Article

Delineating Soil Management Zones for Site-Specific Nutrient Management in Cocoa Cultivation Areas with a Long History of Pesticide Usage

by
Isong Abraham Isong
1,
Denis Michael Olim
1,
Olayinka Ibiwumi Nwachukwu
2,
Mabel Ifeoma Onwuka
2,
Sunday Marcus Afu
1,
Victoria Oko Otie
1,
Peter Ereh Oko
3,
Brandon Heung
4 and
Kingsley John
4,*
1
Department of Soil Science, University of Calabar, Calabar 540271, Nigeria
2
Department of Soil Science and Land Resources Management, Michael Okpara University of Agriculture Umudike, Umuahia P.O. Box 7262, Nigeria
3
Department of Environmental Resources Management, University of Calabar, Calabar 540271, Nigeria
4
Department of Plant, Food, and Environmental Science, Dalhousie University, Truro, NS B3H 4R2, Canada
*
Author to whom correspondence should be addressed.
Land 2025, 14(7), 1366; https://doi.org/10.3390/land14071366
Submission received: 29 April 2025 / Revised: 11 June 2025 / Accepted: 23 June 2025 / Published: 28 June 2025

Abstract

Delineating soil management zones in cocoa cultivation areas can help optimize production and minimize ecological and environmental risks. This research assessed the spatial distribution of heavy metal concentration and soil fertility indicators in Cross River State, Nigeria, to delineate soil management zones (MZs). A total of n = 63 georeferenced, composite soil samples were collected at the 0–30 cm depth increment, air-dried, and subjected to physicochemical analysis. The soil data were subjected to principal component analysis (PCA), and the selected principal components (PCs) were used for fuzzy c-means clustering analysis to delineate the MZs. The result indicated that soil pH varied from 4.8 (strongly acidic) to 6.3 (slightly acidic), with high average organic carbon contents. The degree of contamination was low, while the ecological risk indicator (RI) of the environment under cocoa cultivation ranged from low risk (RI = 18.24) to moderate risk (RI = 287.15), with moderate risk areas mostly found in patches around the central and upper regions. Higher pH was associated with increased levels of exchangeable Ca, Mg, and K, and TN and OC. Strong spatial dependence was observed for silt, pH, OC, Mg, Zn, Cu, Pb, Cd, Cr, and DC. The result showed the first six principal components (PCs) with eigenvalues >1 accounting for 83.33% of the cumulative variance, and three MZs were derived via the selected six PCs using fuzzy c-means clustering analysis. The results of this study further indicated that MZ3 had the highest pH (6.06), TN (0.24%), OC (2.79%), exchangeable Ca (10.62 cmol/kg), Mg (4.01 cmol/kg), and K (0.12 cmol/kg). These were significantly (p < 0.05) higher than those observed in MZ2 and MZ1, and they represent the most fertile parts of the study area. Furthermore, 40.6% of the study area had marginal soil (i.e., soil under MZ2).

1. Introduction

The cocoa tree (Theobroma cacao) is an important economic crop, essential for chocolate production, and is often used in beverages, cosmetics, and pharmaceuticals due to its nutritional and antioxidant properties [1]. Globally, the leading producers of cocoa include Côte d’Ivoire, being ranked 1st in the world, with 2,034,000 tons (40%); Ghana, ranked 2nd, with 883,652 tons (18%); Indonesia, ranked 3rd, with 659,776 tons (13%); and Nigeria, ranked 4th, with a production capacity of 328,263 tons (7%) [1,2]. High consumption rates are observed in regions such as Europe and North America, with countries like Switzerland, Belgium, and the United States leading in per capita chocolate consumption [3].
The management of cocoa farms to maintain high yields in Nigeria and elsewhere in the world often requires the intensive use of pesticides to combat pests, such as mirids and cocoa pod borers, and diseases such as black pod disease caused by Phytophthora palmivora. For instance, copper-based fungicides (e.g., Bordeaux mixture) and others (e.g., Basudin, Ridomil, Cypermethrin, Thiamethoxam, and Acetamiprid) are still commonly used in West Africa, in countries like Nigeria, Togo, Zambia, Zaire, Ghana, Cote D’Ivoire, and Cameroon [1,4,5] to combat pests and diseases. However, the continuous and intensive use of these pesticides has raised concerns regarding environmental impacts, as these pesticides often leave residues that can persist in the soil long after their application, leading to various ecological and health-related issues including but not limited to the depletion of soil quality, microbial communities, and overall ecosystem functionality.
The cocoa industry in Nigeria is increasingly vulnerable to the cumulative effects of soil degradation, declines in soil fertility, nutrient mining, and poor land management practices—all of which are further exacerbated by the intensive use of pesticides. Several studies, including those by Arham et al. [6], Aikpokpodion et al. [7], and Yeboah et al. [8], indicated that cocoa plantations are increasingly found to be contaminated with heavy metals, primarily due to the application of pesticides. For instance, Arham et al. [6] showed that in East Kolaka, Indonesia, there were elevated levels of lead (Pb) and cadmium (Cd), surpassing the permissible limits established by the World Health Organization for soils from cocoa plantations. Similarly, in Nigeria, cocoa plantation soils were found to be contaminated with copper (Cu) in fungicide-treated cocoa plantations in Cross River State and Ondo State [9,10]. Conversely, in a study site in Ghana, Yeboah et al. [8] showed that although heavy metal concentrations were below permissible limits in cocoa plantation soils, some individual farms showed moderate levels of Cu pollution due to long-term fungicide application. Given these environmental concerns, there is a need to evaluate heavy metal contaminants and soil quality in soils where pesticides are consistently used for pest and disease control. This is especially important given that the persistence of pesticides in the soil matrix may alter soil pH, reduce microbial population, organic matter content, and nutrient availability [11], which in turn can affect plant growth, productivity, and overall soil quality.
Despite the growing need for adaptive strategies and precision agriculture, there is still a lack of detailed information on soil quality under cocoa cultivated soils at a spatial scale needed for developing site-specific soil management practices. Without a comprehensive soil assessment, farmers will be ill-equipped to adjust their farming practices in response to environmental degradation, leading to further declines in crop productivity and increased vulnerability. Soil fertility indicators are one of the most significant factors influencing crop yield [12], including cocoa yield. Fertile and well-managed soils are crucial for maximizing cocoa production, as they affect nutrient uptake and plant growth.
The distribution of soil nutrients in a particular area varies, mainly due to variability in climate, soil type, parent materials, vegetation, and anthropogenic activities [13,14]. Therefore, it is necessary to characterize the spatial patterns of soil nutrient indicators and heavy metal concentration at the field scale for the subsequent implementation of soil management in cocoa plantations. Here, the spatial distribution of soil properties can be characterized via geostatistical techniques [15,16,17]. Geostatistical techniques help in predicting the values of soil properties in unsampled locations by considering spatial autocorrelation and reducing estimation error variance and costs of investigation [18].
By characterizing the field-scale spatial patterns of soil properties, site-specific management practices can be implemented by adjusting inputs, such as fertilizers, lime, and irrigation, based on each site’s unique requirements. One way of implementing variable rate technology is by delineating soil management zones (MZs). These zones may be established by utilizing principal component analysis (PCA) combined with clustering methods, such as fuzzy c-means algorithm (FCMA), k-means algorithm, or Gaussian mixture models, for classifying a particular area into various zones [19]. Lajili et al. [20] in their study utilized other delineation algorithms, such as iterative self-organizing data analysis (ISODATA), hierarchical, and spatial segmentation. The delineation of MZs has previously been applied in the management of soil cultivated with maize [21], wheat [22], oil palm [23], citrus [24], and potato field [25]; hence, similar results are expected when applied to cocoa plantation soils.
Utilizing PCA for MZs delineation offers advantages like dimensionality reduction, identification of key variables explaining variance, and the ability to work with correlated data, leading to more efficient and targeted management practices. PCA, when used in conjunction with clustering algorithms (e.g., FCMA), is more efficient and powerful compared to other algorithms [26] to delineate MZs based on soil properties, aiding in precision soil nutrient management and crop productivity. The concept of delineating MZs aims to optimize soil management by dividing the landscape into distinct zones based on soil characteristics and suitability for particular crops has the potential to maximize the efficiency of agricultural inputs [27]. This approach can guide farmers in adopting soil management practices that are tailored to the unique needs of each zone. For instance, farmers in areas with acidic soils may need to apply lime, while those in regions with nutrient-depleted soils may require organic or inorganic fertilizers, and those in metal-contaminated areas can opt for remediation techniques.
Over the years, farmers in many regions of the world, including Cross River State, rely on a whole-field land management approach, in which each region/farm is treated as a homogeneous area [28], with inputs applied equally across all sections of the field and without consideration for the variability in soil. To optimize crop output equally across cultivated areas, there is a need to tailor soil nutrient and input management to the specific need of each part of the field, rather than treating them uniformly. This research aims to assess the spatial distribution of heavy metal concentration and soil fertility indicators in Cross River State, Nigeria, delineate MZs in the study area, and compare the differences in heavy metal concentration and soil fertility indicators between MZs to identify the high-risk zone(s) to consider for efficient soil management.

2. Materials and Methods

2.1. Description of the Study Area

This study was conducted in cocoa plantations within the Ikom-Etung-Boki Local Government Areas (LGAs) of Cross River State, Nigeria (Figure 1). The exact location of sample collection extended between a latitude of 5° 48′ N to 6° 12′ N and a longitude of 8° 41′ E–9° 5′ E, with elevation ranging from 21 to 585 m above mean sea level. The area is located withing the rainforest vegetation zone, which experiences a humid tropical climate with a notable dry season (between November and March) and a rainy season (between April and October). This area receives an average annual rainfall that exceeds 2500 mm, has a temperature range of 23 °C to 31 °C, and a mean relative humidity of 83%. The principal crop grown in the area is cocoa; however, maize, cassava, and vegetable crops (e.g., okra, Telfairia occidentalis, pepper, waterleaf, and Amaranthus cruentus) are also common. Over the years, cocoa farms in this region have been subjected to intensive pesticide use and pest management programs. Therefore, selecting this area provides a relevant and practical context for delineating management zones under pesticide application, given its substantial cocoa production, persistent pest challenges, and established pesticide use practices.

2.2. Soil Sampling Regime and Laboratory Analysis

A total of 63 georeferenced composite soil samples were collected at the 0–30 cm depth increment. The soil samples were collected in triplicate within cocoa farms using a sterilized soil auger. The soils were thoroughly mixed in a bag to obtain a homogenized sample, which were then labeled and transported to the laboratory. The sampling interval of 500 m to 1000 m was maintained throughout the sampling process. The collected soil samples were air-dried at room temperature for 5 days. The dried soil samples were crushed into a powder by using a porcelain mortar and pestle. Following this, the samples were sieved (2 mm mesh) to ensure homogeneity. The exact locations of the sampling points were determined using a global positioning system (GPS Model eTrex Legend H) receiver.
Particle size fractions were determined using the modified Bouyocous method with sodium hexametaphosphate as a dispersant [29]. Soil pH was measured potentiometrically in a soil-water suspension (mixed at a ratio of 1:2.5) and measured using a glass electrode pH meter following the procedure described in Udo et al. [30]. Organic carbon was determined by the dichromate wet oxidation method of Walkley and Black, and as outlined in Nelson and Sommers [31]. The total nitrogen content of the soil was determined by wet-digestion, distillation, and titration procedures of the Kjeldahl method as described by Bremner [32]. Available phosphorus (P) was extracted by the Bray-1 method, and the color was developed in soil extract using the ascorbic acid blue method [33]. Exchangeable bases (Ca2+, Mg2+, and K+) were extracted by saturating soil with neutral 1 M NH4OAc [30], and Ca and Mg in the extract were determined using an atomic absorption spectrophotometer (AAS), while K was determined by flame photometry. The Zn, Pb, Cr, Cd, and Cu concentrations in soil samples were extracted with diethylenetriaminepentaacetic acid (DTPA) solution (0.005 M DTPA + 0.01 M CaCl2 + 0.1 M triethanolamine, pH 7.3) following the procedure outlined in Lindsay and Norvell [34], and the concentration in the extract was determined by atomic absorption spectrophotometer.

2.3. Data Analysis

2.3.1. Descriptive Statistics

Descriptive statistics, including minimum, maximum, mean, kurtosis, skewness, standard deviation (SD), coefficient of variation (CV), and principal components analysis (PCA) were generated for the soil properties. Correlation analysis was also performed to examine the relationships between studied soil properties. In addition, pollution indices, including the degree of contamination (DC) and ecological risk of the environment, were used to assess the pollution status of the study area, while interpolation and predictions were performed using ordinary kriging (OK).

2.3.2. Computation of Pollution Indices

Two pollution indices were considered in this study (i.e., the degree of contamination and ecological risk index). The degree of contamination (DC) is aimed at providing a measure of the degree of overall contamination in soil surface layers in a particular ecosystem. In this study, DC was calculated using the following:
DC = i = 1 n C f i = C metal C background
where Cmetal is the measured concentration of the examined metal (n) in the soil, Cbackground is the concentration of the examined metal (n) in the reference environment.
Following Hakanson [35], four DC classes were defined for in the study area as: DC < 7 (low DC), 7 ≤ DC < 14 (moderate DC), 14 ≤ DC < 28 (considerable DC), and DC ≥ 28 (very high DC).
The average shale, background concentration (Cbackground) values for the investigated metals is as follow (Pb = 20 mg/kg, Cu = 45 mg/kg; Cr = 90 mg/kg; Cd = 0.3 mg/kg, Zn = 95 mg/kg).
The estimation of ecological risks caused by the heavy metals in the soil was computed using the ecological risk index (RI) in the following [35]:
RI = i = 1 n E r i = i = 1 n T r i ×   C f i = i = 1 n T r i × C metal C background ,
where E r i and T r i are the ecological risk factor and toxic response factor for metal i, respectively. The T r i values for the investigated metals were given by Hakanson [35] and Theoneste et al. [36] as (Pb = Cu = 5; Cr = 2; Cd = 30, Zn = 1). C f i is the contamination factor, Cmetal is the measured concentration of the examined metal (n) in the soil and Cbackground is the concentration of the examined metal (n) in the reference environment. The classification of the RI values also followed the scheme provided in Hakanson [35]: RI < 150 (low risk), 150 ≤ RI < 300 (moderate risk), 300 ≤ RI < 600 (considerable risk), and RI ≥ 600 (very high risk).

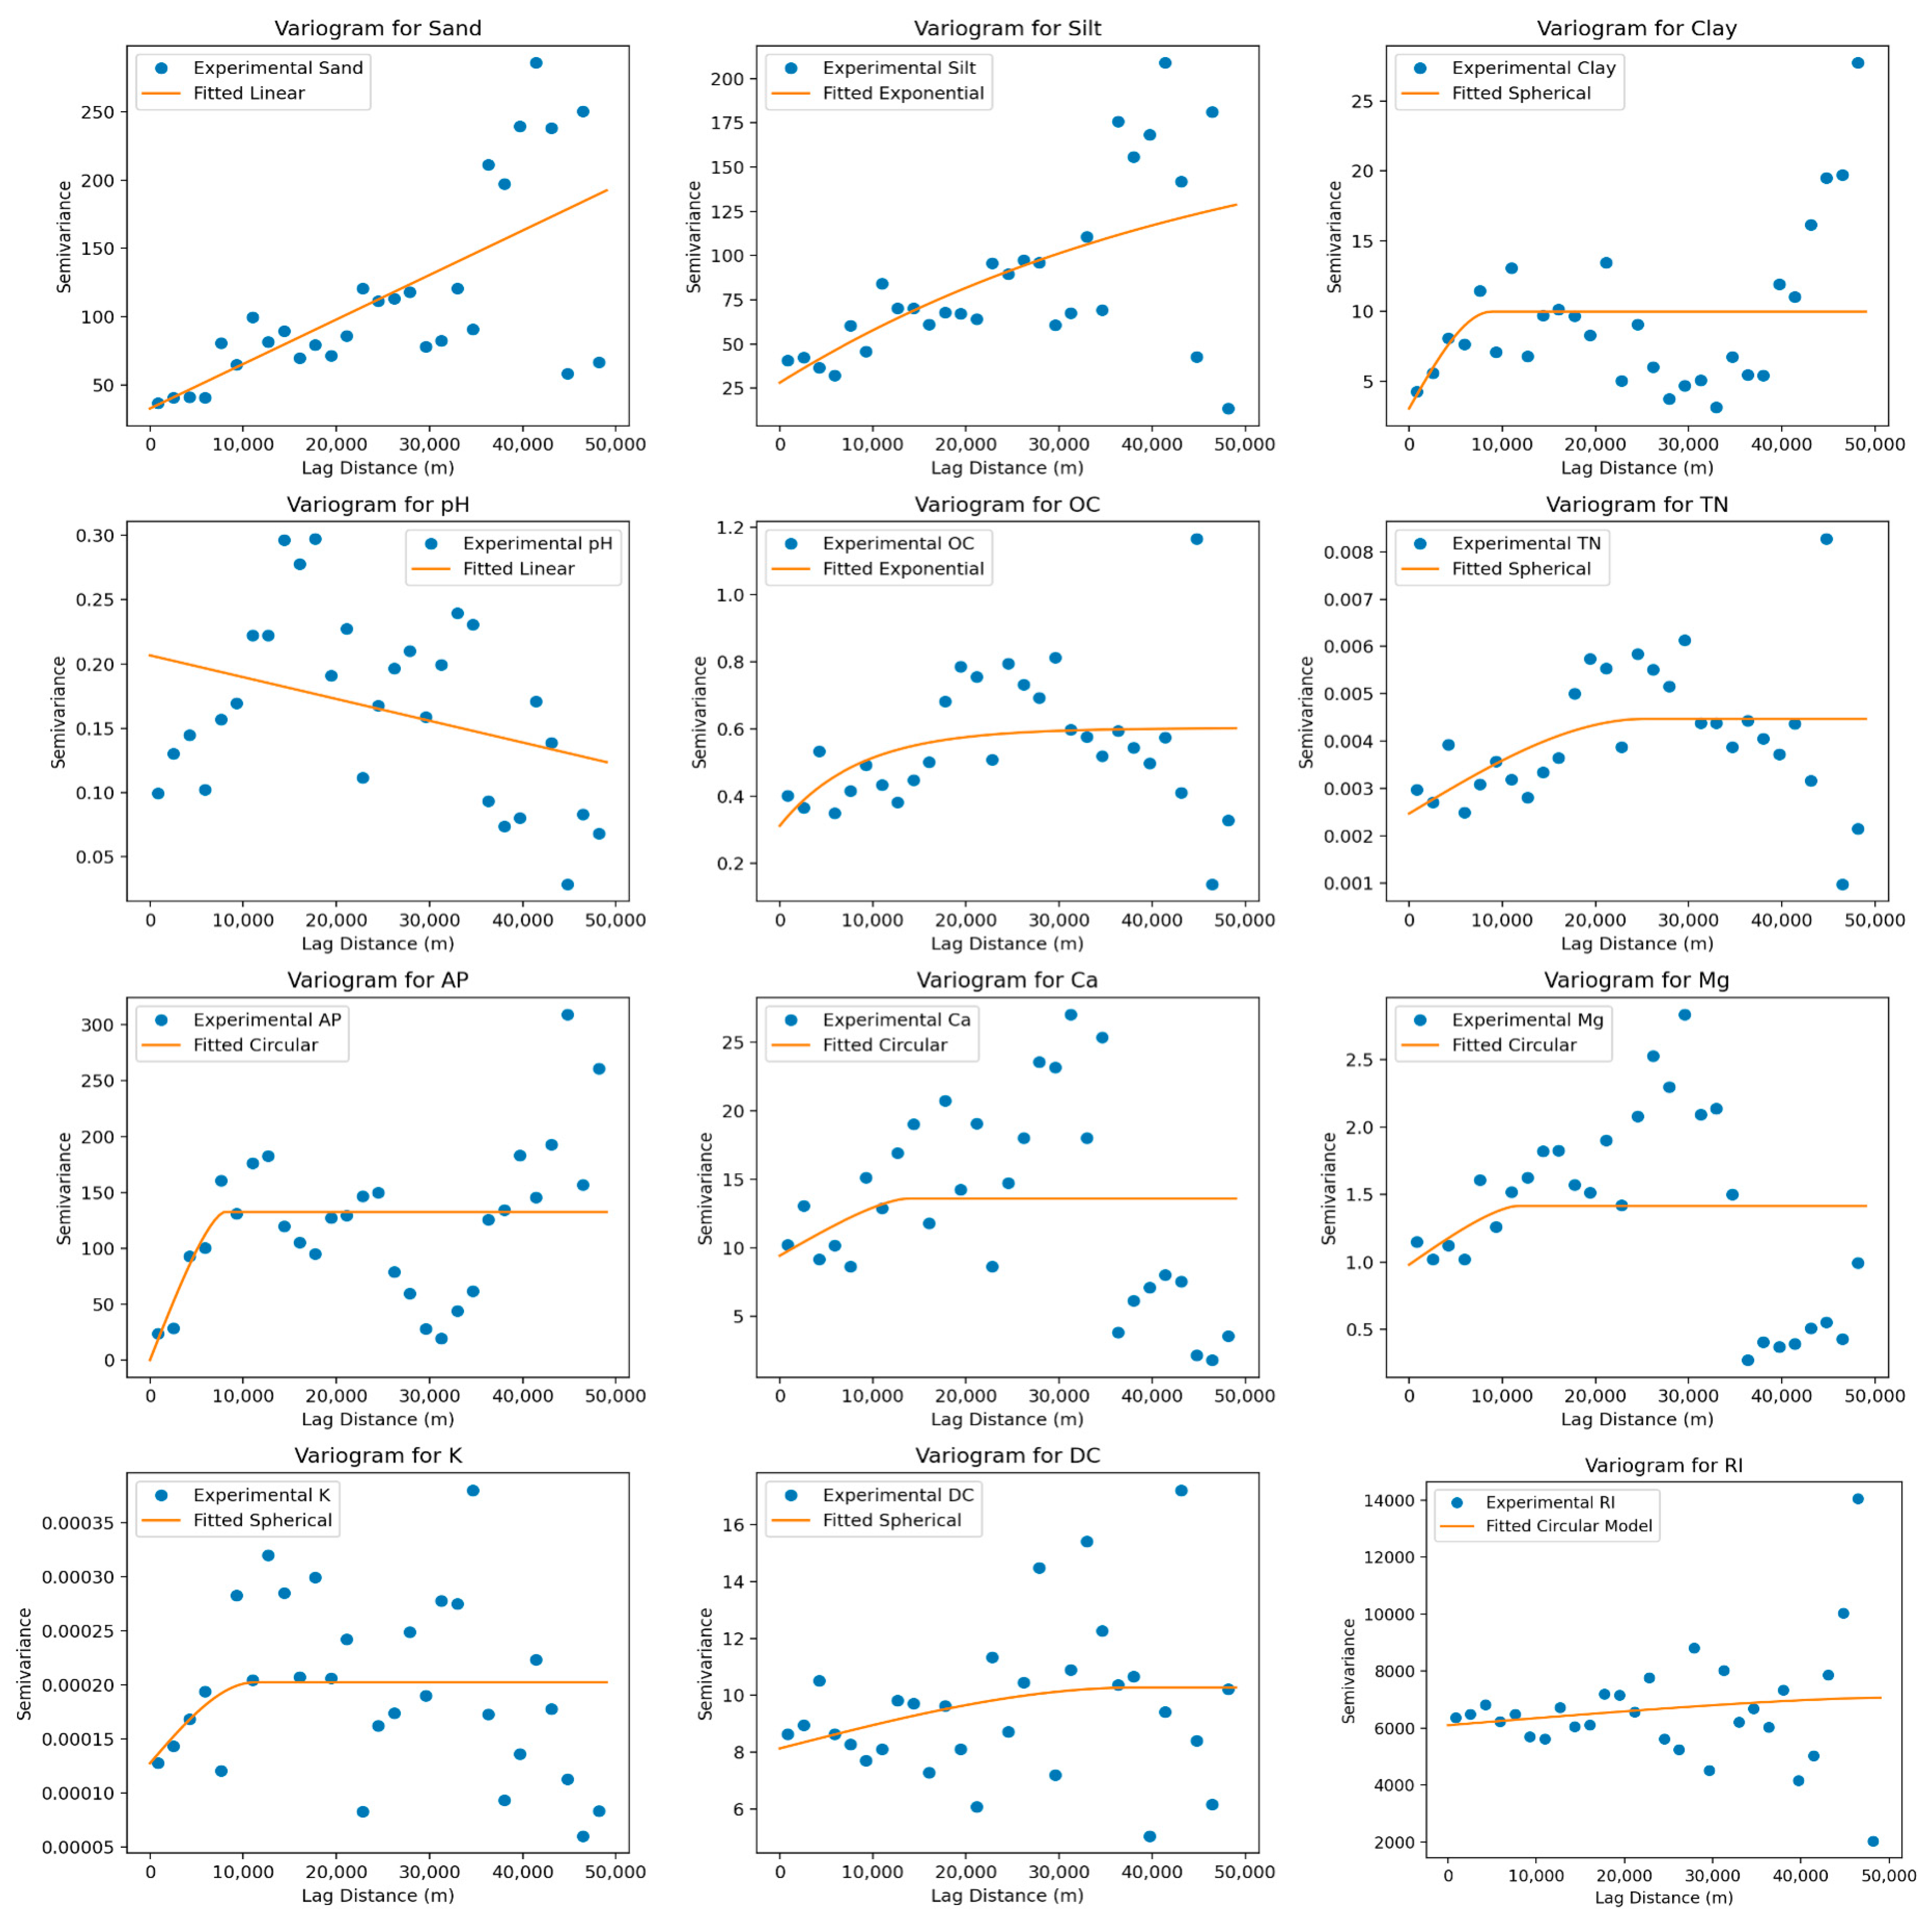
2.3.3. Ordinary Kriging

Ordinary kriging (OK) is a widely used geostatistical technique that generates an optimal unbiased estimate of surface using a semivariogram based on regionalized variables. This uses an estimated mean of a particular soil property at a known location to predict the value at an unsampled location [37]. It can be expressed as:
Ζ ( x 0 ) = i = 1 n λ i · Ζ ( x i ) ,
where Z′( x 0) is the predicted/interpolated value for point x 0, Z( x i) is the known value, and λi is the kriging weight for the Z( x i) values.
OK can be estimated by the semi-variance function of the variables on the condition that the estimated value is unbiased and optimal. In this regard, for each soil property, range, nugget, and nugget ratio values are determined using semivariograms. Semivariance, (h), is computed as half the average squared difference between the components of data pairs as:
γ h = 1 2 N h i = 1 n [ Z ( X i ) Z X i + h ] 2 ,
where γ(h) is the semivariance, h the lag distance, Z is the parameter of the soil property, N(h) the number of pairs of locations separated by a lag distance h, Z(Xi), and Z(Xi + h) are values of Z at positions Xi and Xi + h.
Before fitting the semi-variogram model, the skewed values of soil properties were log transformed to ensure a normal distribution. Several semivariogram models including spherical, exponential, Gaussian, linear, and circular models were fitted to the experimental semivariogram to select the best model. The cross-validation technique was performed to choose the best fitted semi-variogram model for each of the studied soil properties using mean error (ME), mean absolute prediction error (MAE), and the root mean square error (RMSE), as presented below:
M E = 1 n i = 1 n Z o i Z p i ,
RMSE = 1 n i = 1 n ( Z oi Z pi ) 2 ,
M A E = 1 n i = 1 n Z o i Z p i ,
where Zpi = predicted values, Zoi = observed values, and n = the size of the observations, for the i-th term observation. Here, a good model prediction was expected to have low bias, MAE and RMSE. Lastly, the nugget/sill ratio was used as a criterion to classify the spatial dependence of soil properties. If the ratio is less than 0.25, the variable has strong spatial dependence; between 0.25 and 0.75, the variable has moderate spatial dependence; and when greater than 0.75, the variable shows only weak spatial dependence [38].

2.3.4. Principal Component Analysis

PCA carried out, whereby only the principal components (PCs) with eigenvalues ≥ 1, which explained at least 5% variation in the data, were retained for interpretation. Within each PC, only variables with high factor loadings (≥±0.7 eigenvector) were selected [39]. Finally, the scores of the selected PCs were used for fuzzy c-means clustering analysis for the delineation of specific soil management zones.

2.3.5. Delineation of Soil Management Zones

The delineation of the MZs was done using a c-means clustering algorithm in the R software version 4.3. The datasets were partitioned into two to eight clusters. Normalized classification entropy (NCE) and fuzzy performance index (FPI) were then used to obtain the optimum cluster number. The NCE and FPI account for the extent of disorganization by specific classes and degree of fuzziness, respectively. The optimum number of clusters was obtained against the minimum values of NCE and FPI. The NCE and FPI were calculated according to the following equations:
NCE = n n c k = 1 n i = 1 c μ ik log a ( μ ik ) n ,
FPI = 1 c c 1 1 i = 1 c k = 1 n ( μ ik ) 2 n ,
where c is the cluster number, n is observation number, μik is fuzzy membership, and loga is the natural logarithm. Upon completion of the clustering analysis, analysis of variance (ANOVA) was performed to assess differences in soil property between different clusters (MZs). Mean values with significant differences (p ≤ 0.05) among the MZs were compared and separated using Tukey’s Honestly Significant Difference (HSD) test.

3. Results

3.1. Characterization of the Studied Soil Properties

The descriptive statistics of the soil properties are presented in Table 1. Soil pH varied from 4.8 (strongly acidic) to 6.3 (slightly acidic), with a mean value of 5.62 and low coefficient of variation of 7.71%. The value of soil organic carbon (OC) ranged from 0.92 to 4.00% with a mean value of 2.22%. This result indicates that the OC of the study area ranged from low to high. The soil total nitrogen (TN) content ranged from 0.08 to 0.34%, with a mean of 0.19% and was rated as low. Additionally, available phosphorus (AP) content ranged from 0.12 to 32.75 mgkg−1, with a mean of 8.71 mgkg−1 and was rated as moderate. Furthermore, the mean exchangeable Ca (6.50 cmolkg−1) and Mg (2.89 cmolkg−1) contents were moderate, while the mean exchangeable K (0.11 cmolkg−1) was low. The results also indicated that the particle size distribution of the study soil for sand, silt, and clay ranged from 36.6–79.0%, 16–56%, and 2.0–19.4%, respectively. Similarly, heavy metal contents of the soil for Cu, Zn, Pb, Cd, and Cr range from 12.76–38.19 mg kg−1, 5.10–36.21 mg kg−1, 0.00–0.04 mg kg−1, 0.18–2.87 mg kg−1, and 0.01–0.34 mg kg−1, respectively. The result from analyzing the degree of contamination showed that the soil of the study area ranged from a low degree of contamination (DC = 1.65) to a moderate degree of contamination (DC = 11.93), with a mean value of 6.17. Furthermore, the result for IR indicated that the studied soil ranged from low risk (IR = 18.24) to moderate risk (IR = 287.15).
Except for Cu and Zn, the studied heavy metals were reported to have higher CV values as compared to the soil fertility indicators (i.e., pH, OC, TN, and exchangeable K). Additionally, AP, and exchangeable Ca and Mg all had high variability. Generally, the variability was found to be low for soil pH, and K, moderate for sand, silt, OC, TN, Cu, Zn, and high for clay, AP, Ca, Mg, Pb, Cd, Cr, DC, and IR following a report that CV values of ≤15, 16 to 35, and >36% imply low, moderate, and high variability, respectively. The Kolmogorov–Smirnov tests showed that the soil properties of sand, silt, clay, pH, OC, TN, Ca, Cu, Zn, Pb, Cd, DC, and IR were normally distributed (Table 1). However, AP, Mg, K, and Cr were not normally distributed (p < 0.05); therefore, they were transformed using the logarithmic transformation method to achieve a normal distribution before applying the OK method, whereby the resulting maps were subsequently back-transformed.

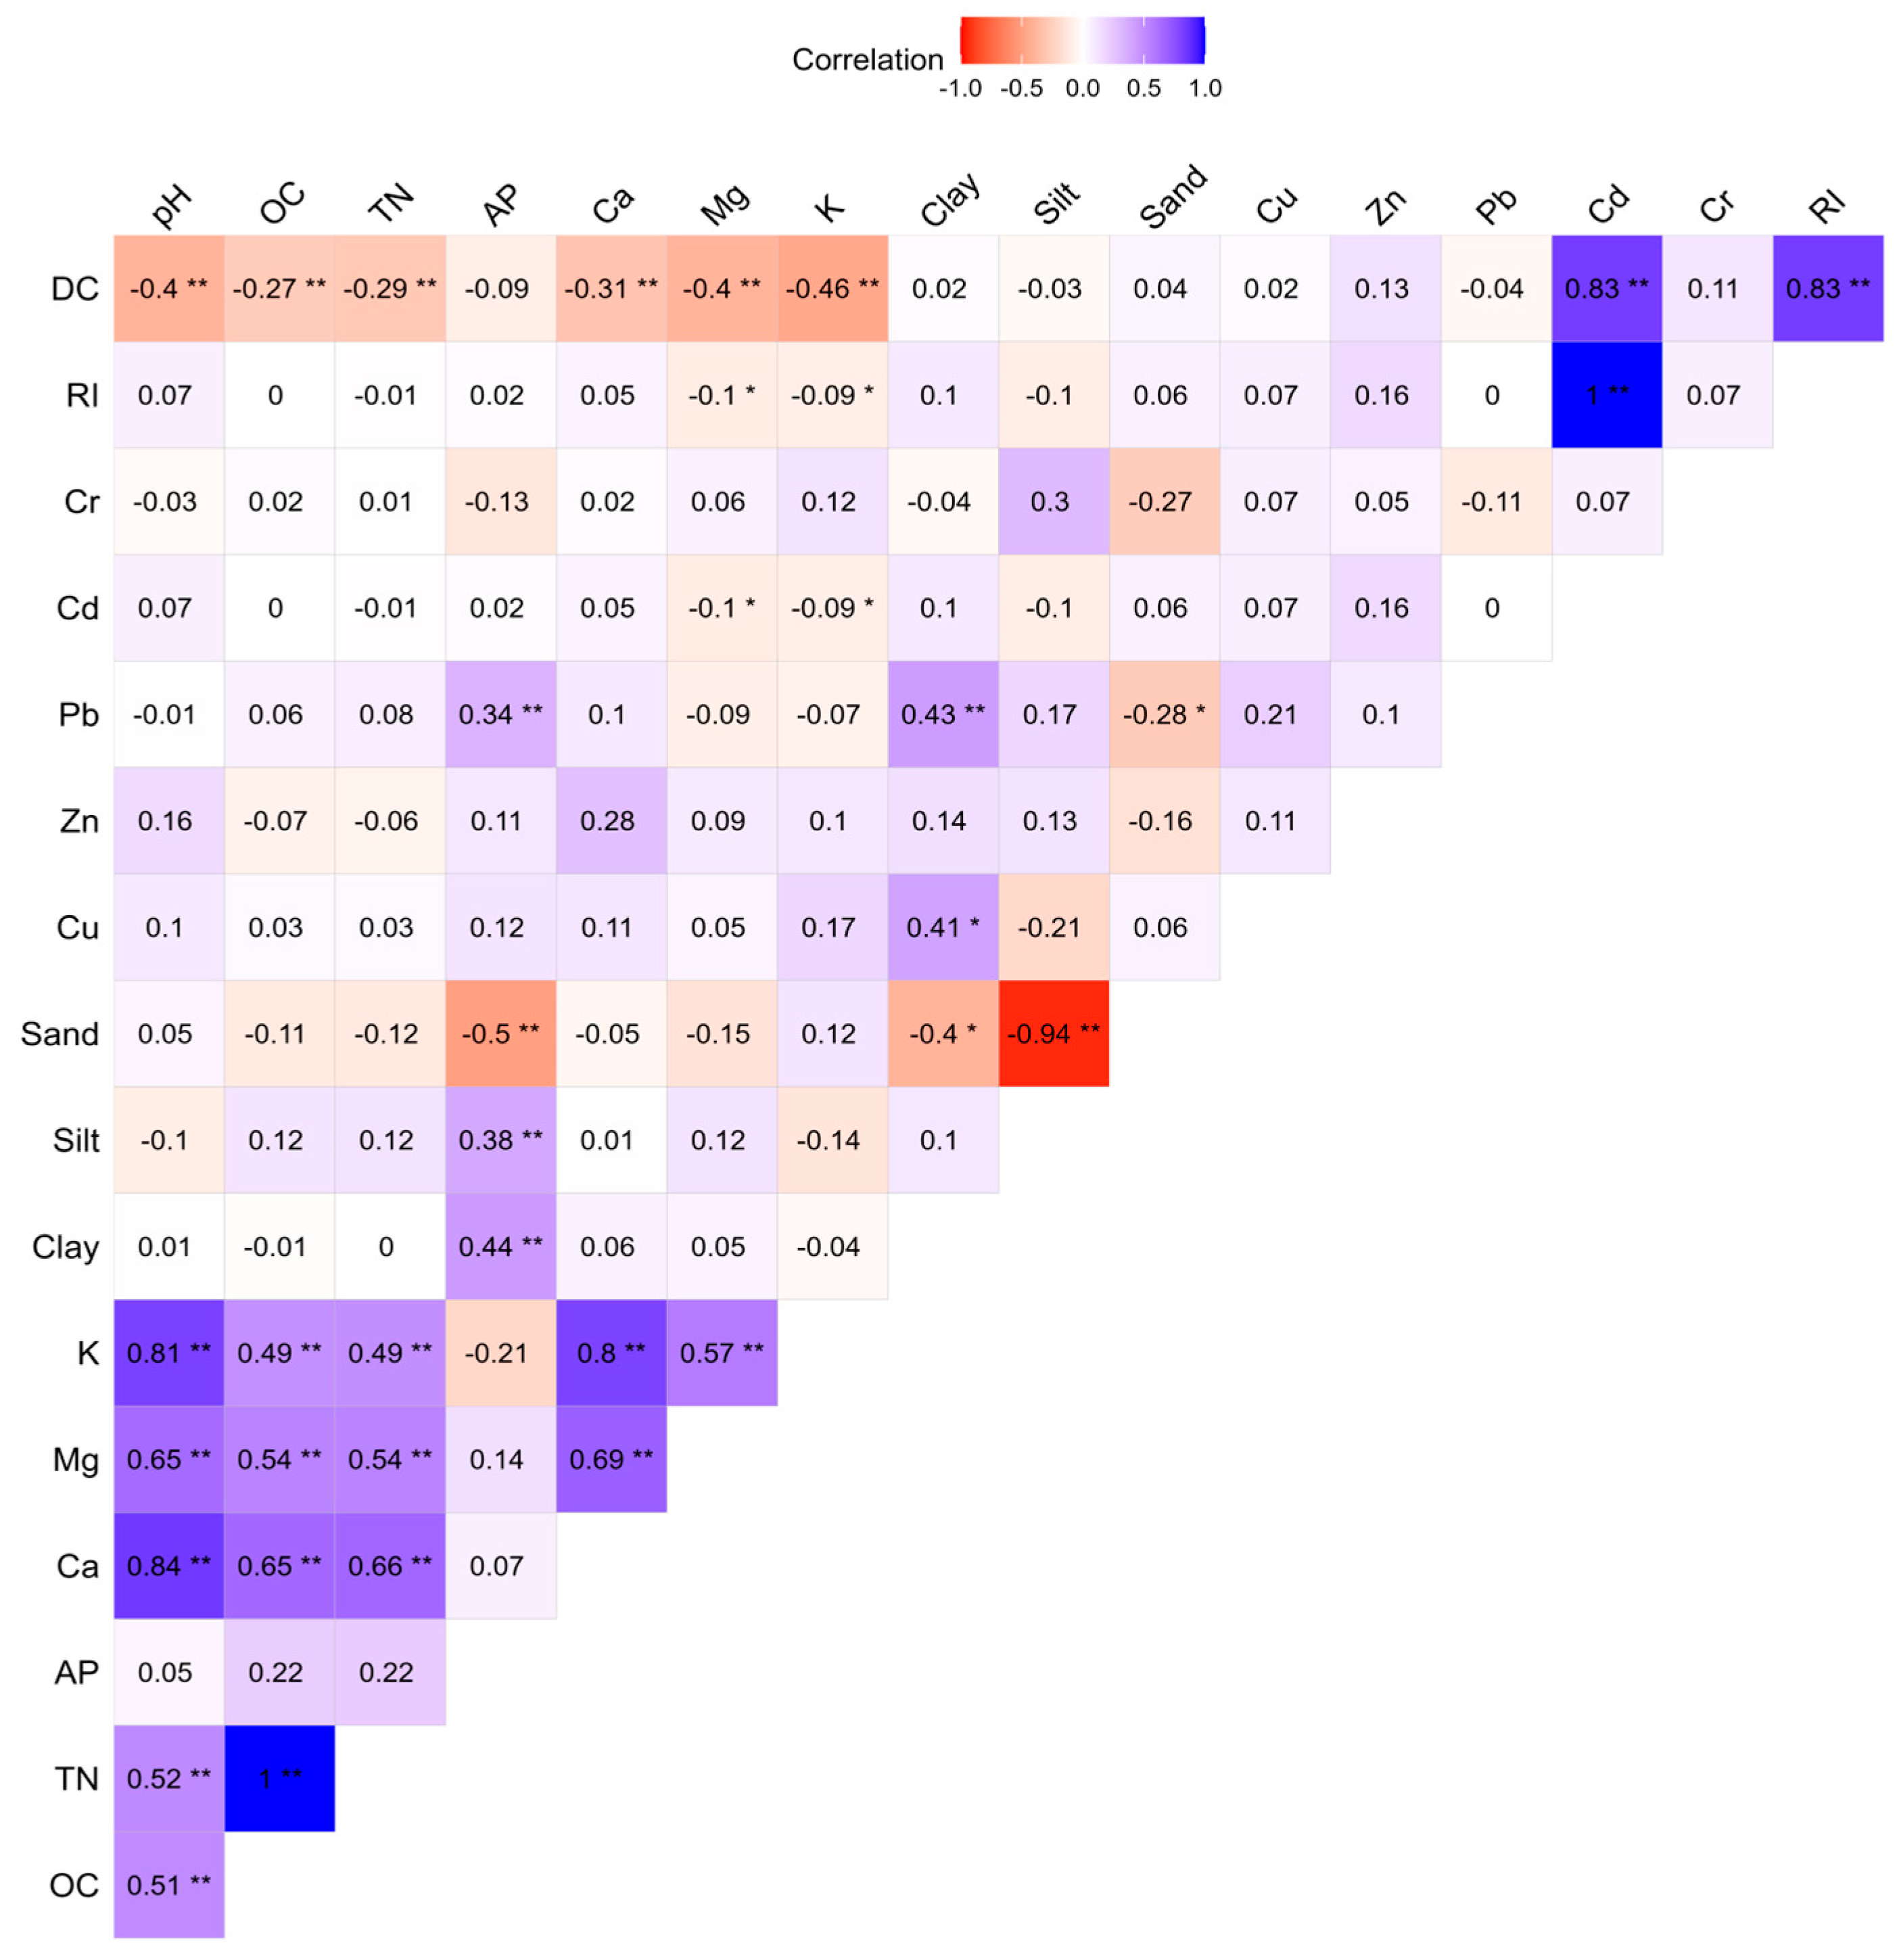
3.2. Relationship Between the Soil Properties and Heavy Metals

A correlation matrix illustrating the relationship among the different studied soil properties is presented in Figure 2. The results indicated that sand was negatively and significantly correlated with Cr (r = −0.27), AP (r = −0.50), clay (r = −0.40), and Pb (r = −0.28), indicating that sand content has negative relationship with Cr, AP, Clay, and Pb contents in the studied soil. Clay was found to exhibit a positive and significant relationship with Cu (r = 0.41), Pb (r = 0.43), and AP (r = 0.44). This also implies that clay has a positive relationship with the concentration of Cu and Pb, and the level of AP. Soil pH exhibited a positive and significant correlation with Ca (r = 0.84), K (r = 0.81), Mg (r = 0.65), TN (r = 0.52), and OC (r = 0.51). This means that when other actors are held constant, increasing soil pH will correspondingly increase the level of Ca, K, Mg, TN, and OC. Exchangeable Ca also exhibited a positive and significant correlation with pH (r = 0.84), K (r = 0.01), Mg (r = 0.69), TN (r = 0.66), and OC (r = 0.65). Soil OC was found to have had positive and significant correlation with Ca (r = 0.65), pH (r = 0.51), K (r = 0.49), Mg (r = 0.54), and TN (r = 1). Furthermore, the degree of contamination was found to have a negative and significant correlation with Ca (r = −0.31), pH (r = −0.40), K (r = −0.46), Mg (r = −0.40), TN (r = −0.28), and OC (r = −0.27). Other notable relationships are shown in Figure 2. Significant correlations among the studied soil properties indicated that PCA could be employed to summarize the principal sources of data variability.

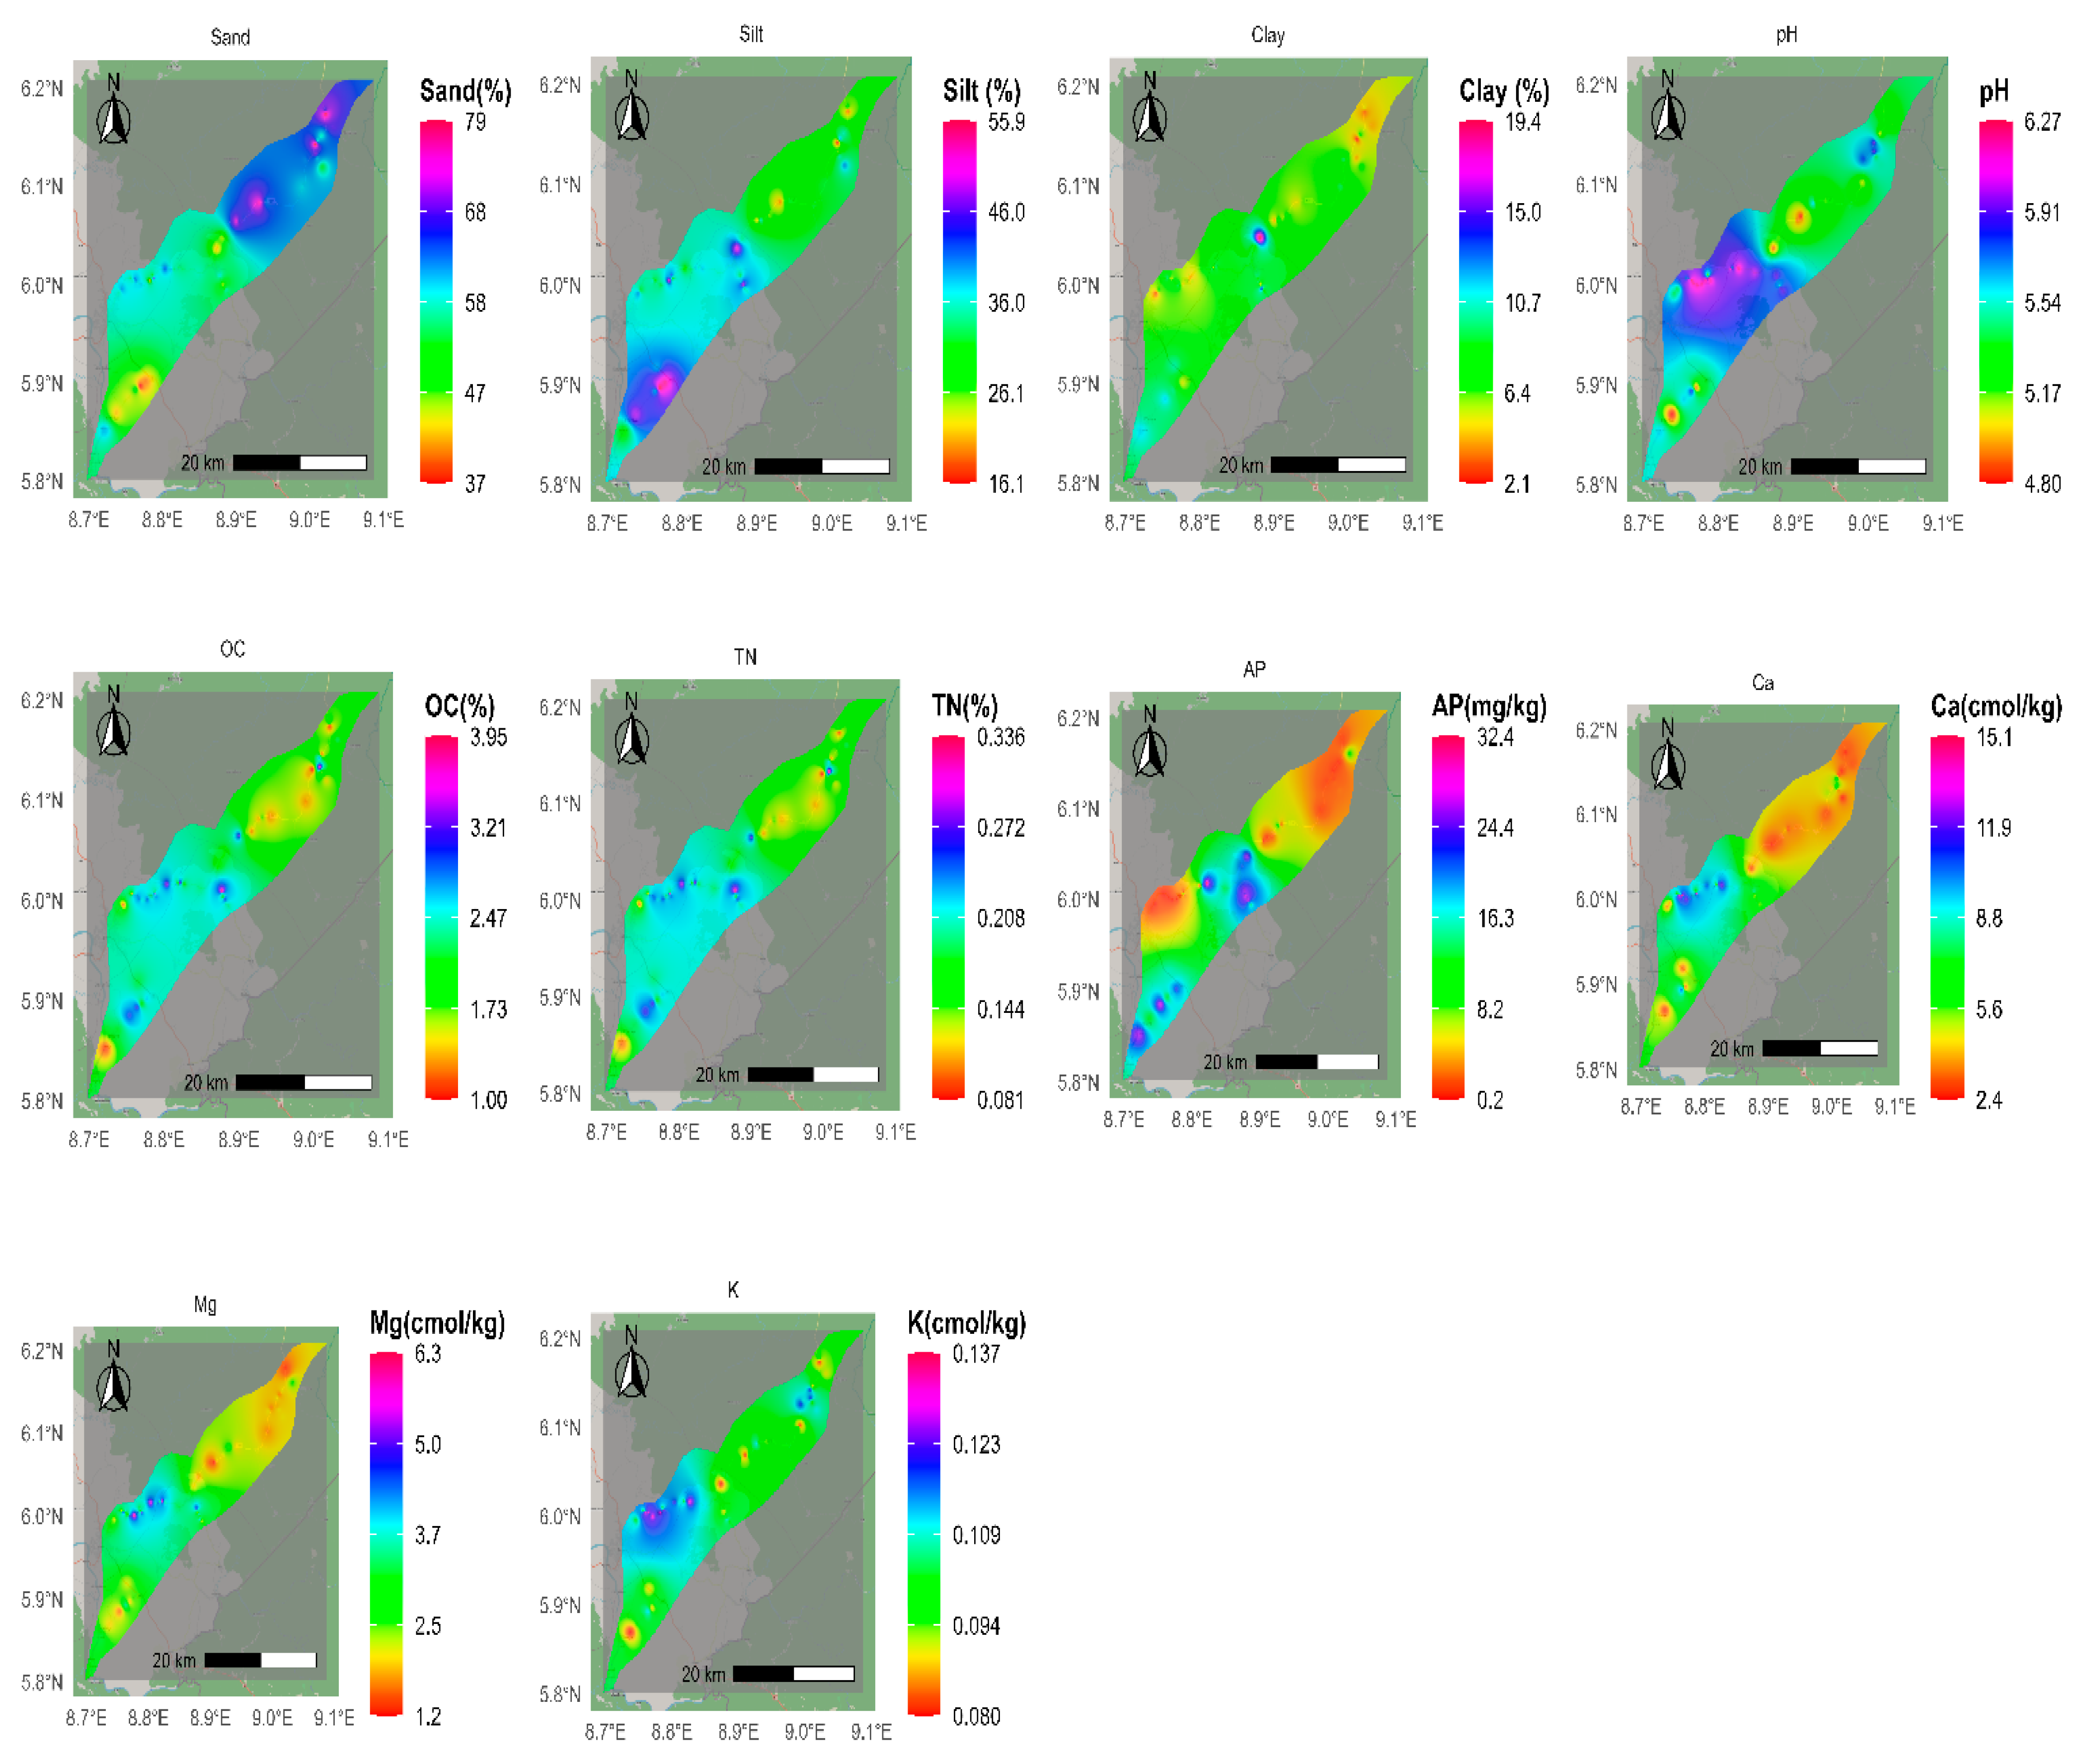
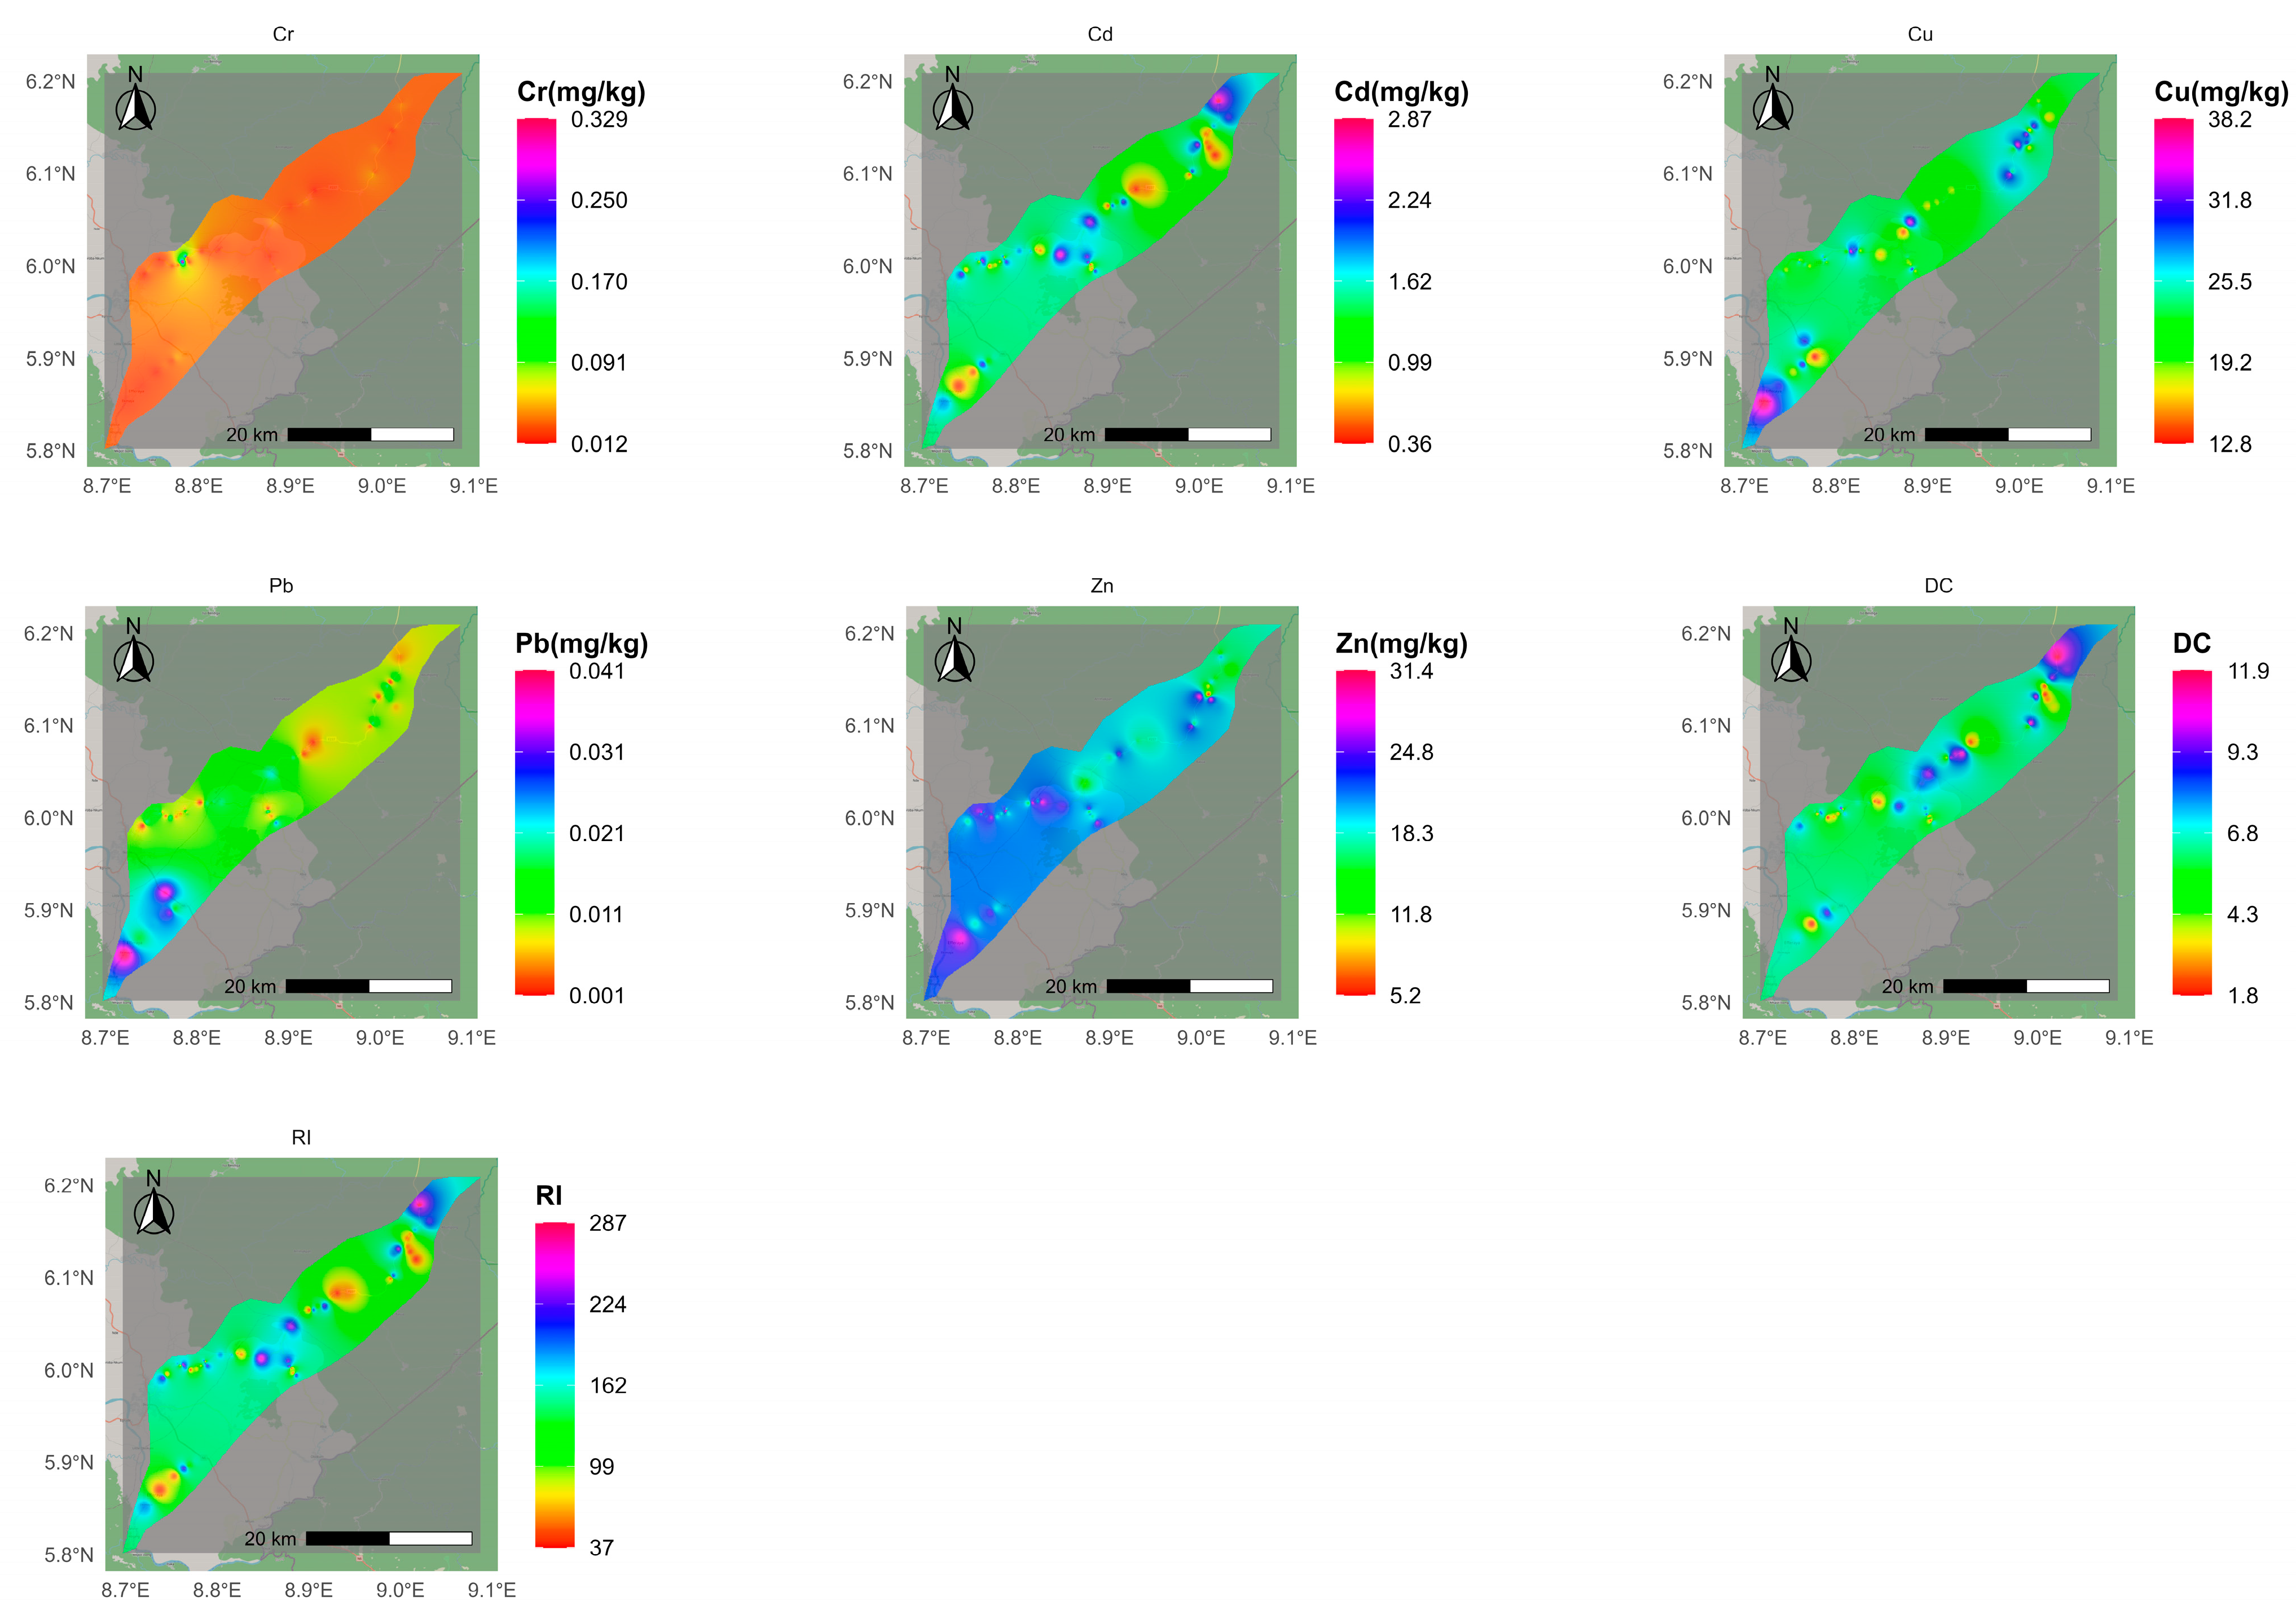
3.3. Spatial Distribution of Soil Properties and Heavy Metals

Presented in Table 2 is the summary of the geostatistical results of the semivariogram model parameters that characterize the spatial structure of each soil parameter. In addition, the semivariogram of the fitted models is presented in Figure 3. Best-fitted models were obtained through prediction errors (ME, MAE, and RMSE), and the results are shown in Table 2. For the studied soil, the best-fitting model was linear for sand, pH, Zn, and Cu. Silt and OC followed an exponential model, while clay, TN, K, Pb, Cr, and DC exhibited a spherical model. Additionally, AP, Ca, Mg, Cd, and IR were best described by a circular model (Table 2). Most soil properties exhibited very low ME, MAE, and RMSE values close to zero, indicating that kriging predictions for unsampled soil property values closely aligned with the measured values. As presented in Table 2, the nugget-to-sill ratio ranged from 0.000 (for OC) to 0.999 (for K). Based on the nugget-to-sill ratio, silt, pH, OC, Mg, Zn, Cu, Pb, Cd, Cr, and DC exhibited strong spatial dependence, sand, clay, TN, AP, and RI all had moderate spatial dependence, while Ca and K had weak spatial dependence.
The overall variogram range varied from 262.3 m for RI (shortest) to 13,746.6 m for sand (longest). This indicates that the spatial distribution of most studied soil properties possesses high spatial dependence across the area of study. The range value of the semivariogram determines the distance after which spatial dependence ceases to exist. Here, the combination of a small range and nugget-to-sill ratio, such as the case with silt, pH, OC, Mg, Zn, Cu, Pb, Cd, Cr, and DC, suggests that their spatial variations are strongly influenced by intrinsic factors related to soil formation (parent material, texture, and mineralogy) rather than random or external factors such as fertilization and pesticide application. This is because a low nugget-to-sill ratio (less than 25%) signifies strong spatial dependence, meaning the variability is primarily due to structural factors rather than random or extrinsic influences like management practices or sampling errors. Moreover, the high range and nugget-to-sill ratio values of Ca and K could potentially be linked to anthropogenically induced variability, due to farming practices and soil management history.
The predictive maps of the soil property with the OK model are presented in Figure 4 and Figure 5. Sand content was highest in the upper part of the study area (mostly above 60%) and lower in the central and lower regions (Figure 4). Conversely, silt content was lowest in the upper region and highest in the central and lower parts. Clay content was relatively uniform across the study area, ranging from approximately 5–10%, with slightly higher values in the central region.
Soil pH in the upper region ranged from 5.13 to 5.62, with some spots reaching 5.95. In contrast, the central region exhibited pH values predominantly above 5.62. Organic carbon (OC) content in the upper region ranged from 1.65% to 2.64%, while in the central and lower regions, values were generally around 2.31%. Similarly, total nitrogen (TN) content in the upper region was approximately 0.19%, whereas the central and lower regions were dominated by values around 0.22%.
The spatial distribution of available phosphorus (AP) showed low concentrations (<7.3 mg/kg) in the upper and western regions. In contrast, the central and lower parts exhibited higher AP concentrations (>18 mg/kg). The spatial distribution of exchangeable cations (Ca, Mg, and K) is illustrated in Figure 4. Exchangeable Ca was mostly below 5.2 cmol/kg in the upper region but reached up to 9.5 cmol/kg in the lower region, with similarly high values in the central part. Exchangeable Mg concentrations in the upper region were generally below 2.33 cmol/kg, while values in the lower region ranged from 2.33 to 3.7 cmol/kg. The central region exhibited Mg values exceeding 4 cmol/kg. Exchangeable K in the upper part ranged from 0.092 to 0.11 cmol/kg, with occasional patches above 0.11 cmol/kg. The central region had values between 0.11 and 0.13 cmol/kg.
Figure 5 presents the spatial distribution of heavy metals (Cr, Cd, Cu, Pb, and Zn). Chromium (Cr) concentrations were consistently low across the study area (<0.091 mg/kg). Cadmium (Cd) values mostly ranged from 0.99 to 1.62 mg/kg, with localized patches exceeding 1.62 mg/kg in the upper region. Copper (Cu) concentrations, predominantly between 18.5 and 25.0 mg/kg, were higher in certain areas of the upper and lower regions. Lead (Pb) levels were low, mostly ranging from 0.011 to 0.021 mg/kg, with values exceeding 0.021 mg/kg in the lower region. Zinc (Zn) concentrations ranged from 18 to 24 mg/kg across the study area, with the upper region exhibiting values below 18 mg/kg.
The DC varied across the study area (Figure 5), with values mostly between 4.3 and 6.8. However, higher contamination levels (~8.5) were observed in parts of the upper and central regions. The RI ranged from 99 to 162 across the study area, with patches in the upper and central regions reaching approximately 224.

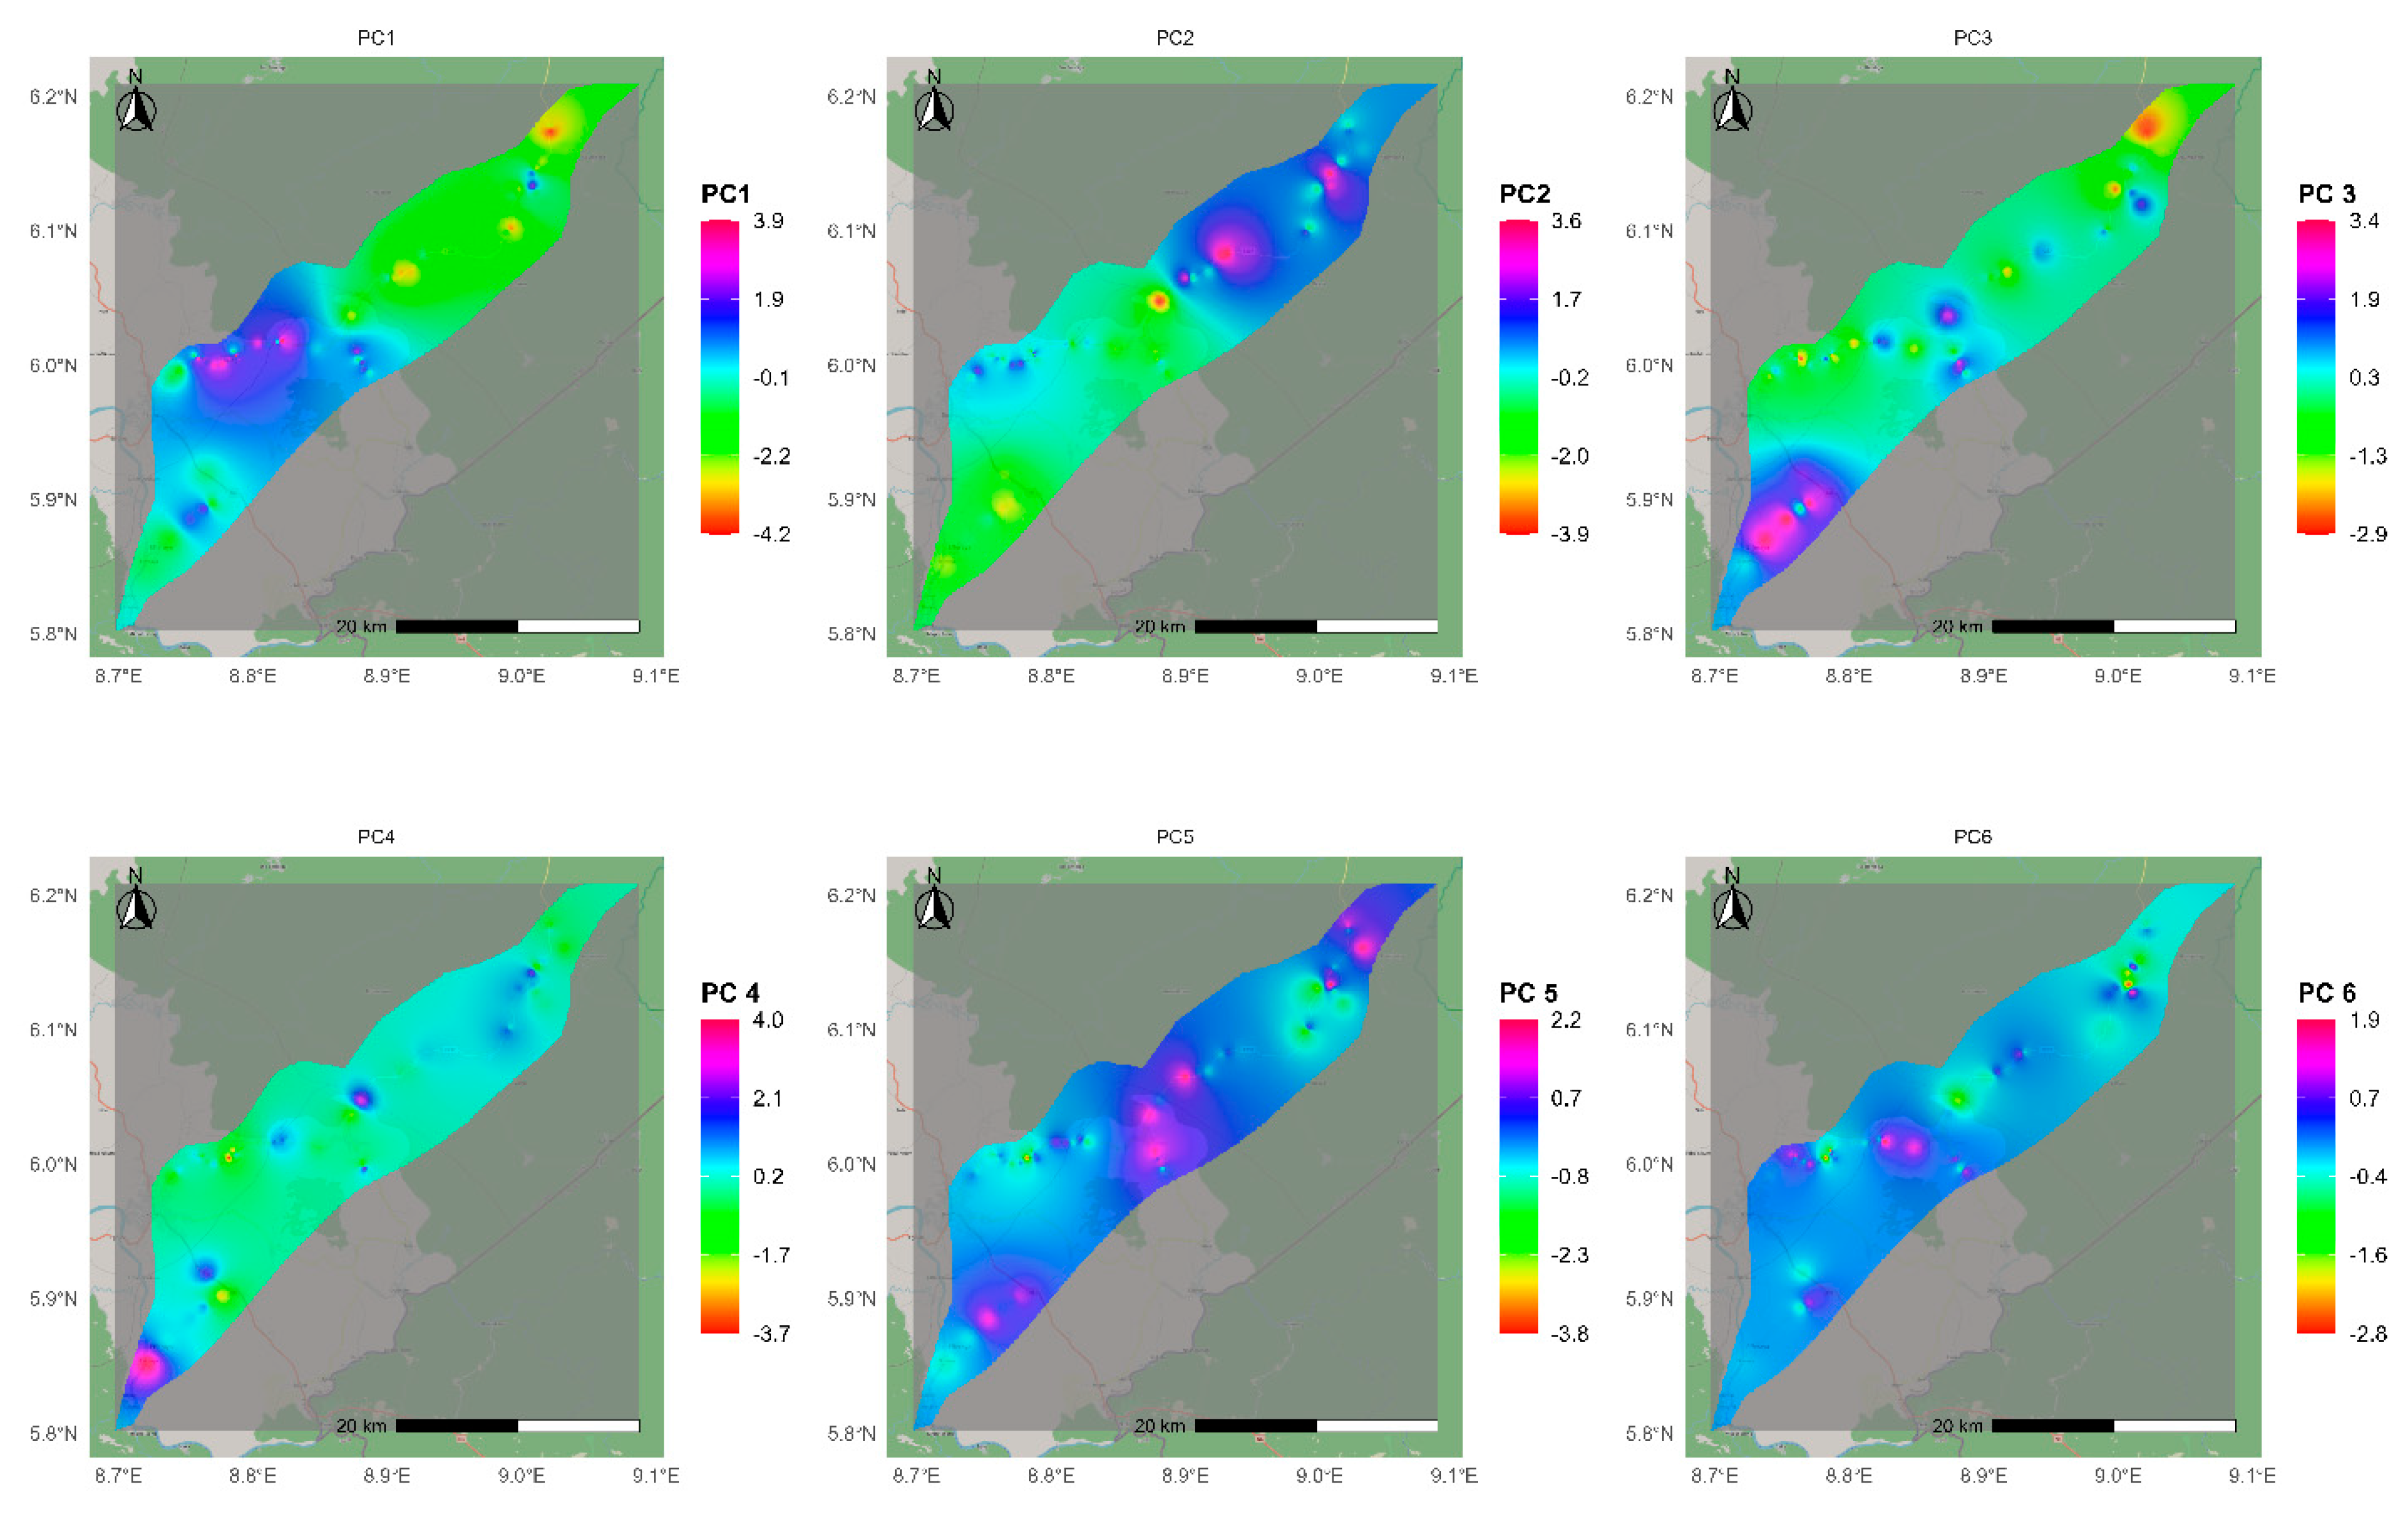
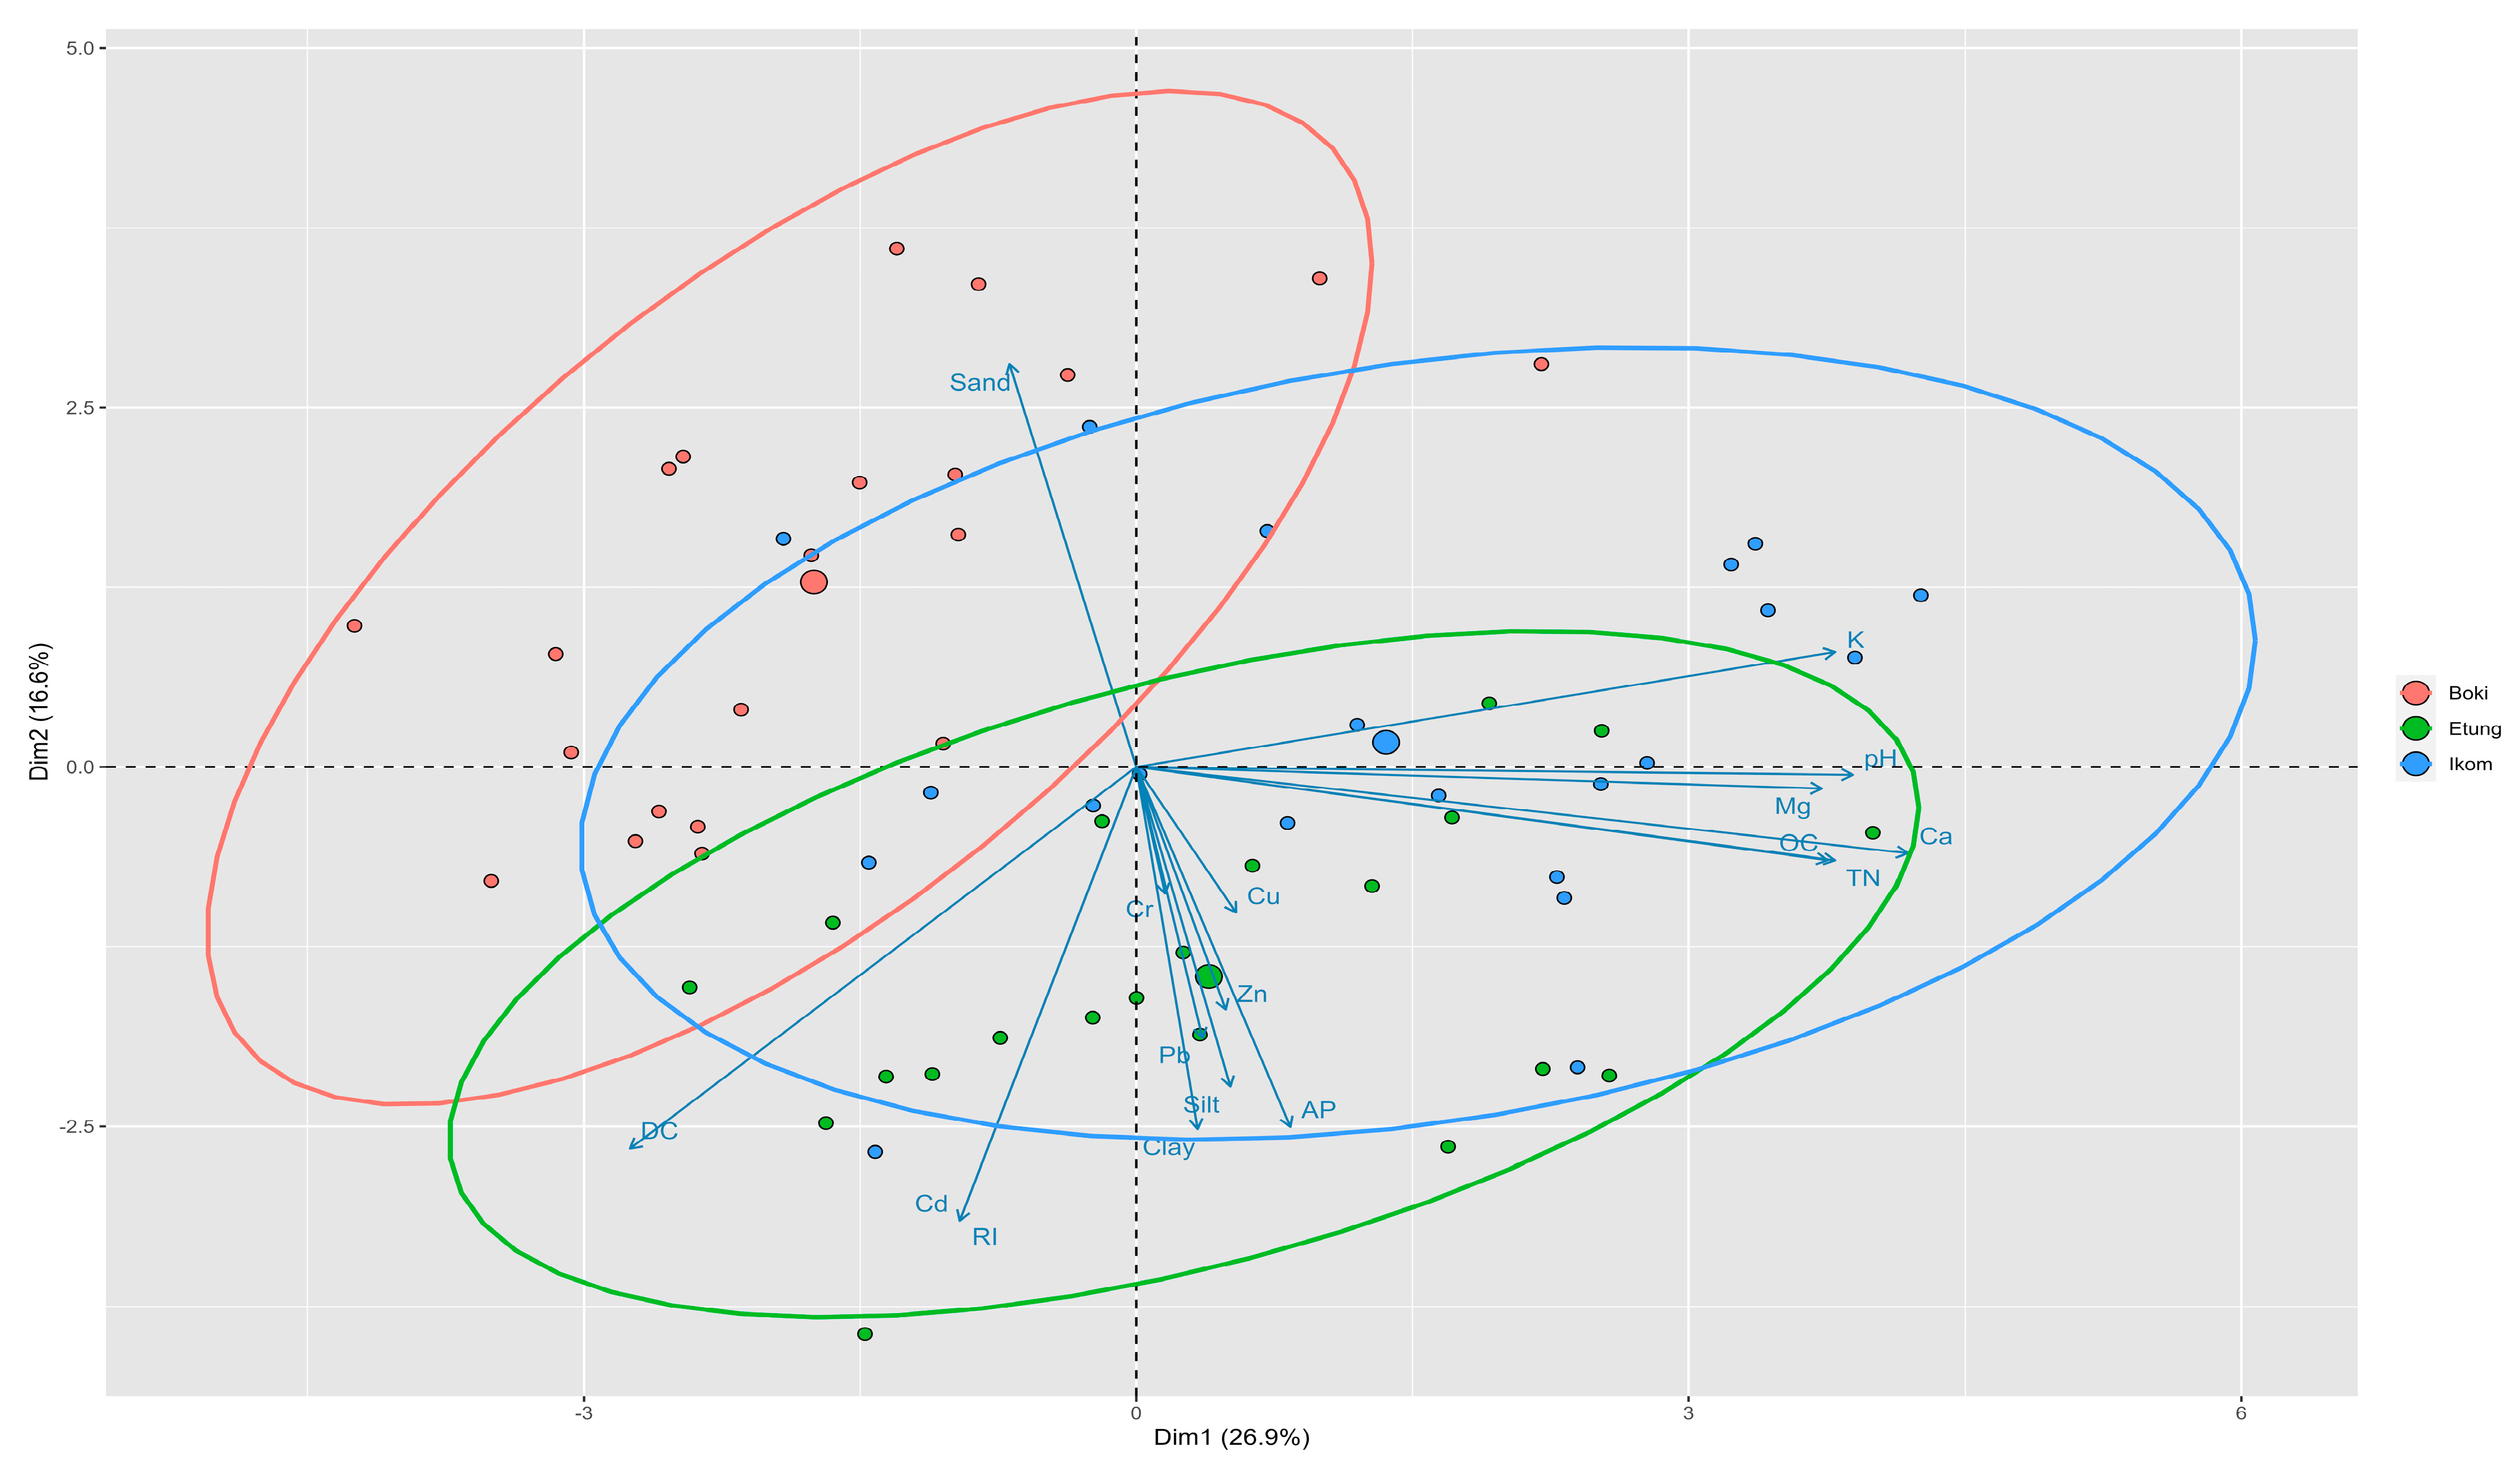
3.4. Principle Components Analysis (PCA)

The results of the correlation analysis indicated a significant correlation among most of the soil properties. For this reason, PCA was performed to summarize the variability in the data into principal components (PCs), and the result is presented in Table 3. This result showed the first six principal components (PCs) with eigenvalues > 1 accounting for 83.33% of the cumulative variance (Table 3). Principal component (PC1) explained 26.91% of the total variation in the observations, and it is mainly contributed by pH, OC, TN, Ca, Mg, and K. PC 2 explained 16.50% of the total variance, with significant contributions from Cd, RI, and DC. PC3 explained about 16.07% of the total variability in the observations, being highly contributed to by the silt and sand contents. PC 4 described approximately 9.95% of the total variability, which is contributed by clay and Cu; PC 5 yielded approximately 7.75% of the overall variability, with major influence from Zn. Meanwhile, PC6 explained about 6.04% of the total variability in the observations, being highly contributed to by only Cr. The spatial distribution maps of the first six PCs are presented in Figure 6.
As a dimension reduction technique, PCA reduced the 17 investigated properties into six PCs, accounting for 83.33% of the cumulative variance. A biplot depicting the factor loadings of the first two PCs (PC1 and PC2) is presented in Figure 7. A biplot analysis of PC1 versus PC2 revealed three prominent groups of soil properties, in which K, pH, Mg, Ca, OC, and TN constituted one group, Cu, Zn, Cr, Pb, AP, silt, and clay form another group, while IR, Cd, and DC created another group (Figure 7). The biplot assisted in the identification of soil nutrients for prioritization of management strategies and decision-making to achieve sustainable crop production and soil quality control, and reduce soil pollution. From the biplot, the angles between the vectors show properties that are associated with one another. Properties have a positive correlation when they are near together and create a small angle. They are not likely to be correlated if they intersect at a 900 angle. They are negatively correlated when they diverge and produce a significant angle that is nearly 180o.

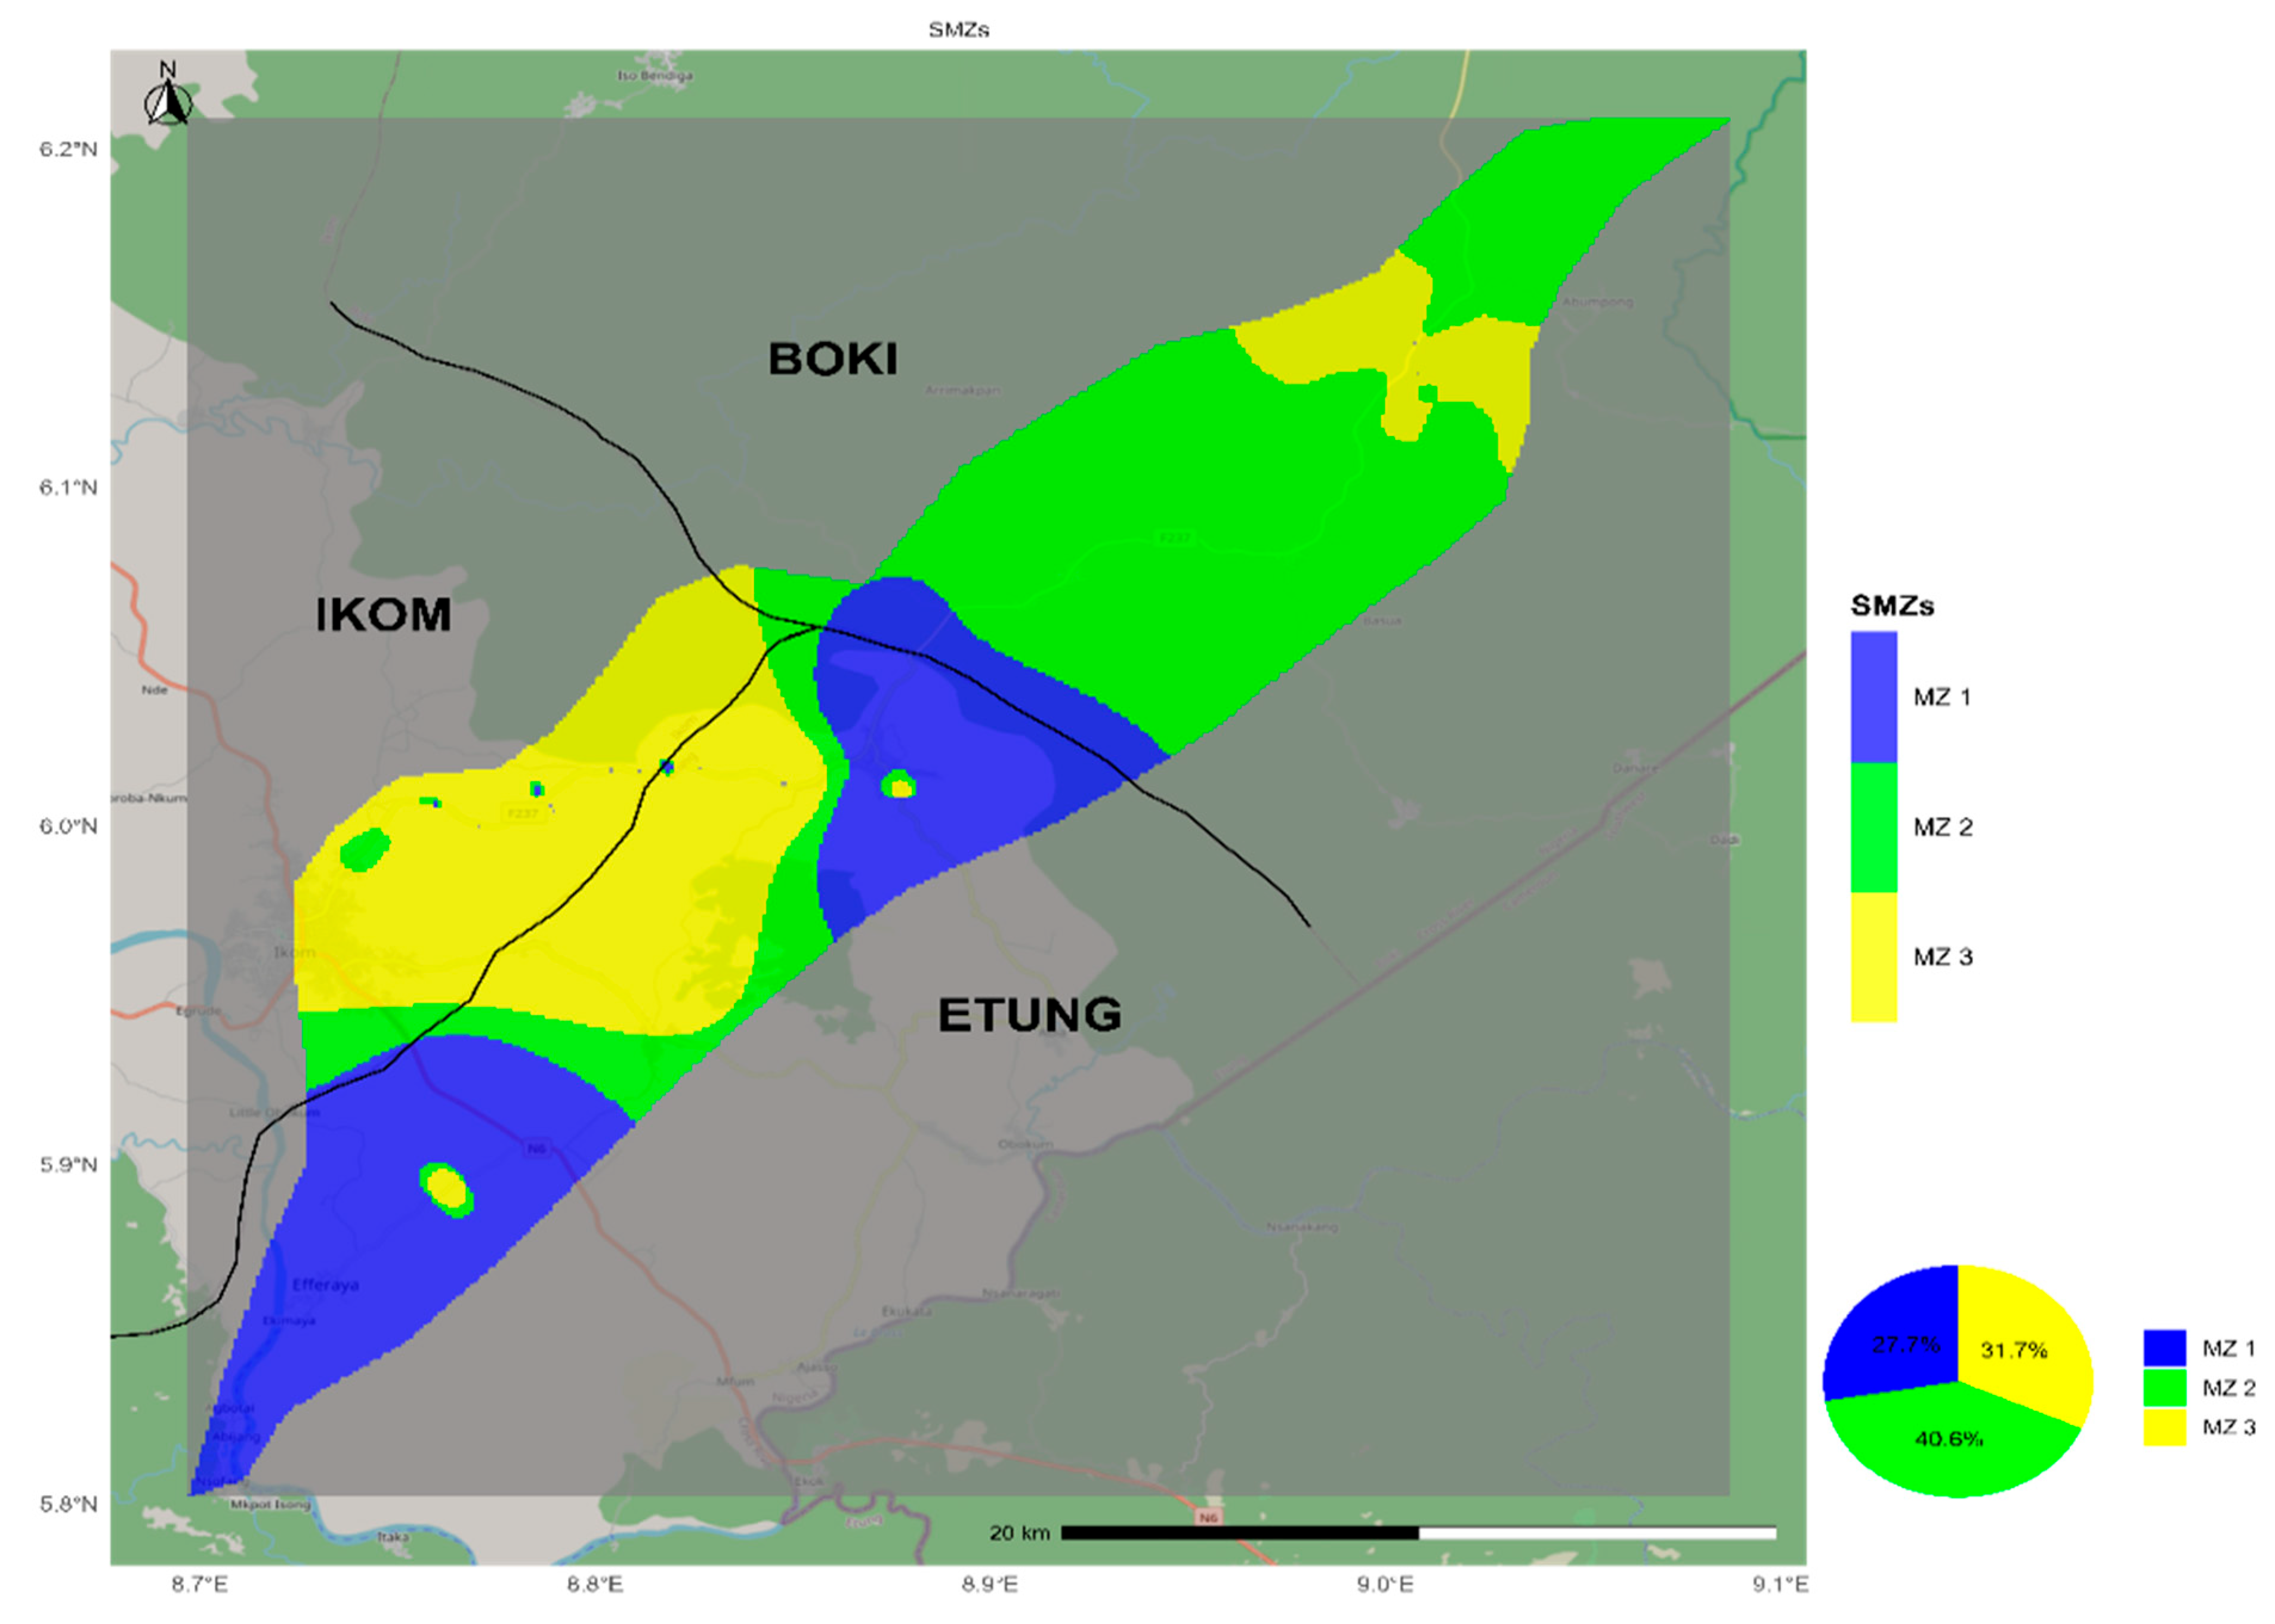
3.5. Delineation of Management Zones Based on Clustering Analysis

To delineate site-specific MZs, the selected six PCs variables were subsequently utilized as input parameters in the fuzzy c-means clustering analysis to establish the optimal number of clusters for partitioning. This resulted in three clusters for the study area. The clustering of these PCs was based on the normalized classification entropy (NCE) and fuzziness performance index (FPI). The minimum NCE and FPI values for the study area were achieved at 3 (Figure 8).
The resulting map generated three distinct MZs: MZ1, MZ2, and MZ3. The significance of the differences among the MZs with respect to soil properties was determined with the analysis of variance (ANOVA) as shown in Table 4. The analysis confirmed that the three delineated MZs were diverse for most soil properties, which varied significantly across the three MZs. For instance, there were significant differences among the three MZs for pH, OC, TN, AP, exchangeable Ca, Mg, and K, sand, silt and clay, Pb, and degree of contamination (DC). This result provides insight into site-specific soil management for sustainable cocoa production while sustaining the soil from land degradation and pollution. Hence, different management strategies specific to each MZ can be planned based on the values of soil properties of different MZs.
MZ3 exhibited the highest pH (6.06), TN (0.24%), OC (2.79%), and exchangeable cations, including calcium (10.62 cmol/kg), magnesium (4.01 cmol/kg), and potassium (0.12 cmol/kg). These values were significantly higher (p < 0.05) than those in MZ2 and MZ1. In terms of particle size fractions, soils in MZ3 and MZ2 were similar and significantly different from those in MZ1. Conversely, MZ1 had the highest lead (Pb) concentration (0.02 mg/kg), which was significantly higher (p < 0.05) than in MZ2 and MZ3. The degree of contamination was highest in MZ2, comparable to MZ1, and significantly higher (p < 0.05) than in MZ3. However, no significant differences (p > 0.05) were observed among the three zones in Cu, Zn, Cd, and Cr, nor in overall ecological risk.
Soils in MZ3 were slightly acidic, with high OC, moderate TN, low available phosphorus, and high exchangeable Ca and Mg but low exchangeable K. To restore fertility in this zone, management practices should focus on increasing exchangeable K and AP and applying lime. Consequently, cocoa productivity in MZ3 is expected to surpass that of MZ2 and MZ1. Meanwhile, MZ2 soils were strongly acidic, had the highest sand and lowest clay content, and exhibited low TN, exchangeable Ca, and K. These conditions indicate depleted fertility and a high risk of environmental degradation through leaching and erosion due to the high sand content. MZ1 soils were moderately acidic, with moderate OC, high AP, and moderate exchangeable Ca and Mg, but low TN and K. Compared to MZ3, soil K and TN levels were lower. To improve fertility, farm managers should enhance K and TN levels by introducing legumes, applying manure, and preserving biomass residues.
The spatial variation of soil MZs is presented in Figure 9. The results indicated that the upper part of the study area had MZ2 as dominant, the lower part was mostly dominated by MZ1, while the central part was mostly dominated by MZ3, with some areas having MZ1 and MZ2. The overall results indicated that MZ1 occupies 27.68% of the study area, while MZ2 occupies 40.60%, and MZ3 occupies 31.72% of the study area (Table 5).

4. Discussion

The soil of the study area, mostly those in the central and lower regions, had higher pH, OC, TN, AP, exchangeable Ca, and Mg. Soils with higher levels of OC (>2.0%) have more mineralizable N that may be accessed by crops [25]. Across the study area, exchangeable K was found to be low when compared to the critical exchangeable K value of 0.2 cmol/kg established by Landon [40]. The low K levels of the observed soils can be attributed to several factors, including parent materials, fixation, and leaching losses [41]. Higher rates of K losses have been reported to occur through erosion and leaching [42]. The low soil N, P, and K observed in cocoa farms within our study locations necessitate tailored nutrient management to sustain cocoa productivity. Soil K is essential for pod quality and disease resistance, phosphorus improves root and pod development, and nitrogen promotes vegetative growth. Continuously harvesting depletes these nutrients; hence, combined NPK fertilization can significantly restore nutrient deficiency. Soil fertility and, eventually, cocoa output and quality can all be enhanced by the combined application of mineral fertilizers and organic amendments.
From our observation, the Zn, Cu, Pb, and Cr values were all below the maximum allowable limits described in Lindsay [43], which were established for the mineral soil environment, and far below the background level established by Turekian and Wedepohl [44]. With these low Zn, Cu, Pb, and Cr contents, the observed soils were deemed safe for crop cultivation. Nevertheless, the Cd concentrations obtained for the study soils were far above the background level of 0.8 mg/kg [44] and the maximum allowable limits of Lindsay (1979; 0.01–0.7 mg/kg) established for mineral soil environment, implying that the soil utilized for cocoa production is laden with Cd. Therefore, there should be proper remediation measures to prevent the dangerous effects of Cd on human health. Although geological material can contribute to elevated heavy metal concentrations [45], the integrated agricultural activities, including fertilizer and pesticide use, might be responsible for the elevated concentration of most heavy metals in the soil. Our results were in line with those of Yeboah et al. [8], carried out in Ghana, where heavy metal concentrations obtained were all below the maximum permissible limit in soil. The result of this indicated that the studied soil had a low degree of contamination. The ecological risk index (RI) is widely used to evaluate heavy metal pollution, ecological risk, and toxicity in soil [46]. The ecological risk of the environment under cocoa cultivation ranged from low risk (RI = 18.24) to moderate risk (RI = 287.15), with moderate risk areas mostly found around the central and upper regions in patches.
Clay content was found to correlate positively with Cu and Pb, which may be due to its higher CEC. Soil texture, particularly clay content, affects the sorption capacity of heavy metals. Higher clay content is more effective at immobilizing metals like Cr and Pb [46]. This is in line with Que et al. [47], where clay was found to be positively correlated with the content of heavy metals (Pb and As). In our investigation, higher pH was associated with increased levels of exchangeable Ca, Mg, and K, and TN and OC, which corroborated the findings of Paudel et al. [48]. Higher pH is associated with increased total nitrogen, and OC is likely to improve microbial activity and nutrient cycling in the study area. It has been reported by Lindsay [43] that soil pH increase can induce metal immobilization through several processes, including the increase of metal sorption onto negative sites or the precipitation of metals in the form of oxides, hydroxides, carbonates, and phosphates. As observed in the correlation matrix (Figure 2), the spatial patterns of soil properties reported in this study all followed a similar trend. Soil properties that were strongly and positively correlated mostly showed a similar spatial pattern, and vice versa. For example, the high correlation between OC with pH, Ca, Mg, K, and TN resulted in a very similar distribution pattern. Notably, variables that had a negative correlation with DC (e.g., OC, TN, Mg, K, pH, and Ca) showed high values where DC was low, and vice versa. Similarly, soil properties that had a negative correlation with sand (e.g., silt, Cr, AP, clay, and Pb) showed high values where sand contents were somewhat low, and vice versa. This is consistent with the results of Paudel et al. [48], which showed a positive correlation between OC and (Ca, Mg and K, and TN and pH), as well as the results of Que et al. [47], which showed a negative correlation between sand and heavy metals.
Our findings are consistent with previous studies that reported the prevalence of exponential, circular, linear, and spherical best-fit models for soil properties [49,50]. The strong spatial dependence observed in this study for silt, pH, OC, Mg, Zn, Cu, Pb, Cd, Cr, and DC is largely attributed to geomorphological and soil structural factors, including parent material, depth to bedrock, topography, and soil texture. In contrast, weaker spatial dependence on soil properties (e.g., Ca and K) is influenced by extrinsic random factors such as climatic conditions, land use changes, and soil management practices. These variations in nugget/sill and range values for most soil properties align with Aggag and Alharbi [49] and Salem et al. [50]. Both intrinsic and anthropogenic factors jointly influence soil properties and their spatial patterns. For example, soil/crop management interventions (fertilizer and pesticide application) and agricultural intensification can alter the spatial scale over which soil properties are autocorrelated, indicating anthropogenic influence on soil spatial structure. Similarly, certain soil property like silt, as observed in this study, is mainly controlled by natural factors (parent materials), which influence soil formation over long temporal scales.
Mapping soil properties using geostatistical methods in cocoa plantations can help identify areas requiring specific interventions to improve soil fertility. Understanding the spatial variation of pH, OC, TN, and AP contents, exchangeable cations, and heavy metals in cocoa plantations is essential for sustainable agricultural practices. The approach adopted in this study is in line with the studies, including Behera et al. [23], Khan et al. [25], Gök et al. [46], and Salem et al. [50]. The literature indicates that while some cocoa soils can sustain adequate nutrient levels, deficiencies, particularly in phosphorus and K, are common and can limit productivity [51]. Implementing targeted soil management strategies based on spatial analysis can enhance soil health and optimize cocoa production across different regions. Cocoa is a perennial crop that needs considerable nutrient inputs, particularly N, P, and K, in the early phases of growth and pod development. P shortage limits root growth and energy transfer, K insufficiency decreases pod size, quality, and disease resistance, and low soil N limits vegetative growth and leaf development. Continuous cocoa cultivation, without sufficient fertilization, depletes essential nutrients in tropical soils, resulting in stunted growth and lower yields. The spatial variation of heavy metals such as chromium (Cr), cadmium (Cd), copper (Cu), lead (Pb), and zinc (Zn) in cocoa plantations is essential, particularly due to their impact on human health. Previous studies [6,9,10] indicated that cocoa plantations often experience extensive applications of agrochemicals, including fertilizers and pesticides, which can introduce heavy metals into the soil. These practices might lead to increased concentrations of heavy metals, raising concerns about their accumulation in both soil and plant tissues, potentially affecting human health and the environment.
The identified areas at risk of contamination, especially with Cd, were found mostly in the central and upper regions, where values exceeding 1.62 mg/kg dominated. However, for Copper (Cu), the risk zones were in the upper and lower regions: here, values up to 18.5 and 25 mg/kg were observed. Additionally, high-risk areas for Zn were found across the entire study area. The degree of contamination poses a high risk in parts of the upper and central regions. Additionally, high-risk areas, according to RI, were in the upper and central regions, reaching approximately 224. Cu is the predominant heavy metal contaminant in many cocoa soils, often reaching moderate to very high contamination levels, while Pb, Cd, Zn, and Fe are generally at lower or natural background levels [10]. Pollution load indices in some Nigerian cocoa plantations indicate significant Cu accumulation due to prolonged fungicide use. Other metals like Zn are present but typically within sufficient or moderate levels. The primary source of heavy metal contamination in cocoa farms is the repeated application of copper-containing fungicides used to control black pod disease. Studies in Nigeria and Cameroon confirm that long-term use of these fungicides leads to copper accumulation in soils, cocoa leaves, pods, and beans [9,10].
Our result derived six PCs from PCA, effectively summarizing the variability of soil properties. PCA was also employed by Afu et al. [52] in their study. The result of this investigation further indicated that management zone 3 (MZ3) had the highest pH (6.06), TN (0.24%), OC (2.79%), exchangeable Ca (10.62 cmol/kg), Mg (4.01 cmol/kg), and K (0.12 cmol/kg) that were significantly (p < 0.05) higher than those observed in MZ2 and MZ1. MZ3 represents the most fertile parts of the study area, closely followed by MZ1, while MZ2 represents the most degraded parts of the study area in terms of soil fertility status. About 40% of the study area had marginal soil (i.e., soil under MZ2). This study highlights the effectiveness of the methodology employed to delineate MZs, which can be instrumental in precise soil nutrient management and maximizing crop productivity. The low K and TN content in the area can be related to intrinsic factors, such as soil formation from low-weatherable parent materials. About 40% of the study area had marginal soil (i.e., soil under MZ2). However, to increase the nutrients to an optimum level, compound fertilizer (e.g., NPK 15:15:15 or 20:10:10) should be applied to target high N, P, and K, as in the case of MZ2, which has high demand for N, P, and K.

5. Conclusions

This study introduces a novel approach that utilizes precision agriculture to optimize high yields while minimizing input material waste in the investigated region. The soil in this area exhibited a low level of contamination. The ecological risk associated with the current cocoa management practices was generally low, although moderate risks were noted in the central and upper regions of the landscape. Additionally, the soils are already contaminated with heavy metals and are deficient in essential nutrients, exhibiting low soil organic carbon content and high acidity. Through the scientific delineation of soil MZs in southeastern Nigeria, land managers and farmers engaged in cocoa production can better identify the varying needs of their soils. This allows them to supply inputs such as fertilizers, water, and pesticides at tailored rates, minimizing waste and leading to improved cocoa growth and higher yields, as resources can be directed where they are most needed. Specific remediation strategies can be implemented for each zone based on its unique requirements. Additionally, optimizing fertilizer use within these soil management zones minimizes the risk of contaminating the soil with heavy metals from fertilizers. Therefore, we recommend implementing a nutrient management approach tailored to each zone’s needs, ensuring efficient use of resources while reducing the environmental risks associated with the over-application of chemicals.

Author Contributions

Conceptualization, I.A.I., O.I.N. and D.M.O.; methodology, I.A.I., D.M.O. and S.M.A.; software, I.A.I. and K.J.; formal analysis, I.A.I.; investigation, I.A.I., B.H. and K.J., resources, M.I.O., I.A.I., P.E.O. and S.M.A.; data curation, D.M.O., V.O.O. and S.M.A.; writing—original draft preparation, I.A.I., B.H. and K.J.; writing—review and editing, I.A.I., B.H., K.J., V.O.O. and D.M.O.; visualization, I.A.I. and K.J.; supervision, O.I.N., M.I.O., S.M.A. and I.A.I. All authors have read and agreed to the published version of the manuscript.

Funding

This research received no external funding.

Data Availability Statement

The datasets used for the current study are available from the corresponding author on reasonable request.

Conflicts of Interest

The authors declare no conflicts of interest.

References

  1. Etaware, P.M. Some Identifiable Factors Responsible for the Variation in Cocoa Production in Nigeria and Other Cocoa Producing Nations, Adjudicated by Their Contributions to the Global Market. Front. Agron. 2022, 4, 731019. [Google Scholar] [CrossRef]
  2. WorldAtlas. The Top 10 Cocoa Producing Countries. 2020, p. 12. Available online: https://www.worldatlas.com (accessed on 12 June 2021).
  3. Prete, M.D.; Samoggia, A. Chocolate Consumption and Purchasing Behaviour Review: Research Issues and Insights for Future Research. Sustainability 2020, 12, 5586. [Google Scholar] [CrossRef]
  4. Wessel, M.; Quist-Wessel, P.M. Cocoa production in West Africa, a review and analysis of recent developments. NJAS Wagening. J. Life Sci. 2015, 74–75, 1–7. [Google Scholar] [CrossRef]
  5. Aminu, F.O.; Edun, T.A. Environmental effect of pesticide use by cocoa farmers in plantation soil in East Kolaka, Indonesia. Orient. J. Chem. 2019, 33, 1164–1170. [Google Scholar]
  6. Arham, Z.; Asmin, L.O.; Rosmini, R.; Nurdin, M. Heavy Metal Content of Cocoa Plantation Soil in East Kolaka, Indonesia. Orient J. Chem. 2017, 33, 1164–1170. [Google Scholar] [CrossRef]
  7. Aikpokpodion, P.E.; Adeniyi, D.O.; Olorunmota, R.T.; Adeji, A.O. Environmental Impacts of Long-Term Use of Pesticides in Cocoa Ecosystem. J. Res. For. Wildl. Environ. 2024, 16, 1–16. [Google Scholar]
  8. Yeboah, S.; Dogbatse, J.A.; Kumi, M.A.; Tulcan, R.X.S.; Addae-Wireko, L. Heavy metal status in cocoa (Theobroma cacao L.) soils and beans: The case of Abuakwa North Municipality of Eastern Region, Ghana. Environ Monit Assess. 2024, 196, 156. [Google Scholar] [CrossRef]
  9. Aikpokpodion, P.E.; Lajide, L.; Aiyesanmi, A.F. Heavy Metals Contamination in Fungicide Treated Cocoa Plantations in Cross River State, Nigeria. Am.-Eurasian J. Agric. Environ. Sci. 2010, 8, 268–274. [Google Scholar]
  10. Aikpokpodion, P.E. Assessment of heavy metals pollution in fungicide treated cocoa plantations in Ondo State, Nigeria. J. Appl. Biosci. 2010, 33, 2034–2046. [Google Scholar]
  11. Osinuga, O.A.; Aduloju, A.B.; Oyegoke, C.O. Impact of agrochemicals application on soil quality indicators and trace elements level of wetlands under different uses. J. Trace Elem. Miner. 2023, 5, 100090. [Google Scholar] [CrossRef]
  12. Isong, I.A.; John, K.; Okon, P.B.; Ogban, P.I.; Afu, S.M. Soil quality estimation using environmental covariates and predictive models: An example from tropical soils of Nigeria. Ecol. Process. 2022, 11, 66. [Google Scholar] [CrossRef]
  13. Amalu, U.C.; Isong, I.A. Status and spatial variability of soil properties in relation to fertilizer placement for intercrops in an oil palm plantation in Calabar, Nigeria. Niger. J. Crop Sci. 2018, 5, 58–72. [Google Scholar]
  14. Li, C.; Wang, X.; Qin, M. Spatial variability of soil nutrients in seasonal rivers: A case study from the Guo River Basin, China. PLoS ONE 2021, 16, e0248655. [Google Scholar] [CrossRef] [PubMed]
  15. John, K.; Bouslihim, Y.; Isong, I.A.; Lahcen, H.L.; Razouk, R.; Kebonye, N.M.; Agyeman, P.C.; Penížek, V.; Zádorová, T. Mapping soil nutrients via different covariates combinations: Theory and an example from Morocco. Ecol. Process. 2022, 11, 23. [Google Scholar] [CrossRef]
  16. John, K.; Isong, I.A.; Kebonye, N.M.; Ayito, E.O.; Agyeman, P.C.; Afu, S.M. Using Machine Learning Algorithms to Estimate Soil Organic Carbon Variability with Environmental Variables and Soil Nutrient Indicators in an Alluvial Soil. Land 2020, 9, 487. [Google Scholar] [CrossRef]
  17. Gökmen, V.; Sürücü, A.; Budak, M.; Bilgili, A.V. Modeling and mapping the spatial variability of soil micronutrients in the Tigris basin. J. King Saud Univ. Sci. 2023, 35, 102724. [Google Scholar] [CrossRef]
  18. Nyengere, J.; Okamoto, Y.; Funakawa, S.; Hitoshi Shinjo, H. Analysis of spatial heterogeneity of soil physicochemical properties in northern Malawi. Geoderma Reg. 2023, 35, e00733. [Google Scholar] [CrossRef]
  19. Yuan, Y.; Shi, B.; Yost, R.; Liu, X.; Tian, Y.; Zhu, Y.; Cao, W.; Cao, Q. Optimization of Management Zone Delineation for Precision Crop Management in an Intensive Farming System. Plants 2022, 11, 2611. [Google Scholar] [CrossRef]
  20. Lajili, A.; Cambouris, A.N.; Chokmani, K.; Duchemin, M.; Perron, I.; Zebarth, B.J.; Biswas, A.; Adamchuk, V.I. Analysis of Four Delineation Methods to Identify Potential Management Zones in a Commercial Potato Field in Eastern Canada. Agronomy 2021, 11, 432. [Google Scholar] [CrossRef]
  21. Aliyu, K.T.; Kamara, Y.A.; Jibrin, M.J.; Huising, E.J.; Shehu, M.B.; Adewopo, J.B.; Mohammed, B.I.; Solomon, R.; Adam, M.A.; Samndi, M.A. Delineation of Soil Fertility Management Zones for Site-specific Nutrient Management in the Maize Belt Region of Nigeria. Sustainability 2020, 12, 9010. [Google Scholar] [CrossRef]
  22. Ameer, S.; Cheema, M.J.M.; Khan, M.A.; Amjad, M.; Noor, M.; Wei, L. Delineation of nutrient management zones for precise fertilizer management in wheat crop using geo-statistical techniques. Soil Use Manag. 2022, 38, 1430–1445. [Google Scholar] [CrossRef]
  23. Behera, S.K.; Ravi, K.; Mathur, R.K.; Shukla, A.K.; Suresh, K.; Prakash, C. Spatial variability of soil properties and delineation of soil management zones of oil palm plantations grown in a hot and humid tropical region of southern India. CATENA 2018, 165, 251–259. [Google Scholar] [CrossRef]
  24. Zeraatpisheh, M.; Bakhshandeh, E.; Emadi, M.; Li, T.; Xu, M. Integration of PCA and Fuzzy Clustering for Delineation of Soil Management Zones and Cost-Efficiency Analysis in a Citrus Plantation. Sustainability 2020, 12, 5809. [Google Scholar] [CrossRef]
  25. Khan, H.; Farooque, A.A.; Acharya, B.; Abbas, F.; Esau, T.J.; Zaman, Q.U. Delineation of Management Zones for Site-Specific Information about Soil Fertility Characteristics through Proximal Sensing of Potato Fields. Agronomy 2020, 10, 1854. [Google Scholar] [CrossRef]
  26. Hashemi, S.E.; Gholian-Jouybari, F.; Hajiaghaei-Keshteli, M. A fuzzy C-means algorithm for optimizing data clustering. Expert Syst. Appl. 2023, 227, 120377. [Google Scholar] [CrossRef]
  27. Maleki, S.; Karimi, A.; Mousavi, A.; Kerry, R.; Taghizadeh-Mehrjardi, R. Delineation of Soil Management Zone Maps at the Regional Scale Using Machine Learning. Agronomy 2023, 13, 445. [Google Scholar] [CrossRef]
  28. Srinivasan, R.; Shashikumar, B.N.; Singh, S.K. Mapping of Soil Nutrient Variability and Delineating Site-Specific Management Zones Using Fuzzy Clustering Analysis in Eastern Coastal Region, India. J. Indian Soc. Remote Sens. 2022, 50, 533–547. [Google Scholar] [CrossRef]
  29. Gee, G.W.; Or, D. Particle Size Analysis. In Methods of Soil Analysis, Part 4, Physical Methods; Dane, J.H., Topp, G.C., Eds.; ASA and SSSA: Madison, WI, USA, 2002; pp. 255–293. [Google Scholar]
  30. Udo, E.J.; Ibia, T.O.; Ogunwale, J.A.; Ano, A.O.; Esu, I.E. Manual of Soil, Plan and Water Analyses; Sibon Books Limited: Lagos, Nigeria, 2009; p. 183. [Google Scholar]
  31. Nelson, O.W.; Sommers, L.E. Total Carbon, Organic Carbon and Organic Matter. In Methods of Soil Analysis Part 3, Chemical Methods; Sparks, O.L., Ed.; Soil Science Society of America Book Series Number 5; American Society of Agronomy: Madison, WI, USA, 1996; pp. 961–1010. [Google Scholar]
  32. Bremner, J.M. Total nitrogen. In Methods of Soil Analysis: Part 3—Chemical Methods; Soil Science Society of America, Inc.: Madison, WI, USA, 1996; pp. 1085–1121. [Google Scholar]
  33. Kuo, S. Phosphorus. In Methods of Soil Analysis: Part 3; Sparks, D.L., Ed.; SSSA Book Series No. 5; SSSA and ASA: Madison, WI, USA, 1996; pp. 869–919. [Google Scholar]
  34. Lindsay, W.L.; Norvell, W.A. Development of DTPA soil tests for Zn, Fe, Mn and Cu. Soil Sci. Soc. Am. J. 1978, 42, 421–428. [Google Scholar] [CrossRef]
  35. Hakanson, L. An ecological risk index for aquatic pollution control. A sedimentological approach. Water Res. 1980, 14, 975–1001. [Google Scholar] [CrossRef]
  36. Theoneste, N.; Gang, D.U.; Jing-Song, G.; Xu, G.; Lei, H. Pollution and potential ecological risk assessment of heavy metals in a lake. Pol. J. Environ. Stud. 2013, 122, 1129–1134. [Google Scholar]
  37. Goovaerts, P. Geostatistical modelling of uncertainty in soil science. Geoderma 2001, 103, 3–26. [Google Scholar] [CrossRef]
  38. Cambardella, C.A.; Moorman, T.B.; Novak, J.M.; Parkin, T.B.; Karlen, D.L.; Turco, R.F.; Konopka, A.E. Field-scale variability of soil properties in Central Iowa soils. Soil Sci. Soc. Am. J. 1994, 58, 1501–1511. [Google Scholar] [CrossRef]
  39. Andrews, S.S.; Mitchell, J.P.; Mancinelli, R.; Karlen, D.L.; Hartz, T.K.; Horwath, W.R.; Pettygrove, G.S.; Scow, K.M.; Munk, D.S. On-Farm assessment of soil quality in California’s central valley. Agron. J. 2002, 94, 12–23. [Google Scholar]
  40. Landon, J.R. Booker Tropical Soil Manual: A Handbook for Soil Survey and Agricultural Land Evaluation in the Tropics and Subtropics; Routledge: Oxfordshire, UK, 2014. [Google Scholar]
  41. Brady, N.C.; Weil, R.R. Elements of the Nature and Properties of Soil, 2nd ed.; Prentice Han: Englewood Cliffs, NJ, USA, 2006. [Google Scholar]
  42. Ambeager, A. Soil Fertility and Plant Nutrition in the Tropics and Subtropics; IFAV/IPI: Zug, Switzerland, 2006; p. 96. [Google Scholar]
  43. Lindsay, W. Chemical Equilibrai in Soils, 1st ed.; John Wiley and Sons: New York, NY, USA, 1979. [Google Scholar]
  44. Turekian, K.K.; Wedepohl, D.H. Distribution of the elements in some major units of the earth’s crust. Bull. Geol. Soc. Am. 1961, 72, 175–192. [Google Scholar] [CrossRef]
  45. Afu, M.S.; Isong, I.A.; Aki, E.E.; John, J. Heavy metals in agricultural soils developed on diverse parent materials in Cross River State, Nigeria. Arch. Agron. Soil Sci. 2021, 67, 1375–1387. [Google Scholar] [CrossRef]
  46. Gök, G.; Tulun, Ş.; Çelebi, H. Mapping of heavy metal pollution density and source distribution of campus soil using geographical information system. Sci Rep. 2024, 14, 29918. [Google Scholar] [CrossRef] [PubMed]
  47. Que, W.; Yi, L.; Wu, Y.; Li, Q. Analysis of heavy metals in sediments with different particle sizes and influencing factors in a mining area in Hunan Province. Sci. Rep. 2024, 14, 20318. [Google Scholar] [CrossRef]
  48. Paudel, M.; Adhikari, K.R.; Subedi, B.; Gairhe, J.J.; Vista, S.P.; Lamichhane, S. Assessment of the relationship between soil ph and macronutrients at Baseshwor, Sindhuli. J. Inst. Agric. Anim. Sci. 2020, 36, 241–248. [Google Scholar] [CrossRef]
  49. Aggag, A.M.; Alharbi, A. Spatial Analysis of Soil Properties and Site-Specific Management Zone Delineation for the South Hail Region, Saudi Arabia. Sustainability 2022, 14, 16209. [Google Scholar] [CrossRef]
  50. Salem, H.M.; Schott, L.R.; Piaskowski, J.; Chapagain, A.; Yost, J.L.; Brooks, E.; Kahl, K.; Johnson-Maynard, J. Evaluating Intra-Field Spatial Variability for Nutrient Management Zone Delineation through Geospatial Techniques and Multivariate Analysis. Sustainability 2024, 16, 645. [Google Scholar] [CrossRef]
  51. Akinbode, S.O.; Folorunso, O.; Olutoberu, T.S.; Olowokere, F.A.; Adebayo, M.; Azeez, S.O.; Hammed, S.G.; Busari, M.A. Farmers’ Perception and Practice of Soil Fertility Management and Conservation in the Era of Digital Soil Information Systems in Southwest Nigeria. Agriculture 2024, 14, 1182. [Google Scholar] [CrossRef]
  52. Afu, S.M.; Isong, I.A.; Olim, D.M.; Egbai, O.O.; Aaron, M.E.; Heueng, B.; John, K. The nexus of clay mineralogy and soil fertility under diverse parent materials in two distinct geomorphological settings. Environ. Earth Sci. 2024, 83, 653. [Google Scholar] [CrossRef]
Figure 1. Map showing the study location and sampling areas.
Land 14 01366 g001
Figure 2. Correlation matrix plot showing the relationship between the studied soil properties. Note: * Significant at p ≤ 0.05; ** significant at p ≤ 0.01. OC = organic carbon (%), TN = total nitrogen (%), AP = Available Phosphorus (mgkg−1), Ca = Exchangeable Ca (cmolkg−1), Mg = Exchangeable Mg (cmolkg−1), K = Exchangeable K (cmolkg−1), DC = degree of contamination, RI = Ecological Risk, Cd = cadmium, Cr = Chromium, PB = Lead, Cu = Copper, Zn = Zinc.
Land 14 01366 g002
Figure 3. Experimental and fitted semivariogram models for the target soil properties.
Land 14 01366 g003
Figure 4. Predictive maps of soil properties using ordinary kriging.
Land 14 01366 g004
Figure 5. Predictive maps of heavy metals, degree of contamination, and ecological risk using ordinary kriging.
Land 14 01366 g005
Figure 6. Predictive maps of six principal components (PCs) with the OK model.
Land 14 01366 g006
Figure 7. Principal component analysis biplot depicting linkages between soil properties and study sites. Note: OC = organic carbon (%), TN = total nitrogen (%), AP = Available Phosphorus (mgkg−1), Ca = Exchangeable Ca (cmolkg−1), Mg = Exchangeable Mg (cmolkg−1), K = Exchangeable K (cmolkg−1), Cd = cadmium (mgkg−1), Cr = Chromium (mgkg−1), Pb = Lead (mgkg−1), Cu = Copper (mgkg−1), Zn = Zinc (mgkg−1), RI = Ecological risk index, DC = Degree of contamination.
Land 14 01366 g007
Figure 8. Calculated fuzziness performance index (FPI) and normalized classification entropy (NCE) for the different number of cluster classes.
Land 14 01366 g008
Figure 9. Map of soil management zones for the study area.
Land 14 01366 g009
Table 1. Descriptive statistics of the studied soil properties.
MeanMinMaxSDCV (%)SkewnessKurtosisKS p-Value
Sand (%)58.3536.679.009.0515.51−0.09−0.040.90
Silt (%)34.7516.0056.008.2423.720.380.270.42
Clay (%)7.012.0019.402.8440.511.624.950.13
pH5.624.806.300.437.71−0.21−1.090.30
OC (%)2.220.924.000.7332.830.24−0.560.93
TN (%)0.190.080.340.0632.720.23−0.580.80
AP (mgkg−1)8.710.1232.7510.27117.840.81−0.90.00
Ca (cmolkg−1)6.52.4016.803.8659.490.93−0.110.12
Mg (cmolkg−1)2.891.206.401.2543.180.89−0.070.03
K (cmolkg−1)0.110.080.140.0113.770.27−0.330.02
Cu (mgkg−1)23.2312.7638.196.3827.470.62−0.790.11
Zn (mgkg−1)20.695.1036.215.2425.30.030.850.54
Pb (mgkg−1)0.010.000.040.0170.780.931.140.27
Cd (mgkg−1)1.410.182.870.8057.090.02−1.540.06
Cr (mgkg−1)0.030.010.340.05160.785.1625.380.00
DC6.171.6511.933.0449.280.08−1.120.41
RI140.8418.24287.1580.3757.060.02−1.540.06
KS = Kolmogorov–Smirnov p-value; CV = coefficient of variation; DC = degree of contamination; RI = ecological risk of environment. OC = organic carbon, TN = total nitrogen, AP = Available Phosphorus, Ca = Exchangeable Ca, Mg = Exchangeable Mg, K = Exchangeable K, DC = degree of contamination, Cd = cadmium, Cr = Chromium, PB = Lead, Cu = Copper, Zn = Zinc.
Table 2. Semivariogram parameters for the studied soil properties.
VariablesModelNugget (C0)Partial Sill (C1)Sill (C0+C1)Range (m)Nugget/SillSpatial DependencyMEMAERMSE
SandLinear34.5447.481.9413,746.570.42Moderate−1.586.838.59
SiltExponential5.0167.8972.89100.000.07Strong1.016.088.08
ClaySpherical3.276.489.759675.820.33Moderate−0.502.062.86
pHLinear0.010.140.149857.630.06Strong−0.030.260.32
OCExponential0.000.440.44274.810.00Strong−0.060.620.71
TNSpherical0.000.000.001661.710.74Moderate−0.000.0490.06
APCircular50.00105.46155.46950.000.32Moderate0.396.888.26
CaCircular8.342.3110.65885.520.78Weak−0.042.973.56
MgCircular0.081.241.315846.950.06Strong−0.050.961.19
KSpherical6.807.47 × 10−56.80709.040.10Weak6.77 × 10−50.010.01
ZnLinear5.7422.0927.83868.980.21Strong−0.044.555.73
CuLinear3.2538.8942.14788.150.08Strong−0.075.857.03
PbSpherical1.65 × 10−86.27 × 10−56.27 × 10−51014.290.00Strong−0.000.010.01
CdCircular0.150.530.681213.770.22Strong0.030.770.86
CrSpherical0.000.000.001200.860.07Strong−0.010.010.02
DCSpherical2.297.299.58893.120.24Strong0.092.653.13
RICircular1876.434595.206471.63262.260.29Moderate1.1373.7281.52
Note: OC = organic carbon (%), TN = total nitrogen (%), AP = Available Phosphorus (mgkg−1), Ca = Exchangeable Ca (cmolkg−1), Mg = Exchangeable Mg (cmolkg−1), K = Exchangeable K (cmolkg−1), DC = degree of contamination, IR = Ecological Risk, Cd = cadmium (mgkg−1), Cr = Chromium (mgkg−1), Pb = Lead (mgkg−1), Cu = Copper (mgkg−1), Zn = Zinc (mgkg−1).
Table 3. Principal component analysis and loading coefficient for the first six principal components.
PC 1PC 2PC 3PC 4PC 5PC 6
eigenvalue4.5752.8222.7321.6911.3181.027
Variance (%)26.91416.60216.0699.9497.7536.044
CV (%)26.91443.51659.58569.53477.28783.331
Soil properties
pH0.880−0.023−0.1260.0250.194−0.03
OC0.7940.0480.1900.018−0.481−0.093
TN0.7980.0350.1960.027−0.471−0.107
AP0.0780.0260.5670.462−0.081−0.384
Ca0.9350.0140.0000.0690.166−0.019
Mg0.780−0.1430.138−0.0220.0530.042
K0.837−0.169−0.2490.0030.1410.232
Clay−0.0070.0550.2010.8160.104−0.039
Silt−0.002−0.0650.944−0.0380.0490.168
Sand−0.0210.051−0.927−0.216−0.092−0.145
Cu0.0920.034−0.3070.7630.0000.313
Zn0.1690.1650.1560.0980.812−0.037
Pb−0.012−0.0210.2260.6390.011−0.244
Cd0.0370.983−0.0490.0450.0660.010
Cr0.0360.0840.249−0.054−0.0220.888
RI0.0370.983−0.0490.0450.0660.010
DC−0.3840.8850.000−0.0310.0390.083
Note: Boldface factor loadings are considered highly weighted; OC = organic carbon (%), TN = total nitrogen (%), AP = Available Phosphorus (mgkg−1), Ca = Exchangeable Ca (cmolkg−1), Mg = Exchangeable Mg (cmolkg−1), K = Exchangeable K (cmolkg−1), Cd = cadmium (mgkg−1), Cr = Chromium (mgkg−1), Pb = Lead (mgkg−1), Cu = Copper (mgkg−1), Zn = Zinc (mgkg−1), CV = Cumulative variance, RI = Ecological Risk Index, DC = Degree of Contamination.
Table 4. Differences in soil properties among the MZs, estimated by analysis of variance (ANOVA).
Exchangeable CationsParticle Size FractionsHeavy Metals
MZspHOCTNAPCaMgKClaySiltSandCuZnPbCdCrRIDC
MZ15.57 b2.12 b0.18 b17.32 a5.23 b2.55 b0.10 b8.39 a40.13 a51.46 b22.05 a21.41 a0.02 a1.48 a0.02 a148.52 a5.97 ab
MZ25.20 c1.68 c0.14 c3.77 c3.07 c1.97 b0.10 b5.95 b32.22 b62.31 a22.53 a19.89 a0.01 b1.33 a0.04 a132.67 a7.53 a
MZ36.06 a2.79 a0.24 a7.72 b10.62 a4.01 a0.12 a7.11 ab33.58 b59.16 a24.69 a20.98 a0.01 b1.43 a0.04 a143.55 a5.00 b
Note: OC = organic carbon (%), TN = total nitrogen (%), AP = Available Phosphorus (mgkg−1), Ca = Exchangeable Ca (cmolkg−1), Mg = Exchangeable Mg (cmolkg−1), K = Exchangeable K (cmolkg−1), Cd = cadmium (mgkg−1), Cr = Chromium (mgkg−1), Pb = Lead (mgkg−1), Cu = Copper (mgkg−1), Zn = Zinc (mgkg−1), MZs = management zones, RI = Ecological risk index. Means within a column not sharing a letter in common differ significantly from other means (p < 0.05) following Tukey’s Honestly Significant Difference (HSD) test.
Table 5. Area of coverage by soil management zones.
Soil MZsArea (Ha)%
MZ1 14,115.427.7
MZ220,703.140.6
MZ316,173.231.7
Disclaimer/Publisher’s Note: The statements, opinions and data contained in all publications are solely those of the individual author(s) and contributor(s) and not of MDPI and/or the editor(s). MDPI and/or the editor(s) disclaim responsibility for any injury to people or property resulting from any ideas, methods, instructions or products referred to in the content.

