1. Introduction
Tourism is now one of the most dynamic components of the ocean economy with marine- and coastal-related travel already gaining a dominant share of global tourism receipts and ranking among the fastest-growing blue-economy sectors [
1]. As coastal destinations compete for this expanding market, local authorities face the paradox that the very growth they encourage is having an intensifying effect on environmental stress, with a particularly visible factor being marine debris: accumulating litter diminishes beach aesthetics, depresses visitor satisfaction, and ultimately erodes the economic dividend that tourism is meant to secure [
2,
3].
Despite decades of research linking beach cleanliness to tourist preferences [
4,
5], routine monitoring still relies heavily on manual transects, photo-assisted surveys, or visitor questionnaires. However, these techniques are labor-intensive—Phillips and House [
6] report that surveying a one-kilometer beach segment can demand up to eight person-hours—and spatially sparse, typically covering <5% of the shoreline each season. Such limitations hamper evidence-based management, especially where debris loads fluctuate across micro-landforms such as beach entrances, rocky groins, or dune edges.
Remote-sensing and deep-learning advances offer a technical escape from this bottleneck, but while satellite imagery has been trialed for broad-scale litter plumes, even 0.3 m WorldView-4 scenes fail to resolve the 5–50 cm objects that dominate beach debris [
7]. Unmanned-aerial-vehicle (UAV) platforms close this resolution gap (<1 cm px at 30 m altitude) and, when paired with object-detection networks, can achieve impressive operational accuracies: recent studies reported mean average precision (
mAP) values of 70–80% for bottles [
8] and 72% for mixed classes along 1900 km of Hawaiian coastline [
9]. Yet most research still stops at single-scene performance benchmarking; few works translate pixel detections into geospatial layers suitable for policy analysis or test whether high-resolution outputs reveal spatial patterns that coarser data would miss.
To address these gaps, the present study developed an end-to-end GeoAI workflow that (i) trained a Grid R-CNN detector on an 11-class UAV debris dataset, (ii) converted detections directly into GIS-ready vectors, and (iii) analyzed object-level densities across five contiguous beaches on Wonsan Island, Korea. Our contributions include quantifying the detection gain delivered by a two-stage grid-based network relative to earlier one-stage designs; demonstrating an automated conversion pipeline that eliminates the manual vectorization step still common in environmental GeoAI; and testing whether ultra-high-resolution debris maps expose management-relevant patterns that remain invisible at meter-scale resolutions.
Accordingly, this study is guided by the following research questions and hypotheses:
RQ1. Does the proposed UAV–Grid R-CNN workflow achieve superior detection accuracy (mAP > 70%) compared with published manual survey baselines?
H1. The trained model will reach a mAP of at least 70% against an expert-verified image subset.
RQ2. How does the object-level distribution of marine debris extracted from ≤1 cm UAV imagery relate to micro-scale drivers—specifically beach entrances and distance to the landward edge—and do these relationships remain undetected when the imagery is degraded to meter-level resolution?
H2. Debris density will exhibit a statistically significant negative correlation (r < −0.5) with distance from entrances and landward boundaries in the high-resolution dataset, whereas no such pattern will emerge from coarser resampled imagery.
By centering the analysis on object-scale spatial patterns and their implications for coastal planning, this study demonstrates that high-resolution GeoAI is not merely a faster counting tool, but a critical enabler of evidence-based governance in tourism-driven coastal zones.
2. Literature Review: Monitoring Marine Debris on Tourist Beaches
2.1. Traditional Beach-Litter Surveys and Their Limitations
Research on marine debris impacts began with ecological case studies in the 1980s [
10,
11] and soon extended to tourism, where visitor displeasure with littered scenery was first quantified by Morgan [
3]. Because early work depended on manual transects and photo-assisted counts, subsequent large-scale programs—e.g., the OSPAR 100 m protocol or the United Kingdom’s Marine Conservation Society audits—codified labor-intensive field methods: roughly 8 person-hours are needed to survey one kilometer of shore [
6]. Coverage therefore remains patchy, with Williams et al. [
12] estimating that routine campaigns sample <5% of the Caribbean shoreline each year, while cleaning costs for local authorities can exceed USD 300 km
−1 season
−1 [
13]. Moreover, the spatial bias and infrequent repetition of such surveys make it difficult to pinpoint hotspots near beach entrances, access roads, or dune edges—micro-sites that tourists experience most directly and managers must prioritize.
2.2. Remote-Sensing and Deep-Learning Progress
Very-high-resolution (VHR) satellites have been explored as a remedy, but a 0.31 m WorldView-4 scene still cannot resolve the 5–50 cm items that dominate strand-line debris, with Topouzelis, Papakonstantinou, and Garaba [
7] reporting omission rates above 80%. Unmanned-aerial-vehicle (UAV) platforms, however, close the resolution gap (<1 cm ground sampling distance) and have proven cost-effective for multisite coverage [
14,
15]. When paired with modern object detectors, accuracies approach operational thresholds [
16]: Tran et al. [
8] achieved a mean average precision (
mAP) of 80% for plastic bottles, and Winans et al. [
9] reported 72%
mAP across 1900 km of Hawaiian shoreline. Nevertheless, most studies stop at scene-level metrics with detections rarely projected into geographic coordinate systems, and the fine-scale spatial relationships that might inform beach-cleaning logistics or visitor-management schemes have yet to be tested statistically.
2.3. Remaining Gaps and Rationale for This Study
Taken together, the literature reveals three unresolved needs: First, conventional surveys are too sparse and costly to guide day-to-day beach operations. Second, meter-scale VHR imagery is inadequate for individual-object mapping, while UAV datasets remain under-used unless paired with advanced GeoAI. Third—and most critical for coastal tourism governance—no study has quantified how object-level debris densities vary with micro-landform drivers such as entrance proximity or landward distance, relationships that can only be exposed by centimeter-scale analysis. Addressing these gaps, the present work fuses ≤1 cm UAV imagery with a Grid R-CNN detector and an automated georeferencing pipeline, then tests whether the resulting high-resolution maps reveal statistically significant patterns invisible at coarser scales. By doing so, we aim to supply local authorities with actionable intelligence on where—and why—tourist beaches accumulate litter.
3. Materials and Methods
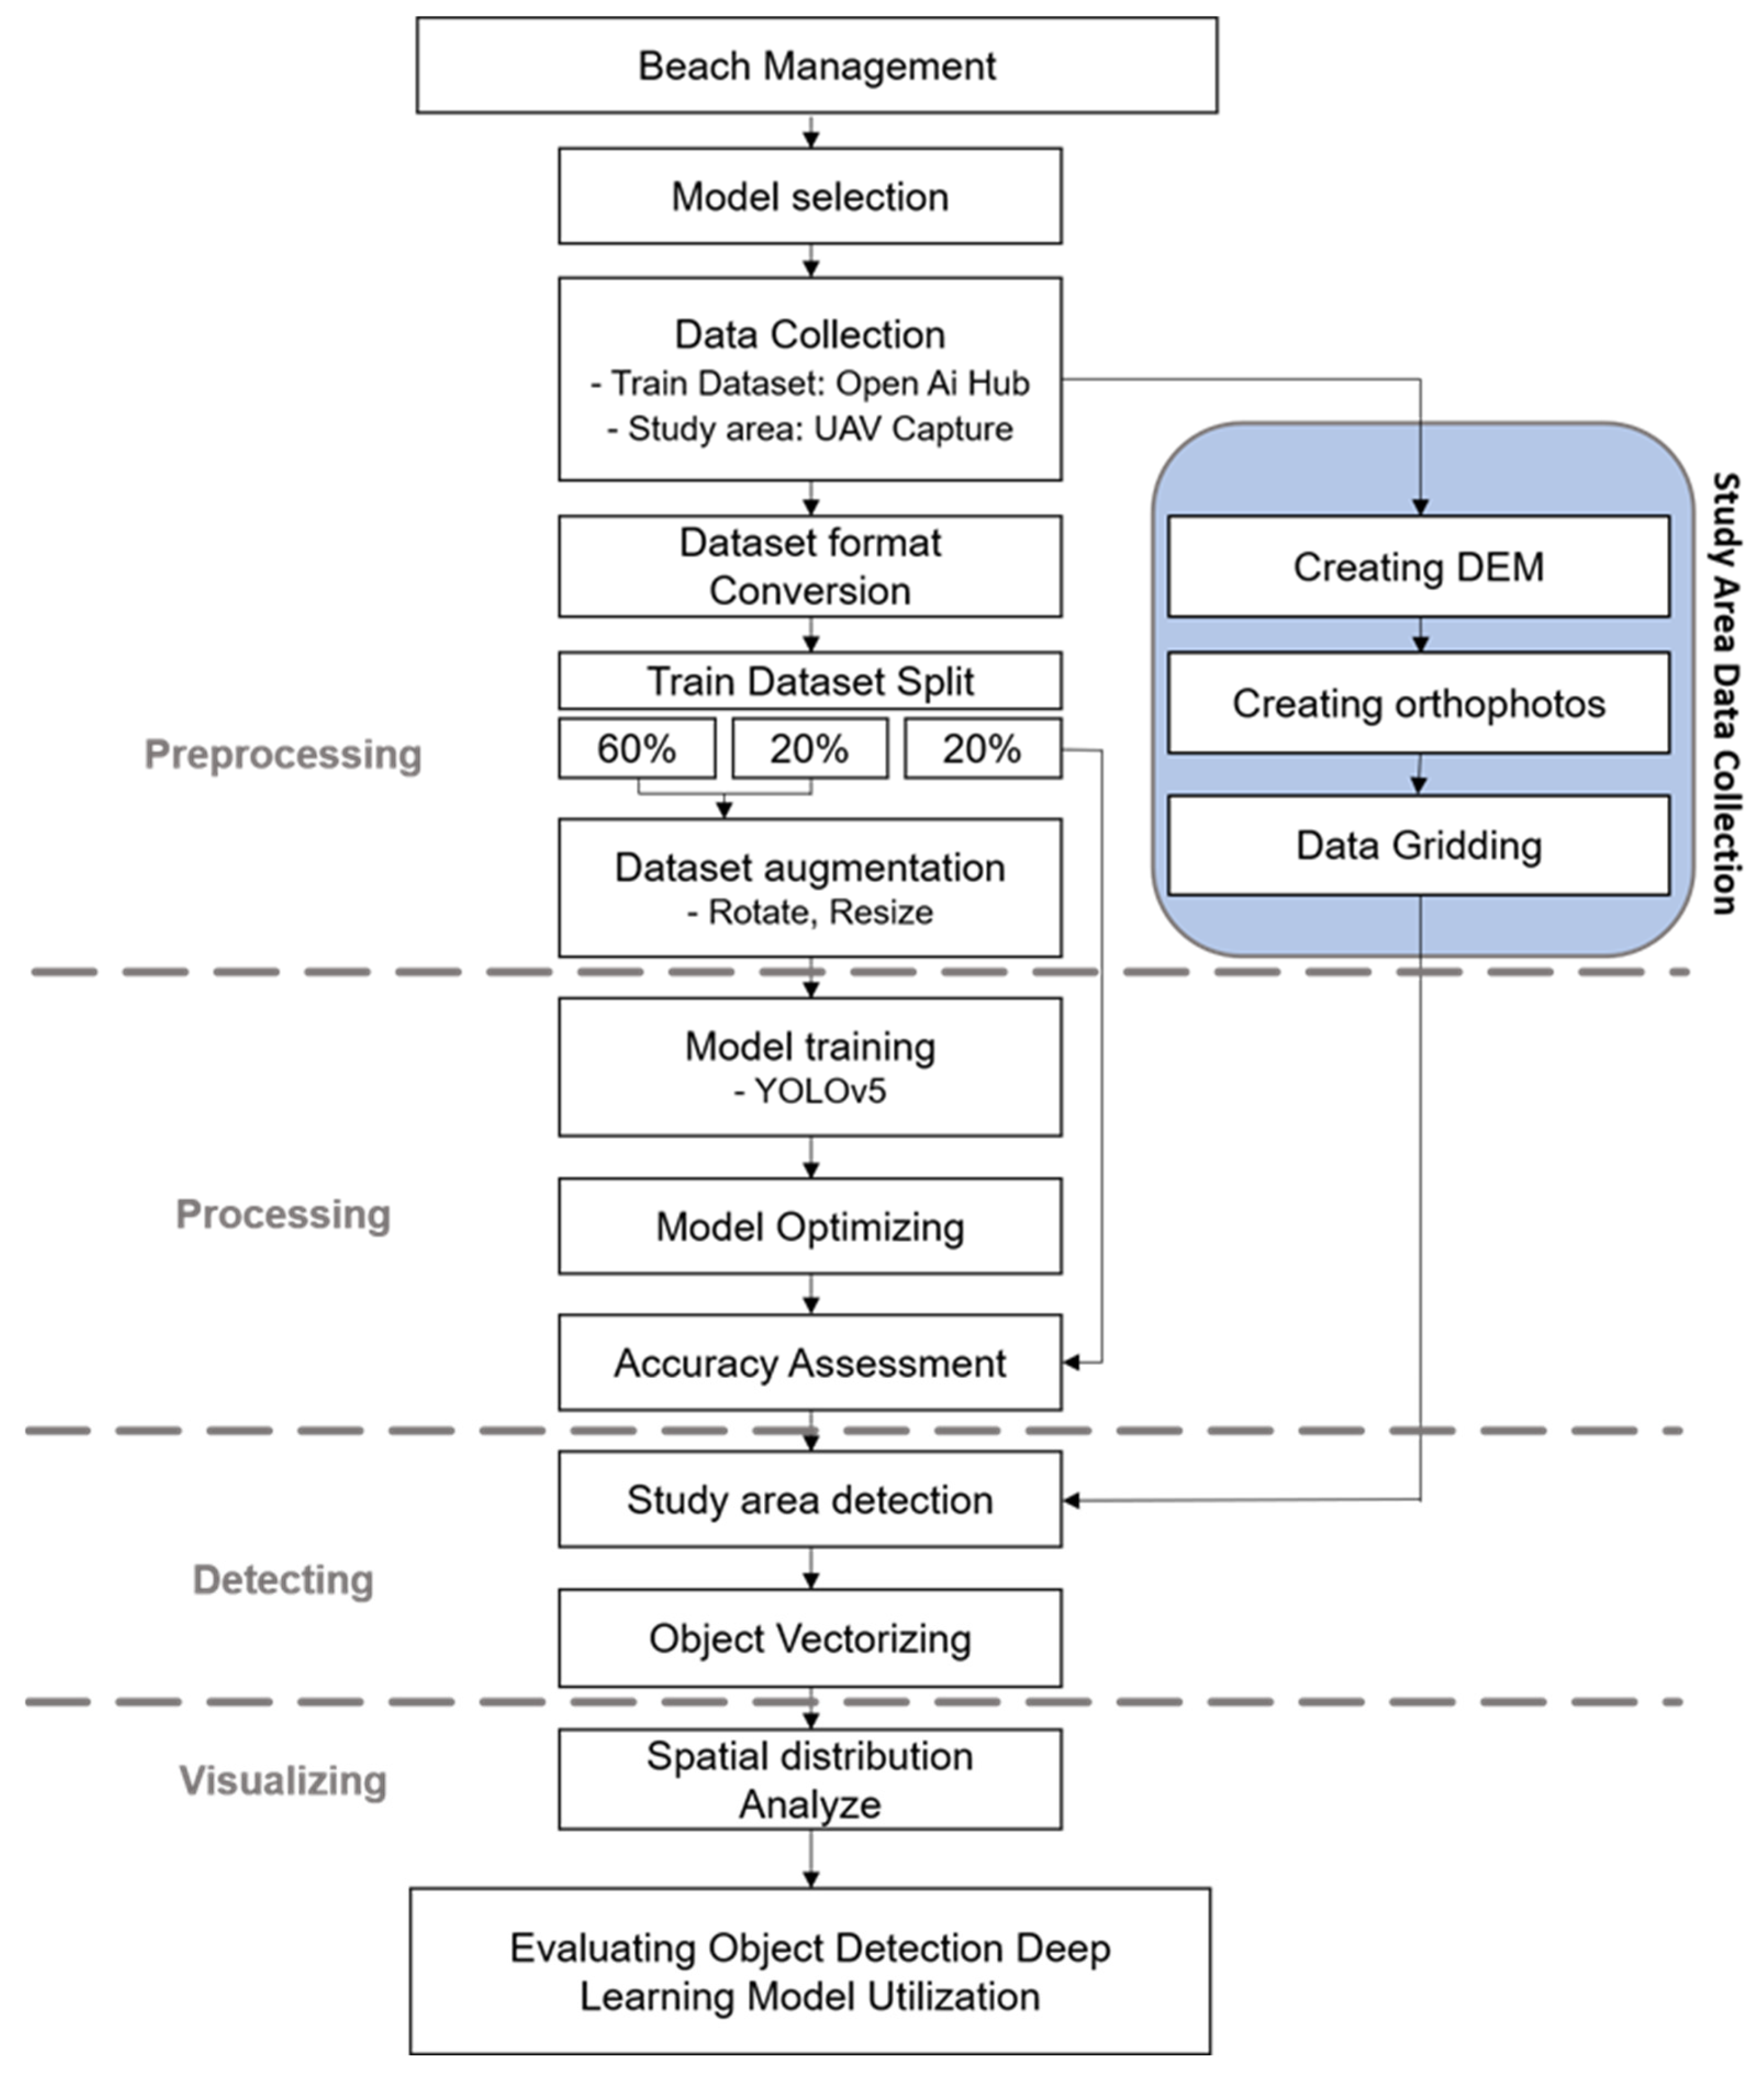
Methodologically, this study aims to efficiently acquire high-precision spatial information and establish an integrated spatial database through the automation of geographic object extraction from remote sensing images using geospatial artificial intelligence (GeoAI) technologies. The research is divided into four main stages—preprocessing, processing, detection, and visualizing—with each further subdivided into sub-processes.
Figure 1 presents the overall workflow of this study.
3.1. Data Acquisition
3.1.1. Study Area and Flight Approvals
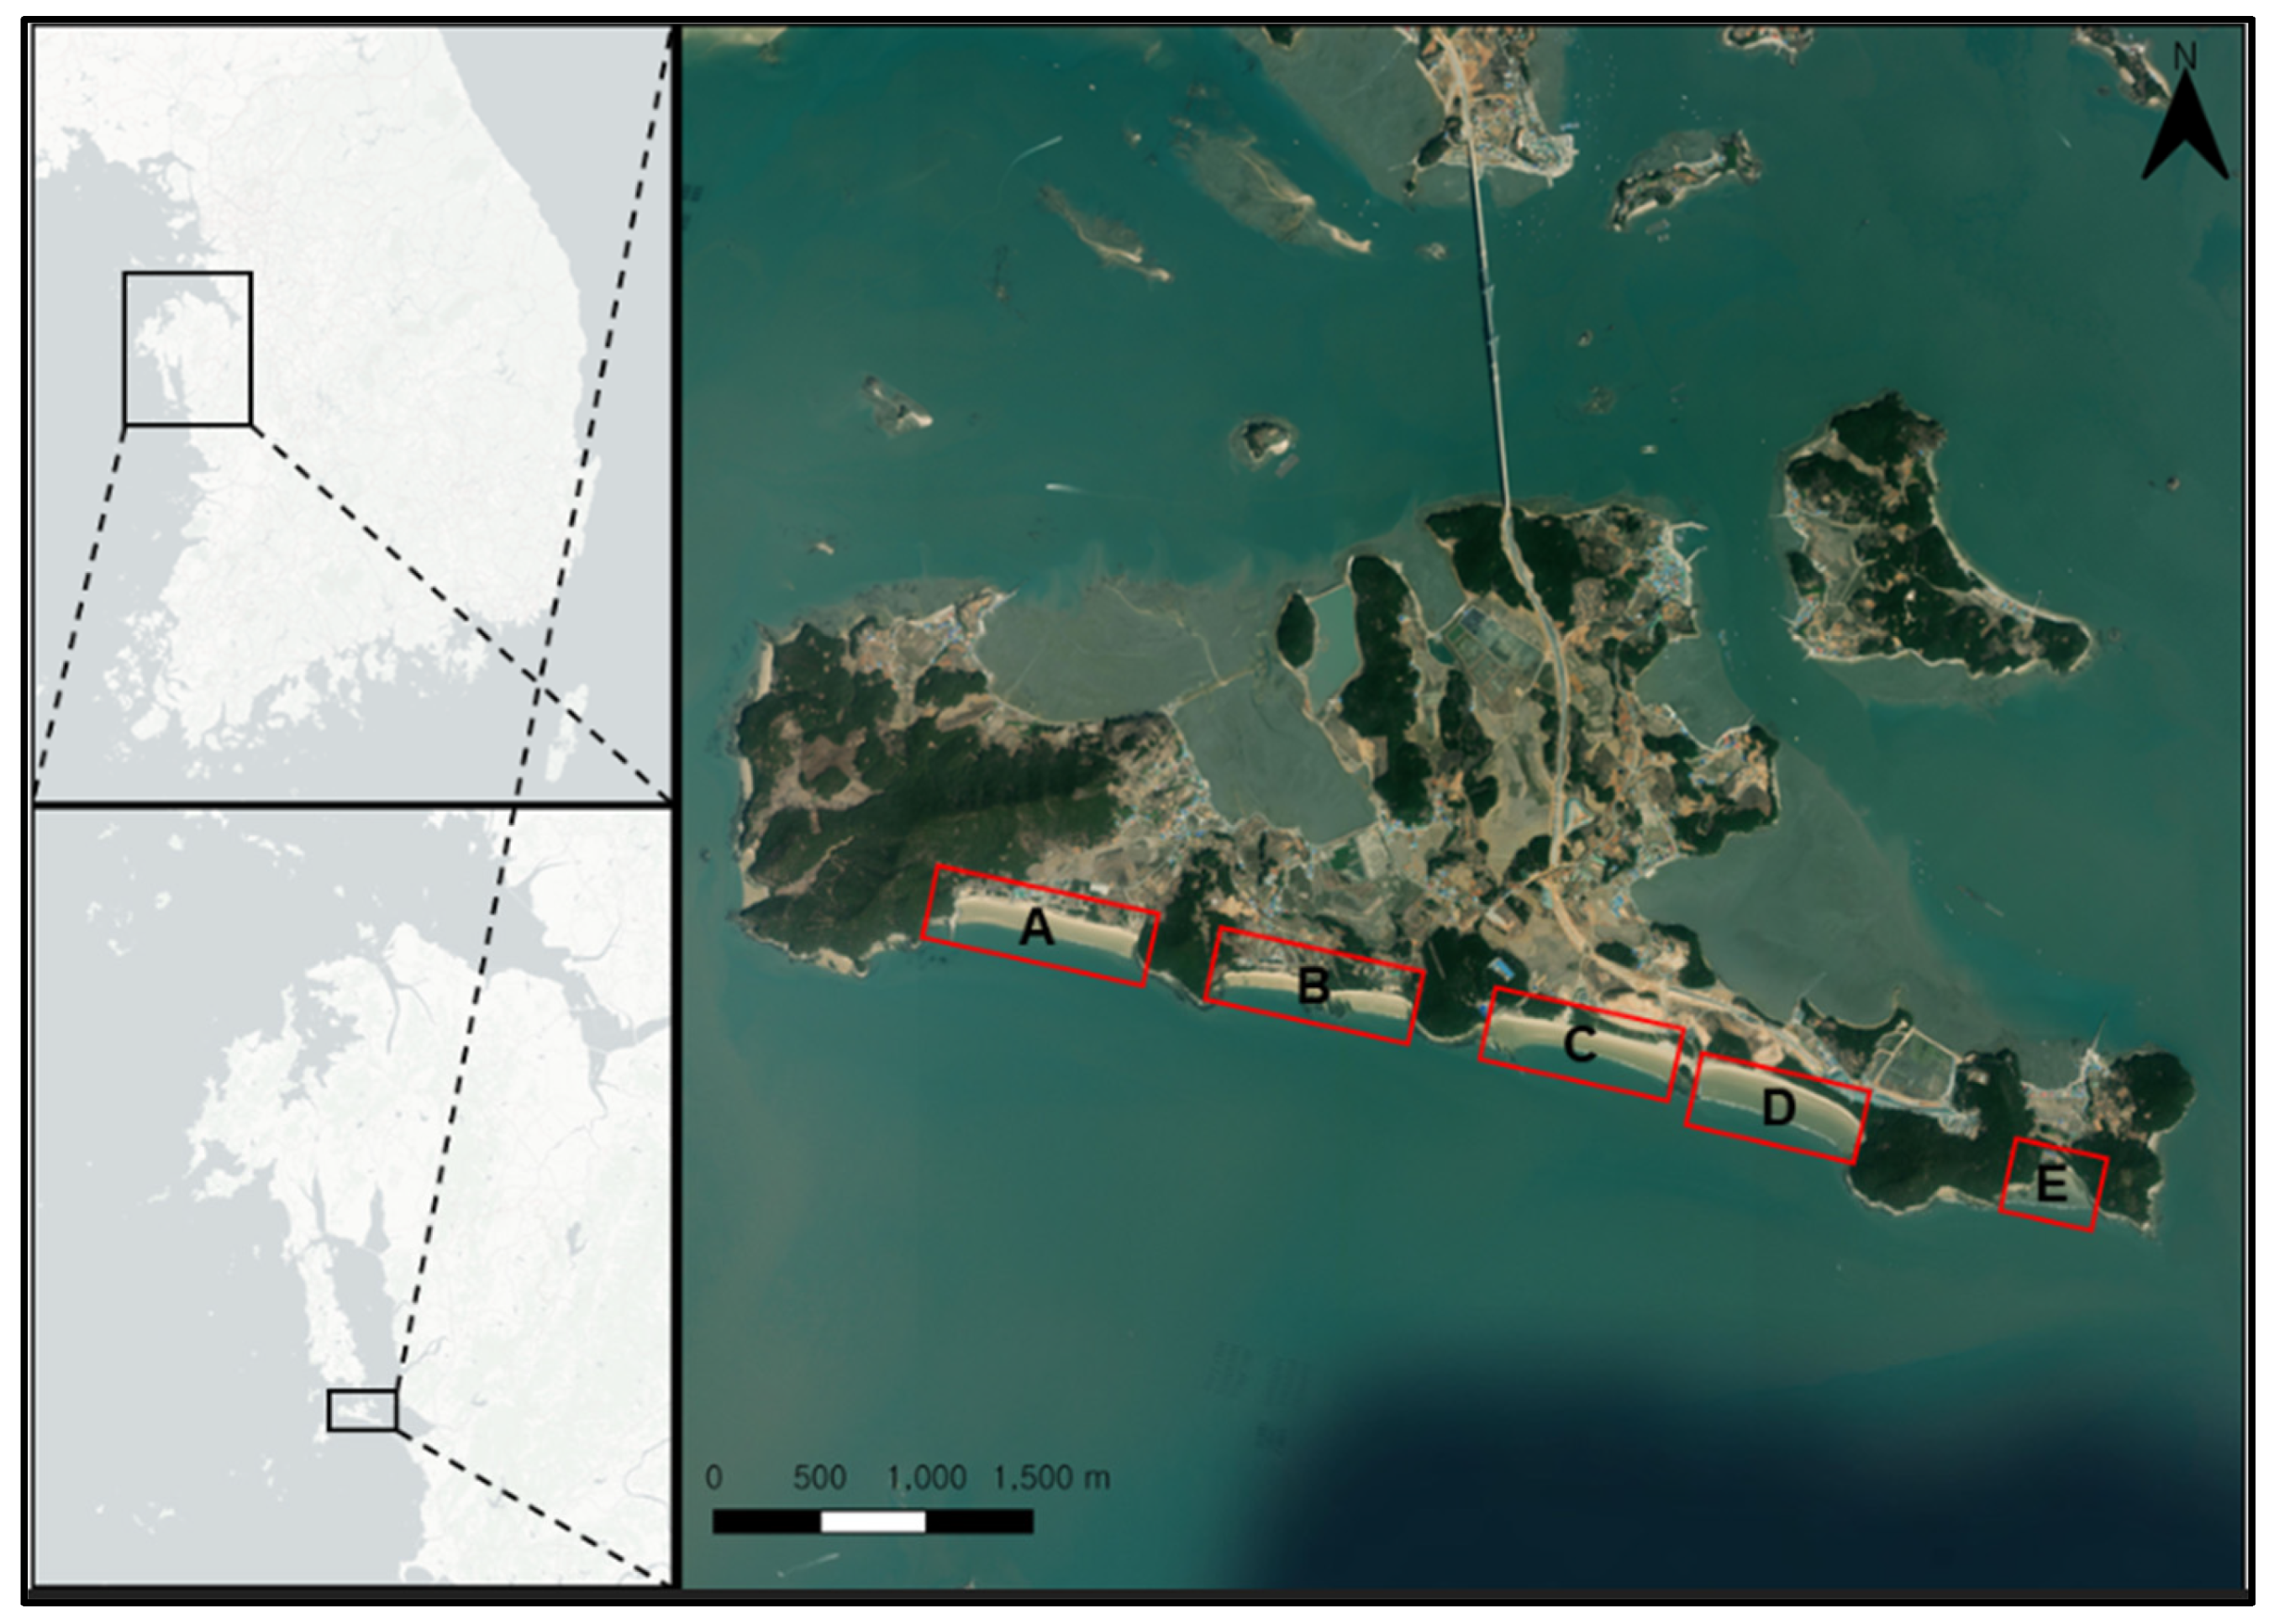
UAV operations were conducted along five sandy beaches on Wonsan Island, Boryeong-si, Chungcheongnam-do (see
Figure 2). Beach (A) is Obongsan Beach and (B) is Sachang Beach, while (C) and (D) form Wonsando Beach and (E) is Jeodu Beach. Wonsan Island covers an area of 7.07 km
2 and has a population of 982 people. Wonsan Island’s beaches serve both the fishing industry and a growing tourism sector, particularly after the opening of the Boryeong Undersea Tunnel in 2021, which significantly improved accessibility leading to a sharp rise in visitor numbers. Approximately 6 km of extensive coastline stretches along the southern end of the island, segmented by four small mountains that form five distinct beaches. Given this expansive coastal area, about two-thirds of the island’s population is engaged in the fishing industry, but in response to rising tourism, Boryeong-si is actively developing tourist infrastructure such as resorts and campgrounds. However, this rapid growth has also led to a surge in waste, including construction debris and litter from recreational activities such as camping and fishing, and despite ongoing cleanup efforts, the island continues to struggle with managing both locally generated and washed-ashore marine debris. This study aims to address these challenges by using UAVs and deep-learning techniques to analyze and quantify the spatial distribution of marine litter along Wonsan Island’s beaches, ultimately supporting more effective debris management and impact assessment.
All sorties were registered through the Drone One-Stop portal of the Ministry of Land, Infrastructure, and Transport (MOLIT), Korea’s competent aviation authority for remotely piloted aircraft. As the study area lies wholly within a designated drone operation zone, the portal issued an operation identification code that the flight team carried on-site with no requirement for an additional municipal waiver. Flight plans avoided private property and populated foreshore zones, and missions were scheduled outside the peak tourist season to minimize any disturbance to visitors or local businesses.
3.1.2. Image-Capture Parameters
Data were acquired between 15−20 January 2023, coinciding with a spring-tide cycle that maximized exposure of the strand line. A DJI Phantom 4 quad-copter, DJI (SZ DJI Technology Co., Ltd., Shenzhen, China), equipped with a 20 mm f/2.8 camera (94° FOV, 1/2.3″ CMOS, 12.4 MP) flew at 30 m above ground level along parallel tracks planned in Pix4D Capture with 70% forward and side overlap. This configuration produced raw frames at a ground-sampling distance of 0.83 cm px−1. Thirty-one flights yielded 31,841 images, which were processed into georeferenced ortho-mosaics using Pix4D Mapper (version 4.6.4).
3.1.3. Desk-Based Ground-Truth Subset
Because on-site object verification was impracticable, we created a desk-based validation set. 10% of ortho-mosaic tiles were selected by simple random sampling, exported as 512 × 512 px chips, and independently annotated by two experienced remote-sensing researchers in the CVAT (Computer Vision Annotation Tool, version 2.0.0.). Bounding boxes were retained only where both annotators agreed on class identity and extent with disagreements resolved through discussion to form a consensus reference set. This subset served both as the validation split during model training and as an independent test set for the accuracy metrics reported in
Section 3.2.
The combined protocol ensured legal compliance, avoided public intrusion, maximized shoreline visibility during low-tide conditions, and generated a high-resolution imagery set with internally consistent annotations for the subsequent GeoAI workflow.
3.2. Deep-Learning Workflow
3.2.1. Training Dataset
Marine-debris imagery supplied by the AI Hub Data Center includes 11 object classes—e.g., Styrofoam, plastic fragment, container, bag/film—all labeled with MS COCO-style bounding boxes. The full inventory and class frequencies are summarized in
Table 1.
While the dataset contains UAV, CCTV, and smartphone sources, this study retained only UAV imagery to avoid scale inconsistency, yielding the class distribution shown in
Table 2.
After quality checks (blurry or over-exposed frames removed), the data were split image-wise into 80% training, 10% validation, and 10% independent test sets. Validation and test images coincided with the desk-based consensus labels described in
Section 3.1.3, ensuring that all reported metrics were evaluated on boxes accepted by both annotators.
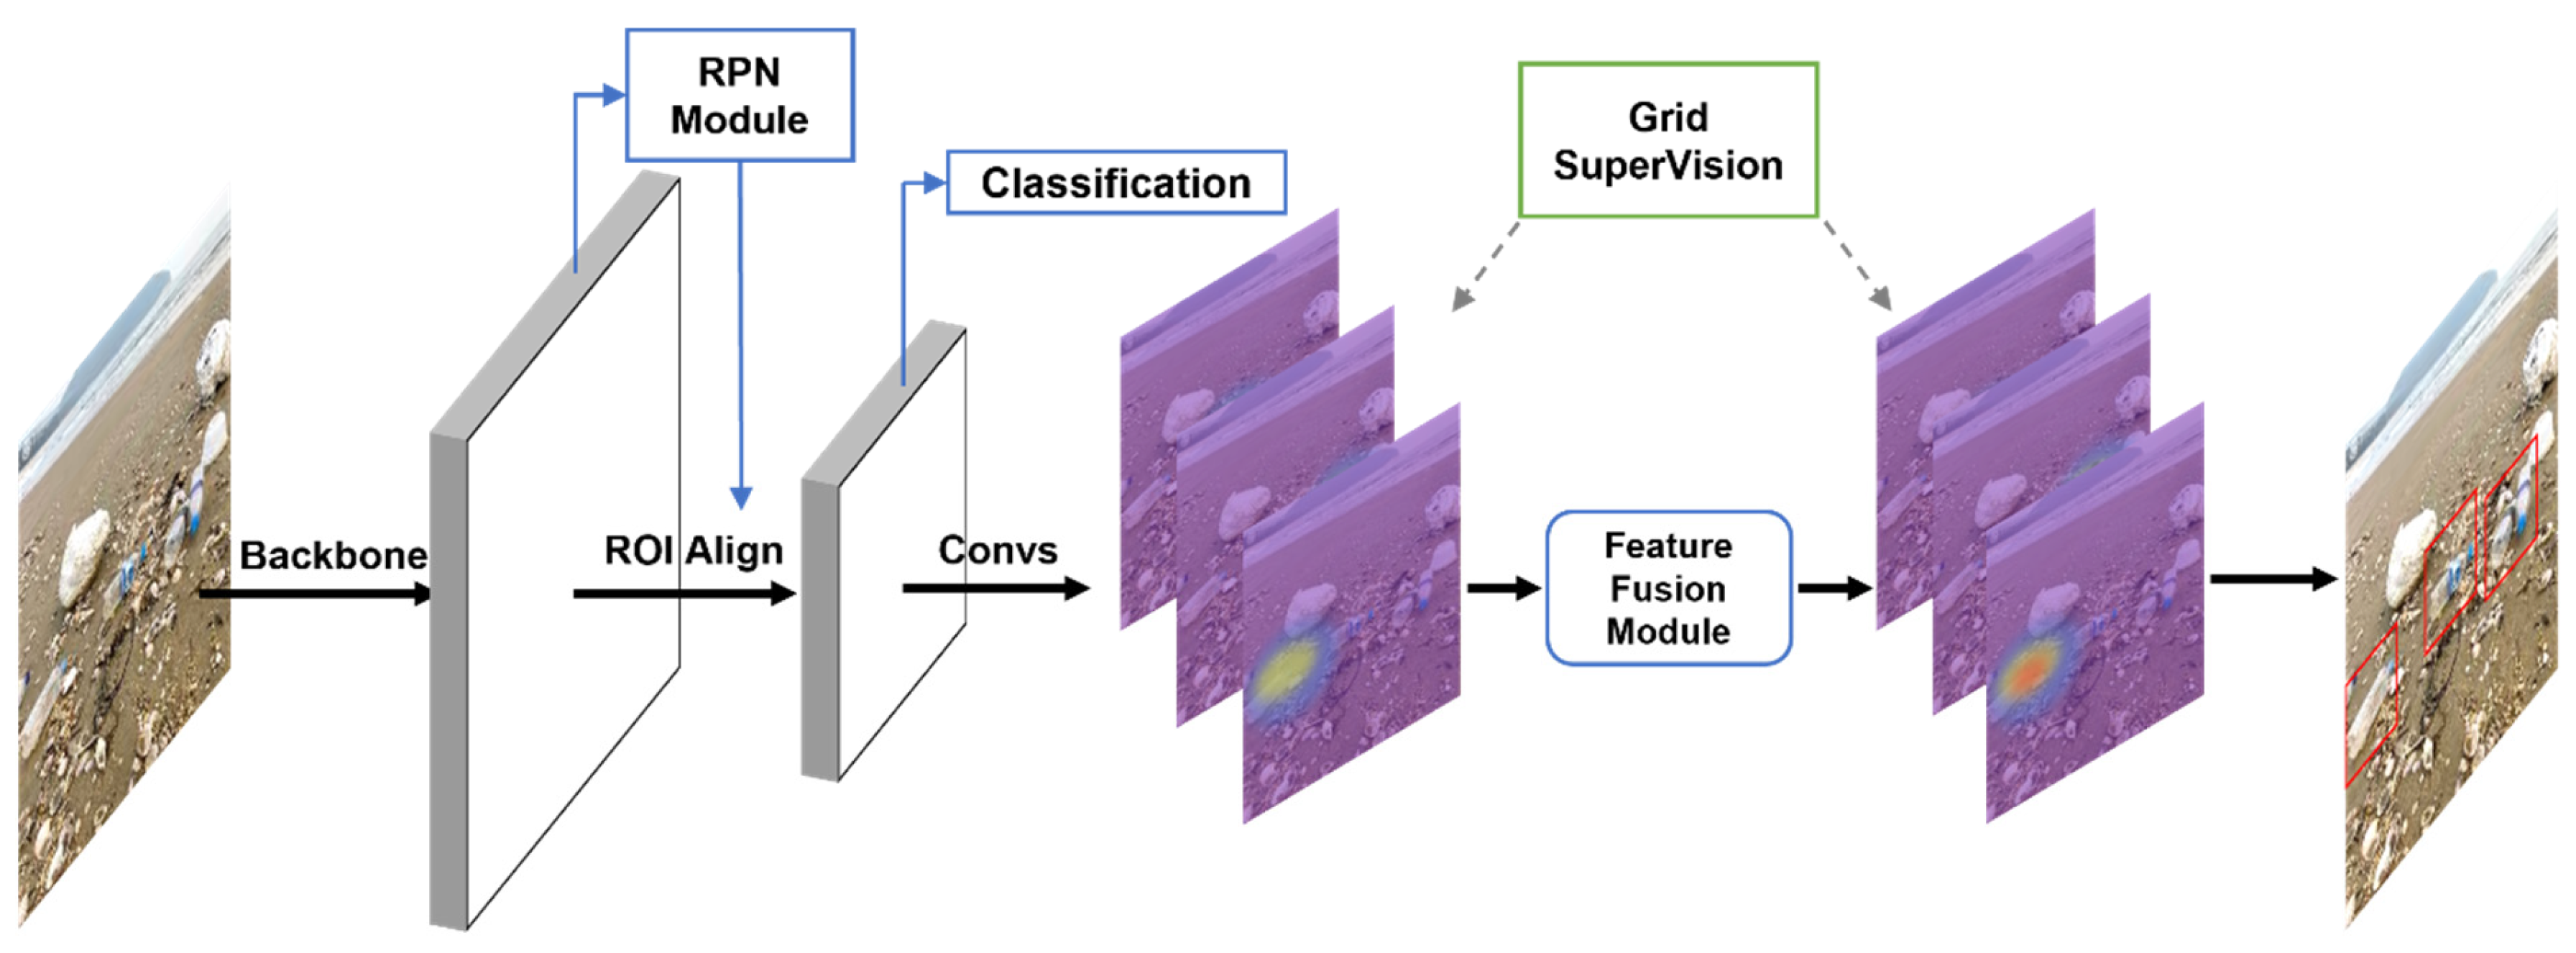
3.2.2. Model Architecture
A two-stage Grid R-CNN detector was adopted for its grid-based localization module that improves small-object recall relative to standard Faster R-CNN while preserving class discrimination accuracy. The backbone was ResNet-101 with feature-pyramid network (FPN) augmentation. A schematic of the architecture is reproduced from the original publication in
Figure 3.
3.2.3. Hyper-Parameter Settings
Key training parameters followed the defaults recommended for Grid R-CNN but were fine-tuned during preliminary experiments; full details appear in
Table 3.
The final model was trained for 100 epochs with stochastic gradient descent, an initial learning rate of 0.01, a momentum of 0.9, and a weight decay of 5 × 10⁻⁴. Early stopping was not used because the validation loss converged steadily after epoch 60.
3.2.4. Computing Environment
Training and inference were executed on a single workstation, the specifications of which are listed in
Table 4.
3.2.5. Accuracy Metrics and Validation Protocol
Performance was assessed on the independent test split with the COCO evaluation toolkit. A detection was counted as correct when the predicted class matched the label and the intersection-over-union (IoU) between predicted and ground-truth boxes exceeded 0.5; otherwise, it was logged as a false positive (
FP) or false negative (
FN). Because the absence of debris is not an evaluated category, true negatives were not recorded. From the resulting confusion matrix, we computed precision and recall—defined, respectively, as the proportion of true positives (
TP) among all positive predictions and the proportion of
TP among all actual positives, using Equations (1) and (2). Post hoc tallies of common
FP sources (e.g., wave foam, pebbles) were compiled to aid the qualitative discussion in
Section 4.
The average precision (
AP) for each class was calculated as the area under the interpolated precision–recall curve (Equations (3) and (4)), and the mean of these values across all 11 classes yielded the mean average precision
mAP (0.5:0.95) reported in the Results section (Equation (5)).
AP and
mAP are quintessential metrics used in the computer vision domain to quantitatively represent model object recognition performance [
17].
3.2.6. Inference Speed and Scalability Assessment
Runtime was measured on full-resolution 512 × 512-pixel chips. The trained network can process 2.87 images s−1 on the RTX 3060 Ti listed above, equivalent to mapping the 6 km Wonsan shoreline in ≈0.9 h with a single GPU. Linear speed-up is achievable by distributing tiles across multiple GPUs because the inference stage is embarrassingly parallel; four identical nodes would reduce wall time to ≈14 min, making routine quarterly monitoring feasible for local authorities.
3.3. Post-Processing and Evaluation
3.3.1. Geo-Referencing Pipeline
Object detections exported by the Grid R-CNN are returned as COCO-style JSON files that record class labels, confidence scores, and four normalized pixel-image coordinates for each bounding box. To integrate these outputs with standard GIS workflows, a three-step conversion was implemented.
Bounding-box coordinates exported by the detector were first transformed from image space to map space by applying the affine coefficients embedded in each ortho-mosaic, thereby yielding Easting and Northing values in the Korean national projected system (EPSG: 5179). The resulting geometries and their attributes were then serialized directly to GeoJSON, a lightweight, human-readable vector format. Finally, to ensure compatibility with legacy desktop GIS environments, the GeoJSON files were batch-converted to ESRI Shapefiles and consolidated into a single geodatabase. Every stage of this conversion—pixel-to-map transformation, serialization, and format translation—was executed automatically through a custom Python routine that leverages the Fiona and Shapely libraries.
3.3.2. Grid-Based Density Mapping
To summarize spatial patterns, the unified Shapefile was intersected with a 25 m × 25 m fishnet grid covering the five beaches. Each cell stores the count of debris objects and inherits the dominant class when one class represents >50% of detections inside the cell. Counts were then classified into five equal-quantile density levels to enable choropleth visualization in subsequent result figures.
3.3.3. Visual Pattern Inspection
Beach entrance locations and the landward vegetation line were digitized from the ortho-mosaics and overlaid on the density grid. Visual cross-checking revealed a clear tendency for high-density cells (quantiles 4 and 5) to cluster within ~50 m of either an entrance ramp or the landward edge of the backshore. Low-density cells predominated on the central foreshore and around headlands where pedestrian access is limited. Although no formal statistical test was applied, the mapped patterns corroborate the management expectation that visitor pathways and terrestrial run-on are primary drivers of debris accumulation—insights that would be difficult to obtain from manual strip surveys or meter-resolution satellite scenes.
4. Results
4.1. Detecting Outcomes
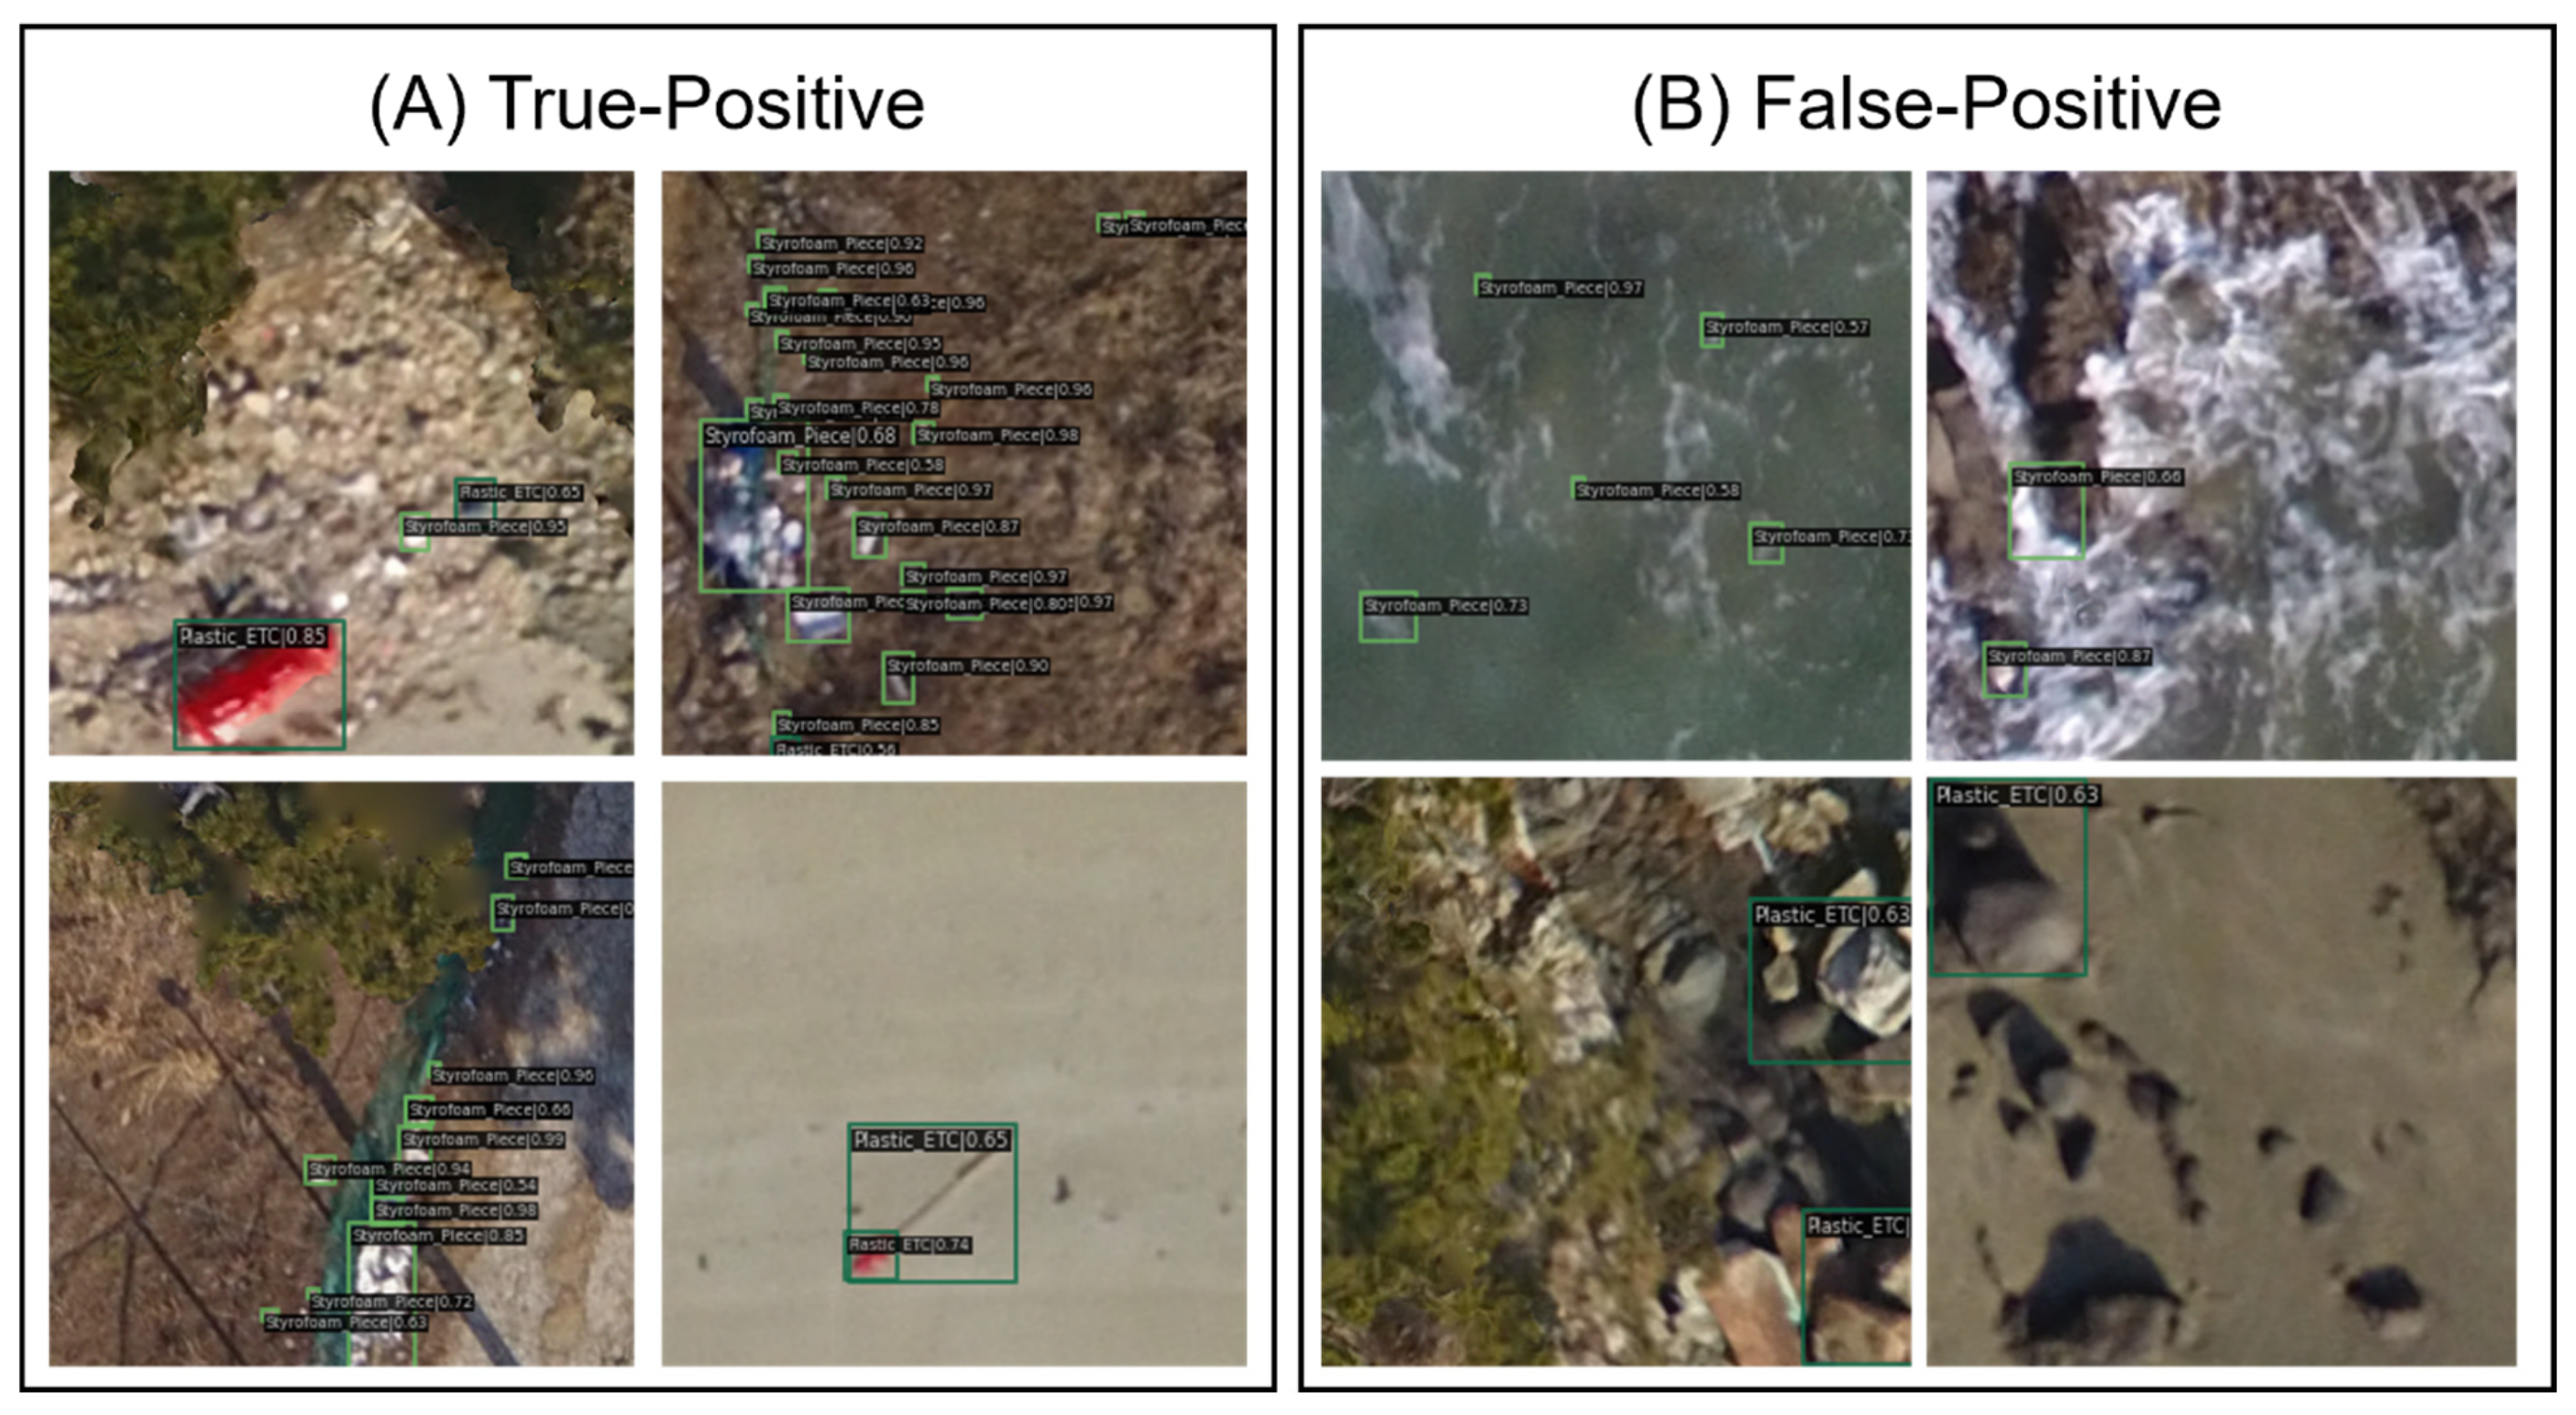
The trained Grid R-CNN successfully identified the vast majority of debris objects in the UAV ortho-mosaics, as illustrated in
Figure 4A (left panel). Most detections are smaller than 100 pixels on the source imagery—corresponding to objects roughly 8–10 cm across at the 0.83 cm GSD—and over 90% were classified as either Styrofoam or plastic fragment, mirroring the class prevalence in the training set. Typical scenes show discrete bounding boxes tightly fitted to individual items scattered across the foreshore, confirming that the grid-based localization module can effectively capture small, high-contrast targets.
The right panel (
Figure 4B) highlights the principal failure mode: wave crests and bright pebbles occasionally mimic the texture and brightness of white debris, leading the network to generate false positives. A qualitative review of all misfires indicated that more than half arose from breaking surf, with most of the remainder caused by sun-lit cobbles or shell hash; other sources of visual clutter—such as foam, kelp, or driftwood—were rare and did not meaningfully affect model performance. Although these errors reduce precision, they are spatially confined to narrow swash zones and therefore do not obscure the broader distribution patterns analyzed in
Section 4.3. Future work could integrate a specialized hard-negative mining stage or employ temporal filtering across tidal states to suppress such context-specific artifacts.
4.2. Quantitative Evaluation Results
Training loss declined rapidly during the first 20 epochs and then stabilized, plateauing at ≈ 0.04 after epoch 60 (
Figure 5). Convergence of both training and validation curves indicates that neither over- nor under-fitting was evident at the 100-epoch endpoint adopted for inference. On the independent test split, the network achieved a mean average precision of
mAP (0.5:0.95) = 74.91%, with class-wise
AP ranging from 69% (bag/film) to 79% (Styrofoam) (
Table 5). Overall precision and recall were 78.04% and 84.68%. The modest gap between recall and precision reflects the false-positive patterns discussed in
Section 4.1; nevertheless, eight of the eleven classes surpassed the 70%
mAP benchmark often cited for operational object-detection tasks. Inference efficiency, meanwhile, meets the throughput demanded by routine monitoring. Running on a single RTX 3060 Ti, the network processed 2.87 images s
−1 (512 × 512 px chips), equivalent to mapping the entire 6 km Wonsan shoreline—at 0.83 cm GSD—in ≈ 0.9 h. Because inference is embarrassingly parallel, distributing tiles across four identical GPUs would shorten wall time to roughly 14 min, making quarterly or even monthly surveys feasible for local authorities without specialized hardware.
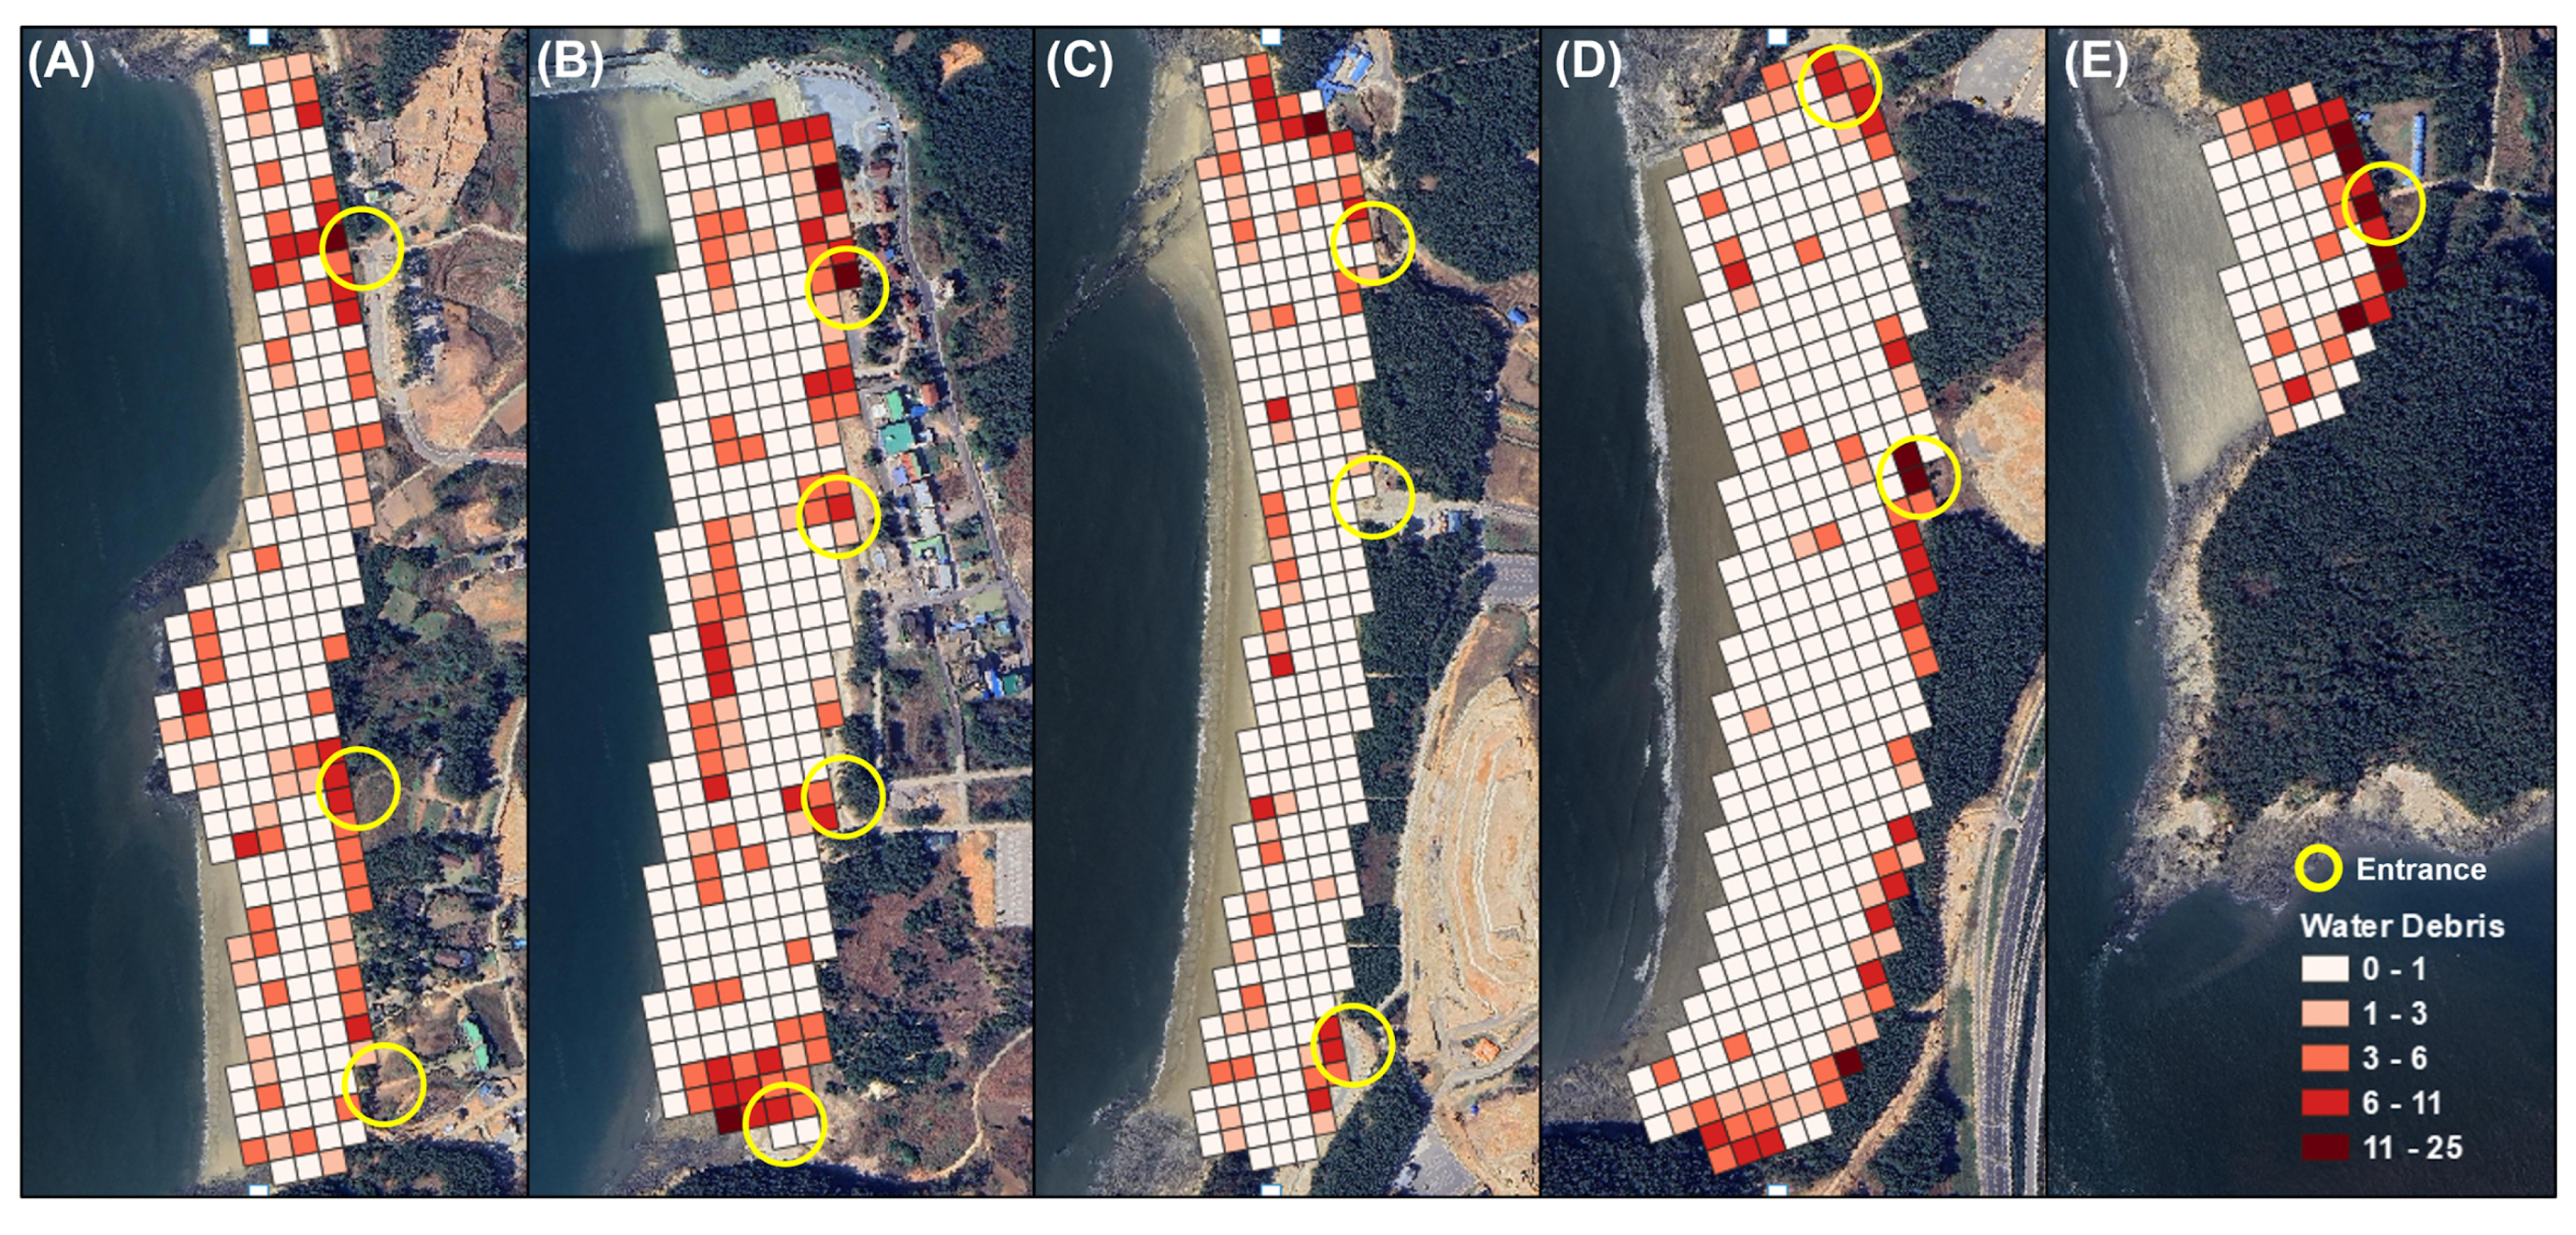
4.3. Georeferencing and Visualization Results
The 25 m grid maps in
Figure 6 reveal a consistent cross-shore gradient: debris density rises sharply toward the terrestrial margin of every beach and peaks in cells abutting entrance ramps or the back-shore vegetation line. Quantitatively, the cell-level summary in
Table 6 shows that 57% of all high-density cells (≥6 pieces 25 m
−2) lie within 100 m of either an entrance or the landward edge, and 86% fall within 200 m. Beyond 200 m, high-density cells account for only 14% of the total, indicating that pedestrian access and terrestrial run-on are dominant drivers of litter accumulation—patterns that confirm the qualitative impressions discussed in
Section 4.1 and underscore the value of centimeter-scale mapping.
Beach-wise totals (
Table 7) reinforce the above interpretation. Jeodu Beach, an area used year-round for sea cucumber and abalone aquaculture, records the highest density of 0.498 pieces 100 m
−2—more than twice the multi-beach mean of 0.221. Obongsan Beach, meanwhile, exhibits the greatest absolute count (439 items) and, together with Sachang, shows debris clusters tightly aligned with entrance paths. By contrast, the central reaches of Wonsando—despite hosting the island’s main commercial strip—display only moderate densities once beyond the first 100 m inland.
Taken together, the fine-grid results demonstrate that centimeter-resolution GeoAI can not only tally debris but also pinpoint micro-sites where cleanup and visitor-management interventions will be most effective. Such detail, difficult to obtain with manual transects or meter-scale satellite scenes, provides actionable intelligence for allocating limited coastal maintenance budgets.
5. Discussion
In 1997, the National Academy of Sciences estimated that approximately 6.4 million tons of marine debris were entering the oceans each year. More recent studies have reported that the annual weight of plastic waste generated by coastal nations worldwide amounts to about 275 million tons with coastal tourist destinations particularly vulnerable to the economic impacts of increasing marine debris, while also contributing significantly to its growth [
18,
19], making precise and effective marine debris management crucial for these areas. With this in mind, the current study explores the potential application of GeoAI for effective marine environment management by developing an automated process that can detect marine debris at the object level using UAV imagery and incorporate the detected debris into an integrated geospatial database to analyze their distribution. This approach is particularly relevant for countries with long coastlines, where regular monitoring is logistically challenging but urgently needed to support sustainable tourism and environmental certification efforts.
Specifically, this research investigates the application of deep-learning object-detection models, particularly Grid R-CNN, in the classification and detection of marine debris on tourist beaches using UAV imagery. It also assesses the processing speed of an automated approach to building an integrated spatial database. The goal is to demonstrate the efficiency and effectiveness of the proposed approach in automating the entire process, from object detection to the generation of high-precision spatial information. The results corroborate the potential of GeoAI technologies in managing marine environments and supporting local governments with the management of tourist beaches. Moreover, the integration of object-level detection with spatial analysis supports a shift from reactive cleanup to proactive, data-driven planning.
Ultimately, the centimeter-scale UAV–GeoAI pipeline yielded a mean average precision of 74.9% while processing 2.87 images s−1—performance that confirms small-object litter can be monitored automatically without the intensive labor and spatial bias inherent in strip transects. Translating this throughput to practice, a single consumer-grade GPU surveyed Wonsan’s 6 km shoreline in <1 h, a cadence well aligned with weekly or post-storm inspections. When detections were summarized in a 25 m grid, 57% of high-density cells occurred within 100 m of an entrance or the landward vegetation line and 86% within 200 m, pinpointing clear intervention zones. Redirecting just one-fifth of current cleanup budgets to these hotspots could trim annual costs by a similar proportion while improving visitor aesthetics—an outcome particularly relevant to beaches seeking eco-certification. This finding suggests a highly actionable insight for municipalities and tourism operators, who could prioritize maintenance efforts in locations where they will have the greatest environmental and economic impact.
Error analysis showed that most false positives cluster in the swash zone, where wave crests and sun-lit pebbles mimic white debris. Although these artifacts lowered precision, their spatial confinement means they do not mask broader distribution trends. Moreover, hard-negative mining or fusing RGB with a short-wave infrared surf mask are promising suppressors. Further improvements may also be achieved by incorporating texture features and contextual cues, which could help the model better distinguish between natural and anthropogenic materials.
Several study boundaries merit caution. First, imagery was captured only in mid-winter over homogeneous sand beaches leaving seasonal litter surges and spectral complexity on gravel or coral coasts untested. Second, validation relied on desk-based consensus annotation rather than in situ tags, potentially introducing centimeter-scale positional bias. Third, the two-stage detector—while accurate—may prove computationally heavy for nationwide roll-outs unless paired with cluster or edge inference. Additionally, the study was conducted on a limited number of sites, which may affect generalizability. Broader regional testing is, therefore, required to adapt the workflow to diverse coastal settings and tourism dynamics.
Future research will therefore (i) repeat flights during the summer tourist peak and on mixed geomorphic settings, (ii) evaluate lightweight one-stage detectors such as YOLOv8 and RT-DETR once a denser, cross-season training set is available, and (iii) explore hyperspectral or fluorescence bands to discriminate plastics from mineral substrates. Formal spatial regression tests linking litter density to foot-traffic proxies and shoreline morphology will also be pursued to complement the descriptive grids reported here. In the longer term, integration with real-time monitoring systems and policy frameworks could enable GeoAI-based decision support tools for marine environment governance at national scales.
6. Conclusions
This study demonstrates that centimeter-resolution GeoAI can both quantify marine debris with survey-grade accuracy and expose micro-scale patterns essential for cost-effective beach management. By automating the full chain from UAV capture to GIS-ready vectors, the workflow converts a labor-intensive manual survey into a repeatable, scalable monitoring solution. The resulting hotspot maps enable local authorities to focus remediation where it matters most—within the first 200 m of beach access points—thereby enhancing environmental stewardship and sustaining tourism revenue.
7. Patents
The authors declare that no patents are pending or issued that derive from the methods, data, or findings presented in this manuscript.
Author Contributions
Conceptualization, J.S. and B.Y.; Methodology, J.S. and B.Y.; Software, J.S.; Validation, J.S. and B.Y.; Formal analysis, J.S.; Investigation, B.Y.; Writing—original draft, J.S.; Writing—review & editing, B.Y.; Visualization, J.S.; Supervision, B.Y. Project administration, B.Y. All authors have read and agreed to the published version of the manuscript.
Funding
This research received no external funding.
Data Availability Statement
The data presented in this study are available on reasonable request from the corresponding author. Because the dataset contains sensitive information, it is not publicly archived; requests will be evaluated individually and released only after an institutional security review.
Conflicts of Interest
The authors declare no conflict of interest.
References
- Deely, J.; Hynes, S.; Cawley, M. Overseas visitor demand for marine and coastal tourism. Mar. Policy 2022, 143, 105176. [Google Scholar] [CrossRef]
- Kurniawan, F.; Adrianto, L.; Bengen, D.G.; Prasetyo, L.B. Vulnerability assessment of small islands to tourism: The case of the Marine Tourism Park of the Gili Matra Islands, Indonesia. Glob. Ecol. Conserv. 2016, 6, 308–326. [Google Scholar] [CrossRef]
- Morgan, R. A novel, user-based rating system for tourist beaches. Tour. Manag. 1999, 20, 393–410. [Google Scholar] [CrossRef]
- Lucrezi, S.; Milanese, M.; Markantonatou, V.; Cerrano, C.; Sarà, A.; Palma, M.; Saayman, M. Scuba-diving tourism systems and sustainability: Perceptions by the scuba-diving industry in two marine-protected areas. Tour. Manag. 2017, 59, 385–403. [Google Scholar] [CrossRef]
- Rangel-Buitrago, N.; Correa, I.D.; Anfuso, G.; Ergin, A.Y.; Williams, A.T. Assessing and managing scenery of the Caribbean coast of Colombia. Tour. Manag. 2013, 35, 41–58. [Google Scholar] [CrossRef]
- Phillips, M.R.; House, C. An evaluation of priorities for beach tourism: Case studies from South Wales, UK. Tour. Manag. 2009, 30, 176–183. [Google Scholar] [CrossRef]
- Topouzelis, K.; Papakonstantinou, A.; Garaba, S.P. Detection of floating plastics from satellite and unmanned aerial systems (Plastic Litter Project 2018). Int. J. Appl. Earth Obs. Geoinf. 2019, 79, 175–183. [Google Scholar] [CrossRef]
- Tran, T.L.C.; Huang, Z.-C.; Tseng, K.-H.; Chou, P.-H. Detection of bottle marine debris using unmanned aerial vehicles and machine learning techniques. Drones 2022, 6, 401. [Google Scholar] [CrossRef]
- Winans, W.R.; Chen, Q.; Qiang, Y.; Franklin, E.C. Large-area automatic detection of shoreline stranded marine debris using deep learning. Int. J. Appl. Earth Obs. Geoinf. 2023, 124, 103515. [Google Scholar] [CrossRef]
- Carr, A. Impact of non-degradable marine debris on the ecology and survival outlook of sea turtles. Mar. Pollut. Bull. 1987, 18, 352–356. [Google Scholar] [CrossRef]
- Walker, W.A.; Coe, J.M. Survey of marine-debris ingestion by odontocete cetaceans. In Proceedings of the Second International Conference on Marine Debris, Honolulu, HI, USA, 2–7 April 1989; pp. 2–7. [Google Scholar]
- Williams, A.T.; Rangel-Buitrago, N.G.; Anfuso, G.; Cervantes, O.; Botero, C.M. Litter impacts on scenery and tourism on the Colombian north Caribbean coast. Tour. Manag. 2016, 55, 209–224. [Google Scholar] [CrossRef]
- Iñiguez, M.E.; Conesa, J.A.; Fullana, A. Marine-debris occurrence and treatment: A review. Renew. Sustain. Energy Rev. 2016, 64, 394–402. [Google Scholar] [CrossRef]
- Andriolo, U.; Gonçalves, G.; Bessa, F.; Sobral, P. Mapping marine litter on coastal dunes with unmanned-aerial systems: A showcase on the Atlantic Coast. Sci. Total Environ. 2020, 736, 139632. [Google Scholar] [CrossRef] [PubMed]
- Lo, H.S.; Wong, L.C.; Kwok, S.H.; Lee, Y.K.; Po, B.H.K.; Wong, C.Y.; Cheung, S.G. Field test of beach-litter assessment by a commercial aerial drone. Mar. Pollut. Bull. 2020, 151, 110823. [Google Scholar] [CrossRef] [PubMed]
- Ser, J.; Yang, B. Quantitative Evaluations of Deep Learning Models for Rapid Building Damage Detection in Disaster Areas. J. Korean Soc. Surv. Geod. Photogramm. Cartogr. 2022, 40, 381–391. [Google Scholar]
- Lin, W.; Li, Y.; Li, X.; Xu, D. The dynamic analysis and evaluation on tourist ecological footprint of city: Take Shanghai as an instance. Sustain. Cities Soc. 2018, 37, 541–549. [Google Scholar] [CrossRef]
- de Araújo, M.C.B.; Costa, M.F. Municipal services on tourist beaches: Costs and benefits of solid-waste collection. J. Coast. Res. 2006, 22, 1070–1075. [Google Scholar] [CrossRef]
- Yang, B.; Madden, M.; Kim, J.; Jordan, T.R. Geospatial analysis of barrier island beach availability to tourists. Tourism Manag. 2012, 33, 840–854. [Google Scholar] [CrossRef]
| Disclaimer/Publisher’s Note: The statements, opinions and data contained in all publications are solely those of the individual author(s) and contributor(s) and not of MDPI and/or the editor(s). MDPI and/or the editor(s) disclaim responsibility for any injury to people or property resulting from any ideas, methods, instructions or products referred to in the content. |
© 2025 by the authors. Licensee MDPI, Basel, Switzerland. This article is an open access article distributed under the terms and conditions of the Creative Commons Attribution (CC BY) license (https://creativecommons.org/licenses/by/4.0/).


