Article

Strategic Planning for Sustainable Urban Park Vitality: Spatiotemporal Typologies and Land Use Implications in Hangzhou’s Gongshu District via Multi-Source Big Data

1
Department of Regional and Urban Planning, Zhejiang University, Hangzhou 310058, China
2
School of Spatial Planning and Design, Hangzhou City University, Hangzhou 310015, China
3
Zhejiang University Urban-Rural Planning & Design Institute Co., Ltd., Hangzhou 310058, China
*
Authors to whom correspondence should be addressed.
Land 2025, 14(7), 1338; https://doi.org/10.3390/land14071338
Submission received: 7 April 2025 / Revised: 20 June 2025 / Accepted: 21 June 2025 / Published: 23 June 2025
(This article belongs to the Special Issue Strategic Planning for Urban Sustainability (Second Edition))

Abstract

Urban park vitality, a key indicator of public space performance, has garnered significant research attention. However, existing studies often neglect the temporal variability in vitality patterns, thus failing to accurately reflect actual park performance and limiting their relevance for strategic urban planning and sustainable resource allocation. This study constructs a “temporal behavior–spatial attributes–park typology” framework using high-precision (50 m) mobile signaling data to capture hourly vitality fluctuations in 59 parks of Hangzhou’s Gongshu District. Using dynamic time-warping-optimized K-means clustering, we identify three vitality types—Morning-Exercise-Dominated, All-Day-Balanced, and Evening-Aggregation-Dominated—revealing distinct weekday/weekend usage rhythms linked to park typology (e.g., community vs. comprehensive parks). Geographical Detector analysis shows that vitality correlates with spatial attributes in time-specific ways; weekend morning vitality is driven by park size and surrounding POI density, while weekday evening vitality depends on interactions between facility density and residential population. These findings highlight how transportation accessibility and commercial amenities shape temporal vitality, informing time-sensitive strategies such as extended evening hours for suburban parks and targeted facility upgrades in residential areas. By bridging vitality patterns with strategic planning demands, the study advances the understanding of how sustainable park management can optimize resource efficiency and enhance public space equity, offering insights for urban green infrastructure planning in other regions.

1. Introduction

In an era of rapid urbanization, strategic planning for urban sustainability faces a critical paradox: while parks are acknowledged as vital for livability and climate resilience [1], their planning often remains fragmented, prioritizing short-term land development profits over long-term community needs. Rigid zoning, disconnected real-estate-driven planning, and insufficient integration of temporal usage dynamics [2] have led to underutilized parks, particularly in peripheral areas, where evening vitality plummets due to poor accessibility and inadequate facilities. This misalignment between strategic spatial allocation and sustainable user demands raises the question: can a strategic, time-sensitive planning approach transform parks into resilient, inclusive anchors of urban sustainability?
In the context of China’s new urbanization, urban park development faces structural contradictions arising from a spatial mismatch between supply and demand [3]. This is manifested in issues such as low utilization efficiency and insufficient spatial vitality in parks due to improper planning, creating significant tensions with the “people-centered” urban development philosophy under the high-quality development agenda. In response to the urgent need for high-quality development, urban green space system planning in China is undergoing a strategic transformation from quantitative expansion to qualitative improvement. To align with population needs, there is an imperative to establish spatial optimization mechanisms based on population behavioral characteristics.
Current planning paradigms typically rely on static metrics (e.g., park area per capita) but overlook temporal vitality patterns [4]—a critical dimension of sustainability that reflects resource efficiency and equity. For instance, community parks dominated by morning exercisers on weekdays indicate underutilization of infrastructure during other hours, while parks’ comprehensive weekend balance suggests untapped potential for multi-functional, sustainable land use. By bridging strategic planning theory [5] with temporal–spatial vitality analysis, this study proposes a new framework for aligning park design with urban sustainability goals, ensuring that parks are not just green spaces but dynamic engines for equitable, resilient cities.
The vitality patterns of park green spaces, defined as the spatial activity volume per unit area per unit time [6], directly reflect human park usage. This metric not only serves as an intuitive indicator of spatial utilization efficiency but also constitutes a key quantitative basis for evaluating urban public space service levels. Using big data, this research explores the temporal rhythms and spatial accessibility patterns of urban park usage. The analysis of relationships between green infrastructure attributes and human activities contributes to more responsive urban design frameworks.
Investigating the relationship between green space characteristics and utilization efficiency is a prerequisite for enhancing recreational performance in urban parks. Existing studies have focused on spatial design features such as the green view ratio [7], vegetation composition [8], and infrastructure provision [9], analyzing their differential impacts on recreational activities to improve usage efficiency. Other research has examined distributional characteristics at the planning scale, including accessibility [10], green area [11], location [12], and morphology [13], exploring their relationships with usage behaviors to establish green space allocation rules at regional and urban levels. However, a common limitation in planning-level studies is their treatment of recreational activities as static or homogenized ideal states, overlooking the temporal and social dimensions that influence spatial vitality. This leads to significant practical constraints due to regional and temporal variations, complicating efforts to uncover the underlying mechanisms linking green space attributes to utilization efficiency.
Recreational behavior observation constitutes the foundational method for landscape designers and professionals to evaluate green space usage. Since Whyte’s [14] seminal study on public space users, observation techniques have evolved significantly, including video recording [15], UAV monitoring [16], and GPS tracking [17]. These methods enable detailed documentation of visitor dynamics, broad-scale green space surveillance, and comprehensive individual activity records, respectively. However, practical implementations of existing studies are constrained by instrumental limitations, preventing long-term and large-scale observations of recreational behaviors. This restricts the assessment of regional green space utilization efficiency over extended time periods.
With the proliferation of mobile signaling data and internet-sourced big data in recent years, studies leveraging location-based service (LBS) datasets have identified correlations between recreational activities and resident behavioral characteristics. These findings have been applied to spatial planning processes such as urban functional zoning [18,19]. This technological advancement enables the exploration of temporal and spatial patterns of green space recreation at urban and regional scales, facilitating systematic and precise evaluations of green space service capacity to inform more accurate and rational green infrastructure planning. Many scholars have utilized aggregated mobile signaling data to investigate the spatiotemporal characteristics of park visits by residents in Chinese megacities [20,21,22], as well as to assess park service areas and utilization efficiency [23,24].
Temporal studies have confirmed that park visitor volume follows periodic patterns at specific time points [20]. For instance, Liu et al. [25] analyzed recreational behaviors in summer street green spaces in Tianjin Binhai New Area and found peak usage between 10:00 and 16:00. Yang [26] observed recreational activities at Hefei Swan Lake Park, examining hourly visitor behaviors from 8:30 to 17:30 and the impact of landscape spaces. Yang et al. [27] used mobile signaling data and surrounding POI/facility datasets for spatial statistical analysis, revealing diurnal differences in park vitality and their structural determinants and indicating a shift toward round-the-clock recreational patterns. Additionally, previous studies have confirmed significant differences in park usage between weekdays and weekends [28,29]. Existing time-dimension research has three key limitations: (1) small sample sizes, typically relying on 1–2 days of representative data [30], with daytime-only analysis and limited focus on instantaneous/average efficiency rather than longitudinal trends; (2) coarse data resolution, as most mobile signaling studies use 250 m/100 m positioning [29]—this study pioneers individual-level analysis using 50 m resolution data, enabling the precise tracking of visitor trajectories and improving analytical accuracy compared with previous coarser datasets—and (3) traditional regression models (e.g., OLS [27,31,32] and GWR [33,34,35]) insufficiently account for spatial heterogeneity.
Classifying parks based on temporal patterns provides a new perspective for studying the relationships between green space attributes and recreational efficiency, particularly in terms of diurnal rhythms [32]. Hourly recreational flows directly reflect the visitation intensity of green spaces, revealing both the temporal variations in daily usage frequency and the concentrated time periods/durations of peak activity. This provides a critical perspective for in-depth analysis of daily recreational patterns among urban park users.
The study addresses three core questions:
  • How do the temporal vitality patterns of urban parks vary across different time periods (weekdays vs. weekends) and park typologies?
  • What are the key spatial attributes and their interactions that drive the spatiotemporal differentiation of park vitality?
  • How can time-sensitive planning strategies be developed to align park design with dynamic user demands and sustainable resource allocation?
This research integrates multi-source big data to construct a “temporal behavior–spatial attribute–vitality typology” framework that transcends traditional static planning theories and finds that vitality differentiation is influenced by the interaction of factors rather than being determined by a single factor. Additionally, the Geodetector model quantifies the dynamic impacts of 14 factors, providing a replicable technical procedure. This study embeds land use theory into park vitality analysis through three dimensions: functional zoning, spatial allocation, and temporal regulation. This data-driven approach overcomes subjective planning limitations, offering evidence-based solutions for green space layout optimization, facility upgrades, and service radius adjustments to achieve spatial alignment between public space supply and resident needs to advance high-quality urban green infrastructure development.

2. Materials and Methods
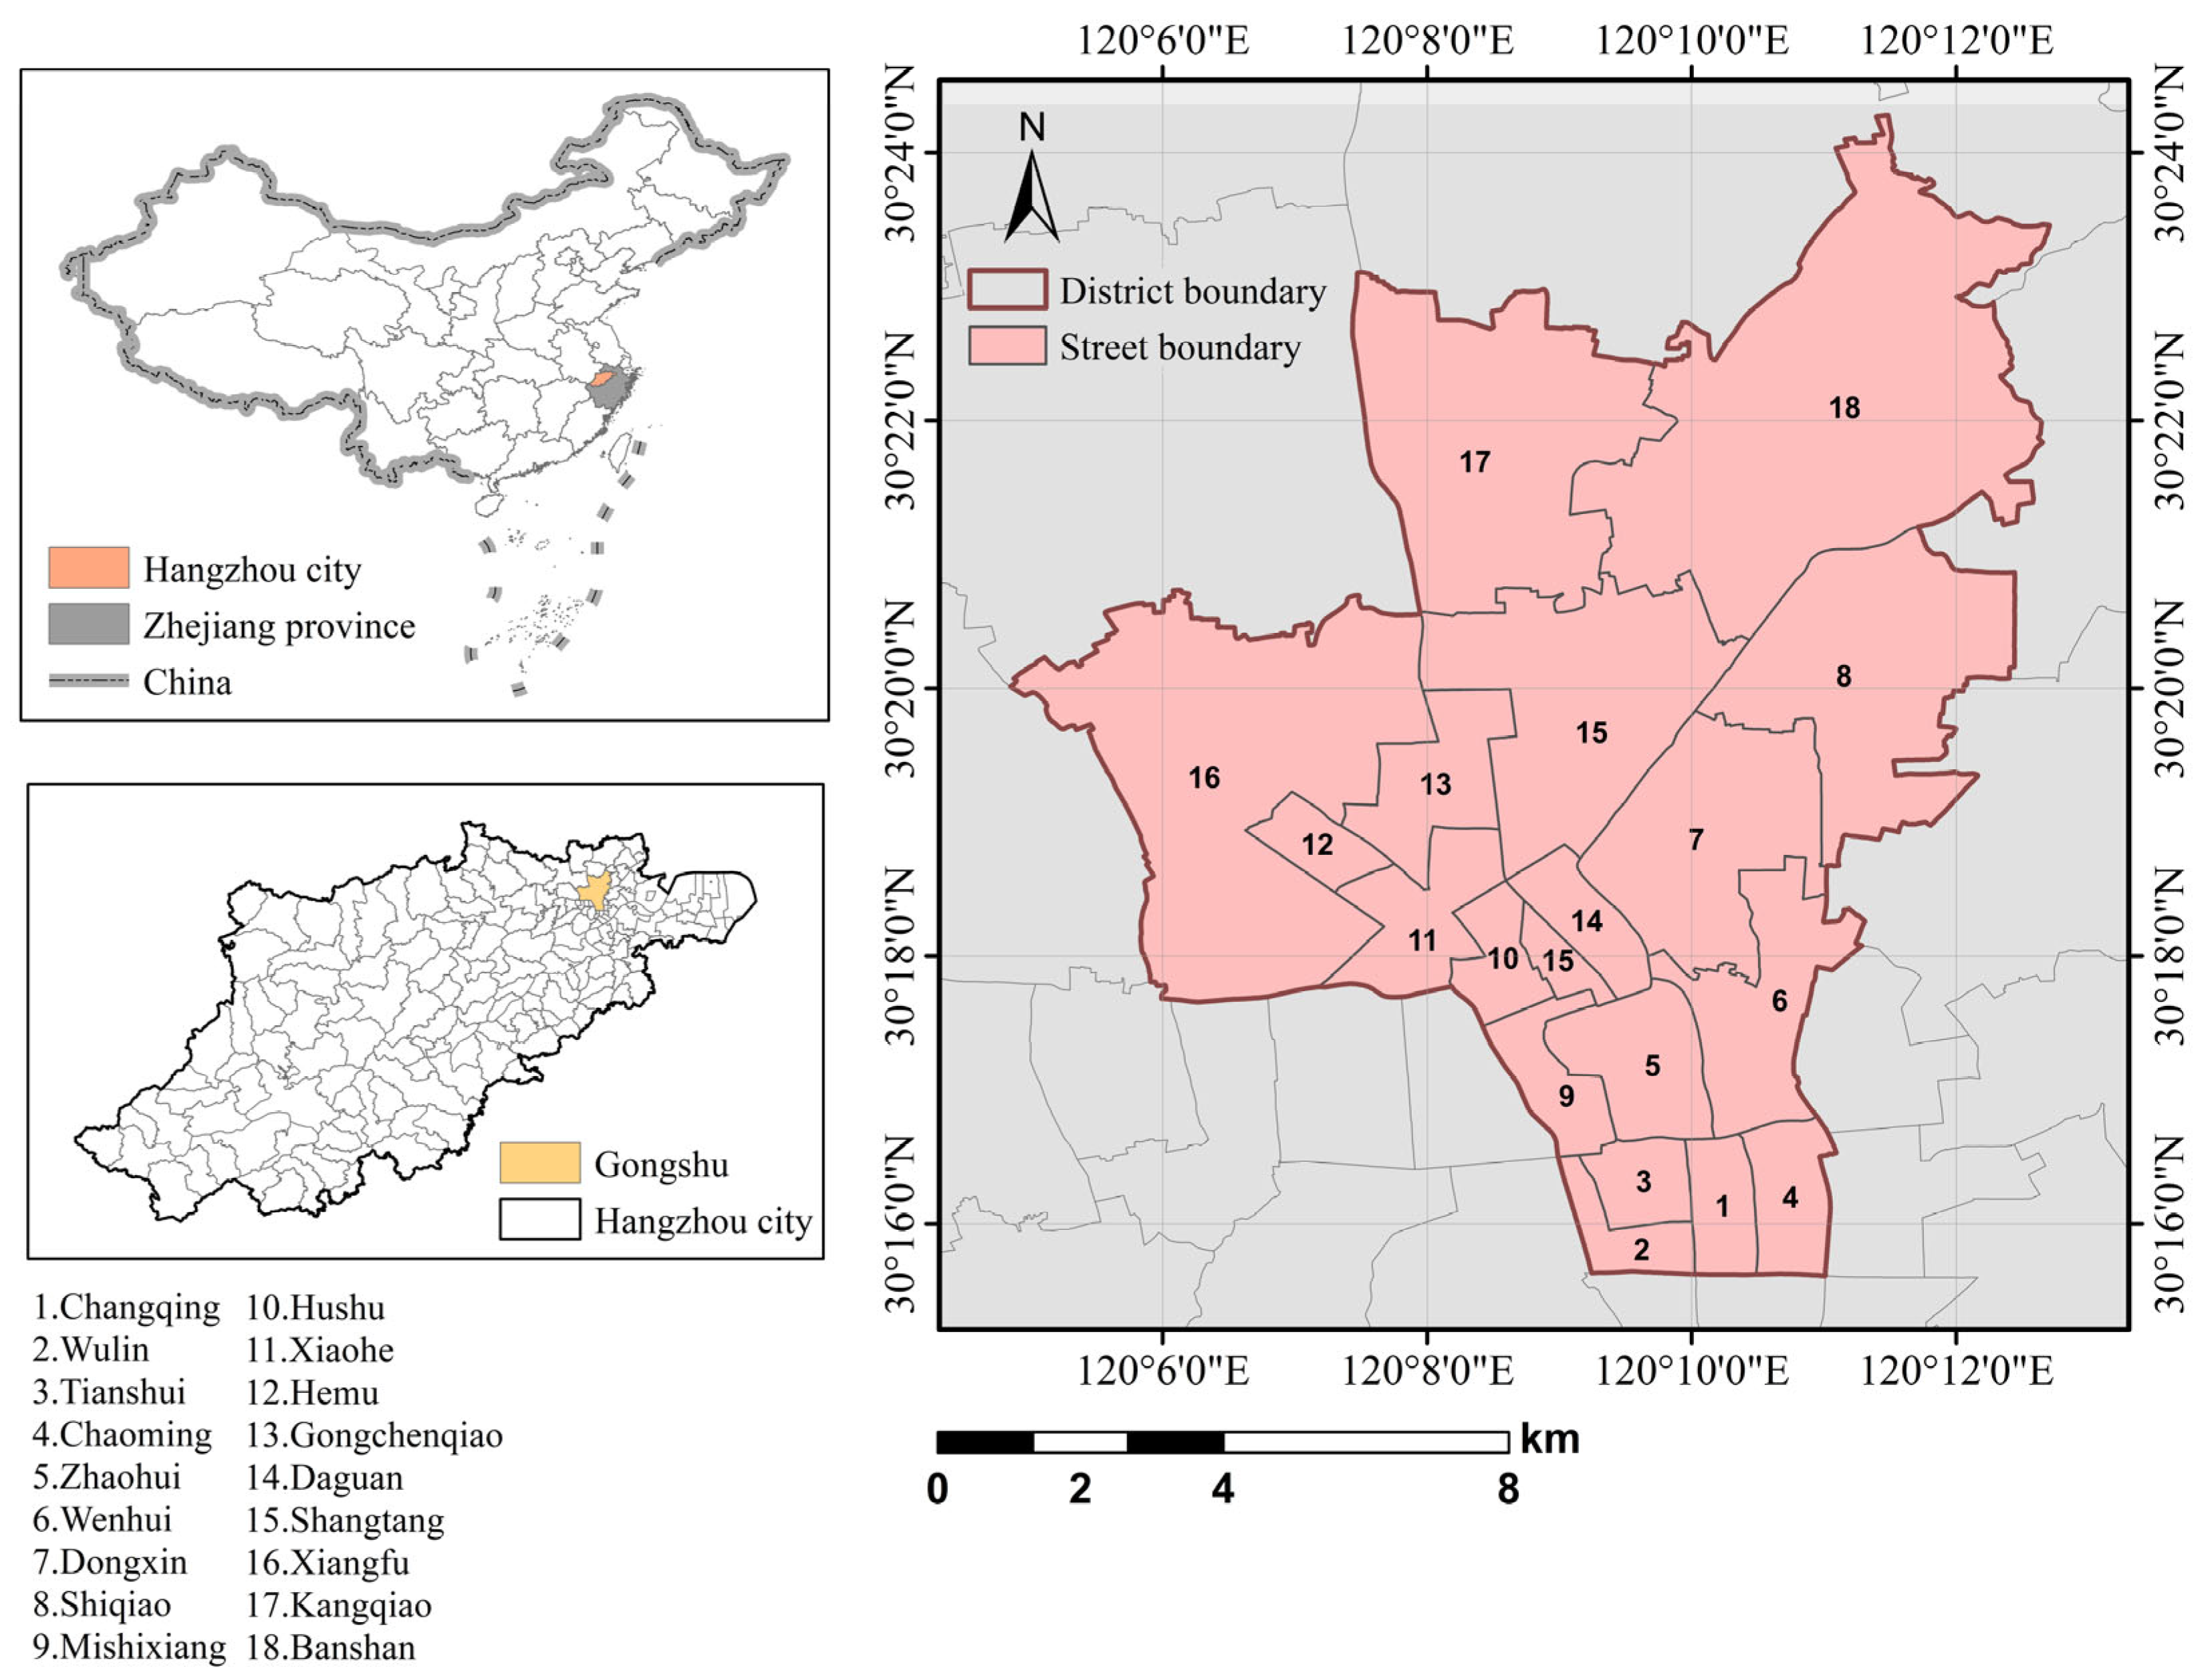
2.1. Study Area

This study selects Gongshu District, one of Hangzhou’s core urban areas (Figure 1), as the research site. Gongshu District, a core component of Hangzhou’s urban fabric, is situated at the confluence of ecological and cultural landscapes: the Banshan National Forest Park to the north, the Grand Canal waterway system, and the iconic West Lake to the south. Spanning 119 km2 with 18 subdistricts, the district supports a population of 1.188 million and a green infrastructure network totaling 2186.89 hectares. Current metrics include a 27.31% green coverage rate and 18 m2 per capita park space. As outlined in the Hangzhou Green Space System Special Plan (2021–2035), Gongshu will play a critical role in achieving city-wide targets of 17 m2 per capita park space, 43% green coverage, and 95% park service radius coverage.
Gongshu District was selected as the research area for urban park green spaces due to its abundant and diverse park resources, including urban parks, wetland parks, and forest parks. With high green coverage rates, Gongshu exhibits complex ecosystems and vegetation types while maintaining a unique blend of historical and modern landscapes, facilitating comparative analysis of green space designs across different periods. Additionally, the district’s advanced urbanization and proactive government initiatives in ecological civilization, including innovative practices such as smart landscape technologies, provide an ideal research environment. Given its strategic location, diverse green infrastructure, and strong policy support, Gongshu District serves as an optimal case study for park green space research. This investigation contributes to a deeper understanding of urban park dynamics and offers transferable insights for green space planning in other cities.
Given the 50 m spatial resolution of mobile signaling data and the assumption of uniform user distribution within Voronoi polygons, accurately matching the boundaries of small parks (less than 3 hectares) with signaling data becomes challenging, particularly in high-density urban environments. This may lead to significant computational errors and hinder the precise identification of actual visitor counts. Considering both data precision and research requirements, this study selected urban parks larger than 3 hectares as research targets, totaling 59 sites. These include 6 comprehensive parks (154.96 ha), 10 special-category parks (635.16 ha), 9 community parks (83.28 ha), and 34 garden parks (204.57 ha). Their spatial distribution is illustrated in Figure 2.

2.2. Multi-Source Data and Processing

The mobile signaling data were provided by China Mobile Zhejiang Company and anonymized to protect user privacy, with a spatial resolution of 50 m grids and hourly temporal accuracy. The park vector data were sourced from the publicly available “Hangzhou Urban Green Space System Plan” issued by the Hangzhou Planning and Natural Resources Bureau.
POI (point of interest) data were collected from AMAP (https://map.gaode.com/, accessed on 12 April 2023), a leading Chinese geographic information platform comparable to Google Maps globally, in 2023 and used after coordinate correction and duplicate removal. Hangzhou Gongshu District POI information was obtained via the AMAP’s Web Service API (https://lbs.amap.com/api/webservice/guide/api-advanced/newpoisearch, accessed on 12 April 2023), which enables programmatic data retrieval. Data were collected in accordance with the platform’s developer guidelines, and no personal privacy information was involved. Structured data retrieval was performed by defining geographic boundaries (Gongshu District, Hangzhou) and POI categories using Python 3.11 scripting. Retrieved attributes included IDs, names, categories, descriptions, coordinates, addresses, longitudes, and latitudes. Data preprocessing included coordinate correction, filtering, duplicate removal, and deletion of incomplete records, resulting in 57,946 valid POI entries for Gongshu District. The average POI density is 25.6 points per hectare. Notably, the number of POIs within a 1200 m buffer zone around parks reaches 32,458, meeting the sample size requirements for statistical analysis (each park corresponds to an average of 550 POI records). Eight primary categories were identified as positively influencing park usage: food and beverage; shopping and consumption; hotels and accommodation; science, education, and culture; lifestyle services; healthcare; leisure and entertainment; and sports and fitness.
Water data were derived by interpreting water area boundaries using 0.5 m resolution remote sensing imagery. Road network data were sourced from the OpenStreetMap open-source map data platform, encompassing some minor roads and internal roads within communities. Population density was calculated using a permanent population identification model based on signaling data and calibrated with the Hangzhou Statistical Yearbook 2022.
To ensure data validity and representativeness, this study collected hourly mobile signaling data from 6:00 to 22:00 across 59 urban parks in the research area over 14 consecutive days from 27 March to 9 April 2023. The time span covered two full weeks with no extreme weather conditions affecting travel. Demographic data for permanent residents utilized the full-year 2022 dataset. According to market penetration surveys by China Mobile Zhejiang Company, their network currently covers over 68% of Zhejiang’s telecommunications market, meeting the requirements for mobile big data analysis. Thus, the selected dataset demonstrates strong representativeness for reflecting real-time park visitation patterns.
The signaling data employed six algorithmic models: permanent resident identification, floating population recognition, fixed-position recognition, travel OD (origin–destination) analysis, commuting pattern identification, and population distribution modeling. The temporal analysis was structured into the following:
  • Leisure time categorization: weekdays vs. weekends;
  • Arrival time intervals: 6:00–8:00, 8:00–12:00, 12:00–16:00, 16:00–18:00, 18:00–20:00, and 20:00–22:00 (six intervals).
The spatial analysis utilized 50 m grids. Statistical metrics, including average stay duration and park occupancy, were derived through aggregation.

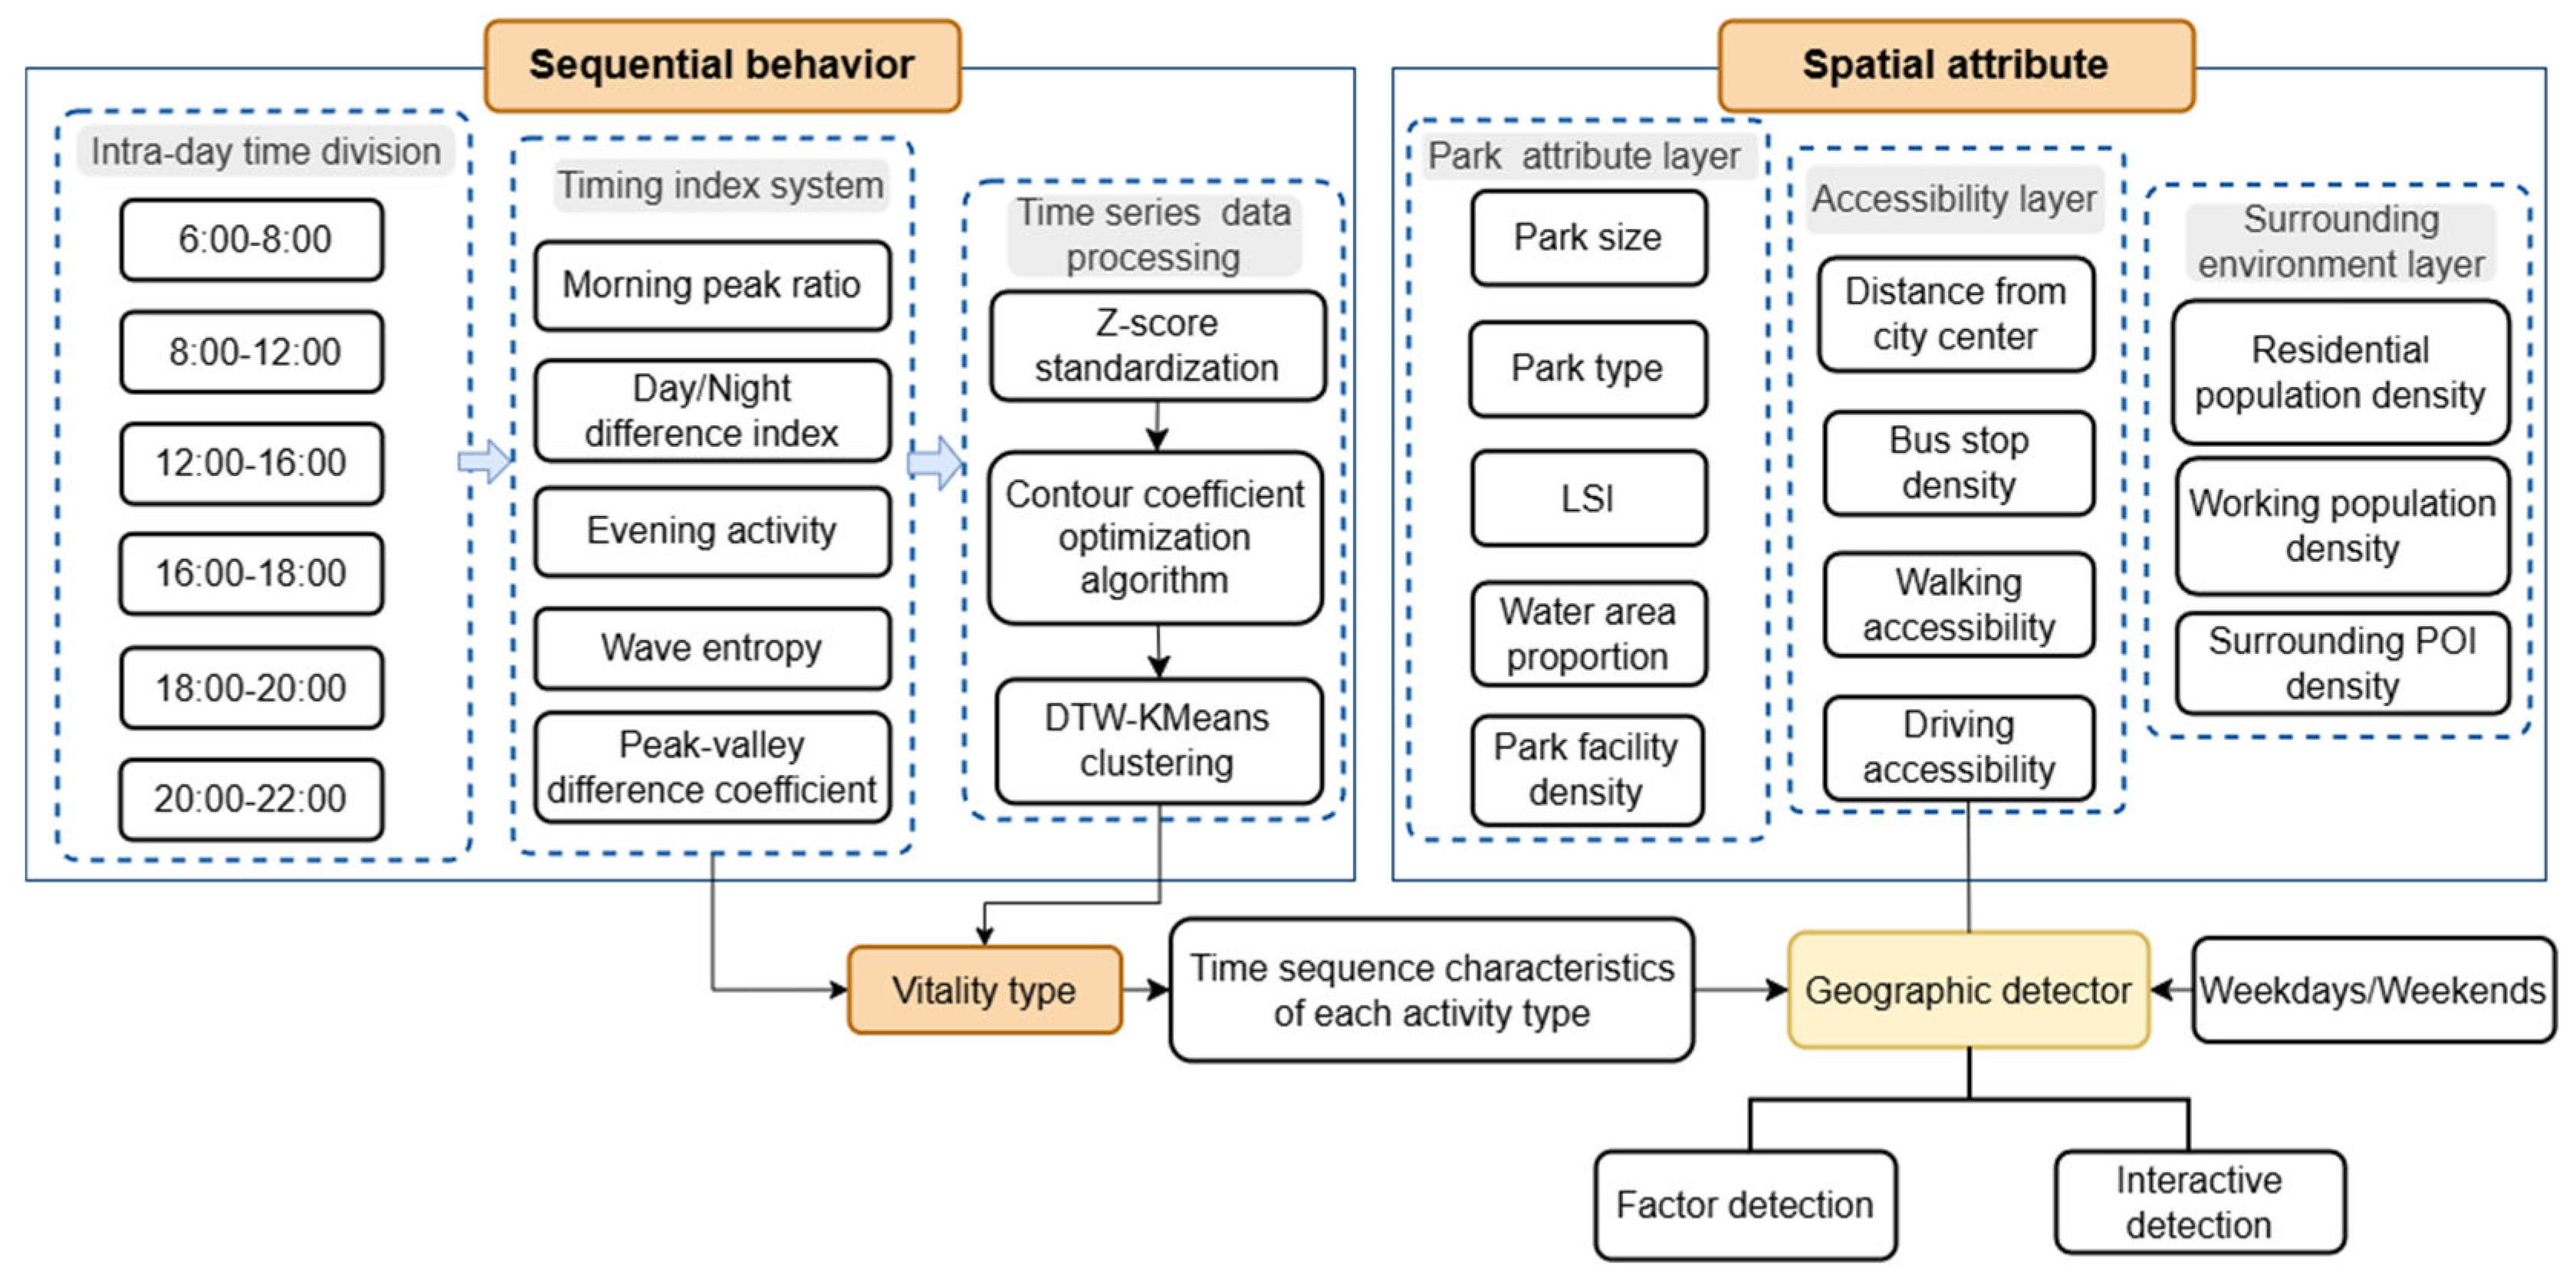
2.3. Integrated Analytical Framework of “Temporal Behavior–Spatial Attributes–Vitality Typologies”

This study constructs a spatiotemporal integration framework for analyzing urban park vitality—”temporal behavior–spatial attributes–vitality typologies”—based on time geography theory [36]. Park vitality is measured using population density, with visitor groups demonstrating temporal consistency in arrival patterns. Addressing the diurnal heterogeneity of park visits and integrating spatiotemporal constraints of urban daily rhythms, the daily cycle is divided into six characteristic periods: early morning (6:00–8:00), morning (8:00–12:00), afternoon (12:00–16:00), evening (16:00–18:00), night (18:00–20:00), and late night (20:00–22:00).
At the temporal feature analysis level, this study transcends traditional frequency-based statistical paradigms by constructing a five-dimensional temporal feature index system: morning peak ratio, day–night difference coefficient, evening activity level, fluctuation entropy, and peak–valley difference coefficient. After normalizing the feature space using Z-score standardization, an improved silhouette coefficient optimization algorithm was employed to determine the optimal cluster number. Dynamic time warping (DTW) distance-optimized K-means clustering (DTW-KMeans) was then implemented to classify the 59 urban parks into distinct temporal behavior spectrum types.
The spatial attribute analysis constructs the following three-tier spatial attribute index system based on park characteristics, accessibility features, and surrounding environmental attributes:
  • Park-specific attributes, including park area, park type, landscape morphology index, water area ratio, and facility density;
  • Accessibility attributes, comprising distance to city center, bus stop density, walking accessibility, and driving accessibility;
  • Surrounding environment attributes, encompassing residential population density, employment density, and density of park-related services/facilities.
Geographical Detector models were applied to separately analyze each temporal feature index, quantifying the influence intensity and interaction effects of spatial attributes on temporal patterns. The methodological flowchart is shown in Figure 3:

2.3.1. Constructing a Temporal Feature Matrix of Recreational Behavior

Daily Visitor Flow Fluctuation Curve Construction: Hourly average visitation volumes were calculated for each time segment according to daily temporal distributions, yielding a 16 h visitor flow fluctuation curve for each park.
Temporal Feature Index Extraction: Based on waveform characteristics, five temporal feature indices were extracted:
  • Morning Peak Ratio ( M m o r ): This quantifies the vitality intensity during the morning commute (6:00–8:00). The higher the ratio, the more concentrated the morning exercise crowd. It is calculated as the ratio of hourly average visitation volume during 6:00–8:00 to the full-day average:
    M m o r = P 6 8 P 6 22 ,
    where P 6 8 is the hourly average visitation volume during 6:00–8:00; P 6 22 is the full-day (6:00–22:00) average visitation volume.
  • Day–Night Difference Coefficient ( M D N ) : This reflects the imbalance between daytime (8:00–16:00) and evening (16:00–22:00) vitality distributions, measured by the ratio of visitation volumes between these periods. A ratio greater than 1 indicates busier daytime activity (e.g., office workers’ lunch breaks), while a ratio less than 1 signifies more active nighttime engagement (e.g., residents taking walks after work). The calculation formula is as follows:
    M D N = P 8 16 P 16 22 ,
    where P 8 16 is the hourly average visitation volume during 8:00–16:00; P 16 22 is hourly average visitation volume during 16:00–22:00.
  • Evening Activity Level ( M e v e ) : This represents the contribution of the 18:00–22:00 vitality as the proportion of total visits during this period relative to the full day. The higher the value, the greater the potential of the park’s night-time economy (e.g., 0.3 indicates that 30% of visitors are active at night). The calculation formula is as follows:
    M e v e = P 18 22 P 6 22 ,
    where P 18 22 is the total visitation volume during 18:00–22:00; P 6 22 is the full-day (6:00–22:00) total visitation volume
  • Fluctuation Entropy ( H ): The fluctuation entropy value is used to evaluate the regularity of human flow fluctuations. A higher entropy value indicates more random visitor distribution, such as being evenly dispersed throughout the day; a lower entropy value signifies stronger periodicity, such as being crowded only during morning and evening peaks. Shannon entropy is used to measure the disorderliness of visitor flow fluctuations, where higher entropy indicates more random vitality distributions. This measures the irregularity of hourly visitation volume distributions and is calculated as the Shannon entropy of hourly visit distributions:
    p i = t i t ,
    H = i = 1 n p i × l o g 2 ( p i ) ,
    where p i is the probability of visitation volume state i; t i is the number of hours in state i; t is the total analyzed hours (16 h, 6:00–22:00).
  • Peak–Valley Difference Coefficient ( P V R ): The peak–valley difference coefficient is used to characterize the disparity between peak and trough human flow volumes, similar to a “tidal phenomenon.” The larger the ratio, the more crowded the peak periods and the emptier the trough periods become. This is the core index for measuring the fluctuation intensity of park population flow. It quantifies the amplitude of daily vitality extremes as the ratio of maximum to minimum hourly average visitation volumes.
    P V R = P m a x V m i n ,
    where P m a x is maximum hourly average visitation volume; V m i n is the non-zero minimum visitation volume. Notably, to avoid infinite values caused by zero visitation during trough periods, this study substitutes V m i n = 3 , the non-zero minimum value observed across all parks during trough periods, for actual zero values in PVR calculations.
This study encompasses 59 urban parks as research objects. Through the synthesis of the five characteristic indicators, a 5 × 59 temporal feature matrix T is established and formulated as follows:
T = M m o r , 1 P V R 1 M m o r , 59 P V R 59 ,
where M m o r , n (n = 1, 2, …, 59) represents the morning peak ratio of each park and P V R n (n = 1, 2, …, 59) denotes the peak–valley difference coefficient. The sequence of parks in the study does not influence the computational outcomes.

2.3.2. DTW-Based K-Means Clustering

To capture dynamic similarities in urban park visitor flow temporal patterns, this study employs Dynamic time warping (DTW) distance-optimized K-means clustering (DTW-KMeans). The DTW-KMeans clustering algorithm serves as a strategic planning tool that identifies several vitality types that inform adaptive land use strategies. Unlike conventional static classifications, this dynamic approach captures hourly demand fluctuations, enabling planners to allocate resources strategically—e.g., prioritizing evening facility upgrades in residential-heavy zones to maximize sustainable service efficiency. Replacing the Euclidean distance with DTW enables better detection of waveform similarities. The silhouette score was used to determine the optimal number of clusters. The implementation steps are as follows:
  • Temporal Data Preprocessing: Daily visitation volume data for 59 parks were standardized using Z-score normalization to eliminate dimensional differences, constructing a standardized temporal matrix X R 59 × 6 .
  • DTW distance replaced the traditional Euclidean distance to elastically align temporal waveforms and resolve interference from phase shifts in similarity measurements. The DTW distance is calculated as follows:
    D D T W ( A , B ) = min π ( i , j ) π ( A i B j ) 2 ,
    where π is the optimal warping path and A and B are two temporal curves.
  • Cluster Number Determination: Cluster quality was evaluated using the silhouette score, with a grid search identifying the optimal cluster number K = 3. The silhouette score is calculated as follows:
    s i = b i a i max a i , b i ,
    where a i is the average intra-cluster distance of sample i, and b i is the average distance to the nearest neighboring cluster.
  • Model Training and Optimization: DTW-KMeans was implemented using Python’s tslearn library with the following parameters: maximum iterations T = 100, convergence threshold ϵ = 1 × 10 4 , and three random initializations to avoid local optima. The algorithm iteratively optimizes cluster centroids C K and sample assignments to minimize the following objective function:
    J = k = 1 K x i C K D D T W ( x i , C K ) ,
  • Result Validation: Intra-cluster compactness was validated through the intra-cluster average DTW distance (<60 visitors/hour) and inter-cluster separation (>220 visitors/hour). Cluster structure significance was confirmed using permutation tests (p < 0.01).

2.3.3. Geographical Detector Model—Indicator Determination and Feature Extraction

This study employs the Geographical Detector model [37] to explore relevant factors influencing the spatiotemporal vitality indices of urban park green spaces. The Geographical Detector can detect spatial heterogeneity in geographical phenomena and identify the significance and correlation of different influencing factors of these phenomena [20]. Its core concept evaluates the degree of influence of specific factors on spatial heterogeneity by comparing sub-regions under different factors with the entire region.
For numerical independent variables, this research uses the natural breaks method to stratify variables into 7 layers (scoring range: 1–7) before conducting statistical analysis with the Geographical Detector. To maintain consistency with this scoring system, park types were assigned values: comprehensive parks (=7), special-category parks (=5), community parks (=3), and garden parks (=1).
A unique advantage of the Geographical Detector is its ability to detect interaction effects between two factors influencing dependent variables. By calculating and comparing single-factor q-values and combined q-values of factor pairs, the model can determine the presence, strength, directionality, and linear or non-linear nature of interactions.
This study employs two components of the Geographical Detector model: differentiation and factor detection and interaction detection. The factor detector quantifies the influence of an independent variable Xn on park utilization Y using the following q-statistic [30]:
q = 1 h = 1 L N h σ h 2 N σ 2 = 1 S S W S S T ,
S S W = h = 1 L N h σ h 2 S S T = N σ 2 ,
where q is the explanatory power of factor Xn on Y; h = {1, 2, 3, … L} represents the categories or strata of the variable; N and Nh are total units in the entire region and stratum h, respectively; σ h 2 and σ2 are the variance of Y in the stratum h and the entire region; SSW is the sum of squared within-group deviations; SST is the total sum of squared deviations. Interpretation: q [ 0 , 1 ] , with higher values indicating stronger influence of Xn on Y.
The interaction detector examines how interactions between factors X1, X2, …, Xk affect urban park utilization. It compares combined q-values of factor pairs to their individual q-values to identify the following: synergistic/antagonistic effects, linear/non-linear relationships, and dominant/recessive factor hierarchies.
In this study, the Geographical Detector model uses cluster-specific typological indices of 59 parks as dependent variables, modeling weekday and weekend typological indices separately to analyze the influence intensity of factors on different vitality types. As defined in Section 2.3.1, the dependent variables include the following: morning peak ratio, evening activity level, and peak–valley difference coefficient. Building on prior research [30,38,39,40], independent variables were selected from three dimensions influencing park visitation behavior (Table 1): park-specific attributes, accessibility features, and surrounding environmental attributes.
  • Park-specific Attributes;
Park-specific attributes include the park area, park type, landscape shape index (LSI), water area ratio, and facility density. Park area, as a fundamental attribute, enables larger parks to provide more recreational amenities and services [41]. According to the Urban Green Space Classification Standard (CJJ/T 85-2017) [42], urban park green spaces are classified into four categories: comprehensive parks, community parks, special-category parks, and garden parks. The landscape shape index (LSI) is a key metric in landscape ecology for quantifying the complexity of patch shapes. It evaluates shape complexity by measuring the relationship between patch perimeter and area [43] and is calculated as follows:
LSI = C i 2 π × S i
where Si is the area of urban park i (hectares); Ci is the perimeter of the urban park i (meters). A higher LSI value indicates a more complex and irregular patch shape, while a lower LSI suggests simpler, more circular or square-like shapes [44]. The LSI is calculated based on park vector boundaries.
Water proportion (WP) is calculated after interpreting the water area boundaries from 0.5 m resolution remote sensing imagery. The water proportion is the ratio of water area to park area, serving as an important indicator for evaluating green space composition and ecological value. This ratio is calculated by dividing the total water area within the park boundary by the park’s total area. It highlights the proportion of water bodies such as lakes, ponds, and streams, which can significantly influence the park’s aesthetic appeal, biodiversity, and recreational opportunities.
Facility density is the ratio of the number of service facilities within the park to the park’s area. Service facilities include playgrounds, themed plazas, leisure corridors, restaurants, shops, restrooms, parking lots, etc.
2.
Accessibility Features
Accessibility features are measured through four dimensions: distance to the city center, bus stop density, walking accessibility, and driving accessibility. According to the Territorial Spatial Master Plan of Hangzhou (2021–2035) and the research on identifying urban centers through the integration of POI (point of interest) and NTL (nighttime light) data [45], Wulin Square serves as the city center of Hangzhou. This study calculates the distance from each park to the urban center. Bus stop density (BSD) is defined as the ratio of the bus stop count to buffer area within the park’s service radius. Following the Urban Green Space Planning Standard (GBT 51346-2019) [46], buffer zones were established as follows: 1200 m for comprehensive/special-category parks, 500 m for community parks, and 300 m for small parks. A total of 649 bus stops within park buffers were collected from AMAP POI data. The bus stop density was calculated by dividing bus stop counts by the buffer area. Walking accessibility represents the area reachable within 15 or 30 min on foot during non-peak weekdays. Using the network analysis tool in ArcGIS, the range of walking accessibility for each park was calculated. Driving accessibility was calculated similarly.
3.
Surrounding Environmental Attributes
The surrounding environmental attributes encompass residential population density (RPD), working population density (WPD), and park-related services/facilities within park buffer zones. RPD and WPD represent the density of residents and workers, respectively, within the park’s service radius buffers, identified using mobile signaling data. Park-related service/facility characteristics are reflected by the density of surrounding points of interest (SPOIs).
Similarly to the BSD, RPD, and WPD calculations, ArcGIS 10.2’s Network Analyst and Spatial Join tools were used to filter POIs within 1200 m, 500 m, or 300 m network distances from park boundaries. The POI density was calculated using buffer zones.

3. Results

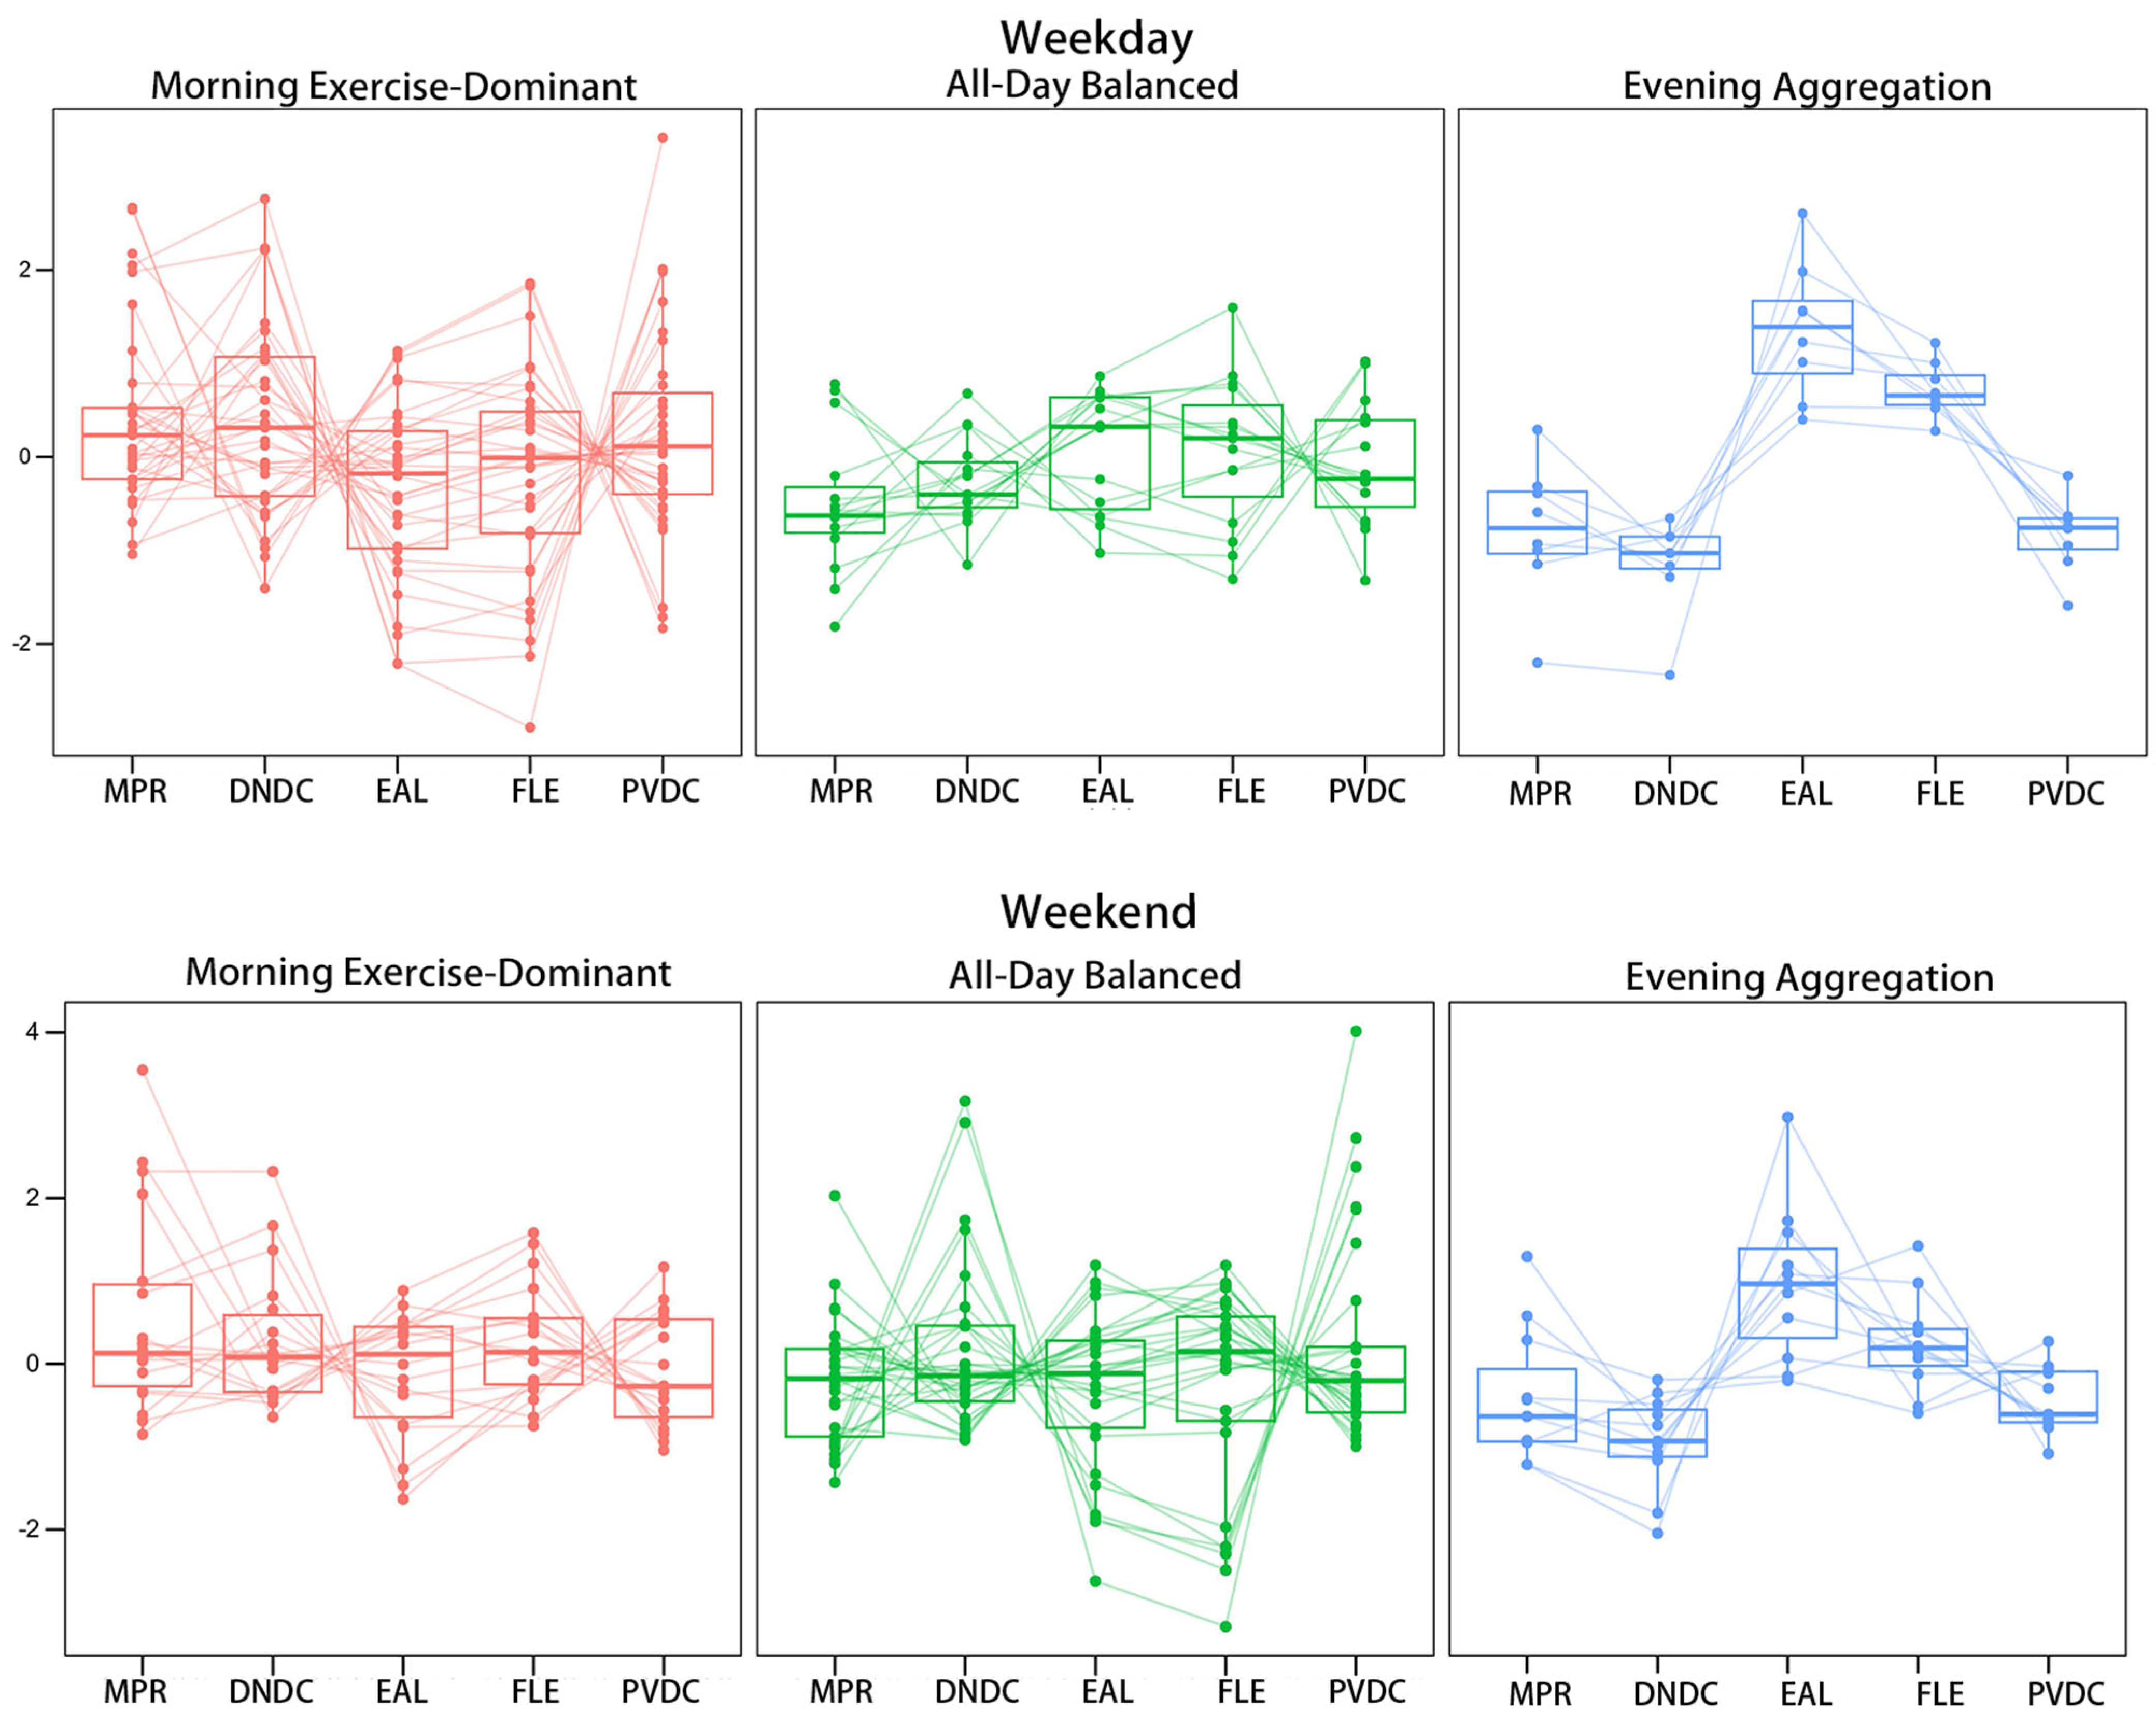
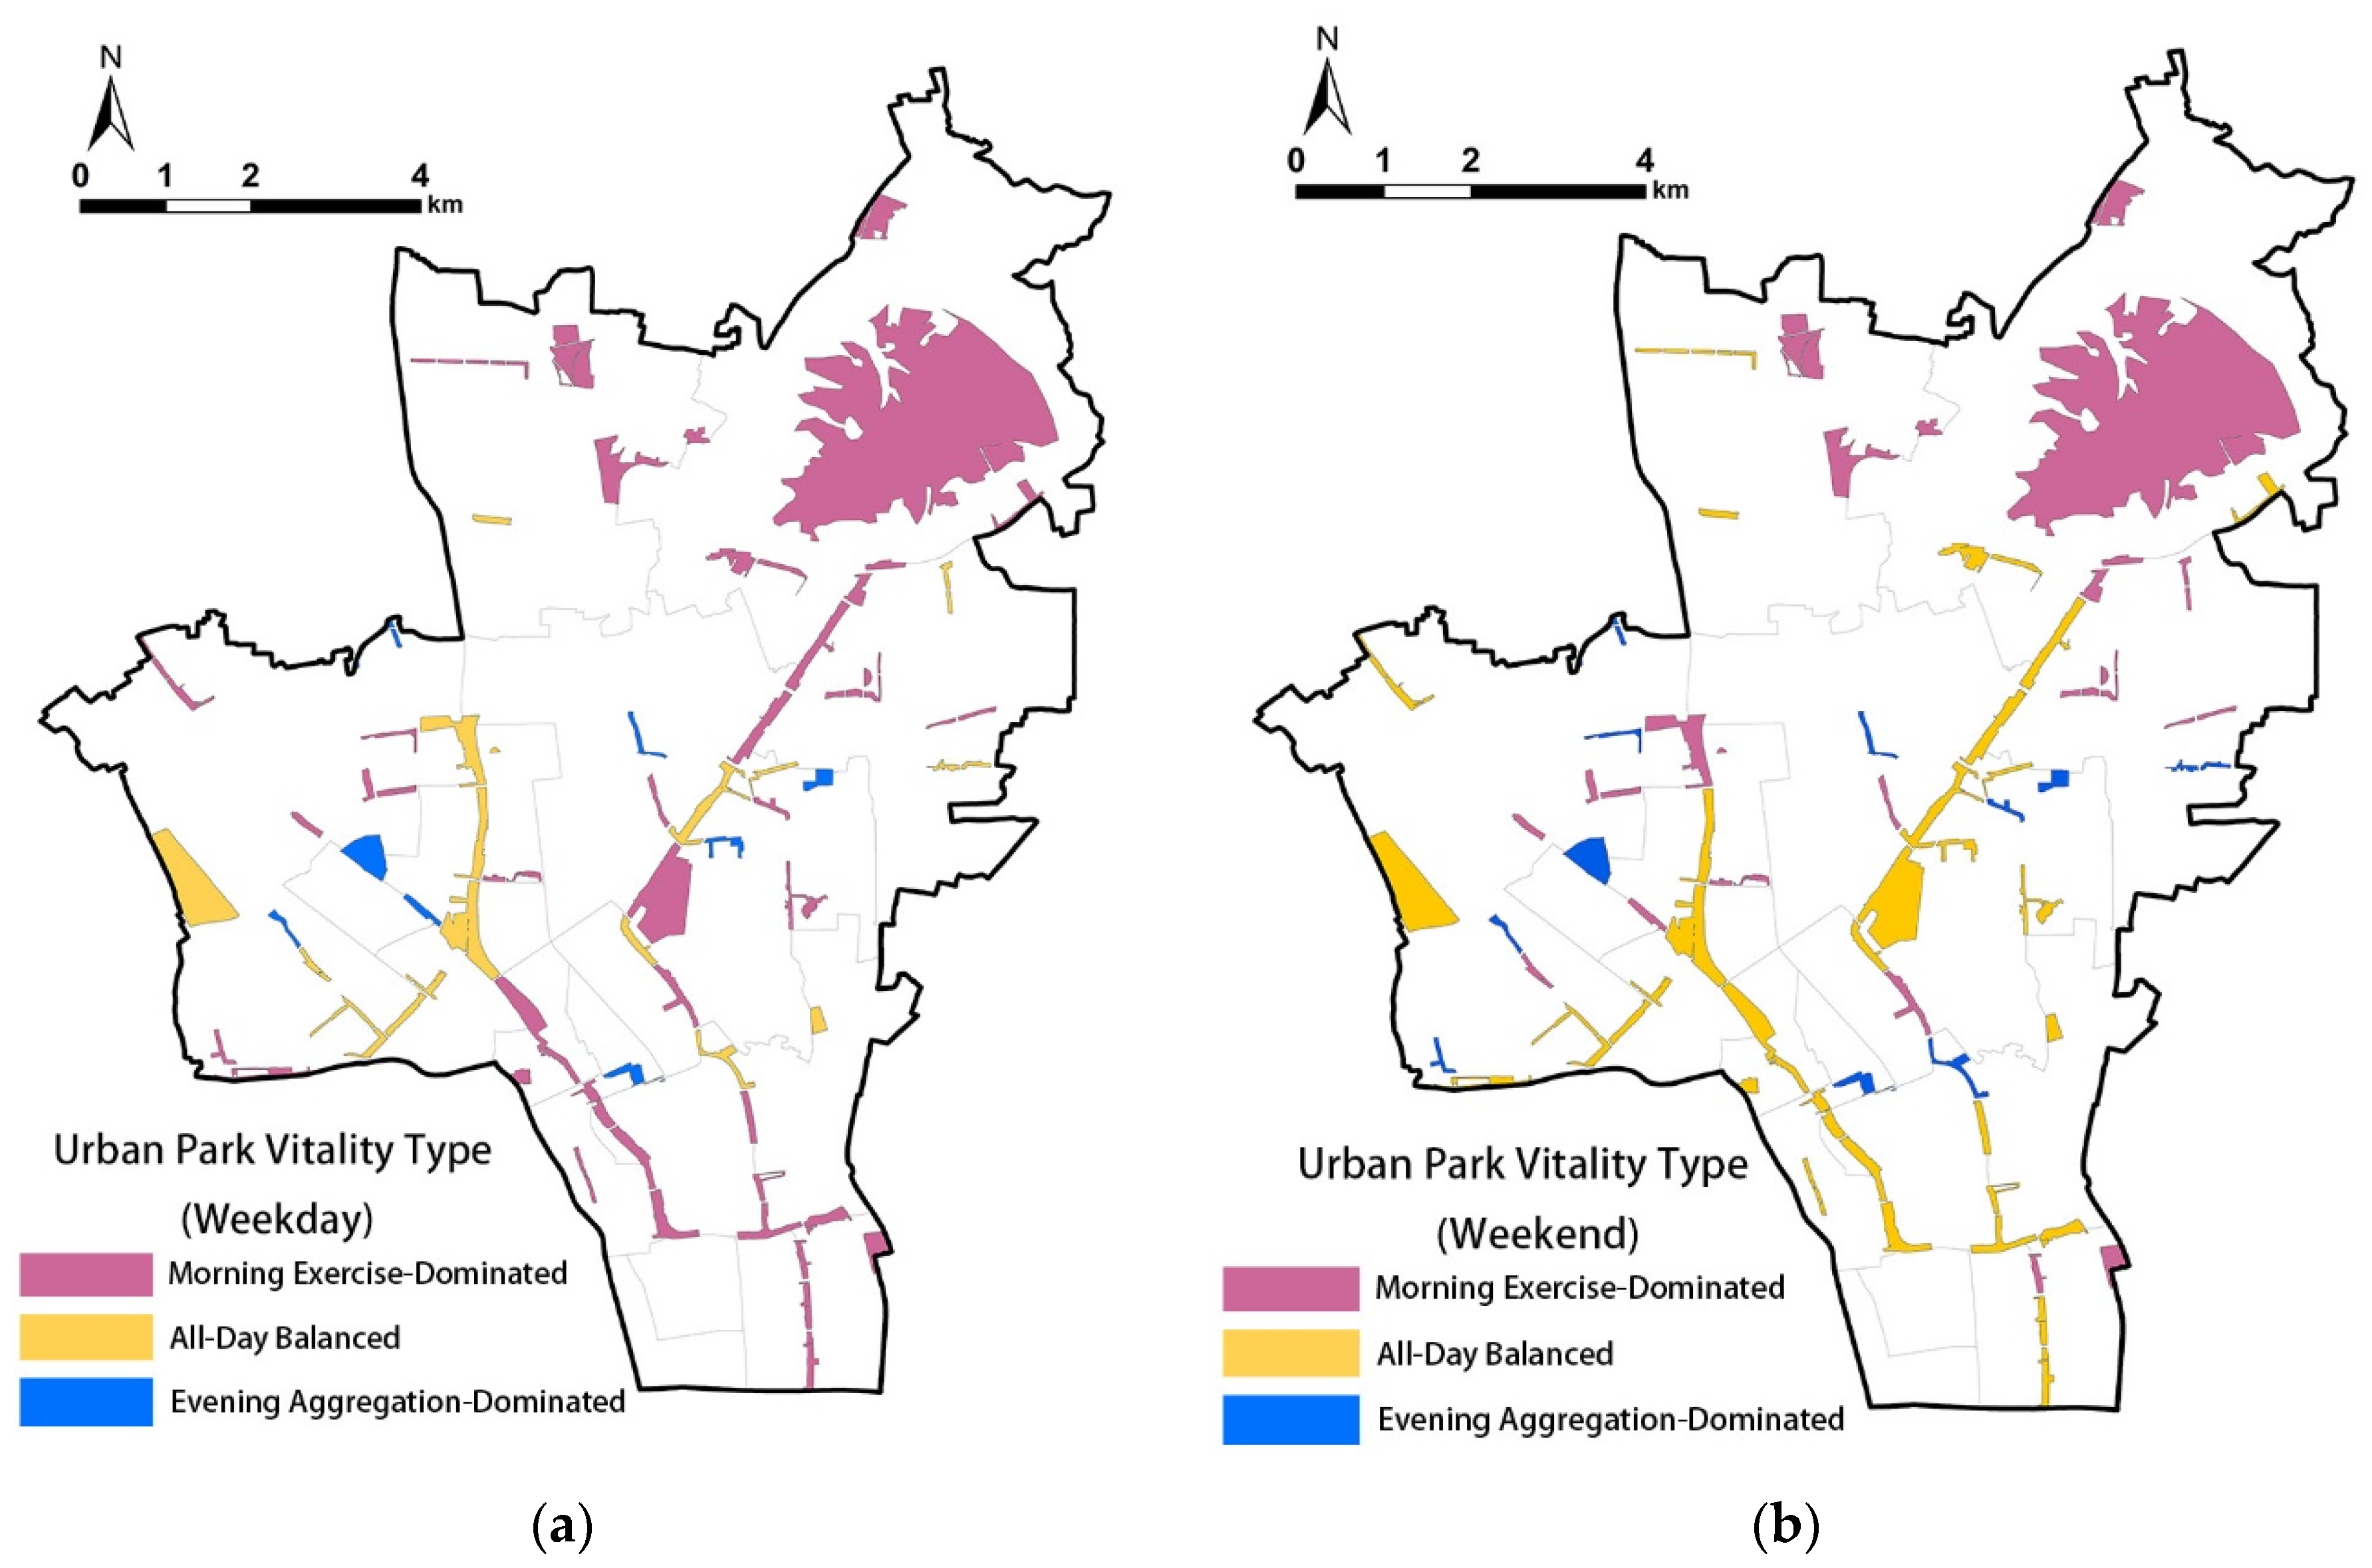
3.1. Urban Park Vitality Typologies

Based on time geography theory [47], the park vitality typology reveals the spatiotemporal consistency of vitality patterns through dynamic time-series similarity clustering. Using a dynamic time warping distance-optimized K-means clustering algorithm and combining the waveform characteristics of cluster centers with field surveys, the 59 urban parks were classified into three vitality types: “Morning-Exercise-Dominant”, “All-Day-Balanced”, and “Evening-Aggregation-Dominated”. The number of clusters was set to three, with a maximum iteration count of T = 100, a convergence threshold of ϵ = 1 × 10⁻⁴, and three random initializations to avoid local optima. The algorithm minimized the objective function by iteratively optimizing cluster centers Ck and sample assignments. Clustering compactness was validated via the average within-class DTW distance (<60 people/hour) and between-class separation (>220 people/hour), while a permutation test (p < 0.01) confirmed the significance of cluster structures.
The temporal characteristic indicators and their thresholds are as follows: The morning peak ratio reflects the intensity of morning exercise demand, with values <0.3 indicating low demand; 0.3–0.5 signifying typical community parks serving both morning exercise and daily leisure; and >0.5 denoting professional morning exercise venues that may require additional morning-oriented facilities. The day–night difference coefficient measures activity balance: <0.8 indicates night-dominated parks, 0.8–1.2 signifies balanced day–night activity, and >1.2 reflects predominantly daytime use. For nighttime vitality, <0.25 indicates low nighttime activity, 0.25–0.35 represents basic nighttime demand, and >0.35 signals high potential for night-time economy development. The fluctuation entropy value evaluates flow regularity: <2.5 indicates strong periodicity (concentrated in specific periods), 2.5–3.2 denotes moderate fluctuation, and >3.2 suggests random all-day distribution (potentially indicating high facility utilization). The peak–valley difference coefficient characterizes crowding disparity: <5 implies stable flow with low facility pressure, 5–10 indicates significant tidal effects, and >10 reflects extreme peak–valley gaps requiring crowd-diversion measures. These thresholds, derived from clustering results of 59 parks and validated through field observations, provide a rapid diagnostic tool for planning decisions to optimize park management and resource allocation.
The three vitality patterns reveal the heterogeneity of crowd behavior, which give rise to differentiated resource pressures. Normalized typological indices are presented in Figure 4, and spatial distributions are mapped in Figure 5. The key findings include: (1) typological characteristics which can be observed in Figure 4: Morning Exercise-Dominated parks exhibit distinct daytime peak clusters characterized by high morning peak ratios; All-Day-Balanced parks (predominantly comprehensive parks) display stable visitation profiles with lower fluctuation entropy values; Evening-Aggregation-Dominated parks (largely special-category parks) experience sharp post-18:00 peaks, with high evening activity levels. (2) Temporal variation: Morning-Exercise-Dominated parks outnumber others on weekdays, while All-Day Balanced parks increase significantly on weekends; community parks and riverside walking trails exhibit strong temporal dependence, with weekday visitation often being dominated by morning exercise (indicating early recreational time allocation) and weekend usage shifting to evening aggregation patterns that reflect leisure-focused visits. Comprehensive/special-category parks such as Xiaohezhi Street Historical Block and Banshan National Forest Park maintain consistent vitality patterns across days, which is attributed to their high popularity and tourism-driven visitation.

3.2. Results of the Geographical Detector Model

3.2.1. Main Influencing Factors on Weekends

Using the Geographical Detector model, this study identified significant determinants of weekend urban park vitality typologies through analysis of 14 influencing factors across three dimensions (Table 2). The results indicate that weekend morning peak ratios are most strongly influenced by park type (e.g., comprehensive parks), park area, 30 min driving accessibility (D-30), and surrounding POI density (SPOI), reflecting family preferences for large, functionally diverse parks with commercial amenities and long-distance accessibility. Evening activity levels correlate significantly with park facility density, 15 min walking accessibility (W-15), and SPOI, as well-equipped parks and high walkability combined with surrounding retail/leisure services extend weekend evening stays. Peak–valley differences are shaped by the distance to the city center, residential population density (RPD), D-30, and SPOI, where dense residential areas exhibit stable visitation while long-distance driving accessibility creates concentrated peak flows.
Interaction detection, as shown in Figure 6, revealed the following synergistic effects among factors: the interactions of SPOIs with park type (q = 0.7485), area (q = 0.7567), and D-30 (q = 0.8221) exerted the strongest influence on morning peaks, driven by consumption–leisure linkages in parks such as Banshan National Forest Park. For evening activity, interactions of SPOIs with facility density (q = 0.763) and W-15 (q = 0.8056) dominated, reflecting night market/retail synergies. The interactions of D-30 with park area (q = 0.806) and SPOIs (q = 0.8156) intensified pulse visits in large parks, exacerbating flow fluctuations. These findings highlight the critical role of comprehensive parks and surrounding amenities in mediating weekend visitation patterns, with implications for park planning and resource allocation.

3.2.2. Main Influencing Factors on Weekdays

Similarly to weekends, weekday park visitation determinants were analyzed using 14 factors across three dimensions.
As shown in Table 3 and Figure 7, the results show that the morning peak ratios on weekdays were significantly influenced by bus stop density, working population density (WPD), 15 min walking accessibility (W-15), and surrounding POI density (SPOI), reflecting commuter activity near transit hubs and office areas where WPD ∩ bus stop density (q = 0.8358) and SPOI ∩ WPD (q = 0.8356) interactions amplified morning peaks through combined transit, commercial, and office influences. W-15 ∩ park type interactions (q = 0.8133) further highlighted the multiplicative effect of pedestrian accessibility on commuter attraction.
Evening activity levels correlated with facility density, residential population density (RPD), 15 min driving accessibility (D-15), and SPOI, with residents favoring well-equipped parks after work despite parking challenges associated with high D-15; RPD ∩ facility density (q = 0.8241) and RPD ∩ SPOI (q = 0.8103) interactions underscored synergistic enhancement of evening vitality through residential density and park/retail amenities.
Peak–valley differences were shaped by park type, distance to the city center, and SPOI, with exclusive functional orientations of park typologies leading to purpose-driven visitation patterns and peripheral parks exhibiting greater flow volatility. SPOI ∩ distance (q = 0.8505) and SPOI ∩ D-30 (q = 0.8264) interactions indicated that parks in peripheral yet commercially dense areas faced concentrated daytime visits dominated by single-function usage, exacerbating diurnal variations. These findings emphasize the need for integrated transit-oriented and amenity-rich strategies to balance weekday park vitality across temporal and spatial dimensions.

3.3. Influencing Factors of Vitality Types in Different Time Periods

By analogizing the results of the factor detector across different time periods (weekends/weekdays), we generated Figure 8. As illustrated in Figure 8, the q-values for three characteristic indices during both weekends and weekdays highlight the dominance of surrounding POIs, and the degree of influence does not differ significantly across different time periods. As shown in Figure 8a, during the morning peak period, the vitality of urban parks is significantly influenced by park type, park area, and 30 min driving accessibility on weekends, while on weekdays, it is more strongly affected by 15 min walking accessibility and surrounding work population density. As shown in Figure 8b, the evening activity index is significantly influenced by park facility density and 15 min walking accessibility. Specifically, when comparing different time periods, they are more strongly affected by 15 min walking accessibility on weekends, while on weekdays, they are more influenced by 15 min driving accessibility and surrounding residential population density. As shown in Figure 8c, the day/night difference index is primarily influenced by distance from the city center, surrounding residential population density, park type, and 30 min driving accessibility. When comparing different time periods, it is notably more affected by surrounding residential population density and 30 min driving accessibility on weekends, while on weekdays, park type has a stronger influence. Notably, the distance from the city center exhibits a strong impact during both weekends and weekdays.
Analysis of influencing factors for characteristic indices of urban park vitality typologies across weekend and weekday periods reveals four key findings: First, surrounding POI density (SPOI) significantly impacts parks of all vitality types across temporal dimensions, making commercial service provisions near parks a primary consideration for future maintenance and management. Second, weekend vitality enhancement strategies should integrate park type, area, and 30 min driving accessibility (D-30) for morning peak optimization, alongside facility density and 15 min walking accessibility (W-15) for evening activity improvement. Additionally, distance to the city center, D-30, and residential population density (RPD) must be addressed to mitigate peak–valley fluctuations. Third, weekday strategies should prioritize transit accessibility (bus stop density, W-15), working population density (WPD), and park typology to align with commuter patterns, while facility density and RPD require attention for evening vitality. Fourth, interacting factors with the highest impacts on characteristic indices across both periods include SPOI ∩ D-30, SPOI ∩ W-15, SPOI ∩ WPD, and SPOI ∩ RPD, which must be incorporated into planning frameworks. These findings provide a data-driven foundation for targeted park management interventions and spatial planning decisions.

4. Discussion

Based on the spatiotemporal differentiation results of the three vitality types and the Geodetector results, this study further explores their theoretical implications and planning insights. The research finds that park vitality is not determined by single resources (such as area or facilities) but depends on “temporal–spatial adaptability”—the precise alignment of service provisions with time-specific demands. This challenges the traditional planning standard of “park allocation based on population size”, calling for an added dimension of “time-period demand forecasting” to enable precise service delivery and avoid resource waste from one-size-fits-all planning.

4.1. Land Use Planning and Sustainability Enhancement Based on Vitality Types

Compared with traditional universal strategies, typological analysis can precisely address the core needs of different parks, achieving deep coordination among maintenance management, planning layout, and collaborative optimization of surrounding elements. The differentiated strategic planning and sustainability enhancement based on vitality types demonstrate that the key to improving park vitality lies in “temporal–spatial adaptability” [48]; Morning-Exercise-Dominated parks need to progress beyond being traditional “daytime-only park” locations, All-Day-Balanced parks require stronger integration with TOD (transit-oriented development) strategies, and Evening-Aggregation-Dominated parks must align closely with residential activity rhythms.
  • “Morning-Exercise-Dominated” parks: Addressing temporal fragmentation to unlock the temporal value of suburban parks.
Parks of this type are mainly suburban natural parks on both weekends and weekdays (e.g., Banshan National Forest Park), and they are characterized by high morning vitality on weekdays/weekends and significant declines during daytime and nighttime. Their core contradiction lies in the neglect of the “time dimension” in planning—a disconnect between “time-period service demands and flexible land supply”. Current maintenance management only meets basic morning needs (e.g., sanitation), failing to tap into the potential value of other periods.
  • Innovative Maintenance Management:
Establishment of a “time-divided maintenance-dynamic opening” mechanism: Anti-slip facilities on fitness trails and direct drinking water supply in the morning should be prioritized; indoor/outdoor spaces such as forest science museums and stargazing platforms should be gradually opened from afternoon to evening, regulating visitor flow through smart reservation systems (reducing nighttime management costs).
  • Planning Strategies:
On weekdays, Morning-Exercise-Dominated parks are mostly community parks and riverside green spaces that are relatively close to the city center and located in high-density residential areas. Field research shows that their facilities primarily include fitness trails and rest pavilions, aligning with the behavioral patterns of middle-aged and elderly groups. The interaction effect of POI density and PFD (park facility density) is stronger on weekdays than on weekends. To further enhance aging-friendly attributes, future improvements could involve adding community medical facilities. “Time-period-flexible indicators” in land use planning should be defined, requiring newly built suburban parks to reserve 20% of land as “nighttime vitality expansion zones” with simultaneous construction of sustainable facilities such as solar streetlights and eco-toilets. One should collaborate with public transportation systems to launch “morning fitness shuttle routes” connecting metro stations and park entrances. This collaborative “time–space–transportation” planning directly responds to the concept of “flexible planning” [49], breaking the vicious cycle of “low accessibility–low utilization” in suburban parks.
  • Synergy with Surrounding Elements:
A “light-asset park night economy” model should be introduced, hosting stargazing, camping, and nature education lectures on weekend evenings. Partner merchants must commit to operating during the hours of 6:00–8:00 AM (e.g., breakfast carts, sports supply stations) in exchange for rental discounts.
2.
“All-Day-Balanced” parks (e.g., Xiaohezhi Street Greenway, Ying’ergang Greenway, and green spaces around West Lake Cultural Square): Reconfiguring urban functional networks to create sustainable vitality hubs.
The cross-time-period balance of All-Day-Balanced parks may result from the diversity of their served populations, including both middle-aged and elderly morning exercisers, weekend parent–child families, and young tourists. As urban core parks, their “all-day high vitality on weekends and secondary peaks at noon/evening on weekdays” reflect strong functional coupling with surrounding commercial, office, and transportation facilities. However, this also exposes the drawback of “functional isolation” in traditional planning—parks lack collaborative management with adjacent businesses when hosting diverse activities.
  • Upgraded Maintenance Management:
Modular stages and smart lockers should be deployed, adopting an “activity reservation–facility sharing” system. Lawns should be reserved for parent–child markets in the morning, converted into open-air concert venues in the afternoon, and transformed into light art exhibition spaces at night. High-efficiency space utilization is achieved through dynamic facilities (e.g., movable seats, temporary stages), reducing repetitive construction costs [50]. One should collaborate with surrounding enterprises on a “noon vitality program”, providing shared office pods and unmanned convenience stores to meet the short-term rest needs of white-collar workers.
  • Planning Strategies:
A “Park + TOD” mixed-use development model should be implemented, prioritizing the layout of such parks within 500 m of metro stations. Surrounding commercial complexes should be required to allocate at least 10% of their area for park-supporting facilities (e.g., coffee kiosks, sports equipment rental points), forming integrated spaces for “recreation–consumption–commuting”. The Geographical Detector analysis shows significant correlations between the temporal characteristic indicators of these parks and surrounding POI density, confirming that functional mixing promotes all-day vitality.
  • Synergy with Surrounding Elements:
Integrated “Rail + Park” corridors should be constructed along the Grand Canal, connecting commercial complexes and community service centers via permeable asphalt pathways for seamless linkage. A “park–commercial district–community tripartite governance mechanism” should be established, channeling 5% of commercial advertising revenue into park maintenance funds. Park footfall data should be used to guide staggered parking fees in surrounding lots (e.g., free parking for 1 h on weekend mornings), integrating parking, retail, and park entrances. This increases weekend park-and-ride rates, alleviates traffic pressure in central areas, and creates a virtuous cycle of “popularity accumulation–commercial feedback–sustainable operation”.
3.
“Evening-Aggregation-Dominated” parks (e.g., Mishixiang Cultural Square): Precisely responding to residential needs to build inclusive vitality units.
The “high weekday evening vitality and low weekend daytime vitality” of these parks reveals that residents’ post-work social and fitness needs are not fully addressed by traditional planning standards (the current Urban Residential Area Planning and Design Standard only specifies per capita park area without distinguishing time-period demands).
  • Innovative Maintenance Management:
The strong correlation between evening vitality and commercial POIs (on weekends, SPOI q = 0.7693; on weekdays, SPOI q = 0.6281) indicates that young office workers and families are the main users. Such groups prefer composite spaces of “park + convenience store + parent–child facilities”. It is recommended to add smart food pickup lockers and temporary child care areas to the facility configuration. Meanwhile, an “evening vitality special program” can be implemented. Operating hours should be extended to 22:00, and security facilities should be added; the installation of high-demand evening facilities such as soundproof enclosures for square dancing and glow-in-the-dark children’s play areas should be prioritized based on resident voting results, collecting real-time usage feedback via WeChat mini-programs to dynamically adjust layouts. A “park steward” system should be established, with community volunteers responsible for nighttime order maintenance.
  • Planning Strategies:
An “evening vitality correction coefficient” should be introduced in regulatory planning, requiring supporting parks in residential areas with a population density of >15,000 people/km2 to increase service facility density by 30% above standard values and reserve indoor activity spaces. Studies show that facility density has a significant impact on evening vitality (p < 0.01), confirming the importance of targeted facility allocation.
  • Synergy with Surrounding Elements:
One should collaborate with community committees to develop “park night economy” projects [51], introducing low-energy activities such as intangible cultural heritage handicraft markets and outdoor movies. A portion of stall revenues should be allocated to subsidize park lighting costs, creating a sustainable cycle of “resident use–community management–commercial empowerment” while enhancing community identity through nighttime activities. Convenience service stations (e.g., automatic water vending machines, shared umbrellas) should be embedded in the facades of surrounding buildings, and underground spaces should be developed into community gyms, improving land use efficiency.

4.2. Implications and Innovations

As a core city in the Yangtze River Delta, Hangzhou’s urbanization stage is similar to that of most first- and second-tier cities in China, particularly in terms of high-density built environments, accelerating aging population, and the separation of work and residence, making it representative in these aspects. The vitality characteristics and influencing factors identified in this study have also been validated in other cities such as Shanghai [7], Guangzhou [35], and Fuzhou [30]. Regarding regional specificity, Hangzhou’s “Park City” construction policy may enhance the spatiotemporal equilibrium of vitality, while cities lacking policy guidance may exhibit more pronounced temporal differences. The spatiotemporal coupling mechanisms discovered in this study hold reference value for rapidly urbanizing areas in China. For example, high-density cities such as Guangzhou and Wuhan can draw lessons from the community linkage strategies of ‘evening gathering-type’ parks, while leisure-oriented cities such as Chengdu and Xi’an can optimize the commercial supporting facilities of comprehensive parks. However, less developed regions should pay attention to the fundamental role of transportation accessibility and avoid blindly copying the eastern model.
Chinese urban parks face a conflict between “standardized management and diversified needs,” as fee-based parks generally close earlier than the peak of residents’ evening activities, resulting in loss of facility utilization. In the future, it is necessary to promote “one district, one policy” management—for example, allowing early opening of morning exercise areas in aging communities and piloting night-time opening in zones with concentrated young populations.
The innovative value of this study goes beyond the Hangzhou case, bringing three key advancements to the international urban planning field.
Theoretically, it reveals for the first time that park vitality emerges from the dynamic interaction of time-based needs, spatial features, and social groups—a relationship that should be central to planning. Methodologically, integrating 50 m resolution signaling data with the DTW algorithm creates a practical framework for improving the accuracy of micro-scale vitality assessments in cities. In practice, time-adaptive approaches (such as designing flexible spaces for evening activity) can help developing countries make the most of limited green spaces while aiding developed nations in upgrading public areas for aging communities.
These findings enrich our understanding of sustainable cities and communities (SDG 11) and drive a shift in public space research—moving from a focus on supply-driven design to one that actively responds to people’s behaviors and needs.

4.3. Limitations and Future Work

This study acknowledges four primary limitations: first, excluding park visits with a dwell time of <30 min may underestimate visitor scale. The main consideration was that due to the acquisition accuracy of mobile phone signaling data, short visits may reflect non-substantive stays, such as passing by in a car or making purchases at a convenience store. It is possible to overlook park utilization behaviors with short stays but of great significance, such as short-term running activities and short-term rest. Future research can refine the behavioral definition of short-term visits by incorporating GPS trajectories or user surveys. Second, population composition analysis focuses solely on residential/working demographics, lacking subdivided visitor characteristics (gender, age, and income). Future research can build a finer population-space interaction model through multi-source data fusion, such as signaling age tags + street view image analysis. It is also possible to incorporate questionnaire surveys or anonymous user profile data to explore the preference differences of different groups for park vitality types. Third, the factor selection relies on a literature review and qualitative methods, potentially missing unknown determinants due to knowledge gaps. Fourth, the data collection included a midweek light rain Qingming Festival day that was treated as a weekday. The treatment of the Qingming Festival as a working day has a twofold impact on this study. On the positive side, the park vitality pattern on a single-day rest day on Wednesday is highly similar to that of a regular working day. Incorporating it into the working day analysis can enhance the recognition accuracy of the normal vitality pattern and avoid the interference of a single-day holiday on the model’s stability. However, this treatment also has limitations: first, it ignores the boost in vitality during local time periods (such as 7–9 am) due to the unique “short-time spring outing” activities on the Qingming Festival; second, it fails to capture the all-day peak of park usage that may be triggered by a “consecutive Qingming Festival” (such as when it falls on Friday or Monday). Future research can combine hourly pedestrian flow data with festival type classification (single-day rest in the middle of the week/consecutive rest) to construct a more refined dynamic park vitality model, especially paying attention to the interaction between traditional festivals and natural landscapes (such as flower seasons), in order to improve the fine management strategy of urban open spaces. Building on this temporal granularity and festival categorization, a more comprehensive approach would involve constructing a multi-level time dimension of “weekdays—weekends—holidays”. This framework enables a systematic analysis of how holiday effects drive transformations in park vitality types. For instance, during the Spring Festival, family reunion activities typically elevate the social vitality of community parks, while the National Day holiday often stimulates a surge in ecological tourism vitality within natural scenic area parks. By integrating these dynamics, future studies can significantly enhance the social explanatory power of research conclusions and offer more precise guidance for optimizing park functions and spatial layouts based on population needs and temporal characteristics.

5. Conclusions

The three vitality types identified through DTW-KMeans clustering highlight spatiotemporal resource imbalances in urban park systems: morning-dominated parks experience low evening usage, while night-aggregating parks underutilize facilities during the day (as detailed in Figure 4). This temporal inefficiency underscores shortcomings in standardized planning approaches. Notably, Geodetector analysis shows that surrounding POI density (q = 0.47–0.77) influences vitality 2–5 times more strongly than traditional area metrics (q = 0.15–0.38), proving that spatial inequalities amplify service exclusion through temporal compounding.
The “temporal behavior–spatial attribute–vitality typology” framework advances park planning by replacing static indicators with dynamic demand-based models. Incorporating vitality typologies into land use and transportation strategies can shift urban development from expansion-focused to efficiency-driven, fostering sustainable symbiosis between cities, parks, and communities. Based on mobile signaling data, the methodology offers adaptable models for data-informed park management and siting, particularly supporting urban park planning in high-density cities and global urban regeneration efforts.
By analyzing how park vitality arises from the strategic alignment of time, space, and human behavior, this study redirects sustainability planning; integrating hourly usage data enables parks to adapt to evolving community needs while reducing resource waste. For high-density urban areas, this approach provides a blueprint to transform green spaces into resilient, inclusive assets through temporal responsiveness and multi-factor optimization.

Author Contributions

G.L.: conceptualization, data curation, formal analysis, methodology, software, validation, writing—original draft, and writing—review and editing. Q.C.: resources, writing—review and editing, and funding acquisition. W.C.: data curation, funding acquisition, investigation, and resources. All authors have read and agreed to the published version of the manuscript.

Funding

This research was funded by the Joint Research Fund between Hangzhou City University and Zhejiang University Urban-Rural Planning & Design Institute Co., Ltd. (S24-214000-009).

Data Availability Statement

Data will be made available on request.

Acknowledgments

Thanks to all the reviewers and editors.

Conflicts of Interest

Weifeng Chen was employed by the Zhejiang University Urban-Rural Planning & Design Institute Co., Ltd. The remaining authors declare that the research was conducted in the absence of any commercial or financial relationships that could be construed as a potential conflict of interest.

References

  1. UN-Habitat—A Better Urban Future|UN-Habitat. Available online: https://unhabitat.org/ (accessed on 14 April 2025).
  2. Healey, P. Urban Complexity and Spatial Strategies: Towards a Relational Planning for Our Times; Routledge: London, UK, 2006; ISBN 978-0-203-09941-4. [Google Scholar]
  3. Chen, J.; Liu, B.; Li, S.; Jiang, B.; Wang, X.; Lu, W.; Hu, Y.; Wen, T.; Feng, Y. Actual Supply-Demand of the Urban Green Space in a Populous and Highly Developed City: Evidence Based on Mobile Signal Data in Guangzhou. Ecol. Indic. 2024, 169, 112839. [Google Scholar] [CrossRef]
  4. Haselsteiner, E.; Smetschka, B.; Remesch, A.; Gaube, V. Time-Use Patterns and Sustainable Urban Form: A Case Study to Explore Potential Links. Sustainability 2015, 7, 8022–8050. [Google Scholar] [CrossRef]
  5. Healey, P. (Ed.) Making Strategic Spatial Plans; Routledge: London, UK, 2006; ISBN 978-0-203-45150-2. [Google Scholar]
  6. Zhang, J.; Yu, Z.; Cheng, Y.; Chen, C.; Wan, Y.; Zhao, B.; Vejre, H. Evaluating the Disparities in Urban Green Space Provision in Communities with Diverse Built Environments: The Case of a Rapidly Urbanizing Chinese City. Build. Environ. 2020, 183, 107170. [Google Scholar] [CrossRef]
  7. Shao, Y.; Lu, H. Research on recreation rules and spatial correlation of community parks based on multi-source data: A case study of Shanghai. Landsc. Archit. 2024, 31, 32–40. [Google Scholar] [CrossRef]
  8. de Jalon, S.G.; Chiabai, A.; Quiroga, S.; Suarez, C.; Scasny, M.; Maca, V.; Zverinova, I.; Marques, S.; Craveiro, D.; Taylor, T. The Influence of Urban Greenspaces on People’s Physical Activity: A Population-Based Study in Spain. Landsc. Urban Plan. 2021, 215, 104229. [Google Scholar] [CrossRef]
  9. Zhang, L.; Yang, S. A preliminary study on the behavior characteristics of residents’ activities and the correlation of spatial layout in community public space: A case study of Suzhou Park Neighborhood Center. Huazhong Archit. 2018, 36, 82–86. [Google Scholar] [CrossRef]
  10. Ekkel, E.D.; de Vries, S. Nearby Green Space and Human Health: Evaluating Accessibility Metrics. Landsc. Urban Plan. 2017, 157, 214–220. [Google Scholar] [CrossRef]
  11. Chen, Y. Factors influencing the activity volume of urban community public space. J. Shenzhen Univ. Sci. Eng. 2016, 33, 180–187. [Google Scholar]
  12. Tong, Z. The Study of Quantification Method on Urban Greenspace Configuration. Ph.D. Thesis, Nanjing University, Nanjing, China, 2011. [Google Scholar]
  13. Kimpton, A. A Spatial Analytic Approach for Classifying Greenspace and Comparing Greenspace Social Equity. Appl. Geogr. 2017, 82, 129–142. [Google Scholar] [CrossRef]
  14. Whyte, W.H. The Social Life of Small Urban Spaces; STPH: Shanghai, China, 2016; ISBN 978-7-5327-7051-9. [Google Scholar]
  15. Park, K.; Ewing, R. The Usability of Unmanned Aerial Vehicles (UAVs) for Measuring Park-Based Physical Activity. Landsc. Urban. Plan. 2017, 167, 157–164. [Google Scholar] [CrossRef]
  16. Zhao, X.; Xu, J.; Liu, X.; Zhu, X. Study on physical activity and spatial distribution of urban parks in winter based on UAV observation: A case study of four parks in Harbin. CLA 2019, 35, 40–45. [Google Scholar] [CrossRef]
  17. Matisziw, T.C.; Nilon, C.H.; Wilhelm Stanis, S.A.; LeMaster, J.W.; McElroy, J.A.; Sayers, S.P. The Right Space at the Right Time: The Relationship between Children’s Physical Activity and Land Use/Land Cover. Landsc. Urban. Plan. 2016, 151, 21–32. [Google Scholar] [CrossRef]
  18. Reades, J.; Calabrese, F.; Sevtsuk, A.; Ratti, C. Cellular Census: Explorations in Urban Data Collection. IEEE Pervasive Comput. 2007, 6, 30–38. [Google Scholar] [CrossRef]
  19. Wang, B.; Zhen, F.; Zhang, H. Study on dynamic change and regionalization of urban activity time based on check-in data. Scient. Geogr. Sin. 2015, 35, 151–160. [Google Scholar] [CrossRef]
  20. He, X.; Yuan, Q.; Lu, J.; Li, G. A study on the spatio-temporal patterns and influencing mechanisms of foreign tourists’ visits to urban parks: A case study of Guangzhou. S. Archit. 2024, 6, 32–43. [Google Scholar] [CrossRef]
  21. Niu, X.; Kang, N. Spatial and temporal characteristics and influencing factors of tourist activities in Shanghai Country Parks: A study based on mobile phone signaling data. CLA 2021, 37, 39–43. [Google Scholar] [CrossRef]
  22. Dong, W. Spatial and temporal vitality characteristics and influencing factors of urban parks based on multi-source data: A case study of Yanqing District, Beijing. China Build. Met. Struct. 2023, 141–143, 149. [Google Scholar] [CrossRef]
  23. Long, F.; Shi, L.; Peng, Z.; Yang, J.; Zhang, S. Urban park service evaluation based on mobile signaling data. Urban Probl. 2018, 6, 88–92. [Google Scholar] [CrossRef]
  24. Fang, J.; Liu, S.; Wang, D.; Zhang, Y. Analysis of supply and demand service of Shanghai urban park based on mobile signaling data. Landsc. Archit. 2017, 11, 35–40. [Google Scholar] [CrossRef]
  25. Liu, H.; Hu, Y.; Liang, F. Study on recreational behavior of street side green space users in summer in Binhai New Area, Tianjin. J. Beijing Univ. Agric. 2013, 28, 74–77. [Google Scholar]
  26. Yang, G. Research on recreation behavior in lake-type park based on behavioral observation. Archit. Cult. 2018, 5, 171–172. [Google Scholar]
  27. Yang, B.; Yin, M.; Zheng, S.; Gao, R. Study on day and night recreation activity of high-density urban park green space based on mobile phone signaling and POI big data: A case study of typical park green space in Shanghai. Landsc. Archit. 2023, 40, 35–42. [Google Scholar]
  28. Rizwan, M.; Wan, W.; Cervantes, O.; Gwiazdzinski, L. Using Location-Based Social Media Data to Observe Check-In Behavior and Gender Difference: Bringing Weibo Data into Play. ISPRS Int. J. Geo-Inf. 2018, 7, 196. [Google Scholar] [CrossRef]
  29. Song, Y.; Huang, B.; Cai, J.; Chen, B. Dynamic Assessments of Population Exposure to Urban Greenspace Using Multi-Source Big Data. Sci. Total Environ. 2018, 634, 1315–1325. [Google Scholar] [CrossRef]
  30. Zeng, L.; Liu, C. Exploring Factors Affecting Urban Park Use from a Geospatial Perspective: A Big Data Study in Fuzhou, China. Int. J. Environ. Res. Public Health 2023, 20, 4237. [Google Scholar] [CrossRef]
  31. Xu, J.; Zhao, Y.; Zhong, K.; Ruan, H.; Sun, C. Correlation analysis of temperature and NDVI concentration density based on geographical weighting and least square linear regression model. Trop. Geogr. 2017, 37, 269–276. [Google Scholar] [CrossRef]
  32. Hu, X.; Li, T. Spatial and temporal distribution characteristics of urban park population based on vitality perspective: A case study of Suzhou Central City. Landsc. Archit. 2022, 39, 90–97. [Google Scholar]
  33. Tao, Z.; Ding, J.; Wang, L.; Chen, D. A spatial-temporal heterogeneity study on the influence of urban park characteristics on recreation vitality. Chin. Landsc. Archit. 2023, 39, 108–113. [Google Scholar] [CrossRef]
  34. Ye, Y.; Qiu, H. Exploring Affecting Factors of Park Use Based on Multisource Big Data: Case Study in Wuhan, China. J. Urban Plan. Dev. 2021, 147, 05020037. [Google Scholar] [CrossRef]
  35. He, X.; Yuan, Q.; Lu, J.; Li, G. Spatial and temporal activity patterns and planning strategies of urban park population in Guangzhou based on multi-source big data. Mod. Urban Res. 2025, 1, 7–14. [Google Scholar] [CrossRef]
  36. Hägerstraand, T. What about people in regional science? Pap. Reg. Sci. 1970, 24, 7–21. [Google Scholar] [CrossRef]
  37. Wang, J.; Xu, C. Geodetectors: Principles and prospects. Acta Geogr. Sin. 2017, 72, 116–134. [Google Scholar]
  38. Li, F.; Yao, N.; Liu, D.; Liu, W.; Sun, Y.; Cheng, W.; Li, X.; Wang, X.; Zhao, Y. Explore the Recreational Service of Large Urban Parks and Its Influential Factors in City Clusters—Experiments from 11 Cities in the Beijing-Tianjin-Hebei Region. J. Clean. Prod. 2021, 314, 128261. [Google Scholar] [CrossRef]
  39. Chen, Y.; Liu, X.; Gao, W.; Wang, R.Y.; Li, Y.; Tu, W. Emerging Social Media Data on Measuring Urban Park Use. Urban. For. Urban. Green. 2018, 31, 130–141. [Google Scholar] [CrossRef]
  40. Lyu, F.; Zhang, L. Using Multi-Source Big Data to Understand the Factors Affecting Urban Park Use in Wuhan. Urban. For. Urban. Green. 2019, 43, 126367. [Google Scholar] [CrossRef]
  41. Dade, M.C.; Mitchell, M.G.E.; Brown, G.; Rhodes, J.R. The Effects of Urban Greenspace Characteristics and Socio-Demographics Vary among Cultural Ecosystem Services. Urban. For. Urban. Green. 2020, 49, 126641. [Google Scholar] [CrossRef]
  42. CJJ/T 85-2017; Urban Green Space Classification Standard. China Architecture & Building Press: Beijing, China, 2017.
  43. Jiang, W.; Wang, Y.; Zhang, M. Exploring the Industrial Heat Island Effects and Key Influencing Factors in the Guangzhou–Foshan Metropolitan Area. Sustainability 2025, 17, 3363. [Google Scholar] [CrossRef]
  44. Sun, R.; Chen, L. How Can Urban Water Bodies Be Designed for Climate Adaptation? Landsc. Urban. Plan. 2012, 105, 27–33. [Google Scholar] [CrossRef]
  45. Lou, G.; Chen, Q.; He, K.; Zhou, Y.; Shi, Z. Using Nighttime Light Data and POI Big Data to Detect the Urban Centers of Hangzhou. Remote Sens. 2019, 11, 1821. [Google Scholar] [CrossRef]
  46. GB/T 51346-2019; Urban Green Space Planning Standard. China Architecture & Building Press: Beijing, China, 2019.
  47. Chai, Y.; Shen, Y.; Xiao, Z.; Zhang, Y.; Zhao, Y.; Ta, N. Review for Space-time Behavior Research: Theory Frontiers and Application in the Future. Prog. Geo. 2012, 31, 667–675. [Google Scholar]
  48. Gomez-Baggethun, E.; Barton, D.N. Classifying and Valuing Ecosystem Services for Urban Planning. Ecol. Econ. 2013, 86, 235–245. [Google Scholar] [CrossRef]
  49. Yin, Q.; Wu, C.; Luo, G. Research on Flexible Land Use Planning. Trans. Chin. Soc. Agric. Eng. 2006, 22, 65–68. [Google Scholar]
  50. Bolund, P.; Hunhammar, S. Ecosystem Services in Urban Areas. Ecol. Econ. 1999, 29, 293–301. [Google Scholar] [CrossRef]
  51. Work Summary and Work Plan for 2022 and 2023 of the Municipal Bureau of Planning and Natural Resources—Public Disclosure of Implementation Status. Available online: https://www.sz.gov.cn/szzt2010/wgkzl/jggk/lsqkgk/content/post_10568888.html (accessed on 14 April 2025).
Figure 1. Location of Gongshu District.
Land 14 01338 g001
Figure 2. Spatial distribution of urban parks with different areas.
Land 14 01338 g002
Figure 3. Coupling analysis framework of “temporal behavior–spatial attribute–vitality typology”.
Land 14 01338 g003
Figure 4. Parallel coordinate map of the characteristic index of each activity type park. (MPR: morning peak ratio, DNDC: day–night difference coefficient, EAL: evening activity level, FLE: fluctuation entropy, PVDC: peak–valley difference coefficient. Data are standardized by Z-score, and the larger the value, the more significant the characteristics of the indicator are).
Land 14 01338 g004
Figure 5. Spatial distribution map of parks with active types in different time periods: (a) weekday; (b) weekend.
Land 14 01338 g005
Figure 6. Thermal map of each characteristic index influence factor detection on the weekends: (a) morning peak ratio; (b) evening activity; (c) day/night difference index.
Land 14 01338 g006
Figure 7. Thermal map of each characteristic index influence factor detection on the weekdays: (a) morning peak ratio; (b) evening activity; (c) day/night difference index.
Land 14 01338 g007
Figure 8. Distribution of influence factors of each characteristic index of urban parks in different time periods (q value): (a) morning peak ratio; (b) evening activity; (c) day/night different index.
Land 14 01338 g008
Table 1. Variables: description and data sources.
VariablesDescriptionUnitSource
Park-specific AttributesPSPark sizeHaExtracted from AMAP
PTPark type-Comprehensive park (=7)
Specialized park (=5)
Community park (=3)
Mini park (=1)
(LSI)
Landscape shape index
The landscape shape index-LSI = C i 2 π × S i
Si represents the area of the urban park I in hectares, and Ci signifies the circumference of the park I in meters.
WPWater proportion to the urban park area Water area/park area
(PFD)
Park facilities density
The density of park services, such as playgrounds, themed plazas, lounge corridors, restaurants, shops, toilets, and parking lotsn/haPOI screening + map comparison
Accessibility Features(DTC)
Distance to the city center
The distance from the park to the city centermEuclidean distance from the city center (Wulin Square) to an urban park centroid
(BSD)
Bus station density
The density of the bus stations within buffer areas of each park.n/haBuffer analysis was conducted based on data from AMAP POI (accessed in 12 April 2023)
(W-15)
Walking in an isochronous circle (15 min)
Area accessibility from walking for 15 min in non-peak hours on weekdays from the parkm2Used real-time path planning tool to obtain a grid file describing the time distance to the park.
(W-30)
Walking in an isochronous circle (30 min)
Area accessibility from walking for 30 min in non-peak hours on weekdays from the parkm2Used real-time path planning tool to obtain a grid file describing the time distance to the park.
(D-15)
Driving in an isochronous circle (15 min)
Area accessibility from driving for 15 min in non-peak hours on weekdays from the parkm2Used real-time path planning tool to obtain a grid file describing the time distance to the park.
(D-30)
Driving in an isochronous circle (30 min)
Area accessibility from driving for 30 min in non-peak hours on weekdays from the parkm2Used real-time path planning tool to obtain a grid file describing the time distance to the park.
Surrounding Environmental Attributes(RPD)
Residential population density
The density of the residential population within the buffer areas of each parkPopulation/haBuffer analysis was conducted based on mobile phone signaling data
(WPD)
Working population density
The density of the working population within the buffer areas of each parkPopulation/haBuffer analysis was conducted based on mobile phone signaling data
SPOIThe density of surrounding services and POI in the buffer areas of each parkn/haBuffer analysis was conducted based on data from AMAP in 2023
Note: Factors were calculated in ArcGIS 10.2.
Table 2. Correlation and significance of influencing factors of each characteristic index of urban parks on weekends: (A) morning peak ratio; (B) evening activity; (C) day/night difference index.
(A) Morning peak ratio
FactorPTPSLSIWPPFDDTCBSDW-15W-30D-15D-30RPDWPDSPOI
q statistic0.34730.32210.1320.09580.04510.24600.08220.20900.17230.04020.43840.23380.19440.6627
p value0.000.000.160.570.690.400.060.080.080.090.020.080.100.00
(B) Evening activity
FactorTypeAreaLSIWPPFDDTCBSDW-15W-30D-15D-30RPDWPDSPOI
q statistic0.26130.28260.17430.18230.43940.11650.15240.61220.15890.03870.09790.20590.16090.7693
p value0.100.070.140.820.040.340.660.000.220.130.080.080.170.01
(C) Day/Night difference index
FactorTypeAreaLSIWPPFDDTCBSDW-15W-30D-15D-30RPDWPDSPOI
q statistic0.17430.18530.11470.03170.03690.55240.10650.22160.08230.19440.48200.47130.13200.5658
p value0.880.060.130.870.950.020.640.080.280.230.030.010.120.03
Table 3. Correlation and significance of influencing factors of each characteristic index of urban parks on weekdays: (A) morning peak ratio; (B) evening activity; (C) day/night difference index.
(A) Morning peak ratio
FactorPTPSLSIWPPFDDTCBSDW-15W-30D-15D-30RPDWPDSPOI
q statistic0.15130.0340.09770.02630.05270.23340.34830.42920.13480.06330.20510.18720.41080.5823
p value0.300.160.060.560.660.380.000.010.070.240.130.060.000.01
(B) Evening activity
FactorTypeAreaLSIWPPFDDTCBSDW-15W-30D-15D-30RPDWPDSPOI
q statistic0.25720.06450.14620.17840.36790.13900.09520.20890.11620.34020.14880.51090.15180.6281
p value0.110.790.100.820.030.250.570.100.200.030.580.000.090.00
(C) Day/Night difference index
FactorTypeAreaLSIWPPFDDTCBSDW-15W-30D-15D-30RPDWPDSPOI
q statistic0.38340.19820.10370.04090.02160.60120.13050.28510.03900.26180.13420.23780.08420.4712
p value0.010.230.090.790.900.010.530.060.310.240.180.060.280.01
Disclaimer/Publisher’s Note: The statements, opinions and data contained in all publications are solely those of the individual author(s) and contributor(s) and not of MDPI and/or the editor(s). MDPI and/or the editor(s) disclaim responsibility for any injury to people or property resulting from any ideas, methods, instructions or products referred to in the content.

