


The Potential of Informal Green Space (IGS) in Enhancing Urban Green Space Accessibility and Optimization Strategies: A Case Study of Chengdu


Abstract
1. Introduction
- (1)
- How do the spatial configurations and quantitative compositions relate to formal versus informal green spaces within Chengdu’s central urban district?
- (2)
- What is the magnitude of improvement contributions from distinct informal green space typologies to accessibility and equity, and what is the nature of their inter-categorical variations?
- (3)
- Following the integration of informal green spaces within urban planning frameworks, are there still communities exhibiting substandard accessibility levels?
2. Data
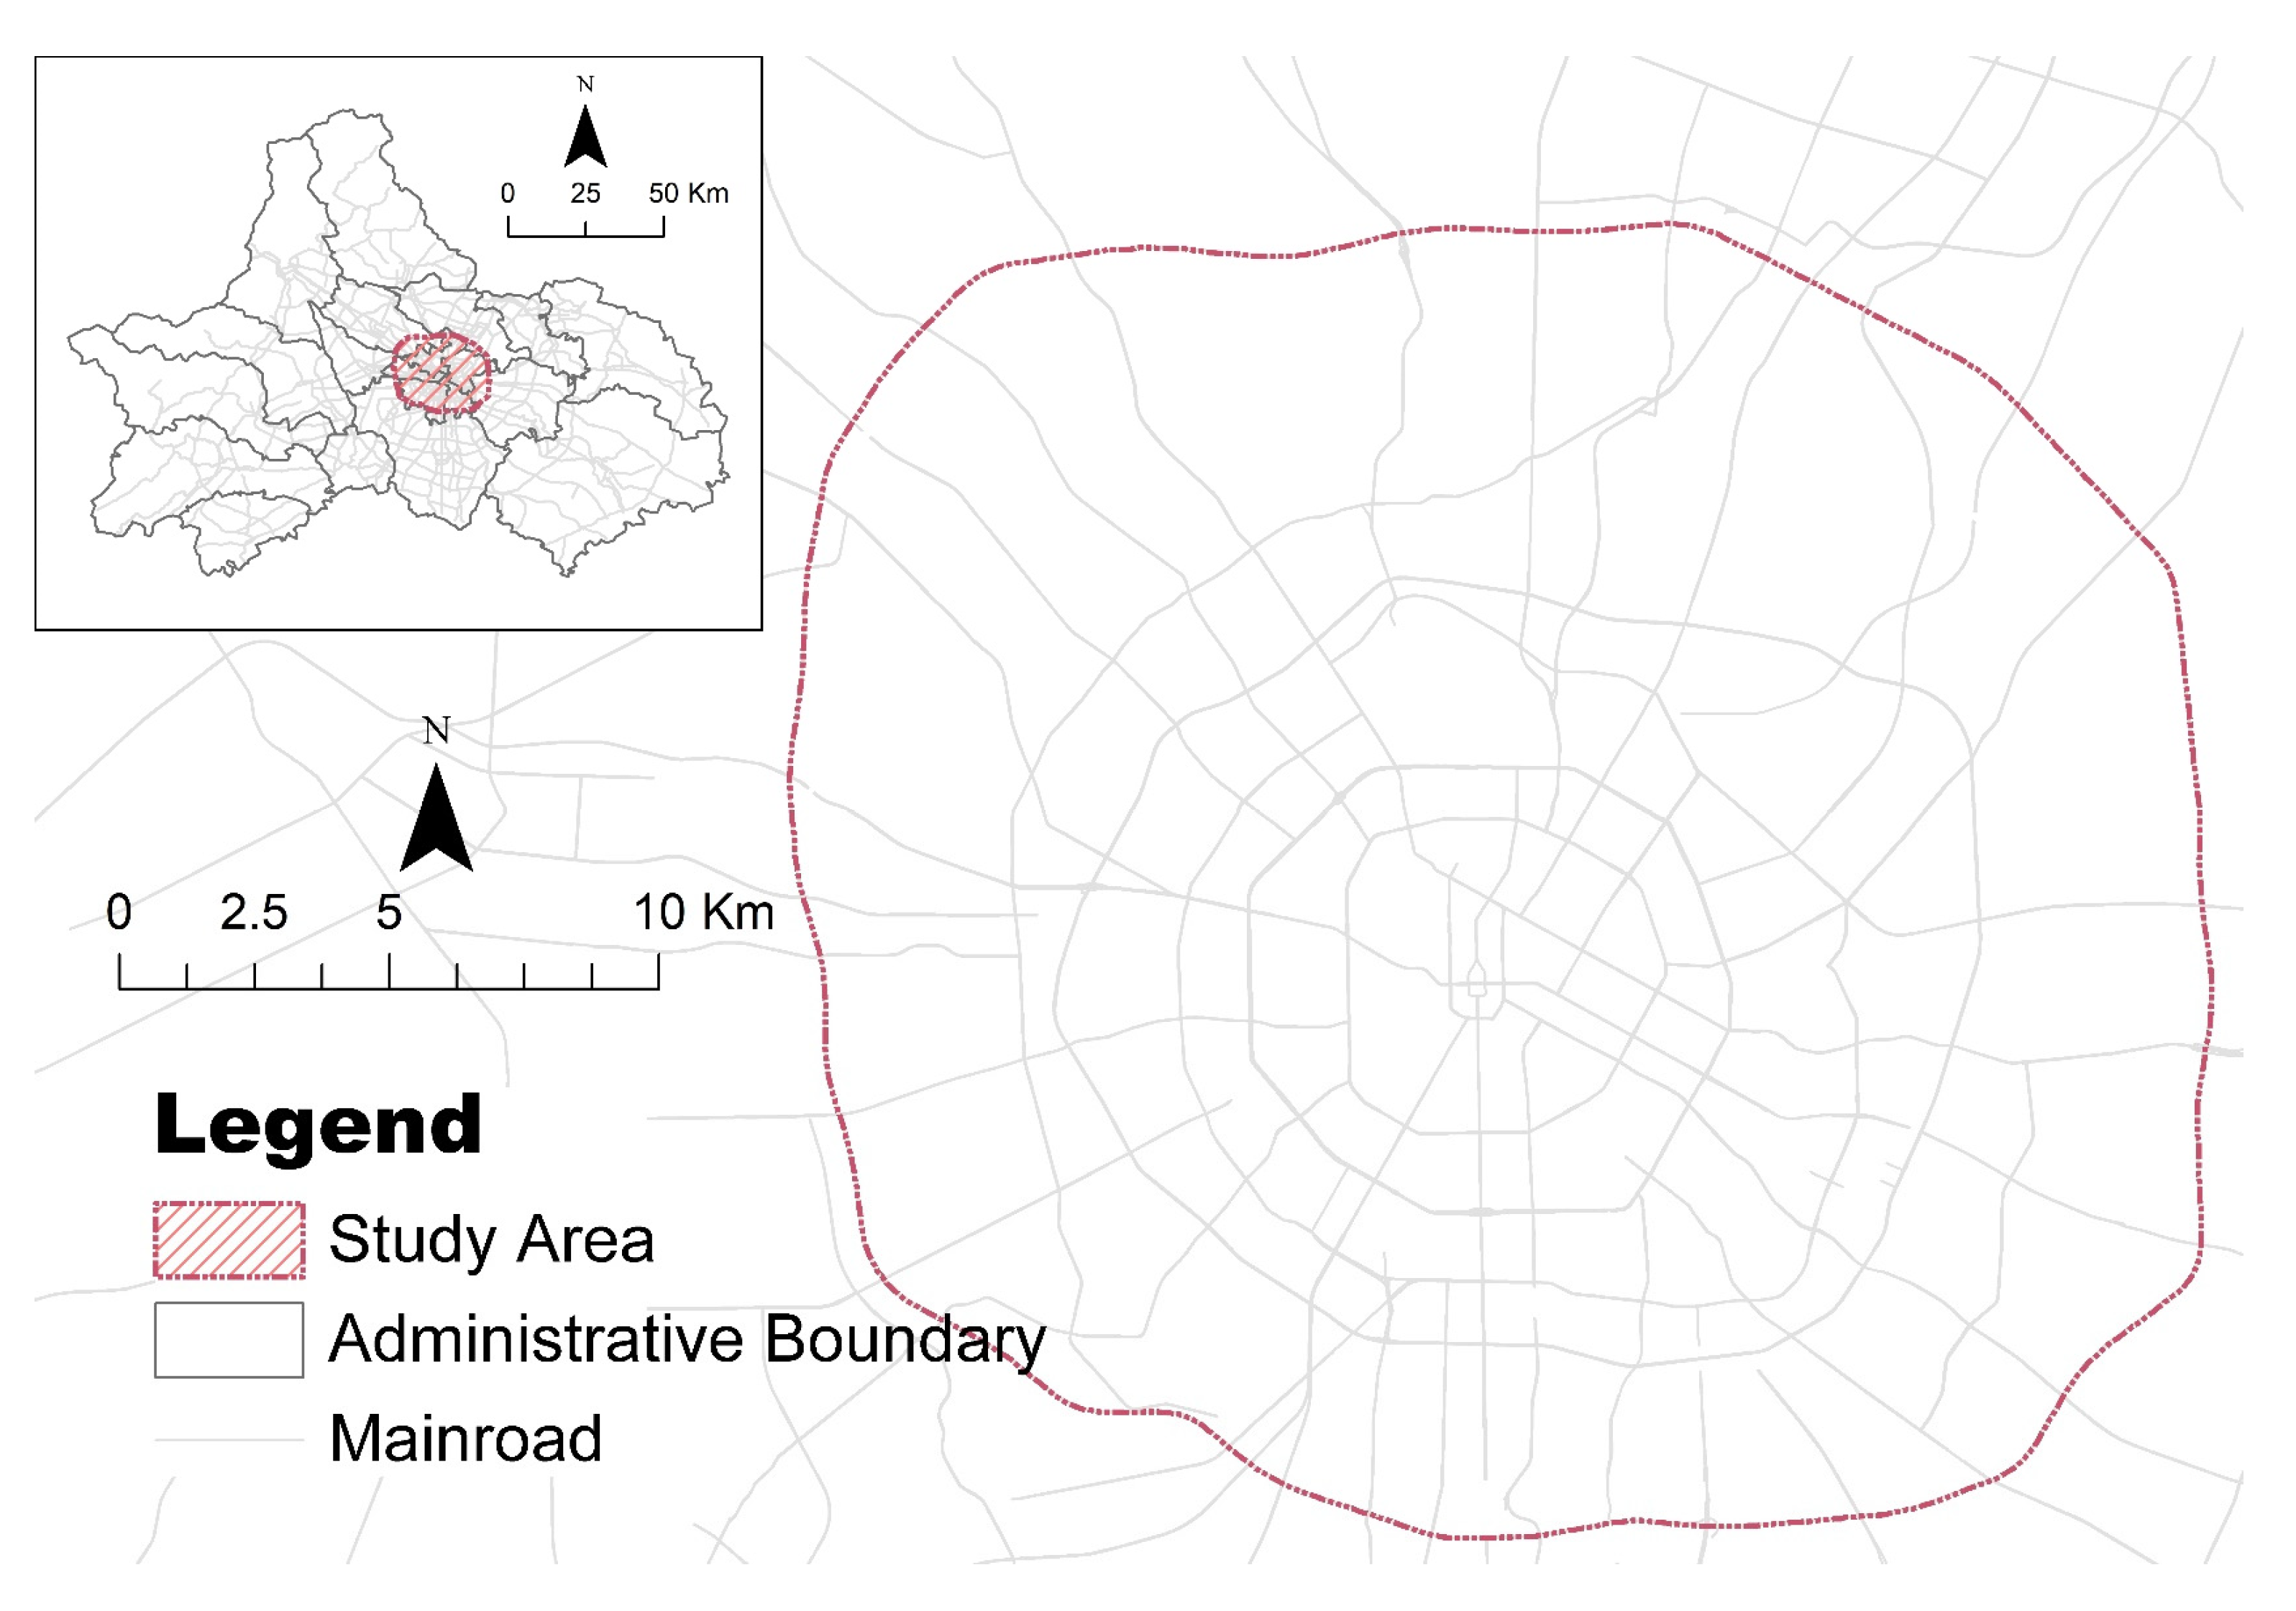
2.1. Study Area
2.2. Data Source
3. Method
3.1. Classification of Informal Green Space
3.2. Extraction of Informal Green Space
3.3. Measurement of Accessibility to Green Spaces and Its Equity
4. Result and Discussion
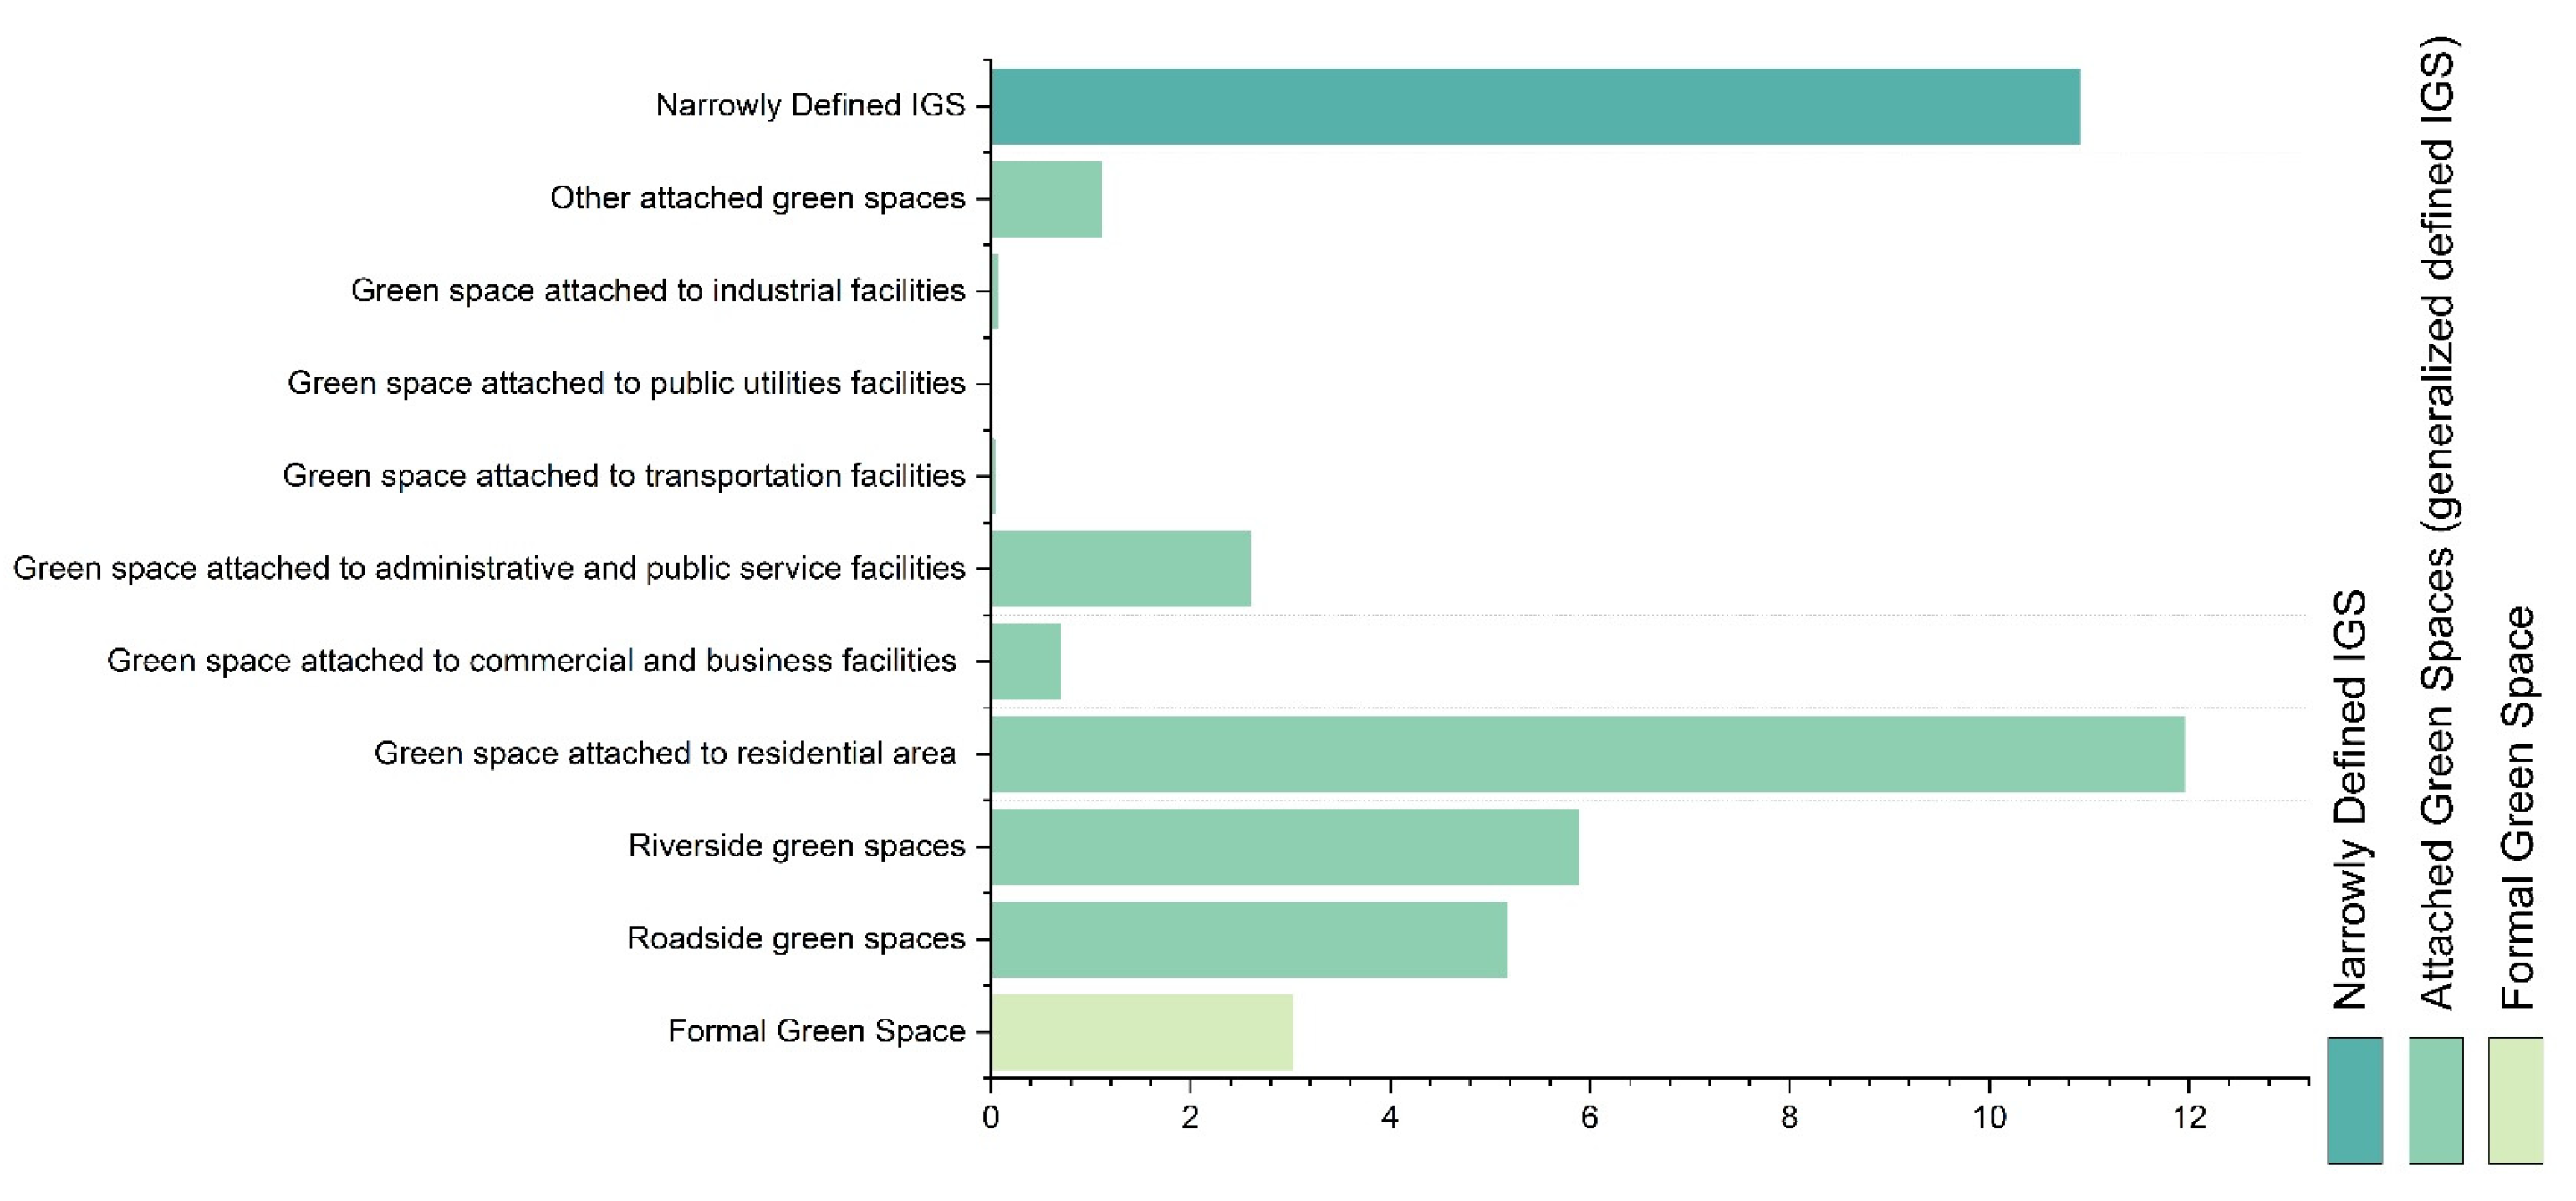
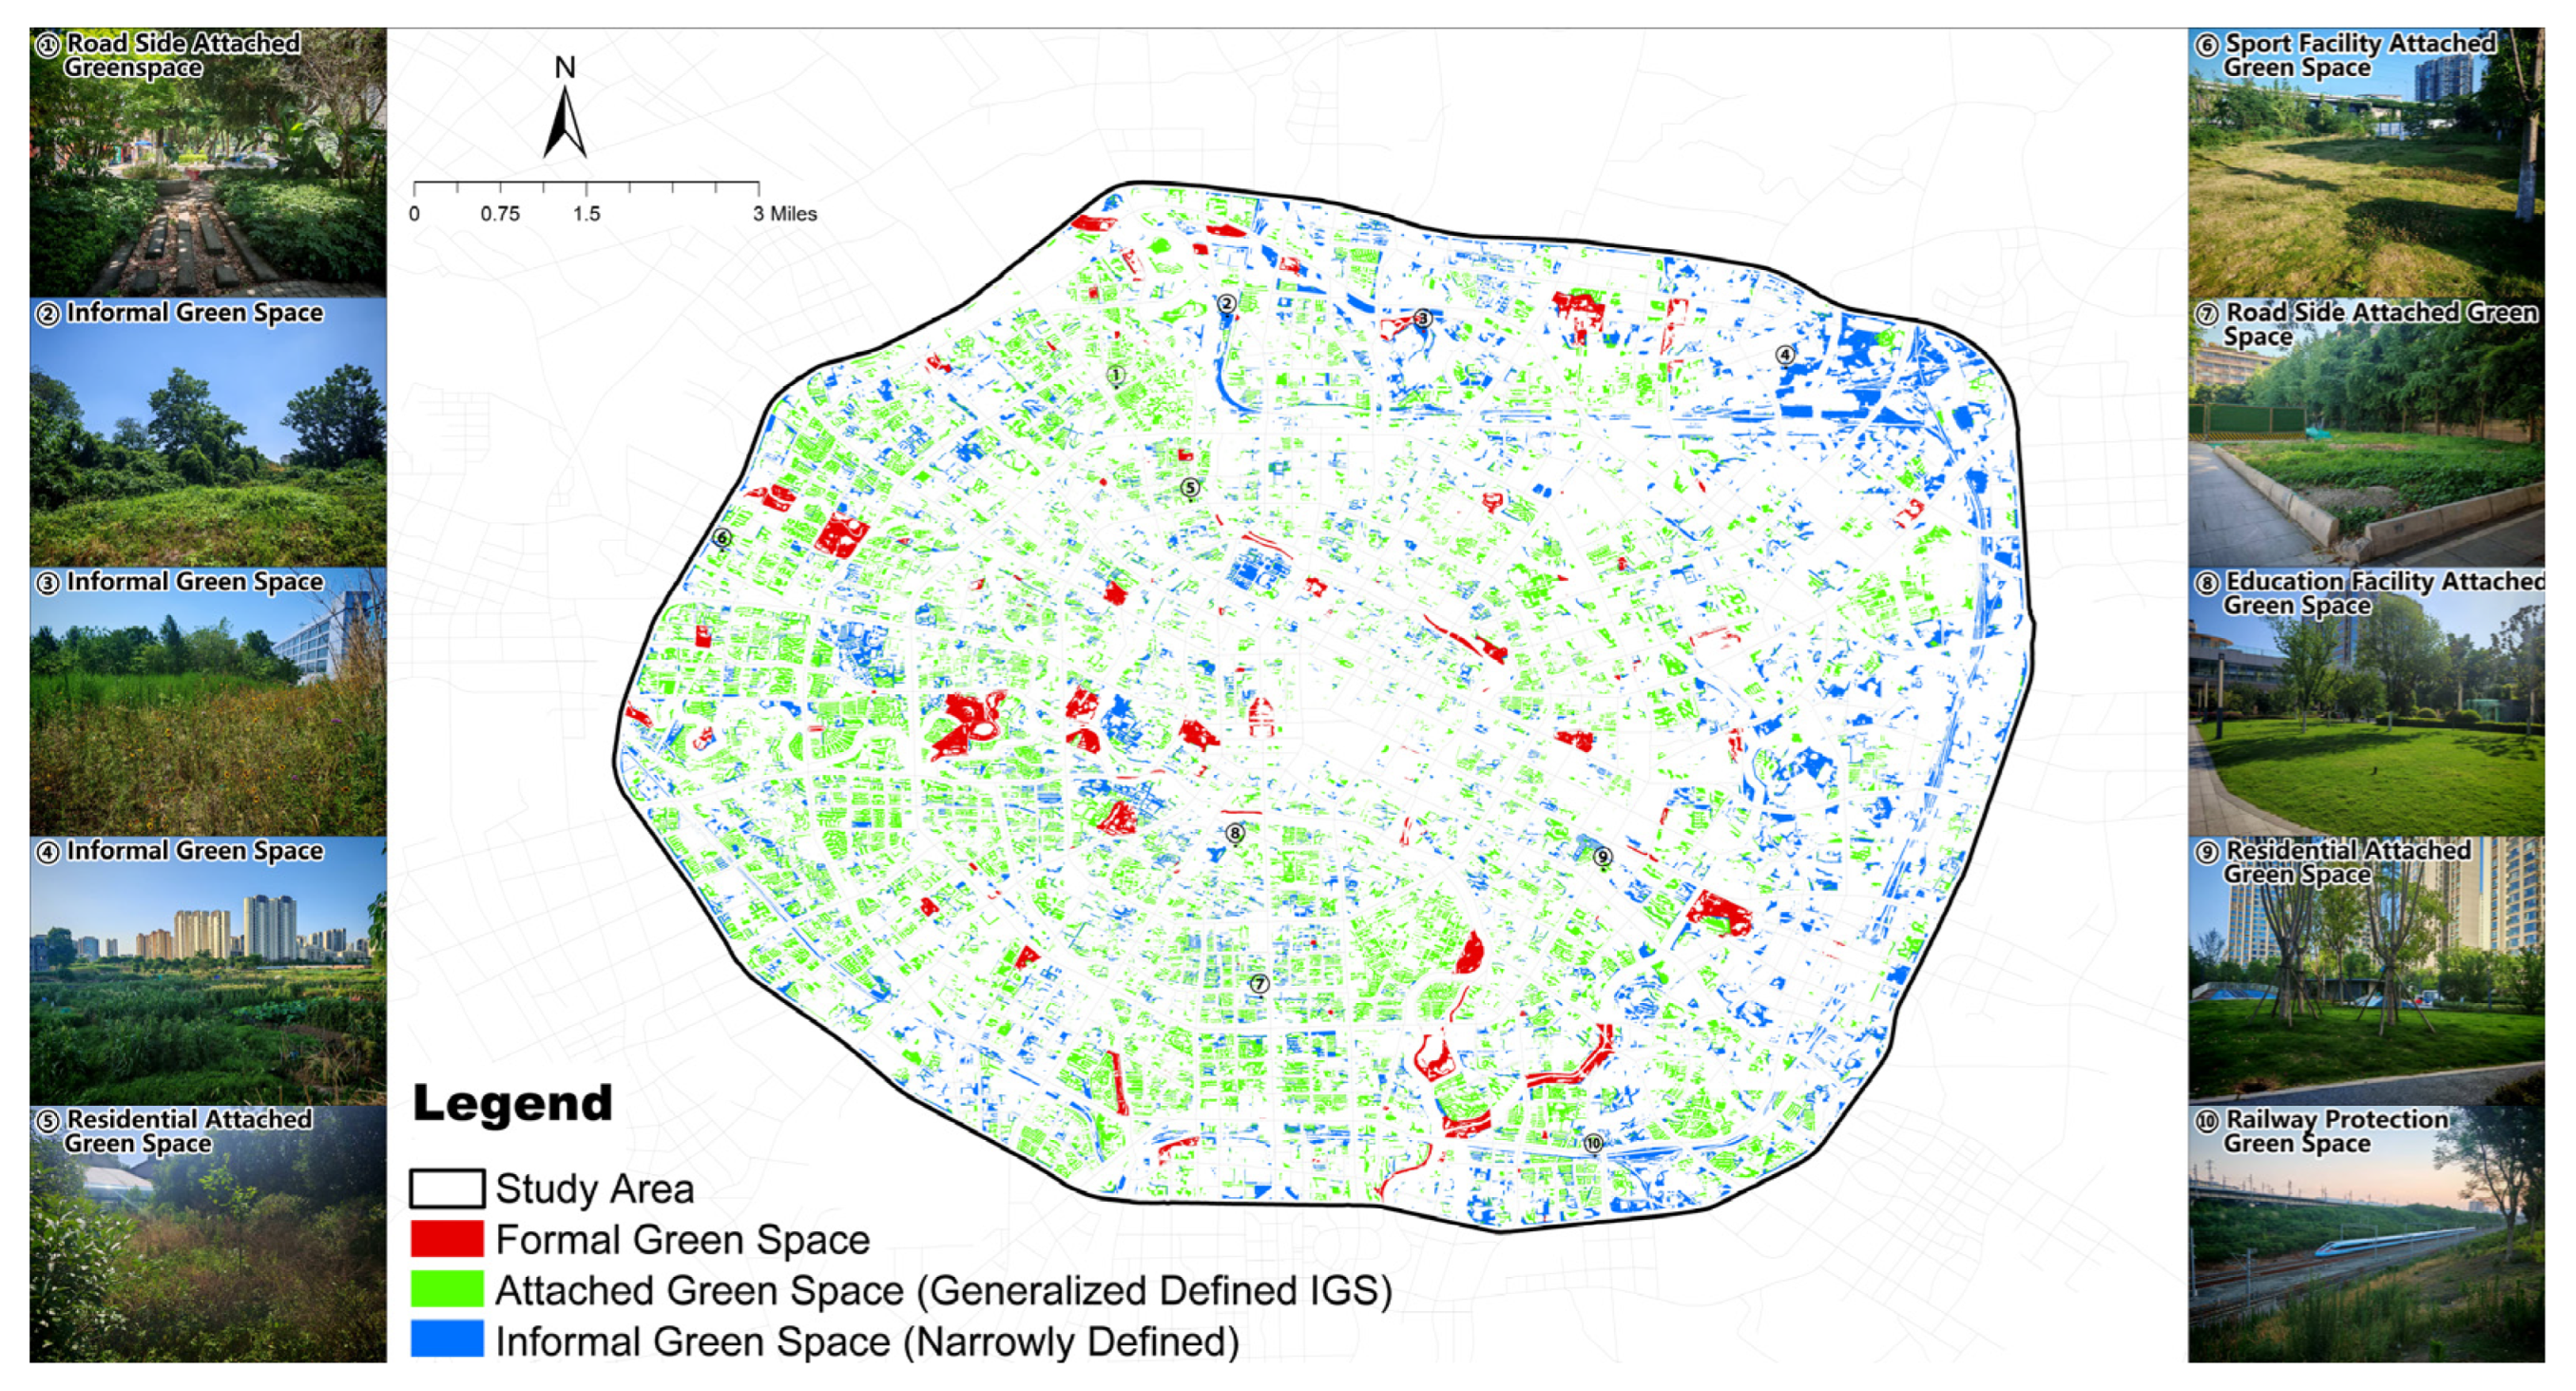
4.1. The Configuration and Distribution of IGS
4.2. How IGS Affect the Accessibility and Equity of Urban Green Spaces
4.2.1. Overall Effect of IGS on the Equity of Green Space Accessibility
4.2.2. Effect of Semi-Public Attached Green Spaces on the Equity of Green Space Accessibility
4.3. Strategies for Improving Green Space Accessibility Considering IGS
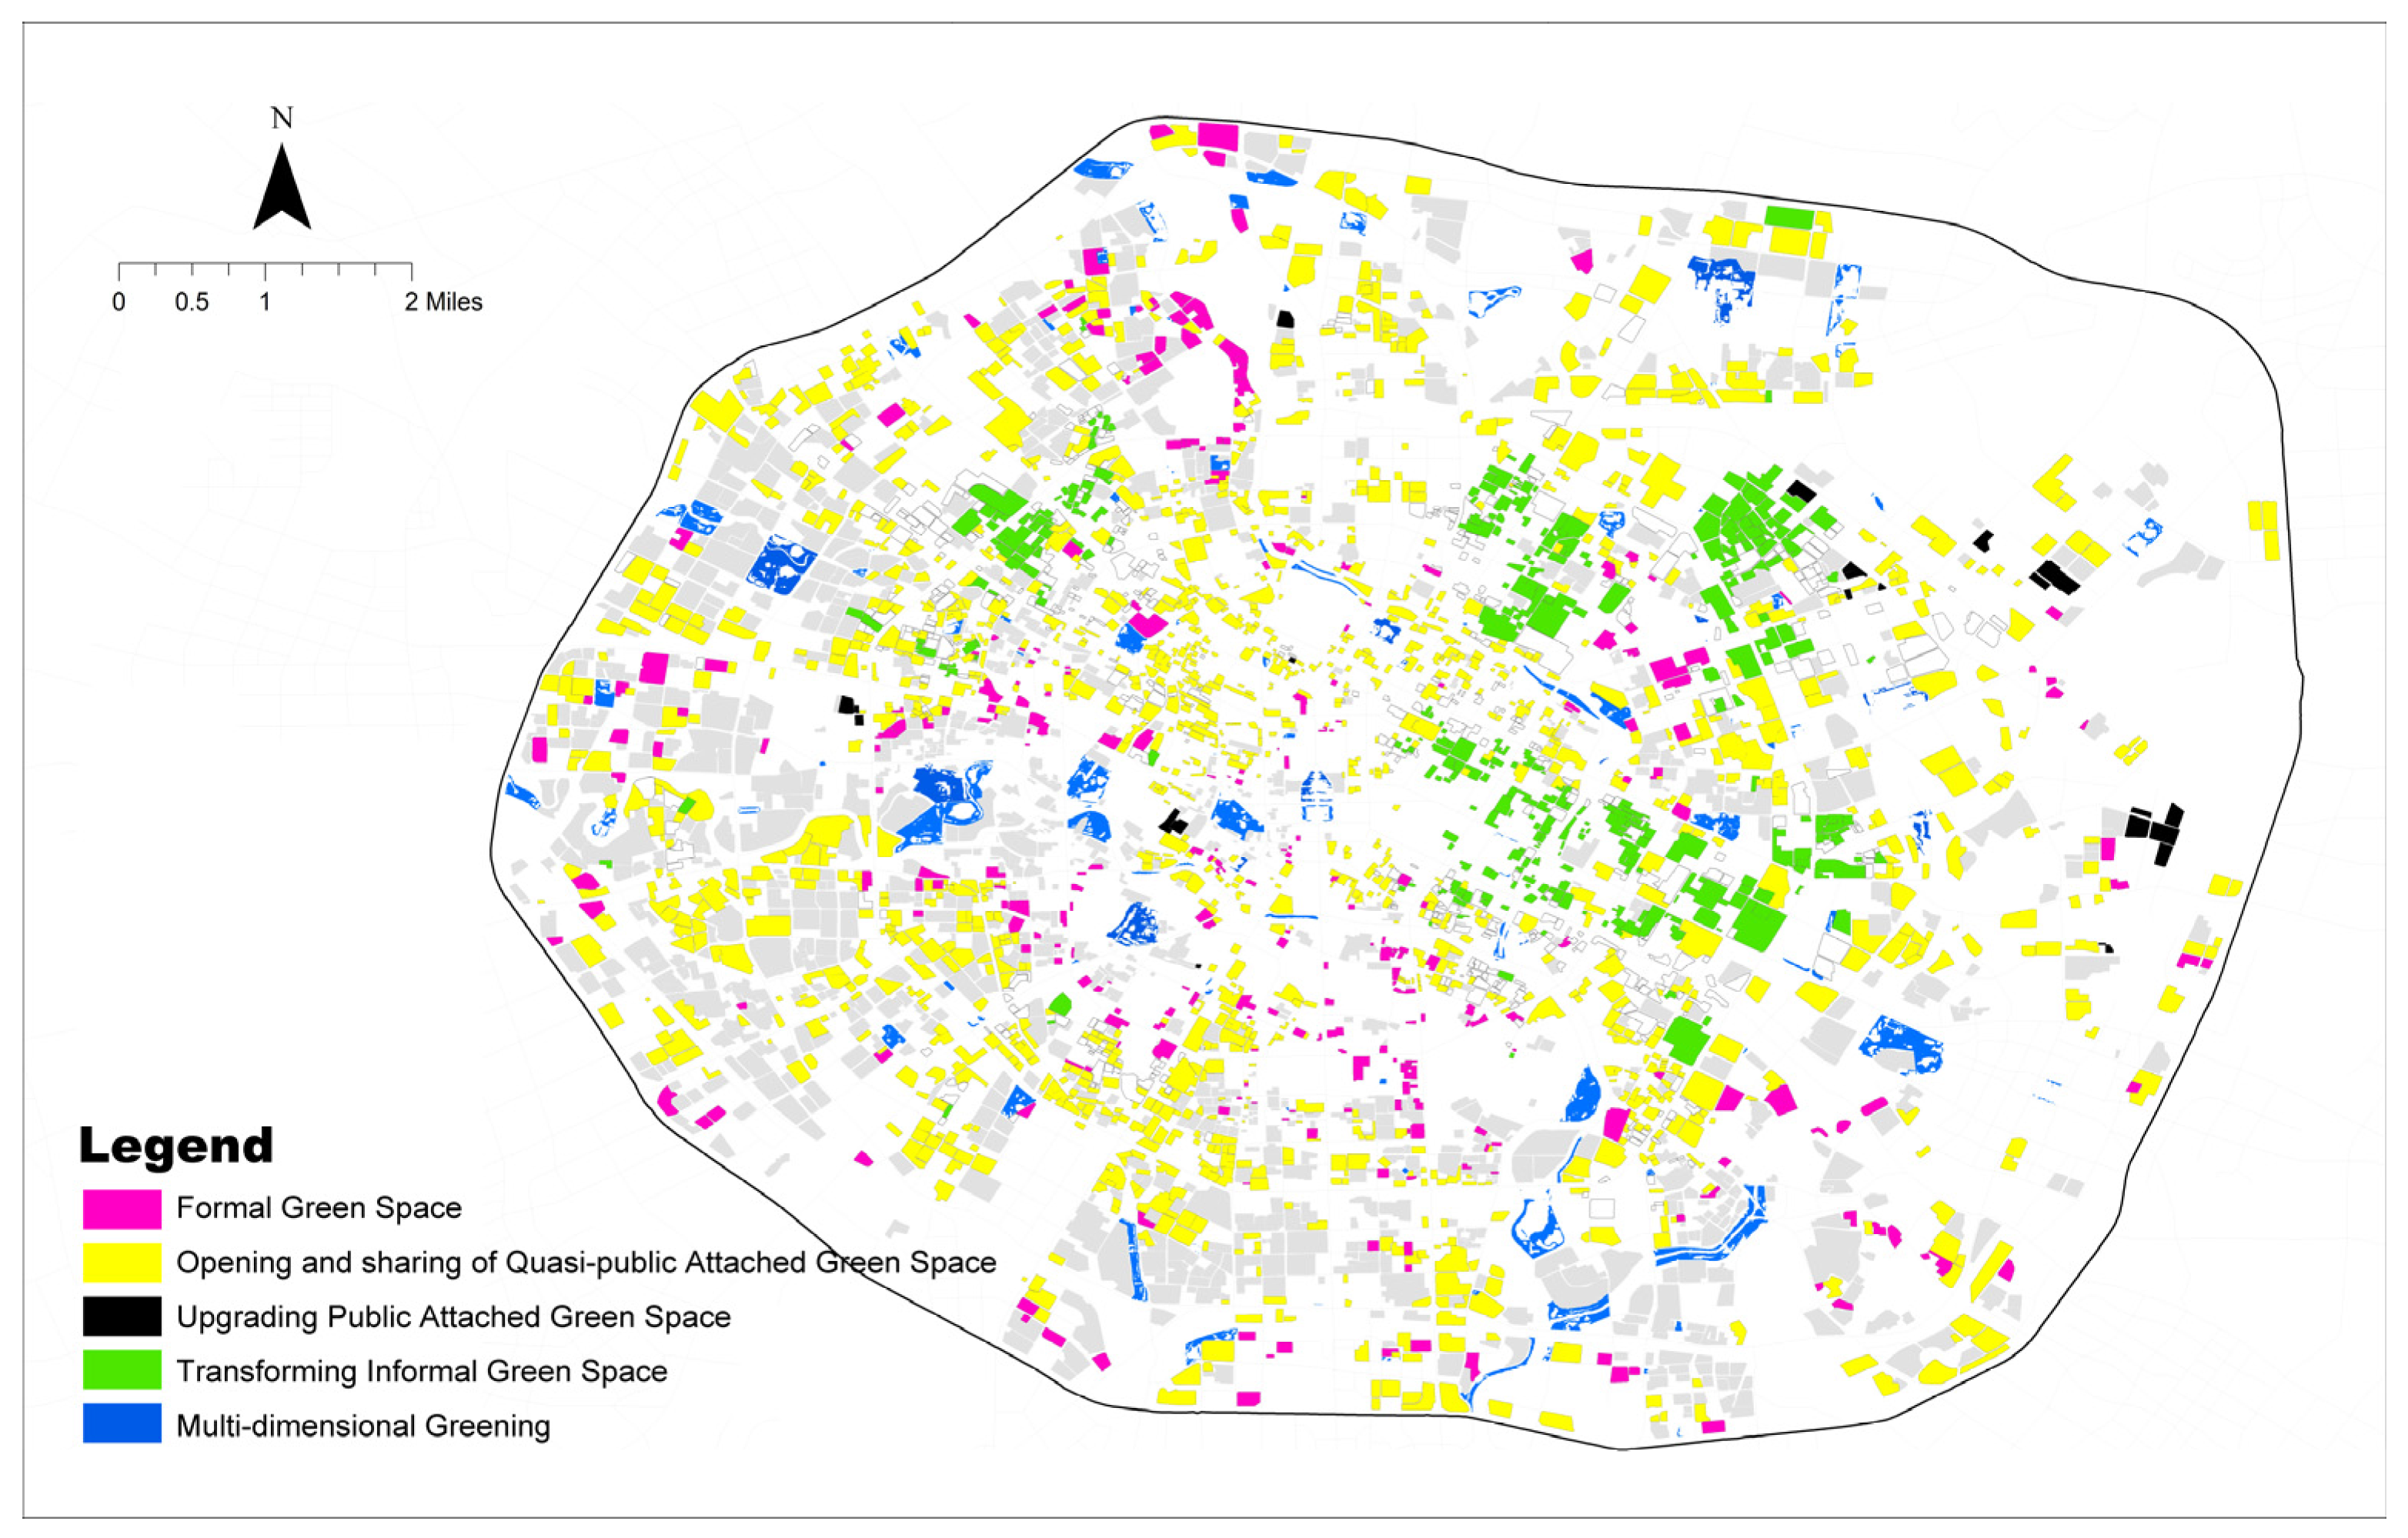
4.3.1. Spatial Differentiation of IGS Enhancement Effect and Vulnerable Residentials Identification
4.3.2. Targeted Strategies to Enhance the Accessibility of Disadvantaged Residentials
4.4. Limitation
5. Conclusions
Author Contributions
Funding
Data Availability Statement
Conflicts of Interest
References
- Yao, X.; Yu, Z.; Ma, W.; Xiong, J.; Yang, G. Quantifying Threshold Effects of Physiological Health Benefits in Greenspace Exposure. Landsc. Urban Plan. 2024, 241, 104917. [Google Scholar] [CrossRef]
- Jin, Y.; Yu, Z.; Yang, G.; Yao, X.; Hu, M.; Remme, R.P.; van Bodegom, P.M.; Morpurgo, J.; Huang, Y.; Wang, J.; et al. Quantifying Physiological Health Efficiency and Benefit Threshold of Greenspace Exposure in Typical Urban Landscapes. Environ. Pollut. 2024, 362, 124726. [Google Scholar] [CrossRef]
- Wang, Z.; Cheng, H.; Li, Z.; Wang, G. Is Greener Always Healthier? Examining the Nonlinear Relationships between Urban Green Spaces and Mental Health in Wuhan, China. Urban For. Urban Green. 2024, 101, 128543. [Google Scholar] [CrossRef]
- Liu, N.; Wu, M.; Wang, J.; Wei, J.; Yao, X.; Zhu, Z. Availability, Accessibility, or Visibility? A Study of the Influencing Factors of Greenspace Exposure Behavior in Fuzhou Urban Parks. Forests 2025, 16, 341. [Google Scholar] [CrossRef]
- Ji, S.; Kim, S.; Lee, J.; Seo, K. Quantitative Evaluation and Typology of Social Exposure Patterns to Urban Green Spaces: A Case Study of Seoul. Forests 2025, 16, 510. [Google Scholar] [CrossRef]
- Ye, Y.; Xiang, Y.; Qiu, H.; Li, X. Revealing Urban Greenspace Accessibility Inequity Using the Carrying Capacity-Based 3SFCA Method and Location Big Data. Sustain. Cities Soc. 2024, 108, 105513. [Google Scholar] [CrossRef]
- Zhu, C.; Zheng, S.; Yang, S.; Dong, J.; Ma, M.; Zhang, S.; Liu, S.; Liu, X.; Yao, Y.; Han, B. Towards a Green Equal City: Measuring and Matching the Supply-Demand of Green Exposure in Urban Center. J. Environ. Manag. 2024, 365, 121510. [Google Scholar] [CrossRef]
- Zhang, T.; Wang, L.; Hu, Y.; Zhang, W.; Liu, Y. Measuring Urban Green Space Exposure Based on Street View Images and Machine Learning. Forests 2024, 15, 655. [Google Scholar] [CrossRef]
- Fang, D.; Liu, D.; Kwan, M.-P. Evaluating Spatial Variation of Accessibility to Urban Green Spaces and Its Inequity in Chicago: Perspectives from Multi-Types of Travel Modes and Travel Time. Urban For. Urban Green. 2025, 104, 128593. [Google Scholar] [CrossRef]
- Zhang, R.; Sun, F.; Shen, Y.; Peng, S.; Che, Y. Accessibility of Urban Park Benefits with Different Spatial Coverage: Spatial and Social Inequity. Appl. Geogr. 2021, 135, 102555. [Google Scholar] [CrossRef]
- Jin, Y.; He, R.; Hong, J.; Luo, D.; Xiong, G. Assessing the Accessibility and Equity of Urban Green Spaces from Supply and Demand Perspectives: A Case Study of a Mountainous City in China. Land 2023, 12, 1793. [Google Scholar] [CrossRef]
- Shan, L.; He, S. The Role of Peri-Urban Parks in Enhancing Urban Green Spaces Accessibility in High-Density Contexts: An Environmental Justice Perspective. Landsc. Urban Plan. 2025, 254, 105244. [Google Scholar] [CrossRef]
- Zhang, L.; Chen, P.; Hui, F. Refining the Accessibility Evaluation of Urban Green Spaces with Multiple Sources of Mobility Data: A Case Study in Shenzhen, China. Urban For. Urban Green. 2022, 70, 127550. [Google Scholar] [CrossRef]
- Wu, W.; Zheng, T. Establishing a “Dynamic Two-Step Floating Catchment Area Method” to Assess the Accessibility of Urban Green Space in Shenyang Based on Dynamic Population Data and Multiple Modes of Transportation. Urban For. Urban Green. 2023, 82, 127893. [Google Scholar] [CrossRef]
- Long, Y.; Qin, J.; Wu, Y.; Wang, K. Analysis of Urban Park Accessibility Based on Space Syntax: Take the Urban Area of Changsha City as an Example. Land 2023, 12, 1061. [Google Scholar] [CrossRef]
- Feltynowski, M.; Kronenberg, J.; Bergier, T.; Kabisch, N.; Łaszkiewicz, E.; Strohbach, M.W. Challenges of Urban Green Space Management in the Face of Using Inadequate Data. Urban For. Urban Green. 2018, 31, 56–66. [Google Scholar] [CrossRef]
- Chen, B.; Tu, Y.; Wu, S.; Song, Y.; Jin, Y.; Webster, C.; Xu, B.; Gong, P. Beyond Green Environments: Multi-Scale Difference in Human Exposure to Greenspace in China. Environ. Int. 2022, 166, 107348. [Google Scholar] [CrossRef]
- Dai, C.; Maruthaveeran, S.; Shahidan, M.F.; Chu, Y. Usage of and Barriers to Green Spaces in Disadvantaged Neighborhoods: A Case Study in Shi Jiazhuang, Hebei Province, China. Forests 2023, 14, 435. [Google Scholar] [CrossRef]
- Zou, Y.; Chen, J.; Zong, H. Is Shading a Better Way to Cool down? Evaluation and Comparison of the Cooling Capacity of Blue-Green Spaces and Urban Shade. Ecol. Indic. 2024, 167, 112688. [Google Scholar] [CrossRef]
- Feng, S.; Chen, Y.; Kou, X.; Li, C.; Chang, J. Temporal Sequence of Informal Green Space Renewal for Enhancing Equity in Urban Park Green Spaces: A Case Study in Gulou District of Xuzhou City, China. Acta Ecol. Sin. 2024, 44, 9173–9182. [Google Scholar] [CrossRef]
- Rupprecht, C.D.D.; Byrne, J.A. Informal Urban Greenspace: A Typology and Trilingual Systematic Review of Its Role for Urban Residents and Trends in the Literature. Urban For. Urban Green. 2014, 13, 597–611. [Google Scholar] [CrossRef]
- Rupprecht, C. Informal Urban Green Space: Residents’ Perception, Use, and Management Preferences across Four Major Japanese Shrinking Cities. Land 2017, 6, 59. [Google Scholar] [CrossRef]
- Kim, M.; Rupprecht, C.; Furuya, K. Residents’ Perception of Informal Green Space—A Case Study of Ichikawa City, Japan. Land 2018, 7, 102. [Google Scholar] [CrossRef]
- Gawryszewska, B.J.; Łepkowski, M.; Pietrych, Ł.; Wilczyńska, A.; Archiciński, P. The Structure of Beauty: Informal Green Spaces in Their Users’ Eyes. Sustainability 2024, 16, 1619. [Google Scholar] [CrossRef]
- Afrad, A.; Kawazoe, Y. Can Interaction with Informal Urban Green Space Reduce Depression Levels? An Analysis of Potted Street Gardens in Tangier, Morocco. Public Health 2020, 186, 83–86. [Google Scholar] [CrossRef]
- Herman, K.; Ciechanowski, L.; Przegalińska, A. Emotional Well-Being in Urban Wilderness: Assessing States of Calmness and Alertness in Informal Green Spaces (IGSs) with Muse—Portable EEG Headband. Sustainability 2021, 13, 2212. [Google Scholar] [CrossRef]
- Chen, Z.; Yang, H.; Ye, P.; Zhuang, X.; Zhang, R.; Xie, Y.; Ding, Z. How Does the Perception of Informal Green Spaces in Urban Villages Influence Residents’ Complaint Sentiments? A Machine Learning Analysis of Fuzhou City, China. Ecol. Indic. 2024, 166, 112376. [Google Scholar] [CrossRef]
- Sikorska, D.; Łaszkiewicz, E.; Krauze, K.; Sikorski, P. The Role of Informal Green Spaces in Reducing Inequalities in Urban Green Space Availability to Children and Seniors. Environ. Sci. Policy 2020, 108, 144–154. [Google Scholar] [CrossRef]
- Ke, X.; Huang, D.; Zhou, T.; Men, H. Contribution of Non-Park Green Space to the Equity of Urban Green Space Accessibility. Ecol. Indic. 2023, 146, 109855. [Google Scholar] [CrossRef]
- Pietrzyk-Kaszyńska, A.; Czepkiewicz, M.; Kronenberg, J. Eliciting Non-Monetary Values of Formal and Informal Urban Green Spaces Using Public Participation GIS. Landsc. Urban Plan. 2017, 160, 85–95. [Google Scholar] [CrossRef]
- Miao, X.; Pan, Y.; Chen, H.; Zhang, M.-J.; Hu, W.; Li, Y.; Wu, R.; Wang, P.; Fang, S.; Niu, K.; et al. Understanding Spontaneous Biodiversity in Informal Urban Green Spaces: A Local-Landscape Filtering Framework with a Test on Wall Plants. Urban For. Urban Green. 2023, 86, 127996. [Google Scholar] [CrossRef]
- Luo, S.; Patuano, A. Multiple Ecosystem Services of Informal Green Spaces: A Literature Review. Urban For. Urban Green. 2023, 81, 127849. [Google Scholar] [CrossRef]
- Archiciński, P.; Przybysz, A.; Sikorska, D.; Wińska-Krysiak, M.; Da Silva, A.R.; Sikorski, P. Conservation Management Practices for Biodiversity Preservation in Urban Informal Green Spaces: Lessons from Central European City. Land 2024, 13, 764. [Google Scholar] [CrossRef]
- Kim, M.; Rupprecht, C.D.D.; Furuya, K. Typology and Perception of Informal Green Space in Urban Interstices: A Case Study of Ichikawa City, Japan. IRSPSD Int. 2020, 8, 4–20. [Google Scholar] [CrossRef]
- Biernacka, M.; Kronenberg, J.; Łaszkiewicz, E.; Czembrowski, P.; Amini Parsa, V.; Sikorska, D. Beyond Urban Parks: Mapping Informal Green Spaces in an Urban–Peri-Urban Gradient. Land Use Policy 2023, 131, 106746. [Google Scholar] [CrossRef]
- Stanford, H.R.; Hurley, J.; Garrard, G.E.; Kirk, H. Finding the Forgotten Spaces: Using a Social-Ecological Framework to Map Informal Green Space in Melbourne, Australia. Land Use Policy 2024, 141, 107114. [Google Scholar] [CrossRef]
- Feng, S.; Kou, X.; Chang, J.; Hu, Z.; Li, C. Urban Informal Green Space: Concept, Type, Value and Updating Design Pattern. South Archit. 2022, 78–87. [Google Scholar] [CrossRef]
- CJJ/T 85-2017; Ministry of Housing and Urban-Rural Development of the People’s Republic of China. Standard for Classification of Urban Green Space. Ministry of Housing and Urban-Rural Development: Beijing, China, 2017.
- Ta, D.T.; Wang, H.; Furuya, K. The Concept of Informal Green Space in Academic Research: A Comprehensive Literature Review on the Terminology Used. Land 2025, 14, 43. [Google Scholar] [CrossRef]
- Stanford, H.R.; Garrard, G.E.; Kirk, H.; Hurley, J. A Social-Ecological Framework for Identifying and Governing Informal Greenspaces in Cities. Landsc. Urban Plan. 2022, 221, 104378. [Google Scholar] [CrossRef]
- Zhou, C. Concept Identification and Planning Strategies of Informal Urban Green Space. Chin. Landsc. Archit. 2022, 38, 50–55. [Google Scholar] [CrossRef]
- Yanfang, Z.; Jiahui, X.; Zeqi, W.; Yan, L.; Fangying, L. Research on the Renewal Potential and Strategy of Informal Green Spaces in the Context of Supply-Demand Imbalances: A Case Study Based on Gutai Central District in Fuzhou City. South Archit. 2024, 83–94. [Google Scholar] [CrossRef]
- Chen, J.; Ban, Y.; Pan, W.; Liao, Z. Optimal Design of Informal Green Spaces in Cold-Region Settlements: An Embodied Cognition Perspective. J. Asian Archit. Build. Eng. 2024, 1–13. [Google Scholar] [CrossRef]
- Rupprecht, C.D.D.; Byrne, J.A. Informal Urban Green Space as Anti-Gentrification Strategy? In Just Green Enough; Routledge: London, UK, 2017; ISBN 978-1-315-22951-5. [Google Scholar]
- Stuhlmacher, M.; Kim, Y.; Kim, J.E. The Role of Green Space in Chicago’s Gentrification. Urban For. Urban Green. 2022, 71, 127569. [Google Scholar] [CrossRef]
- Li, X.; Ma, X.; Xue, X.; Ha, K.M. Spatial Supply-Demand Evaluation and Layout Optimization for Urban Green Space: A Case Study of Xuzhou Central District. Sci. Geogr. Sin. 2019, 39, 1771–1779. [Google Scholar] [CrossRef]
- Shi, Q.; Liu, M.; Marinoni, A.; Liu, X. UGS-1m: Fine-Grained Urban Green Space Mapping of 31 Major Cities in China Based on the Deep Learning Framework. Earth Syst. Sci. Data 2023, 15, 555–577. [Google Scholar] [CrossRef]
- Zhang, Z.; Qian, Z.; Zhong, T.; Chen, M.; Zhang, K.; Yang, Y.; Zhu, R.; Zhang, F.; Zhang, H.; Zhou, F.; et al. Vectorized Rooftop Area Data for 90 Cities in China. Sci Data 2022, 9, 66. [Google Scholar] [CrossRef]
- Mallick, R.K.; Routray, J.K. Identification and Accessibility Analysis of Rural Service Centers in Kendrapara District, Orissa, India: A GIS-Based Application. Int. J. Appl. Earth Obs. Geoinf. 2001, 3, 99–105. [Google Scholar] [CrossRef]
- T/CI 026-2021; China International Association for Promotion of Science and Technology (CIAPST). Technical Specification for Green Space Extraction of Urban Agglomeration: Beijing, China, 2021.
- Apparicio, P.; Abdelmajid, M.; Riva, M.; Shearmur, R. Comparing Alternative Approaches to Measuring the Geographical Accessibility of Urban Health Services: Distance Types and Aggregation-Error Issues. Int J Health Geogr 2008, 7, 7. [Google Scholar] [CrossRef]
- Jalkanen, J.; Fabritius, H.; Vierikko, K.; Moilanen, A.; Toivonen, T. Analyzing Fair Access to Urban Green Areas Using Multimodal Accessibility Measures and Spatial Prioritization. Appl. Geogr. 2020, 124, 102320. [Google Scholar] [CrossRef]
- Zhu, Z.; Li, J.; Chen, Z. Green Space Equity: Spatial Distribution of Urban Green Spaces and Correlation with Urbanization in Xiamen, China. Environ. Dev. Sustain. 2023, 25, 423–443. [Google Scholar] [CrossRef]
- Liu, B.; Tian, Y.; Guo, M.; Tran, D.; Alwah, A.A.Q.; Xu, D. Evaluating the Disparity between Supply and Demand of Park Green Space Using a Multi-Dimensional Spatial Equity Evaluation Framework. Cities 2022, 121, 103484. [Google Scholar] [CrossRef]
- Zhao, Y.; Xu, F.; Wan, Y.L. Spatial Accessibility and Supply-Demand Balance Analysis Method of Park Green Space Based on Modified Gravity Model. J. Geo-Inf. Sci. 2022, 24, 1993–2003. [Google Scholar] [CrossRef]
- Mao, K.; Li, J.; Yan, H. Measuring the Spatial Accessibility of Parks in Wuhan, China, Using a Comprehensive Multimodal 2SFCA Method. ISPRS Int. J. Geo-Inf. 2023, 12, 357. [Google Scholar] [CrossRef]
- Xing, L.; Liu, Y.; Wang, B.; Wang, Y.; Liu, H. An Environmental Justice Study on Spatial Access to Parks for Youth by Using an Improved 2SFCA Method in Wuhan, China. Cities 2020, 96, 102405. [Google Scholar] [CrossRef]
- Cao, M.; Yao, H.; Xia, J.; Fu, G.; Chen, Y.; Wang, W.; Li, J.; Zhang, Y. Accessibility-Based Equity Assessment of Urban Parks in Beijing. J. Urban Plan. Dev. 2021, 147, 05021018. [Google Scholar] [CrossRef]
- Li, Z.; Fan, Z.; Song, Y.; Chai, Y. Assessing Equity in Park Accessibility Using a Travel Behavior-Based G2SFCA Method in Nanjing, China. J. Transp. Geogr. 2021, 96, 103179. [Google Scholar] [CrossRef]
- Tian, D.; Wang, J.; Xia, C.; Zhang, J.; Zhou, J.; Tian, Z.; Zhao, J.; Li, B.; Zhou, C. The Relationship between Green Space Accessibility by Multiple Travel Modes and Housing Prices: A Case Study of Beijing. Cities 2024, 145, 104694. [Google Scholar] [CrossRef]
- Zhang, F.; Li, D.; Ahrentzen, S.; Zhang, J. Assessing Spatial Disparities of Accessibility to Community-Based Service Resources for Chinese Older Adults Based on Travel Behavior: A City-Wide Study of Nanjing, China. Habitat Int. 2019, 88, 101984. [Google Scholar] [CrossRef]
- GB/T51346-2019; Ministry of Housing and Urban-Rural Development of the People’s Republic of China. Standard for Planning of Urban Green Space. Ministry of Housing and Urban-Rural Development: Beijing, China, 2019.
- Stanford, H.R. What to Do with the Spaces in between? The Social-Ecological Value of Informal Green Space and the Challenge of Planning the Unplanned. Landsc. Urban Plan. 2025, 259, 105372. [Google Scholar] [CrossRef]


| Classification | Subcategories | Extraction Method | |
|---|---|---|---|
| Formal green space | Urban parks | Acquired though AOI | |
| Attached green spaces | Green spaces attached to residential area | Clipped by residential AOI | |
| Municipal infrastructure attached green spaces (public attached green spaces) | Roadside green spaces | Green space for environmental protection of road extraction standard is defined according to the Technical Specification for Green Space Extraction of Urban Agglomeration (T/CI 026-2021) [49]. The buffer of the OSM road network used to clip green spaces is defined as follows: 40 m for primary and secondary roads, 20 m for tertiary roads, 10 m for residential roads. | |
| Riverside green spaces | In accordance with the planning technical stipulate in Chengdu, the river has been configured with a 50-m-wide buffer zone, designated as the green control area. The green space within this buffer zone is designated as the ecological buffer green space of the river. | ||
| Semi-public attached green spaces | Green space attached to commercial and business facilities | Clipped by AOI of hotels, markets, offices, etc. | |
| Green space attached to administrative and public service facilities | Clipped by AOI of educational institutions, healthcare facilities, government offices, stadiums, and exhibition centers. | ||
| Green space attached to transportation facilities | Clipped by AOI of transportation hubs, such as railway stations, high-speed train stations, etc. | ||
| Green space attached to public utilities facilities | Clipped by AOI of filling stations, petrol stations, fire stations, etc. | ||
| Green space attached to industrial facilities | Clipped by AOI of industrial enterprises, industrial parks, etc. | ||
| Other attached green spaces | In cases where area of interest (AOI) attribution has not been explicitly defined, the existence of green space that is partially obscured by buildings and exhibits a green space ratio of less than 35% is categorized as “other attached green space”. In contrast, if the green space ratio surpasses 35%, it is classified as informal green space in the narrow sense. | ||
| IGS in narrow the sense | |||
| G0 = Formal Green Space | G1 = G0 + Residential Attached Green Spaces | G2 = G1 + Public Attached Green Space | G3 = G2 + Narrowly Defined IGS | |
|---|---|---|---|---|
| Gini coefficient | 0.795 | 0.63 | 0.422 | 0.419 |
| Accessibility | 1.14 | 5.54 | 12.5 | 15.75 |
| G0 = Formal Green Space + Residential Attached Green Spaces | G0 + Green Space Attached to Commercial and Business Facilities | G0 + Green Space Attached to Transportation and Public Utilities Facilities | G0 + Green Space Attached to Administrative and Public Service Facilities | |
|---|---|---|---|---|
| Gini coefficient | 0.630 | 0.614 | 0.629 | 0.590 |
| Accessibility | 5.54 | 5.75 | 5.55 | 6.72 |
Disclaimer/Publisher’s Note: The statements, opinions and data contained in all publications are solely those of the individual author(s) and contributor(s) and not of MDPI and/or the editor(s). MDPI and/or the editor(s) disclaim responsibility for any injury to people or property resulting from any ideas, methods, instructions or products referred to in the content. |
© 2025 by the authors. Licensee MDPI, Basel, Switzerland. This article is an open access article distributed under the terms and conditions of the Creative Commons Attribution (CC BY) license (https://creativecommons.org/licenses/by/4.0/).
Share and Cite
Zou, Y.; Zhang, L.; Huang, W.; Chen, J. The Potential of Informal Green Space (IGS) in Enhancing Urban Green Space Accessibility and Optimization Strategies: A Case Study of Chengdu. Land 2025, 14, 1313. https://doi.org/10.3390/land14071313
Zou Y, Zhang L, Huang W, Chen J. The Potential of Informal Green Space (IGS) in Enhancing Urban Green Space Accessibility and Optimization Strategies: A Case Study of Chengdu. Land. 2025; 14(7):1313. https://doi.org/10.3390/land14071313
Chicago/Turabian StyleZou, Yu, Liwei Zhang, Wen Huang, and Jiao Chen. 2025. "The Potential of Informal Green Space (IGS) in Enhancing Urban Green Space Accessibility and Optimization Strategies: A Case Study of Chengdu" Land 14, no. 7: 1313. https://doi.org/10.3390/land14071313
APA StyleZou, Y., Zhang, L., Huang, W., & Chen, J. (2025). The Potential of Informal Green Space (IGS) in Enhancing Urban Green Space Accessibility and Optimization Strategies: A Case Study of Chengdu. Land, 14(7), 1313. https://doi.org/10.3390/land14071313