Article

Urban Green Spaces and Climate Changes: Assessing Ecosystem Services for the Municipality of Sassari (Italy)

Department of Agricultural Sciences, University of Sassari, 07100 Sassari, Italy
*
Author to whom correspondence should be addressed.
Land 2025, 14(6), 1308; https://doi.org/10.3390/land14061308
Submission received: 14 May 2025 / Revised: 11 June 2025 / Accepted: 17 June 2025 / Published: 19 June 2025

Abstract

Urban green spaces (UGS) supply a wide range of ecosystem services (ESs), which are key to mitigation and adaptation to climate changes. In this study, we focus on two ESs, i.e., greenhouse gas sequestration by terrestrial ecosystems and mitigating the heat island effect through vegetation, as defined by the Common International Classification of Ecosystem Services. The purpose is to support municipalities with characteristics similar to those of the municipality investigated in this study with a rough assessment of ESs through freely available data. The ES delivery capacity assessment relies on the adoption of two indicators: (i) increased carbon storage in forests and (ii) the Heat Island Mitigation Index (HIMI). We applied the method to the UGS of the municipality of Sassari (Italy) and found that the potential amount of carbon storage is 42,052.7 t, while the value of HIMI provided by the green spaces in the homogeneous territorial areas is 67.73%. The methodological approach adopted in this study is potentially applicable in Italian as well as Mediterranean small to medium municipalities to integrate the quantitative assessment of ESs in local planning tools. The novelty of this study lies in the applied practical approach, which is implementable by public bodies lacking data and resources, to assessing prima facie the need for operational climate adaptation and mitigation strategies.

1. Introduction

Urbanized areas are increasingly hosting humans [1,2], who are addressing the effects of a changing climate [3,4,5,6,7]. Climate changes due to human (e.g., the emission of carbon dioxide produced by the combustion of fossil fuels, increasing livestock farming, etc.) and non-human (e.g., volcanic eruptions) activities are responsible for global warming, which often implies extreme weather events such as high temperatures and excessive rainfall [8,9] or potential positive effects on crop production (e.g., cotton yields and rice growth [10,11]).
Well-known effects exacerbated by global warming include flooding, landslides, and heat waves [12,13]. Heat waves (or heat extremes), which are characterizing summer seasons around the world [14], negatively affect people’s health (e.g., dehydration and heat stroke are recurrent cause of death [15]), and are responsible for increased mortality and morbidity. In urbanized areas, the heat waves intensify their effect due to the urban heat island (UHI) [13]. In this study, we define the UHI effect as the phenomenon where “cities are warmer than their surrounding hinterlands due to the complex topography and mass of buildings, replacement of pervious vegetated surfaces with impervious built surfaces and the emission of heat from anthropogenic activities” [15]; the UHI is a noticeable feature of urban climate [16].
According to several scholars, urban green spaces (UGS) deliver a variety of ecosystem services (ESs) [17,18,19,20,21,22], including cultural services (e.g., spiritual and recreation) and regulating services (e.g., microclimate regulation and carbon sequestration). After all, the benefits supplied by green spaces are well-known from decades [23,24,25,26] and publications regarding green spaces date back to the 1970s [27]. Scientific literature proposed many definitions of ESs. According to highly cited scholars, ESs “represent the benefits human populations derive, directly or indirectly, from ecosystem functions” [28,29]. The Millennium Ecosystem Assessment defines ESs as “the benefits people obtain from ecosystems” [30]. In this study, we define ESs as intended by Rodrigues Ferreira Barbosa et al., i.e., “the ecological characteristics, functions, or processes that directly or indirectly contribute to human well-being through various pathways” [20]. UGS also deliver ecosystem disservices (EDiss), which are “defined as the negative effects of nature on human wellbeing” [31] and include plants responsible for allergies and restoration of wetlands that can increase the incidence of diseases, such as malaria [32]. Some scholars argue that a comprehensive understanding of how nature affects human well-being requires an integrated assessment of ES and EDiss and this should also lead to better sustainability policies [33].
In this study, we define ‘green space’ as “any vegetated land within an urban area, which could be publicly or privately owned and may include but is not limited to parks, landscaped streets, or residential gardens” [34]; furthermore, we use ‘green cover’ or ‘green area’ as a synonym of ‘green space’. These are of paramount relevance also considering the European Restoration Regulation (2024) [35], the EU Biodiversity Strategy for 2030, which also aims to halt the loss of green ecosystems in urban centers and promote healthy ecosystems and green infrastructure, which should be thoroughly integrated into urban planning [36], and the Sustainable Energy and Climate Action Plan as solution that partially contributes to reducing the greenhouse gases in the atmosphere and mitigating the urban heat island effect [37]. Green spaces contribute to mitigating the heat island effect [15,38,39,40] and are important for reducing atmospheric carbon dioxide, because they act as natural carbon sinks [41,42,43].
In Italy, scholars have extensively addressed research on urban green spaces according to multifaceted perspectives [44,45,46,47,48]. De Meo et al. [44] investigated the citizens’ use of green areas before and during the two lockdowns that occurred in Italy due to the Coronavirus Disease 2019 and found that the pandemic intensified the positive citizens’ perception of UGS. Giannico et al. [45] focused on the link between green spaces in residential areas and death prevention, and found that green spaces contribute to reducing deaths. Sallustio et al. [46] quantitatively estimated the relevance of green spaces in built-up (GSB) areas in Italy and found that most of them are sealed (about 55%). The surface area covered by GSB (18%) mostly consisted of forest. Speak et al. [49] focused on the pros (e.g., carbon storage and sequestration) and cons (e.g., pollen production for allergy sufferers) of using different tree species for green spaces in three Italian town squares (piazzas) in Bolzano, northern Italy. The authors set nine scenarios for each town square, which were based on the public’s perspective gathered via workshops and data acquired through a smartphone app. Among other things, the findings suggested that scenarios with larger trees supplied most ESs although larger trees were also responsible for increased ecosystem disservices (EDiss), which can be reduced with wise species selection.
The above premise emphasizes that the planning and design of UGS are relevant to providing the citizens with the maximum benefits (ESs), while avoiding or reducing pitfalls (EDiss).
Speak et al. [49] point out a general lack of data for practitioners at the municipal level, and greening programs rarely consider indicators of ESs and EDiss. Thus, pragmatic decisions are often based on a limited set of indicators. In 2022, Vidal et al. [50] recalled a study performed by Dias et al. [51], who focused on a comparative analysis of the municipal master plan strategies on public UGS in Porto and Lisboa (Portugal). Dias et al. [51] found that the lack of data is one of the main reasons that prevents adequate intervention in public UGS. In their research, which aimed at identifying groups of ESs potential in public UGS in Porto, Vidal et al. [50] remarked on the lack of data as one of the limitations of the study. Finally, Lourdes et al. [52] listed the lack of data as one of the causes why some models, e.g., recreational services, may lack accuracy. Therefore, lack of data is commonly identified by scholars as one of the limitations of research on UGS.
In a context lacking adequate data and resources, practitioners may face a variety of difficulties when they have to assign quantitative values to ESs and EDiss. As some municipalities may address lack of data when defining operational climate adaptation and mitigation strategies based on UGS, the aim of this study is to contribute to filling this research gap, by providing municipalities with climate, institutional, geographical, and other characteristics (e.g., a certain lack of data for in-depth analyses) similar to those of the municipality investigated in this study, with a methodological approach to integrate the quantitative assessment of ESs in local planning tools (e.g., municipal master plan, green plan, or green program), by considering freely available data and software (i.e., data and software accessible to anyone with Internet). So, the research question is: can we suggest to municipalities a practical approach to quantify the ESs provided by green spaces, when available data are limited? The purpose is to provide the municipalities with support for a rough assessment of ESs through freely available data and methods rooted in scientific basis. We assume this method allows for a comparative approach by pointing out the best and worst performances of similar local administrations. This may be relevant to municipalities that ask for more financial resources (e.g., the worst performing municipalities could ask for more financial resources to reduce the gap with the best performing municipalities). In this study, we focus on two ESs as defined by the Common International Classification of Ecosystem Services (CICES; [53]): (i) greenhouse gas sequestration by terrestrial ecosystems, and (ii) mitigating the heat island effect through vegetation.
The article unfolds as follows. After the literature review in Section 2, in Section 3 we describe the method. In Section 4 and Section 5, we, respectively, summarize and critically comment on the findings. In Section 6, we answer the research question, briefly summarize the main findings, and highlight the limitations of this research.

2. Green Spaces for Climate Change Adaptation and Mitigation

The interest of scholars in green spaces in facing climate change has increased over time. As an example, the Scopus database indexed 851 articles (time span 1992–2024) with the search terms “green spaces” AND “heat island” and 228 articles (time span 2003–2024: no other journal articles indexed before 2003) with “green spaces” AND “carbon sequestration” (search within Article title, Abstract, Keywords; Figure A1 in Appendix A). We performed the same research on the Web of Science (by Topic) and found 698 articles for “green spaces” AND “heat island” (time span 2000–2024) and 155 articles for “green spaces” AND “carbon sequestration” (time span 2010–2024; Figure A2 in Appendix A). Research on green spaces and heat islands increased significantly after the mid-2010s, while studies on green spaces and carbon sequestration increased after 2020. Note that we did not consider other types of publications such as conference papers, book chapters, reviews, books, and notes, nor other search engines such as Google Scholar. A detailed review of the articles is beyond the scope of this work: recent relevant reviews can be found, for example, in Dong et al. [54] and Wu et al. [55]. As a representative study, Zhao et al. [42] performed a literature review with the aim of providing an overview on the research concerning UGS as carbon sequestration measure. They used search terms such as ‘public green space’ and ‘carbon sink’ in the Web of Science core database. After applying filters on the resulting publications (time span 2007–2022), 145 out of 2950 articles were analyzed using CiteSpace. They found that the role of urban public green spaces as a measure for emission reduction and carbon sequestration has gained increasing attention over the years. Below, we provide a summary of the main research we found relevant to the objectives of this study, by stressing the methodologies adopted and the main findings.
In Lisbon (Portugal), Reis and Lopes [39] estimated the cooling potential of green spaces. They used climatic data, mobile measurements, satellite images, Geographic Information System (GIS), and NDVI. The authors found that an amount of 50 m2 of green cover (vegetation) reduces the air temperature by 1 °C. Reis and Lopes [39] argue that such a surface is the minimum area that has a certain relevance for improving the quality of the urban microclimate. Carter et al. [15] cite research of Gill et al. [40], who proved the benefits of green areas in terms of temperature reduction in Great Manchester, where the modelled surface temperatures were lower in medium density housing zones and woodlands than in the city centers [40], which were characterized by greater vegetation cover. Carter et al. [15] focused on the Oxford Road Corridor (Manchester, the UK) and discussed the partnership of stakeholders and landowners, which was aimed at improving an economic development area. To do so, the methodology consisted of two parts: the first one -a scenario-driven approach- included land cover assessment (Aerial photograph interpretation and Ordnance Survey MasterMap data), finding potential future land cover scenarios, examining climate change projections (information acquired through the Weather Generator), modelling surface temperatures (current and future); the second one regarded structured interviews involving the members of the Corridor Partnership Board. Among other things, they found that green spaces within the Oxford Road Corridor can mitigate rising temperatures and increase the quality of human life, which may be incentives for landowners and developers for investing in green areas. They also found a positive perception from the Corridor Partnership Board of the benefits brought by green spaces. Yao et al. [38] concentrated on the urban block as elementary spatial units with the purpose of investigating the role of urban green areas on affecting seasonal land surface temperatures in the urbanized region of Beijing (China). The authors used IKONOS and Landsat-8 series images in GIS environment and the ENVI (v 5.3) platform. They considered a set of factors clustered in landscape metrics of UGS (e.g., total area, patch density, etc.), urban block morphology (landscape shape index, Shannon’s diversity index, etc.), and UGS ratio. Yao et al. [38] confirmed the cooling effect of vegetation (e.g., urban forest) as solution to mitigate the UHI effect. Overall, citizens consider the shade and cooling provided by trees to be very important benefits, whose relevance is set to further increase in the expected scenario of increased frequency of heat waves [56].
Zhang et al. [41] investigated the carbon sequestration in urban green areas in Zhengzhou Green Expo Park, Zhengzhou City, Henan Province (China). The methodological approach consisted of three main processes: (i) data collection and quantification methods for carbon sequestration (photosynthetic instrument, LiDAR scanning system, soil drill, questionnaire survey, etc.); (ii) data analysis with MATLAB; and (iii) optimal strategies for increasing the carbon sequestration capacity of UGS. They found that plant density was more effective than coverage in terms of carbon sequestration, although a too high density may increase the mortality risk of individual plants. Russo et al. [57] proposed a protocol with the purpose of quantitatively assessing aboveground carbon storage and sequestration in Bolzano (Italy). The method was based on the use of context-specific allometric and dendrometrics equations and field measurements of selected trees (e.g., total and crown base height, percent missing canopy, tree circumference, etc.) and two models from the United States of America (USA). The study aimed at (i) assessing the carbon storage and sequestration through European and Italian allometric equations and local data from field measurements, and (ii) assess the performance—in terms of carbon storage and sequestration—of the context-specific method compared with the two USA models. The authors found statistical and practical differences in the three methods adopted for quantifying carbon storage and sequestration. Feng et al. [43] focused on the main urbanized areas of Xi’an (China) to assess the carbon neutrality potential of urban green spaces. They collected data consisting of (i) satellite images via the Google Earth Engine, which were used for calculating the kernel normalized difference vegetation index (kNDVI), land use classification, and surface temperature, and (ii) field sampling. The authors adopted specific equations to calculate carbon neutrality capacity estimation, carbon sequestration estimation, kNDVI, carbon emission reduction estimation, urban heat island intensity, and land surface temperature. They found that the relevance of urban green spaces in reducing carbon dioxide emissions is more relevant than the carbon sequestration capacity. The authors stated that carbon sequestration is less relevant than carbon emission reduction in terms of achieving carbon neutrality [43]. As stressed by Zhang et al. [58], urban green spaces are not always a carbon sink. The authors showed that irrigation and pesticide in the construction and maintenance of parks play a pivotal role as contributors to carbon emissions (see also [59]). Thus, the accurate selection of species and careful management of irrigation water are crucial for garden managers [58].
In this study, we cannot fully apply any of the previous approaches as it would be too demanding and time-consuming acquiring and elaborating on some key elements of the methods (i.e., software licenses, mobile measurements, IKONOS imagery, LiDAR scanning system, field sampling, and allometric equations). On the one hand, we can count on Landsat images, orthophotos, National Inventory of Forests, and Forest Carbon Reservoirs. On the other hand, we found that NDVI and GIS are adopted in previous research. Thus, we have tailored the method to our context (the municipality of Sassari) by using well-known approaches to obtain the maximum result with the minimum available data.

3. Materials and Methods

In this section, we describe the method applied to quantitatively assess ES1 (greenhouse gas sequestration by terrestrial ecosystems) and ES2 (mitigating the heat island effect through vegetation). Firstly, we describe the municipality (e.g., geographical context and planning instruments). Secondly, we state how we measured ES1 and ES2.

3.1. Case Study: The Municipality of Sassari (Italy)

The city of Sassari—120,875 inhabitants in 2023—is located in the island of Sardinia (Italy), about 10 km from the sea on a limestone plateau, a substratum that characterizes most of the neighboring areas (Figure 1). The elevation on the sea level is on average equal to 225 m in the main settlement and gradually decreases in the northwest historical region of ‘Nurra’ and the Gulf of Asinara, while the southeastern area is characterized by hilly land. Valleys and ravines alternate throughout the urban and peri-urban areas, significantly affecting the outline of the city. On the other hand, olive groves, wooded areas, and horticultural crops characterize the areas bordering the city.
The climate is typical of the geographic area and classified as inland Mediterranean, marked by mild, relatively wet, winters and dry, hot summers (Figure A3 in Appendix A provides details on average yearly temperature and yearly precipitation [60]). Average monthly temperatures range from 5 to 12 °C in the coldest months (typically, December, January, and February), and from 18 to 31 °C in the hottest months (July and August). However, the future climate scenarios of Sassari emphasized an increase in average temperature, temperature extremes, and periods with high temperatures [61]. Temperatures rarely fall below 0 °C and rainfall averages around 450–500 mm/year, but Barbato et al. [61] argue that Sassari is expected to face an increase in the intensity and frequency of extreme precipitation events.
UGS include important resources, such as the public municipal gardens. Built in 1870, these gardens span a surface area of over 29,000 m2 and are divided into three main areas, two of which are completely fenced in [62]. Another remarkable green asset is the olive grove belt. It represents a typical identitarian element of the peri-urban context and serves as a connective element between the center and the agricultural zones. The olive grove belt has prominent relevance for the agricultural and historical landscape of Sassari. In this regard, the municipal master plan (MMP) provides for interventions aimed at preserving the olive grove strip [63]. Other flora consists of Mediterranean species, e.g., Quercus ilex (holm oak), Quercus suber (cork oak), Taxus baccata (yew), Ilex aquifolium (holly), Laurus (laurel), Alaternus (alaternus), Myrtus (myrtle), Pistacia lentiscus (lentisk), Erica arborea (tree heather), and Juniperus lycia (juniper lyceum). Chamaerops humilis (dwarf palm), Centranthus ruber (Jupiter’s beard), and Calluna vulgaris (pink heather) cover smaller areas [64].
The municipality of Sassari regulates the management of green spaces through a MMP adopted in 2012 [63] and a municipal code for the protection of urban green areas (MCPUGA) adopted in 2018 [65]. The MMP aims to achieve a green system useful for connecting urban areas to peri-urban and rural areas surrounding the city. The aim is to encourage the connection and merging of these areas, with the purpose of building an urban ecological network accessible to a variety of users, also recovering small areas, but that are sufficient to create micro neighborhood parks [63]. The MMP provides rules for the use of green areas through zoning, i.e., “[the] division of a city or county by legislative regulations into areas, or zones, which specify allowable uses for real property and size restrictions for buildings within these areas” [66]. The MMP of Sassari set zones such as agricultural areas, areas for general services, protection areas, etc., (see Appendix A) that can be relevant to the purpose of this study.
On the other hand, MCPUGA aims to promote protection, safeguard, improvement, and increase of the municipal plant heritage. The document establishes rules to ensure the protection and rational management of the green areas, which include all tree, shrub, and herbaceous cover grown in flowerbeds, gardens, parks, along roads, green areas of school and cultural buildings, in municipally owned homes, in cemeteries, and in private areas set aside as greenery and/or uncultivated.
The municipality is currently devoid of a green plan and an updated official census of green spaces.

3.2. Assessing the Ecosystem Services

The procedure of assessing ESs involved four steps and was inspired by Serra et al. [67]. In step 1, the study of the context has the purpose of identifying green spaces that are candidates for supplying ESs and have potential to be included in a green infrastructure. In step 2, we selected a set of target ESs that could be relevant to mitigation and adaptation to climate changes. In step 3, we defined a set of indicators to measure the potential delivery of ESs by the green spaces. In step 4, we assessed the capacity of the green areas to supply ESs.
Step 1 focuses on the environmental and ecological characteristics of the area of interest and serves the aim of choosing the most promising green areas to be included in the potential green infrastructure. Steps 2 and 3 are the cornerstones of the assessment framework and depend on the need of mitigating and adapting to a changing climate in a context where little data is available to plan adequate strategies and measures. In this study, the green areas (components) that could be part of a green infrastructure have a key role in terms of adaptation to climate change and carbon dioxide storage measures (greenhouse gas sequestration, which is a mitigation measure). In step 3, the set of indicators depends on the availability of adequate data. Step 4 focuses on the quantitative assessment of the selected ESs. In Table 1, we list the indicators that were adopted.
We selected two ESs classified by the Common International Classification of Ecosystem Services (CICES; [53]), whose supply capacity is assessed through two indicators: increased carbon storage in forests (CICES code 2.2.6.1) and Heat Island Mitigation Index (CICES code 2.2.6.2). The reasons for choosing the selected indicators depend on the availability of data, i.e., we could count only on two sets of data for assessing the supply capacity: data retrieved from the ‘2005 National Inventory of Forests and Forest Carbon Reservoirs’ [68,69], in textual format, for assessing ES1, and satellite images [70] for ES2.

3.2.1. Greenhouse Gas Sequestration by Terrestrial Ecosystems—ES1

Urban contexts are generally not considered for this type of analysis [69] for the following reasons: the idea that the impact of land use change on ecosystem service is greatest in areas with a high naturalness; the low ecological value that is attributed to the urban ecosystem; the small size of carbon storage reservoirs, compared to actual emissions; and the very low storage capacity attributed to the urban setting [69].
As for the study area, no site-specific analyses or data on the potential carbon storage capacity were available, thus we considered data provided by the National Inventory of Forests and Forest Carbon Reservoir [68,69]. The rationale we adopted is rooted in the use of the normalized difference vegetation index (NDVI). NDVI is useful for acquiring information on vegetation cover and is largely adopted by scholars [71]. NDVI is calculated from satellite data and varies depending on the reflection of solar radiation by vegetation cover.
NDVI is expressed according to the Equation (1) [39,72]:
NDVI = N I R R E D N I R + R E D
where NIR (near-infrared—Band_08) is the measure of spectral reflectance in the near-infrared region, while RED (Red—Band_04) is the measure of spectral reflectance in the red acquired in the visible region. NDVI ranges from −1 (e.g., lakes, rivers) to +1 (e.g., rainforests or temperate forests); Huang et al. [71]. Values of NDVI in the range 0.1–0.5 characterize minimal to sparse vegetation while 0.6–1 implies areas with dense green vegetation [72,73].
The National Inventory of Forests and Forest Carbon Reservoirs provides us with three ranges of NDVI, which are linked to specific forest categories (Table 2).
According to Table 2, ‘Non-photosynthetic areas’ do not contribute to carbon storage, while low and high canopy cover have the maximum potential store capacity of 6.9 and 21.4 t · ha−1 [69].

3.2.2. Mitigating the Heat Island Effect Through Vegetation—ES2

Reis and Lopes [39] argue that urban vegetation has proved to be useful for reducing air and surface temperature. Green areas are, therefore, usually cooler than the surrounding environment: this effect is called Park Cool Island (PCI) or Cool Island Effect [39]. Typology and features of vegetation affect PCI and NDVI are commonly adopted as quantitative metrics to assess vegetation in urbanized areas [39].
In this study, we applied the Heat Island Effect Mitigation Index (HIMI; [67]) to quantitatively assess the performance of the green cover in the municipality of Sassari. HIMI lies on the ratio between Agreen and a reference surface area (A). HIMI obeys Equation (2):
HIMI = A g r e e n A × 100
where HIMI (in percentage) ranges from 0% (Agreen = 0) to 100% (Agreen = A). Agreen is the area occupied by green areas, which can be considered as potential components of green infrastructure; we consider green areas (Agreen) showing NDVI ≥ 0.429, which implies lush vegetation [67]. The value of 0.429 is also consistent with the threshold imposed by Speak and Salbitano [56], who considered 0.4, which stands for medium- to high-density greenery, excluding areas covered by patchy grass and small shrubs [56]. Finally, note that 0.429 is close to 0.488, which characterizes high canopy cover [74].
A refers to two different contexts: Azon for the surfaces occupied by green areas included in the homogeneous territorial areas (Table A1) and Apu for the peri-urban and urban contexts. The higher the HIMI, the larger the surface covered by vegetation, which implies high NDVI.
We used satellite images available online for free [70] and additional data, whose main characteristics are listed in Table 3.
Satellite data were considered for assessing both ES1 and ES2. The images date back to 29 July 2024, which fell in the hottest weeks of that summer: this is relevant to properly consider the heat island effect. Furthermore, carbon dioxide capture and storage achieve maximum values in summer. The 20 cm resolution orthophotos date back to 2019 and use the national reference system RDN2008 UTM32N, where RDN2008 means ‘Rete Dinamica Nazionale 2008’, i.e., 2008 National Dynamic Network, and UTM32N, means Universal Transverse Mercator Zone 32 North. Finally, zoning represents the most important green areas of the municipality in terms of surface area. Both ES1 and ES2 have been assessed using the surface areas occupied by urban and peri-urban areas (see Table A1). Zone E3 is the boundary (buffer) that separates the urban and peri-urban areas from the rural areas. Beyond the limit of this buffer, the surface of green areas is negligible when compared to that of the urban and peri-urban context. Data were analyzed and managed in Quantum GIS version 3.40.

4. Results

As a first step, we calculated the values of NDVI for the urban and peri-urban zones of Sassari (Figure 2).
Figure 2 shows that, especially in the western and central part, most areas are characterized by low to medium values of NDVI, while in the eastern part the values are predominantly high. In Section 3.1 and Section 3.2, we summarize the main findings concerning the quantitative assessment of ES1 and ES2, which relies on the calculated values of NDVI.

4.1. Greenhouse Gas Sequestration by Terrestrial Ecosystems

We focus on the urban and peri-urban areas set by the zoning of the MMP of Sassari. Although no data are available about the potential carbon storage capacity in the urban and peri-urban areas, the rationale for estimating the ESs is to select three classes of NDVI, which are associated with specific forest categories (Table 2, Section 2). The total amount of organic carbon is assessed by linking the NDVI to each category. Table 4 summarizes the findings.
The non-photosynthetic areas amount to 248.37 ha. According to the NDVI (values from −0.553 to −0.226), these areas are devoid of vegetation, then the quantity of carbon stored is equal to 0. The low canopy cover of 880.73 ha has a potential store capacity of about 5525 t, while the high canopy cover (1706.90 ha), has a potential store capacity of about 36,528 t. The high canopy cover absorbs 6.6 times (86.86%) carbon more than the low canopy cover (13.14%). Overall, the potential amount of carbon storage is 42,052.7 t.

4.2. Mitigating the Heat Island Effect Through Vegetation

We identified the forest areas with NDVI ≥ 0.429, which amounted to 19.21 km2 (Agreen). Then, we divided this value for the surface occupied by green areas included in the homogeneous territorial areas (28.36 km2, Azon; Table A1) and for the peri-urban and urban context (129,78 km2, Apu). We found HIMI = 67.73% for the homogeneous territorial areas and 14.80% for the peri-urban and urban context.

5. Discussion

As for ES1, the contribution provided by the high canopy cover (86.86%) is clearly higher than that provided by the low canopy cover (13.14%). This is mainly due to two reasons: the notable variety of tree species, which better assimilate atmospheric carbon dioxide and the surface area, which is almost double (1706.90 ha) if compared to the low canopy cover (880.73 ha). As for ES2, the maximum efficiency (HIMI = 100%) cannot be achieved because some areas, which are delimited as homogeneous territorial zones including a certain type of greenery, have little or no vegetation cover. The findings are comparable to those of Serra et al. [67], who found lower values of HIMI for the metropolitan city (MCC) of Cagliari (Italy). In this regard, the municipality of Sassari shows better performance than the MCC of Cagliari in terms of potential mitigation of heat island effect and this is relevant to the safeguard of people’s health [77]. The findings are strongly rooted in the NDVI, as in previous research [39,67]. However, Yao et al. pointed out that NDVI is susceptible to precipitation, temperature, and other factors [38]. Thus, although it allows us to obtain findings potentially comparable with other international research, we have to stress this limitation.
As a response to the research question, the methodology adopted in this study allowed us to quantify two ESs by considering free available data. The ESs are potentially relevant to the population living in the municipality of Sassari, if we consider that its future climate scenarios stressed an increase in average temperature, temperature extremes, and periods with high temperatures [61]. Thus, the green cover plays a pivotal role in both mitigation (greenhouse gas sequestration) and adaptation to climate change (mitigating the heat island effect). In this regard, the methodological approach is consistent with the objectives of the Sustainable Energy and Climate Action Plan in terms of making cities more climate-resilient [37].
This exercise has relevance in terms of landscape and spatial planning. The ESs we assessed are usable by local administrations (i.e., municipalities) that can count on limited financial resources to acquire data and specialists. In fact, the method proposed in this study relies on a few data available to everyone and open-source software (QGIS v. 3.32.3 Lima), which is well-documented (manuals, tutorials, videos, etc.; e.g., [78,79]). Practitioners who would like to assess the performance of the local greenery to face the effects of a changing climate may be interested in the methodological approach we proposed, as it is applicable in practice. Furthermore, we found that the municipality of Sassari lacks a green urban plan (GUP), which is necessary to protect and enhance the existing green heritage and to plan its increase [80]. The GUP is strategic for urban transformation, and is considered as a complementary tool in the context of urban planning [81,82]. However, in Italy, the GUP is not compulsory [80]. Sassari lacks an updated green census (i.e., a systematic and detailed census of the tree and shrub heritage available in private and urban green spaces), since it dates to the early 2000s. This is a critical issue as it is the fundamental tool for (i) planning new green spaces, (ii) maintenance of greening, (iii) re-developing green areas, and (iv) estimating the economic investments necessary for the maintenance and enhancement of the functionality of the green heritage [81].

6. Conclusions

In this study, we proposed and applied a methodological approach that may be adopted by Italian as well as Mediterranean municipalities to integrate the quantitative assessment of ESs in local planning tools. The purpose was to provide the municipalities with support for a rough assessment of ecosystem services (ESs) through freely available data and software. We focused on two ESs, which were assessed for the municipality of Sassari (Italy): (i) greenhouse gas sequestration by terrestrial ecosystems; and (ii) mitigating the heat island effect through vegetation. We considered the green areas belonging to both urban and peri-urban context, and the green areas included in specific zones as set by the zoning. We found that the potential amount of carbon storage is about 42,052.7 t and that the Heat Island Effect Mitigation Index (HIMI) is significantly higher in the homogeneous territorial areas than in the urban and peri-urban context.
We did not come up with innovative methods for quantifying ESs. The novelty of the study lies in the applied practical approach, which is implementable by public bodies lacking data and resources, to assess prima facie the need for climate adaptation and mitigation strategies. In other words, the approach we adopted to assess the greenhouse gas sequestration by terrestrial ecosystems through the National Inventory of Forests and Forest Carbon Reservoirs is one of the first attempts to link NDVI with specific forest categories and carbon stored per unit area in the context of Italian municipalities. Furthermore, HIMI has been applied for the first time in another study concerning a metropolitan city. Thus, we have proved that the method is replicable in other contexts.
This study has limitations. First, we had limited data and could not assess the ESs in further detail. The amount of carbon sequestration needs to be considered a rough value: we did not know the details, such as the age and health of the trees, the species involved, the volumes of the canopies, etc. Furthermore, we are not aware of the effectiveness of the green cover against the UHI effect, i.e., we did not quantify the benefits of greenery in terms of temperature reduction (absolute values) and effects on perceived temperature (e.g., the effect of shadow). Second, we used data with different resolutions/scales, and this may be relevant to uncertainty (e.g., by leading the planners into potential misinterpretations). In this regard, an updated large-scale green census and field surveys are the minimum requirements to plan reasonable measures aimed at improving the functionality of the green spaces and designing multi-functional green infrastructure. Third, we did not investigate potential ecosystem disservices resulting from an increase in green spaces. This is essential to design adequate adaptation and mitigation solutions compatible with human needs. Four, the method adopted for calculating the HIMI does not provide spatially explicit results, limiting its value for practical planning and decision-making. Future research should address and overcome these limitations.

Author Contributions

Conceptualization, A.D.M.; methodology, A.D.M. and A.L.; software, A.M. and G.C.; validation, A.L., V.S., A.M. and G.C.; formal analysis, A.M.; investigation, A.D.M. and A.L.; resources, V.S. and G.C.; data curation, A.M. and G.C.; writing—original draft preparation, A.L.; writing—review and editing, A.L. and A.D.M.; visualization, G.C. and V.S.; supervision, A.D.M. and A.L. All authors have read and agreed to the published version of the manuscript.

Funding

Andrea De Montis and Antonio Ledda are supported by the Agritech National Research Center (CN00000022, Concession Decree 1032 of 17/06/2022) and the National Biodiversity Future Center—NBFC (CN00000033, Concession Decree 1034 of 17/06/2022 adopted by the Italian Ministry of University and Research, CUP J83C22000870007), European Union Next-GenerationEU, Projects funded under the National Recovery and Resilience Plan (NRRP; Piano Nazionale di Ripresa e Resilienza), Mission 4 Component 2 Investment 1.4. This manuscript reflects only the authors’ views and opinions, and neither the European Union nor the European Commission can be considered responsible for them.

Data Availability Statement

Data are listed in Table 2 and Table 3 and in the section References.

Conflicts of Interest

The authors declare no conflicts of interest. The funders had no role in the design of the study; in the collection, analyses, or interpretation of data; in the writing of the manuscript; or in the decision to publish the results.

Abbreviations

The following abbreviations are used in this manuscript:
CICESCommon International Classification of Ecosystem Services
ESsEcosystem Services
EDissEcosystem Disservices
e.g.,‘exempli gratia’ means ‘for example’
GUPGreen Urban Plan
HIMIHeat Island Mitigation Index
i.e.,‘id est’ means ‘that is’
kNDVIKernel Normalized Difference Vegetation Index
NDVINormalized Difference Vegetation Index
MCPUGAMunicipal code for the protection of urban green areas
MMPMunicipal Master Plan
UGSUrban green spaces
UHIUrban Heat Island
PCIPark Cool Island

Appendix A

Figure A1. Articles indexed in Scopus.
Land 14 01308 g0a1
Figure A2. Articles indexed in Web of Science.
Land 14 01308 g0a2
Figure A3. Sassari: average yearly temperature and yearly precipitation (time span 2006–2022). Data concerning temperature refers to 2008–2022.
Land 14 01308 g0a3
Table A1. Zones that include green spaces that can be relevant to the purpose of this study.
Zone CodeLabelSub-Zone CodeDescription
EAgricultural areasE5.aMarginal agricultural areas that require adequate environmental conditions. These areas can also be used for low-impact agro-zootechnical and silvo-pastoral activities.
E5.cMarginal agricultural areas that require adequate environmental conditions. Areas of low agricultural importance, which are relevant to soil protection and conservation.
GAreas for general servicesG2Urban parks, sports and leisure facilities.
HProtection areasH2.8Areas of environmental and landscape value (urban valleys).
H2.9Areas of environmental and landscape value (woods and forests).
H4Green areas, which are mainly adjacent to urban and extra-urban public roads. The construction of buildings is forbidden.
SAreas for equipped public spacesS3Areas defined in the green plan and regulation such as simple green areas, neighborhood parks, etc.
S3/p‘Building credit’ areas. ‘Building credit’ means building capacity recognized after implementing measures concerning the improvement of urban, landscape, and environmental quality.
SD3 e SD4Areas for equipped public spaces in industrial areas.

References

  1. Ma, Y.; Yang, J. A Review of Methods for Quantifying Urban Ecosystem Services. Landsc. Urban Plan. 2025, 253. [Google Scholar] [CrossRef]
  2. Bayulken, B.; Huisingh, D.; Fisher, P.M.J. How Are Nature Based Solutions Helping in the Greening of Cities in the Context of Crises Such as Climate Change and Pandemics? A Comprehensive Review. J. Clean. Prod. 2021, 288, 125569. [Google Scholar] [CrossRef]
  3. Hussain, M.; Butt, A.R.; Uzma, F.; Ahmed, R.; Irshad, S.; Rehman, A.; Yousaf, B. A Comprehensive Review of Climate Change Impacts, Adaptation, and Mitigation on Environmental and Natural Calamities in Pakistan. Environ. Monit. Assess. 2020, 192, 48. [Google Scholar] [CrossRef]
  4. Khan, I.; Lei, H.; Shah, A.A.; Khan, I.; Muhammad, I. Climate Change Impact Assessment, Flood Management, and Mitigation Strategies in Pakistan for Sustainable Future. Environ. Sci. Pollut. Res. 2021, 28, 29720–29731. [Google Scholar] [CrossRef]
  5. Wu, T.; Barrett, J. Coastal Land Use Management Methodologies under Pressure from Climate Change and Population Growth. Environ. Manag. 2022, 70, 827–839. [Google Scholar] [CrossRef]
  6. Tabucanon, A.S.; Kurisu, K.; Hanaki, K. Assessment and Mitigation of Tangible Flood Damages Driven by Climate Change in a Tropical City: Hat Yai Municipality, Southern Thailand. Sci. Total Environ. 2021, 789, 147983. [Google Scholar] [CrossRef]
  7. Yang, K.; Zhang, J.; Cui, D.; Ma, Y.; Ye, Y.; He, X.; Yang, Z.; Cheng, M.; Zhang, Y. Multi-Scale Study of the Synergy between Human Activities and Climate Change on Urban Heat Islands in China. Sustain. Cities Soc. 2025, 125, 106341. [Google Scholar] [CrossRef]
  8. Laino, E.; Iglesias, G. Scientometric Review of Climate-Change Extreme Impacts on Coastal Cities. Ocean. Coast. Manag. 2023, 242, 106709. [Google Scholar] [CrossRef]
  9. Frame, D.J.; Rosier, S.M.; Noy, I.; Harrington, L.J.; Carey-Smith, T.; Sparrow, S.N.; Stone, D.A.; Dean, S.M. Climate Change Attribution and the Economic Costs of Extreme Weather Events: A Study on Damages from Extreme Rainfall and Drought. Clim. Change 2020, 162, 781–797. [Google Scholar] [CrossRef]
  10. Gérardeaux, E.; Giner, M.; Ramanantsoanirina, A.; Dusserre, J. Positive Effects of Climate Change on Rice in Madagascar. Agron. Sustain. Dev. 2012, 32, 619–627. [Google Scholar] [CrossRef]
  11. Gérardeaux, E.; Sultan, B.; Palaï, O.; Guiziou, C.; Oettli, P.; Naudin, K. Positive Effect of Climate Change on Cotton in 2050 by CO2 Enrichment and Conservation Agriculture in Cameroon. Agron. Sustain. Dev. 2013, 33, 485–495. [Google Scholar] [CrossRef]
  12. Bolan, S.; Padhye, L.P.; Jasemizad, T.; Govarthanan, M.; Karmegam, N.; Wijesekara, H.; Amarasiri, D.; Hou, D.; Zhou, P.; Biswal, B.K.; et al. Impacts of Climate Change on the Fate of Contaminants through Extreme Weather Events. Sci. Total Environ. 2024, 909, 168388. [Google Scholar] [CrossRef]
  13. Kabisch, N.; Remahne, F.; Ilsemann, C.; Fricke, L. The Urban Heat Island under Extreme Heat Conditions: A Case Study of Hannover, Germany. Sci. Rep. 2023, 13, 23017. [Google Scholar] [CrossRef]
  14. Ebi, K.L.; Capon, A.; Berry, P.; Broderick, C.; de Dear, R.; Havenith, G.; Honda, Y.; Kovats, R.S.; Ma, W.; Malik, A.; et al. Hot Weather and Heat Extremes: Health Risks. Lancet 2021, 398, 698–708. [Google Scholar] [CrossRef]
  15. Carter, J.G.; Cavan, G.; Connelly, A.; Guy, S.; Handley, J.; Kazmierczak, A. Climate Change and the City: Building Capacity for Urban Adaptation. Prog. Plan. 2015, 95, 1–66. [Google Scholar] [CrossRef]
  16. Yang, L.; Qian, F.; Song, D.-X.; Zheng, K.-J. Research on Urban Heat-Island Effect. Procedia Eng. 2016, 169, 11–18. [Google Scholar] [CrossRef]
  17. Chang, J.; Qu, Z.; Xu, R.; Pan, K.; Xu, B.; Min, Y.; Ren, Y.; Yang, G.; Ge, Y. Assessing the Ecosystem Services Provided by Urban Green Spaces along Urban Center-Edge Gradients. Sci. Rep. 2017, 7, 11226. [Google Scholar] [CrossRef]
  18. Paudel, S.; States, S.L. Urban Green Spaces and Sustainability: Exploring the Ecosystem Services and Disservices of Grassy Lawns versus Floral Meadows. Urban For. Urban Green. 2023, 84, 127932. [Google Scholar] [CrossRef]
  19. Song, P.; Kim, G.; Mayer, A.; He, R.; Tian, G. Assessing the Ecosystem Services of Various Types of Urban Green Spaces Based on I-Tree Eco. Sustainability 2020, 12, 1630. [Google Scholar] [CrossRef]
  20. Rodrigues Ferreira Barbosa, V.; Maria Damasceno, R.; Andreotti Dias, M.; Jablinski Castelhano, F.; Llacer Roig, H.; Requia, W.J. Ecosystem Services Provided by Green Areas and Their Implications for Human Health in Brazil. Ecol. Indic. 2024, 161, 111975. [Google Scholar] [CrossRef]
  21. Mao, Q.; Wang, L.; Guo, Q.; Li, Y.; Liu, M.; Xu, G. Evaluating Cultural Ecosystem Services of Urban Residential Green Spaces From the Perspective of Residents’ Satisfaction with Green Space. Front. Public Health 2020, 8, 226. [Google Scholar] [CrossRef]
  22. Pinto, L.V.; Inácio, M.; Ferreira, C.S.S.; Ferreira, A.D.; Pereira, P. Ecosystem Services and Well-Being Dimensions Related to Urban Green Spaces—A Systematic Review. Sustain. Cities Soc. 2022, 85, 104072. [Google Scholar] [CrossRef]
  23. de Vries, S.; Verheij, R.A.; Groenewegen, P.P.; Spreeuwenberg, P. Natural Environments—Healthy Environments? An Exploratory Analysis of the Relationship between Greenspace and Health. Environ. Plan. A 2003, 35, 1717–1731. [Google Scholar] [CrossRef]
  24. Swanwick, C.; Dunnett, N.; Woolley, H. Nature, Role and Value of Green Space in Towns and Cities: An Overview. Built Environ. 2003, 29, 94–106. [Google Scholar] [CrossRef]
  25. Urban Task Force. Towards an Urban Renaissance—Final Report of the Urban Task Force; Queen’s Printer and Controller of HMSO—Taylor & Francis e-Library: Abingdon, UK, 2005. [Google Scholar]
  26. Fuller, R.A.; Irvine, K.N.; Devine-Wright, P.; Warren, P.H.; Gaston, K.J. Psychological Benefits of Greenspace Increase with Biodiversity. Biol. Lett. 2007, 3, 390–394. [Google Scholar] [CrossRef]
  27. Taylor, L.; Hochuli, D.F. Defining Greenspace: Multiple Uses across Multiple Disciplines. Landsc. Urban Plan. 2017, 158, 25–38. [Google Scholar] [CrossRef]
  28. Costanza, R.; d’Arge, R.; de Groot, R.; Farber, S.; Grasso, M.; Hannon, B.; Limburg, K.; Naeem, S.; O’Neill, R.V.; Paruelo, J.; et al. The Value of the World’s Ecosystem Services and Natural Capital. Nature 1997, 387, 253–260. [Google Scholar] [CrossRef]
  29. Bolund, P.; Hunhammar, S. Ecosystem Services in Urban Areas. Ecol. Econ. 1999, 29, 293–301. [Google Scholar] [CrossRef]
  30. Millennium Ecosystem Assessment. Ecosystems and Human Well-Being: Synthesis; Island Press: Washington, DC, USA, 2005. [Google Scholar]
  31. Wu, S.; Li, B.V.; Li, S. Classifying Ecosystem Disservices and Valuating Their Effects—A Case Study of Beijing, China. Ecol. Indic. 2021, 129, 107977. [Google Scholar] [CrossRef]
  32. Shackleton, C.M.; Ruwanza, S.; Sinasson Sanni, G.K.; Bennett, S.; De Lacy, P.; Modipa, R.; Mtati, N.; Sachikonye, M.; Thondhlana, G. Unpacking Pandora’s Box: Understanding and Categorising Ecosystem Disservices for Environmental Management and Human Wellbeing. Ecosystems 2016, 19, 587–600. [Google Scholar] [CrossRef]
  33. Blanco, J.; Dendoncker, N.; Barnaud, C.; Sirami, C. Ecosystem Disservices Matter: Towards Their Systematic Integration within Ecosystem Service Research and Policy. Ecosyst. Serv. 2019, 36, 100913. [Google Scholar] [CrossRef]
  34. Garber, M.D.; Benmarhnia, T.; Zhou, W.; Mudu, P.; Rojas-Rueda, D. Greening Urban Areas in Line with Population Density and Ecological Zone Can Reduce Premature Mortality. Commun. Earth Environ. 2024, 5, 650. [Google Scholar] [CrossRef]
  35. European Parliament and Council Regulation (EU). 2024/1991 of the European Parliament and of the Council of 24 June 2024 on Nature Restoration and Amending Regulation (EU) 2022/869 (Text with EEA Relevance); European Union: Brussels, Belgium, 2024. [Google Scholar]
  36. European Commission. Communication from the Commission to the European Parliament, the Council, the European Economic and Social Committee and the Committee of the Regions EU Biodiversity Strategy for 2030 Bringing Nature Back into Our Lives; European Commission: Brussels, Belgium, 2020. [Google Scholar]
  37. Bertoldi, P. Guidebook ‘How to Develop a Sustainable Energy and Climate Action Plan (SECAP)’—Part 1—The SECAP Process, Step-By-Step Towards Low Carbon and Climate Resilient Cities by 2030; EUR 29412 EN; Publications Office of the European Union: Luxembourg, 2018; ISBN 978-92-79-96847-1. [Google Scholar]
  38. Yao, L.; Li, T.; Xu, M.; Xu, Y. How the Landscape Features of Urban Green Space Impact Seasonal Land Surface Temperatures at a City-Block-Scale: An Urban Heat Island Study in Beijing, China. Urban For. Urban Green. 2020, 52, 126704. [Google Scholar] [CrossRef]
  39. Reis, C.; Lopes, A. Evaluating the Cooling Potential of Urban Green Spaces to Tackle Urban Climate Change in Lisbon. Sustainability 2019, 11, 2480. [Google Scholar] [CrossRef]
  40. Gill, S.E.; Handley, J.F.; Ennos, A.R.; Pauleit, S. Adapting Cities for Climate Change: The Role of the Green Infrastructure. Built Environ. 2007, 33, 115–133. [Google Scholar] [CrossRef]
  41. Zhang, X.; Huang, H.; Tu, K.; Li, R.; Zhang, X.; Wang, P.; Li, Y.; Yang, Q.; Acerman, A.C.; Guo, N.; et al. Effects of Plant Community Structural Characteristics on Carbon Sequestration in Urban Green Spaces. Sci. Rep. 2024, 14, 7382. [Google Scholar] [CrossRef]
  42. Zhao, D.; Cai, J.; Xu, Y.; Liu, Y.; Yao, M. Carbon Sinks in Urban Public Green Spaces under Carbon Neutrality: A Bibliometric Analysis and Systematic Literature Review. Urban For. Urban Green. 2023, 86, 128037. [Google Scholar] [CrossRef]
  43. Feng, Y.; Fang, C.; Jia, X.; Song, P.; Zhou, L.; Xu, X.; Wang, K.; He, R.; Guo, N.; Ge, S. Dual Pathways of Carbon Neutrality in Urban Green Spaces: Assessment and Regulatory Strategies. Sustain. Cities Soc. 2025, 125, 106311. [Google Scholar] [CrossRef]
  44. De Meo, I.; Becagli, C.; Cantiani, G.M.; Casagli, A.; Paletto, A. Citizens’ Use of Public Urban Green Spaces at the Time of the COVID-19 Pandemic in Italy. Urban For. Urban Green. 2022, 77, 127739. [Google Scholar] [CrossRef]
  45. Giannico, O.V.; Sardone, R.; Bisceglia, L.; Addabbo, F.; Pirotti, F.; Minerba, S.; Mincuzzi, A. The Mortality Impacts of Greening Italy. Nat. Commun. 2024, 15, 10452. [Google Scholar] [CrossRef]
  46. Sallustio, L.; Perone, A.; Vizzarri, M.; Corona, P.; Fares, S.; Cocozza, C.; Tognetti, R.; Lasserre, B.; Marchetti, M. The Green Side of the Grey: Assessing Greenspaces in Built-up Areas of Italy. Urban For. Urban Green. 2019, 37, 147–153. [Google Scholar] [CrossRef]
  47. Ottoboni, M.; Pappalardo, S.E.; De Marchi, M.; Ungaro, F. Characterization and Mapping of Public and Private Green Areas in the Municipality of Forlì (NE Italy) Using High-Resolution Images. Land 2023, 12, 660. [Google Scholar] [CrossRef]
  48. Pantaloni, M.; Marinelli, G.; Santilocchi, R.; Minelli, A.; Neri, D. Sustainable Management Practices for Urban Green Spaces to Support Green Infrastructure: An Italian Case Study. Sustainability 2022, 14, 4243. [Google Scholar] [CrossRef]
  49. Speak, A.F.; Montagnani, L.; Solly, H.; Wellstein, C.; Zerbe, S. The Impact of Different Tree Planting Strategies on Ecosystem Services and Disservices in the Piazzas of a Northern Italian City. Urban Ecosyst. 2022, 25, 355–366. [Google Scholar] [CrossRef]
  50. Vidal, D.G.; Dias, R.C.; Teixeira, C.P.; Fernandes, C.O.; Filho, W.L.; Barros, N.; Maia, R.L. Clustering Public Urban Green Spaces through Ecosystem Services Potential: A Typology Proposal for Place-Based Interventions. Environ. Sci. Policy 2022, 132, 262–272. [Google Scholar] [CrossRef]
  51. Dias, R.C.; Vidal, D.G.; Seixas, P.C.; Maia, R.L. Os espaços verdes e as preocupações com a sustentabilidade nos Planos Diretores Municipais de 3a geração. Cid. Comunidades Territ. 2020, 41. [Google Scholar]
  52. Lourdes, K.T.; Hamel, P.; Gibbins, C.N.; Sanusi, R.; Azhar, B.; Lechner, A.M. Planning for Green Infrastructure Using Multiple Urban Ecosystem Service Models and Multicriteria Analysis. Landsc. Urban Plan. 2022, 226, 104500. [Google Scholar] [CrossRef]
  53. European Environment Agency. Common International Classification of Ecosystem Services. Available online: https://cices.eu/ (accessed on 17 June 2025).
  54. Dong, L.; Wang, Y.; Ai, L.; Cheng, X.; Luo, Y. A Review of Research Methods for Accounting Urban Green Space Carbon Sinks and Exploration of New Approaches. Front. Environ. Sci. 2024, 12, 1350185. [Google Scholar] [CrossRef]
  55. Wu, Q.; Huang, Y.; Irga, P.; Kumar, P.; Li, W.; Wei, W.; Shon, H.K.; Lei, C.; Zhou, J.L. Synergistic Control of Urban Heat Island and Urban Pollution Island Effects Using Green Infrastructure. J. Environ. Manag. 2024, 370, 122985. [Google Scholar] [CrossRef] [PubMed]
  56. Speak, A.F.; Salbitano, F. Thermal Comfort and Perceptions of the Ecosystem Services and Disservices of Urban Trees in Florence. Forests 2021, 12, 1387. [Google Scholar] [CrossRef]
  57. Russo, A.; Escobedo, F.J.; Timilsina, N.; Schmitt, A.O.; Varela, S.; Zerbe, S. Assessing Urban Tree Carbon Storage and Sequestration in Bolzano, Italy. Int. J. Biodivers. Sci. Ecosyst. Serv. Manag. 2014, 10, 54–70. [Google Scholar] [CrossRef]
  58. Zhang, Y.; Meng, W.; Yun, H.; Xu, W.; Hu, B.; He, M.; Mo, X.; Zhang, L. Is Urban Green Space a Carbon Sink or Source?—A Case Study of China Based on LCA Method. Environ. Impact Assess. Rev. 2022, 94, 106766. [Google Scholar] [CrossRef]
  59. Cech, R.; Leisch, F.; Zaller, J.G. Pesticide Use and Associated Greenhouse Gas Emissions in Sugar Beet, Apples, and Viticulture in Austria from 2000 to 2019. Agriculture 2022, 12, 879. [Google Scholar] [CrossRef]
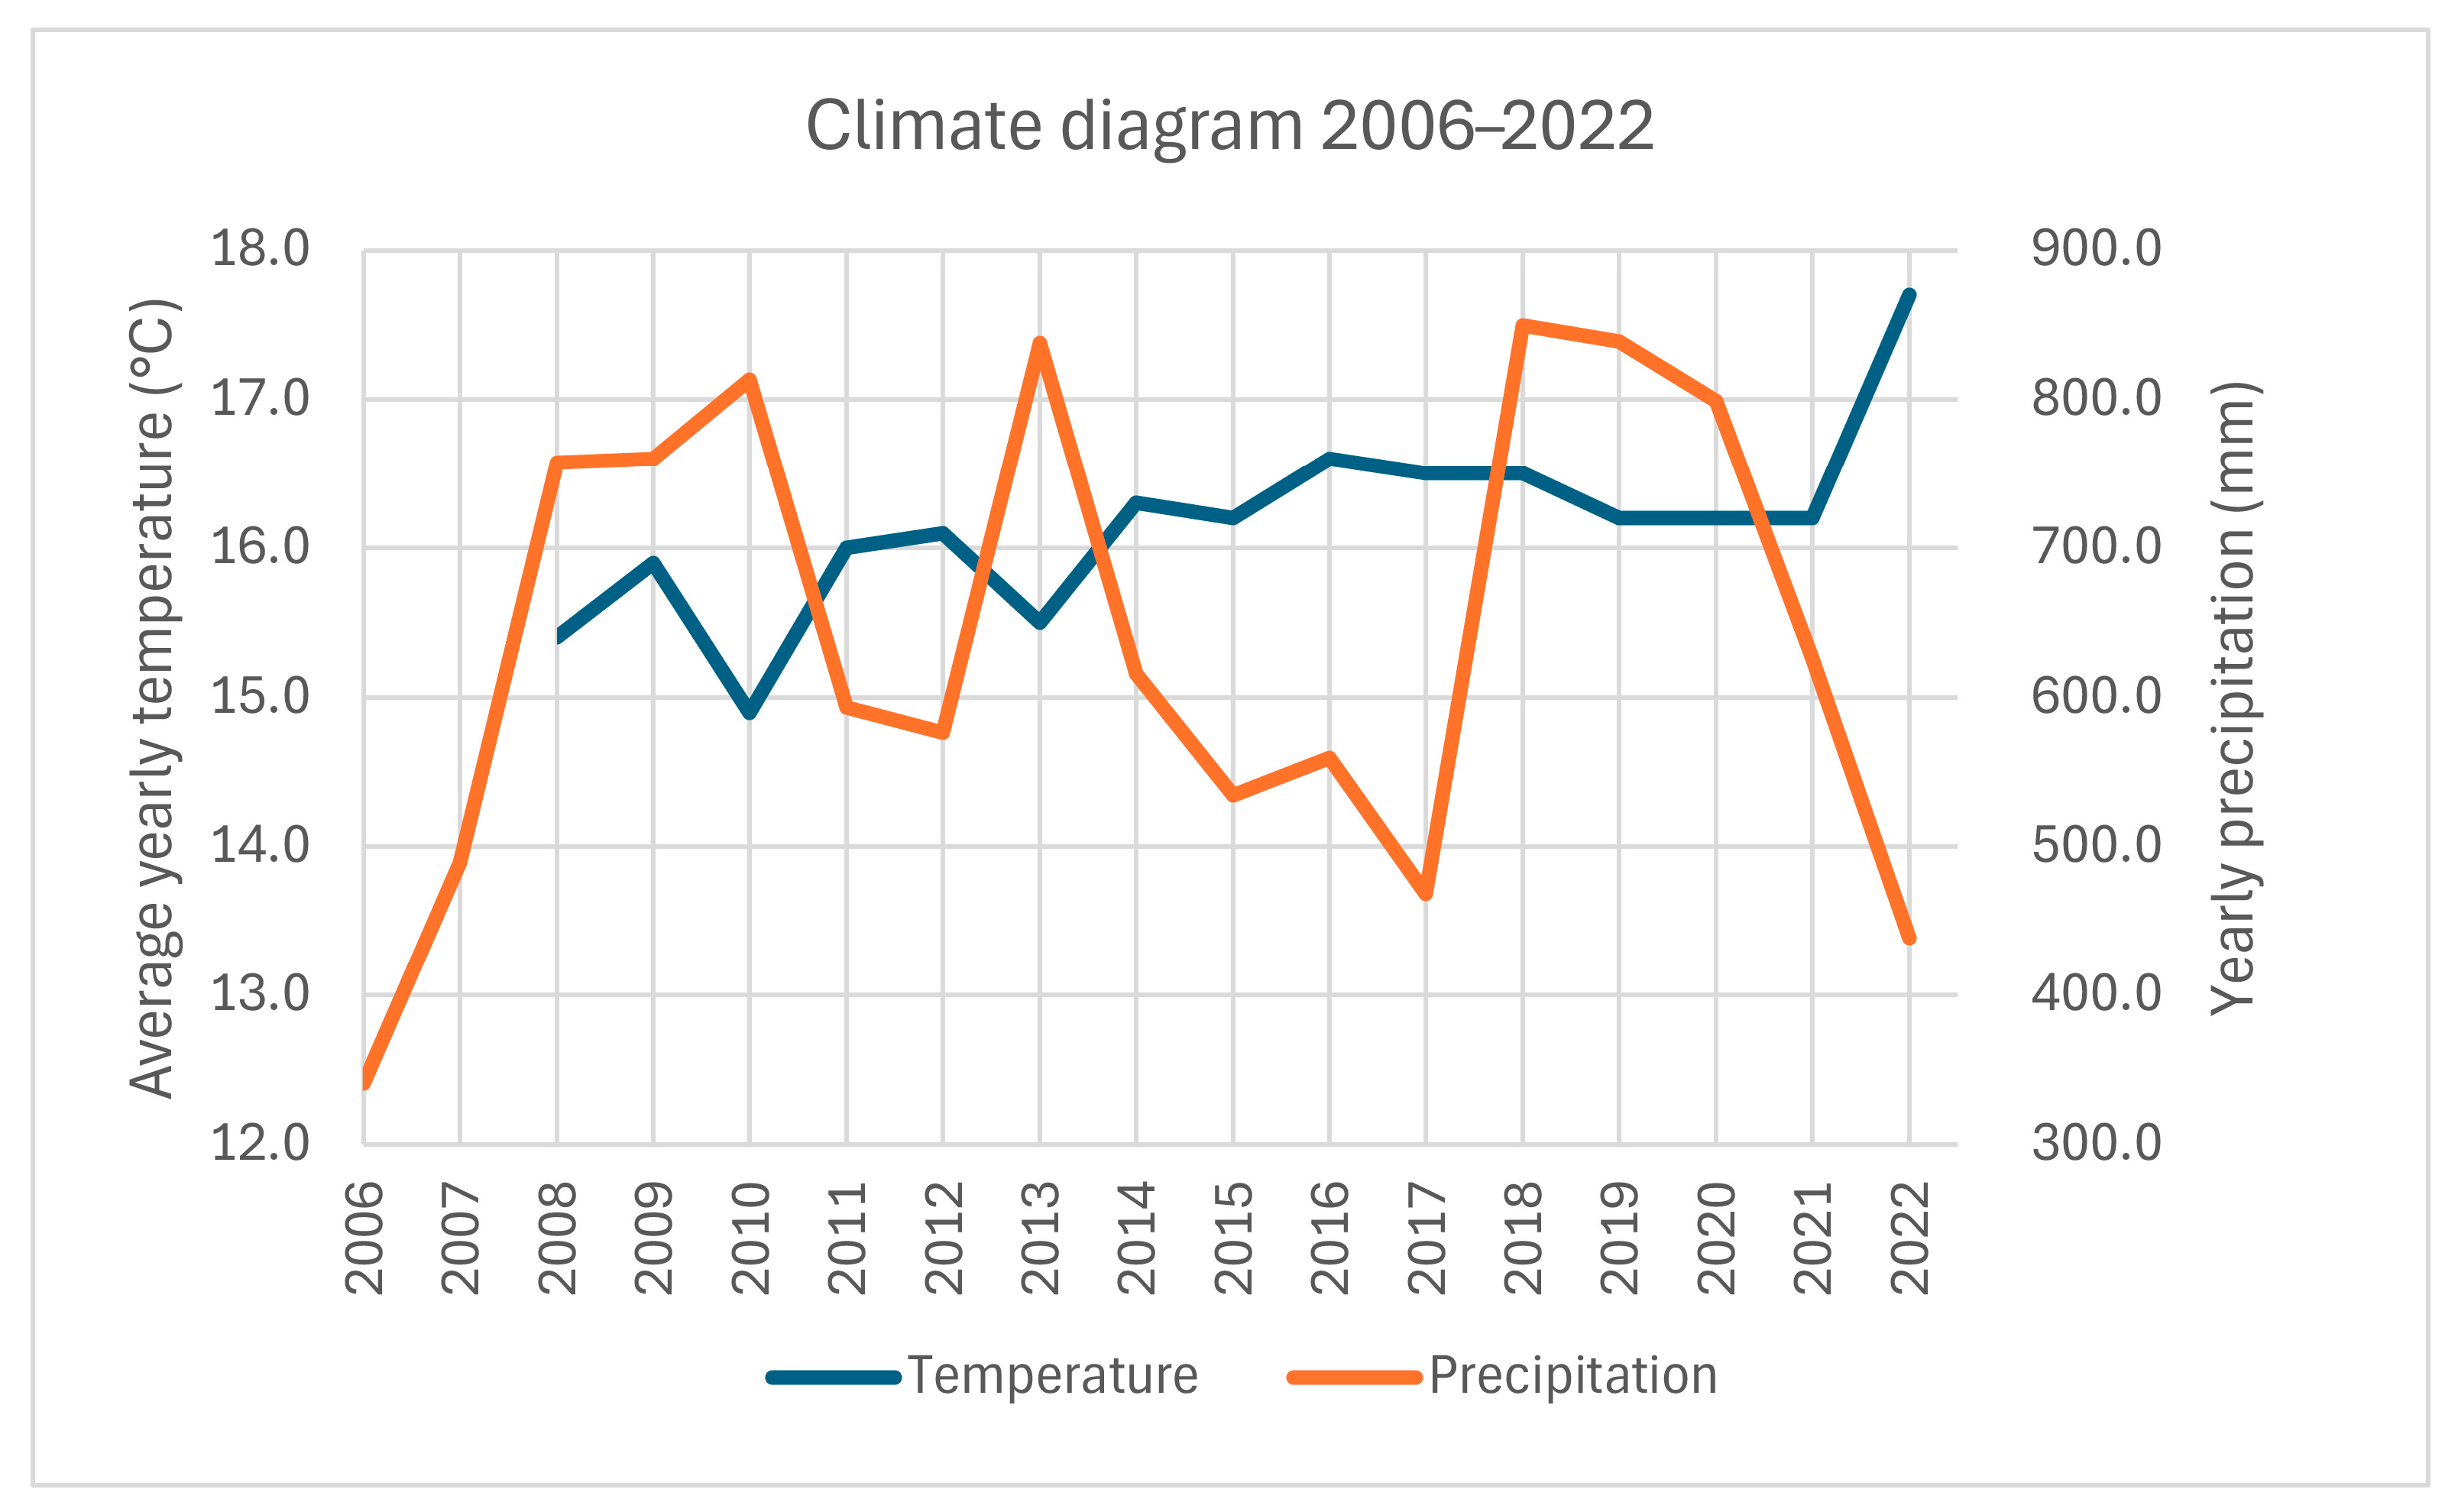
  60. Italian National Institute of Statistics. Temperatura e Precipitazione nei Comuni Capoluogo di Provincia—Anno 2022—Serie Storica 2006–2022; Italian National Institute of Statistics: Rome, Italy, 2024. [Google Scholar]
  61. Barbato, G.; Mercogliano, P.; Pugliese, A.; Marras, S. Local Climate Change Adaptation Plan for Flooding Risk. Local Climate Model for the Municipality of Sassari [Piano Locale di Adattamento Ai Cambiamenti Climatici per Il Rischio Alluvioni del Comune di Sassari. Profilo Climatico Locale per Il Comune Di Sassari]; Fondazione Centro Euro-Mediterraneo sui Cambiamenti Climatici (CMCC): Lecce, Italy, 2021. [Google Scholar]
  62. Municipality of Sassari Parco e Giardino. Comune di Sassari; Municipality of Sassari Parco e Giardino: Sassari, Italy, 2024. [Google Scholar]
  63. Piano Urbanistico Comunale (PUC). Available online: https://www.comune.sassari.it/it/amministrazione/documenti-dati/documenti-tecnici-di-supporto/pianificazione-urbanistica/piano-urbanistico-comunale/index.html (accessed on 12 May 2025).
  64. Valsecchi, F. La Flora e la Vegetazione; Amministrazione Provinciale di Sassari: Sassari, Italy, 1987. [Google Scholar]
  65. Municipality of Sassari. Municipal Code for the Protection of Urban Green Areas [Regolamento Comunale per la Tutela del Verde Urbano]; Municipality of Sassari: Sassari, Italy, 2018. [Google Scholar]
  66. Davidson, M.; Dolnick, F. (Eds.) A Planners Dictionary; American Planning Association: Chicago, IL, USA, 2004; ISBN 978-1-884829-95-3. [Google Scholar]
  67. Serra, V.; Defraia, S.; Ledda, A.; Calia, G.; Corona, F.; De Montis, A.; Mulas, M. Ecological Network, Ecosystem Services, and Green Infrastructure Planning: A Method for the Metropolitan City of Cagliari, Italy. Netw. Spat. Econ. 2025, 25, 95–120. [Google Scholar] [CrossRef]
  68. Inventario Nazionale delle Foreste e dei Serbatoi Forestali di Carbonio INFC2005. Available online: https://www.sian.it/inventarioforestale/jsp/dati_carquant_tab.jsp?menu=3 (accessed on 12 May 2025).
  69. Floris, M. I Servizi Ecosistemici Nella Pianificazione Spaziale Come Strumenti Interpretativi per la Definizione di Tassonomie Territoriali Innovative. PhD Thesis, University of Cagliari, Cagliari, Italy, 2020. [Google Scholar]
  70. Copernicus Conventional Data Access Hubs|Copernicus. Available online: https://www.copernicus.eu/en/access-data/conventional-data-access-hubs (accessed on 12 May 2025).
  71. Huang, S.; Tang, L.; Hupy, J.P.; Wang, Y.; Shao, G. A Commentary Review on the Use of Normalized Difference Vegetation Index (NDVI) in the Era of Popular Remote Sensing. J. For. Res. 2021, 32, 1–6. [Google Scholar] [CrossRef]
  72. Fathollahi, L.; Wu, F.; Melaki, R.; Jamshidi, P.; Sarwar, S. Global Normalized Difference Vegetation Index Forecasting from Air Temperature, Soil Moisture and Precipitation Using a Deep Neural Network. Appl. Comput. Geosci. 2024, 23, 100174. [Google Scholar] [CrossRef]
  73. Mehta, A.; Shukla, S.; Rakholia, S. Vegetation Change Analysis Using Normalized Difference Vegetation Index and Land Surface Temperature in Greater Gir Landscape. J. Sci. Res. 2021, 65, 1–6. [Google Scholar] [CrossRef]
  74. Tabacchi, G.; Gasparini, P. L’Inventario Nazionale delle Foreste e dei Serbatoi Forestali di Carbonio. INFC-2005. Secondo Inventario Forestale Nazionale Italiano. Metodi e Risultati. Con CD-ROM; Edagricole Calderini: Milan, Italy, 2012; ISBN 978-88-506-5394-2. [Google Scholar]
  75. Autonomous Region of Sardinia. Ortofoto AGEA 2019—Sardegna Geoportale. Available online: https://www.sardegnageoportale.it/index.php?xsl=2425&s=422381&v=2&c=14469&t=1&tb=14401 (accessed on 12 May 2025).
  76. Municipality of Sassari. Municipal Master Plan of Sassari—Zoning—Shapefile; Municipality of Sassari: Sardinia, Italy, 2012. [Google Scholar]
  77. Masselot, P.; Mistry, M.; Vanoli, J.; Schneider, R.; Iungman, T.; Garcia-Leon, D.; Ciscar, J.-C.; Feyen, L.; Orru, H.; Urban, A.; et al. Excess Mortality Attributed to Heat and Cold: A Health Impact Assessment Study in 854 Cities in Europe. Lancet Planet. Health 2023, 7, e271–e281. [Google Scholar] [CrossRef]
  78. Gandhi, U. QGIS Tutorials and Tips—QGIS Tutorials and Tips. Available online: https://www.qgistutorials.com/en/ (accessed on 12 May 2025).
  79. QGIS Project. QGIS Training Manual—QGIS Documentation Documentation. Available online: https://docs.qgis.org/3.40/en/docs/training_manual/index.html (accessed on 12 May 2025).
  80. Chiesura, A.; Bultrini, M.; De Maio, E.; Faticanti, M.; Giardi, G.; Lepore, A.; Bataloni, S.; Baldini, B.; Santonico, D.; Giordano, F.; et al. I Piani Comunali del Verde: Strumenti per Riportare la Natura Nella Nostra Vita? Istituto Superiore per la Protezione e la Ricerca Ambientale: Rome, Italy, 2024.
  81. Italian Republic. Criteri Ambientali Minimi per il Servizio di Gestione del Verde Pubblico e la Fornitura di Prodotti per la Cura del Verde. (20A01904) (GU Serie Generale n.90 del 04-04-2020). Available online: https://www.gazzettaufficiale.it/eli/id/2020/04/04/20A01904/sg (accessed on 12 May 2025).
  82. OECD. Developing an Integrated Approach to Green Infrastructure in Italy; OECD Public Governance Reviews; OECD Publishing: Paris, France, 2023; ISBN 978-92-64-41462-4. [Google Scholar]
Figure 1. Geographical context. In full grey is Italy (A). In red is the municipality of Sassari (A,B).
Land 14 01308 g001
Figure 2. Values of NDVI in peri-urban and urban contexts (boundaries in orange). The rural context (boundaries in blue) is not considered.
Land 14 01308 g002
Table 1. Ecosystem services (ESs) and selected indicators for the assessment of the delivery capacity of the UGS in the municipality of Sassari (Italy).
NEcosystem Services (ESs)Indicators
CICES CodeDescription
ES1Greenhouse gas sequestration by terrestrial ecosystems2.2.6.1Increased carbon storage in forests
ES2Mitigating the heat island effect through vegetation2.2.6.2Heat Island Mitigation Index, HIMI (based on the Normalized Difference Vegetation Index, NDVI)
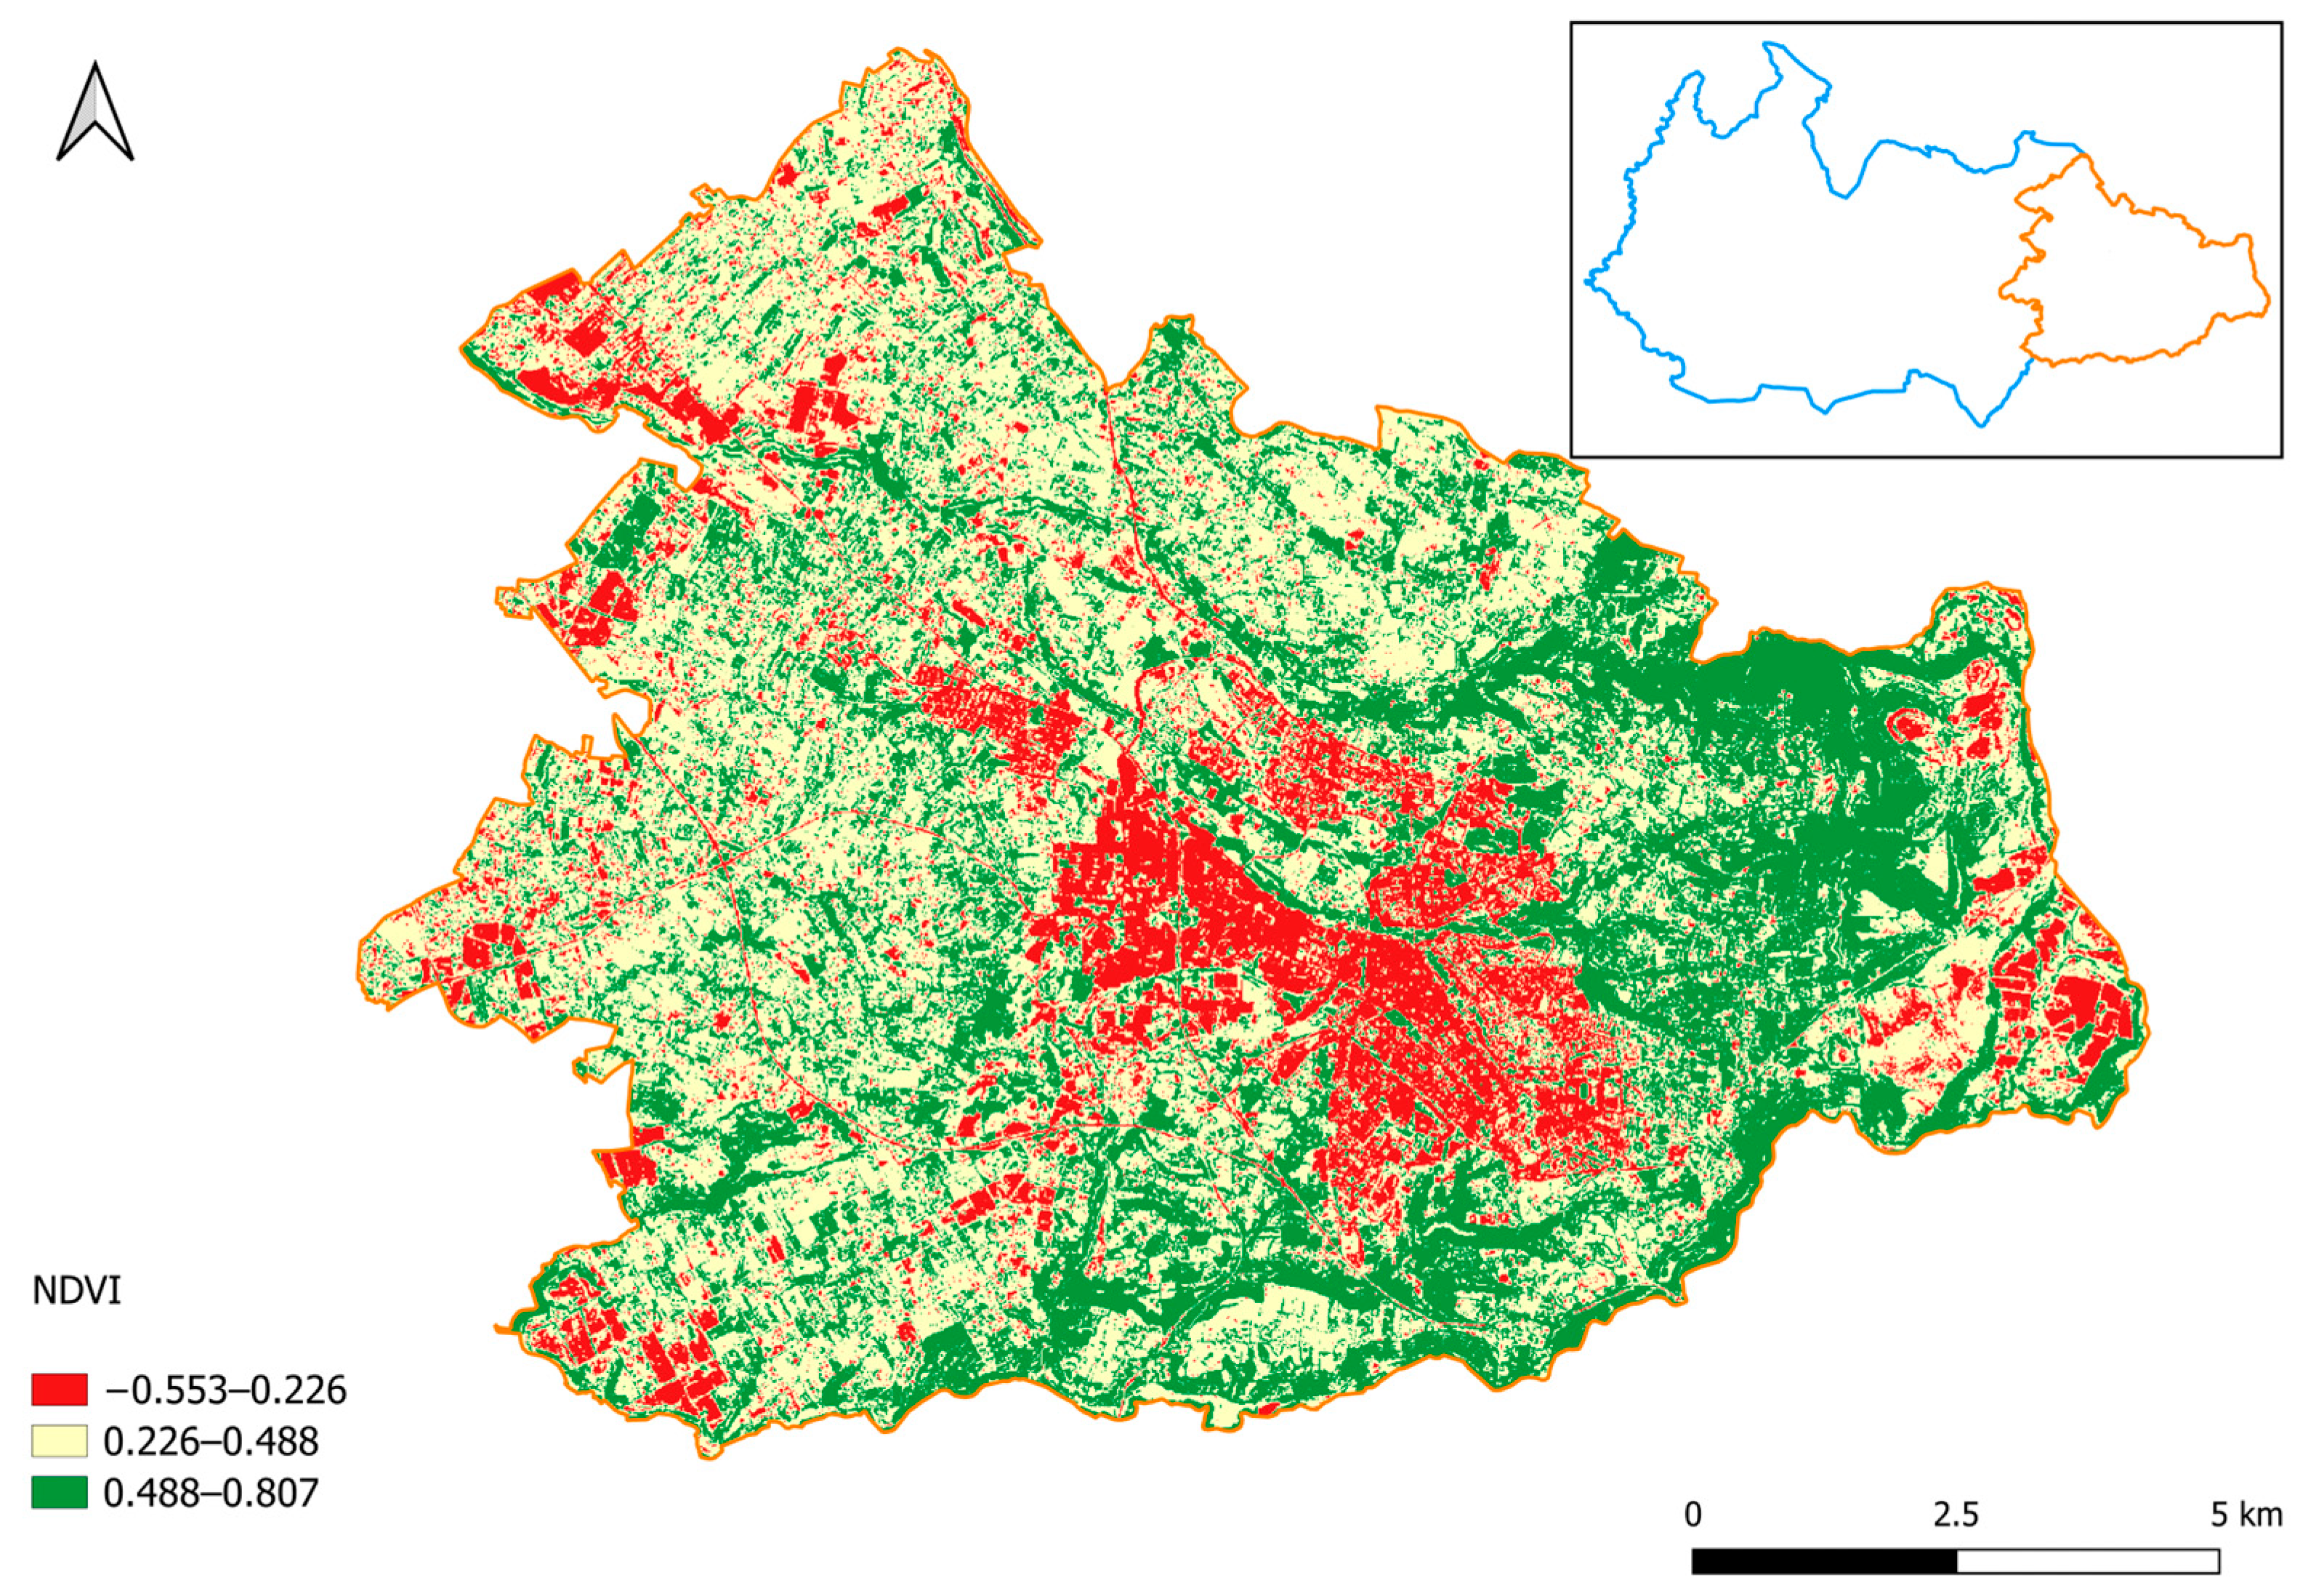
Table 2. Carbon stored per unit area (t · ha−1) according to the values of NDVI.
ClassesValues of NDVIForest CategoryCarbon Stored per Unit Area (t · ha−1)
Non-photosynthetic areas−0.553–0.226Areas devoid of vegetation0.0
Low canopy cover0.226–0.488Temperate areas devoid of topsoil6.9
High canopy cover0.488–0.807Deciduous evergreen forests21.4
Table 3. Description of the data.
DataFormatResolution/ScaleYearSource
Satellite images (Copernicus)Raster100 m2 per pixel2024[70]
OrthophotosRaster0.20 m2019[75]
Municipal master plan of Sassari—zoningShapefilescale 1:40002012[76]
Table 4. Carbon stored by low and high canopy cover.
ClassesSurface Area (ha)Carbon Stored per Unit Area
(t · ha−1)
Carbon Stored
(t)
Carbon Stored in Percentage
Non-photosynthetic areas248.370.000.000.00%
Low canopy cover880.736.905525.0413.14%
High canopy cover1706.9021.4036,527.6686.86%
Total2836.00 42,052.70100.00%
Disclaimer/Publisher’s Note: The statements, opinions and data contained in all publications are solely those of the individual author(s) and contributor(s) and not of MDPI and/or the editor(s). MDPI and/or the editor(s) disclaim responsibility for any injury to people or property resulting from any ideas, methods, instructions or products referred to in the content.

