


An Assessment of University Campus Morphological Resilience Under Typical Disaster Scenarios: A Case Study of the Two Campuses of Tianjin University

Abstract
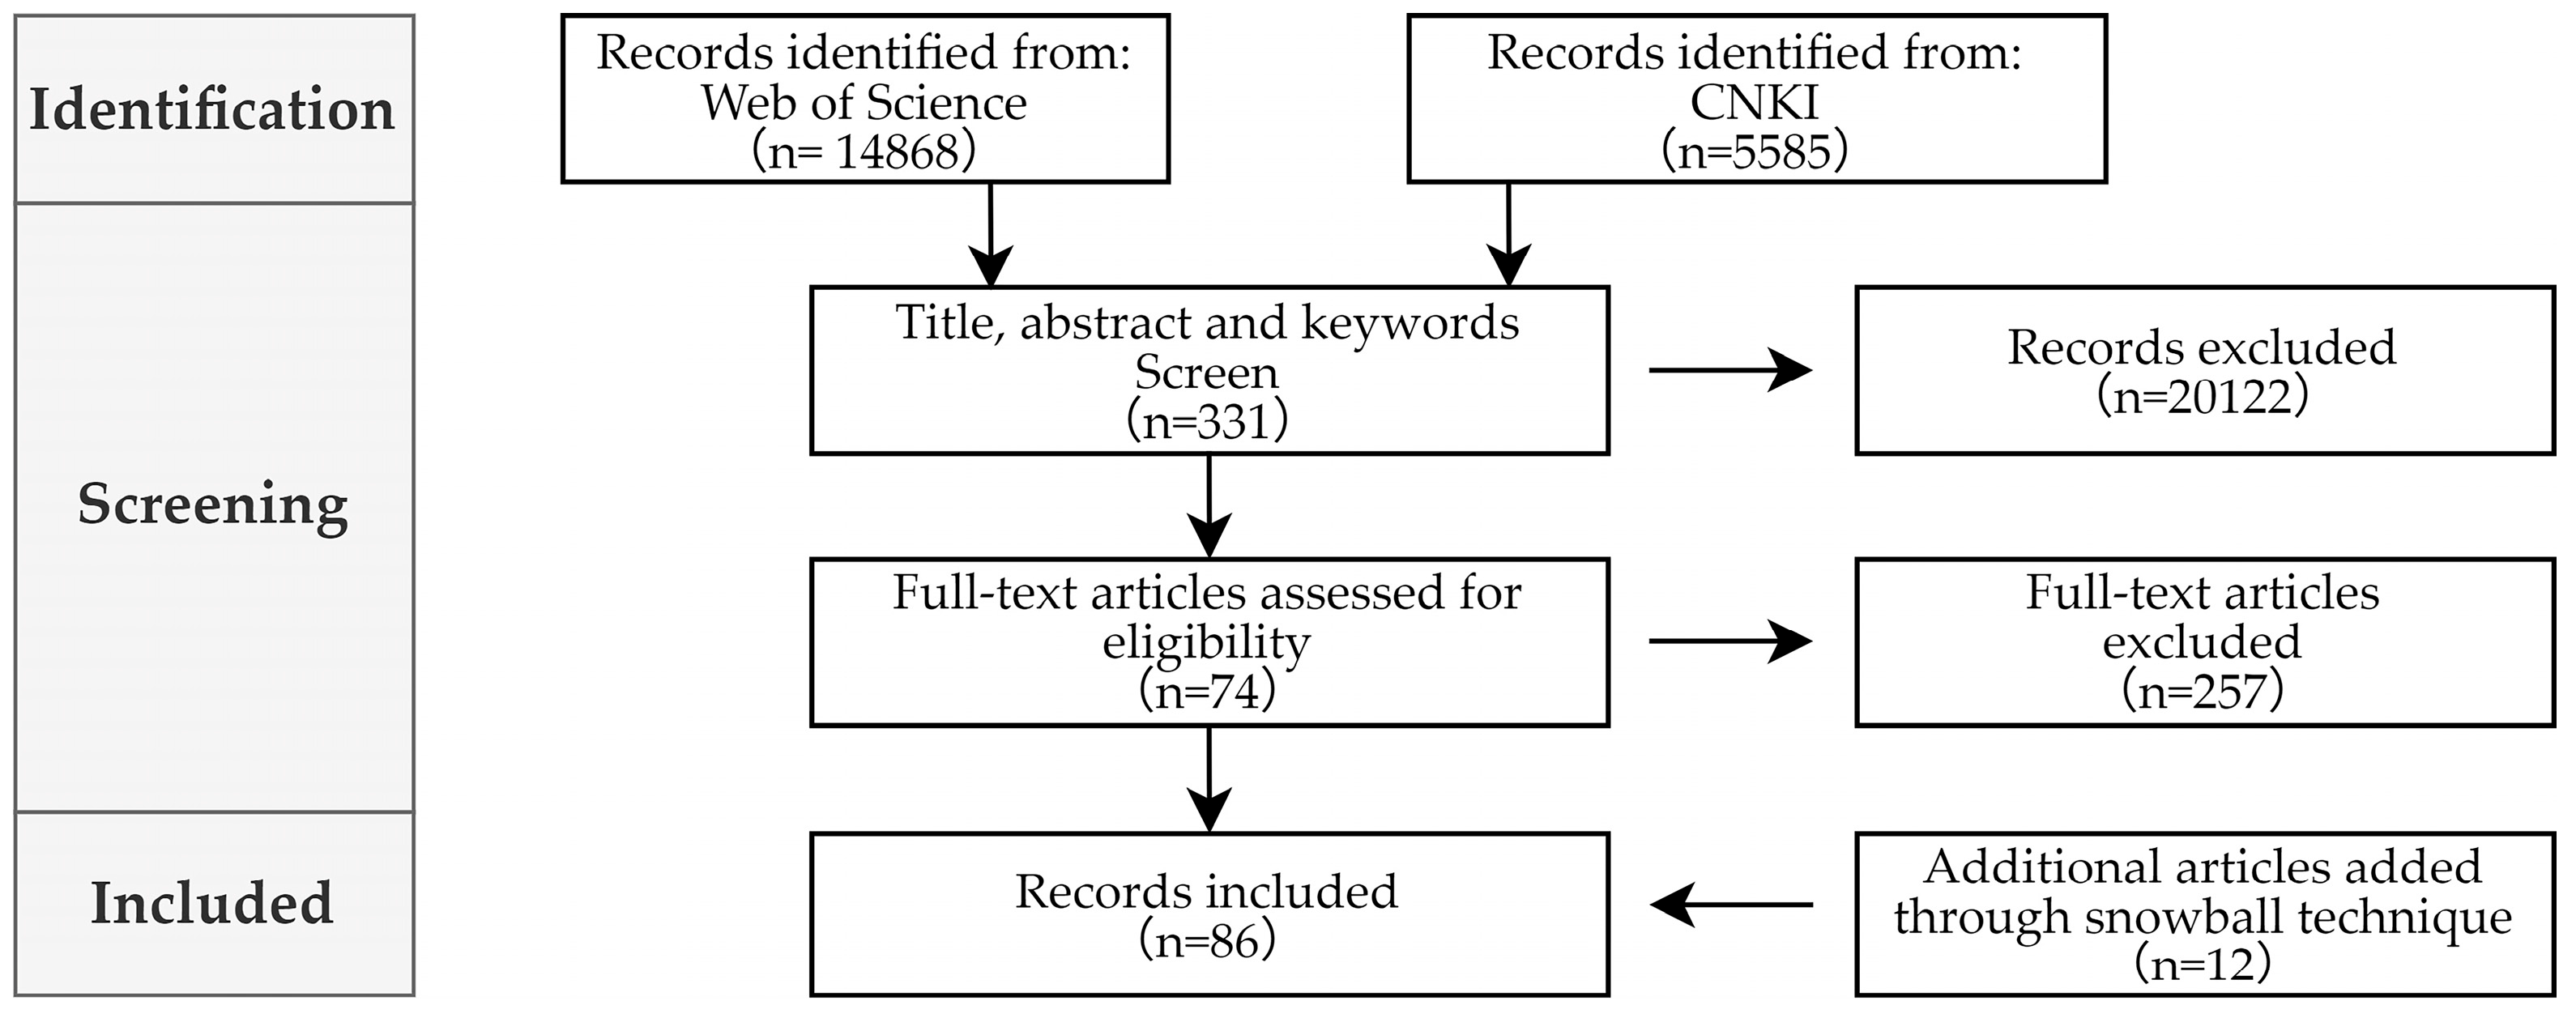
1. Introduction
- Theoretically, the concept of UCMR and a systematic theoretical framework have not been articulated, hindering the development of quantitative evaluation tools.
- Methodologically, reliance on low-resolution remote sensing and open-source cartographic data constrains the spatial accuracy of UCMR assessments. In contrast, UAV photogrammetry integrates low-cost operation, flexible deployment, rapid data acquisition, and centimeter-level spatial resolution, enabling the efficient collection of multi-angle 3D morphological data on campus buildings and terrain to support high-precision resilience assessments.
- What is the conceptual definition of UCMR, and how is it connected to campus morphology and disaster risk dynamics?
- How can UCMR be precisely quantified under multi-disaster scenarios, particularly regarding spatial heterogeneity?
- What are the UCMR differences between legacy and newly built campuses under compound disaster scenarios, and what context-specific strategies can be developed to enhance UCMR?
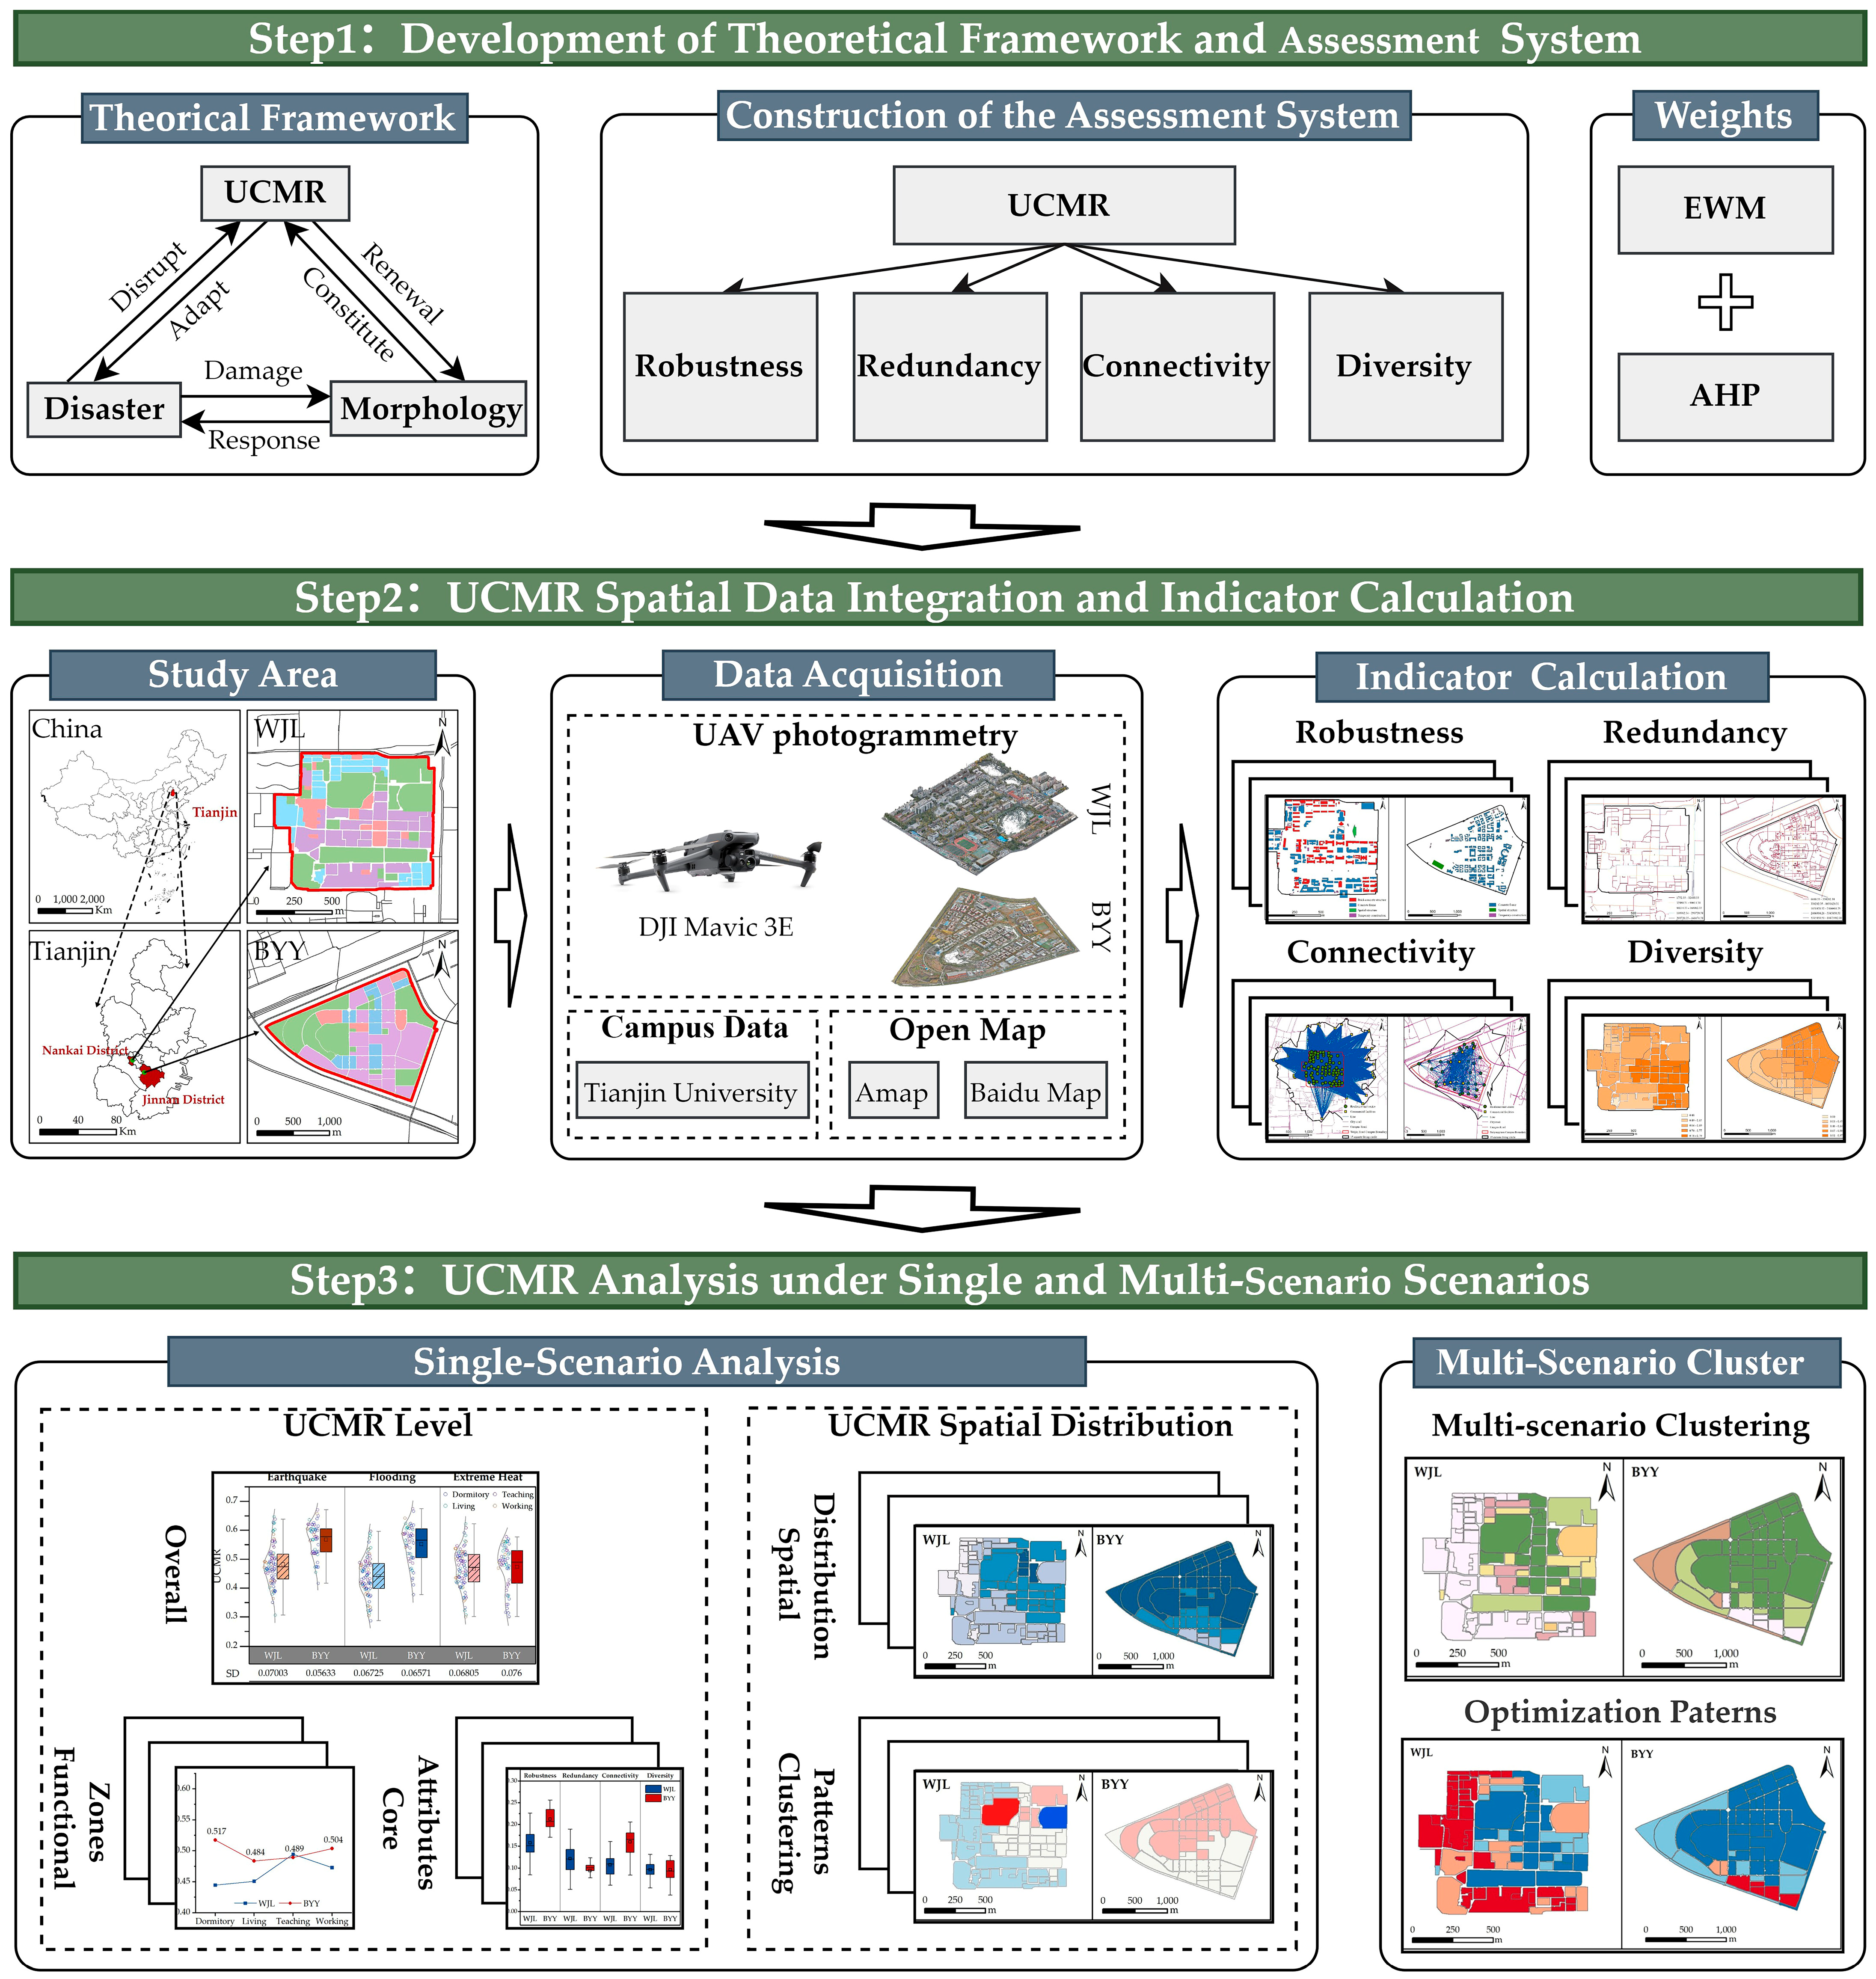
2. Theoretical Framework for UCMR
2.1. The Interactions Between Campus Morphology and Disaster Risk
2.2. Concept Definition of UCMR
2.3. Mechanism of UCMR
3. Materials and Methods
3.1. Study Area and Data Sources
3.2. Construction of the Assessment System
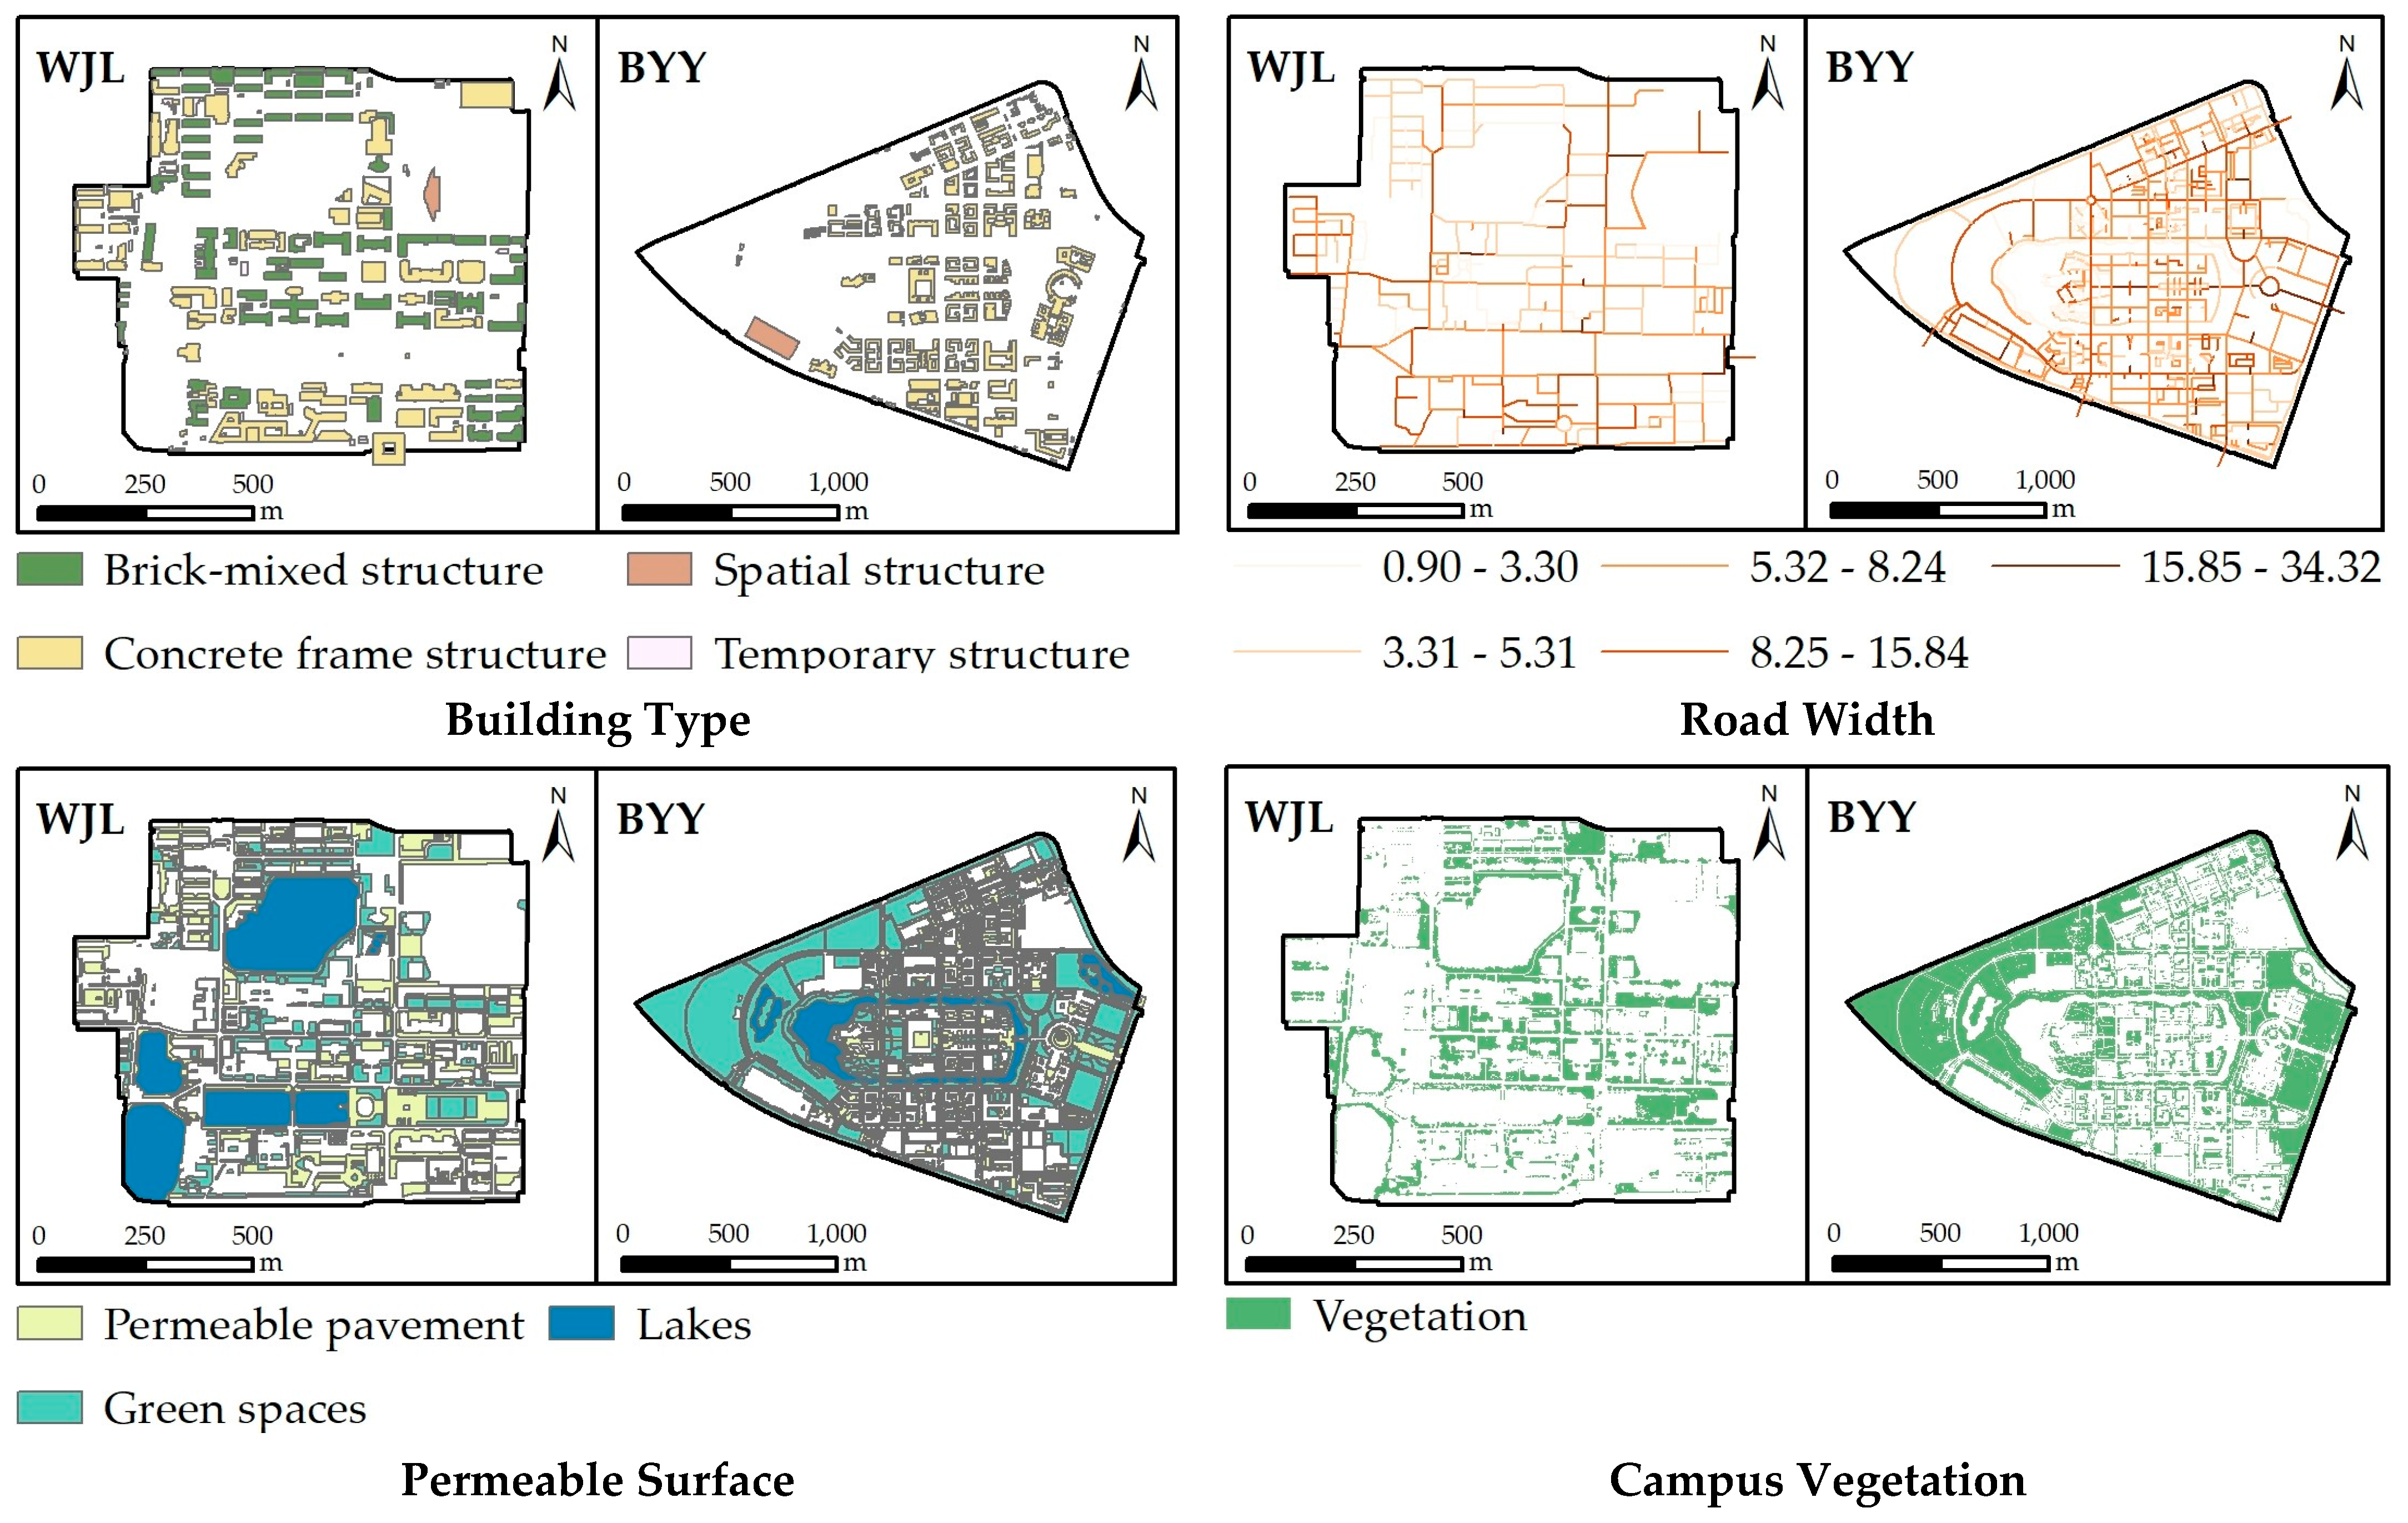
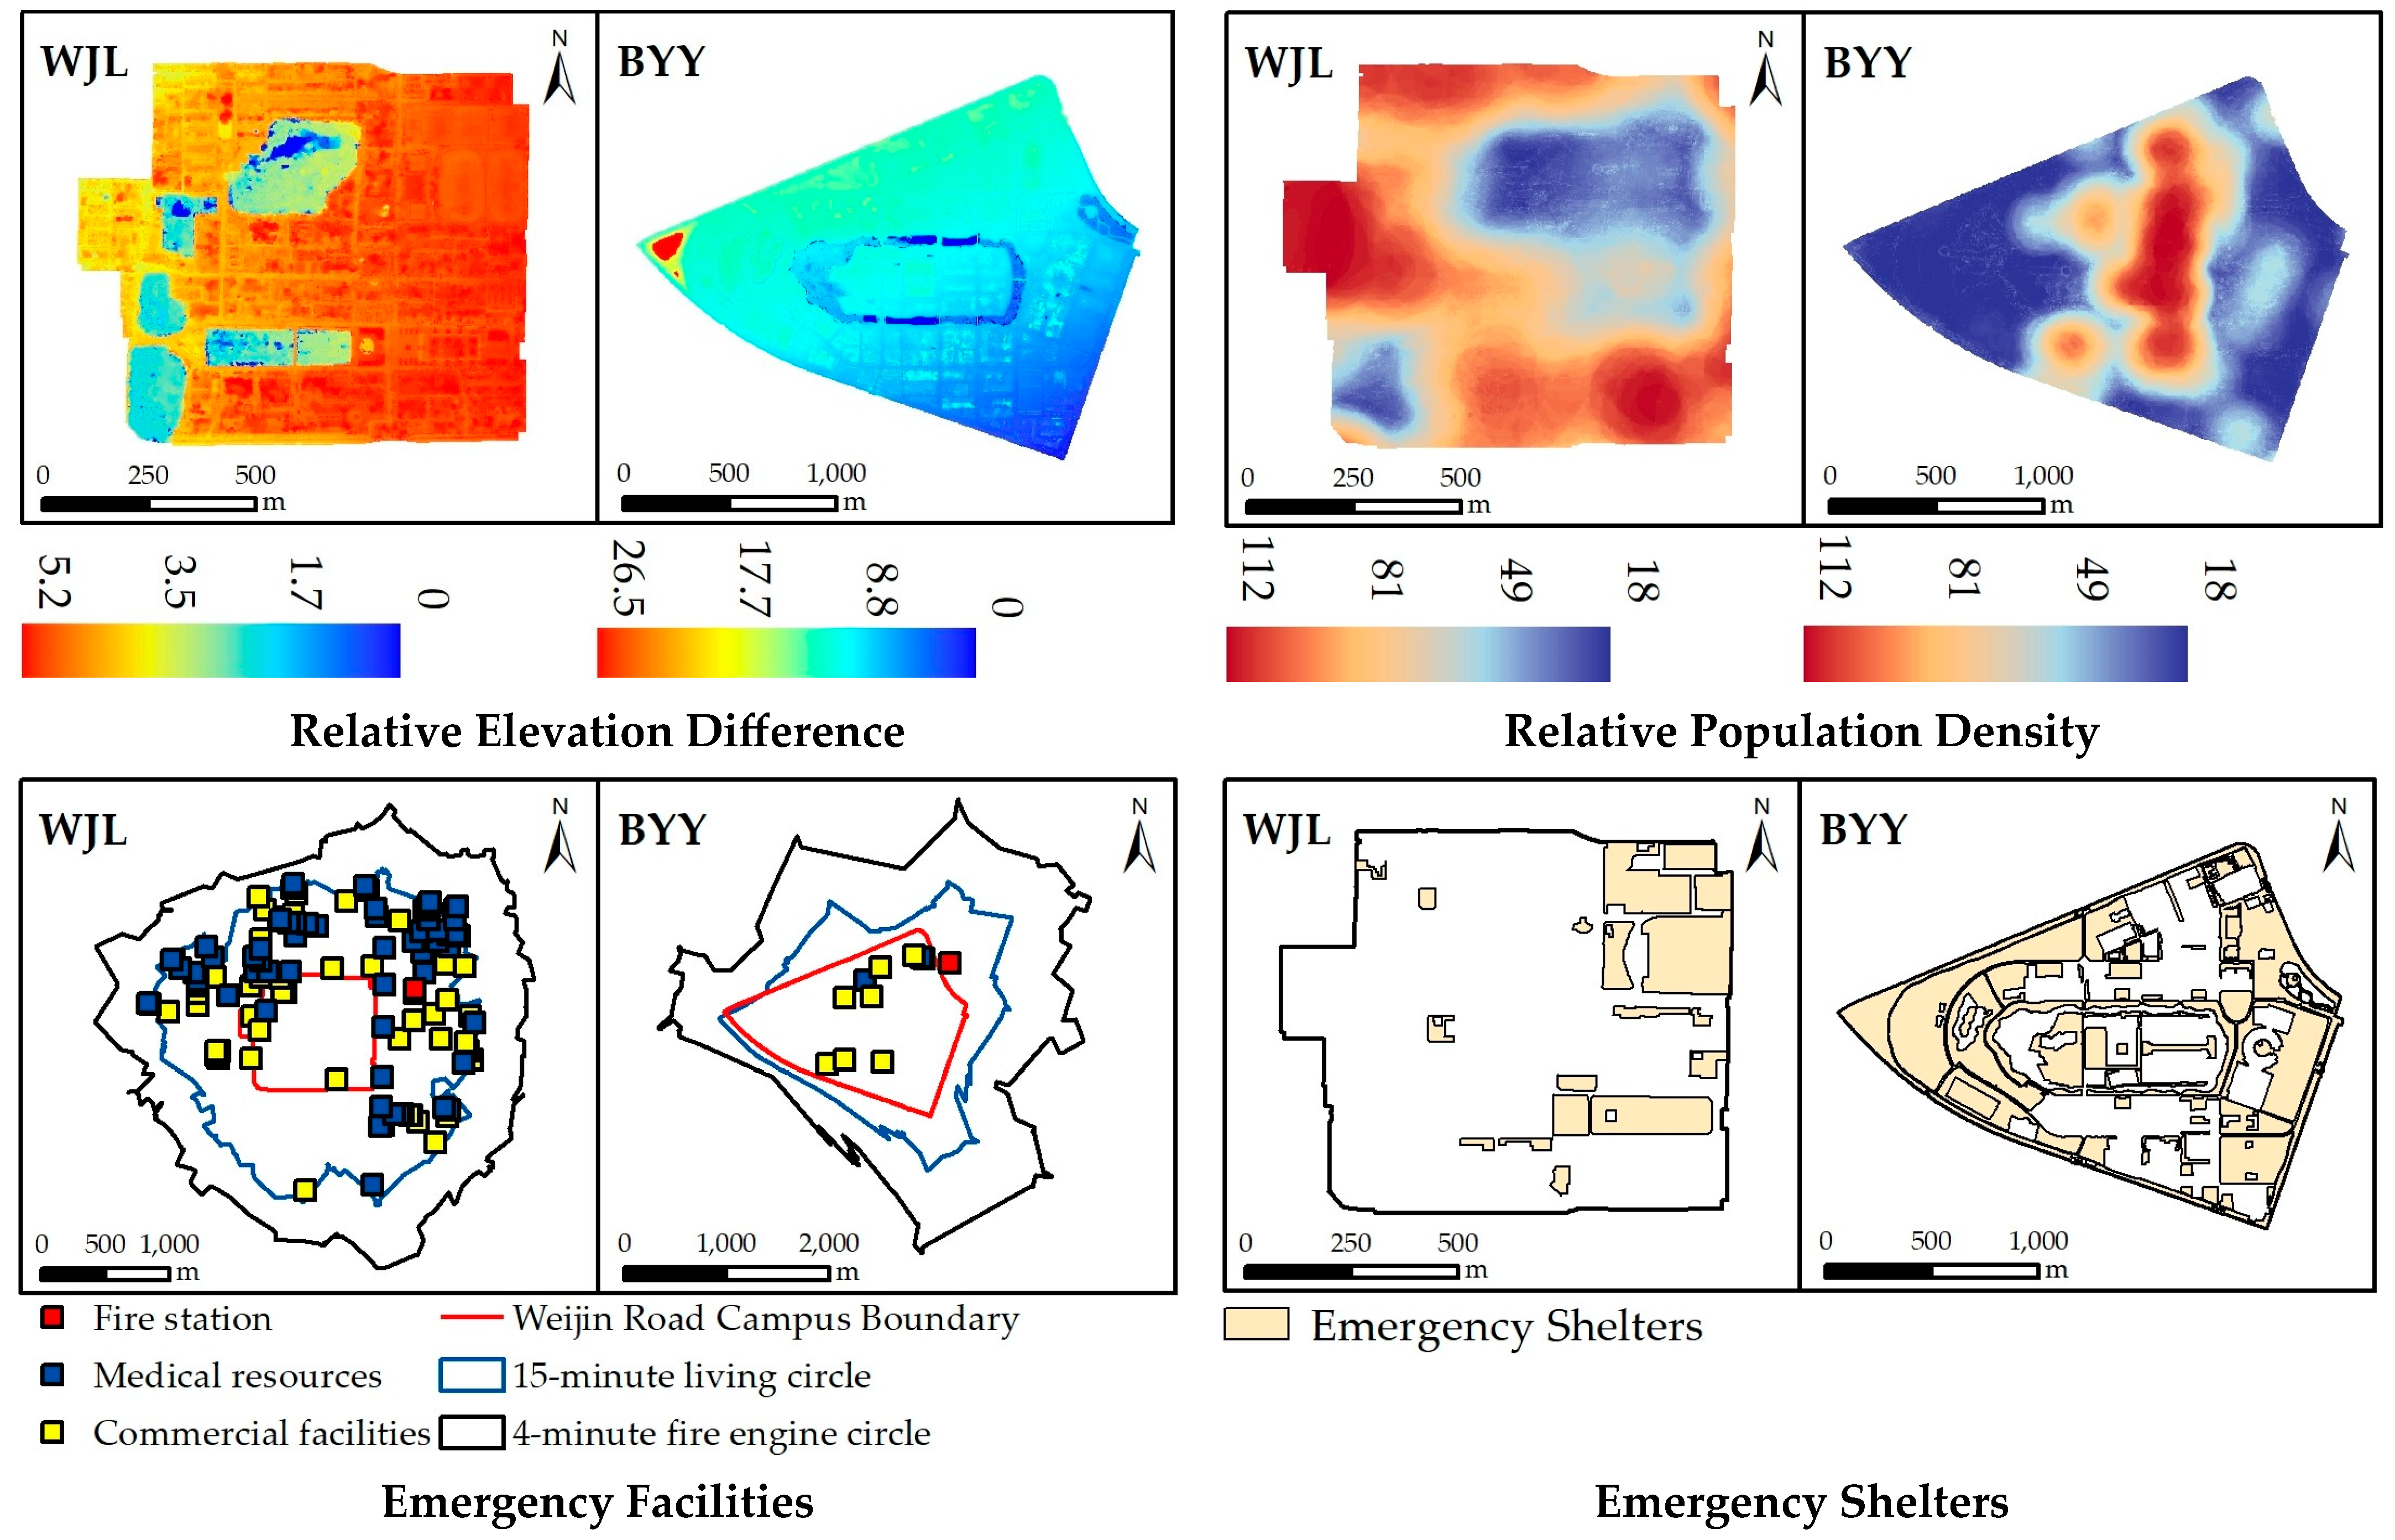
3.2.1. Robustness-Related University Campus Morphological Indicators
3.2.2. Redundancy-Related University Campus Morphological Indicators
3.2.3. Connectivity-Related University Campus Morphological Indicators
3.2.4. Diversity-Related University Campus Morphological Indicators
3.3. Weight Calculation Method
4. Results
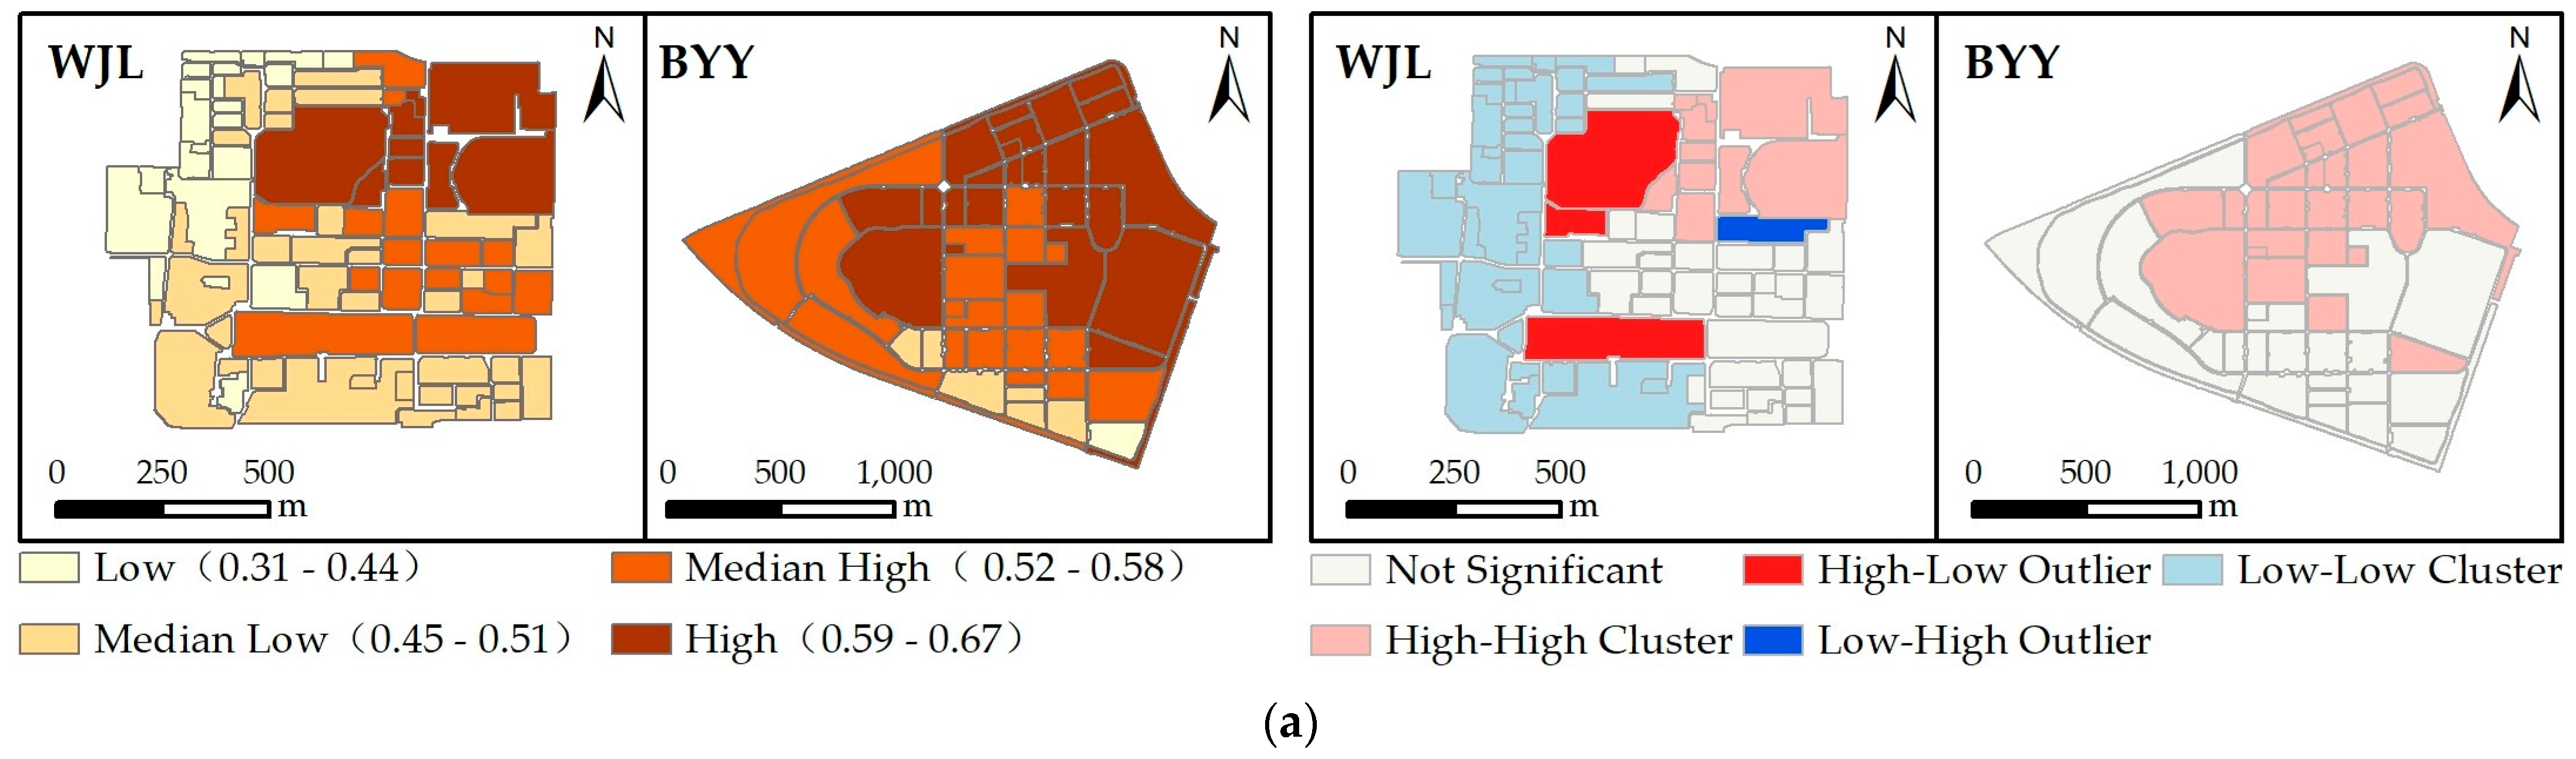
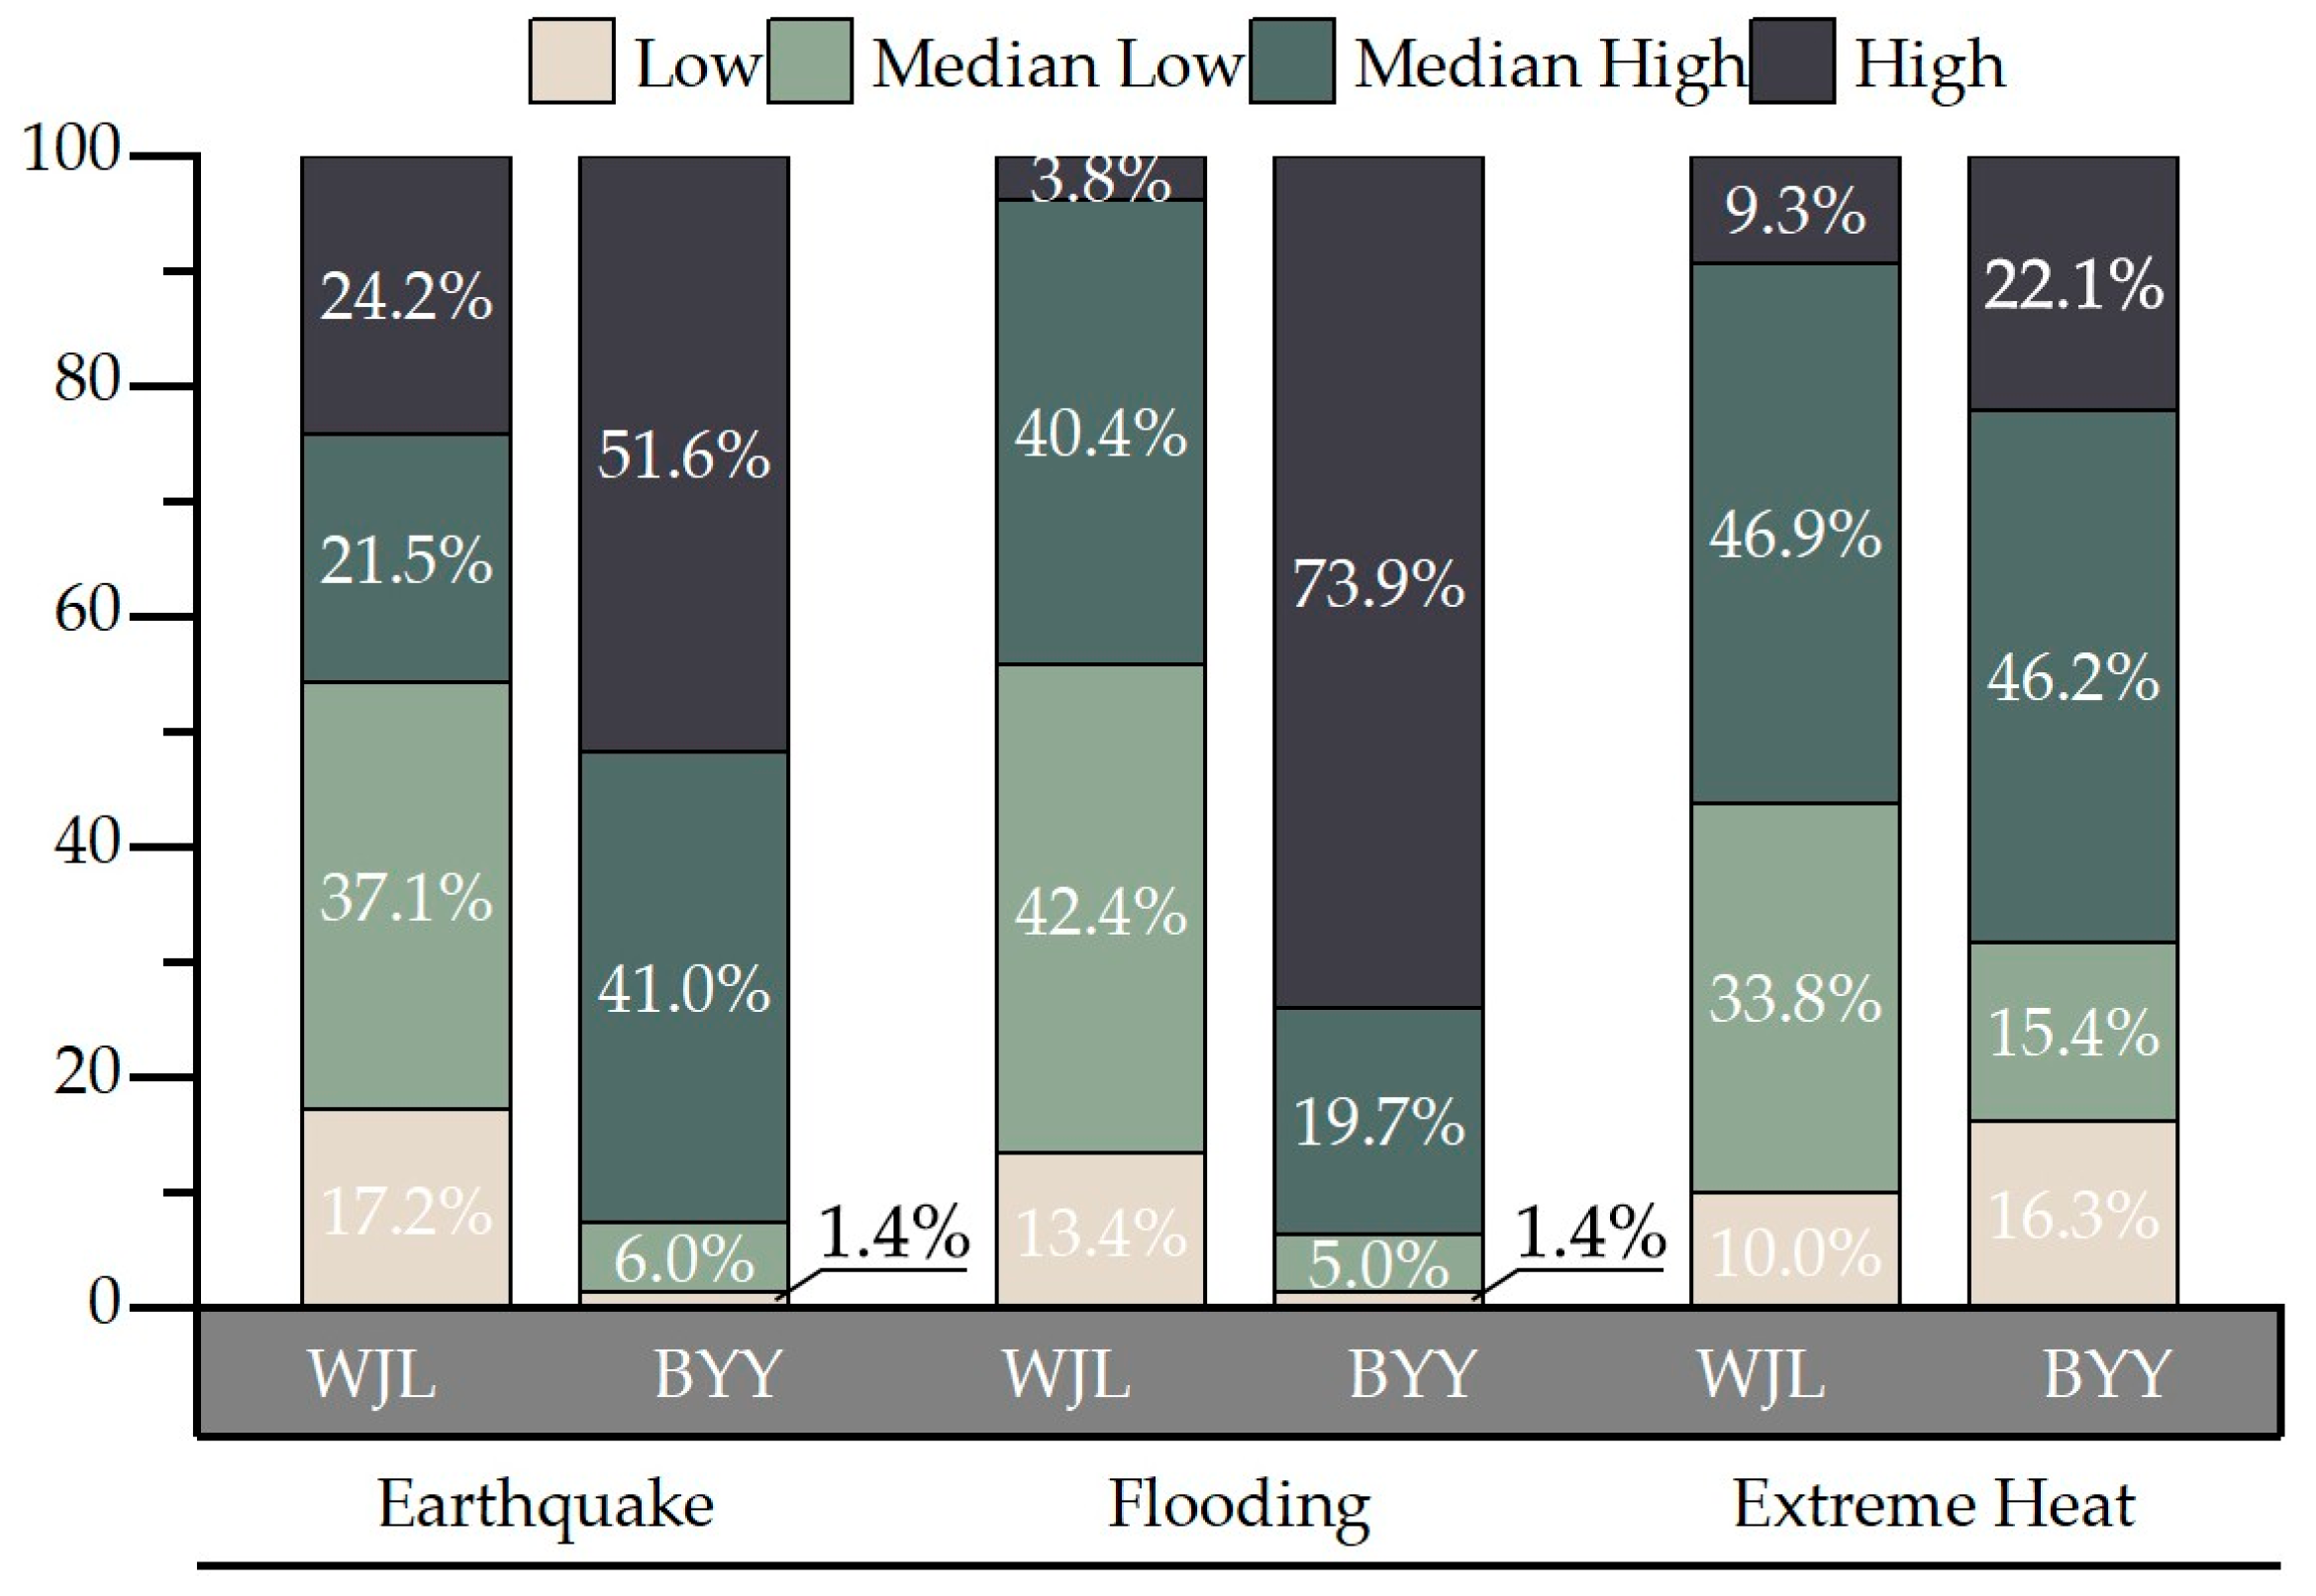
4.1. Overall Characteristics of UCMR in the WJL and BYY Campuses
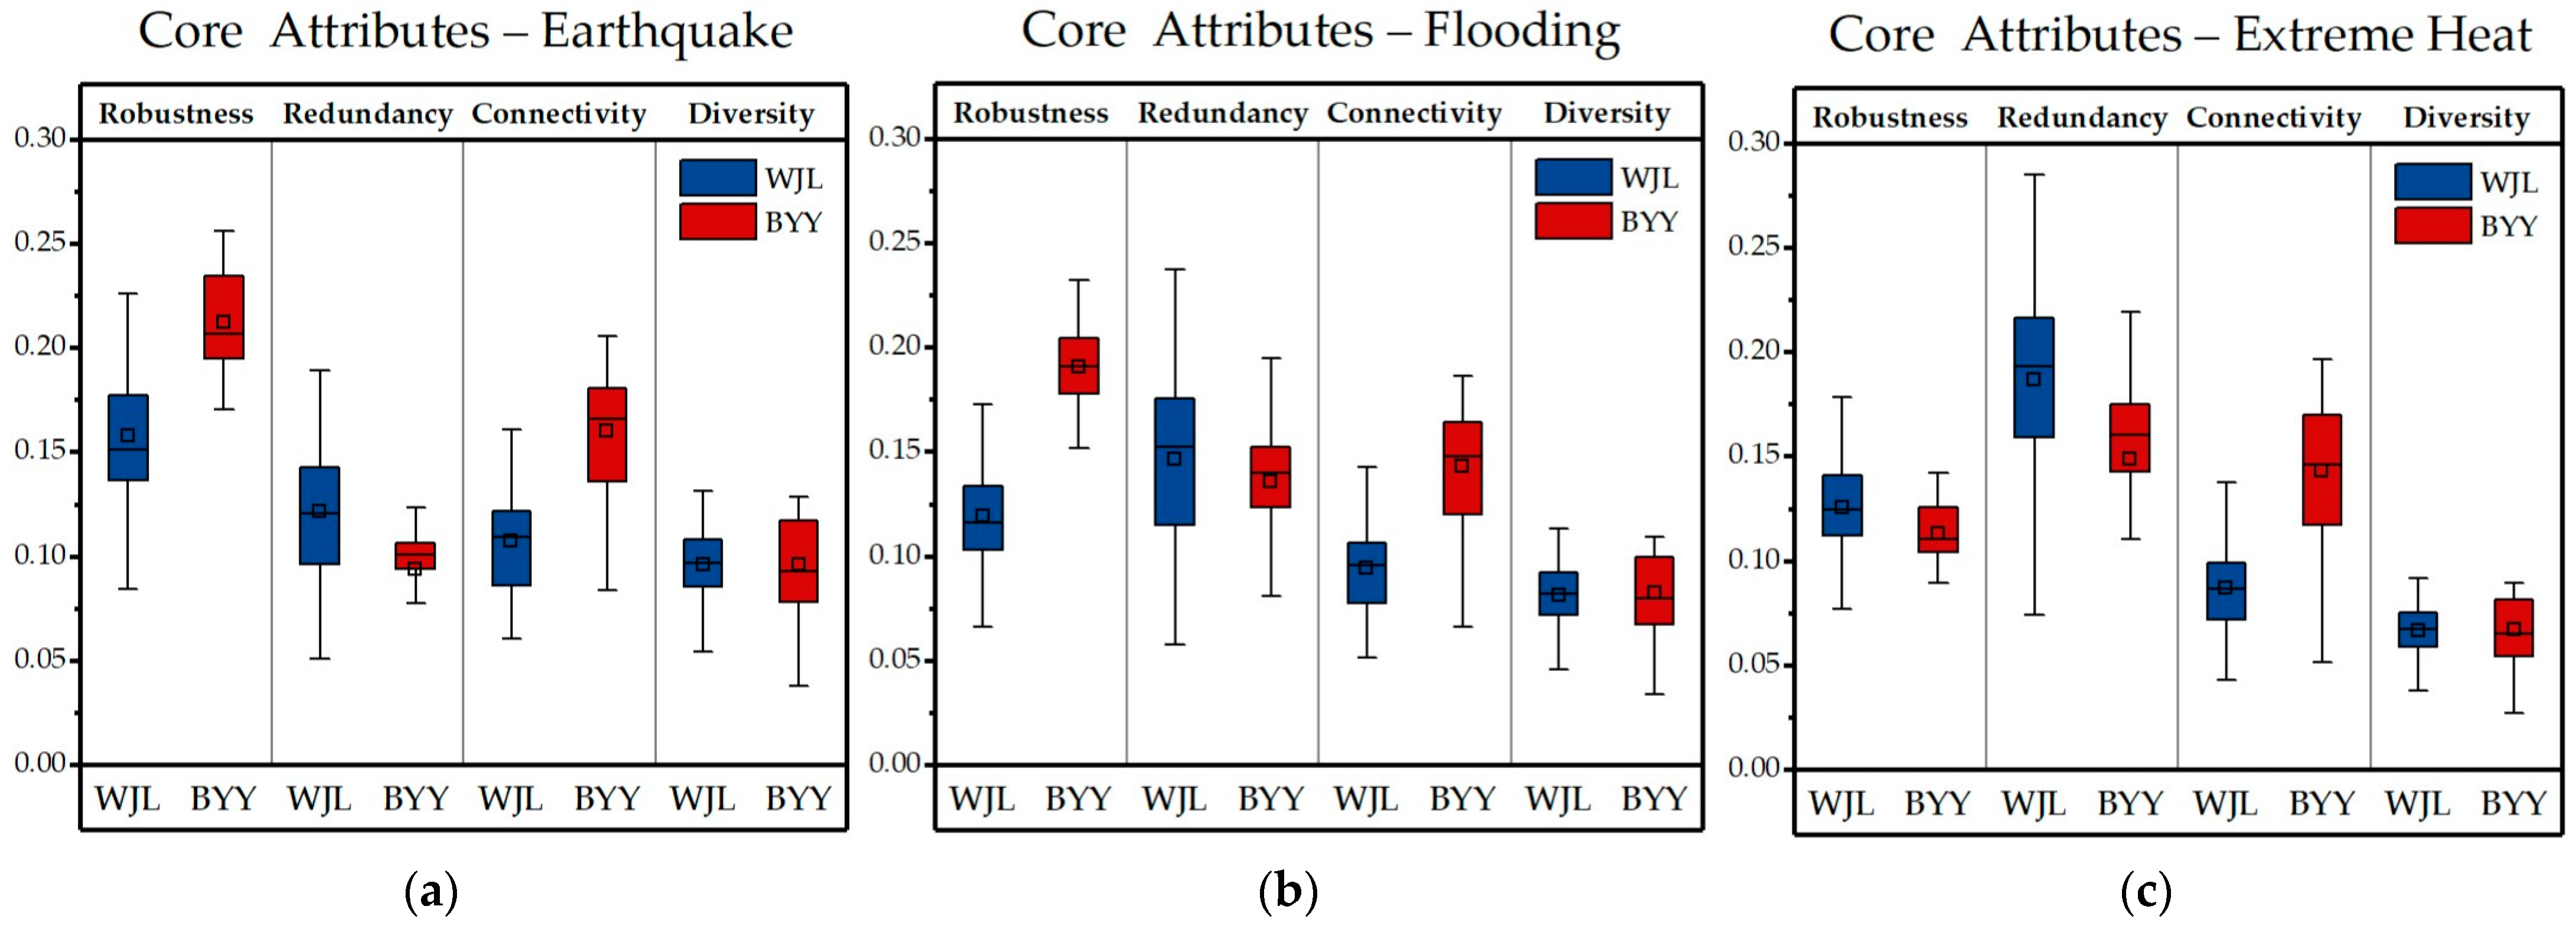
4.2. Core Resilience Attributes in the WJL and BYY Campuses
4.3. Multi-Disaster Coupling Characteristics of UCMR in the WJL and BYY Campuses
5. Discussion
5.1. Campus Developmental Imbalance and Its Role in Shaping UCMR Disparities
- Legacy brick-mixed buildings from the campus’s Sluggish Development Period still operate, diminishing robustness in the northeastern dormitory and central classroom areas during earthquakes and floods.
- As the WJL Campus expanded, blue-green facilities and public space steadily diminished. Infill-led high-density development in the western, central, and southern zones—especially the iconic 12-story Pengxiang Apartment, built in 2000—has negatively affected the campus’s robustness and redundancy.
- Amid a Rapid Construction Period, land use in the southern zone of the WJL Campus was restructured, creating a central–periphery pattern of spatial and functional differentiation. This pattern is characterized by teaching and administrative zones at the core and dormitory and recreational areas forming the peripheral layers. This reorganization subsequently enhanced overall diversity.
- The area along Talei Road, situated in the northeastern corner of the campus, has been designated for recreational use. Characterized by extensive open spaces, abundant blue-green infrastructure, and high-quality buildings, these morphological zones demonstrate consistently high UCMR levels under all three disaster scenarios.
- Campus expansion was paralleled by the urbanization of surrounding zones, fostering a closely integrated spatial relationship between the university and its urban context. Surrounding areas provide ample emergency support, including healthcare and commercial facilities, which have mitigated internal shortages and substantially elevated the campus’s redundancy capacity. Nonetheless, the elevated spatial cost for students to reach emergency resources during crises has undermined internal connectivity performance.
- Due to topographical variation, with elevated areas in the northwest and lower terrain in the southeast, these differences amplified local disparities in robustness under flooding conditions.
- With urbanization in surrounding zones lagging, the capacity to supply emergency resources is constrained, resulting in limited redundancy across the campus.
- Healthcare resources are primarily located in the campus’ northeastern zone, with the fire station positioned beyond the northeast gate. The southeastern region lacks adequate permeable surfaces, whereas other high-density zones possess sufficient informal green areas, creating spatial heterogeneity in redundancy.
- The functional uniformity of buildings near the southeastern edge of the campus constrains diversity at the local scale.
5.2. Recommendations for Enhancing UCMR and Campus Disaster Planning
5.2.1. Recommendations for Enhancing UCMR
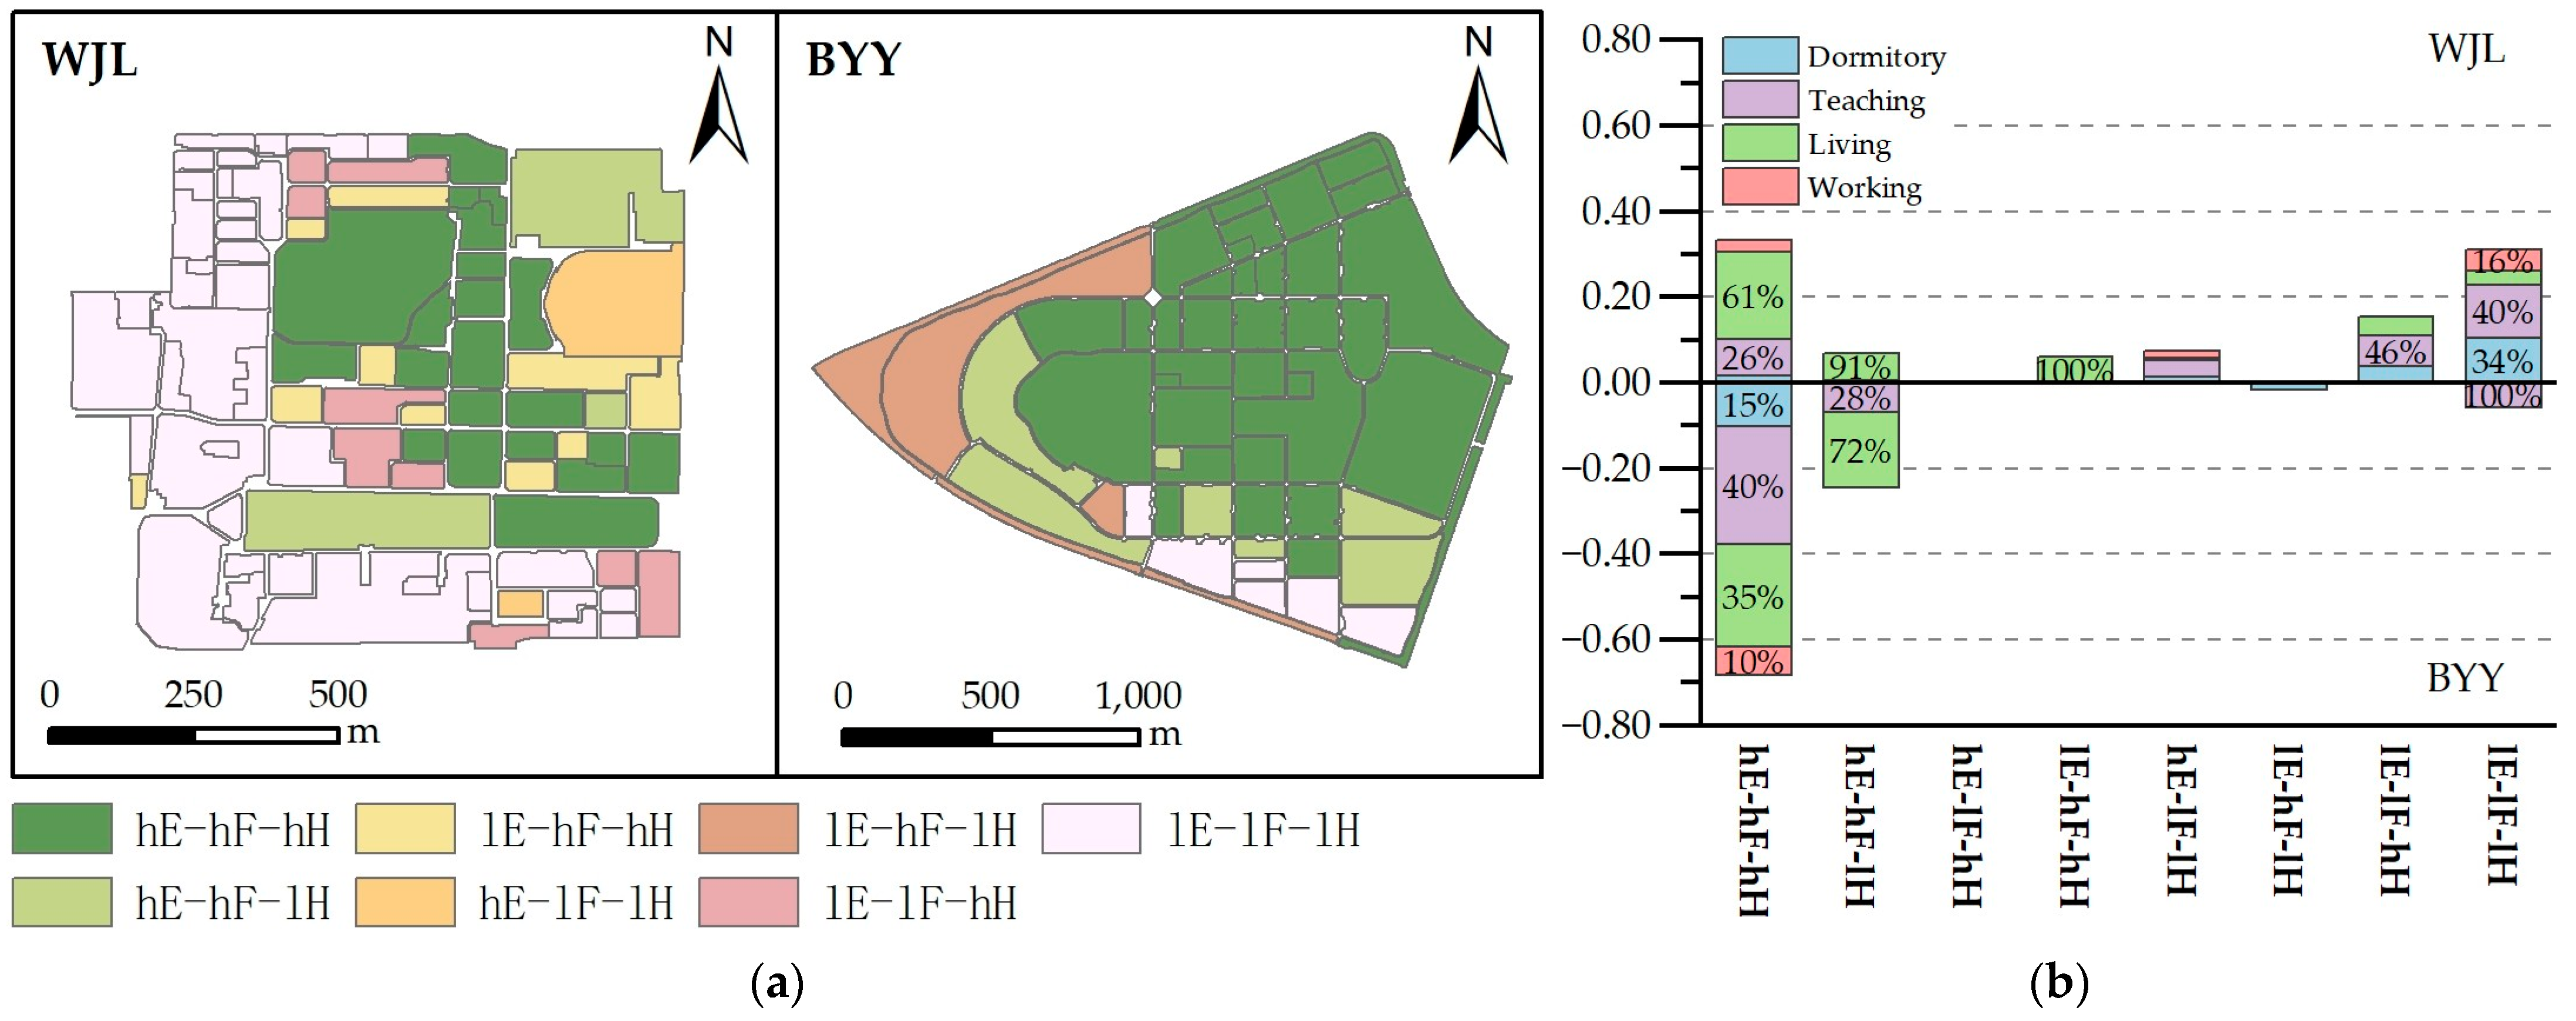
- Tri-Scenario Vulnerability Zones (lE-lF-lH) demonstrate consistently low UCMR performance under earthquakes, flooding, and extreme-heat scenarios, reflecting systemic morphological vulnerability. This unit type represents 31.0% of the WJL Campus, clustering around its northwest and southern margins, whereas at the BYY Campus, such units are limited to the southeastern margins. To revitalize its Tri-Scenario Vulnerability Zones, the WJL Campus must launch coordinated renewal programs that include retrofitting aging brick-mixed buildings [57], redesigning and integrating blue-green networks [83], and optimizing traffic evacuation systems and emergency shelter layouts [21], thereby facilitating the resilience-oriented restoration of campus morphology. The BYY Campus, which contains only a few such units, should adopt fine-grained interventions, including green roofs, pocket-scale rain gardens, and integrated emergency facilities nodes [81].
- Dual-scenario Vulnerability Zones (lE-lF-hH, lE-hF-lH, and hE-lF-lH) demonstrate low UCMR performance under two types of disaster events, indicating a compound shortcoming in resilience capacity. At the WJL Campus, hE-lF-lH and lE-lF-hH units constitute the dual-scenario vulnerability zones, while at the BYY Campus, these zones are composed of lE-hF-lH units. The hE-lF-lH zones within the WJL Campus, encompassing the stadium and Canteen 4 area, are adversely impacted by expansive impermeable surfaces and minimal shading provisions, resulting in stormwater retention and limited thermal adaptability. To strengthen the system’s capacity to buffer flooding and withstand extreme heat, we recommend that future interventions expand permeable surface coverage and incorporate canopy-level trees, green roofs, and vertical shading technologies [84,85]. Characterized by concentrated brick-mixed construction and insufficient blue-green infrastructure, lE-lF-hH units are irregularly distributed across the central and peripheral zones of the campus. Targeted structural retrofitting and ecological flood management redesign are required to strengthen resilience under dual disaster conditions. lE-hF-lH zones in the BYY Campus are concentrated in dormitories 25–26, where elevated dormitory density, limited vegetation, and a lack of solar mitigation facilities reduce adaptive capacity to earthquake and extreme-heat scenarios. Strengthening responsiveness should include retrofitting dormitory structures, expanding pervious surface areas, and reinforcing green ecological networks [86].
- Single-Scenario Vulnerability Zones (hE-hF-lH, lE-hF-hH) show diminished resilience outcomes under a single disaster scenario. lE-hF-hH zones at the WJL Campus are relatively abundant yet dispersed, whereas hE-hF-lH zones are concentrated around the northeastern gymnasium and the eastern parking facility. The BYY Campus only features the lE-hF-hH units, primarily distributed across large undeveloped land parcels. To address this unit category, localized UCMR improvements should be developed based on the specific disaster scenario and the corresponding morphological characteristics of each zone. In earthquake-prone lE-hF-hH zones, structural retrofitting and optimized emergency egress routes—such as reinforced stairwells and earthquake-resistant corridors—should be prioritized [15]. hE-hF-lH areas vulnerable to heat can benefit from enhancing tree-canopy coverage, installing shaded facilities, and deploying mobile cooling rest points to alleviate thermal stress [87].
- Persistently High Resilience Zones (hE-hF-hH) maintain high UCMR performance under earthquake, flooding, and extreme-heat scenarios, reflecting strong systemic stability. hE-hF-hH zones comprise 68.3% of the BYY Campus, featuring broad spatial coverage and integrated spatial continuity. In contrast, at the WJL Campus, hE-hF-hH zones represent only 33.3% of the spatial units and are characterized by concentrated, small-scale clustering patterns. The BYY and WJL campuses should adopt differentiated, context-specific strategies that leverage the morphological patterns of high-resilience zones to unlock their transformative potential and guide resilience enhancement across the campus.
5.2.2. Recommendations for Enhancing Campus Disaster Planning
- Traditional Chinese campuses should leverage their locational advantages and proactively incorporate surrounding emergency assets to establish a multi-level response system spanning campus, neighborhood, and city scales. Concurrently, residual spaces around dormitories and instructional hubs should be utilized to deploy micro-scale emergency supply depots and temporary evacuation shelters. Integrating dispersed green facilities into ecological corridors can enhance the system’s ability to regulate pluvial runoff and mitigate the impacts of extreme heat.
- Newly established campuses in China should move beyond macro-scale planning and adopt granular, micro-unit–based governance frameworks. Campus-level disaster readiness can be enhanced by rationalizing the layout of commercial services, healthcare resources, and emergency shelters, thereby enabling “5-min resilient living circles” [88]. In parallel, spatial redundancies like open green fields and undeveloped clearings should be leveraged to establish multifunctional disaster adaptation hubs that integrate emergency shelters, facilities, and real-time communication services.
6. Conclusions
Author Contributions
Funding
Data Availability Statement
Acknowledgments
Conflicts of Interest
Appendix A

| Search Strings | Database | Records |
|---|---|---|
| “resilien * 1” AND “flood” AND (“urban form” or “urban morphology” or “urban design”) | Web of Science | 121 |
| “resilien *” AND “flood” AND (“urban form” or “urban morphology” or “urban design”) | CNKI | 109 |
| “resilien *” AND “earthquake” AND (“urban form” or “urban morphology” or “urban design”) | Web of Science | 29 |
| “resilien *” AND “earthquake” AND (“urban form” or “urban morphology” or “urban design”) | CNKI | 56 |
| “resilien *” AND “extreme heat” AND (“urban form” or “urban morphology” or “urban design”) | Web of Science | 19 |
| “resilien *” AND “extreme heat” AND (“urban form” or “urban morphology” or “urban design”) | CNKI | 26 |
| “resilien *” AND “flood” AND (“campus form” or “campus morphology” or “campus design” or “university campus” or “campus” or “university”) | Web of Science | 163 |
| “resilien *” AND “flood” AND (“campus form” or “campus morphology” or “campus design” or “university campus” or “campus” or “university”) | CNKI | 114 |
| “resilien *” AND “earthquake” AND (“campus form” or “campus morphology” or “campus design” or “university campus” or “campus” or “university”) | Web of Science | 271 |
| “resilien *” AND “earthquake” AND (“campus form” or “campus morphology” or “campus design” or “university campus” or “campus” or “university”) | CNKI | 348 |
| “resilien *” AND “extreme heat” AND (“campus form” or “campus morphology” or “campus design” or “university campus” or “campus” or “university”) | Web of Science | 28 |
| “resilien *” AND “extreme heat” AND (“campus form” or “campus morphology” or “campus design” or “university campus” or “campus” or “university”) | CNKI | 19 |
| “resilien *” AND (“campus form” or “campus morphology” or “campus design” or “university campus” or “campus” or “university”) | Web of Science | 13266 |
| “resilien *” AND (“campus form” or “campus morphology” or “campus design” or “university campus” or “campus” or “university”) | CNKI | 4746 |
| “resilien *” AND (“urban form” or “urban morphology” or “urban design”) | Web of Science | 971 |
| “resilien *” AND (“urban form” or “urban morphology” or “urban design”) | CNKI | 167 |
Appendix B
| Indicators | Calculation Formula | Explanation of the Formula |
|---|---|---|
| A1 | —the area proportion of heatmap level i at time t; —the heatmap value of level i at time ; T—the total number of time periods; n—the total number of heatmap levels. | |
| A2 | —the average surface elevation of each unit; —the lowest surface elevation of the campus. | |
| A3 | —distance from “source” patch i to the nearest “sink” patch; n—number of “source” patches. | |
| A4 | —the area proportion of the building type i; —the importance score of the building type i, defined as: General-use buildings = 1, heritage buildings = 2, laboratory buildings = 3, Key functional buildings = 4. | |
| A5 | —the area proportion of the building type i; —the importance score of the building type i, defined as: temporary structures = 1, brick-mixed structure = 2, concrete frame structure = 3, spatial structure = 4. | |
| A6 | —the building area of the i-th building; —the construction time of the i-th building; n—the total number of buildings within each unit. | |
| A7 | —the maximum height of buildings on both sides of the road; —the horizontal distance from the centerline of the road to the building boundary. | |
| A8 | —the elevation angle of the sky segment i; —the area of segment i in a hemispherical view. | |
| A9 | —building floor area; A—area of campus study unit. | |
| A10 | —total area of permeable surface; A—area of campus study unit. | |
| A11 | —total area of vegetation; A—area of campus study unit. | |
| A12 | —total area of emergency shelter(≥1000 m2); —area of the 5 min walking cycle of the campus study unit. | |
| A13 | —number of commercial facilities within the 15 min walking cycle of the campus study unit; —area of the 15-min walking cycle of the campus study unit. | |
| A14 | —number of healthcare facilities within the 15 min walking cycle of the campus study unit; —area of the 15-min walking cycle of the campus study unit. | |
| A15 | —number of fire stations within the 4 min of the campus study unit; —area of the 4-min driving cycle of the campus study unit. | |
| A16 | —width of the i-th road; n—total number of roads within the campus study unit. | |
| A17 | —the total number of shortest paths from node s to node t; —the number of shortest paths from s to t that pass through v. | |
| A18 | N—the total number of nodes in the network; —the shortest path distance from node v to node t. | |
| A19 | n—the number of ; —the campus study unit center; -the i-th campus entrance; —the road distance from to . | |
| A20 | —the walking distance corresponding to the i-th time level required to reach emergency locations; —the area proportion of the research unit covered by the i-th walking distance. | |
| A21 | —the campus study unit center; —the i-th commercial facility within the 15 min walking cycle of the campus study unit; -the road distance from to ; n—the number of . | |
| A22 | —the campus study unit center; —the i-th healthcare facility within the 15 min walking cycle of the campus unit; —the road distance from to ; n—the number of . | |
| A23 | —the campus study unit center; —the i-th fire station within the 4 min driving cycle of the campus study unit; —the road distance from to ; n—the number of . | |
| A24 | —proportion of building functional type i; n—number of building functional types. | |
| A25 | Pi—proportion of emergency facility type i; n—number of emergency facility types. | |
| A26 | —total number of intersections; L—total length of roads. |
| 1 | Project 985: A Chinese government scheme launched in May 1998 to build world-class universities, involving 39 top-tier institutions nationwide [51]. |
References
- Li, S.; Zhu, Y.; Yang, J.; Gong, B. Research on Renewal Design of College Campus Based on Flood Bearing Resilience. Sustainability 2023, 15, 11489. [Google Scholar] [CrossRef]
- Dhar, T.K.; Khirfan, L. A Multi-Scale and Multi-Dimensional Framework for Enhancing the Resilience of Urban Form to Climate Change. URBAN Clim. 2017, 19, 72–91. [Google Scholar] [CrossRef]
- Gibbs, L.; bin Jehangir, H.; Kwong, E.J.L.; Little, A. Universities and Multiple Disaster Scenarios: A Transformative Framework for Disaster Resilient Universities. Int. J. Disaster Risk Reduct. 2022, 78, 103132. [Google Scholar] [CrossRef]
- Cetin, M.; Aksoy, T.; Cabuk, S.N.; Senyel Kurkcuoglu, M.A.; Cabuk, A. Employing Remote Sensing Technique to Monitor the Influence of Newly Established Universities in Creating an Urban Development Process on the Respective Cities. Land Use Policy 2021, 109, 105705. [Google Scholar] [CrossRef]
- Lara Arambula, R.; Carnieletto, L.; Pasut, W. Toward a Resilient Campus: Analysis of University Buildings to Evaluate Fast Implementing Strategies to Reduce the Energy Consumption. In Proceedings of the 18th IBPSA Conference, Shanghai, China, 4–6 September 2023; Volume 18, pp. 637–644. [Google Scholar]
- Washington-Ottombre, C.; Brylinsky, S.E.; Carlberg, D.B.; Weisbord, D. Climate Resilience Planning and Organizational Learning on Campuses and beyond: A Comparative Study of Three Higher Education Institutions. In University Initiatives in Climate Change Mitigation and Adaptation; Leal Filho, W., Leal-Arcas, R., Eds.; Springer International Publishing: Cham, Switzerland, 2019; pp. 77–93. ISBN 978-3-319-89590-1. [Google Scholar]
- Dyer, G.; Dyer, M. Strategic Leadership for Sustainability by Higher Education: The American College & University Presidents’ Climate Commitment. J. Clean. Prod. 2017, 140, 111–116. [Google Scholar] [CrossRef]
- Kautto, N.; Trundle, A.; McEvoy, D. Climate Adaptation Planning in the Higher Education Sector. Int. J. Sustain. High. Educ. 2018, 19, 1259–1278. [Google Scholar] [CrossRef]
- Muller, I.; Tempelhoff, J. The Application of a Resilience Assessment Approach to Promote Campus Environmental Management: A South African Case Study. Int. J. Sustain. High. Educ. 2016, 17, 228–245. [Google Scholar] [CrossRef]
- Brewer, M.L.; van Kessel, G.; Sanderson, B.; Naumann, F.; Lane, M.; Reubenson, A.; Carter, A. Resilience in Higher Education Students: A Scoping Review. High. Educ. Res. Dev. 2019, 38, 1105–1120. [Google Scholar] [CrossRef]
- United Nations Office for Disaster Risk Reduction (UNDRR). Sendai Declaration. In Proceedings of the 3rd United Nations World Conference on Disaster Risk Reduction, Sendai, Japan, 14–18 March 2015. [Google Scholar]
- GUNI: Global University Network for Innovation. New Visions for Higher Education Towards 2030; Higher Education in the World Report; GUNI: Global University Network for Innovation: Barcelona, Spain, 2022; ISBN 978-84-09-40894-8. [Google Scholar]
- Feng, X.; Xiu, C.; Bai, L.; Zhong, Y.; Wei, Y. Comprehensive Evaluation of Urban Resilience Based on the Perspective of Landscape Pattern: A Case Study of Shenyang City. Cities 2020, 104, 102722. [Google Scholar] [CrossRef]
- Dibble, J.; Prelorendjos, A.; Romice, O.; Zanella, M.; Strano, E.; Pagel, M.; Porta, S. On the Origin of Spaces: Morphometric Foundations of Urban Form Evolution. Environ. Plan. B Urban Anal. City Sci. 2019, 46, 707–730. [Google Scholar] [CrossRef]
- Sharifi, A.; Roosta, M.; Javadpoor, M. Urban Form Resilience: A Comparative Analysis of Traditional, Semi-Planned, and Planned Neighborhoods in Shiraz, Iran. Urban Sci. 2021, 5, 18. [Google Scholar] [CrossRef]
- Wang, Q.; Zhao, R.; Wang, N. Spatially Non-Stationarity Relationships between High-Density Built Environment and Waterlogging Disaster: Insights from Xiamen Island, China. Ecol. Indic. 2024, 162, 112021. [Google Scholar] [CrossRef]
- Sharifi, A.; Yamagata, Y. Resilient Urban Form: A Conceptual Framework. In Resilience-Oriented Urban Planning; Yamagata, Y., Sharifi, A., Eds.; Lecture Notes in Energy; Springer International Publishing: Cham, Switzerland, 2018; Volume 65, pp. 167–179. ISBN 978-3-319-75797-1. [Google Scholar]
- Dastjerdi, M.S.; Lak, A. Towards Resilient Place Emphasizing Urban Form: An Assessment Framework in Urban Design. Sustain. Cities Soc. 2023, 96, 104646. [Google Scholar] [CrossRef]
- Gharai, F.; Masnavi, M.; Hajibandeh, M. Urban Local-Spatial Resilience: Developing the Key Indicators and Measures, a Brief Review of Literature. Mon. Sci. J. Bagh-E Nazar 2018, 14, 19–32. [Google Scholar]
- Xie, W.; Sun, C.; Lin, Z. Spatial-Temporal Evolution of Urban Form Resilience to Climate Disturbance in Adaptive Cycle: A Case Study of Changchun City. Urban Clim. 2023, 49, 101461. [Google Scholar] [CrossRef]
- Xin, F.; Ma, Y.; Liao, P.; Fu, B. Evaluation of the University Campus Layout for the Dual Use as a City-Level Emergency Shelter. Habitat Int. 2025, 156, 103285. [Google Scholar] [CrossRef]
- Paul, B.; David, C.; Ali, M. Building Localized Interactions between Universities and Cities through University Spatial Development. Eur. Plan. Stud. 2010, 18, 1611–1629. [Google Scholar] [CrossRef]
- Ke, X.; Yang, W.; Misheng, L.; Ranting, Z. Urban and Architectural Design from the Perspective of Flood Resilience: Framework Development and Case Study of a Chinese University Campus. J. Asian Archit. Build. Eng. 2023, 22, 3100–3114. [Google Scholar] [CrossRef]
- Gao, H.; Chen, K.; Zhang, Z.; Zhang, X.; Xie, S. Research on the Practice Path of Resilient University Campus Planning Based on the “Assessment–Planning–Post Assessment” Mechanism. Architecture 2025, 146–152. (In Chinese) [Google Scholar] [CrossRef]
- Heracleous, C.; Michael, A.; Savvides, A.; Hayles, C. Climate Change Resilience of School Premises in Cyprus: An Examination of Retrofit Approaches and Their Implications on Thermal and Energy Performance. J. Build. Eng. 2021, 44, 103358. [Google Scholar] [CrossRef]
- Saeedi, I.; Darabi, H. Campus Landscape Design Based on Resilience Approach and Water Shortage (Case Study: Campus of Malayer University). J. Environ. Stud. 2015, 40, 1051–1066. [Google Scholar]
- Talebloo, S.; Alias, A. The Evaluation of Physical Dimension on the Design of Campus Buildings towards Resilience Initiative at the University of Malaya. J. Des. Built Environ. 2021, 21, 76–91. [Google Scholar] [CrossRef]
- Hutton, N.S.; Allen, M.J. Flood Hazard Awareness at Old Dominion University: Assessment and Opportunity. J. Contemp. Water Res. Educ. 2021, 172, 19–33. [Google Scholar] [CrossRef]
- Lu, J.; Wu, X. Study on the Influence Mechanism of Campus Flood Risk Factors. J. China Hydrol. 2023, 43, 64–68+95. (In Chinese) [Google Scholar] [CrossRef]
- Berrett, B.E.; Vernon, C.A.; Beckstrand, H.; Pollei, M.; Markert, K.; Franke, K.W.; Hedengren, J.D. Large-Scale Reality Modeling of a University Campus Using Combined UAV and Terrestrial Photogrammetry for Historical Preservation and Practical Use. Drones 2021, 5, 136. [Google Scholar] [CrossRef]
- Walker, B.; Holling, C.S.; Carpenter, S.R.; Kinzig, A. Resilience, Adaptability and Transformability in Social–Ecological Systems. Ecol. Soc. 2004, 9, 5. [Google Scholar] [CrossRef]
- Chen, X. The Evolution of Chinese University Campus Morphology. Ph.D. Thesis, Tongji University, Shanghai, China, 2008. (In Chinese). [Google Scholar]
- Ke, X.; He, B.-J. Planning for Heat-Resilient Educational Precincts: Framework Formulation, Cooling Infrastructure Selection and Walkable Routes Determination. Sustain. CITIES Soc. 2024, 101, 105183. [Google Scholar] [CrossRef]
- Zuo, J.; Su, W. Thinking about safety construction of emergency refugium in campus of mountainous area: A case study on playground of Chongqing University. J. Nat. Disasters 2010, 19, 74–79. (In Chinese) [Google Scholar] [CrossRef]
- Sharifi, A. Urban Form Resilience: A Meso-Scale Analysis. Cities 2019, 93, 238–252. [Google Scholar] [CrossRef]
- Chen, B.; Sun, Y.; Li, Y. Research on Adaptive Transformation of Resilient Urban Form at Medium and Micro Scale: Showcase of Shekou Industrial District, Shenzhen. Urban Dev. Stud. 2021, 28, 101–111+2+45. (In Chinese) [Google Scholar]
- Fusco, G.; Venerandi, A. Assessing Morphological Resilience. Methodological Challenges for Metropolitan Areas. In Proceedings of the Computational Science and Its Applications–ICCSA 2020, Cagliari, Italy, 1–4 July 2020; Gervasi, O., Murgante, B., Misra, S., Garau, C., Blečić, I., Taniar, D., Apduhan, B.O., Rocha, A.M.A.C., Tarantino, E., Torre, C.M., et al., Eds.; Springer International Publishing: Cham, Switzerland, 2020; pp. 593–609. [Google Scholar]
- Liang, Y.; Wang, C.; Chen, G.; Xie, Z. Evaluation Framework ACR-UFDR for Urban Form Disaster Resilience under Rainstorm and Flood Scenarios: A Case Study in Nanjing, China. Sustain. Cities Soc. 2024, 107, 105424. [Google Scholar] [CrossRef]
- Zhang, Q.; Sun, H.; Yu, S. Quantitative Evaluation and Analysis of Rainwater Flood Resilience of Urban Form of Taiyuan Street, Shenyang City. Huazhong Archit. 2024, 42, 115–120. (In Chinese) [Google Scholar]
- Zhao, Q. The Adaptive Characteristics of Urban Form Transformations: A Study of the Hui Community in Xi’an. Ph.D. Thesis, Xi’an University of Architecture and Technology, Xi’an, China, 2023. (In Chinese). [Google Scholar]
- Zhao, P.; Tian, Y. Research on the Quantitative Evaluation Method of Morphological Resilience of Historical Blocks: A Case Study based on the Historical and Cultural Blocks in the East, West, and South Corners of Luoyang City. South Archit. 2023, 1–11. (In Chinese) [Google Scholar] [CrossRef]
- Alawneh, S.M.; Rashid, M. Revisiting Urban Resilience: A Review on Resilience of Spatial Structure in Urban Refugee Neighborhoods Facing Demographic Changes. Front. Sustain. Cities 2022, 4, 806531. [Google Scholar] [CrossRef]
- Datola, G. Implementing Urban Resilience in Urban Planning: A Comprehensive Framework for Urban Resilience Evaluation. Sustain. Cities Soc. 2023, 98, 104821. [Google Scholar] [CrossRef]
- Parizi, S.M.; Taleai, M.; Sharifi, A. A GIS-Based Multi-Criteria Analysis Framework to Evaluate Urban Physical Resilience against Earthquakes. Sustainability 2022, 14, 5034. [Google Scholar] [CrossRef]
- Dastjerdi, M.S.; Lak, A.; Ghaffari, A.; Sharifi, A. A Conceptual Framework for Resilient Place Assessment Based on Spatial Resilience Approach: An Integrative Review. Urban Clim. 2021, 36, 100794. [Google Scholar] [CrossRef]
- Hameed Basee, D.; Riadh Abdulla, Z. Transformation of Urban Morphology, Vulnerability and Resilience: Haifa Street Area, as a Case Study. Ain Shams Eng. J. 2022, 13, 101718. [Google Scholar] [CrossRef]
- Xia, C.; Ma, D.; Guo, X.; Wang, Z.; Wang, W. Research on Disaster Resilience Mechanism and Planning Response of Territorial Space from the Perspective of Adaptive Cycle. Urban Dev. Stud. 2024, 31, 44–52. (In Chinese) [Google Scholar]
- Discharged Water Volume into the Sea Exceeds 2.4 Billion Cubic Meters—Tianjin News—Tianjin Government Affairs Website. Available online: https://www.tj.gov.cn/sy/tjxw/202308/t20230816_6378380.html (accessed on 25 February 2025).
- China Climate Bulletin. 2023. Available online: https://www.cma.gov.cn/zfxxgk/gknr/qxbg/202402/t20240223_6084527.html (accessed on 25 February 2025).
- Fang, W.; Li, X.; Tian, D.; Wang, L. Comprehensive evaluation and analysis on the engineering geological stability of Tianjin urban construction. Geol. Surv. Res. 2016, 39, 64–70. (In Chinese) [Google Scholar]
- Project 211 and Project 985–Ministry of Education of the People’s Republic of China Official Website. Available online: http://www.moe.gov.cn/jyb_xwfb/xw_zt/moe_357/jyzt_2015nztzl/2015_zt15/15zt15_mtbd/201511/t20151106_217950.html (accessed on 6 June 2025).
- Guo, W.; Ding, Y.; Yang, G.; Liu, X. Research on the Indicators of Sustainable Campus Renewal and Reconstruction in Pursuit of Continuous Historical and Regional Context. Buildings 2022, 12, 1508. [Google Scholar] [CrossRef]
- Abdul-Rahman, M.; Alade, W.; Anwer, S. A Composite Resilience Index (CRI) for Developing Resilience and Sustainability in University Towns. Sustainability 2023, 15, 3057. [Google Scholar] [CrossRef]
- Balaian, S.K.; Sanders, B.F.; Qomi, M.J.A. How Urban Form Impacts Flooding. Nat. Commun. 2024, 15, 6911. [Google Scholar] [CrossRef] [PubMed]
- Mir, S.; Bhat, M.S.; Shah, S.A.; Khaja, H.A.; Peer, J. An Assessment of Health, Safety and Environmental Risk within Higher Academic Institutions in Kashmir Valley. Environ. Dev. Sustain. 2024. [Google Scholar] [CrossRef]
- Rosso, F.; Bernabei, L.; Bernardini, G.; Russo, M.; Angelosanti, M.; Currà, E.; Quagliarini, E.; Mochi, G. Urban Morphology Parameters towards Multi-Risk Scenarios for Squares in the Historical Centers: Analyses and Definition of Square Typologies and Application to the Italian Context. J. Cult. Herit. 2022, 56, 167–182. [Google Scholar] [CrossRef]
- Wang, C.-H. Does Compact Development Promote a Seismic-Resistant City? Application of Seismic-Damage Statistical Models to Taichung, Taiwan. Environ. Plan. B-Urban Anal. City Sci. 2020, 47, 84–101. [Google Scholar] [CrossRef]
- Zhu, W.; Yuan, C. Urban Heat Health Risk Assessment in Singapore to Support Resilient Urban Design—By Integrating Urban Heat and the Distribution of the Elderly Population. Cities 2023, 132, 104103. [Google Scholar] [CrossRef]
- Zhang, S.; Yuan, C.; Ma, B.; Liu, N.; Li, W. Coupling Effects of Building-Vegetation-Land on Seasonal Land Surface Temperature on Street-Level: A Study from a Campus in Beijing. Build. Environ. 2024, 262, 111790. [Google Scholar] [CrossRef]
- Zhu, Y.; Burlando, P.; Tan, P.Y.; Blagojevic, J.; Fatichi, S. Investigating the Influence of Urban Morphology on Pluvial Flooding: Insights from Urban Catchments in England (UK). Sci. Total Environ. 2024, 953, 176139. [Google Scholar] [CrossRef]
- Lu, L.; Fu, P.; Dewan, A.; Li, Q. Contrasting Determinants of Land Surface Temperature in Three Megacities: Implications to Cool Tropical Metropolitan Regions. Sustain. Cities Soc. 2023, 92, 104505. [Google Scholar] [CrossRef]
- Su, J.; Li, J.; Gao, X.; Yao, Y.; Jiang, C. Comprehensive Analysis of Waterlogging Control and Carbon Emission Reduction for Optimal LID Layout: A Case Study in Campus. Environ. Sci. Pollut. Res. 2022, 29, 87802–87816. [Google Scholar] [CrossRef]
- Leta, B.M.; Adugna, D.; Wondim, A.A. Comprehensive Investigation of Flood-Resilient Neighborhoods: The Case of Adama City, Ethiopia. Appl. Water Sci. 2024, 14, 14. [Google Scholar] [CrossRef]
- Wang, Q.; Li, H.; Zang, X. A Study on the Resilience Rating of Urban Built Environment in Response to Heavy Rainfall Flooding Tianjin Central City as an Example. Archit. J. 2022, S02, 201–207. (In Chinese) [Google Scholar]
- Ma, J.; Blessing, R.; Brody, S.; Mostafavi, A. Non-Locality and Spillover Effects of Residential Flood Damage on Community Recovery: Insights from High-Resolution Flood Claim and Mobility Data. Sustain. Cities Soc. 2024, 117, 105947. [Google Scholar] [CrossRef]
- Zhang, W.; Zhen, F.; Chen, W.; Liu, M. Study on the Assessment of Heat Risks in Nanjing’s Urban Street Spaces: An “Activity-Environment” Interaction Perspective. Geogr. Res. 2024, 43, 2902–2919. (In Chinese) [Google Scholar] [CrossRef]
- Mabrouk, M.; Haoying, H. Urban Resilience Assessment: A Multicriteria Approach for Identifying Urban Flood-Exposed Risky Districts Using Multiple-Criteria Decision-Making Tools (MCDM). Int. J. Disaster Risk Reduct. 2023, 91, 103684. [Google Scholar] [CrossRef]
- Li, K.; Li, C. Exploring the linkages of urban form and climate resilience from a multidimensional perspective. Urban Rural Plan. 2021, 20–27. (In Chinese) [Google Scholar] [CrossRef]
- Erdem, U.; Cubukcu, K.M.; Sharifi, A. An Analysis of Urban Form Factors Driving Urban Heat Island: The Case of Izmir. Environ. Dev. Sustain. 2021, 23, 7835–7859. [Google Scholar] [CrossRef]
- Hu, J.; Liu, D.; Ren, L.; Yun, Y. Review of foreign studies on resilient urban form. Acta Ecol. Sin. 2024, 1–14. [Google Scholar] [CrossRef]
- Roosta, M.; Javadpoor, M.; Ebadi, M. A Study on Street Network Resilience in Urban Areas by Urban Network Analysis: Comparative Study of Old, New and Middle Fabrics in Shiraz. Int. J. Urban Sci. 2022, 26, 309–331. [Google Scholar] [CrossRef]
- Sharifi, A. Resilient Urban Forms: A Review of Literature on Streets and Street Networks. Build. Environ. 2019, 147, 171–187. [Google Scholar] [CrossRef]
- Wang, J.; Foley, K. Assessing the Performance of Urban Open Space for Achieving Sustainable and Resilient Cities: A Pilot Study of Two Urban Parks in Dublin, Ireland. Urban For. Urban Green. 2021, 62, 127180. [Google Scholar] [CrossRef]
- Chen, Y.; Liu, T.; Chen, R.; Zhao, M. Influence of the Built Environment on Community Flood Resilience: Evidence from Nanjing City, China. Sustainability 2020, 12, 2401. [Google Scholar] [CrossRef]
- Li, H. Research on Resilience Type of Urban Built Environment in Response to Rainstorm Waterlogging—A Case Study of the Typical Areas of Beijing-Tianjin-Hebei Region. Master’s Thesis, Tianjin University, Tianjin, China, 2023. (In Chinese). [Google Scholar]
- Hao, H.; Wang, Y. Disentangling Relations between Urban Form and Urban Accessibility for Resilience to Extreme Weather and Climate Events. Landsc. Urban Plan. 2022, 220, 104352. [Google Scholar] [CrossRef]
- Yao, Y.; Lu, L.; Guo, J.; Zhang, S.; Cheng, J.; Tariq, A.; Liang, D.; Hu, Y.; Li, Q. Spatially Explicit Assessments of Heat-Related Health Risks: A Literature Review. Remote Sens. 2024, 16, 4500. [Google Scholar] [CrossRef]
- Dhar, T.K.; Khirfan, L. A Sixfold Urban Design Framework to Assess Climate Resilience: Generative Transformation in Negril, Jamaica. PLoS ONE 2023, 18, e0287364. [Google Scholar] [CrossRef]
- Lak, A.; Hasankhan, F.; Garakani, S.A. Principles in Practice: Toward a Conceptual Framework for Resilient Urban Design. J. Environ. Plan. Manag. 2020, 63, 2194–2226. [Google Scholar] [CrossRef]
- Zeng, P.; Zong, C.; Wei, X. Quantitative Analysis and Spatial Pattern Research of Built-up Environments and Surface Urban Heat Island Effect in Beijing’s Main Urban Area. J. Urban Plan. Dev. 2024, 150, 04024006. [Google Scholar] [CrossRef]
- Mohtat, N.; Khirfan, L. Distributive Justice and Urban Form Adaptation to Flooding Risks: Spatial Analysis to Identify Toronto’s Priority Neighborhoods. Front. Sustain. Cities 2022, 4, 919724. [Google Scholar] [CrossRef]
- Quan, D. Research on the process of campus planning and construction of Tianjin (peiyang) university (from 1895 to 2015). Master’s Thesis, Tianjin University, Tianjin, China, 2017. (In Chinese). [Google Scholar]
- Xiu, C.; Wei, Y.; Wang, Q. Evaluation of urban resilience of Dalian city based on the perspective of “Size-Density-Morphology”. Acta Geogr. Sin. 2018, 73, 2315–2328. (In Chinese) [Google Scholar] [CrossRef]
- Zuo, C.; Yin, B.; Tan, F.; Ma, Z.; Gong, S.; Qi, X. Runoff Simulation and Waterlogging Analysis of Rainstorm Scenarios with Different Return Periods on Campus: A Case Study at China University of Geosciences. Appl. Sci. 2025, 15, 691. [Google Scholar] [CrossRef]
- Fan, C.; Zou, B.; Li, J.; Wang, M.; Liao, Y.; Zhou, X. Exploring the Relationship between Air Temperature and Urban Morphology Factors Using Machine Learning under Local Climate Zones. Case Stud. Therm. Eng. 2024, 55, 104151. [Google Scholar] [CrossRef]
- Elbondira, T.A.; Tokimatsu, K.; Asawa, T.; Ibrahim, M.G. Impact of Neighborhood Spatial Characteristics on the Microclimate in a Hot Arid Climate-a Field Based Study. Sustain. Cities Soc. 2021, 75, 103273. [Google Scholar] [CrossRef]
- Xi, Z.; Li, C.; Zhou, L.; Yang, H.; Burghardt, R. Built Environment Influences on Urban Climate Resilience: Evidence from Extreme Heat Events in Macau. Sci. Total Environ. 2023, 859, 160270. [Google Scholar] [CrossRef]
- Zang, Y.; Wang, H.; Huang, J.; Liu, G.; Li, J. Community Disaster Resilience Assessment and External Association Characteristics Analysis Based on Accessibility of Service Facilities: From the Perspective of 15-Minute Life Circle. Sustain. Cities Soc. 2025, 118, 106051. [Google Scholar] [CrossRef]


| Researcher | Scale | Urban Morphology | Uncertain Disturbance | Dimensional Layer |
|---|---|---|---|---|
| Fusco, G. [37] | Macro | Entire City | General Disturbance | Diversity, Connectivity, Redundancy, Modularity, Efficiency |
| Dhar, T.K. [2] | Macro | Entire City | General Disturbance | Ecological, Physical, Functional, Spatial |
| Liang, Y. [38] | Macro | Entire City | Rainstorm and Flood | Absorption, Coping, Recovery, and Adaptation |
| Zhang Q. [39] | Meso | General Urban Block | Flood | Diversity, Connectivity, Redundancy, Robustness |
| Zhao Q. [40] | Meso | Historic Urban Block | General Disturbance | Diversity, Connectivity, Modularity, Subjectivity, Identity |
| ZHAO P. [41] | Meso | Historic Urban Block | General Disturbance | Modularity, Diversity, Connectivity, Robustness |
| Alawneh, S.M. [42] | Micro | Refugee Neighborhoods | General Disturbance | Connectivity, Diversity, Redundancy, Efficiency |
| Sharifi, A. [15] | Micro | Traditional, Semi-Planned, and Planned Neighborhoods | Earthquake, Flood, Extreme Heat | No Dimensional Layer (Direct Indicator Level) |
| GL | DL | Indicators | Data Sources | EQ 1 | FLD 2 | EH 3 |
|---|---|---|---|---|---|---|
| UCMR | Robustness | Relative population density (A1) | Baidu Map | − 5 | − | − |
| Relative elevation index (A2) | UAV 4 | NA | + 6 | NA 7 | ||
| “Source-sink” landscape average distance (A3) | UAV | NA | − | − | ||
| Building types (A4) | Official Campus Data | − | − | NA | ||
| Building quality (A5) | Official Campus Data | + | + | NA | ||
| Building construction time (A6) | Official Campus Data | + | + | NA | ||
| Road height-to-width ratio (A7) | UAV | − | NA | + | ||
| Sky view factor (A8) | UAV | + | NA | − | ||
| Floor area ratio (A9) | UAV | − | − | − | ||
| Redundancy | Permeable surface ratio (A10) | UAV | NA | + | + | |
| Vegetation coverage (A11) | UAV | NA | + | + | ||
| Emergency shelter density (A12) | UAV | + | NA | NA | ||
| Commercial facilities density (A13) | Amap | + | + | + | ||
| Healthcare facilities density (A14) | Amap | + | + | + | ||
| Fire stations density (A15) | Amap | + | + | + | ||
| Connectivity | Average road width (A16) | UAV | + | + | + | |
| Betweenness centrality (A17) | UAV | − | − | − | ||
| Closeness centrality (A18) | UAV | − | − | − | ||
| Average distance to campus entrances (A19) | UAV | − | − | − | ||
| Coverage of emergency shelters (A20) | UAV | − | NA | NA | ||
| Average distance to commercial facilities (A21) | Amap | − | − | − | ||
| Average distance to healthcare facilities (A22) | Amap | − | − | − | ||
| Average distance to fire stations (A23) | Amap | − | − | − | ||
| Diversity | Building function mix index (A24) | Official Campus Data | + | + | + | |
| Emergency facilities mix index (A25) | Amap | + | + | + | ||
| Intersection density (A26) | UAV | + | + | + |
| DL | Weights | Indicators | Weights | ||||||||||
|---|---|---|---|---|---|---|---|---|---|---|---|---|---|
| Earthquake | Flooding | Extreme Heat | Earthquake | Flooding | Extreme Heat | ||||||||
| AHP | EWM | CW | AHP | EWM | CW | AHP | EWM | CW | |||||
| Robustness | 0.2885 | 0.2717 | 0.2769 | A1 | 0.050 | 0.074 | 0.060 | 0.056 | 0.066 | 0.060 | 0.044 | 0.076 | 0.058 |
| A2 | / | / | / | 0.110 | 0.061 | 0.089 | / | / | / | ||||
| A3 | / | / | / | 0.039 | 0.008 | 0.026 | 0.046 | 0.009 | 0.030 | ||||
| A4 | 0.030 | 0.013 | 0.023 | 0.030 | 0.012 | 0.022 | / | / | / | ||||
| A5 | 0.135 | 0.030 | 0.091 | 0.027 | 0.026 | 0.027 | / | / | / | ||||
| A6 | 0.020 | 0.052 | 0.033 | 0.024 | 0.046 | 0.033 | / | / | / | ||||
| A7 | 0.028 | 0.004 | 0.018 | / | / | / | 0.084 | 0.087 | 0.085 | ||||
| A8 | 0.015 | 0.034 | 0.023 | / | / | / | 0.115 | 0.044 | 0.085 | ||||
| A9 | 0.066 | 0.006 | 0.041 | 0.024 | 0.005 | 0.016 | 0.030 | 0.006 | 0.019 | ||||
| Redundancy | 0.2950 | 0.3539 | 0.3609 | A10 | / | / | / | 0.095 | 0.029 | 0.066 | 0.107 | 0.034 | 0.076 |
| A11 | / | / | / | 0.083 | 0.049 | 0.069 | 0.080 | 0.057 | 0.070 | ||||
| A12 | 0.095 | 0.109 | 0.101 | 0.032 | 0.097 | 0.060 | / | / | / | ||||
| A13 | 0.034 | 0.077 | 0.052 | 0.029 | 0.068 | 0.046 | 0.032 | 0.079 | 0.052 | ||||
| A14 | 0.059 | 0.120 | 0.085 | 0.045 | 0.107 | 0.072 | 0.050 | 0.124 | 0.082 | ||||
| A15 | 0.059 | 0.056 | 0.058 | 0.036 | 0.050 | 0.042 | 0.099 | 0.058 | 0.081 | ||||
| Connectivity | 0.2569 | 0.2379 | 0.2510 | A16 | 0.015 | 0.061 | 0.034 | 0.012 | 0.054 | 0.030 | 0.018 | 0.063 | 0.037 |
| A17 | 0.018 | 0.009 | 0.014 | 0.023 | 0.008 | 0.017 | 0.016 | 0.009 | 0.013 | ||||
| A18 | 0.019 | 0.034 | 0.025 | 0.023 | 0.030 | 0.026 | 0.017 | 0.035 | 0.025 | ||||
| A19 | 0.011 | 0.015 | 0.013 | 0.016 | 0.014 | 0.015 | 0.011 | 0.016 | 0.013 | ||||
| A20 | 0.047 | 0.014 | 0.033 | 0.015 | 0.013 | 0.014 | / | / | / | ||||
| A21 | 0.014 | 0.103 | 0.051 | 0.022 | 0.092 | 0.052 | 0.019 | 0.107 | 0.056 | ||||
| A22 | 0.025 | 0.088 | 0.052 | 0.034 | 0.079 | 0.053 | 0.032 | 0.091 | 0.057 | ||||
| A23 | 0.028 | 0.044 | 0.034 | 0.027 | 0.039 | 0.032 | 0.054 | 0.045 | 0.050 | ||||
| Diversity | 0.1595 | 0.1365 | 0.1112 | A24 | 0.076 | 0.019 | 0.052 | 0.072 | 0.017 | 0.048 | 0.051 | 0.020 | 0.037 |
| A25 | 0.110 | 0.009 | 0.067 | 0.090 | 0.008 | 0.054 | 0.074 | 0.009 | 0.046 | ||||
| A26 | 0.046 | 0.031 | 0.040 | 0.039 | 0.027 | 0.034 | 0.025 | 0.032 | 0.028 | ||||
 | 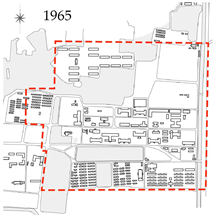 |  | 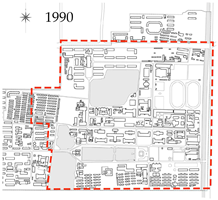 | ||
| Sluggish Development Period (1952–1965) | Basic Stagnation Period (1965–1976) | Planning Adjustment Period (1976–1985) | Rapid Construction Period (1985–2000) | ||
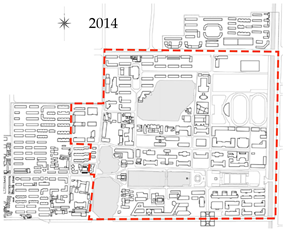 | 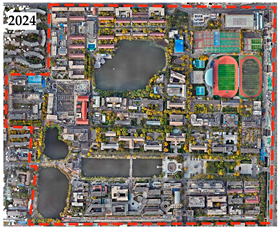 | 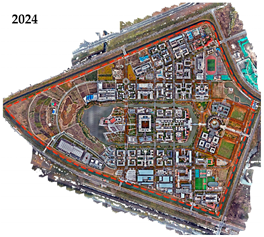 | |||
| Basic Shaping Period (2000–2015) | Relocation and Adjustment Period (2015-present) | ||||
Disclaimer/Publisher’s Note: The statements, opinions and data contained in all publications are solely those of the individual author(s) and contributor(s) and not of MDPI and/or the editor(s). MDPI and/or the editor(s) disclaim responsibility for any injury to people or property resulting from any ideas, methods, instructions or products referred to in the content. |
© 2025 by the authors. Licensee MDPI, Basel, Switzerland. This article is an open access article distributed under the terms and conditions of the Creative Commons Attribution (CC BY) license (https://creativecommons.org/licenses/by/4.0/).
Share and Cite
Han, Y.; Gao, H. An Assessment of University Campus Morphological Resilience Under Typical Disaster Scenarios: A Case Study of the Two Campuses of Tianjin University. Land 2025, 14, 1282. https://doi.org/10.3390/land14061282
Han Y, Gao H. An Assessment of University Campus Morphological Resilience Under Typical Disaster Scenarios: A Case Study of the Two Campuses of Tianjin University. Land. 2025; 14(6):1282. https://doi.org/10.3390/land14061282
Chicago/Turabian StyleHan, Yuqi, and Hao Gao. 2025. "An Assessment of University Campus Morphological Resilience Under Typical Disaster Scenarios: A Case Study of the Two Campuses of Tianjin University" Land 14, no. 6: 1282. https://doi.org/10.3390/land14061282
APA StyleHan, Y., & Gao, H. (2025). An Assessment of University Campus Morphological Resilience Under Typical Disaster Scenarios: A Case Study of the Two Campuses of Tianjin University. Land, 14(6), 1282. https://doi.org/10.3390/land14061282