
Sparing or Sharing? Differential Management of Cultivated Land Based on the “Landscape Differentiation–Function Matching” Analytical Framework


Abstract

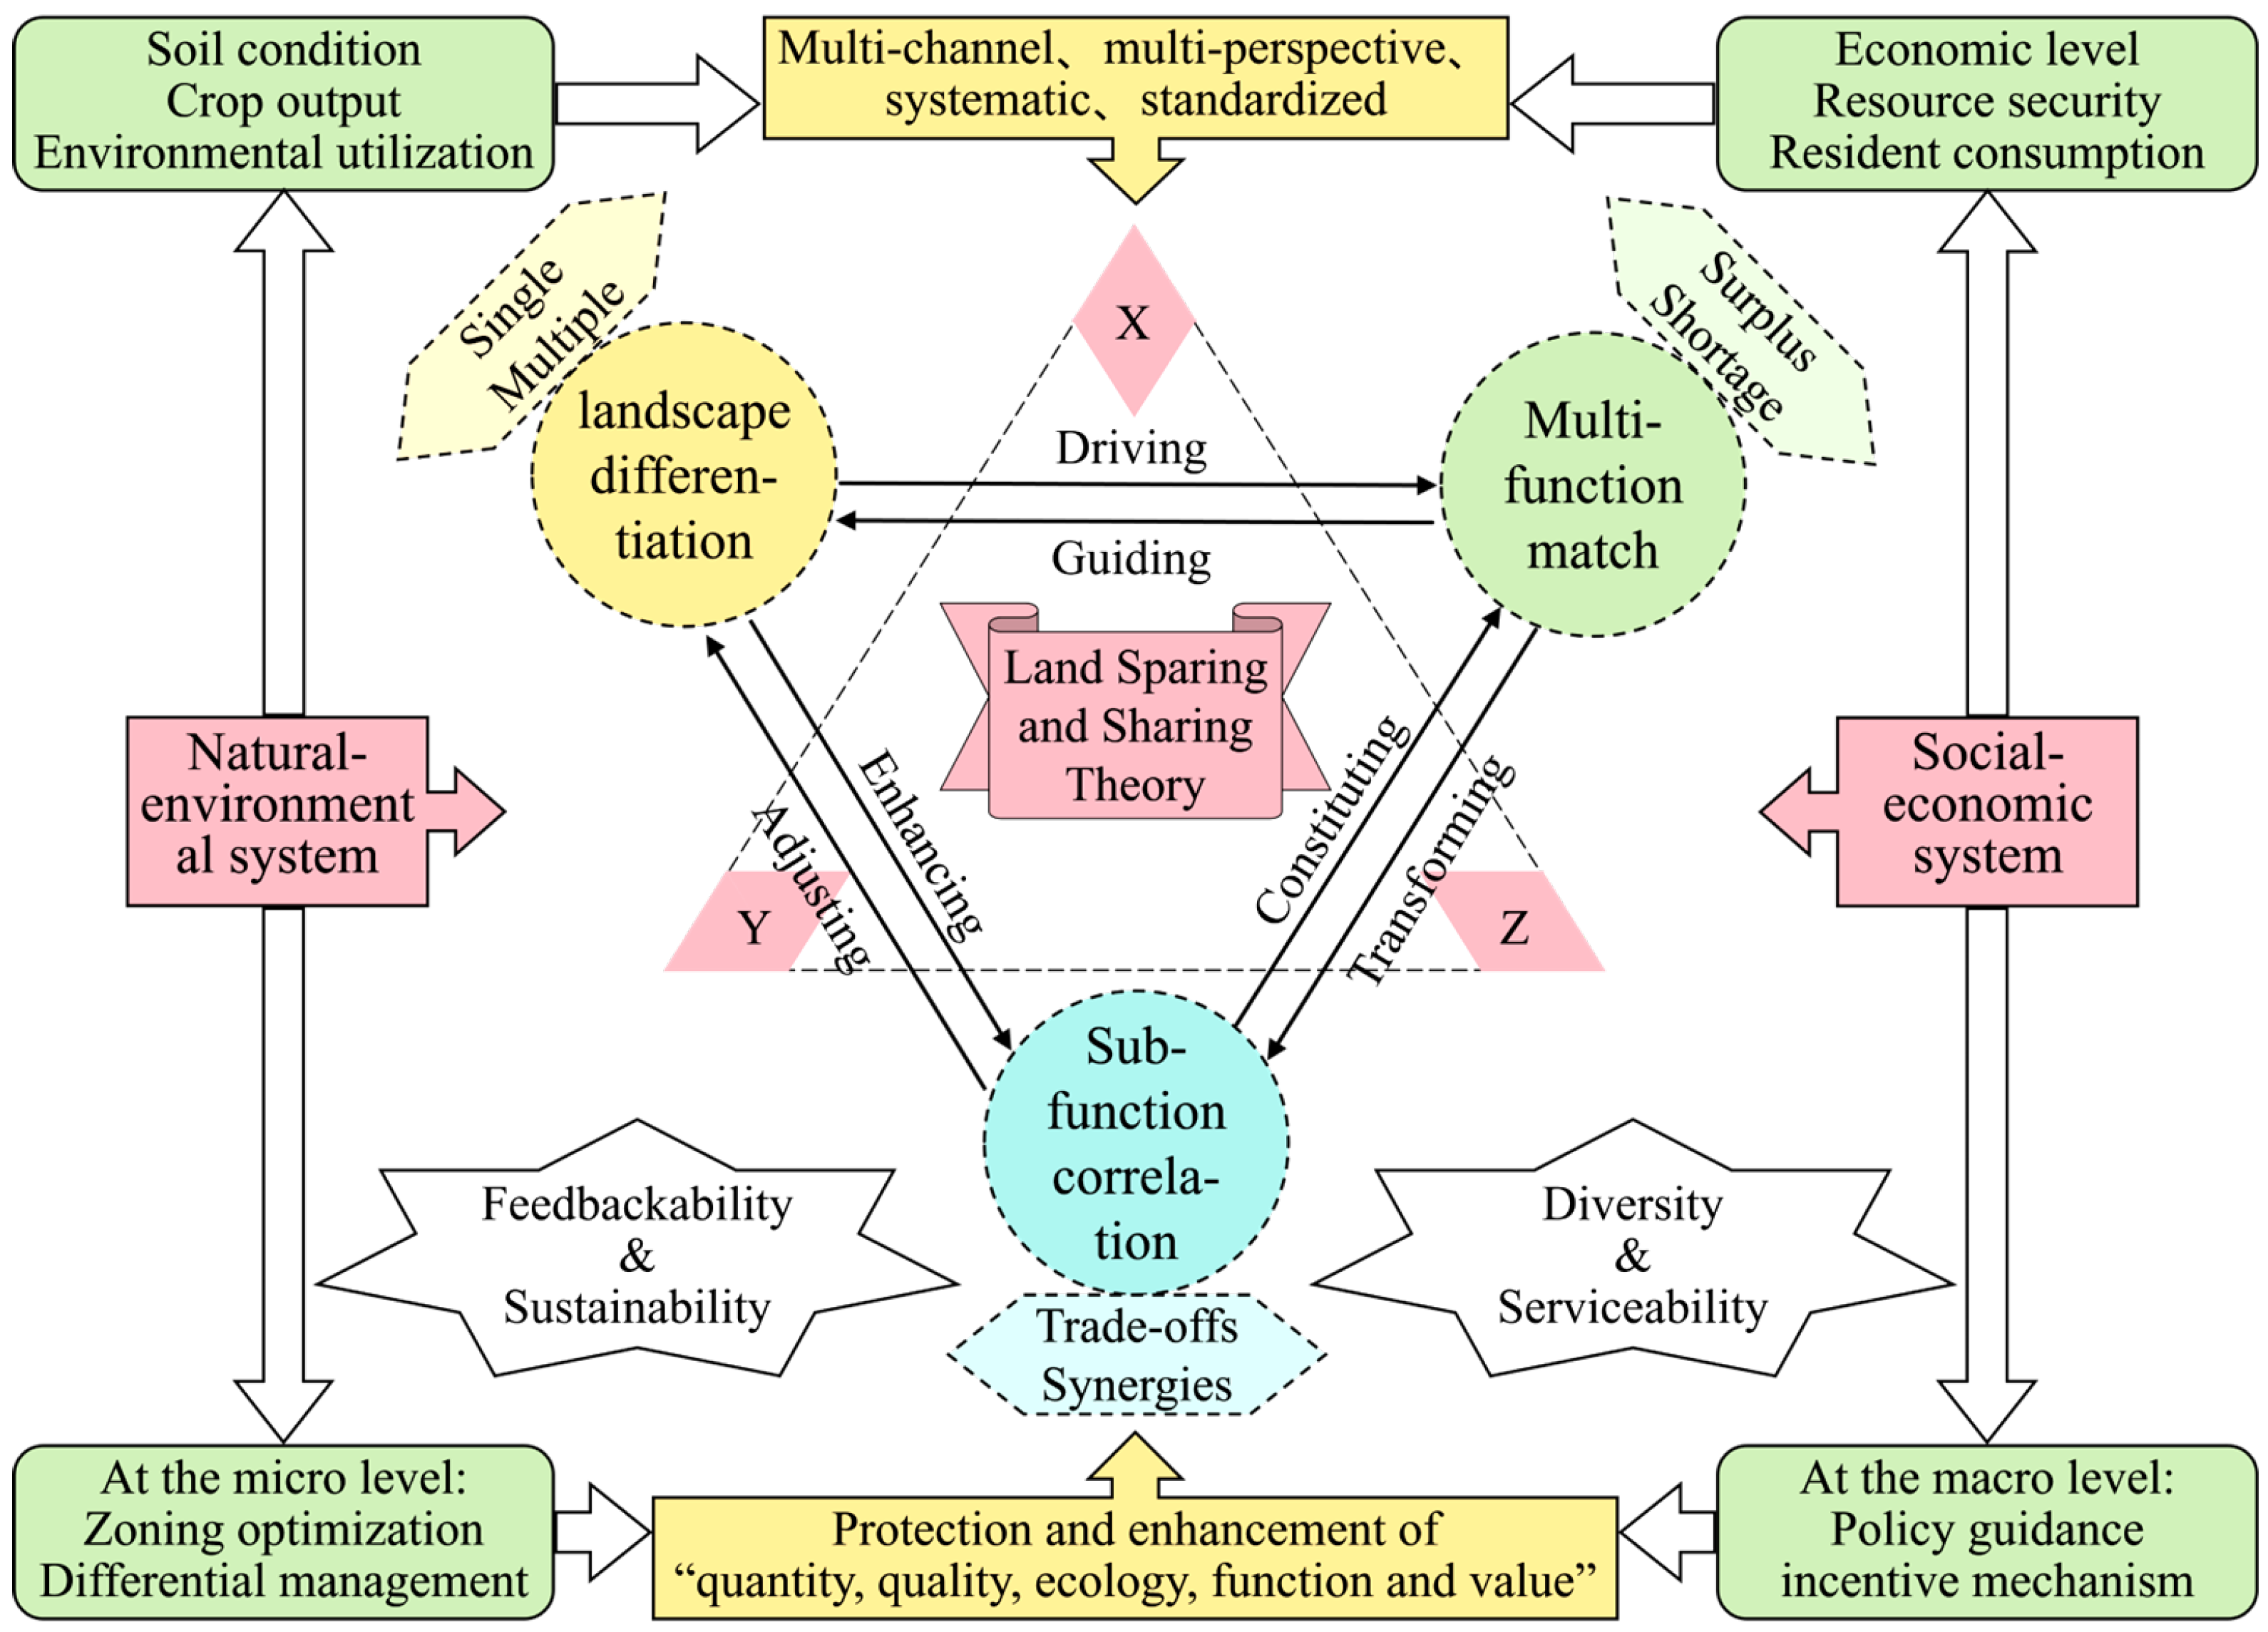
1. Introduction
2. Materials and Methods
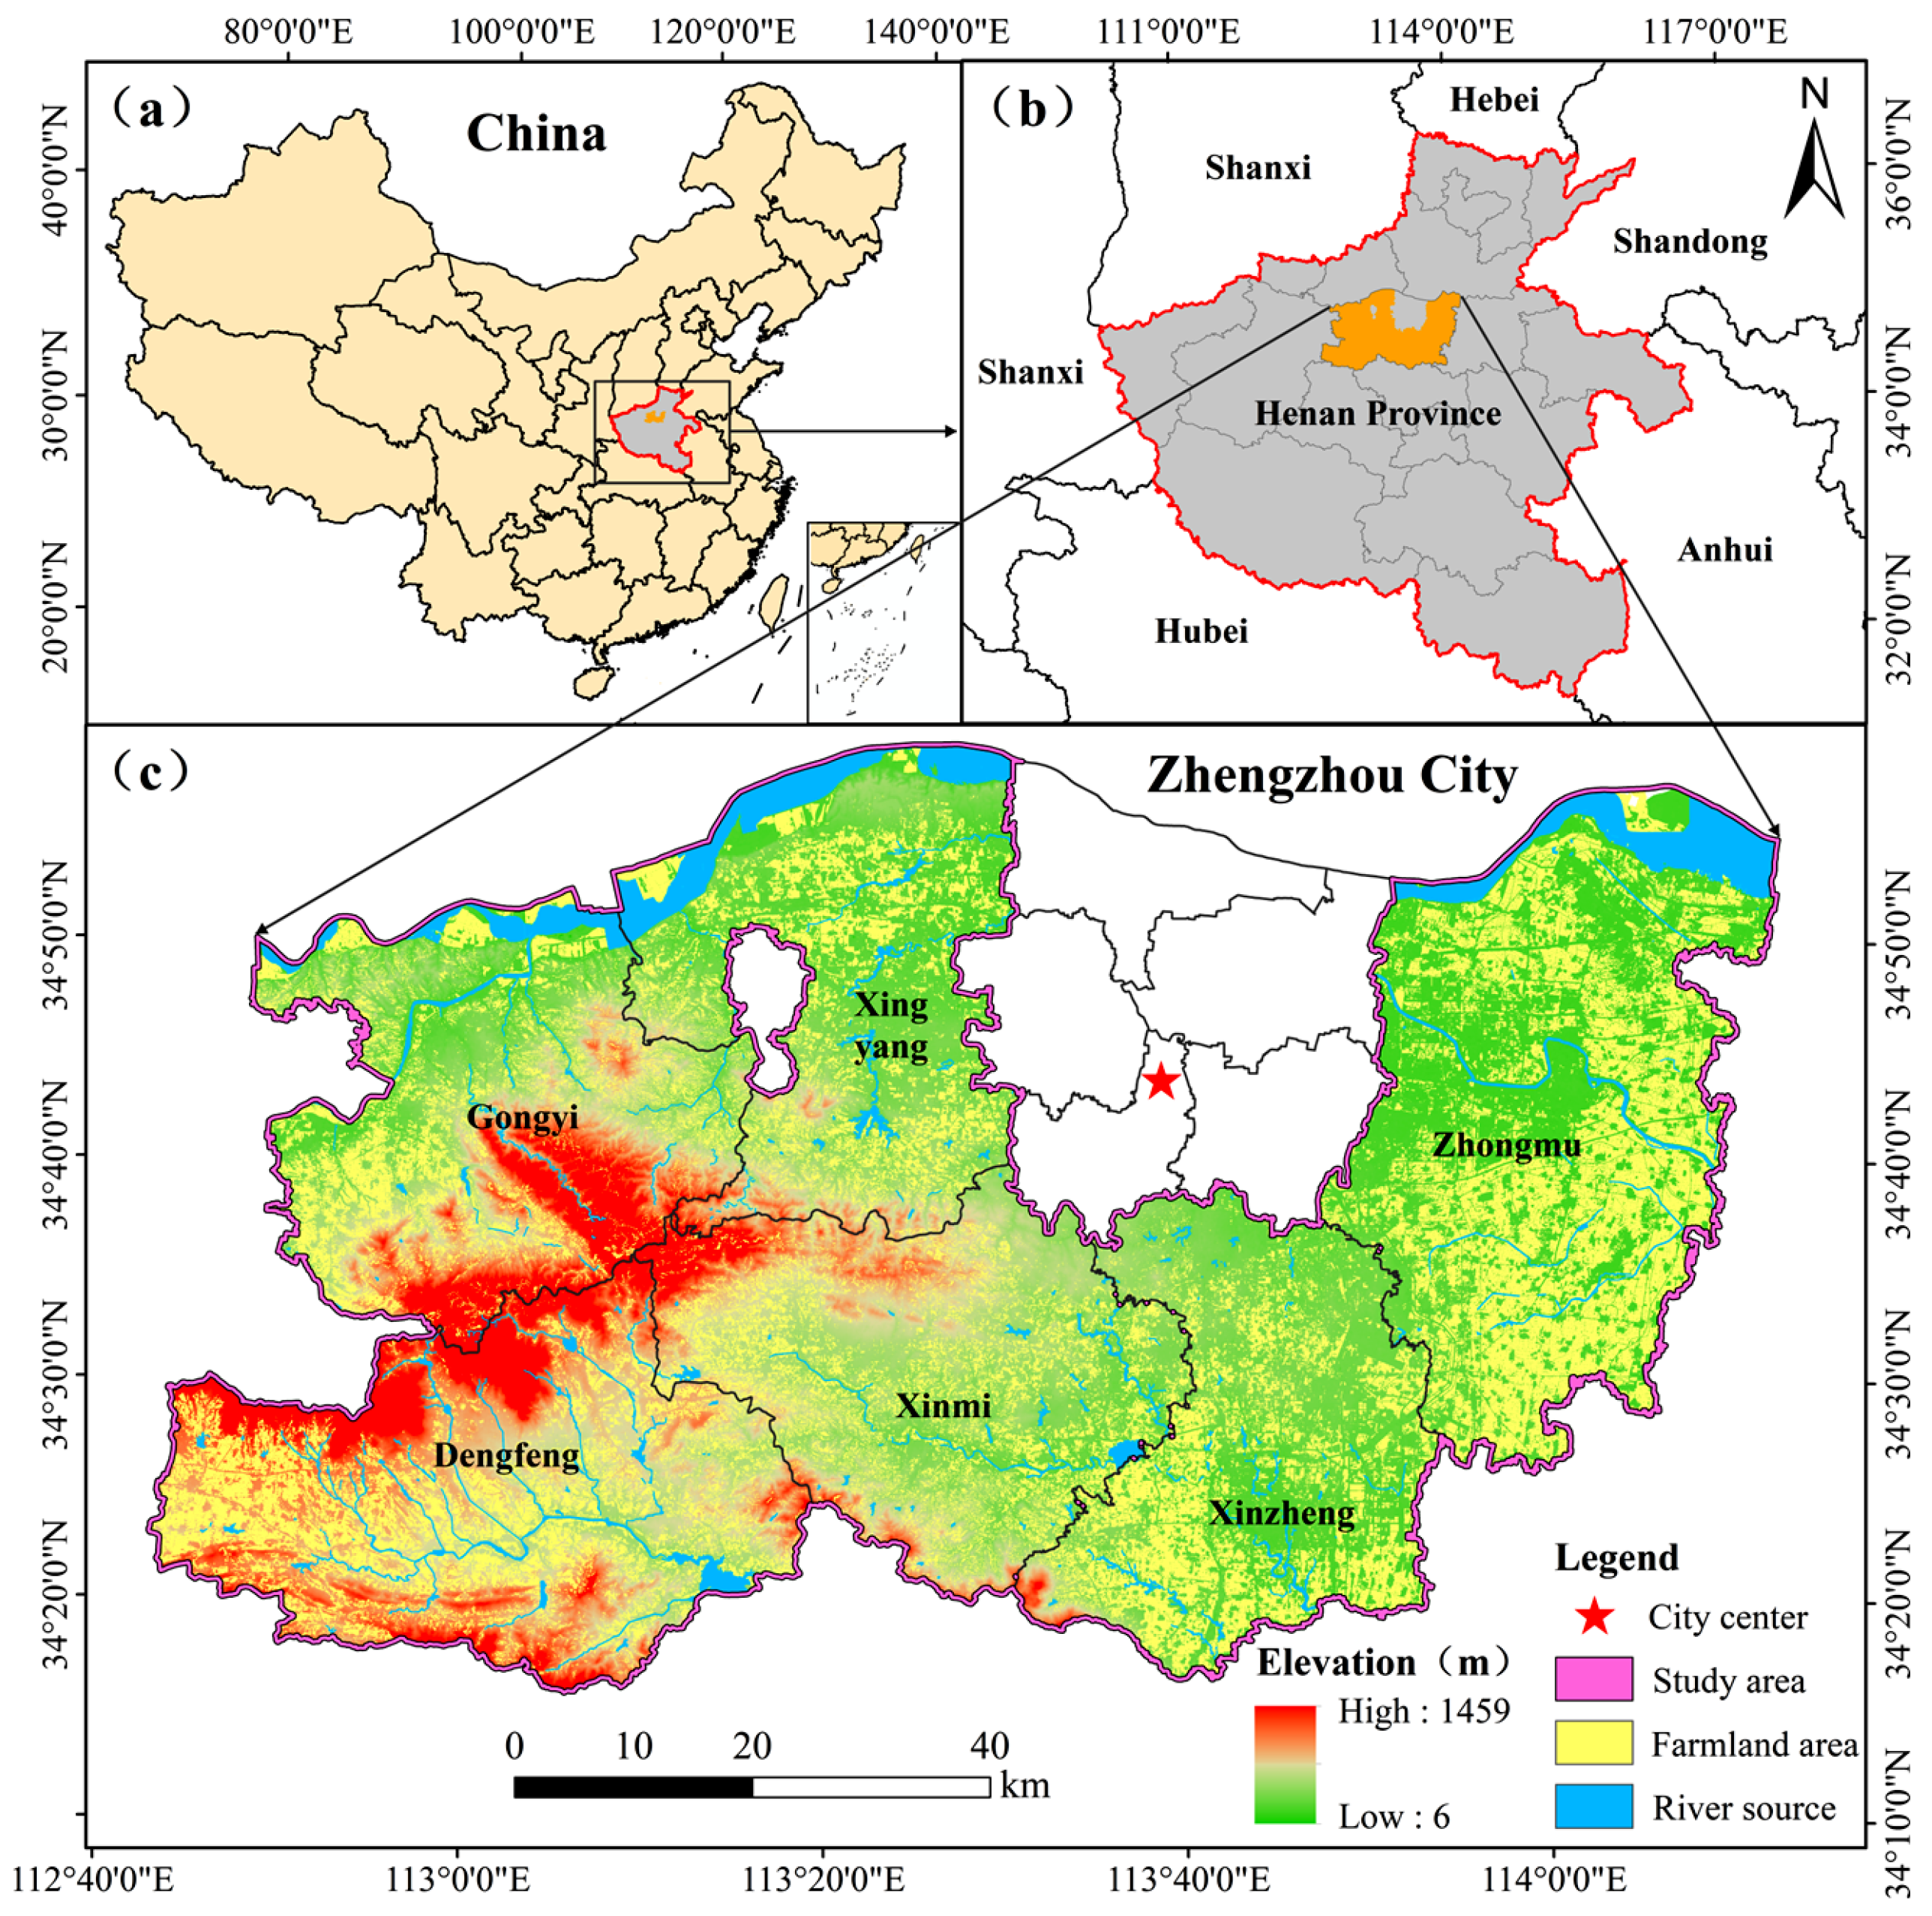
2.1. Study Area
2.2. Data Sources
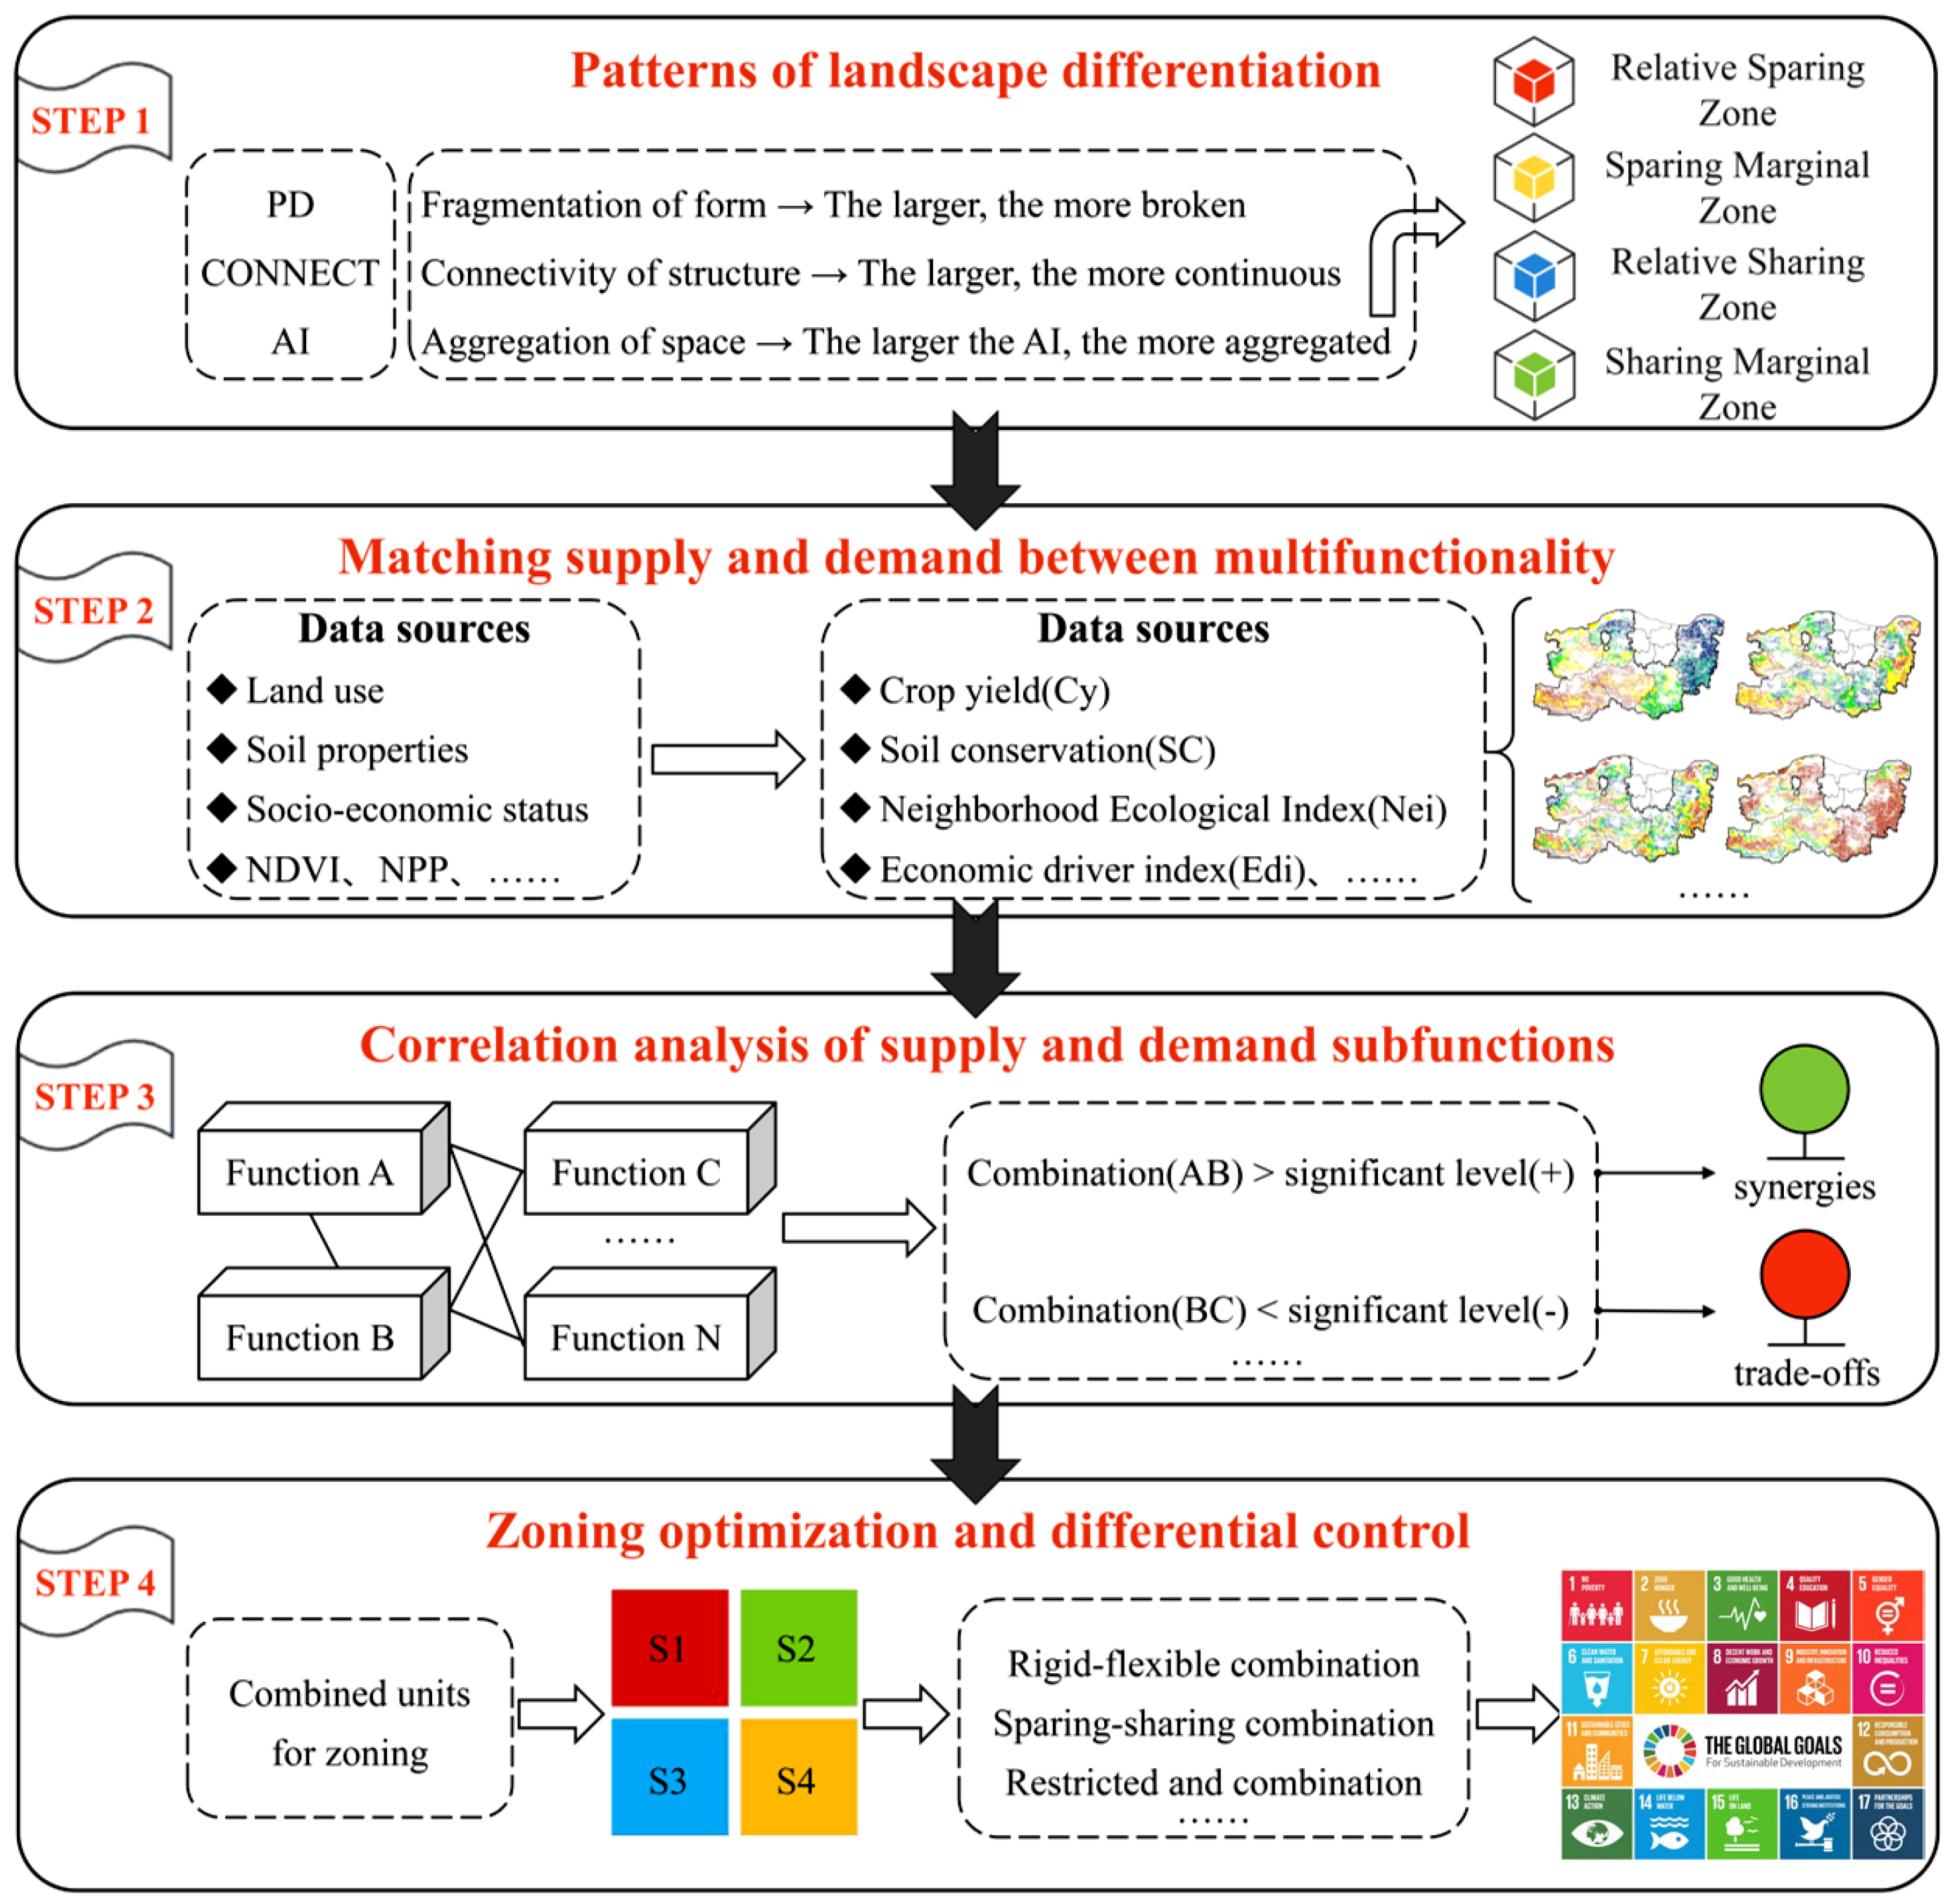
2.3. Research Methodology
2.3.1. Landscape Character Recognition
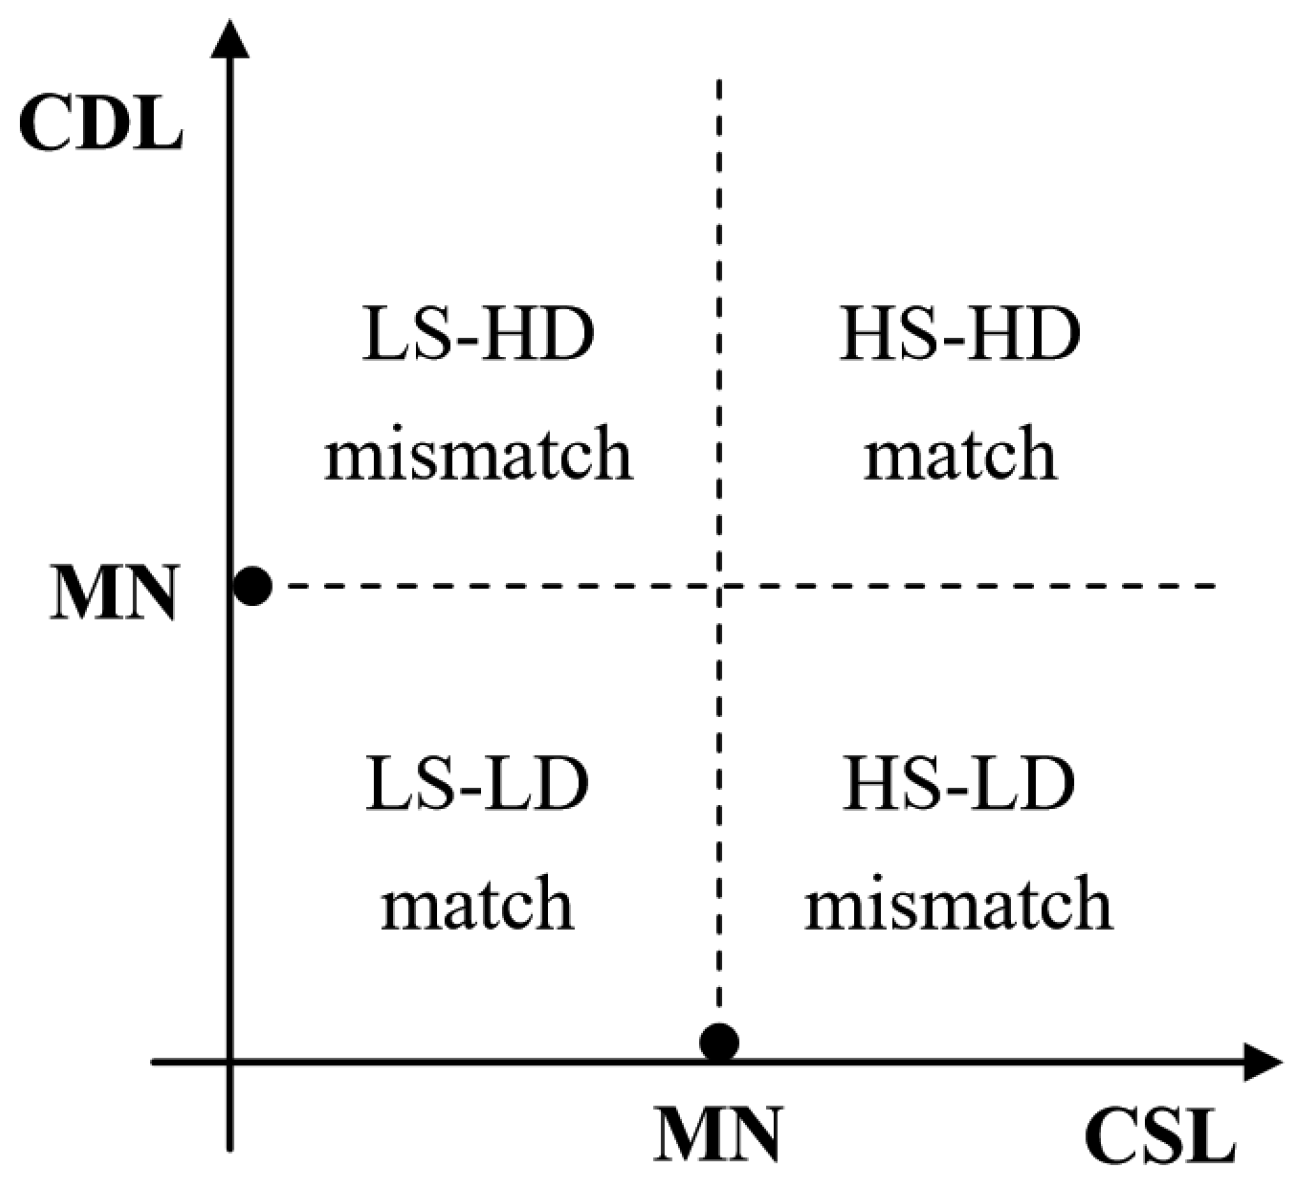
2.3.2. Evaluation System Construction and Matching Supply and Demand
2.3.3. Analysis of Trade-Offs/Synergies Between Multifunctionality
3. Results
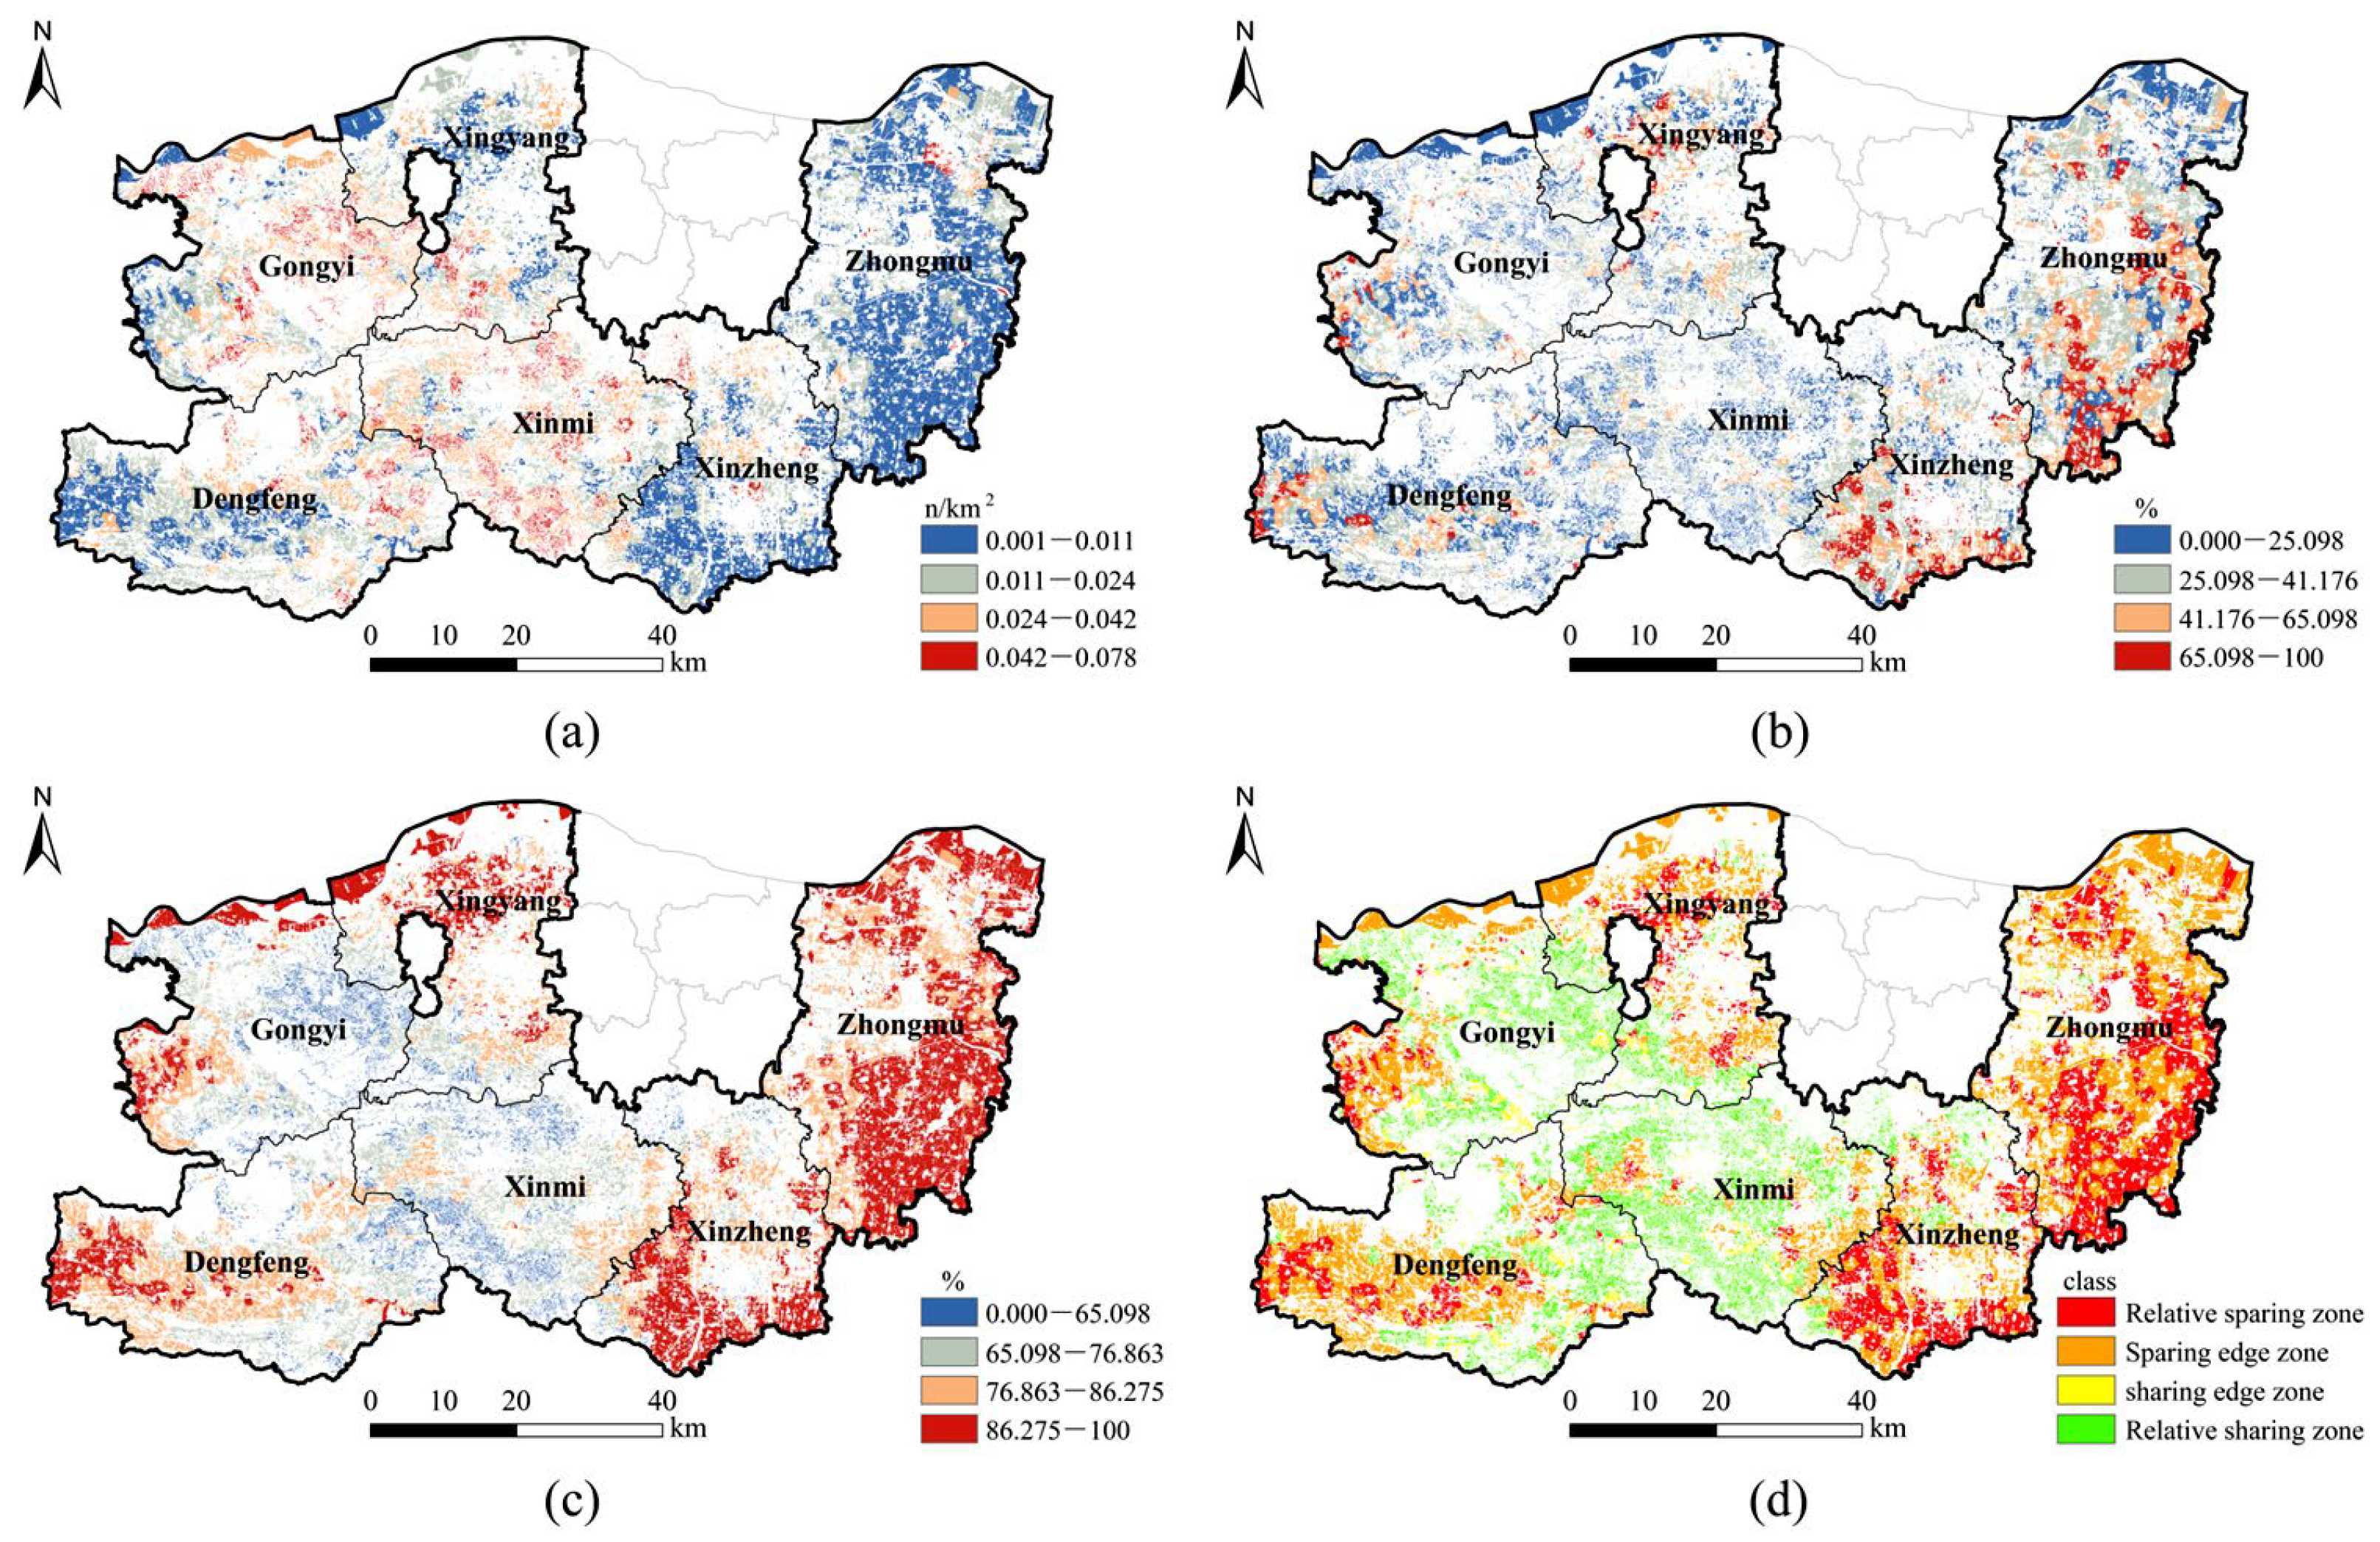
3.1. Landscape Pattern Analysis
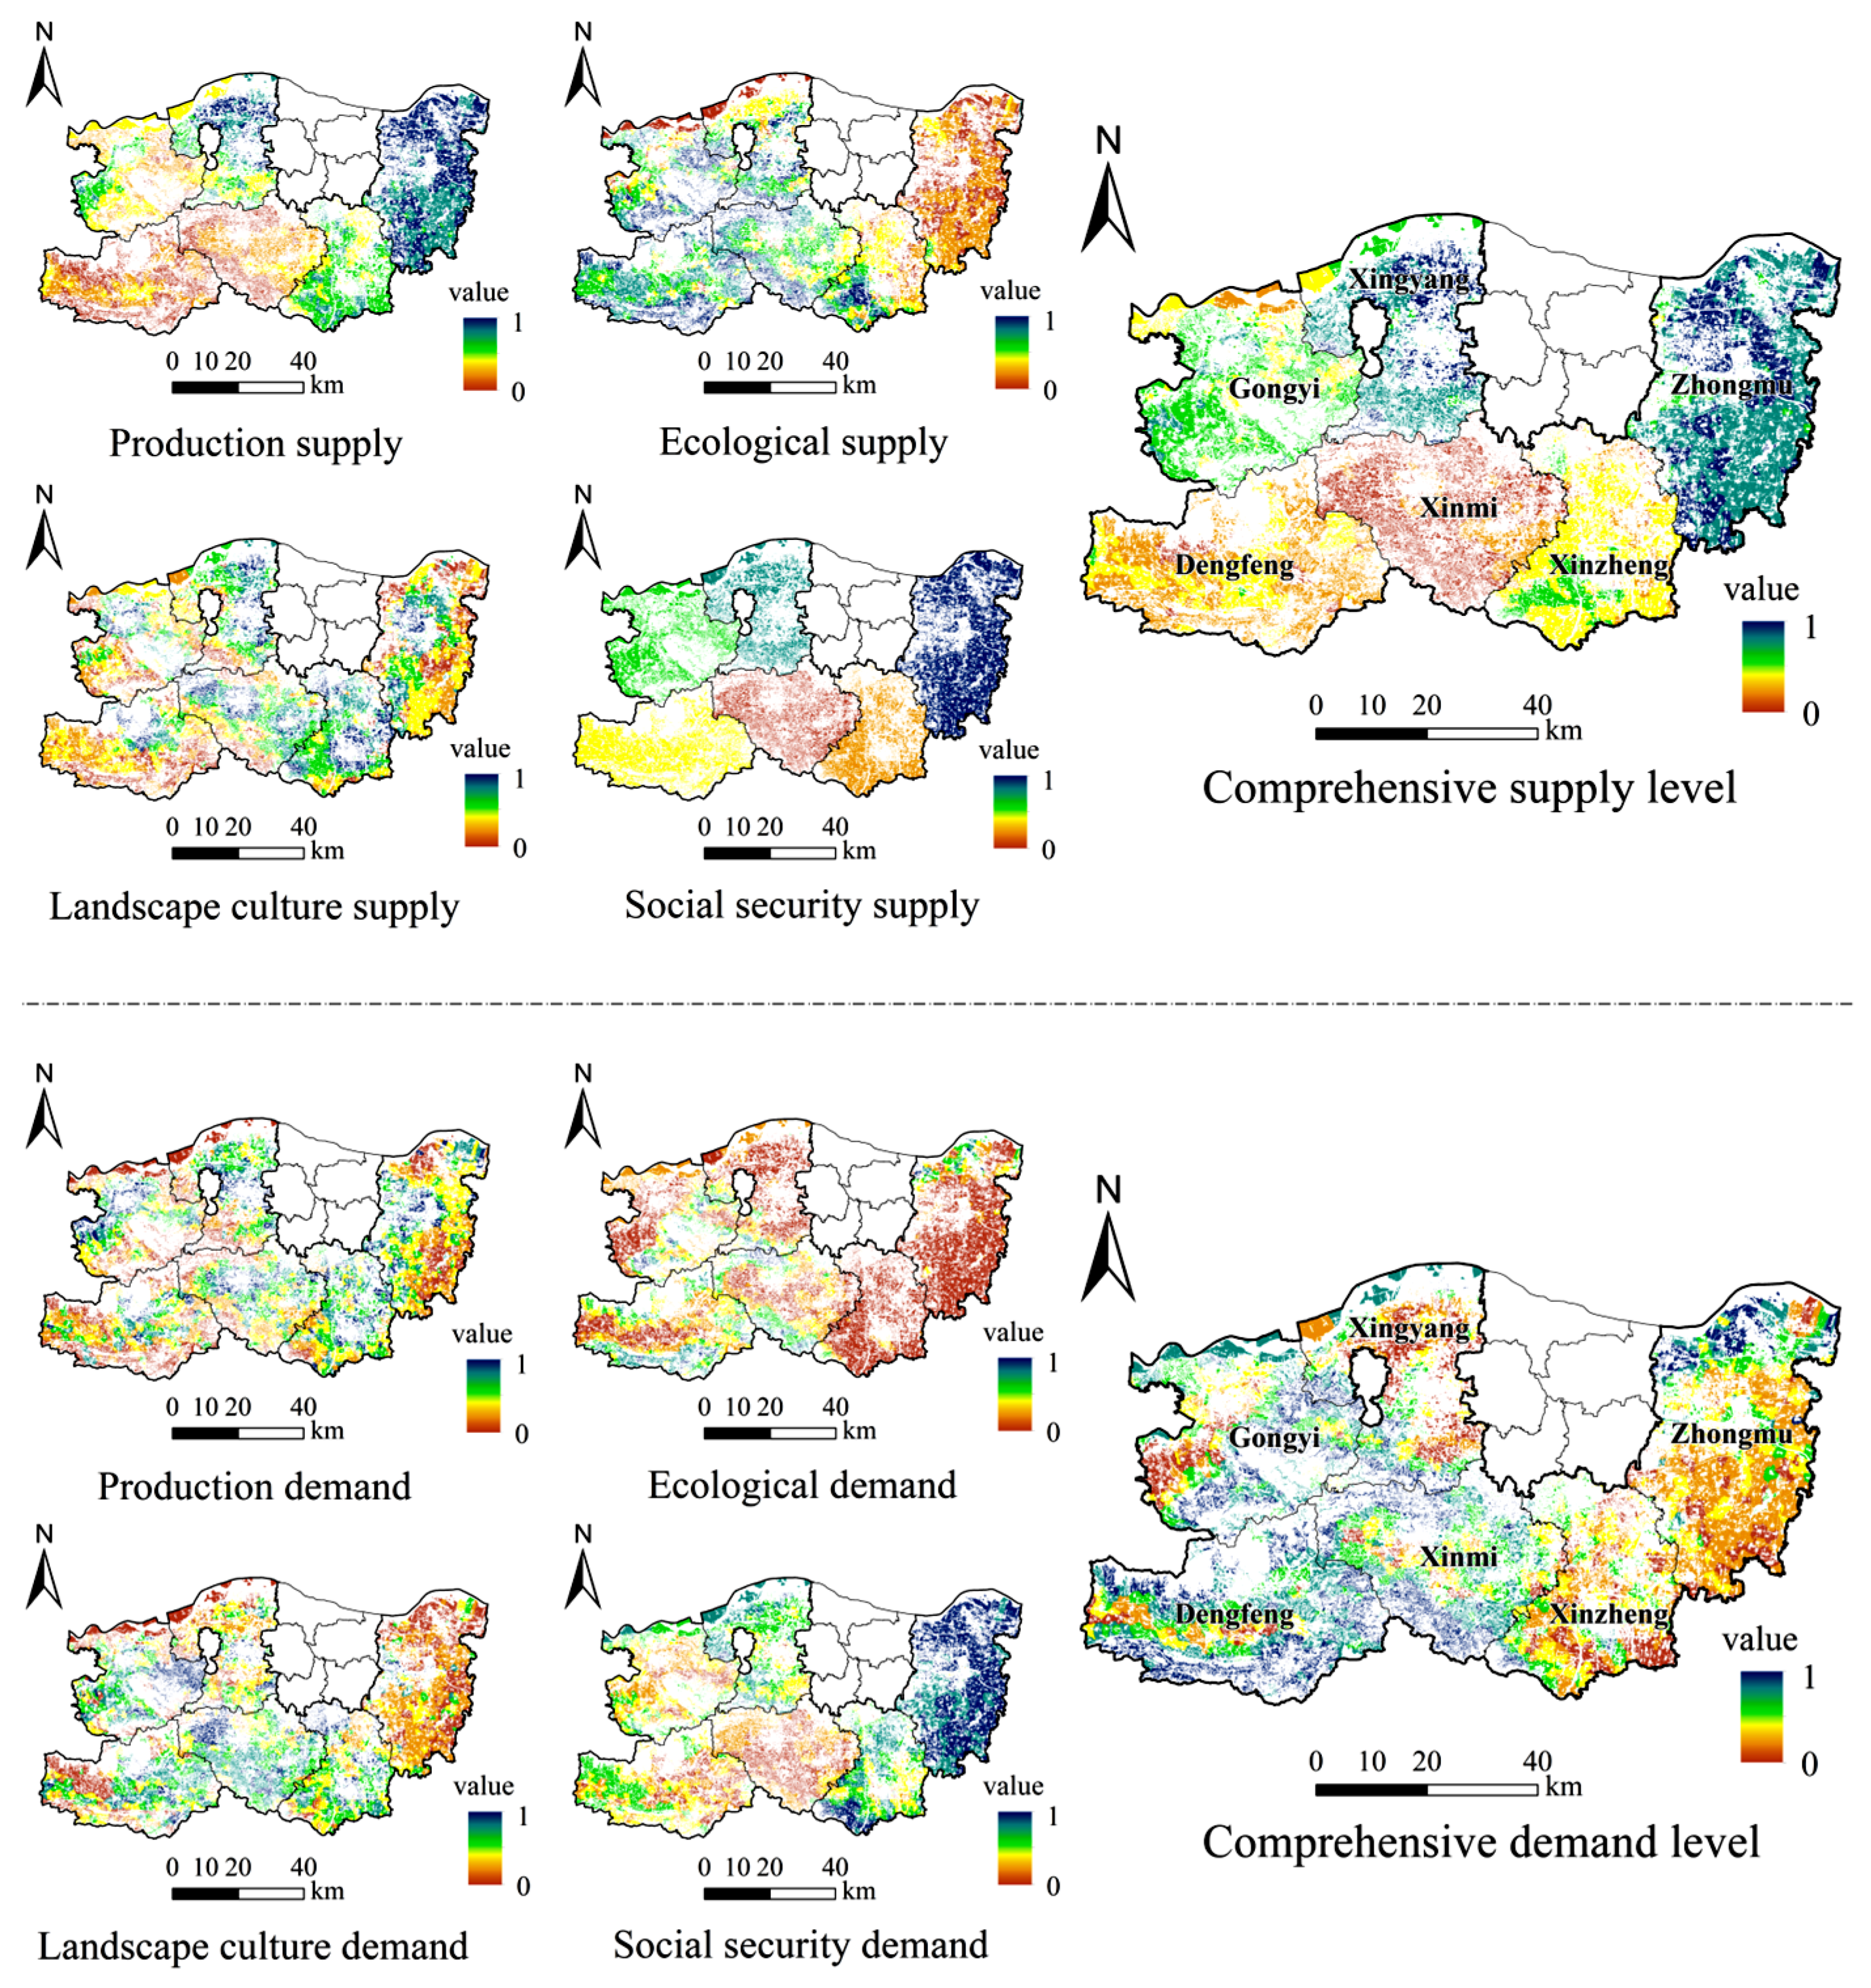
3.2. Multifunctional Evaluation Analysis
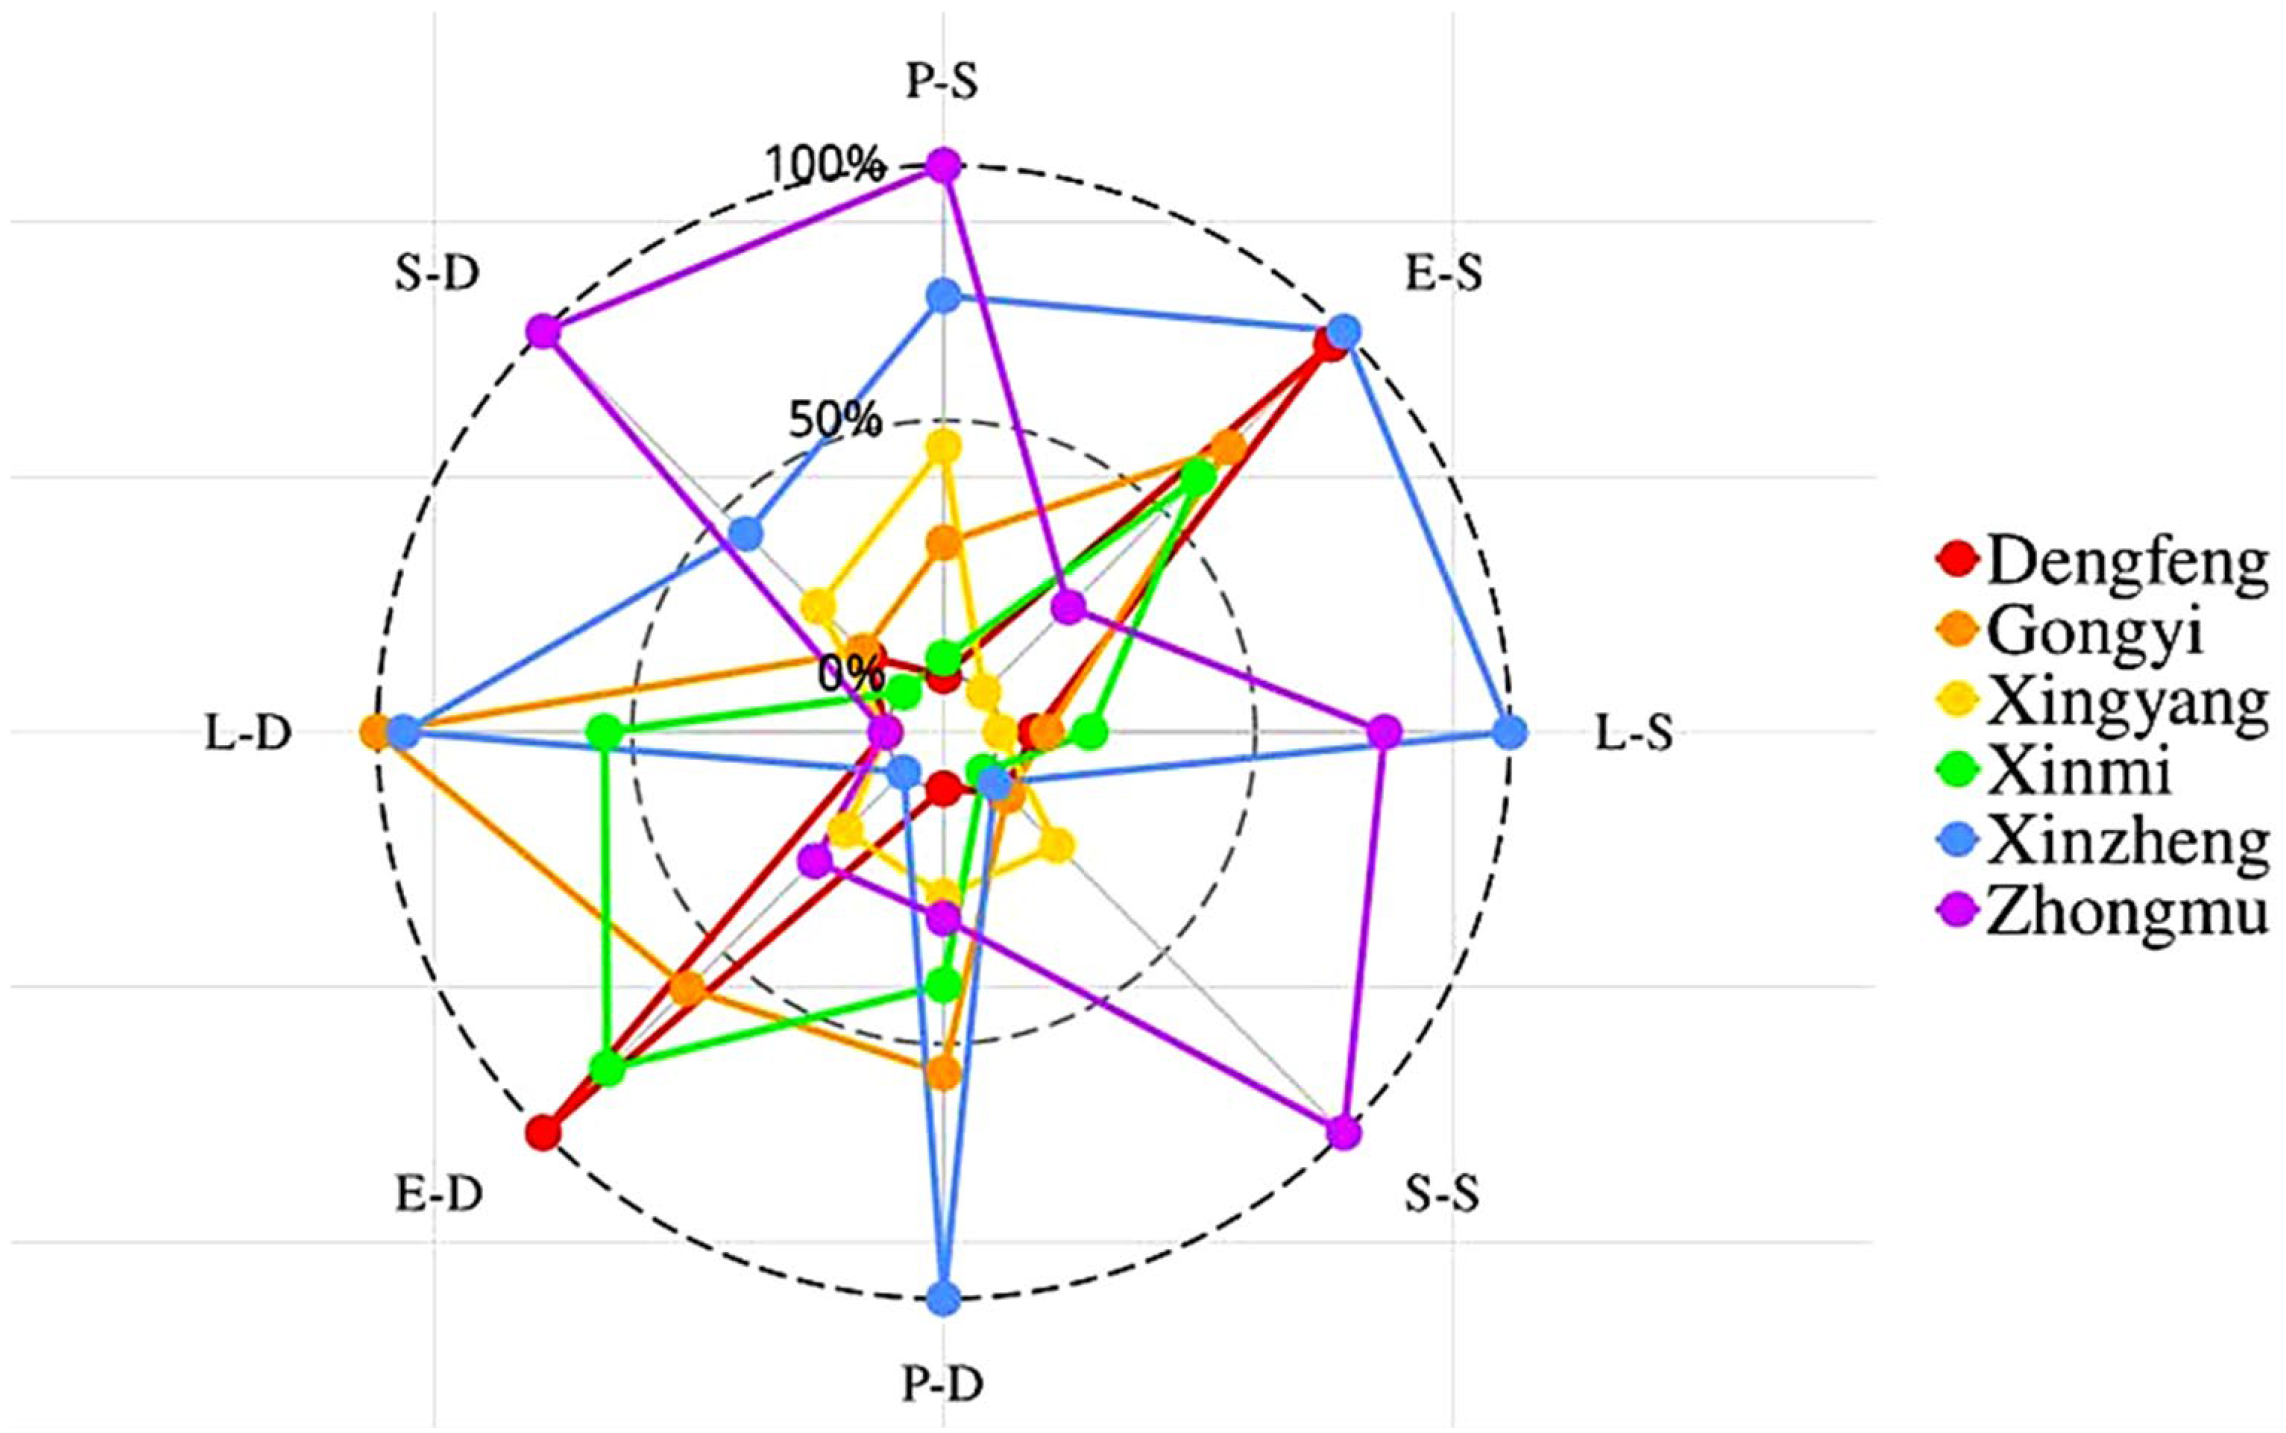
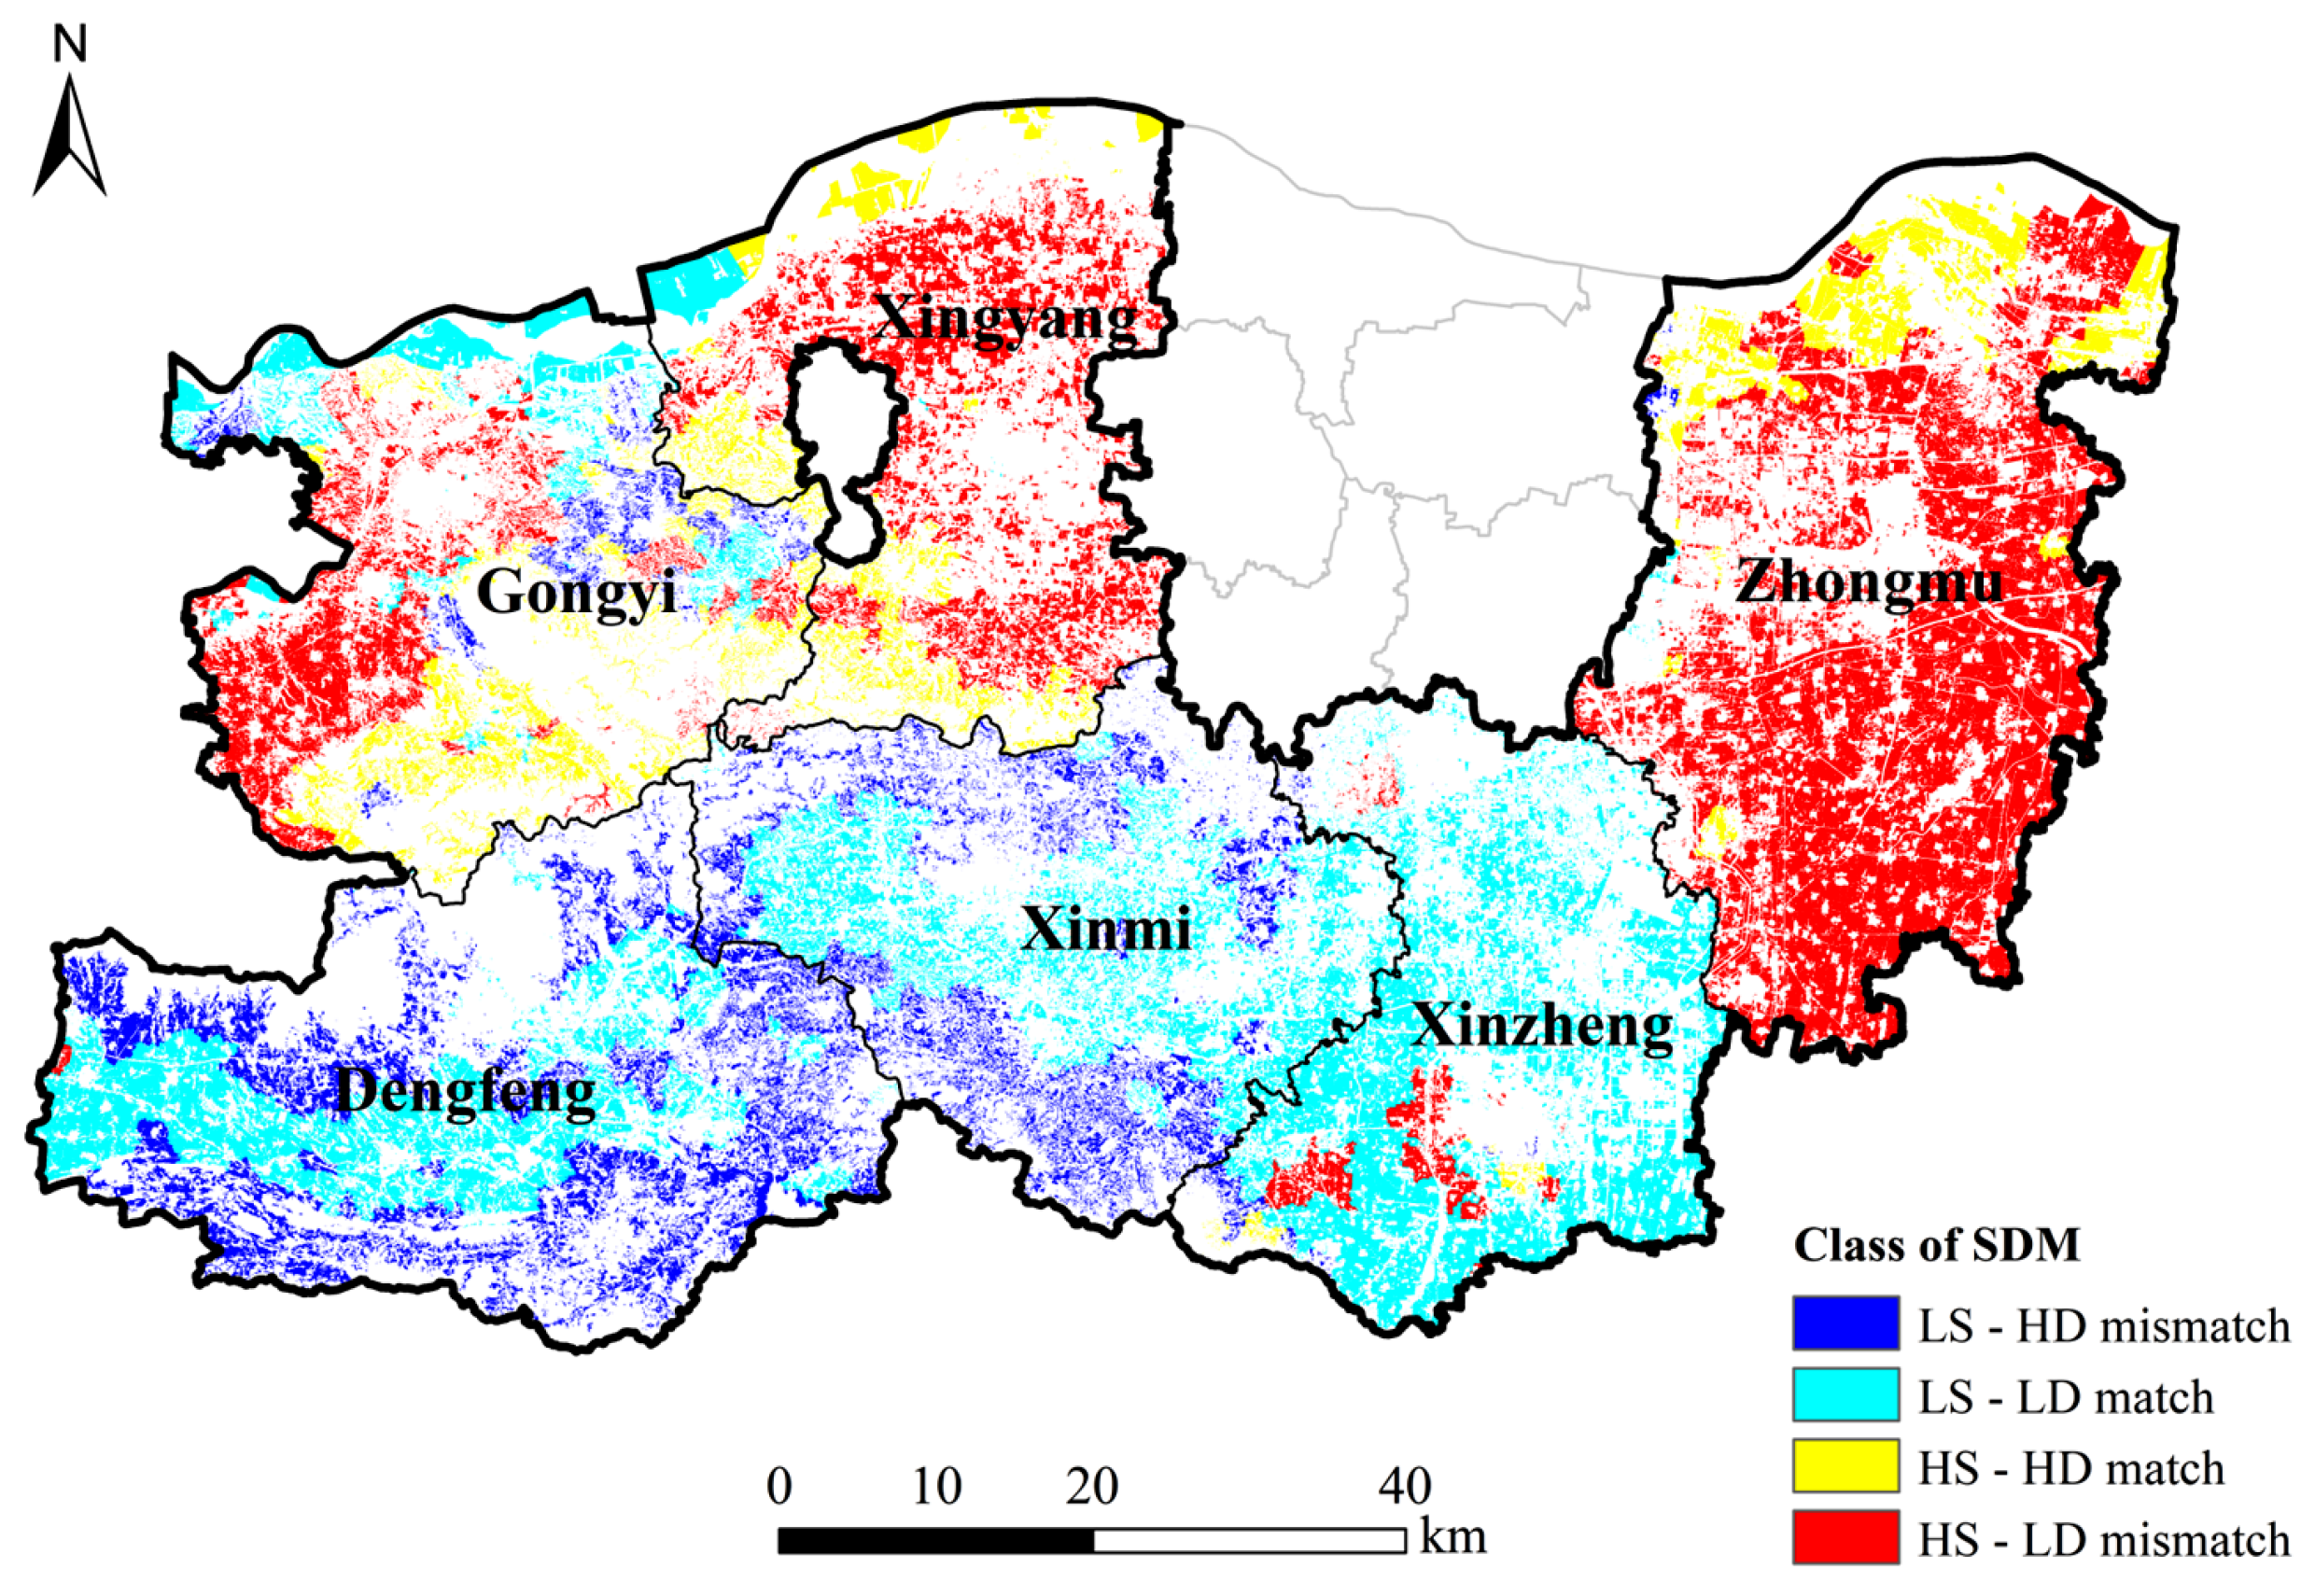
3.3. Supply and Demand Matching Analysis
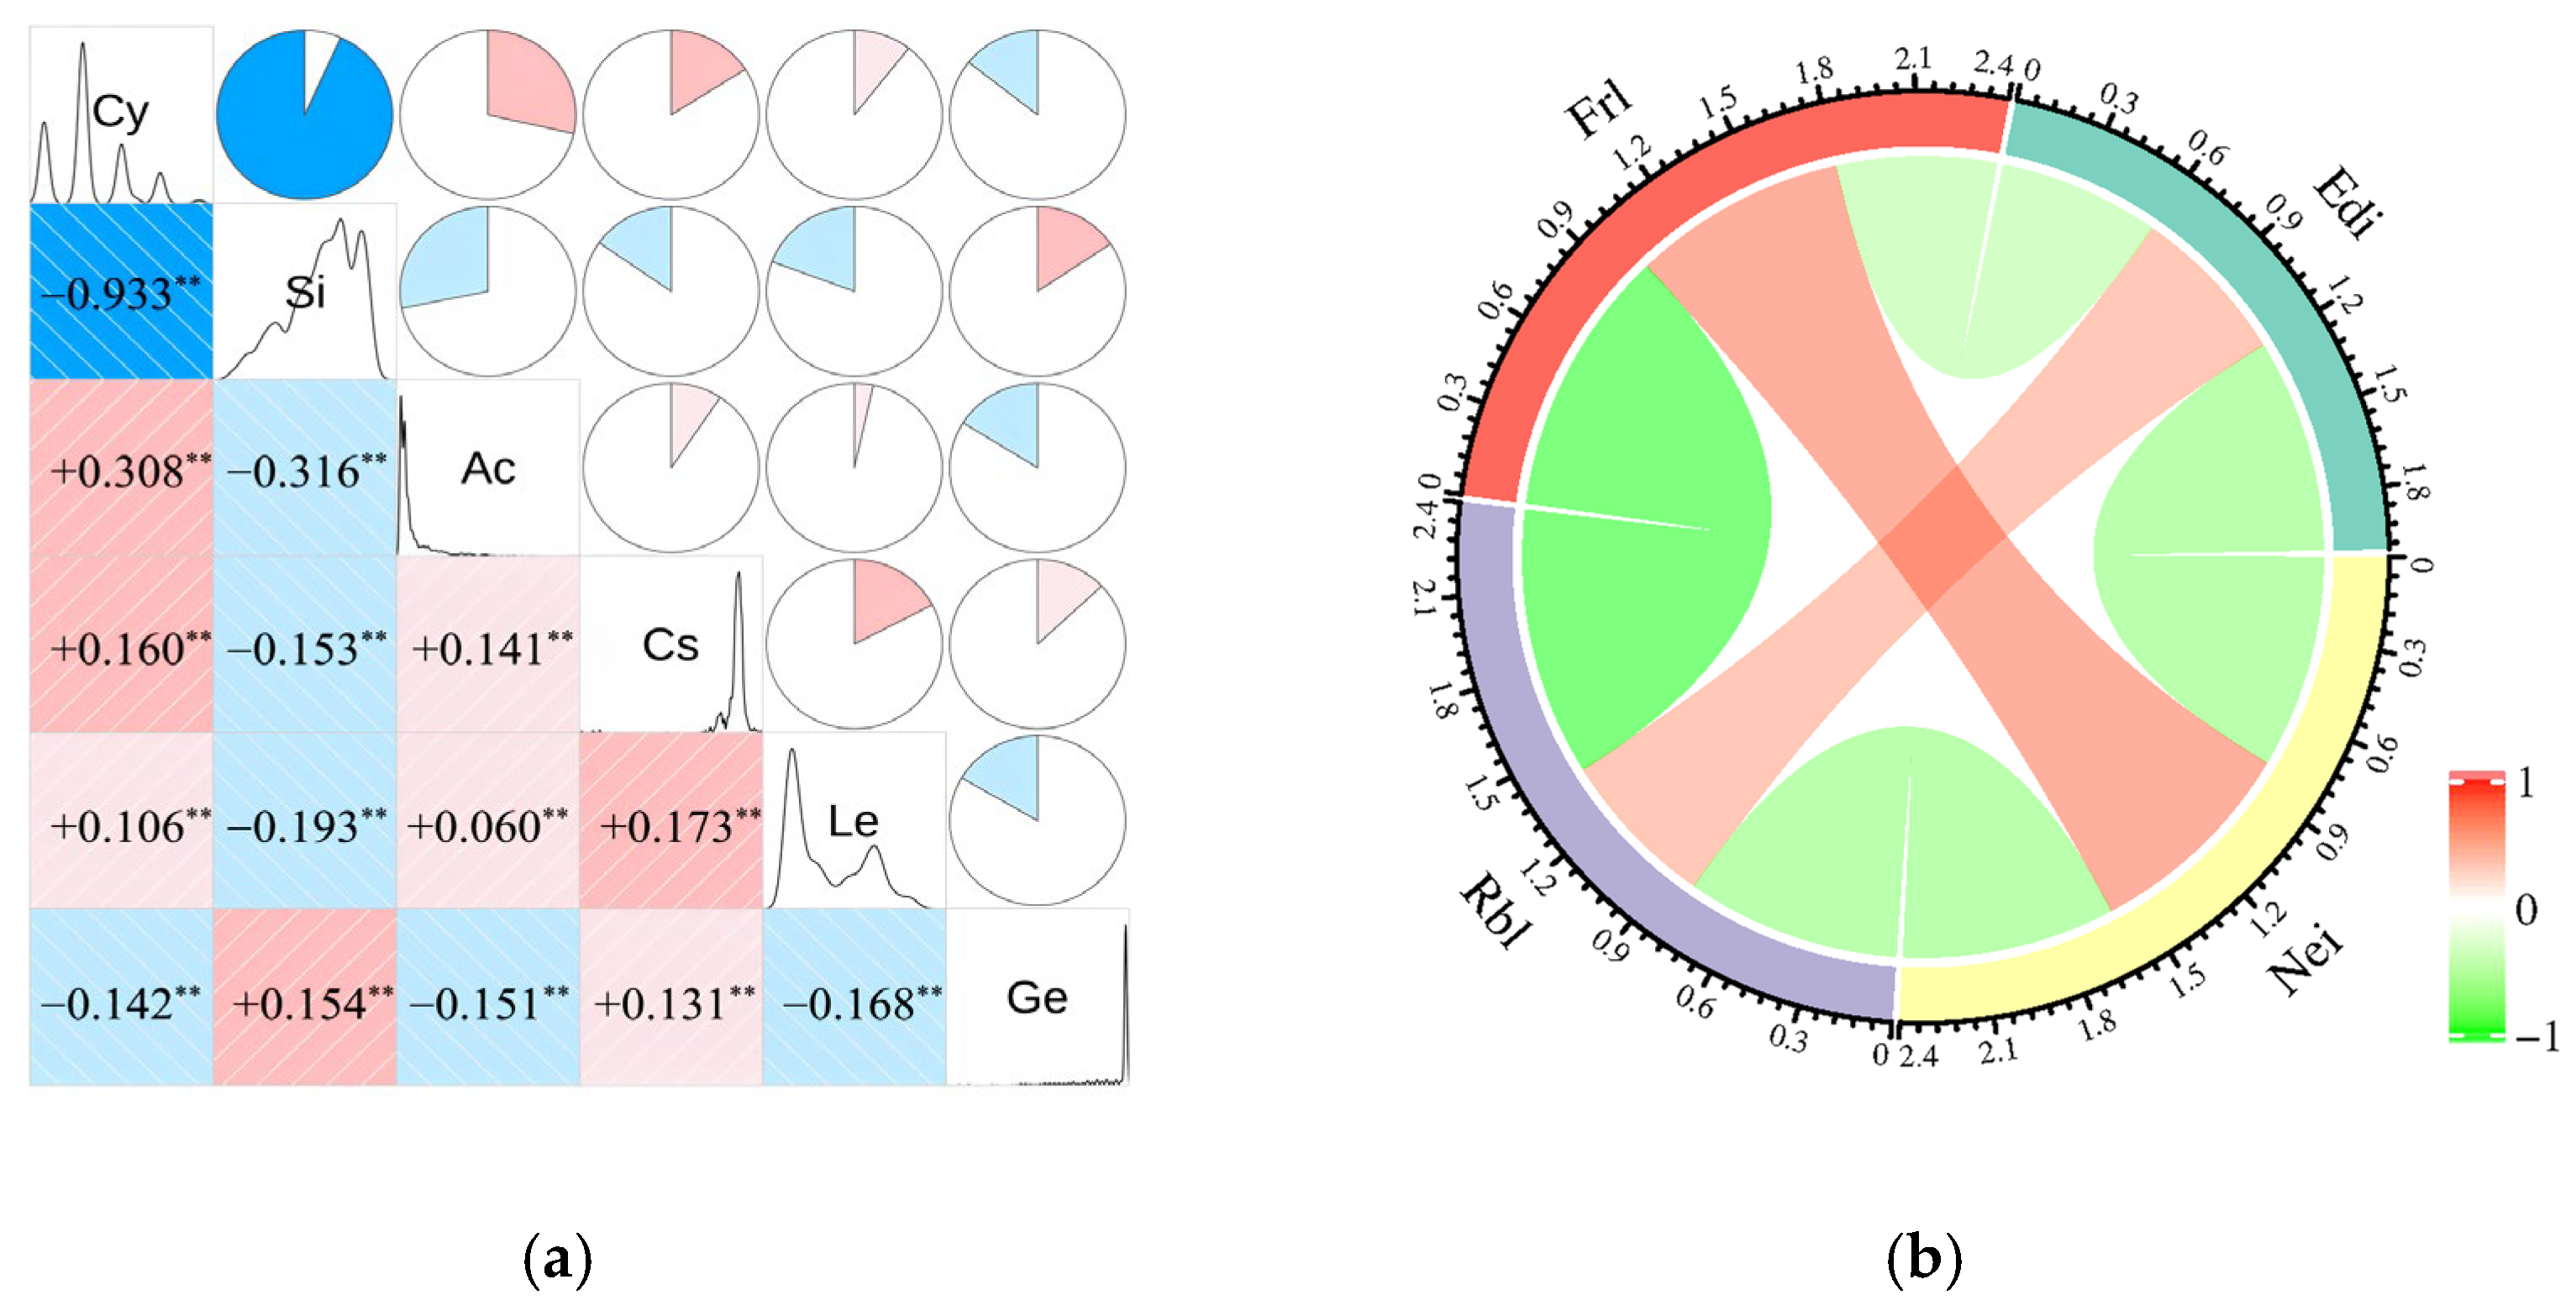
3.4. Sub-Functional Correlation Analysis
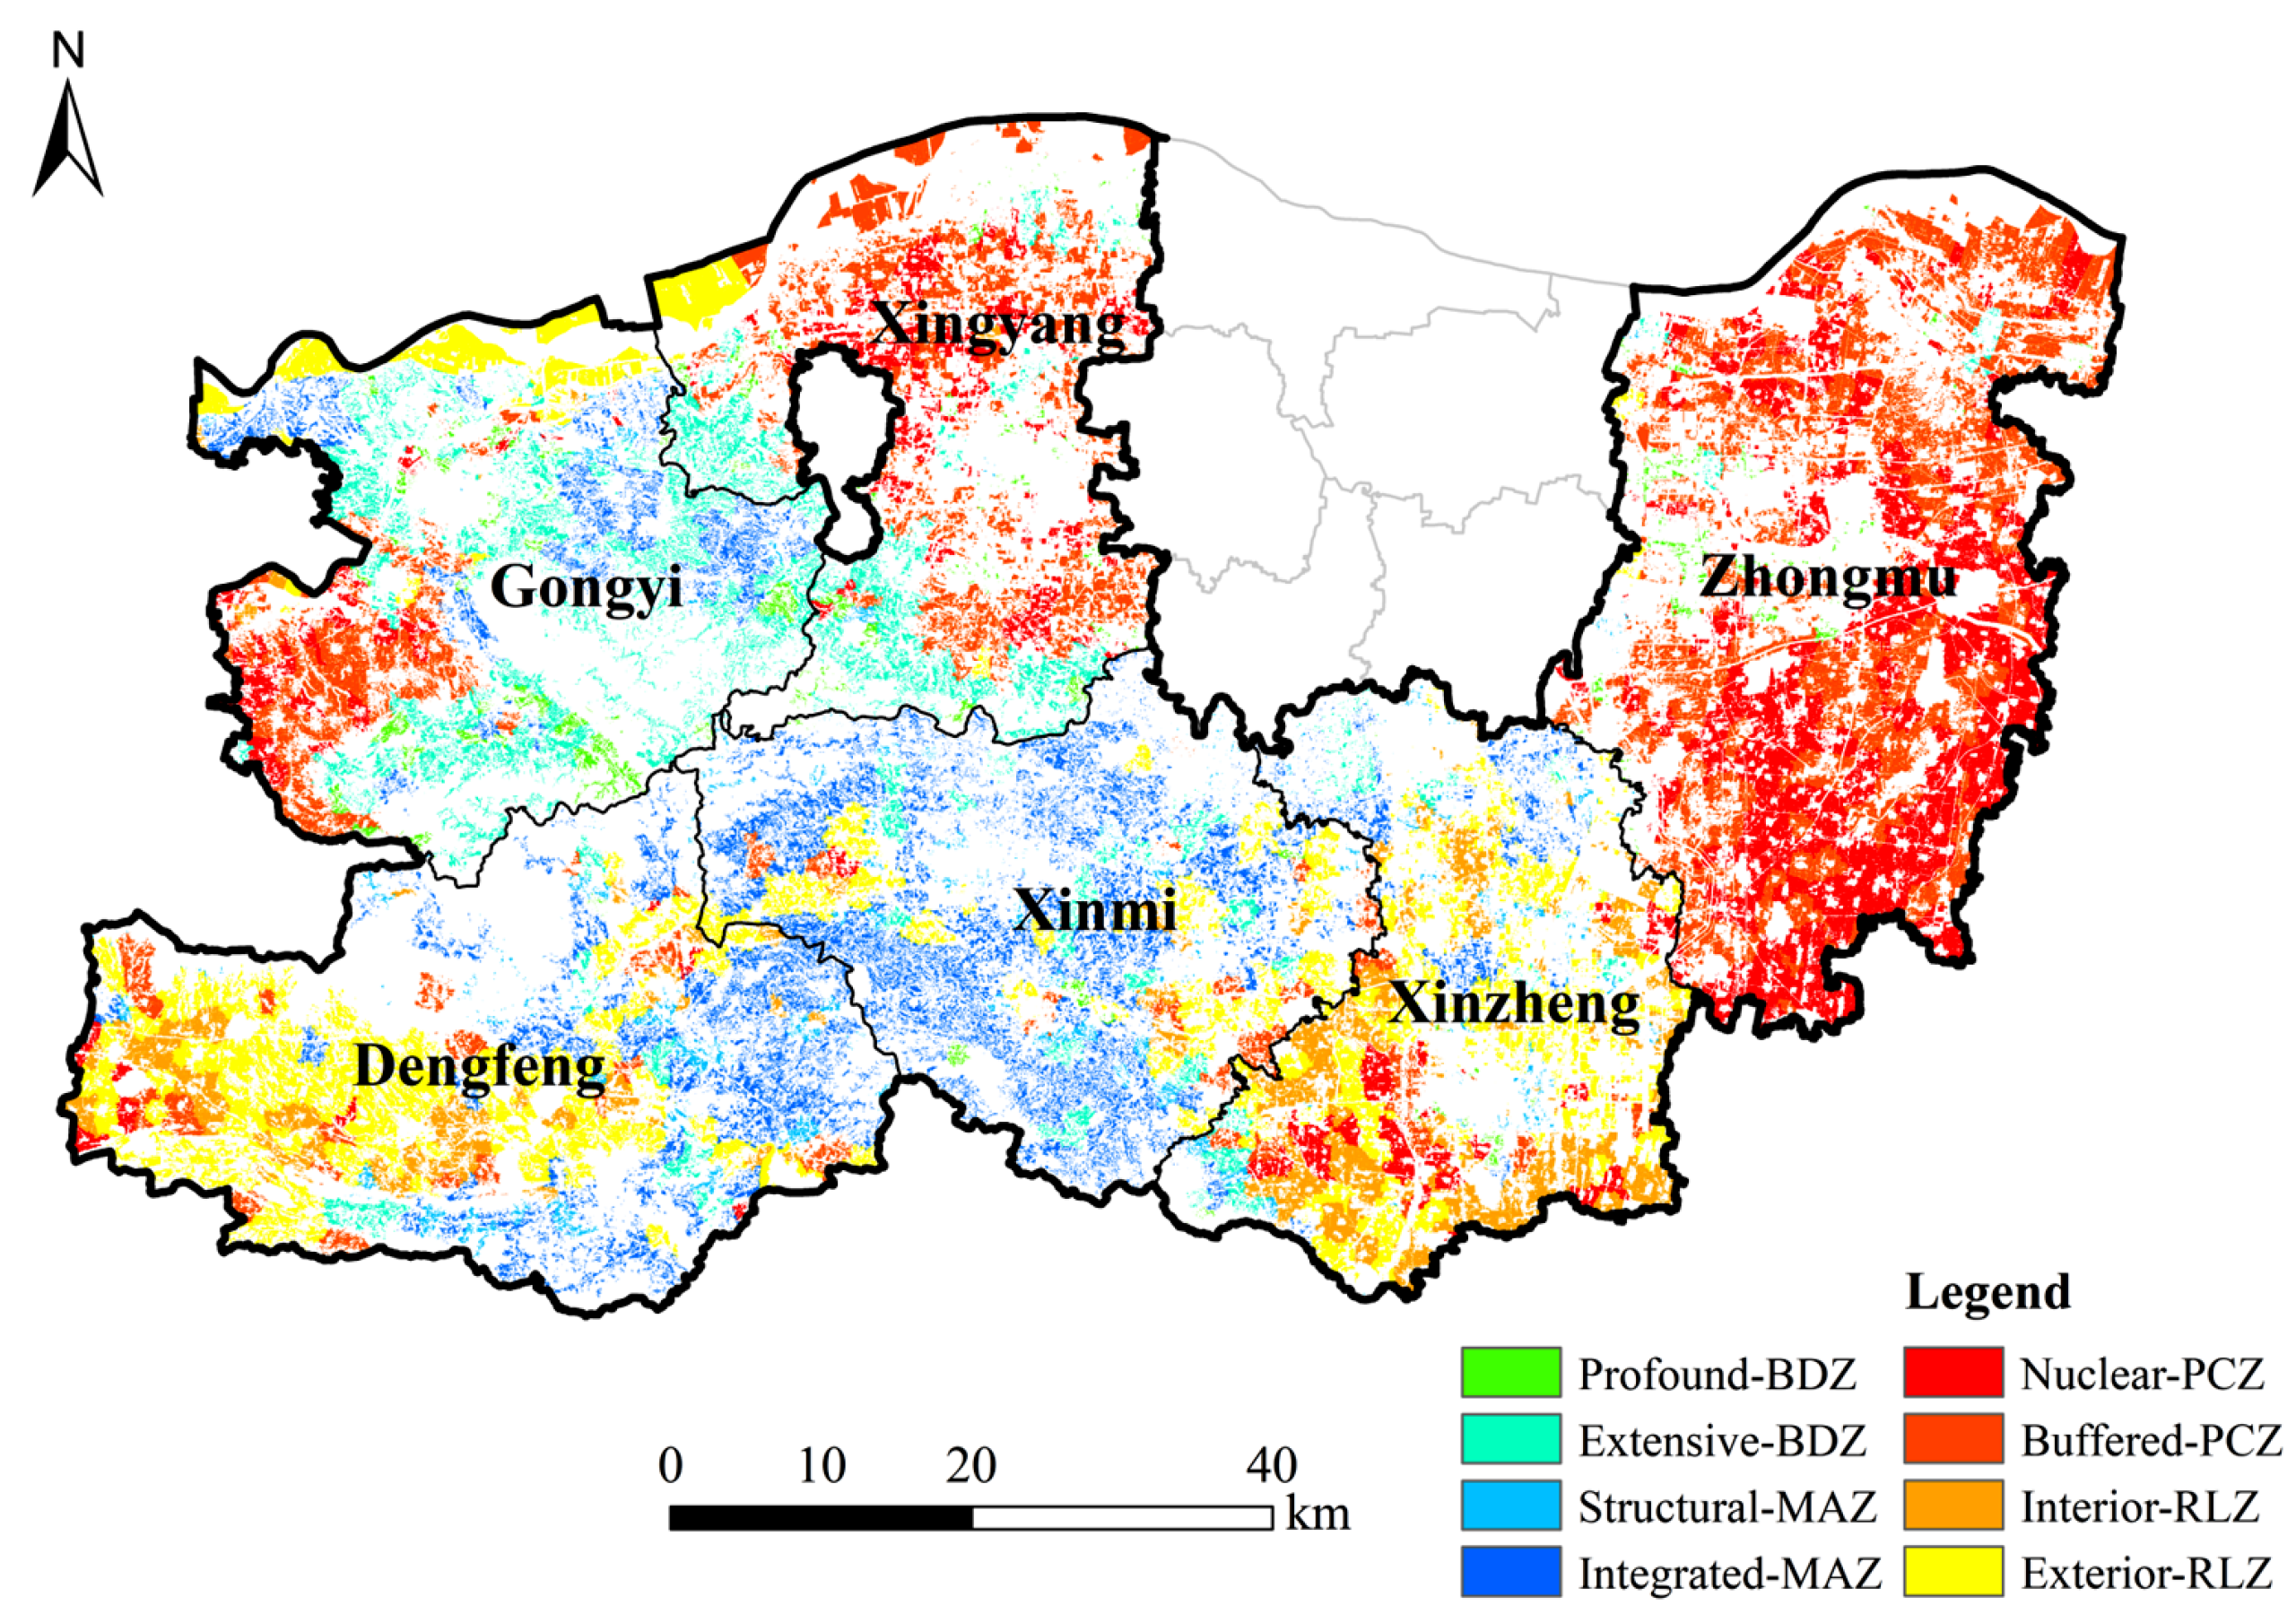
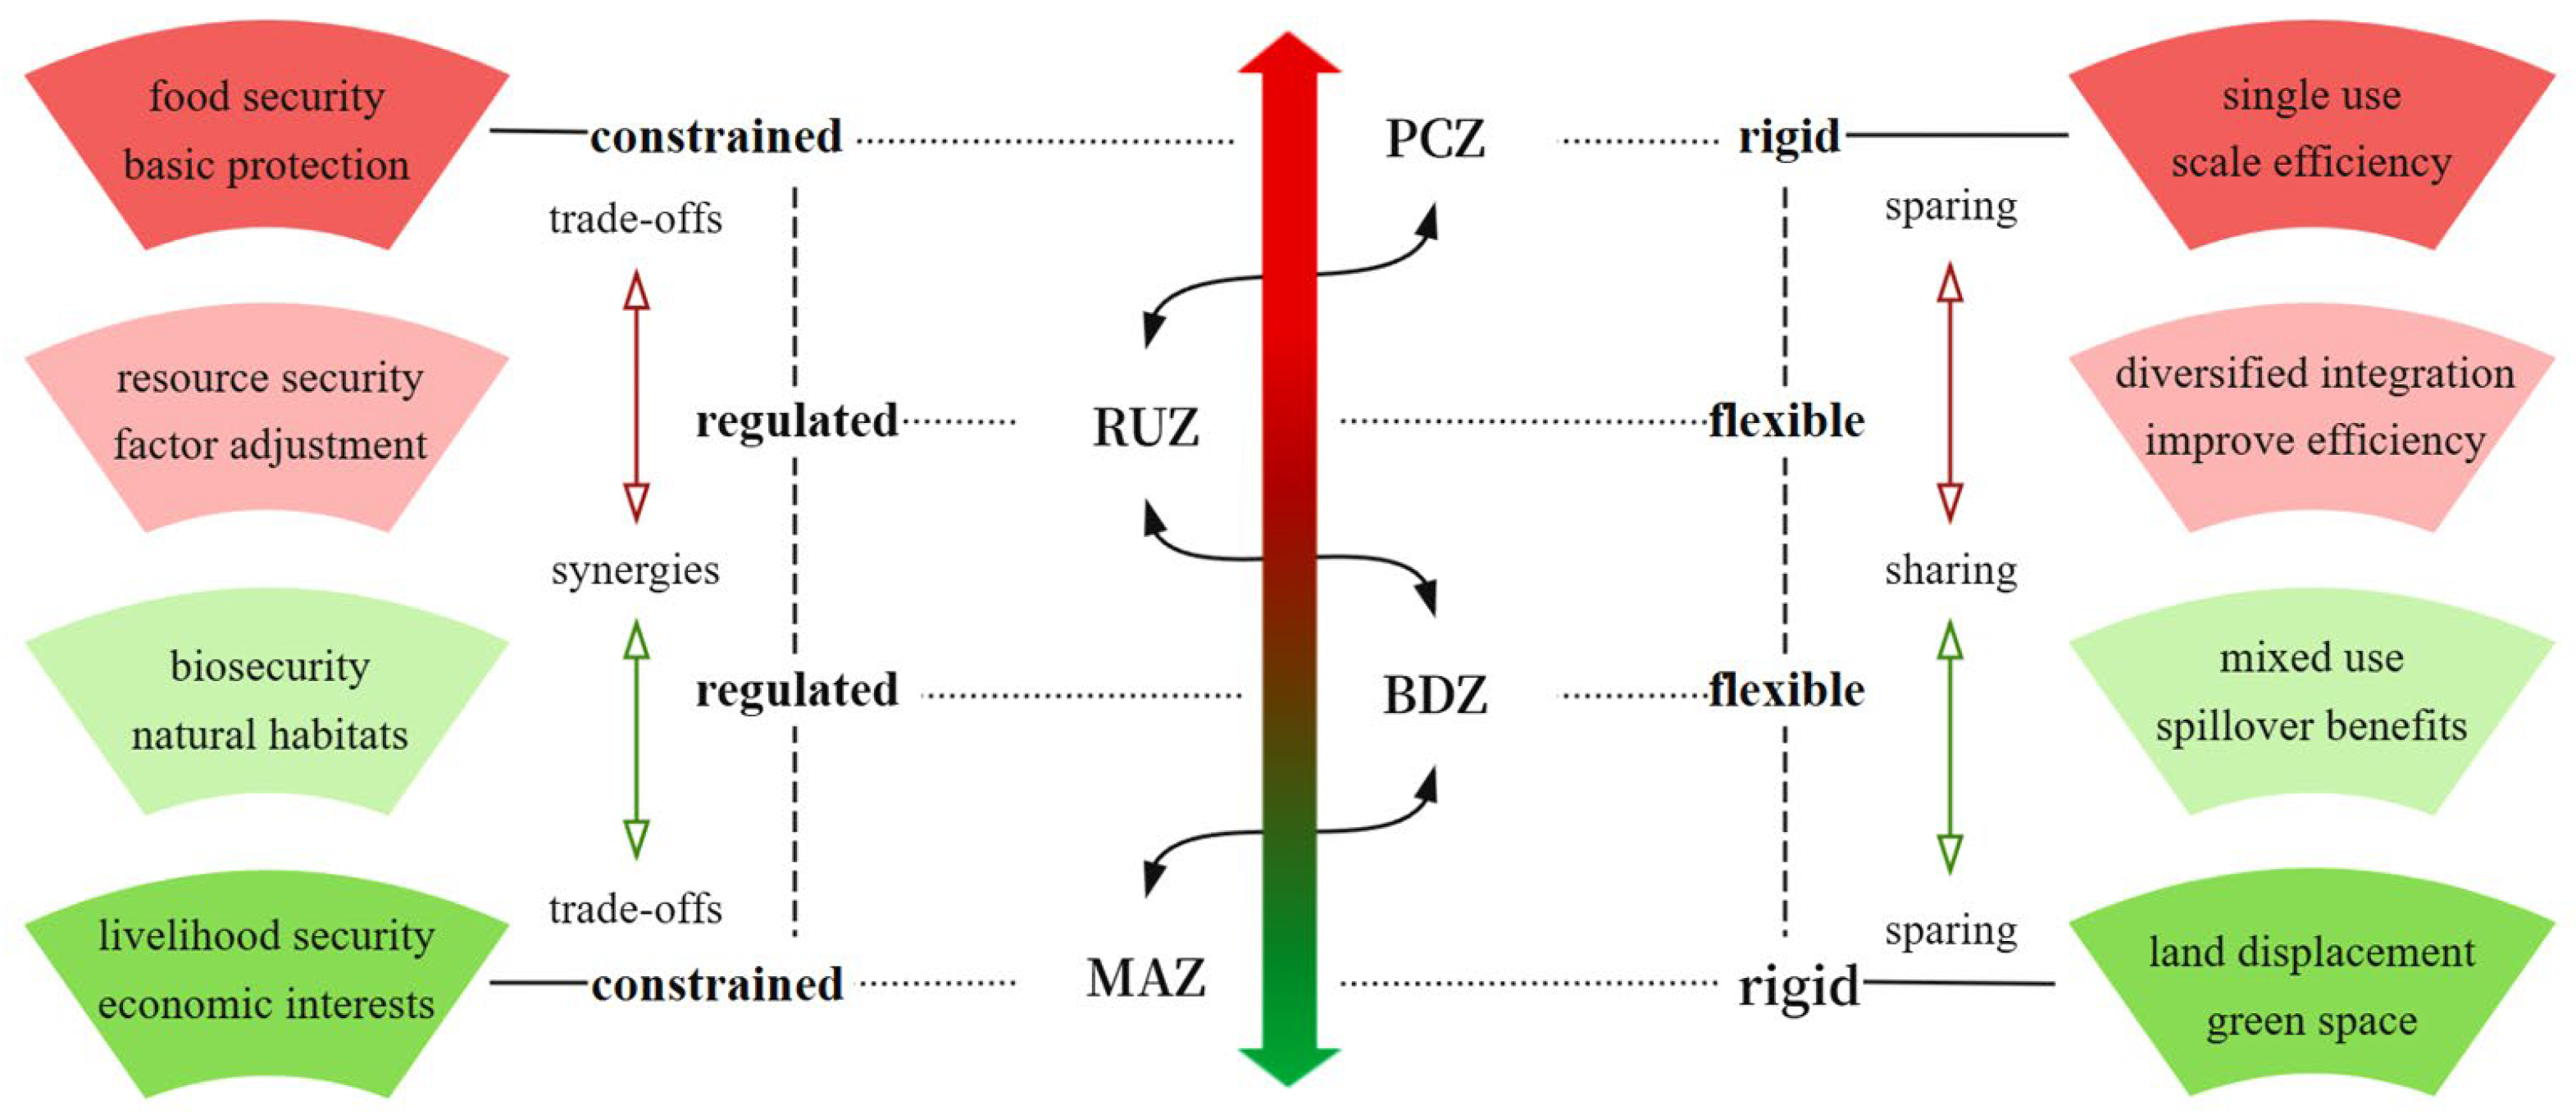
3.5. Functional Partitions and Management Paths
4. Discussion
4.1. Strengths of the Research Framework
4.2. Multifunctional Interrelationships and Alignment of Key Elements
4.3. Policy Implications for the Sustainable Use of Cultivated Land
4.4. Uncertainty and Prospects
5. Conclusions
Author Contributions
Funding
Data Availability Statement
Conflicts of Interest
Abbreviations
| PF | Production function |
| EF | Ecological function |
| LCF | Landscape cultural function |
| SSF | Social security function |
| LS | Low supply |
| LD | Low demand |
| HS | High supply |
| HD | High demand |
References
- FAO; IFAD; UNICEF; WFP; WHO. The State of Food Security and Nutrition in the World 2024—Financing to End Hunger, Food Insecurity and Malnutrition in All Its Forms; WHO: Rome, Italy, 2024. [Google Scholar]
- European Union; FAO; WFP. FSIN and Global Network Against Food Crises; FSIN: Rome, Italy, 2024. [Google Scholar]
- Falkendal, T.; Otto, C.; Schewe, J.; Jägermeyr, J.; Konar, M.; Kummu, M.; Watkins, B.; Puma, M.J. Grain export restrictions during COVID-19 risk food insecurity in many low- and middle-income countries. Nat. Food 2021, 2, 11–14. [Google Scholar] [CrossRef] [PubMed]
- Ngwu, E.C.; Nwosumba, V.C.; Onah, V.C. Russia-Ukraine war, the leadership question and sustainable food security in Africa. Sustain. Dev. 2024, 32, 4135–4144. [Google Scholar] [CrossRef]
- Zhu, X.H.; Zhang, Y.; Zhu, Y.Y.; Li, Y.Y.; Cui, J.X.; Yu, B.H. Multidimensional deconstruction and workable solutions for addressing China’s food security issues: From the perspective of sustainable diets. Land Use Policy 2025, 148, 107401. [Google Scholar] [CrossRef]
- Green, R.E.; Cornell, S.J.; Scharlemann, J.P.W.; Balmford, A. Farming and the fate of wild nature. Science 2005, 307, 550–555. [Google Scholar] [CrossRef]
- Pérez, G.; Mills, S.C.; Socolar, J.B.; Martínez Revelo, D.E.; Haugaasen, T.; Gilroy, J.J.; Edwards, D.P. Avian phylogenetic and functional diversity are better conserved by land-sparing than land-sharing farming in lowland tropical forests. J. Appl. Ecol. 2024, 61, 2497–2509. [Google Scholar] [CrossRef]
- Birch, B.D.J.; Mills, S.C.; Socolar, J.B.; MartínezRevelo, D.E.; Haugaasen, T.; Edwards, D.P. Land sparing outperforms land sharing for Amazonian bird communities regardless of surrounding landscape context. J. Appl. Ecol. 2024, 61, 940–950. [Google Scholar] [CrossRef]
- Ibáñez-Álamo, J.D.; Morelli, F.; Benedetti, Y.; Rubio, E.; Jokimäki, J.; Pérez-Contreras, T.; Sprau, P.; Suhonen, J.; Tryjanowski, P.; Kaisanlahti-Jokimäki, M.-L.; et al. Biodiversity within the city: Effects of land sharing and land sparing urban development on avian diversity. Sci. Total Environ. 2020, 707, 135477. [Google Scholar] [CrossRef]
- Hadi, M.A.; Narayana, S.; Yahya, M.S.; Jamian, S.; Lechner, A.M.; Azhar, B. Enhancing bird conservation in tropical urban parks through land sparing and sharing strategies: Evidence from occupancy data. Urban For. Urban Green. 2024, 98, 128415. [Google Scholar] [CrossRef]
- Hardy, C.; Messier, C.; Boulanger, Y.; Cyr, D.; Filotas, E. Land sparing and sharing patterns in forestry: Exploring even-aged and uneven-aged management at the landscape scale. Landsc. Ecol. 2023, 38, 2815–2838. [Google Scholar] [CrossRef]
- Tälle, M.; Öckinger, E.; Löfroth, T.; Pettersson, L.B.; Smith, H.G.; Stjernman, M.; Ranius, T. Land sharing complements land sparing in the conservation of disturbance-dependent species. Ambio 2022, 52, 571–584. [Google Scholar] [CrossRef]
- Collas, L.; Crastes dit Sourd, R.; Finch, T.; Green, R.; Hanley, N.; Balmford, A. The costs of delivering environmental outcomes with land sharing and land sparing. People Nat. 2022, 5, 228–240. [Google Scholar] [CrossRef]
- Li, Y.R.; Zhang, X.C.; Cao, Z.; Liu, Z.J.; Lu, Z.; Liu, Y.S. Towards the progress of ecological restoration and economic development in China’s Loess Plateau and strategy for more sustainable development. Sci. Total Environ. 2021, 756, 143676. [Google Scholar]
- Carmenta, R.; Steward, A.; Albuquerque, A.; Carneiro, R.; Vira, B.; Estrada Carmona, N. The comparative performance of land sharing, land sparing type interventions on place-based human well-being. People Nat. 2022, 5, 1804–1821. [Google Scholar] [CrossRef]
- Zhang, X.L.; Jin, X.B.; Liang, X.Y.; Ren, J.; Han, B.; Liu, J.P.; Fan, Y.T.; Zhou, Y.K. Implications of land sparing and sharing for maintaining regional ecosystem services: An empirical study from a suitable area for agricultural production in China. Sci. Total Environ. 2022, 820, 153330. [Google Scholar] [CrossRef]
- Baudron, F.; Govaerts, B.; Verhulst, N.; McDonald, A.; Gérard, B. Sparing or sharing land? Views from agricultural scientists. Biol. Conserv. 2021, 259, 109167. [Google Scholar] [CrossRef]
- Selinske, M.; Bekessy, S.A.; Wintle, B.A.; Garrard, G.E. Biodiversity needs both land sharing and land sparing. Nature 2023, 620, 727. [Google Scholar] [CrossRef]
- Grass, I.; Loos, J.; Baensch, S.; Batáry, P.; LibránEmbid, F.; Ficiciyan, A.; Klaus, F.; Riechers, M.; Rosa, J.; Tiede, J.; et al. Land-sharing/-sparing connectivity landscapes for ecosystem services and biodiversity conservation. People Nat. 2019, 1, 262–272. [Google Scholar] [CrossRef]
- Feng, Z.; Xu, X.G.; Zhou, J.; Gao, Y. Land sparing versus sharing framework from ecosystem service perspective. Prog. Geogr. 2016, 35, 1100–1108. [Google Scholar]
- Zhou, G.P.; Long, H.L.; Jiang, Y.F.; Tu, S.S. Ecological function transitions of land use in the Beibu Gulf Economic Zone from the perspective of production-living-ecological space. J. Geogr. Sci. 2024, 34, 2212–2238. [Google Scholar] [CrossRef]
- Lv, L.G.; Han, X.; Long, H.L.; Zhou, B.B.; Zang, Y.S.; Wang, J.X.; Fan, Y.T. Research progress and prospects on supply and demand matching of farmland multifunctions. Resour. Sci. 2023, 45, 1351–1365. [Google Scholar] [CrossRef]
- Zou, L.L.; Liu, Y.S.; Yang, J.X.; Yang, S.F.; Wang, Y.S.; Cao, Z.; Hu, X.D. Quantitative identification and spatial analysis of land use ecological-production-living functions in rural areas on China’s southeast coast. Habitat Int. 2020, 100, 102182. [Google Scholar] [CrossRef]
- Huang, D.; Lu, Y.C.; Liu, Y.L.; Liu, Y.F.; Tong, Z.M.; Xing, L.J.; Dou, C. Multifunctional evaluation and multiscenario regulation of non-grain farmlands from the grain security perspective: Evidence from the Wuhan Metropolitan Area, China. Land Use Policy 2024, 146, 107322. [Google Scholar] [CrossRef]
- Li, S.N.; Shao, Y.Z.; Hong, M.J.; Zhu, C.M.; Dong, B.Y.; Li, Y.; Lin, Y.J.; Wang, K.; Gan, M.Y.; Zhu, J.X.; et al. Impact mechanisms of urbanization processes on supply-demand matches of cultivated land multifunction in rapid urbanization areas. Habitat Int. 2023, 131, 102726. [Google Scholar] [CrossRef]
- Wang, M.C.; Huang, X.J. Inhibit or promote: Spatial impacts of multifunctional farmland use transition on grain production from the perspective of major function-oriented zoning. Habitat Int. 2024, 152, 103172. [Google Scholar] [CrossRef]
- Wang, M.C.; Huang, X.J.; Chen, Y.Y.; Tang, Y.F. Multifunctional farmland use transition and its impact on synergistic governance efficiency for pollution reduction, carbon mitigation, and production increase: A perspective of Major Function-oriented Zoning. Habitat Int. 2024, 153, 103207. [Google Scholar] [CrossRef]
- Rodríguez Sousa, A.A.; Parra-López, C.; Sayadi-Gmada, S.; Barandica, J.M.; Rescia, A.J. A multifunctional assessment of integrated and ecological farming in olive agroecosystems in southwestern Spain using the Analytic Hierarchy Process. Ecol. Econ. 2020, 173, 106658. [Google Scholar] [CrossRef]
- Wang, Q.X.; Ren, J.; Zhang, M.M.; Sui, H.J.; Li, X.D. Synergistic matching and influencing factors of grain production and cropland net primary productivity in the black soil region of northeast China. Agronomy 2024, 14, 2932. [Google Scholar] [CrossRef]
- Qu, Y.B.; Wang, S.L.; Tian, Y.Y.; Jiang, G.H.; Zhou, T.; Meng, L. Territorial spatial planning for regional high-quality development—An analytical framework for the identification, mediation and transmission of potential land utilization conflicts in the Yellow River Delta. Land Use Policy 2023, 125, 106462. [Google Scholar]
- Zhong, H.M.; Liu, Z.J.; Wang, J.Y. Understanding impacts of cropland pattern dynamics on grain production in China: A integrated analysis by fusing statistical data and satellite-observed data. J. Environ. Manag. 2022, 313, 114988. [Google Scholar] [CrossRef]
- Niu, Z.E.; Yan, H.M.; Liu, F. Decreasing cropping intensity dominated the negative trend of cropland productivity in southern China in 2000–2015. Sustainability 2020, 12, 10070. [Google Scholar] [CrossRef]
- Wang, Z.J.; Yang, H.; Hu, Y.M.; Peng, Y.P.; Liu, L.; Su, S.Q.; Wang, W.; Wu, J.L. Multifunctional trade-off/synergy relationship of cultivated land in Guangdong: A long time series analysis from 2010 to 2030. Ecol. Indic. 2023, 154, 110700. [Google Scholar] [CrossRef]
- Liu, Y.; Wan, C.Y.; Xu, G.L.; Chen, L.T.; Yang, C. Exploring the relationship and influencing factors of cultivated land multifunction in China from the perspective of trade-off/synergy. Ecol. Indic. 2023, 149, 110171. [Google Scholar] [CrossRef]
- Yagi, H.; Yoshida, S. Persistence of sub-urban agriculture and landowners’ behavior in the population declining phase: Case of the preferential tax treatment for rental farmland. Land Use Policy 2024, 147, 107370. [Google Scholar] [CrossRef]
- Hassan, D.K.; Hewidy, M.; El Fayoumi, M.A. Productive urban landscape: Exploring urban agriculture multi-functionality practices to approach genuine quality of life in gated communities in Greater Cairo Region. Ain Shams Eng. J. 2022, 13, 101607. [Google Scholar] [CrossRef]
- Zhang, S.Y.; Hu, W.Y.; Li, M.R.; Guo, Z.X.; Wang, L.Y.; Wu, L.H. Multiscale research on spatial supply-demand mismatches and synergic strategies of multifunctional cultivated land. J. Environ. Manag. 2021, 299, 113605. [Google Scholar] [CrossRef]
- MARA. Guidance of the Ministry of Agriculture and Rural Affairs on Expanding Multiple Functions of Agriculture and Promoting High-quality Development of Rural Businesses; Gazette of the Ministry of Agriculture and Rural Affairs of the People’s Republic of China; Gazette of the Ministry of Agriculture and Rural Affairs of the People’s Republic of China: Beijing, China, 2021; pp. 24–29.
- Jiang, C.Y. The agricultural new quality productive forces: Connotations, development priorities, constraints and policy recommendations for the development. J. Nanjing Agric. Univ. (Soc. Sci. Ed.) 2024, 24, 1–17. [Google Scholar]
- Li, Z.; Yang, Y.; Feng, J.; Rana, S.; Wang, S.S.; Wang, H.M.; Zhang, T.; Wang, Y.M.; Guo, G.P.; Cai, Q.F.; et al. Evaluation of fine root morphology and rhizosphere environmental characteristics of the dioeciousidesia polycarpabMaxim. Forests 2024, 15, 234. [Google Scholar] [CrossRef]
- Sohrab, S.; Csikós, N.; Szilassi, P. Landscape metrics as ecological indicators for PM10 prediction in European cities. Land 2024, 13, 2245. [Google Scholar] [CrossRef]
- He, S.; Lin, L.; Xu, Q.; Hu, C.X.; Zhou, M.M.; Liu, J.H.; Li, Y.J.; Wang, K. Farmland zoning integrating agricultural multi-functional supply, demand and relationships: A case study of the Hangzhou metropolitan area, China. Land 2021, 10, 1014. [Google Scholar] [CrossRef]
- Yang, H.; Zou, R.Y.; Hu, Y.M.; Wang, L.; Xie, Y.K.; Tan, Z.X.; Zhu, Z.Q.; Zhu, A.X.; Gong, J.Z.; Mao, X.Y. Sustainable utilization of cultivated land resources based on “element coupling-function synergy” analytical framework: A case study of Guangdong, China. Land Use Policy 2024, 146, 107316. [Google Scholar] [CrossRef]
- Chen, Y.H.; Huang, Q.H.; Zheng, J.J.; Li, M.C. Functional zoning of the cultivated land around the city under multi-scenario simulation. Trans. Chin. Soc. Agric. Eng. 2023, 39, 227–236. [Google Scholar]
- Zhao, N.Z.; Liu, Y.; Cao, G.F.; Samson, E.L.; Zhang, J.Q. Forecasting China’s GDP at the pixel level using nighttime lights time series and population images. GIScience Remote Sens. 2017, 54, 407–425. [Google Scholar] [CrossRef]
- Zhu, Y.L.; Zhang, Y.N.; Ma, L.; Yu, L.; Wu, L. Simulating the dynamics of cultivated land use in the farming regions of China: A social-economic-ecological system perspective. J. Clean. Prod. 2024, 478, 143907. [Google Scholar] [CrossRef]
- Li, J.W.; Tian, Y.C.; Wang, D.H.; Zhang, Q.; Tao, J.; Zhang, Y.L.; Lin, J.L. Matching and driving mechanism analysis of the supply and demand relationships of soil conservation services in karst peak-cluster depression basin in Southwest Guangxi, China. Catena 2024, 246, 108438. [Google Scholar] [CrossRef]
- FAO; IIASA. Harmonized World Soil Database Version 2.0; FAO: Rome, Italy; Laxenburg, Austria, 2023. [Google Scholar]
- Man, Y.; Yang, Y.J.; Chen, F.; Zhu, F.W.; Qu, J.F.; Zhang, S.L. Response of agricultural multifunctionality to farmland loss under rapidly urbanizing processes in Yangtze River Delta, China. Sci. Total Environ. 2019, 666, 1–11. [Google Scholar]
- Xu, Y.; Huang, W.T.; Yao, Y.F.; Xu, M.; Zou, B.; Feng, Y.X. Carbon sequestration in vulnerable ecological regions of China: Limitations and opportunities. J. Clean. Prod. 2024, 475, 143702. [Google Scholar] [CrossRef]
- Yang, J.; Huang, X. The 30 m annual land cover dataset and its dynamics in China from 1990 to 2019, Earth Syst. Sci. Data 2021, 13, 3907–3925. [Google Scholar]
- Gao, J.X.; Shi, Y.L.; Zhang, H.W.; Chen, X.H.; Zhang, W.G.; Shen, W.M.; Xiao, T.; Zhang, Y.H. China Regional 250 m Fractional Vegetation Cover Data set (2000–2023); National Tibetan Plateau/Third Pole Environment Data Center: Beijing, China, 2022. [Google Scholar]
- Chen, Y.H.; Xu, C.C.; Ge, Y.; Zhang, X.X.; Zhou, Y.N. A 100 m gridded population dataset of China’s seventh census using ensemble learning and big geospatial data, Earth Syst. Sci. Data 2024, 16, 3705–3718. [Google Scholar]
- Luo, S.S.; Lai, Q.B.; Wang, X.D.; Wang, Y.P.; Zhao, Y.F. Control and management of cropland regionalization in Fujian Province of China using multi-functional evaluation and trade-off/synergy relationships. Trans. Chin. Soc. Agric. Eng. 2023, 39, 271–280. [Google Scholar]
- Shi, Y.C.; Jin, X.B.; Liang, X.Y.; Han, B.; Ying, S.C.; Wang, S.L.; Zhou, Y.K. Spatial-temporal characteristics and strategies for the classification and optimization of cultivated land agglomeration connectivity in Jiangsu Province of China. Trans. Chin. Soc. Ofagricultural Eng. 2024, 40, 238–248. [Google Scholar]
- Wang, X.H.; Wu, Y.; Manevski, K.; Fu, M.Q.; Yin, X.G.; Chen, F. A framework for the heterogeneity and ecosystem services of farmland landscapes: An integrative review. Sustainability 2021, 13, 12463. [Google Scholar] [CrossRef]
- Kusairi, D. Improvement of some soil chemical properties on marginal lands to increase corn production through conservation tillage techniques and organic fertilizers. Int. J. Adv. Technol. Eng. Inf. Syst. 2022, 1, 89–101. [Google Scholar] [CrossRef]
- Yin, Z.; Lu, Q.Q. China’s new urbanization enters the stage of regional coordinated development. Frontiers 2022, 22, 29–36. [Google Scholar]
- Zhai, J.H.; Xiao, C.W.; Feng, Z.M.; Liu, Y. Spatio-temporal patterns of land-use changes and conflicts between cropland and forest in the Mekong River Basin during 1990–2020. Land 2022, 11, 927. [Google Scholar] [CrossRef]
- Cao, W.; Zhou, W.; Wu, T.; Wang, X.C.; Xu, J.H. Spatial-temporal characteristics of cultivated land use eco-efficiency under carbon constraints and its relationship with landscape pattern dynamics. Ecol. Indic. 2022, 141, 109140. [Google Scholar] [CrossRef]
- Zhou, H.T.; Wu, X.D.; Nie, H.X.; Wang, X.C.Y.; Zang, S.Y. Coupling coordination analysis and obstacle factors identification of rural living-production-ecological functions in a farming-pastoral ecotone. Ecol. Indic. 2024, 158, 111398. [Google Scholar] [CrossRef]
- Zhao, R.; Gabriel Jose, L.; Rodríguez Martín Jose, A.; Feng, Z.; Wu, K.N. Understanding trade-offs and synergies among soil functions to support decision-making for sustainable cultivated land use. Front. Environ. Sci. 2022, 10, 1063907. [Google Scholar] [CrossRef]
- Gao, J.; Zhu, Y.H.; Zhao, R.R.; Sui, H.J. The use of cultivated land for multiple functions in major grain-producing areas in northeast China: Spatial-temporal pattern and driving forces. Land 2022, 11, 1476. [Google Scholar] [CrossRef]
- Kennedy, J.; Hurtt, G.C.; Liang, X.; Chini, L.; Ma, L. Changing cropland in changing climates: Quantifying two decades of global cropland changes. Environ. Res. Lett. 2023, 18, 064010. [Google Scholar] [CrossRef]
- Emmerling, C.; Pude, R. Introducing miscanthus to the greening measures of the EU common agricultural policy. GCB Bioenergy 2017, 9, 274–279. [Google Scholar] [CrossRef]
- Adhikari, K.R.; Grala, K.R.; Grado, C.S.; Grebner, L.D.; Petrolia, R.D. Landowner satisfaction with conservation programs in the southern United States. Sustainability 2022, 14, 5513. [Google Scholar] [CrossRef]
- Gish, S. Drivers and Barriers of the Transition to Regenerative Agriculture Within the EU’s Common Agricultural Policy Reform: Comparative Analysis with the US Farm Bill. Independent Study Project (ISP) Collection. 2022. 3442. Available online: https://digitalcollections.sit.edu/isp_collection/3442 (accessed on 6 May 2025).
- Chen, F.; Jiang, F.F.; Sun, J.; Guo, W.H.; Ma, J.; Zhu, X.H. Logic and innovative practice of cultivated land protection transformation in the context of large-scale balancing cultivated land occupation and reclamation reform. China Land Sci. 2024, 38, 12–24. [Google Scholar]
- Yuan, Y.; Wang, Y.P.; Xu, P. Cultivated land use control from the perspective of “non-grain” governance: Response logic and framework construction. J. Nat. Resour. 2024, 39, 942–959. [Google Scholar] [CrossRef]
- Rikkonen, P.; Kivelä, L.S.; Leppänen, J. How to tackle landownership challenges in Finnish agriculture: Types of landowners and their views on ownership, land tenure and improvement measures. J. Rural Stud. 2025, 117, 103685. [Google Scholar] [CrossRef]

| Type of Indicator | Calculation Method | Implications of the Indicator |
|---|---|---|
| PD | Reflecting fragmentation between patches, the larger the PD, the more fragmented the landscape tends to be, leading to diversified use. | |
| CONNECT | Reflecting structural continuity, the larger the CONNECT, the more continuous the landscape tends to be, leading to single use. | |
| AI | Reflecting the clustering between patches, the smaller the AI, the more dispersed the landscape tends to be, leading to diversified use. |
| Type | Level | Indicator | Weights | Method of Calculation | Reference |
|---|---|---|---|---|---|
| Production function | Supply | Crop yield (Cy) | 0.402 (+) | Cy = (production potential score of grid i/total value of production potential of region j) * total actual production of cultivated land in region j. Grid i makes up region j. | [42,43] |
| Soil quality (Si) | 0.598 (+) | Comprehensive assessment combining attribute characteristics of grid i such as “geomorphology, texture, slope, organic matter, effective phosphorus and potassium, irrigation, and drainage capacity”. | [43,44] | ||
| Demand | Economic driver index (Edi) | 1 (+) | Gross domestic product (GDP) at 1 km resolution was used as a proxy for crop consumption data. It is assumed that a higher GDP is associated with higher food quality requirements, indirectly reflecting demand. | [42,45,46] | |
| Ecological function | Supply | Soil conservation (Ac) | 0.551 (+) | Ac = R * K * LS * (1 – C * Ps), the Revised Universal Soil Loss Equation (RUSLE) was used in this study for computational assessment. | [25,28,47] |
| Soil sequestration (Cs) | 0.449 (+) | Cs = 1.63 * NPPi + SOCDi, NPPi and SOCDi are the dry matter accumulation capacity and soil organic carbon density of grid i, respectively. | [43,48,49,50] | ||
| Demand | Neighborhood Ecological Index (Nei) | 1 (−) | Measured by the percentage of ecological land (woodland, shrubs, grassland, water) within 1 km of cultivated land. It is assumed that the lower the percentage, the greater the ecological demand for farmland. | [51] | |
| Landscape cultural function | Supply | Leisure and entertainment (Le) | 0.396 (+) | Google Maps extracts POIs such as “picking gardens, farms, leisure farms” and takes the 5 km range of farmland as the core area of agritourism. | [25,37] |
| Green environment (Ge) | 0.604 (+) | Ge = (NDVI-NDVIs)/(NDVIv-NDVIs), NDVI, NDVIv, and NDVIs are vegetation indices, vegetation indices for pure vegetation, and vegetation indices for pure soil, respectively. | [33,52] | ||
| Demand | Benefit level of the population (Rbl) | 1 (+) | Considering the impact of proximity on sightseeing trips, the distribution of beneficiaries is characterized. It is assumed that the denser the PD and the closer it is to the key villages of rural tourism, the higher the level of demand from residents. | [43,53] | |
| Social security function | Supply | Farming income (Fi) | 0.620 (+) | An indicator of rural residents “net household business income was selected from the Zhengzhou City Statistical Yearbook to reflect the role of cultivated land in supporting farming economy. | [27] |
| Employment security (Es) | 0.380 (+) | Es = population working in agriculture/total area of cultivated land in the region, the result of this calculation shows the role of cultivated land in carrying agricultural laborers. | [28,54] | ||
| Demand | Level of food distribution (Frl) | 1 (+) | Frl = Foodi/(400 * POPi), Foodi and POPi are the crop production of grid i and the population of grid i, respectively; 400 is a safe value for per capita food consumption. | [26,33,53] |
| Partition Type | Number of Patches | Delineation Criteria |
|---|---|---|
| Relative Sparing Zone | 571 | AI > 75 and CONNECT > 40 and PD < 0.015 |
| Sparing Marginal Zone | 619 | AI > 75 and CONNECT ≤ 40 or AI > 75 & CONNECT > 40 and PD ≥ 0.015 |
| Relative Sharing Zone | 349 | AI ≤ 75 and CONNECT > 40 or AI ≤ 75 & CONNECT ≤ 40 and PD < 0.015 |
| Sharing Marginal Zone | 535 | AI ≤ 75 and CONNECT ≤ 40 and PD ≥ 0.015 |
| Types of Partition | Combining Units | |
|---|---|---|
| Landscape Differences (X) + Matching Supply and Demand (Y) | ||
| PCZ | Nuclear—PCZ | (X1,Y3), (X1,Y4) |
| Buffered—PCZ | (X2,Y3), (X2,Y4) | |
| RUZ | Interior—RUZ | (X1,Y1), (X1,Y2) |
| Exterior—RUZ | (X2,Y1), (X2,Y2) | |
| BDZ | Profound—BDZ | (X3,Y3), (X3,Y4) |
| Extensive—BDZ | (X4,Y3), (X4,Y4) | |
| MAZ | Structural—MAZ | (X3,Y1), (X3,Y2) |
| Integrated—MAZ | (X4,Y1), (X4,Y2) | |
Disclaimer/Publisher’s Note: The statements, opinions and data contained in all publications are solely those of the individual author(s) and contributor(s) and not of MDPI and/or the editor(s). MDPI and/or the editor(s) disclaim responsibility for any injury to people or property resulting from any ideas, methods, instructions or products referred to in the content. |
© 2025 by the authors. Licensee MDPI, Basel, Switzerland. This article is an open access article distributed under the terms and conditions of the Creative Commons Attribution (CC BY) license (https://creativecommons.org/licenses/by/4.0/).
Share and Cite
Ding, G.; Zhao, H. Sparing or Sharing? Differential Management of Cultivated Land Based on the “Landscape Differentiation–Function Matching” Analytical Framework. Land 2025, 14, 1278. https://doi.org/10.3390/land14061278
Ding G, Zhao H. Sparing or Sharing? Differential Management of Cultivated Land Based on the “Landscape Differentiation–Function Matching” Analytical Framework. Land. 2025; 14(6):1278. https://doi.org/10.3390/land14061278
Chicago/Turabian StyleDing, Guanyu, and Huafu Zhao. 2025. "Sparing or Sharing? Differential Management of Cultivated Land Based on the “Landscape Differentiation–Function Matching” Analytical Framework" Land 14, no. 6: 1278. https://doi.org/10.3390/land14061278
APA StyleDing, G., & Zhao, H. (2025). Sparing or Sharing? Differential Management of Cultivated Land Based on the “Landscape Differentiation–Function Matching” Analytical Framework. Land, 14(6), 1278. https://doi.org/10.3390/land14061278