
Establishment of the Indicator System for Livable Cities Based on Sustainable Development Goals and Empirical Research in China


Abstract
1. Introduction
1.1. Research Background and Significance
- (1)
- Driving sustainable urban transformation: By embedding SDG targets into livability criteria, cities are guided to improve economic efficiency, resource management, environmental protection, and social equity.
- (2)
- Providing a global reference framework: Under the smart city and digital governance trends, cities worldwide can leverage this SDG-aligned framework to foster cross-regional collaboration and accelerate progress toward the 2030 Agenda.
1.2. Review of the Research on Urban Livability Evaluation
1.3. Comparative Analysis of Typical Evaluation Systems
1.3.1. Different Focuses of Evaluation Factors Under the Consistent Evaluation Criteria
1.3.2. Lack of Unified Standards for Indicator Calculation and Measurement
1.3.3. Absence of Research Aligning with SDGs
2. Materials and Methods
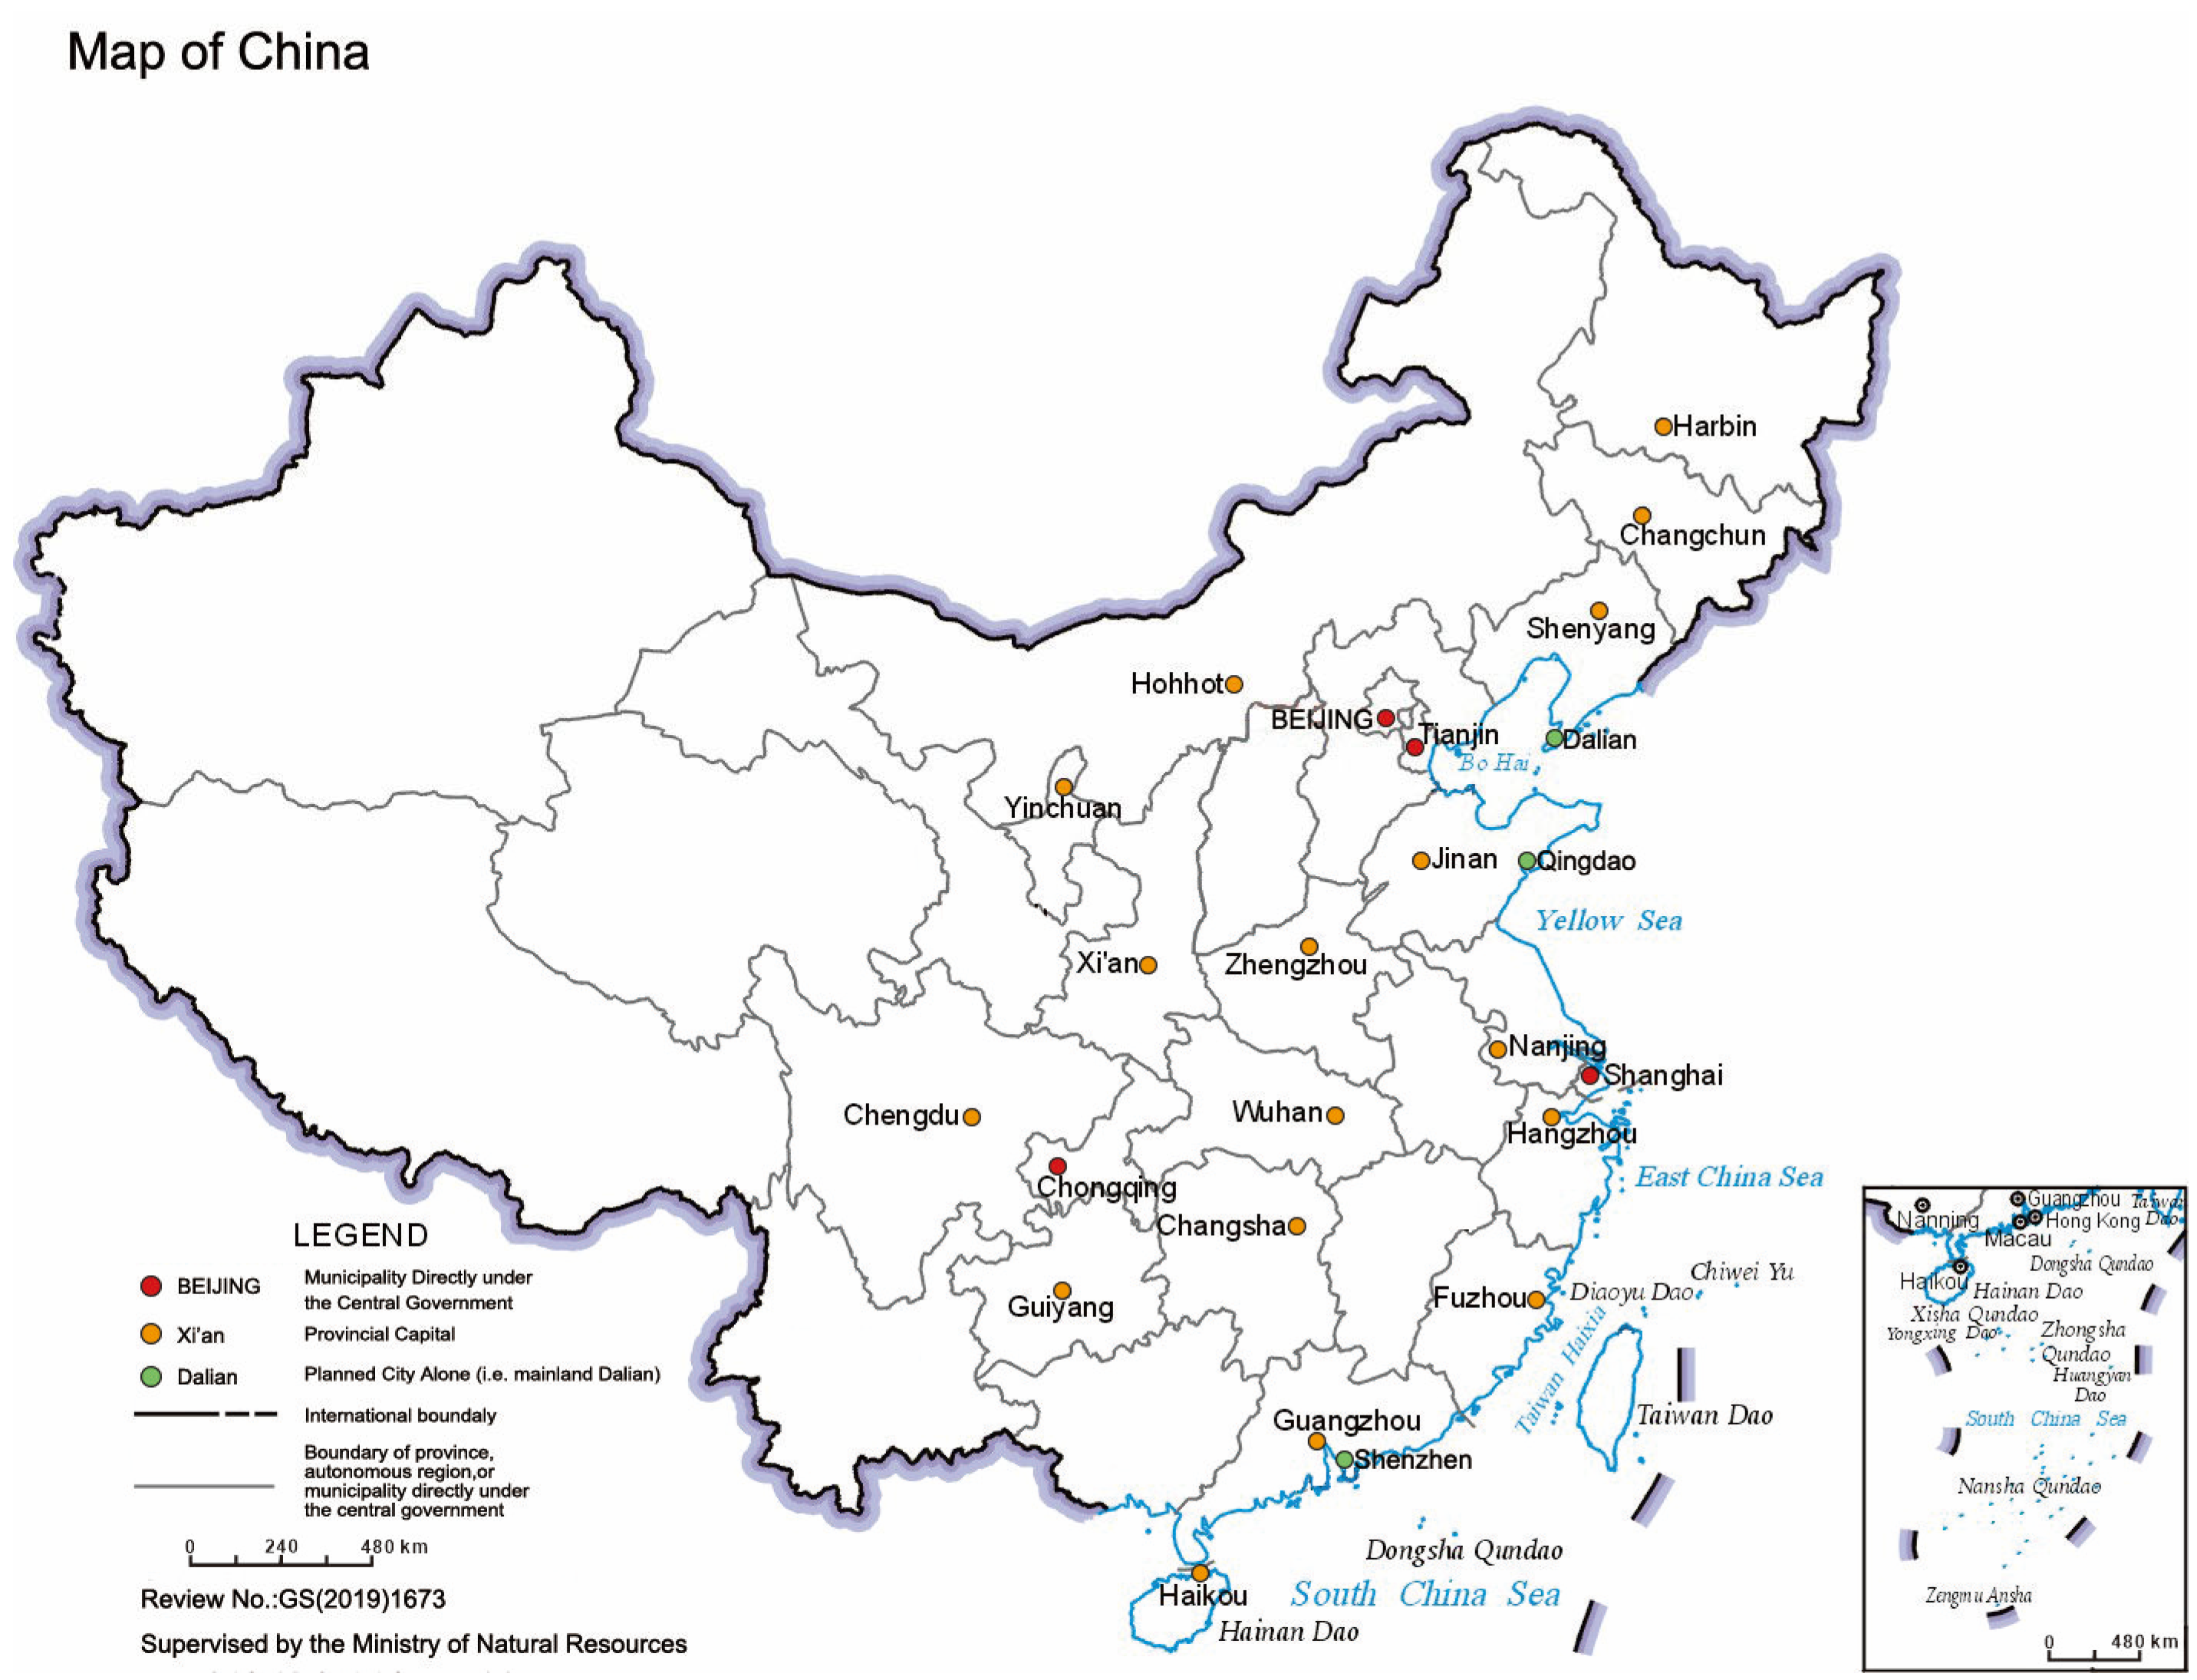
2.1. Study Area
- Four municipalities directly under the central government: Beijing, Shanghai, Tianjin, Chongqing;
- Seventeen provincial capital cities: Xi’an, Chengdu, Guangzhou, Shenyang, Hangzhou, Changsha, Jinan, Zhengzhou, Changchun, Wuhan, Guiyang, Harbin, Fuzhou, Haikou, Hohhot, Yinchuan;
- Three single-planned cities: Dalian, Qingdao and Shenzhen.
2.2. Data Sources
- Supplement missing data using news reports published by official media, combined with online research and other research data;
- Using provincial data as substitutes for cities with missing data;
- Using the average value of a specific indicator among all cities with available data to substitute for the missing data of a particular city;
- Using existing data from the preceding or subsequent year as proxy data if data for an indicator in 2023 are not available.
2.3. Methods of the Indicator System Establishment for Livable Cities Based on SDGs
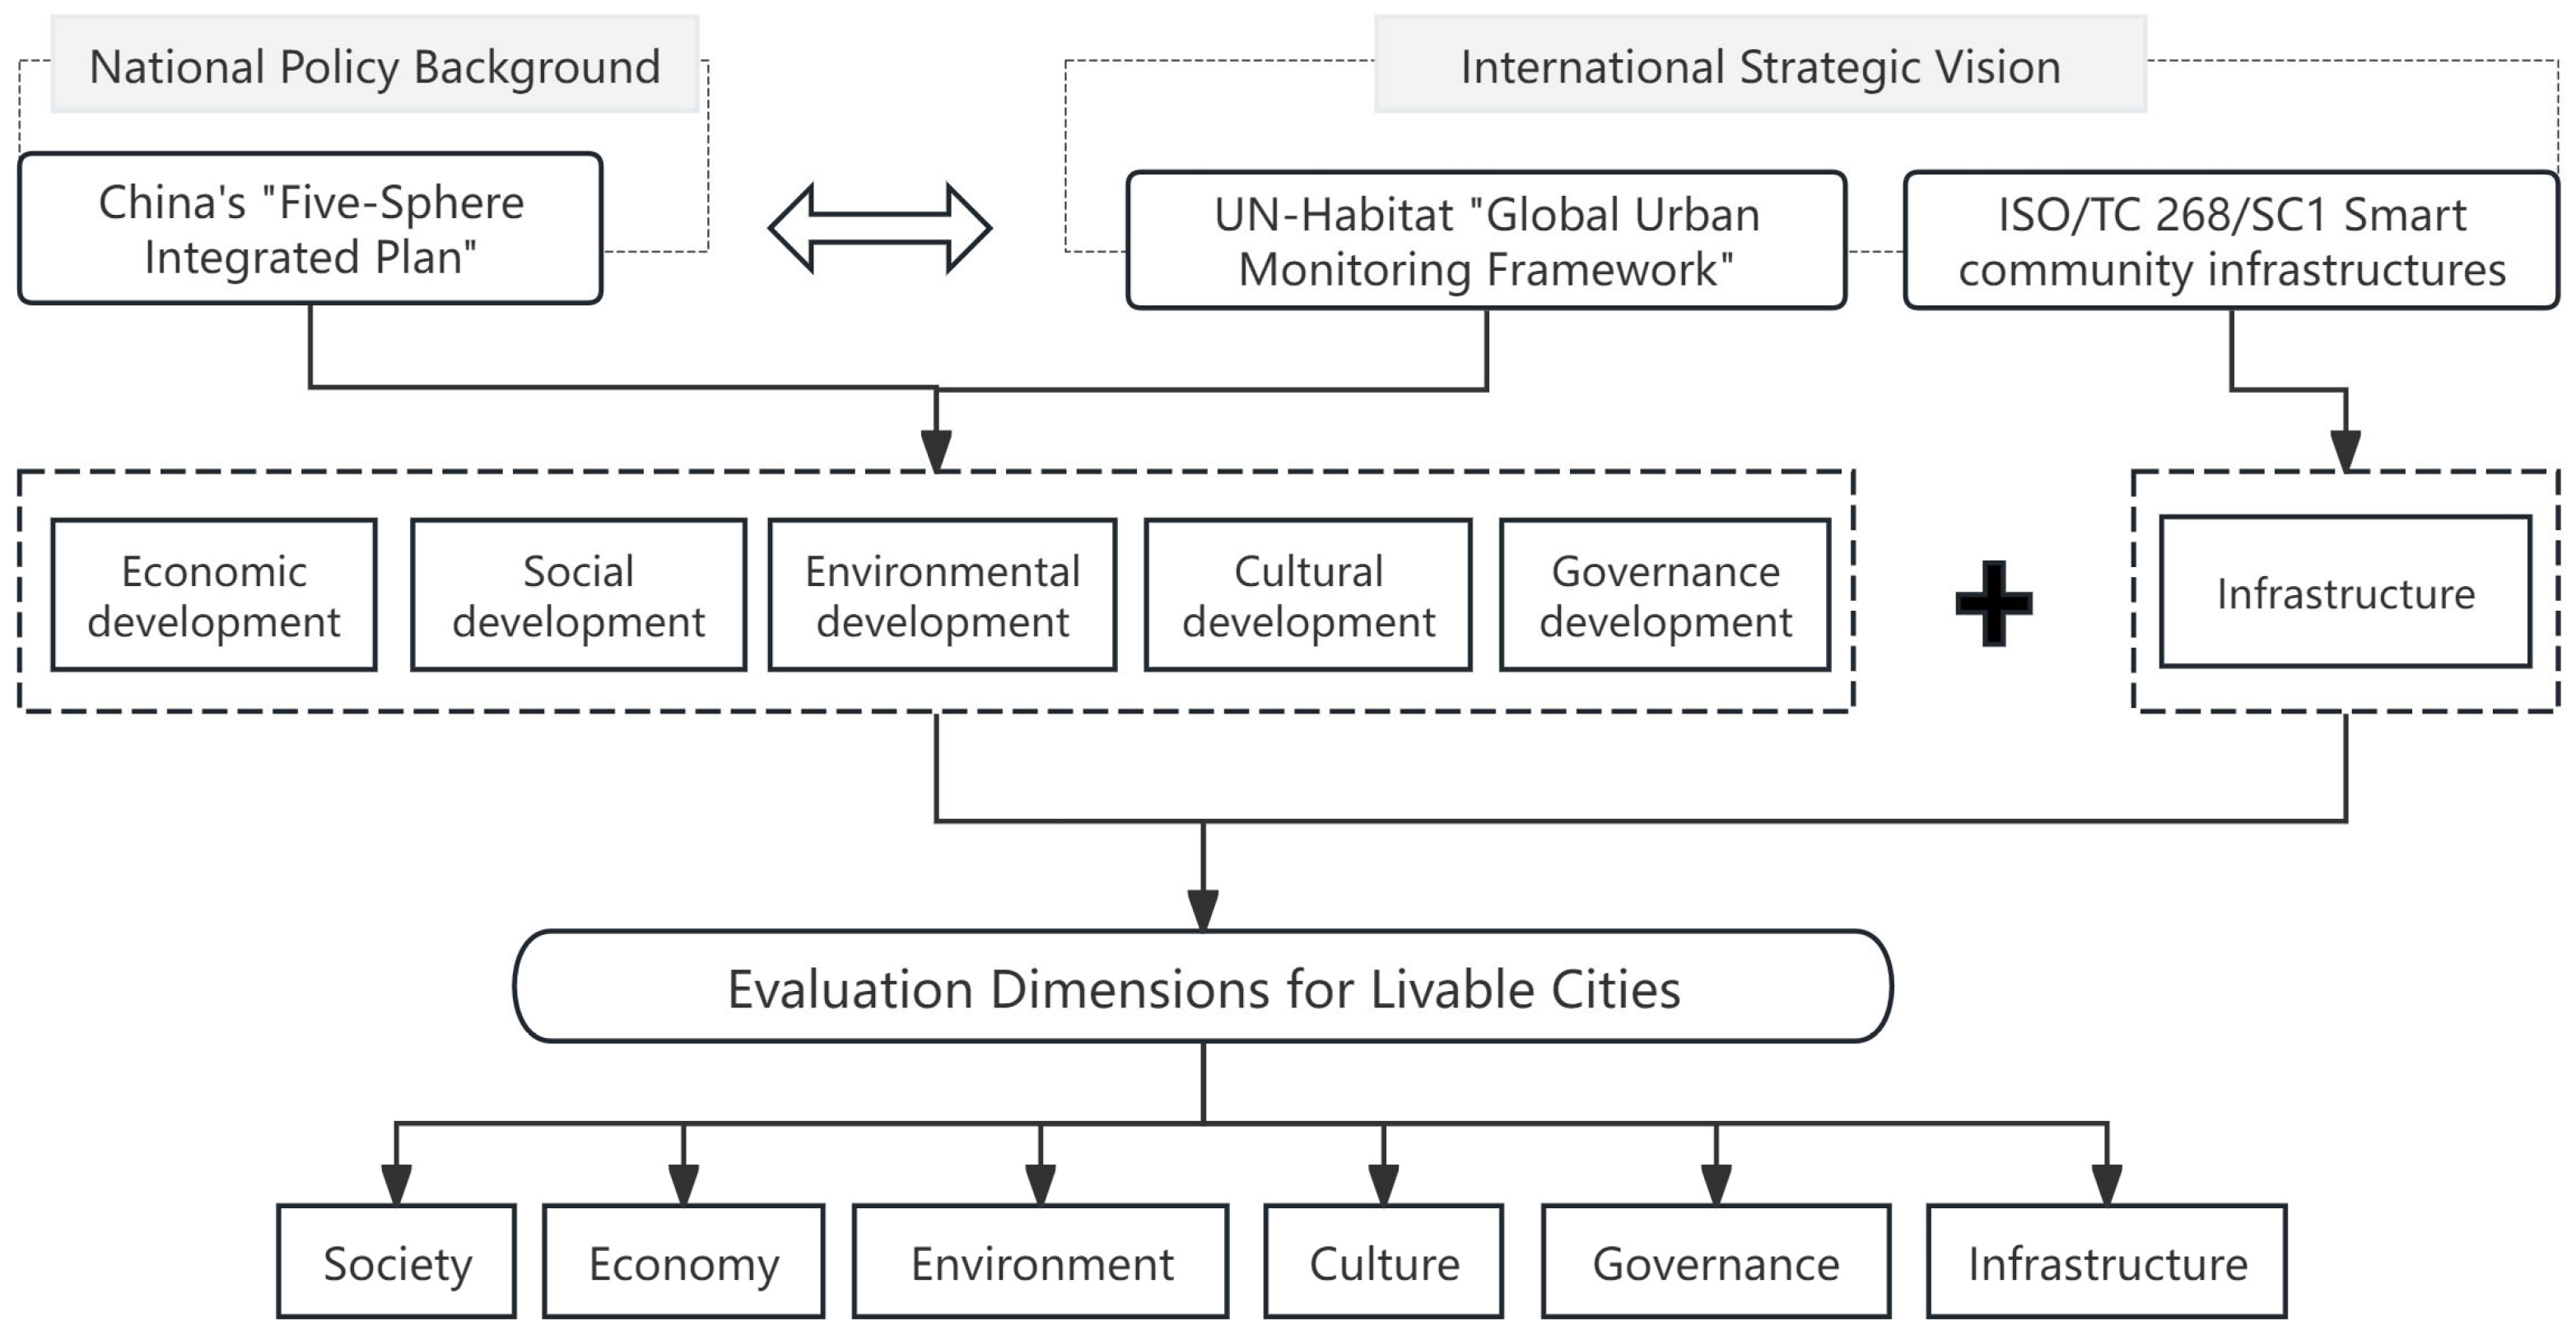
2.3.1. Evaluation Dimensions
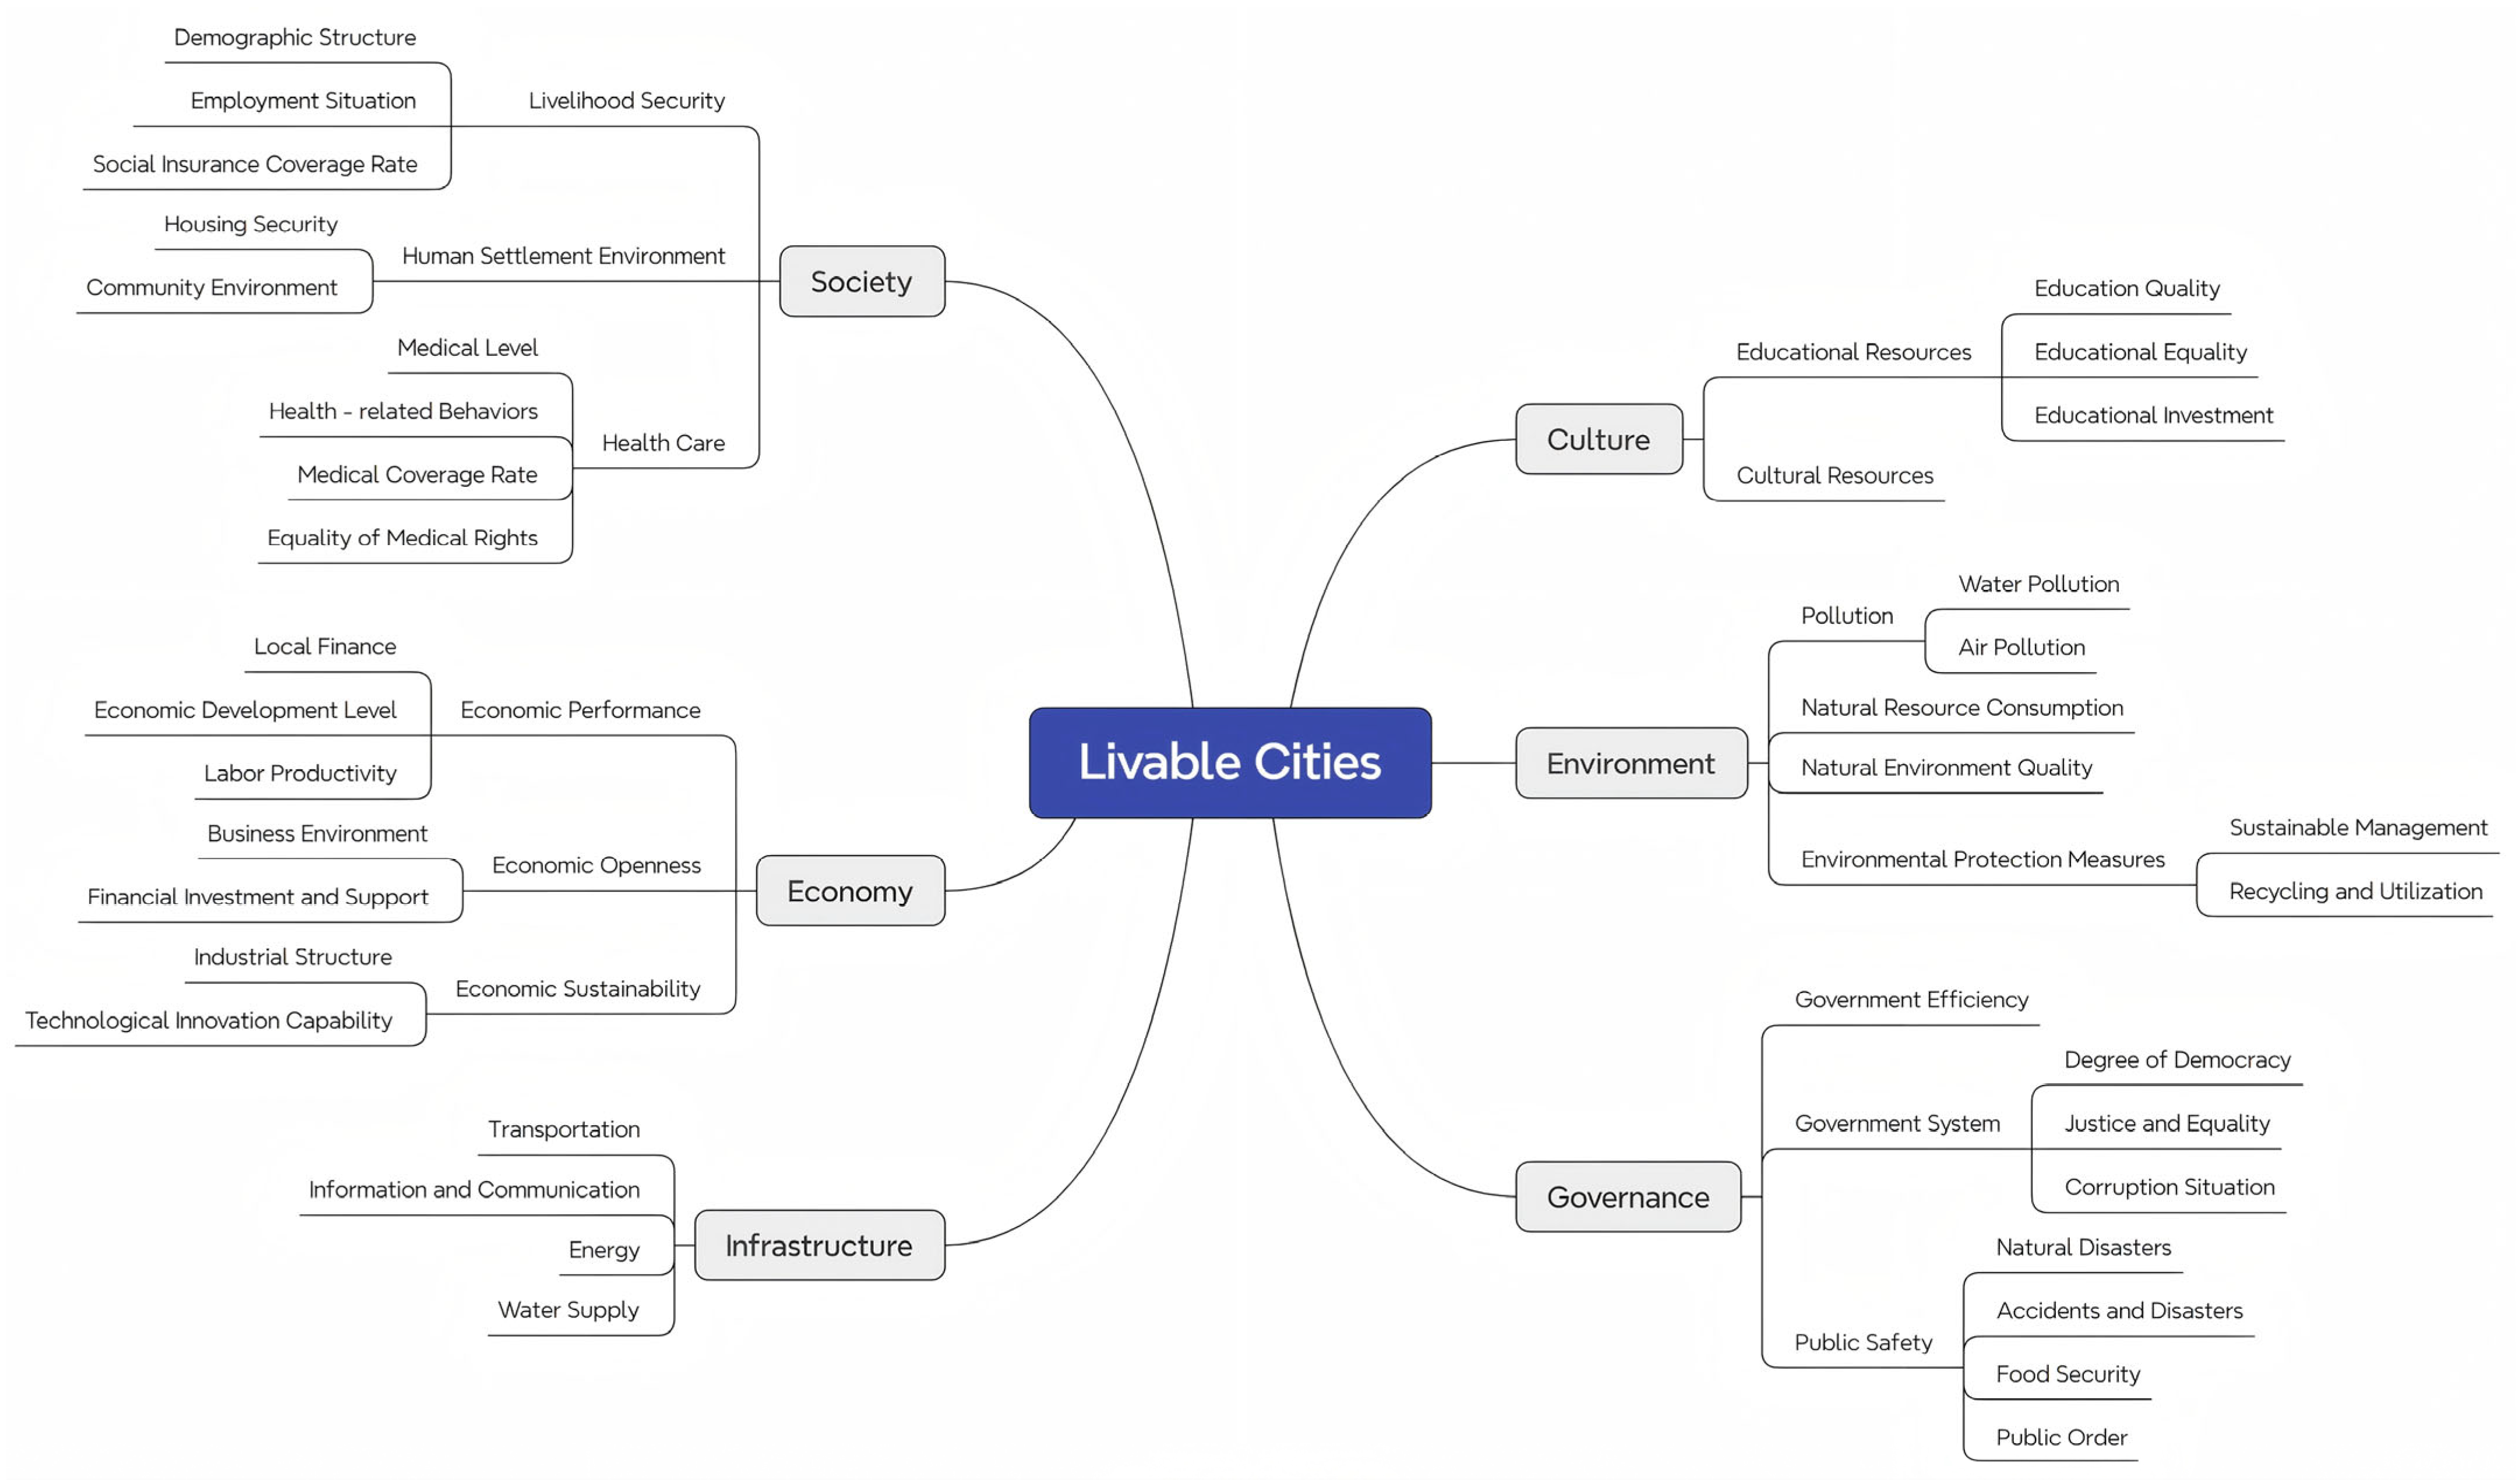
2.3.2. Evaluation Elements
2.3.3. Evaluation Indicators
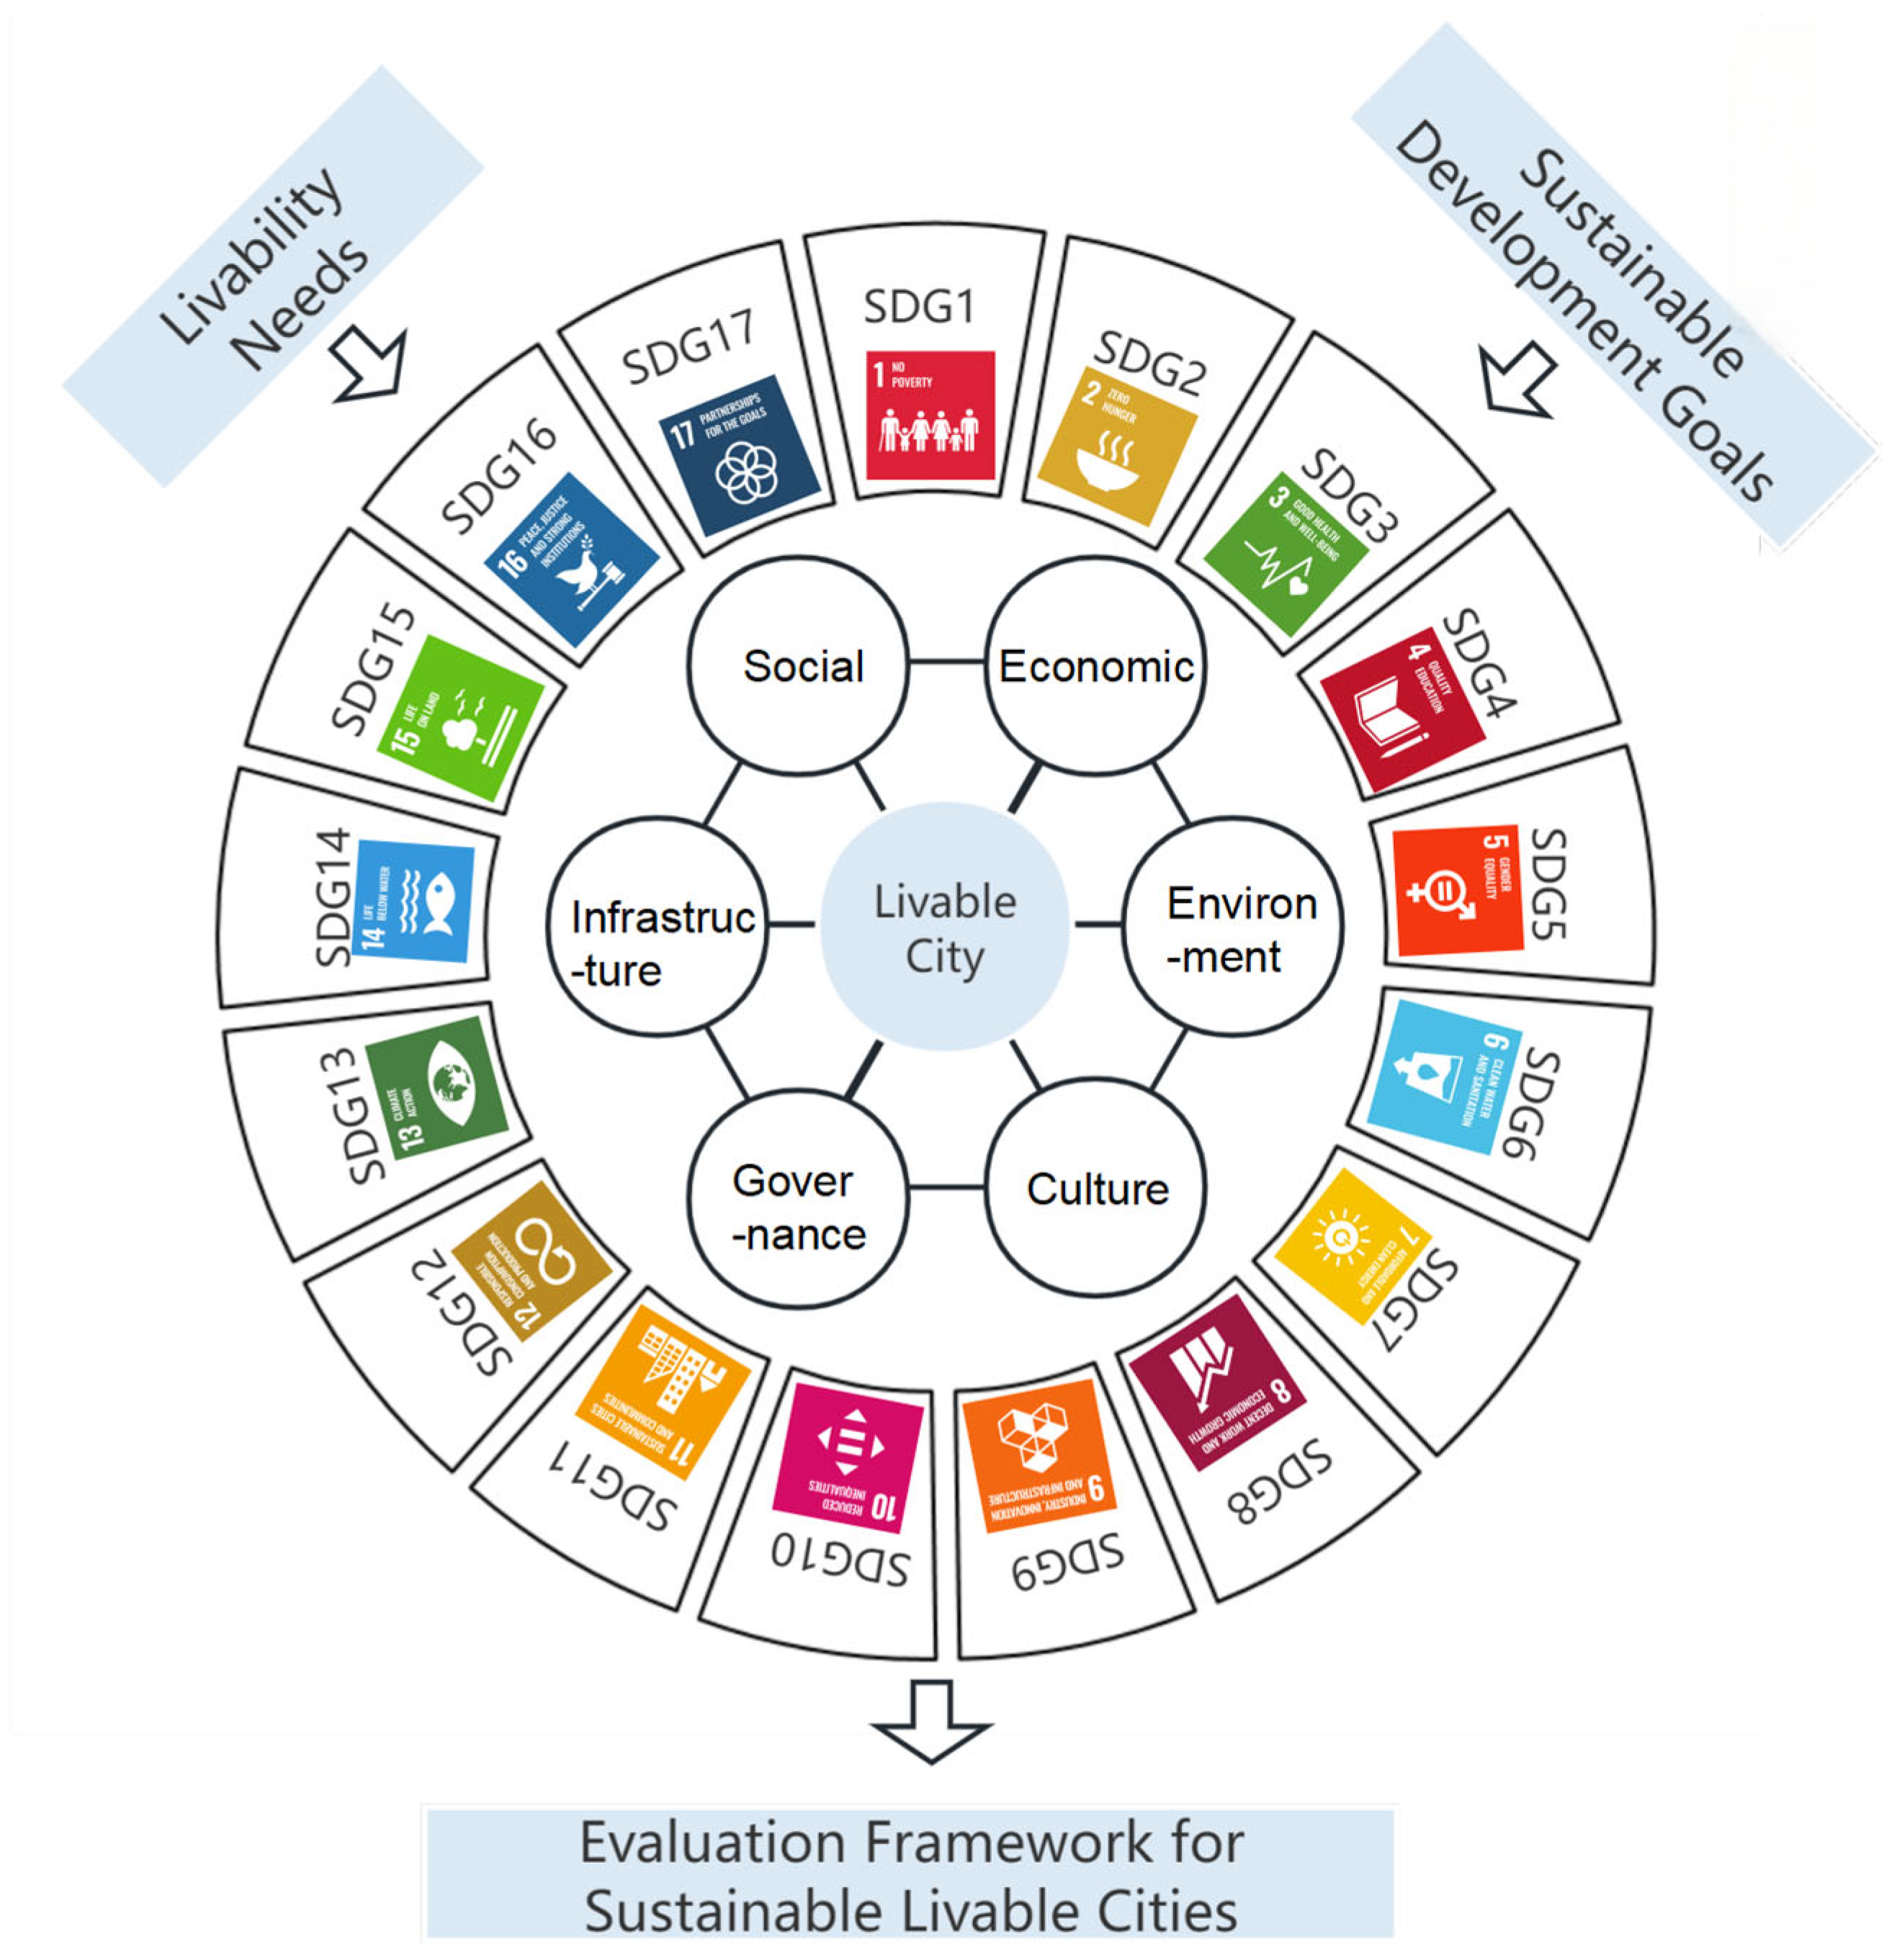
2.3.4. Response Analysis of Livable Cities’ Indicator System to SDGs
2.4. Evaluation and Analysis Method of Livable Cities
2.4.1. Determination of Indicator Thresholds
2.4.2. Data Standardization
2.4.3. Weighting and Aggregation of Indicators
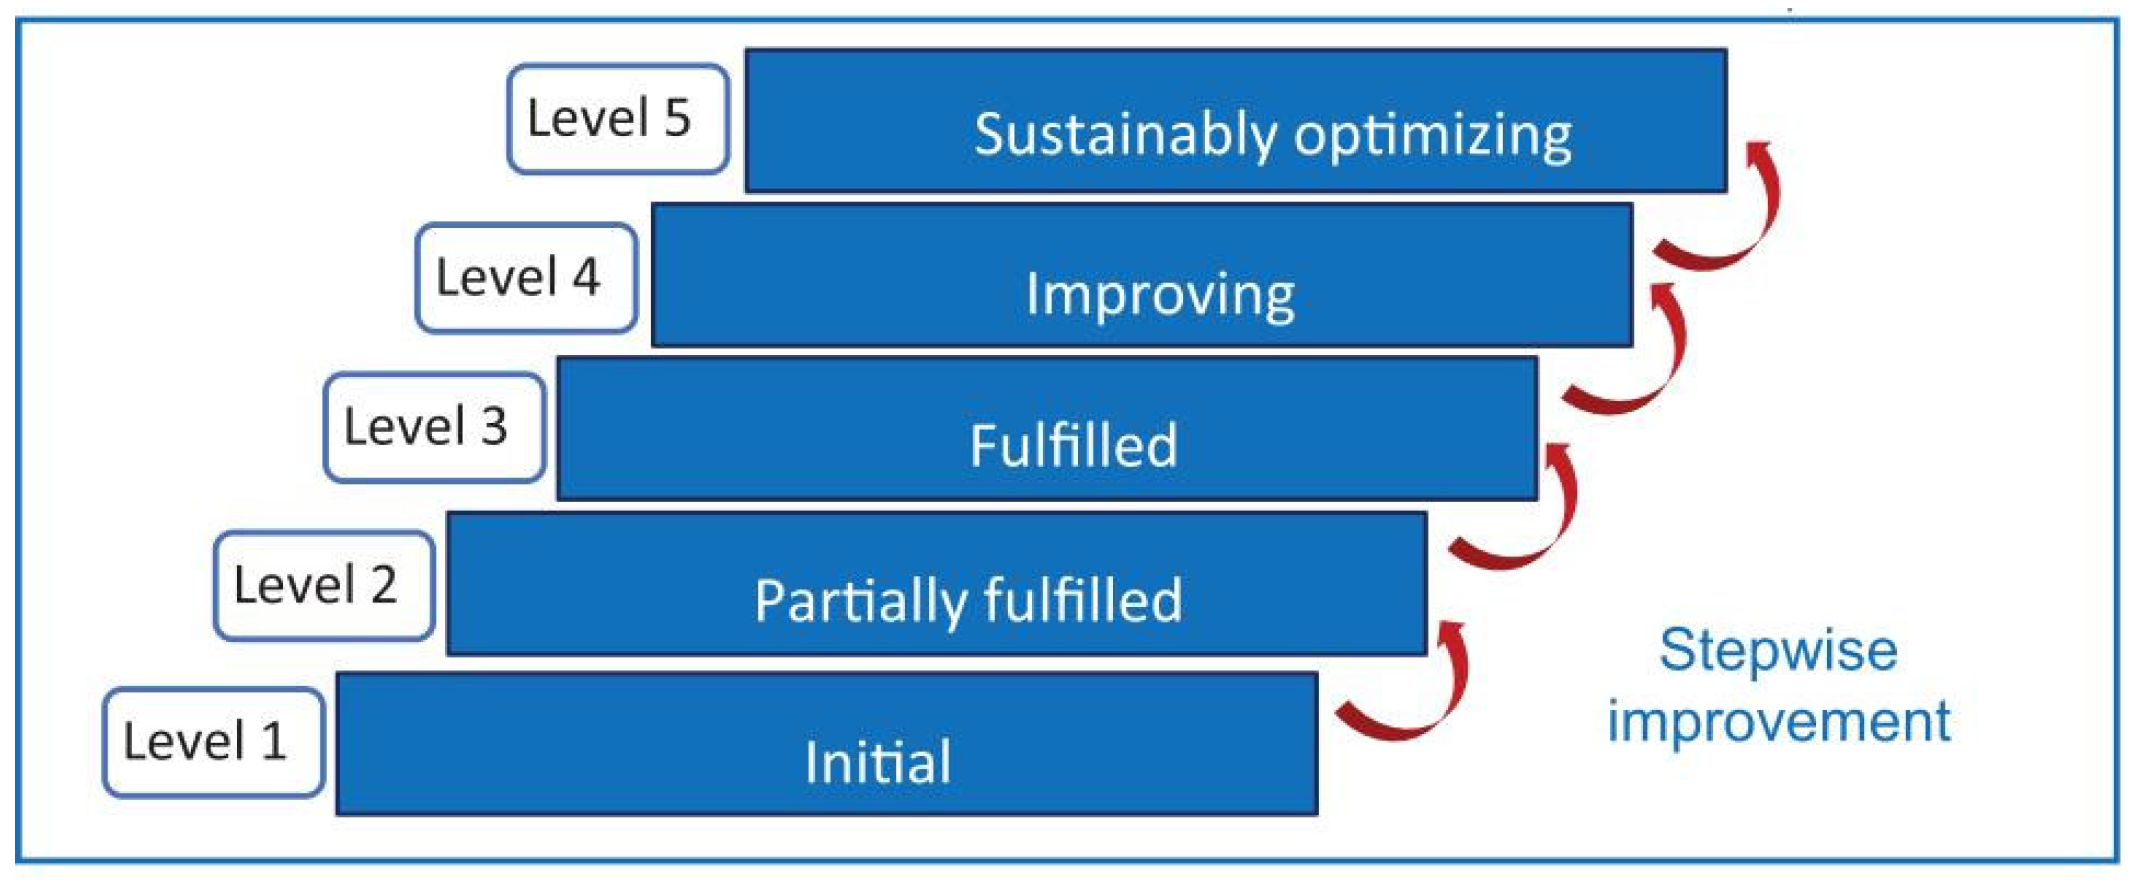
2.4.4. Maturity Model
- Level 1 (Initial): ≤P20, indicating an early development stage.
- Level 2 (Partially Implemented): >P20 and ≤P40, meaning needs are identified but incomplete.
- Level 3 (Achieved): >P40 and ≤P60, representing a moderate performance level.
- Level 4 (Upgrading): >P60 and ≤P80, signifying partial orientation toward future needs.
- Level 5 (Sustained Optimization): >P80, reflecting benchmark performance with continuous improvement via the PDCA cycle.
3. Results
3.1. Empirical Results of the Livability Evaluation of Chinese Cities
3.1.1. Consistency of the Index Ranking Results with Other Reports
3.1.2. Analysis of the Advantages and Disadvantages of Top and Bottom Ranking Cities
- Cities with a Relatively High Livability Index Ranking
- 2.
- Cities with a Relatively low Livability Index Ranking
- 3.
- Comprehensive Comparison
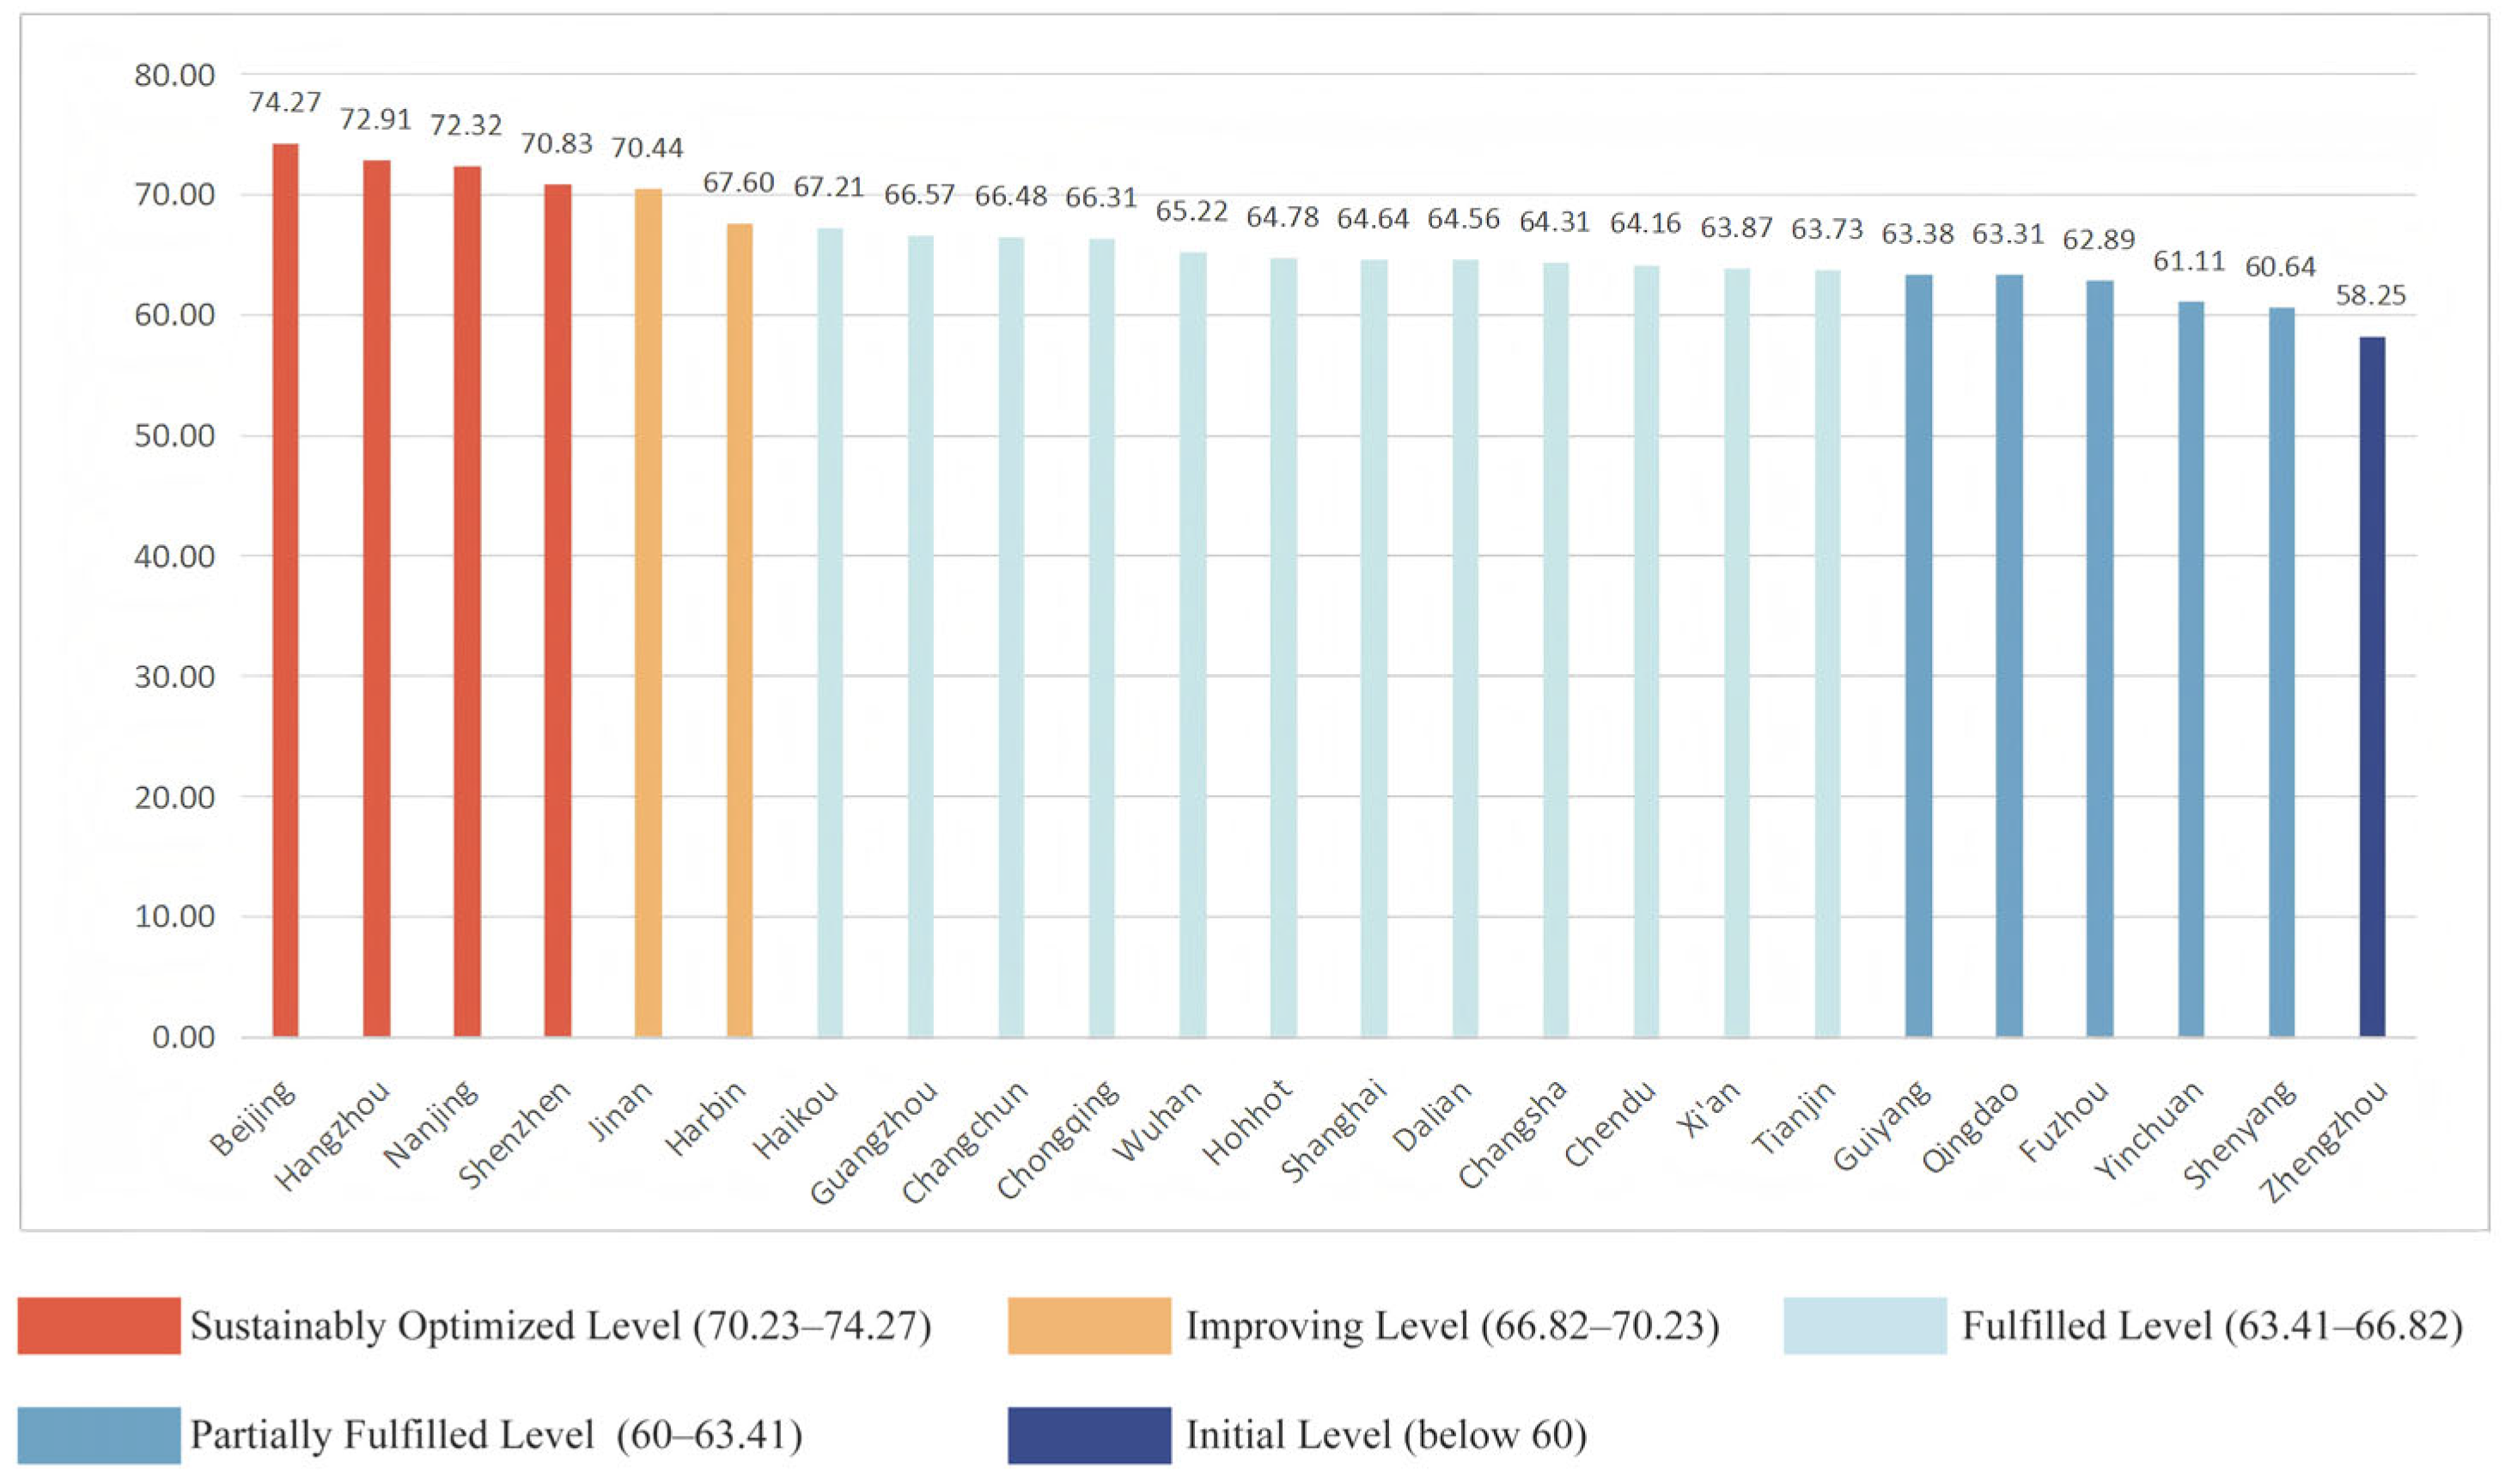
3.1.3. Maturity Levels of Livable Cities
- Initial Level (Score: below 60)
- 2.
- Partially Fulfilled Level (Score: 60–63.41)
- 3.
- Fulfilled Level (Score: 63.41–66.82)
- 4.
- Improving Level (Score: 66.82–70.23)
- 5.
- Sustainably Optimized Level (Score: 70.23–74.27)
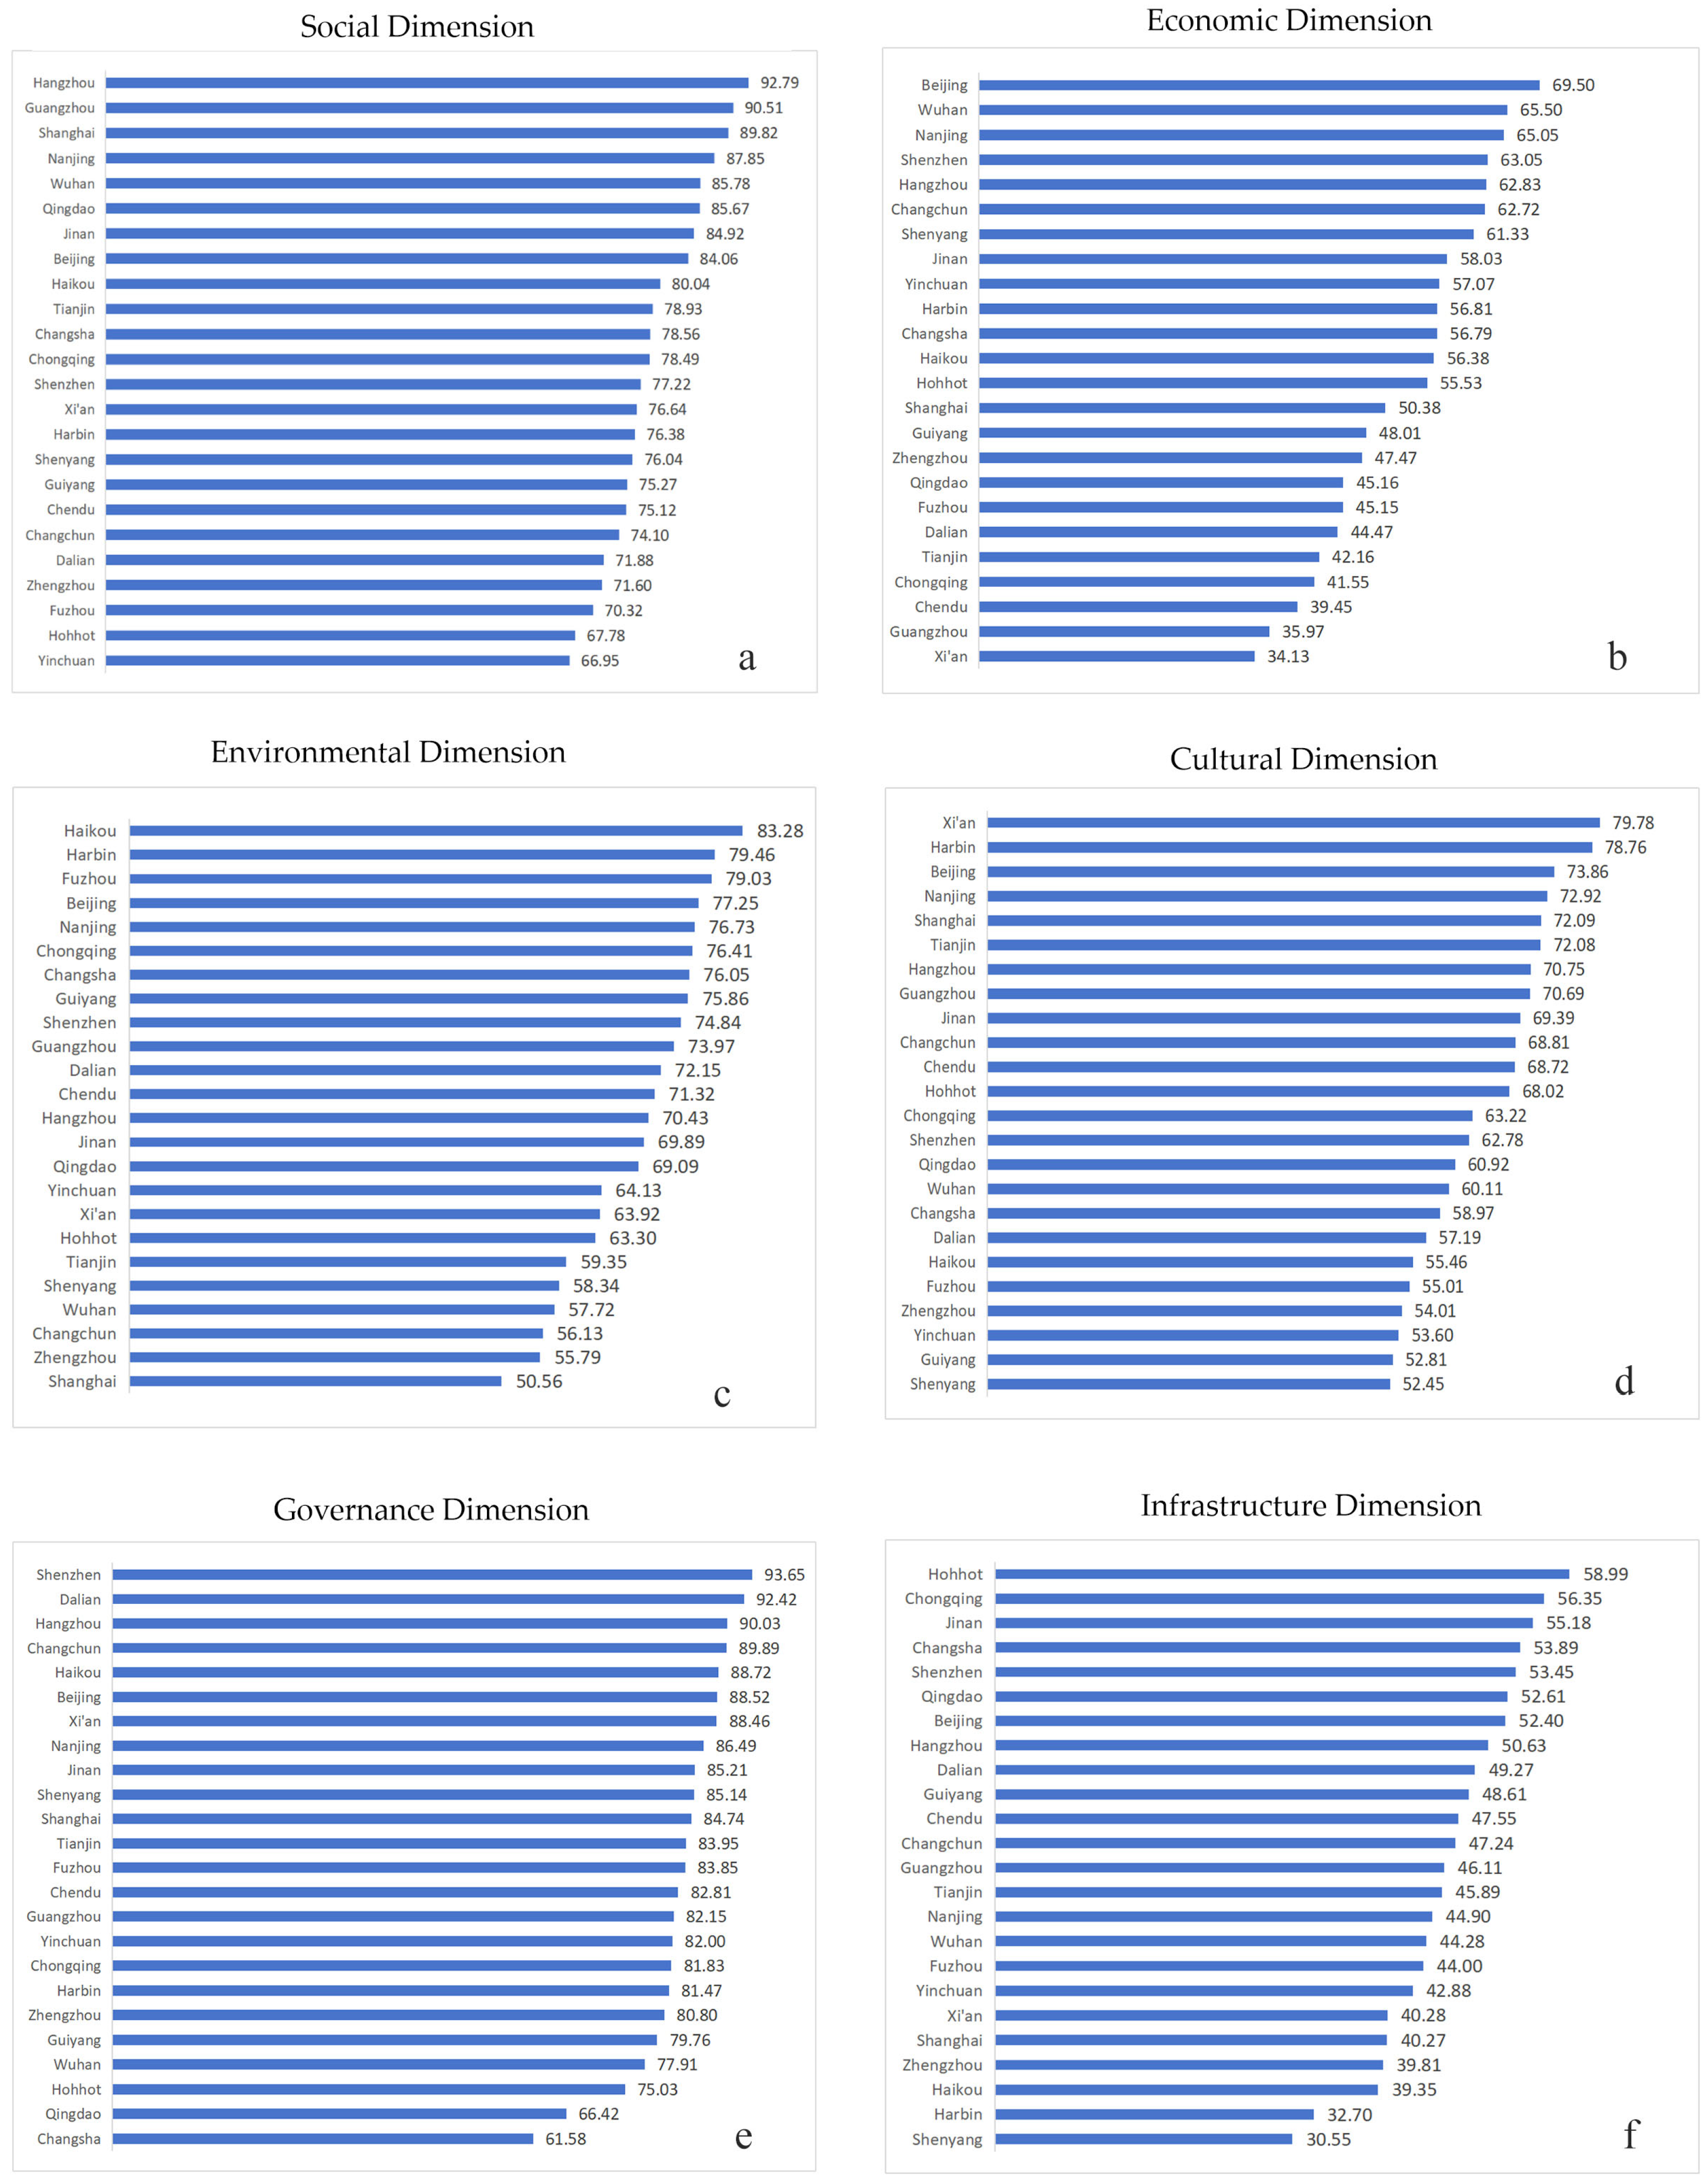
3.2. Analysis of Urban Livability Under Different Dimensions
3.3. Transmission Mechanism of External Factors on Urban Livability
- (1)
- Economic Transmission Effect
- (2)
- Resource Flow Effect
- (3)
- Policy Synergy Effect
- (4)
- Typical Case
3.4. Differentiated Targeted Strategies by City Type
4. Discussion
4.1. Comprehensive Coverage of the Indicator System and Alignment with SDGs
4.2. Versatility of Research Methods and Tool Innovation
4.3. Strategies for Data Consistency Optimization
4.4. Collaborative Advancement of National Standards
4.5. Research Limitations and Future Prospects
- (1)
- Expansion of Sample and Data Scope
- (2)
- Deepening of Model and Analysis
- (3)
- Practical Implementation of Policy Recommendations
5. Conclusions
- The livable city indicator system fully covers all 17 SDGs, providing a comprehensive and balanced evaluation of sustainable pathways for livable cities.
- The methodology, leveraging the self-developed “ILCSD” and knowledge graph technology, demonstrates high efficiency and reusable generality in assessing diverse urban characteristics (e.g., livable cities as a representative theme).
- Threshold setting and index standardization methods consistent with global sustainability monitoring improve data consistency and cross-city comparability, “bottom-up” supporting progress monitoring for 2030 SDGs alignment at the urban, regional, national, and transnational levels.
- As pre-research and standard synchronization verification, the findings technically support the development of Chinese national standard for livable cities, facilitating alignment with international standards.
- The maturity model developed in this study has been successfully applied to evaluate livability in Chinese cities, providing clear guidance for continuous improvement in the PDCA (Plan–Do–Check–Act) full life cycle of urban assessment.
Author Contributions
Funding
Data Availability Statement
Conflicts of Interest
Appendix A

| SDGs | Number of SDGs Indicators by “Tagging” | SDGs Indicators |
|---|---|---|
| SDG 1 No Poverty | 11 | 1.1.1;1.2.1;1.2.2;1.3.1;1.4.1;1.4.2;1.5.1;1.5.2;1.5.4;1.a.2;1.b.1 |
| SDG 2 Zero Hunger | 13 | 2.1.1;2.1.2;2.2.1;2.2.2;2.2.3;2.3.1;2.3.2;2.4.1;2.5.1;2.5.2;2.a.1;2.a.2;2.c.1 |
| SDG 3 Good Health and Well-being | 27 | 3.1.1;3.1.2;3.2.1;3.2.2;3.3.1;3.3.2;3.3.3;3.3.4;3.4.1;3.4.2;3.5.1;3.5.2;3.6.1;3.7.1;3.7.2;3.8.1;3.8.2;3.9.1;3.9.2;3.9.3;3.a.1;3.b.1;3.b.2;3.b.3;3.c.1;3.d.1;3.d.2 |
| SDG 4 Quality Education | 12 | 4.1.1;4.1.2;4.2.1;4.2.2;4.3.1;4.4.1;4.5.1;4.6.1;4.7.1;4.a.1;4.b.1;4.c.1 |
| SDG 5 Gender Equality | 6 | 5.2.1;5.2.2;5.5.1;5.5.2;5.6.1;5.b.1 |
| SDG 6 Clean Water and Sanitation | 11 | 6.1.1;6.2.1;6.3.1;6.3.2;6.4.1;6.4.2;6.5.1;6.5.2;6.6.1;6.a.1;6.b.1 |
| SDG 7 Affordable and Clean Energy | 5 | 7.1.1;7.1.2;7.2.1;7.3.1;7.b.1 |
| SDG 8 Decent Work and Economic Growth | 10 | 8.1.1;8.2.1;8.3.1;8.4.1;8.4.2;8.5.1;8.5.2;8.6.1;8.8.1;8.9.1 |
| SDG 9 Industry, Innovation and Infrastructure | 12 | 9.1.1;9.1.2;9.2.1;9.2.2;9.3.1;9.3.2;9.4.1;9.5.1;9.5.2;9.a.1;9.b.1;9.c.1 |
| SDG 10 Reduced Inequalities | 7 | 10.1.1;10.2.1;10.4.1;10.5.1;10.7.1;10.a.1;10.b.1 |
| SDG 11 Sustainable Cities and Communities | 13 | 11.1.1;11.2.1;11.3.1;11.3.2;11.4.1;11.5.1;11.5.2;11.5.3;11.6.1;11.6.2;11.7.1;11.7.2;11.c |
| SDG 12 Responsible Consumption and Production | 7 | 12.2.1;12.2.2;12.3.1;12.4.2;12.5.1;12.a.1;12.c.1 |
| SDG 13 Climate Action | 3 | 13.1.1;13.1.3;13.2.2 |
| SDG 14 Life Below Water | 7 | 14.1.1;14.2.1;14.3.1;14.4.1;14.5.1;14.6.1;14.a.1 |
| SDG 15 Life on Land | 13 | 15.1.1;15.1.2;15.2.1;15.3.1;15.4.1;15.4.2;15.5.1;15.6.1;15.7.1;15.8.1;15.9.1;15.a.1,15.b.1 |
| SDG 16 Peace, Justice and Strong Institutions | 18 | 16.1.1;16.1.2;16.1.3;16.1.4;16.2.1;16.2.2;16.2.3;16.3.1;16.3.2;16.3.3;16.5.1;16.5.2;16.6.2;16.7.1;16.7.2;16.9.1;16.10.1;16.10.2 |
| SDG 17 Partnerships for the Goals | 6 | 17.1.1;17.1.2;17.3.2;17.4.1;17.6.1;17.8.1 |
| Total | 181 | - |
Appendix B
| Responses to the SDGs | Indicators from SDGs | Indicators of the Livable City Evaluation | Source | Remark |
|---|---|---|---|---|
| SDG 1 No Poverty | 1.1.1 | Incidence of Poverty | ISO 37120 13.3 [40] | / |
| 1.3.1 | Coverage Rate of Minimum Living Security | ISO 37123 13.2 [41] | One indicator is associated with two SDGs, and the other SDG is SDG 10. | |
| 1.4.2 | Housing Unit-to-Household Ratio of Urban Households | GB/T 39497-2020 [42] | One indicator is associated with two SDGs, and the other SDG is SDG 11. | |
| 1.a.2 | Percentage of General Public Service Expenditure in Local Government Budget Expenditure | ISO 37122 13.1 [43] | / | |
| 1.5.1 | Average Annual Losses Caused by Disasters as a Proportion of GDP | ISO 37123 13.5 [41] | One indicator is associated with three SDGs, and the other two are SDG 11 and SDG 13. | |
| 1.4.1 | Coverage Rate of 15-Minute Community Life Circle | ISO 37120 21.4 [40]; GB/T 39497-2020 9.5 [42] | / | |
| 1.b.1 | Percentage of Social Security Budget Expenditure in Local Government Budget Expenditure | SDGs | / | |
| SDG 2 Zero Hunger | 2.a.2 | Percentage of Public Budget Expenditure on Agriculture, Forestry and Water in Total General Public Budget Expenditure | ISO 37122 20.1 [43] | / |
| 2.4.1 | Qualification Rate of Food Sampling Inspection | ISO 37120 20.1 [40] | / | |
| SDG 3 Good Health and Well-being | SDG 3 | Life Expectancy | ISO 37120 11.1 [40] | / |
| 3.2.1 | Mortality Rate of Infants under 5 Years Old per 1000 Infants | ISO 37120 11.4 [40] | / | |
| 3.2.2 | Neonatal Mortality Rate | SDGs | / | |
| 3.3.1 | Incidence Rate of New AIDS Cases per 1000 Population | SDGs | / | |
| 3.3.2 | Incidence Rate of Tuberculosis per 100,000 Population | SDGs | / | |
| 3.3.4 | Incidence Rate of Hepatitis B per 100,000 Population | SDGs | / | |
| 3.8.1 | Number of Beds in Medical and Health Institutions per 1000 Population | ISO 37120 11.2 [40] | / | |
| 3.8.2 | Percentage of Healthcare Expenditure in the Per Capita Disposable Income of Urban Resident Households in the City | SDGs | / | |
| 3.a.1 | Smoking Rate of People Aged 15 and Above | SDGs | / | |
| 3.c.1 | Number of Licensed (Assistant) Physicians per 1000 Population | ISO 37120 11.3 [40] | / | |
| 3.b.1 | Vaccination Rate of Immunization Program Vaccines for School-Age Children | ISO 37123 11.3 [41] | / | |
| 3.b.2 | Percentage of Expenditure on Health in General Public Budget Expenditure | SDGs | / | |
| 3.6.1 | Number of Traffic Fatalities per 100,000 Population | ISO 37120 19.5 [40] | / | |
| 3.1.1 | Maternal Mortality Rate | SDGs | / | |
| SDG 4 Quality Education | 4.1.2 | Graduation Rate of Primary Education | ISO 37120 6.2 [40] | / |
| 4.3.1 | Number of People with Junior College Education and Above per 100,000 Population | ISO 37120 6.6 [40] | / | |
| 4.2.2 | Gross Enrollment Rate of Preschool Education | SDGs | / | |
| 4.5.1 | Enrollment Rate of Compulsory Education for Persons with Disabilities | ISO 37120 6.1 [40] | / | |
| 4.c.1 | Teacher-Student Ratio in Primary Schools | ISO 37120 6.4 [40] | / | |
| SDG 5 Gender Equality | 5.5.1 | Proportion of Female Members in the Municipal People’s Congress (In the context of China) | ISO 37120 10.1 [40] | / |
| 5.b.1 | Penetration Rate of Mobile Phones | GB/T 40947-2021 F2-S6-T26 [42] | / | |
| SDG 6 Clean Water and Sanitation | 6.3.2 | Proportion of Surface Water Reaching or Better than Class III Water Bodies | GB/T 40482-2021 6.3 [44]; GB/T 39497-2020 7.5 [42] | One indicator is associated with two SDGs, and the other SDG is SDG 14. |
| 6.6.1 | Protection Rate of Natural Wetlands | GB/T 39497-2020 7.3 [42] | / | |
| 6.4.1 | Water Loss Rate | ISO 37120 23.7 [40] | / | |
| 6.1.1 | Guarantee Rate of Drinking Water Safety | IS0 37120 23.1 [40] | / | |
| 6.3.1 | Centralized Treatment Rate of Urban Sewage | ISO 37120 22.2 [40]; GB/T 39497-2020 7.11 [42] | / | |
| 6.4.2 | Per Capita Total Water Consumption | ISO 37120 23.5 [40] | / | |
| SDG 7 Affordable and Clean Energy | 7.1.1 | Percentage of Urban Population with Access to Electricity Service | ISO 37120 7.3 [40] | / |
| 7.2.1 | Proportion of Renewable Energy Consumption | ISO 37120 7.2 [40] | One indicator is associated with two SDGs, and the other SDG is SDG 12. | |
| 7.1.2 | Number of Natural Gas Service Connections per 1000 Population | ISO 37120 7.4 [40] | / | |
| SDG 8 Decent Work and Economic Growth | 8.5.2 | Registered Unemployment Rate in Urban Areas | ISO 37120 5.1 [40] | / |
| 8.2.1 | Overall Labor Productivity | GB/T 40482-2021 5.2 [44] | One indicator is associated with two SDGs, and the other SDG is SDG 10 | |
| 8.8.1 | Number of Fatalities in Work Safety Accidents per 100,000 Population | ISO 37120 15.9 [40] | / | |
| 8.1.1 | Per Capita Regional GDP | GB/T 40482-2021 5.1 [44] | / | |
| SDG 9 Industry, Innovation and Infrastructure | 9.3.2 | Water Supply Penetration Rate | ISO 37120 21.2 [40] | / |
| 9.4.1 | Reduction Rate of Carbon Dioxide Emission per Unit of GDP | GB/T 40482-2021 6.5 [44] | / | |
| 9.5.2 | Number of Scientific Researchers per 1,000,000 Population | ISO 37120 6.6 [40] | / | |
| SDG 9 | Number of Patented Inventions per 10,000 Population | ISO 37120 5.6 [40] | / | |
| 9.1.1 | Kilometers of Urban Roads per 100,000 Population | ISO 37120 19.1 [40] | / | |
| 9.c.1 | Proportion of Internet Broadband Access Subscribers | ISO 37120 18.1 [40] | One indicator is associated with two SDGs, and the other SDG is SDG17. | |
| 9.1.2 | Total Annual Passenger Volume of Public Transit Buses (Including Electric Buses) | SDGs | / | |
| 9.5.1 | Proportion of Expenditure on Scientific Research and Experimental Development (R&D) in GDP | GB/T 39497-2020 5.12 [42] | / | |
| 9.2.1 | Percentage of the Gross Output Value of the Secondary Industry in Regional GDP | SDGs | / | |
| SDG 10 Reduced Inequalities | 10.2.1 | Coverage Rate of Minimum Living Security | ISO 37123 13.2 [41] | / |
| 10.4.1 | Overall Labor Productivity | GB/T 40482-2021 5.2 [44] | / | |
| SDG 11 Sustainable Cities and Communities | 11.3.1 | Population Density | ISO 37120 21.5 [40] | / |
| 11.6.2 | Concentration of Fine Particulate Matter (PM2.5) | ISO 37120 8.1 [40] | / | |
| 11.7.1 | Per Capita Green Space Area in Parks (Per Capita Green Space Area in Parks per 100,000 Population) | ISO 37120 14.2 [40] | / | |
| 11.6.1 | Recycling Rate of Urban Solid Waste | ISO 37120 16.3 [40] | One indicator is associated with two SDGs, and the other SDG is SDG 12. | |
| 11.5.2 | Average Annual Losses Caused by Disasters as a Proportion of GDP | ISO 37123 13.5 [41] | / | |
| 11.5.1 | Number of Fatalities Caused by Fires per 100,000 Population | ISO 37120 15.2 [40] | / | |
| 11.7.2 | Criminal Offense Rate per 10,000 People | SDGs | / | |
| 11.2.1 | Coverage Rate of Bus Stops within 500 m | ISO 37120 19.6 [40] | / | |
| 11.7.1 | Per Capita Area of Public Sports Land | ISO 37120 14.2 [40] | / | |
| 11.1.1 | Housing Unit-to-Household Ratio of Urban Households | GB/T 39497-2020 [42] | / | |
| 11.5.3 | Direct Economic Losses Caused by Fires | ISO 37120 12.4 [40] | / | |
| SDG 12 Responsible Consumption and Production | 12.a.1 | Proportion of Renewable Energy Consumption | ISO 37120 7.2 [40] | / |
| 12.5.1 | Recycling Rate of Urban Solid Waste | ISO 37120 16.3 [40] | / | |
| SDG 13 Climate Action | 13.2.2 | Per Capita Greenhouse Gas Emission | ISO 37120 8.3 [40] | / |
| 13.1.1 | Average Annual Losses Caused by Disasters as a Proportion of GDP | ISO 37123 13.5 [41] | / | |
| SDG 14 Life Below Water | 14.1.1 | Proportion of Surface Water Reaching or Better than Class III Water Bodies | GB/T 40482-2021 6.3 [44]; GB/T 39497-2020 7.5 [42] | / |
| SDG 15 Life on Land | 15.1.1 | Forest Coverage Rate | GB/T 40482-2021 6.11 [44] | / |
| 15.4.2 | Green Coverage Rate in Built-up Areas | SDGs | / | |
| SDG 16 Peace, Justice and Strong Institutions | 16.3.3 | Success Rate of Mediation of Social Conflicts and Disputes | GB/T 39497-2020 8.8 [42] | / |
| 16.7.2 | Voter Turnout Rate in Elections | ISO 37120 10.4 [40] | / | |
| 16.5.2 | Number of Arrests for Corruption and Bribery of Civil Servants per 100,000 Population | ISO 37120 10.2 [40] | / | |
| SDG 17 Partnerships for the Goals | 17.1.1 | Percentage of Local Government Budget Revenue in Regional GDP | SDGs | / |
| 17.6.1 | Proportion of Internet Broadband Access Subscribers | ISO 37120 18.1 [40] | / | |
| 17.8.1 | Proportion of Internet Broadband Access Subscribers | ISO 37120 18.1 [40] | / | |
| 17.1.2 | Percentage of Tax Revenue in Public Budget Revenue | ISO 37120 9.4 [40] | / |
| SDGs | Times of Indicator Responses (Including the Cases of One To-Many) |
|---|---|
| SDG3 | 15 |
| SDG11 | 12 |
| SDG9 | 9 |
| SDG1 | 7 |
| SDG6 | 6 |
| SDG4 | 5 |
| SDG8 | 4 |
| SDG17 | 4 |
| SDG10 | 2 |
| SDG7 | 3 |
| SDG16 | 3 |
| SDG2 | 2 |
| SDG12 | 2 |
| SDG13 | 2 |
| SDG15 | 2 |
| SDG5 | 2 |
| SDG14 | 1 |
| Total | 81 |
References
- United Nations Human Settlements Programme. World Cities Report 2020 Value of Sustainable Urbanization; United Nations: New York, NY, USA, 2020. [Google Scholar] [CrossRef]
- Kovacs-Györi, A.; Ristea, A.; Havas, C.; Mehaffy, M.; Hochmair, H.H.; Resch, B.; Juhasz, L.; Lehner, A.; Ramasubramanian, L.; Blaschke, T. Opportunities and challenges of geospatial analysis for promoting urban livability in the era of big data and machine learning. ISPRS Int. J. Geo-Inf. 2020, 9, 752. [Google Scholar] [CrossRef]
- Sheikh, W.T.; van Ameijde, J. Promoting livability through urban planning: A comprehensive framework based on the “theory of human needs”. Cities 2022, 131, 103972. [Google Scholar] [CrossRef]
- United Nations General Assembly. Transforming our World: The 2030 Agenda for Sustainable Development. 2015. Available online: https://sustainabledevelopment.un.org/post2015/transformingourworld/publication (accessed on 1 October 2024).
- United Nations General Assembly. Habitat III New Urban Agenda: Quito Declaration on Sustainable Cities and Human Settlements for All; United Nations General Assembly: Quito, Ecuador, 2016. [Google Scholar]
- European Commission. Report from the Commission to the Council on the Urban Agenda for the EU; Theme: Urban Development; European Commission: Brussels, Belgium, 2017. [Google Scholar]
- United Nations. United Nations Conference on Human Settlements: Habitat II. 1996. Available online: https://www.un.org/en/conferences/habitat/istanbul1996 (accessed on 27 December 2024).
- World Bank Group. Livability and Sustainability of Cities. Available online: https://www.worldbank.org/en/cpf/india/what-we-work/resource-efficient-growth/livability-sustainability-cities (accessed on 27 December 2024).
- World Health Organization. Promoting Health Through Good Governance: WHO Manifesto: Build Healthy, Liveable Cities. Available online: https://www.who.int/activities/promoting-health-through-good-governance/who-manifesto-build-healthy-liveable-cities (accessed on 27 April 2025).
- Ahmed, N.O.; El-Halafawy, A.M.; Amin, A.M. A Critical Review of Urban Livability. Eur. J. Sustain. Dev. 2019, 8, 165–182. [Google Scholar] [CrossRef]
- Ruth, M.; Franklin, R.S. Livability for all? Conceptual limits and practical implications. Appl. Geogr. 2014, 49, 18–23. [Google Scholar] [CrossRef] [PubMed]
- Capol, L.; Keshav, S.; Nagy, Z. Activity hours: Assessing liveability during heatwaves. Build. Environ. 2025, 269, 112339. [Google Scholar] [CrossRef]
- Manning, W.J. Urban environment: Recognizing that pollution and social factors can create barriers to development of more healthy and liveable cities. Environ. Pollut. 2013, 183, 1. [Google Scholar] [CrossRef] [PubMed]
- Foglia, C.; Parisi, M.L.; Pontarollo, N. A senior liveability index for European cities. Reg. Sci. Policy Pract. 2023, 15, 769–794. [Google Scholar] [CrossRef]
- Antolín-López, R.; Martínez-Bravo, M.D.M.; Ramírez-Franco, J.A. How to make our cities more livable? Longitudinal interactions among urban sustainability, business regulatory quality, and city livability. Cities 2024, 154, 105358. [Google Scholar] [CrossRef]
- Yan, M.; Yang, F.; Liu, L.; Guo, D.; Li, C. Construction of an indicator library for cities’ sustainable development. Chin. J. Popul. Resour. Environ. 2024, 22, 469–480. [Google Scholar] [CrossRef]
- Economist Intelligence Unit (EIU). The Global Liveability Index 2024. Available online: https://www.eiu.com/n/webinars/global-liveability-index-2024/ (accessed on 15 October 2024).
- Okulicz-Kozaryn, A. City Life: Rankings (Livability) Versus Perceptions (Satisfaction). Soc. Indic. Res. 2013, 110, 433–451. [Google Scholar] [CrossRef]
- Monocle. Monocle’s Quality of Life Survey 2024: The 20 Best Places to Live. 13 June 2024. Available online: https://monocle.com/affairs/urbanism/quality-of-life-survey-2024/ (accessed on 15 October 2024).
- Numbeo. Current Quality of Life Index. Available online: https://www.numbeo.com/quality-of-life/rankings_current.jsp (accessed on 15 October 2024).
- Lodewick, C. 2022 Global Most Livable Cities List Released: Europe and Canada Are Big Winners. Fortune China. 2 July 2022. Available online: https://www.fortunechina.com/shangye/c/2022-07/02/content_414561.htm (accessed on 15 October 2024).
- Fernandez, C. These Are the 10 U.S. Cities with the Best Quality of Life—None Are in Florida; CNBC: Englewood Cliffs, NJ, USA, 2024. [Google Scholar]
- ISO/TC 268; The Technical Committee of Sustainable Cities and Communities. International Organization for Standardization: Geneva, Switzerland, 2012. Available online: https://www.iso.org/committee/656906.html (accessed on 27 April 2025).
- World Values Survey. Available online: https://www.worldvaluesurvey.org/wvs.jsp (accessed on 27 April 2025).
- Gallup. Comprehensive Global Research That Drives Strategic Leadership. Gallup World Poll and Global Survey Research-Gallup. Available online: https://www.gallup.com/analytics/318875/global-research.aspx (accessed on 27 April 2025).
- National Bureau of Statistics of China (NBSC). China City Statistical Yearbook; China Statistics Press: Beijing, China, 2023.
- Ministry of Housing and Urban-Rural Development of the People’s Republic of China. China Urban Construction Status Bulletin; China Statistics Press: Beijing, China, 2023.
- UN—Habitat. The Global Urban Monitoring Framework. Available online: https://unhabitat.org/the-global-urban-monitoring-framework (accessed on 17 June 2024).
- Chen, J.B. The “Five-in-One” Overall Layout; People’s Daily Press: Beijing, China, 2020. [Google Scholar]
- ISO/TC 268/SC1; The Sub—Committee of ISO/TC 268, Smart Community Infrastructures. International Organization for Standardization: Geneva, Switzerland, 2012. Available online: https://www.iso.org/committee/656967.html (accessed on 27 April 2025).
- Yan, M.; Yang, F.; Li, C.; Guo, D. Constructing a standard system of city sustainable development assessment technology based on the SDGs. Chin. J. Popul. Resour. Environ. 2024, 22, 275–290. [Google Scholar] [CrossRef]
- Yan, M.; Yang, F.; Pan, H.; Li, C. Research on the Response of Urban Sustainable Development Standards to the United Nations Sustainable Development Goals Based on Knowledge Graphs. Land 2024, 13, 1962. [Google Scholar] [CrossRef]
- United Nations. The SDGs and the UN Summit of the Future. Sustainable Development Report 2024—Includes the SDG Index and Dashboards. Available online: https://dashboards.sdgindex.org/ (accessed on 17 June 2024).
- United Nations Development Programme (UNDP). Human Development Index (HDI). Available online: https://hdr.undp.org/data-center/human-development-index#/indicies/HDI (accessed on 17 June 2024).
- Sustainable Development Solutions Network (SDSN) & Bertelsmann Stiftung. Introducing the SDG Index & Dashboards. 20 July 2016. Available online: https://www.sustainabledevelopment.report/news/introducing-the-sdg-index-and-dashboards/ (accessed on 17 June 2024).
- ISO/TS 37107:2019; Sustainable Cities and Communities—Maturity Model for Smart Sustainable Communities. International Organization for Standardization: Geneva, Switzerland, 2019.
- ISO 37153:2024; Smart Community Infrastructures—Maturity Model for Assessment and Improvement (Edition 2, 2024). International Organization for Standardization: Geneva, Switzerland, 2024.
- Institute of Finance and Economics Strategy, Chinese Academy of Social Sciences. The 18th Report on China’s Urban Competitiveness. 2020. Available online: https://www.toutiao.com/article/6886972306770362893/?upstream_biz=doubao&source=m_redirect (accessed on 27 April 2025).
- China Center for International Economic Exchanges, Earth Institute, Columbia University. Blue Book of China’s Sustainable Development Evaluation Report. 2024. Available online: http://www.cbcsd.org.cn/xws/xw/20241216/105085.shtml (accessed on 27 April 2025).
- ISO 37120:2018; Sustainable Cities and Communities-Indicators for City Services and Quality of Life. ISO: Geneva, Switzerland, 2018.
- ISO 37123:2019; Sustainable Cities and Communities-Indicators for Resilient Cities. ISO: Geneva, Switzerland, 2019.
- GB/T 39497-2020; New-Type Urbanization—Evaluation Index System of Quality City. Standardization Administration of the People’s Republic of China: Beijing, China, 2020.
- ISO 37122:2019; Sustainable Cities and Communities-Indicators for Smart Cities. ISO: Geneva, Switzerland, 2019.
- GB/T 40482-2021; Evaluation Indicators for Quality of City Development. Standardization Administration of the People’s Republic of China: Beijing, China, 2021.


| Evaluation System and Issuing Institution | EIU’s Global Livability Index [17] | Mercer’s Quality of Living City Ranking [18] | Monocle’s Liveable Cities Index [19] | Numbeo’s Quality of Life Index [20] |
|---|---|---|---|---|
| Indicators | 1. Stability 2. Healthcare 3. Culture and Environment 4. Education 5. Infrastructure | 1. Political and Social Environment 2. Medical Care and Health 3. Social and Cultural Environment 4. Schools and Education 5. Economic Environment 6. Public Services and Transportation 7. Entertainment 8. Consumer Goods 9. Housing 10. Natural Environment | 1. Safety/Crime 2. Healthcare 3. Climate/Light 4. International Connectivity 5. Public Transportation 6. Building Quality 7. Environmental Issues and Proximity to Nature 8. Urban Planning 9. Business Conditions 10. Proactive Policy Making 11. Inclusiveness | 1. Quality of life Index 2. Purchasing Power Index 3. Safety Index 4. Health Care Index 5. Cost of Living Index 6. Property Price Index 7. Traffic Index 8. Pollution Index 9. Climate Index |
| Limitations | It prioritizes macro-level city-wide general indicators, with limitations in accounting for city-specific characteristics and individual needs. | It overlooks emerging cities or those excelling in specific domains but with smaller scales. Additionally, divergent priorities for quality of life may lead to discrepancies between evaluation results and some residents’ actual experiences. | While its evaluation system is relatively comprehensive and unique, the large number of evaluation factors—some with strong subjectivity—makes results prone to subjectivity, leading to potential disagreements in assessing the same city. | Data sources include diverse channels like random user inputs, potentially affecting data accuracy and reliability. |
| Type | The Proposing Parties of the Typical Systems | Main Aspects of Livable Cities |
|---|---|---|
| Objective evaluation | Fortune magazine [21] | Financial status, housing, education, quality of life, cultural and entertainment facilities, climate and neighborhood relations. |
| Quality of Life Ranking of Metropolitan Areas in the United States [22] | Cultural atmosphere, housing, employment, crime, transportation, education, healthcare, entertainment facilities, climate | |
| International Organization for Standardization Technical Committee of Sustainable Cities and Communities (ISO/TC 268) [23] | Economy, education, energy, environment, finance, fire and emergency response, governance, health, leisure, safety, shelter, solid waste, communication and innovation, transportation, urban planning, wastewater, water and sanitation | |
| Subjective evaluation | World Values Survey [24] | Health, social interaction, life goals, wealth and economy, education |
| Gallup World Poll [25] | Population diversity, economic information index, food and shelter, job climate index, law and order, national institutions |
| Dimensions | Elements | Sub-Elements | Indicators |
|---|---|---|---|
| 1. Social Dimension (20 indicators) | (1) Livelihood Security (5 indicators) | Demographic Structure | Population Density |
| Incidence of Poverty | |||
| Life Expectancy | |||
| Employment Situation | Registered Unemployment Rate in Urban Areas | ||
| Social Insurance Coverage Rate | Coverage Rate of Minimum Living Security | ||
| (2) Human Settlement Environment (4 indicators) | Housing Security | Housing Unit-to-Household Ratio of Urban Households | |
| Community Environment | Percentage of Urban Population with Access to Electricity Service | ||
| Number of Natural Gas Service Connections per 1000 Population | |||
| Coverage Rate of 15-Minute Community Life Circle | |||
| (3) Health Care (11 indicators) | Medical Level | Maternal Mortality Rate | |
| Mortality Rate of Infants under 5 Years Old per 1000 Infants | |||
| Neonatal Mortality Rate | |||
| Incidence Rate of New AIDS Cases per 1000 Population | |||
| Incidence Rate of Tuberculosis per 100,000 Population | |||
| Incidence Rate of Hepatitis B per 100,000 Population | |||
| Number of Beds in Medical and Health Institutions per 1000 Population | |||
| Health-related Behaviors | Percentage of Healthcare Expenditure in the Per Capita Disposable Income of Urban Resident Households in the City | ||
| Smoking Rate of People Aged 15 and Above | |||
| Medical Coverage Rate | Number of Licensed (Assistant) Physicians per 1000 Population | ||
| Equality of Medical Rights | Vaccination Rate of Immunization Program Vaccines for School-Age Children | ||
| 2. Economic Dimension (11 indicators) | (1) Economic Performance (5 indicators) | Local Finance | Percentage of General Public Service Expenditure in Local Government Budget Expenditure |
| Percentage of Expenditure on Health in General Public Budget Expenditure | |||
| Percentage of Local Government Budget Revenue in Regional GDP | |||
| Economic Development Level | Per Capita Regional GDP | ||
| Labor Productivity | Overall Labor Productivity | ||
| (2) Economic Openness (4 indicators) | Business Environment | Percentage of Tax Revenue in Public Budget Revenue | |
| Direct Economic Losses Caused by Fires | |||
| Financial Investment and Support | Percentage of Social Security Budget Expenditure in Local Government Budget Expenditure | ||
| Percentage of Public Budget Expenditure on Agriculture, Forestry and Water in Total General Public Budget Expenditure | |||
| (3) Economic Sustainability (2 indicators) | Industrial Structure | Percentage of the Gross Output Value of the Secondary Industry in Regional GDP | |
| Technological Innovation Capability | Proportion of Expenditure on Scientific Research and Experimental Development (R&D) in GDP | ||
| 3. Environmental Dimension (13 indicators) | (1) Pollution (6 indicators) | Water Pollution | Water Supply Penetration Rate |
| Centralized Treatment Rate of Urban Sewage | |||
| Proportion of Surface Water Reaching or Better than Class III Water Bodies | |||
| Air Pollution | Reduction Rate of Carbon Dioxide Emission per Unit of GDP | ||
| Concentration of Fine Particulate Matter (PM2.5) | |||
| Per Capita Greenhouse Gas Emission | |||
| (2) Natural Resource Consumption (2 indicators) | / | Per Capita Total Water Consumption | |
| / | Proportion of Renewable Energy Consumption | ||
| (3) Natural Environment Quality (2 indicators) | / | Forest Coverage Rate | |
| / | Protection Rate of Natural Wetlands | ||
| (4) Environmental Protection Measures (3 indicators) | Sustainable Management | Green Coverage Rate in Built-up Areas | |
| Per Capita Green Space Area in Parks | |||
| Recycling and Utilization | Recycling Rate of Urban Solid Waste | ||
| 4. Cultural Dimension (9 indicators) | (1) Educational Resources (5 indicators) | Education Quality | Graduation Rate of Primary Education |
| Number of People with Junior College Education and Above per 100,000 Population | |||
| Educational Equality | Gross Enrollment Rate of Preschool Education | ||
| Enrollment Rate of Compulsory Education for Persons with Disabilities | |||
| Educational Investment | Teacher-Student Ratio in Primary Schools | ||
| (2) Cultural Resources (4 indicators) | / | Number of Scientific Researchers per 1,000,000 Population | |
| / | Number of Patented Inventions per 10,000 Population | ||
| / | Protection Rate of Historical and Cultural Blocks and Historical Buildings with Nameplates | ||
| / | Per Capita Area of Public Sports Land | ||
| 5. Governance Dimension (10 indicators) | (1) Government Efficiency (1 indicator) | / | Success Rate of Mediation of Social Conflicts and Disputes |
| (2) Government System (3 indicators) | Degree of Democracy | Voter Turnout Rate in Elections | |
| Justice and Equality | Proportion of Female Members in the Municipal People’s Congress (In the context of China) | ||
| Corruption Situation | Number of Arrests for Corruption and Bribery of Civil Servants per 100,000 Population | ||
| (3) Public Safety (6 indicators) | Natural Disasters | Average Annual Losses Caused by Disasters as a Proportion of GDP | |
| Accidents and Disasters | Number of Traffic Fatalities per 100,000 Population | ||
| Number of Fatalities in Work Safety Accidents per 100,000 Population | |||
| Number of Fatalities Caused by Fires per 100,000 Population | |||
| Food Security | Qualification Rate of Food Sampling Inspection | ||
| Public Order | Criminal Offense Rate per 10,000 People | ||
| 6. Infrastructure Dimension (8 indicators) | (1) Transportation (3 indicators) | / | Kilometers of Urban Roads per 100,000 Population |
| / | Total Annual Passenger Volume of Public Transit Buses (Including Electric Buses) | ||
| / | Coverage Rate of Bus Stops within 500 Meters | ||
| (2) Information and Communication (2 indicators) | / | Penetration Rate of Mobile Phones | |
| / | Proportion of Internet Broadband Access Subscribers | ||
| (3) Energy (1 indicator) | / | Number of Power Interruptions per Capita per Year | |
| (4) Water Supply (2 indicators) | / | Water Loss Rate | |
| / | Guarantee Rate of Drinking Water Safety |
| Indicator Type | Method for Setting Target Value/Worst Value | Example |
|---|---|---|
| Indicators with a Clear Standard Orientation in the SDGs | Use the Absolute Values of the SDGs | The target value of the incidence of poverty is 0, and the worst value is 100. |
| Indicators with Clear Requirements in Relevant Chinese Policy Documents | Use the Planned Values Stipulated in Policy Documents Such as the National/Local 14th Five-Year Plan, the Implementation of the 2030 SDGs, and the “Dual Carbon” Goals | Referring to the 14th Five-Year Plan for the Development of Human Resources and Social Security issued by the Ministry of Human Resources and Social Security, the target value of the urban registered unemployment rate is 5%. |
| Indicators without Clear Requirements in the SDGs but with a Recognized Ideal Value | Select the Recognized Ideal Value | The target value of the guarantee rate of drinking water safety is the recognized ideal value of 100. |
| Indicators without Clear Requirements in Both the SDGs and Chinese Policy Documents, and with High Data Availability in Sample Cities | Adopt the Average Values of the Data Corresponding to the 3 Cities/Provinces with the Best/Worst Performance of the Indicator in the Official Statistical Reports of the Sample Cities | The target value of the number of natural gas service connections per 1000 people is the average value of the 3 cities with the best performance, which is 6.17 million cubic meters per 10,000 people. |
| Other Indicators | Adopt the Technologically Optimal Value or the Technologically Worst Value | The technologically optimal value of the centralized treatment rate of urban sewage is 100%, and the technologically worst value is 70%. |
| City Type | Core Characteristics | Priority Orientation |
|---|---|---|
| Economically Lagging—Ecologically Superior | Outstanding ecological endowment, single—economic structure (e.g., Guiyang). | 1. Promote carbon sink trading and wellness industries while restricting high-energy-consuming projects. 2. Leverage ecological resources to build a distinctive eco-tourism brand. Develop high-end tourism products such as forest wellness and ecological research tours. Additionally, establish an eco-tourism service quality assessment system to boost the share of total tourism revenue in GDP. |
| Industrial Transformation | Decline of traditional industries, high environmental pressure (e.g., Shenyang). | 1. Establish an industrial heritage database, systematically inventory industrial heritage resources, and create industrial-themed cultural and tourism routes to increase the proportion of value-added of the cultural industry in GDP. 2. Strictly enforce environmental protection standards, strengthen the supervision of highly polluting enterprises, focus on monitoring the wastewater discharge per unit of industrial added value and the compliance rate of industrial waste gas emissions, and promote the construction of “waste-free cities”. |
| Emerging Growth | Rapid urbanization, great innovation potential (e.g., Chengdu). | Increase investment in scientific and technological innovation, set up special funds to support the development of start-ups and high-tech industries, and increase the “number of patented inventions per 10,000 population (SDG 9.5.2) to enhance the city’s innovation competitiveness. |
Disclaimer/Publisher’s Note: The statements, opinions and data contained in all publications are solely those of the individual author(s) and contributor(s) and not of MDPI and/or the editor(s). MDPI and/or the editor(s) disclaim responsibility for any injury to people or property resulting from any ideas, methods, instructions or products referred to in the content. |
© 2025 by the authors. Licensee MDPI, Basel, Switzerland. This article is an open access article distributed under the terms and conditions of the Creative Commons Attribution (CC BY) license (https://creativecommons.org/licenses/by/4.0/).
Share and Cite
Yan, M.; Yang, F.; Shi, J.; Li, C. Establishment of the Indicator System for Livable Cities Based on Sustainable Development Goals and Empirical Research in China. Land 2025, 14, 1264. https://doi.org/10.3390/land14061264
Yan M, Yang F, Shi J, Li C. Establishment of the Indicator System for Livable Cities Based on Sustainable Development Goals and Empirical Research in China. Land. 2025; 14(6):1264. https://doi.org/10.3390/land14061264
Chicago/Turabian StyleYan, Maomao, Feng Yang, Jiaqi Shi, and Chao Li. 2025. "Establishment of the Indicator System for Livable Cities Based on Sustainable Development Goals and Empirical Research in China" Land 14, no. 6: 1264. https://doi.org/10.3390/land14061264
APA StyleYan, M., Yang, F., Shi, J., & Li, C. (2025). Establishment of the Indicator System for Livable Cities Based on Sustainable Development Goals and Empirical Research in China. Land, 14(6), 1264. https://doi.org/10.3390/land14061264