Abstract
Against the backdrop of increasing urban population and continuous expansion of urban scales, achieving “people-centered” urban sustainable development, namely building livable and sustainable cities, faces formidable challenges. Under the shared global vision of achieving the 2030 Sustainable Development Goals (SDGs), existing research has rarely explored the alignment between the construction of livable cities and the SDGs. This study constructs a scientific and universally applicable evaluation system for urban livability to clarify that building livable cities is a crucial pathway to promoting urban sustainable development. This study integrates the core principles of the three pillars of the United Nations’ sustainable development, the five-dimensional classification logic of the Global Urban Monitoring Framework, and the performance evaluation key points of ISO/TC 268 standards for SC1 “smart community infrastructure” to construct a six-dimensional livable city evaluation system covering society, economy, culture, environment, governance, and infrastructure. Starting from theoretical research on the connotation of livable cities and their alignment with the SDGs, and based on the research team’s evaluation experience and assessment paradigm of SDGs progress at the urban level, this study uses the “Indicator Library for Cities’ Sustainable Development (ILCSD)” as a technical tool to explore the technical methods for establishing an evaluation index system for livable cities. Meanwhile, combining qualitative research and statistical analysis with China’s development strategic needs, it selects 24 sample cities to analyze the level differences among different types of cities under the proposed index system and to identify the key factors and mechanisms influencing the sustainable development of livable cities. Through theoretical research and empirical analysis, this study has derived a set of evaluation indicators for livable cities oriented towards the SDGs, offering urban management stakeholders a reasonable and comprehensive universal evaluation technical tool to enhance urban livability and promote the implementation of the SDGs.
1. Introduction
1.1. Research Background and Significance
As global urbanization accelerates, cities serve as hubs for human activities, economic growth, and social advancement. UN-Habitat forecasts that by 2050, around two-thirds of the world’s population will reside in urban areas [1]. Consequently, this large-scale urbanization strains limited resources and spaces, undermining cities’ capacity to offer quality services and living standards, and thus making “livability” a pressing concern [2,3].
In recent years, international initiatives, including the UN’s 2030 Agenda for Sustainable Development (SDGs) [4], the New Urban Agenda (NUA) [5], and international agreements such as the European City Initiative [6], have established unified goals to promote urban sustainability across economic, social, and environmental dimensions. The emphasis on improving urban quality of life in these initiatives underscores the importance of building livable cities as a cornerstone for urban sustainability.
The concept of livable cities emerged at the Second UN Conference on Human Settlements in 1996, defining cities as habitable human settlements [7]. Definitions vary among institutions based on spatiotemporal contexts and governance levels. The World Bank emphasizes slum services, environmental health, and financial support for enhancing livability [8]. The WHO’s Healthy City Movement outlines six key features: pleasant environment, social civilization, robust economy, abundant resources, convenient amenities, and public safety [9]. Academics focus on “safety”, “health”, “convenience”, “comfort”, “beauty”, and “justice”, recognizing livable cities as part of sustainable urban development [10,11].
To deepen the understanding of urban livability and facilitate its enhancement, global policymakers and researchers develop evaluation models and analyze influencing factors. Internationally recognized frameworks like the Mercer Index, EIU Global Livability Index, and Monocle Survey dominate assessments. Academic studies further explore specific impacts, such as weather, pollution, and environmental sustainability [12,13], or the needs of vulnerable groups like the elderly [14].
However, current livability assessments—across models and research—suffer from fragmented definitions, conflicting objectives, and a lack of integration between urban development components. The theoretical and empirical link between livability and sustainability remains underexplored [15], despite their shared alignment with the SDGs. While both pursue sustainable urban development, they diverge in conceptualization, temporal scales, and measurement. A unified framework is thus critical to address livability as part of sustainable urban characterization.
This study bridges this gap by anchoring livability in the SDGs’ three-tier monitoring framework. It decomposes the core dimensions of livable cities. Then, it maps them to original SDG indicators, and selects validated metrics from the Indicator Library for Cities’ Sustainable Development (ILCSD) [16]. The resulting indicator system advances two objectives:
- (1)
- Driving sustainable urban transformation: By embedding SDG targets into livability criteria, cities are guided to improve economic efficiency, resource management, environmental protection, and social equity.
- (2)
- Providing a global reference framework: Under the smart city and digital governance trends, cities worldwide can leverage this SDG-aligned framework to foster cross-regional collaboration and accelerate progress toward the 2030 Agenda.
1.2. Review of the Research on Urban Livability Evaluation
Due to the complexity of livability, urban livability evaluation has garnered significant attention. The Economist Intelligence Unit (EIU) has annually published the Global Livability Report since 2004, ranking 173 cities worldwide across five categories—stability, healthcare, culture and environment, education, and infrastructure—using 30 indicators [17].
Mercer Consulting, a leading provider of expatriate quality-of-life data, has released its Quality of Living City Ranking annually since 1998, focusing on housing and the economic environment as key livability factors for international talent [18]. Since 2006, Monocle magazine has listed 25 “most livable cities” each July, assessing both hard metrics (e.g., GDP, income) and intangible factors like resident experience and urban atmosphere [19]. Numbeo’s framework evaluates 234 cities using objective data on life quality, purchasing power, safety, healthcare, and climate, offering insights for residents and investors [20]. These four systems—summarized in Table 1—approach livability through distinct dimensions, priorities, and methodologies, each with unique focuses and limitations.

Table 1.
The main indicator systems of the evaluation of livable cities.
1.3. Comparative Analysis of Typical Evaluation Systems
1.3.1. Different Focuses of Evaluation Factors Under the Consistent Evaluation Criteria
Existing research highlights academic explorations into livable cities’ connotation, objectives, evaluation systems, and mechanisms. While studies differ in purposes and dimensions, their specific indicators often overlap significantly, with a broad consensus on criterion-level (second-level) metrics, as shown in Table 2.
Table 2.
Comparison of the evaluation systems of typical livable cities.
However, the field remains in an exploratory phase: definitions lack unity, evaluation frameworks are insufficient to capture livability’s full scope, and divergent stakeholder priorities lead to fragmented factor weighting, limiting single-system comprehensiveness. For example, Mercer’s focus on housing and economics underrepresents cultural and environmental factors. Despite these aspects’ importance to quality-of-life-focused residents, this approach disadvantages cities with strong non-economic performance but lagging growth, even though such dimensions are critical to residents prioritizing quality of life.
1.3.2. Lack of Unified Standards for Indicator Calculation and Measurement
Global livability evaluations lack a unified, cross-comparable framework due to divergent systems’ hierarchical mismatches and indicator granularity issues. Mixed quantitative–qualitative metrics complicate globally accepted calculation standards, causing inconsistent city rankings and undermining inter-city comparability. This hinders cities’ ability to assess competitiveness, identify gaps, and share best practices, impeding coordinated progress toward livability.
1.3.3. Absence of Research Aligning with SDGs
While the SDGs’ economic, social, and environmental framework aligns with livable cities’ goals, no existing evaluation system explicitly benchmarks against them. This disconnect prevents cities from integrating SDG principles into policies or assessing livability through a sustainable development lens. For instance, in SDG-correlated areas like climate action, inequality reduction, and social inclusion, current systems fail to comprehensively measure urban efforts, lacking guidance for these critical domains and restricting scientific development and international collaboration.
2. Materials and Methods
2.1. Study Area
Based on index data availability and quality, this study selects 24 Chinese cities as empirical samples (Figure 1), including the following:
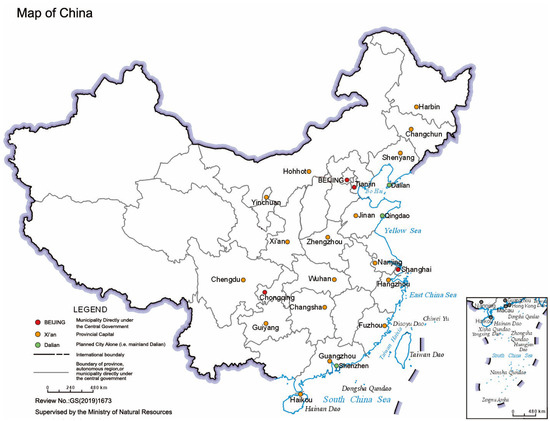
Figure 1.
Distribution map of 24 Chinese cities participating in the evaluation of livable cities.
- Four municipalities directly under the central government: Beijing, Shanghai, Tianjin, Chongqing;
- Seventeen provincial capital cities: Xi’an, Chengdu, Guangzhou, Shenyang, Hangzhou, Changsha, Jinan, Zhengzhou, Changchun, Wuhan, Guiyang, Harbin, Fuzhou, Haikou, Hohhot, Yinchuan;
- Three single-planned cities: Dalian, Qingdao and Shenzhen.
Distributed across China’s central, eastern, and western regions, these cities represent diverse geographical, economic, and cultural contexts. They account for over 20% of China’s population and 40% of its GDP, making them critical for studying national urban development patterns. Additionally, as core urban centers, their governments and statistical institutions maintain standardized data collection systems with advanced digital capabilities for population, economic, and environmental indicators.
2.2. Data Sources
The data used in this study are mainly derived from the open public statistical databases of national and city statistics departments, including paper statistical yearbooks (e.g., the 2023 China City Statistical Yearbook [26]), official bulletins (e.g., the 2023 China Urban Construction Status Bulletin [27]), and online statistical databases (e.g., local city statistics websites, statistical bulletins of national economic and social development, and special bulletins from relevant city departments).
Considering inaccurate data caused by the low acquisition rate of urban data or differences in statistical standards, this study employs alternative data to address the issue of missing data. Four methods are used to replace the missing data:
- Supplement missing data using news reports published by official media, combined with online research and other research data;
- Using provincial data as substitutes for cities with missing data;
- Using the average value of a specific indicator among all cities with available data to substitute for the missing data of a particular city;
- Using existing data from the preceding or subsequent year as proxy data if data for an indicator in 2023 are not available.
By referencing the UN SDSN’s Global National Sustainable Development Assessment Report, this study excludes sample cities with missing data exceeding 20% of total indicators from the evaluation to minimize bias.
2.3. Methods of the Indicator System Establishment for Livable Cities Based on SDGs
2.3.1. Evaluation Dimensions
Regarding the selection of livable city evaluation dimensions, researchers widely adopt a comprehensive perspective covering economic development, social progress, quality of life, infrastructure, and ecological environment. This study proposes a “5 + 1” framework for livable city evaluation dimensions, dividing urban systems into 6 sub-systems—society, economy, culture, environment, governance, and infrastructure—based on global scholars’ research on urban sustainability and China’s current urban development context.
Against the global sustainable development backdrop, the United Nations Human Settlements Programme (UN-Habitat) proposed the “Global Urban Monitoring Framework” (UMF) in 2022 [28], following the 2016 New Urban Agenda, to advance SDG implementation at the urban level. Guided by comprehensive, coordinated, and sustainable development principles, UMF covers 5 key areas—economy, society, culture, environment and governance—forming a globally applicable and recognized assessment system. This framework aligns closely with China’s “Five-Sphere Integrated Plan”, which has guided theoretical research and evaluation in urban construction, sustainable development, and high-quality growth since its introduction in 2012 [29]. As an internationally adopted monitoring framework, UMF integrates the global consensus and China’s urban development philosophy, thus inspiring the retention of these five dimensions in this study.
Additionally, ISO/TC 268 [23], the world’s leading standard-setting body for sustainable cities, emphasizes that urban infrastructure serves as the foundation for smart, resilient, livable, and green urban development. To operationalize this, its sub-committee ISO/TC 268/SC1 Smart community infrastructures [30] has developed international standards for infrastructure operation, maintenance, and performance evaluation in smart sustainable cities, covering transportation, energy, wastewater, and ICT. Therefore, to comprehensively evaluate livable city development, this study adds an infrastructure dimension to the first-level indicators, as illustrated in Figure 2.
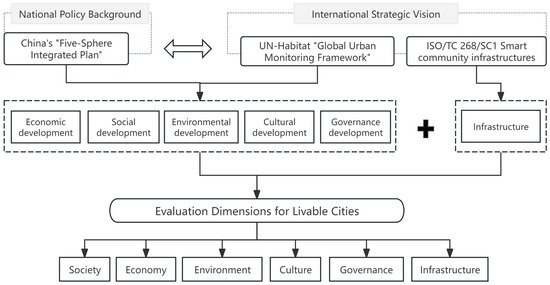
Figure 2.
Evaluation dimensions of the livable cities indicator system.
2.3.2. Evaluation Elements
First, drawing on the existing research in domestic and international academic circles and the best practices summarized in Chapter 1 of this study, this study forms a comprehensive understanding of the connotation and overall requirements of a livable city. Despite differences in how the connotation of a livable city is expressed at home and abroad, their essences are similar, and the positioning of a livable city also shows convergence. This study summarizes the overall understanding of the connotation of a livable city, that is, a livable city is a multi-dimensional city, a complex city that includes 6 dimensions of society, economy, environment, culture, governance, and infrastructure. It integrates a strong economic development level, a harmonious social and humanistic environment, a good ecological environment, sound infrastructure establishment, and efficient governance capabilities to jointly create a harmonious and livable city. At the same time, a livable city is a city for its residents, representing a psychological perception of urban development by the residents, which is closely related to the residents’ gender, age, marital status, educational background, income level, and length of residence, etc. Therefore, the evaluation of a livable city should be people-centered, focusing on the comfort, convenience, safety, and harmony of the city, with the aim of building sustainable cities and enhancing residents’ satisfaction with urban life.
In summary, this study proposes that “a livable city is a city that achieves balanced and high-quality development in aspects such as economic development, social harmony, pleasant environment, cultural prosperity, efficient governance and sound infrastructure, is able to provide high-quality life and good services for residents, and ensures the long-term sustainable development of the city.” The conceptual model for the establishment and evaluation of livable cities is shown in Figure 3.
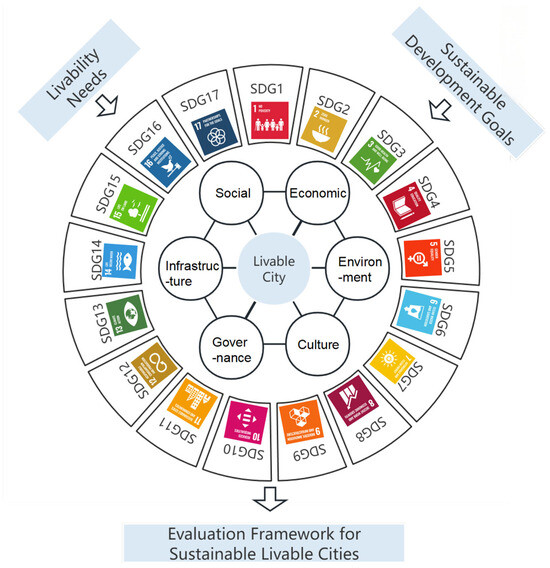
Figure 3.
A conceptual model for the establishment and evaluation of livable cities.
Secondly, the ultimate goal of a livable city is to promote the establishment of a “people-centered” sustainable city, and its key areas and evaluation elements should align with the objectives of implementing the SDGs at the urban level. The concept of livability originates from “sustainability.” To a large extent, they share similar definitions, goals, and implementation methods. However, sustainability is a long-term planning objective addressing global economic, ecological and equity issues, setting broad principles for human society. In contrast, livability focuses on creating a comfortable living space to meet the aspirations of community residents for a better life in the present.
On one hand, the evaluation elements of a livable city should be benchmarked against the SDGs and aligned with international common evaluation systems. On the other hand, the establishment of livable cities initiatives in different countries and regions must be contextualized within specific backgrounds, such as cultural values, knowledge systems, and policy priorities.
Therefore, the research team of this study carried out a hierarchical correlation mapping of the three-level system of the SDGs according to the connotation of a livable city and “tagged” the classification of the SDGs according to the first-level indicators (6 dimensions). The SDGs consist of 17 goals, 169 targets, and 231 specific indicators. Previously, some scholars divided the 17 SDGs into 3 aspects: economic, social and environmental. They believed that 4 goals mainly involve the economic aspect (SDG 8, 9, 10 and 12), 8 goals mainly involve the social aspect (SDG 1, 2, 3, 4, 5, 7, 11 and 16), 4 goals mainly involve the environmental aspect (SDG 6, 13, 14 and 15), and SDG 17 serves as the practical means and guarantee throughout the whole process.
Based on the theoretical connotation of a livable city and combined with the assessment requirements of each goal, target, and indicator of the SDGs, this study evaluated the relevance of each indicator to livability and classified and labeled them according to the 6 dimensions of a livable city. Using a content analysis approach, 181 original SDG indicators aligning with the livable city assessment dimensions were screened out. The results of the “tagging” are shown in Figure 4 below. The situations of responding to the SDGs are retained as shown in Table A1 in Appendix A.
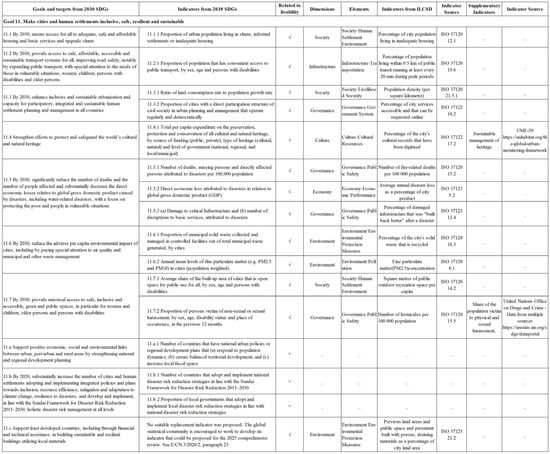
Figure 4.
Schematic diagram of using Excel to “Tag” the relevance and classification between livability indicators and the SDGs (Partial), taking SDG 11 as an example.
Based on the above fundamental work achievements of benchmarking mapping and “tagging”, this study has sorted out the connotative requirements and evaluation elements of livable cities from 6 dimensions. The correlation diagram of the elements (sub-elements) is shown in Figure 5.
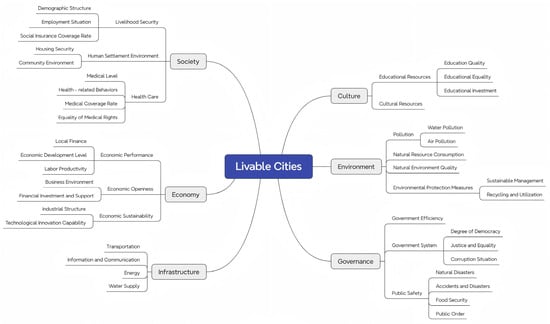
Figure 5.
Evaluation elements in each dimension of livable cities.
2.3.3. Evaluation Indicators
The above sections expound how this study, based on the theoretical connotation of livable cities and by analyzing the corresponding relationship between livable elements and SDGs, constructed a SDGs-based evaluation indicator system framework for livable cities. This framework comprises 19 elements across 6 dimensions—society, economy, environment, culture, governance, and infrastructure. Using the Indicator Library for Cities’ Sustainable Development (ILCSD), an independently developed technical tool [31], the research team preliminarily screened 110 ideal indicators for livable city evaluation. Through empirical research on 24 typical Chinese cities and based on China’s urbanization context and sample cities’ statistical data, 71 practical indicators for livable city evaluation were formed via a three-step process of elimination, replacement, and supplementation. The technical route is shown in Figure 6.
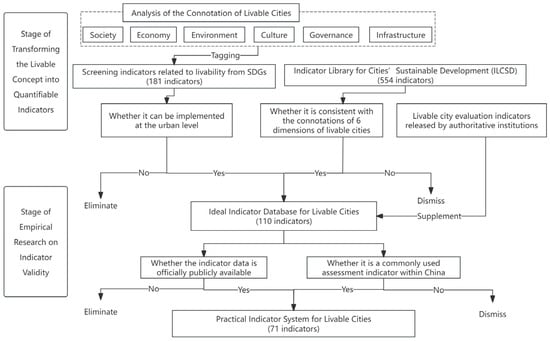
Figure 6.
Technical route of the establishment of livable city indicators’ database.
The research team of this study undertakes the mirror committee of ISO/TC 268, and focuses on organizing the research and development of evaluation standards for different characteristics of urban sustainability and its implementation paths. Aiming to promote the implementation of the SDGs at the urban level, by absorbing high-quality indicators from the ISO 3712x series of international urban evaluation standards and Chinese national standards, the “Indicator Library for Cities’ Sustainable Development (ILCSD)” that responds to the SDGs has been established, which serves as a general technical tool for comprehensive urban evaluation. It ensures that the evaluation system formed based on the indicators selected from the database is closely aligned with the SDGs, and the indicators mainly come from current domestic and international standards, having the basis for indicator universality and data verification [31]. In addition, by applying knowledge graph technology, a “Knowledge Graph of Technical Standards for Cities Sustainable Development” has been created, which further improves the intelligence, digitization, and visualization levels of indicator selection and data statistics when using the “ILCSD” [32]. The above achievements and tools have all played an important role and practical function in the process of selecting specific indicators for livable cities this time.
The first step is to select commonly used domestic and international indicators that have a high degree of relevance to the connotation of livable cities to form an ideal indicator database. From the 554 indicators included in the ILCSD (including the one-to-many relationship with the original SDG indicators), the indicators that are most closely responsive to the connotation of livable cities after being “tagged” are preferentially selected. If the existing indicators in the indicator database cannot be matched, indicators will be supplemented from the evaluation systems of livable cities issued by domestic and international authoritative institutions (simultaneously further dynamically updating the ILCSD). An ideal indicator system for the evaluation of livable cities that is highly associated with the SDGs has been preliminarily established, and 110 ideal indicators that meet both the requirements of the SDGs inspection and conform to the connotation of livability have been screened out.
The second step is to use Beijing as an empirical case to verify the data availability of the ideal indicators. The data sources include the Beijing Statistical Yearbook 2023, the Statistical Bulletin of Beijing’s National Economy, Society and Culture, and work reports of other government agencies. Through the first round of data verification, indicators that are difficult to implement at the urban level and have poor data availability are eliminated. Finally, 71 practical indicators are obtained, forming the evaluation indicator system of livable cities, as shown in Table 3.
Table 3.
The practical indicator system of livable cities.
2.3.4. Response Analysis of Livable Cities’ Indicator System to SDGs
The indicator system for the evaluation of livable cities established in this study is a three-level system composed of “evaluation dimensions-evaluation elements-evaluation indicators”. The specific indicators come from two sources. One is to directly retain the original indicators corresponding to the SDGs, and the other is to select general high-quality indicators from the ILCSD with standard sources. The evaluation content covers all 17 Goals. The sources of the indicators for livable cities and their response relationships with the SDGs are shown in Table A2 and Table A3 in Appendix B.
Indicator responses to each SDG vary, showing differing support intensity for SDG targets. Strongest alignment occurs with SDG 3, 11, and 9.
SDG 3 (Good Health and Well-being) has 15 indicator responses—the highest. Livable city metrics prioritize resident health, e.g., physicians per 1000 population and neonatal mortality rate. Quality healthcare directly impacts quality of life, aligning with livable cities’ focus on resident well-being.
SDG 11 (Sustainable Cities and Communities) follows with 12 responses, emphasizing urban environmental, resource, and infrastructure sustainability. Indicators like park green space per capita, 500 m bus stop coverage, and housing unit ratio reflect SDG 11’s focus on livable urban planning and public services.
SDG 9 (Industry, Innovation, and Infrastructure) has 9 responses, covering industrial development, innovation investment, and transport/ICT infrastructure. These drive economic vitality and daily convenience, critical for livability.
2.4. Evaluation and Analysis Method of Livable Cities
2.4.1. Determination of Indicator Thresholds
To exclude extreme values, defining data thresholds is critical for evaluation accuracy. For upper limits (target values), the “leave no one behind” principle of the 2030 Agenda guides the process, integrating global SDG evaluation practices and China’s urban realities.
For lower limits (worst values), sensitivity to outliers is addressed by excluding the poorest 2.5% of observations across cities, with the remaining minimum set as the threshold. Details are listed in Table 4.
Table 4.
Determination principles of indicator thresholds (target values and worst values).
2.4.2. Data Standardization
This study adopts the same indicator data standardization method as that used in previous United Nations Sustainable Development Annual Reports (for example, the title of the publicly released report in 2024 is SUSTAINABLE DEVELOPMENT REPORT 2024-Includes the SDG Index and Dashboards [33]). The details are as follows:
After establishing the upper and lower limits, the following formula is used to perform a linear transformation of the variables within the range of [0, 100]:
where is the original data value, and represent the target value and the worst value of the same indicator, respectively, and is the calculated standardized value. Through this calculation process, the indicator scores can be interpreted as the percentage of progress towards achieving the Sustainable Development Goals. The data of all indicators can be compared in ascending order, that is, a higher value means being closer to achieving the goal, and a score of 100 means that the target of the indicator has been achieved. Through standardization, comparisons can be made among all indicators. That is, a city with a score of 50 on a certain variable is halfway to achieving the best value of that indicator, and a city with a score of 75 has already passed three-quarters of the distance from the worst to the best. However, if the indicator uses the average value of the top 5 sample cities to determine a score of 100, then “a score of 100” only means that this threshold level of achievement can be reasonably expected in the context of China.
2.4.3. Weighting and Aggregation of Indicators
This study comprehensively compares the advantages and disadvantages of various methods for determining indicator weights. To avoid both artificial interference from subjective weighting methods and the impact of annual data fluctuations on indicator weights—thereby preserving the comparability of long-term continuous tracking evaluations—this study, after comprehensively balancing the objectivity and comparability of results, selects the equal weighting approach. This method is commonly used in authoritative evaluation systems, such as the Global Human Development Index (HDI) released by the United Nations Development Programme (UNDP) [34] and the Global Sustainable Development Goals (SDGs) Index and Dashboards by the Sustainable Development Solutions Network (SDSN) [35], to establish the indicator calculation model.
2.4.4. Maturity Model
This study adopts the percentile method to construct a maturity evaluation model. The percentile method is a statistical tool used to measure and compare the positions of various values in a dataset. In the evaluation of sustainable development performance, it is used to determine the benchmark value of a set of data. The standardized value of each actually observed indicator is compared with the benchmark value, so as to obtain the performance of the indicator relative to the benchmark value. If the standardized value is higher than the benchmark value, it indicates excellent performance in this indicator; if it is lower than the benchmark value, it indicates a deficiency.
Through the above methods, the performance of the livability maturity of each individual dimension is evaluated and analyzed, so as to understand the advantages and disadvantages of the city. Referring to ISO/TR 37107:2019 Sustainable cities and communities—maturity model for smart sustainable communities [36] and ISO 37153:2017 Smart community infrastructures—maturity model for assessment and improvement [37] regarding the hierarchical construction of the sustainable city maturity model, this study continues to use a five-level model, as shown in Figure 7 below.
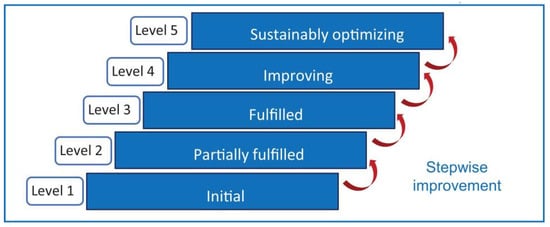
Figure 7.
The maturity model for smart sustainable communities proposed in ISO 37107 [36].
In the data preprocessing stage, indicator data across six dimensions were sorted and percentile values (e.g., P20, P40, P60, P80) were calculated. A globally recognized algorithm—(i = (k/100) × n, with interpolation or rounding based on whether i is an integer—was adopted to define 5 maturity levels (see Figure 7). The classification criteria are as follows:
- Level 1 (Initial): ≤P20, indicating an early development stage.
- Level 2 (Partially Implemented): >P20 and ≤P40, meaning needs are identified but incomplete.
- Level 3 (Achieved): >P40 and ≤P60, representing a moderate performance level.
- Level 4 (Upgrading): >P60 and ≤P80, signifying partial orientation toward future needs.
- Level 5 (Sustained Optimization): >P80, reflecting benchmark performance with continuous improvement via the PDCA cycle.
3. Results
3.1. Empirical Results of the Livability Evaluation of Chinese Cities
Among the 24 empirical cities, Beijing ranks first in the livability ranking, followed by Hangzhou and Nanjing in second and third place. Shenzhen and Jinan rank fourth and fifth (scores above 70), occupying the top 5 positions.
In contrast, Fuzhou, Yinchuan, Shenyang, and Zhengzhou rank in the bottom four, with scores below 63. Zhengzhou has the lowest score (below 60), indicating a pressing need for the city’s decision-makers to address livability challenges.
3.1.1. Consistency of the Index Ranking Results with Other Reports
In the 18th Report on China’s Urban Competitiveness [38], a multi-dimensional comparison of 291 Chinese cities in 2020 was conducted across dimensions such as urban scale, population size, economic level, public facilities, environmental quality, and cultural resources. Five cities—Beijing, Shenzhen, Hangzhou, Nanjing, and Jinan—ranked within the top 11. The report, which adopted a scientific indicator system and a reliable evaluation model to comprehensively assess cities across multiple dimensions, mutually corroborated the results of this evaluation. This further demonstrates that these cities have achieved remarkable results in economic, social, environmental, and cultural development, and the livability index in this study exhibits robust objectivity and credibility.
The Blue Book of China’s Sustainable Development Evaluation Report (2024) [39] shows that the 5 cities of Beijing, Hangzhou, Nanjing, Shenzhen, and Jinan have demonstrated outstanding comprehensive capabilities in sustainable development and all rank among the top 10 in the comprehensive ranking of urban sustainable development. From the perspective of sustainable development, this also provides strong support for the livability of these cities, indicating that these cities have paid attention to the coordinated development of the economy, society, and environment during the long-term development process, possess good development potential and stability, and further enhance the credibility of the results of this study.
3.1.2. Analysis of the Advantages and Disadvantages of Top and Bottom Ranking Cities
- Cities with a Relatively High Livability Index Ranking
As the capital city, Beijing is an important political and cultural center. It has a developed economy and is home to a large number of high-quality employment and educational resources.
Hangzhou not only boasts natural landscapes like the West Lake but also has the advantage of modern development. Its digital economy is outstanding, and urban planning emphasizes the balance between ecology and construction.
Nanjing has a profound historical and cultural heritage. Its universities have strong scientific research capabilities, and innovation—driven industrial development has achieved remarkable results.
As an emerging city, Shenzhen has witnessed rapid economic development. The city is highly modernized in construction, and enterprises represented by Huawei and Tencent are outstanding in innovation capabilities.
Jinan actively promotes the transformation of old and new kinetic energy. With its unique “Spring City” culture, it continuously improves infrastructure.
- 2.
- Cities with a Relatively low Livability Index Ranking
In Fuzhou, traditional industries account for a large proportion, and the development of emerging industries lags behind, and there are deficiencies in urban environmental governance.
Yinchuan is located in the northwest inland. It suffers from water shortages, has a single—structured industry, and lacks competitive infrastructure compared with top-ranking cities.
As an old industrial base, Shenyang faces difficulties in industrial transformation, lacks impetus for economic growth, has prominent air pollution problems, and suffers from severe brain drain.
Zhengzhou faces problems such as traffic congestion, environmental pollution, and unbalanced allocation of public service resources during its rapid development, which restricts the improvement of its livability.
- 3.
- Comprehensive Comparison
Overall, top-ranking cities such as Beijing, Hangzhou, and Nanjing have balanced and excellent development in multiple dimensions including the economy, society, environment and culture, with strong comprehensive livability. They achieve coordinated development through the rational integration of resources. Their scientific and forward-looking policy planning has attracted a large number of talents and enterprises, forming a virtuous cycle and driving the sustainable development of the city. However, bottom-ranking cities such as Yinchuan, Shenyang, and Zhengzhou have limited comprehensive livability due to obvious weaknesses in some dimensions. These cities need to take urgent measures in economic structure transformation, environmental governance, cultural innovation, and infrastructure upgrading.
Regarding economic structure transformation, efforts should be increased to cultivate and support emerging industries and reduce dependence on traditional industries. In environmental governance, it is necessary to strengthen pollution prevention and control and increase investment in ecological restoration. In terms of cultural innovation, it is important to explore the unique culture of the city and enhance cultural soft power. For infrastructure upgrading, attention should be paid to the optimal allocation and balanced development of public service resources such as transportation, education, and medical care. Through precise policies, making up for weaknesses, and strengthening coordination, these cities are expected to enhance their livability competitiveness, improve residents’ well-being, and gradually narrow the gap with top-ranking cities.
3.1.3. Maturity Levels of Livable Cities
To better evaluate the development of livability construction in each city, this study divides the cities into five levels based on the standard deviation of the livability scores, and divides the 24 participating cities into five corresponding groups, as shown in Figure 8.
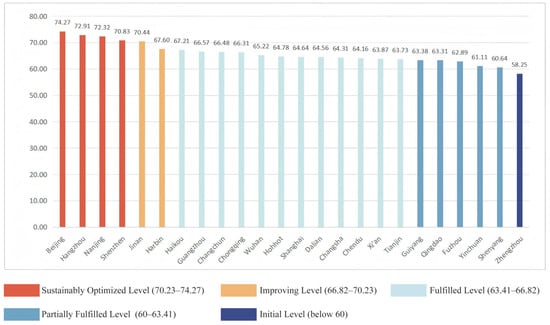
Figure 8.
Livability evaluation results of 24 cities and groupings by maturity level.
- Initial Level (Score: below 60)
The city at this level is Zhengzhou (Score: 58.25), which indicates that Zhengzhou has a relatively low average score in the 6 dimensions and is in the initial stage of livability construction and development. There may be significant room for improvement in all aspects. For example, the urban infrastructures may not be perfect enough, the level of social and economic development is relatively low, and environmental governance also needs to be strengthened.
- 2.
- Partially Fulfilled Level (Score: 60–63.41)
This level includes Shenyang (Score: 60.64), Yinchuan (Score: 61.11), Fuzhou (Score: 62.89), Qingdao (Score: 63.31), and Guiyang (Score: 63.38). These cities have a certain foundation on average in the six dimensions, but their overall performance is not very stable. They may have made some progress in certain aspects, but they still need to consolidate their achievements, and there may be deficiencies in other aspects. For example, some parts of the urban infrastructure may have reached the standard, but there is still room for improvement in the consistency of social services or the stability of environmental quality.
- 3.
- Fulfilled Level (Score: 63.41–66.82)
This level includes Tianjin (Score: 63.73), Xi’an (Score: 63.87), Chengdu (Score: 64.16), Changsha (Score: 64.31), Dalian (Score: 64.56), Shanghai (Score: 64.64), Hohhot (Score: 64.78), Wuhan (Score: 65.22), Chongqing (Score: 66.31), Changchun (Score: 66.48), and Guangzhou (Score: 66.57). These cities have a relatively clear direction and strategy in comprehensive development, and show a certain degree of regularity and systematicness on average in the six dimensions. For example, they have a relatively clear train of thought in urban governance and certain methods in the coordination of infrastructure construction and social and economic development. However, compared with higher-level cities, there may still be gaps in aspects such as refined management or resource utilization efficiency.
- 4.
- Improving Level (Score: 66.82–70.23)
This level includes two cities, Haikou (Score: 67.21) and Harbin (Score: 67.60). This indicates that the cities are at a relatively high level on average in the 6 dimensions. In the process of urban development, they may already have relatively mature models in infrastructure, economic development, social governance, etc., and are able to effectively manage and operate these aspects. However, there may still be a need for further improvement in the development of innovative culture or in dealing with new governance challenges.
- 5.
- Sustainably Optimized Level (Score: 70.23–74.27)
This level includes Jinan (Score: 70.44), Shenzhen (Score: 70.83), Nanjing (Score: 72.32), Hangzhou (Score: 72.91), and Beijing (Score: 74.27). Cities at this level have very high average scores in the 6 dimensions. They are relatively balanced and excellent in all aspects of urban development. Whether it is economic growth, social harmony, environmental protection, or infrastructure improvement, they all have outstanding performances. Moreover, they can continuously optimize their own development models to adapt to new development needs and play a demonstrative and leading role.
3.2. Analysis of Urban Livability Under Different Dimensions
Figure 9a–f present the livability rankings and scores of 24 Chinese cities across six dimensions: society, economy, environment, culture, governance, and infrastructure.
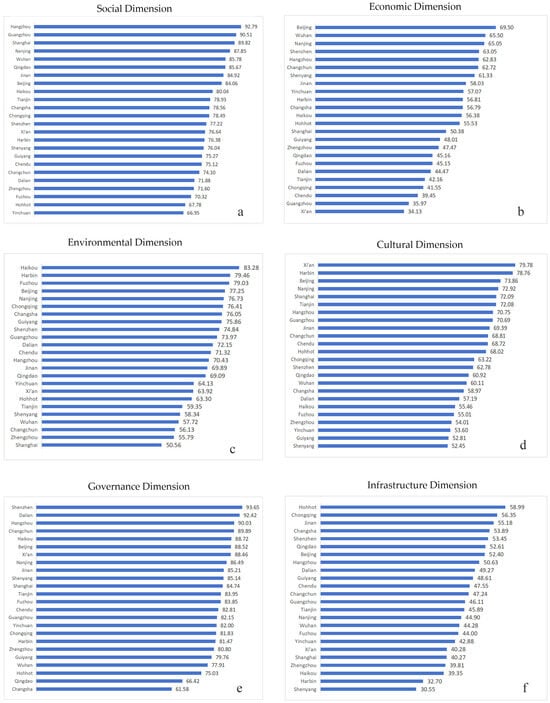
Figure 9.
(a–f). Livability index ranking of 24 Chinese cities across 6 dimensions (including Social, Economic, Environmental, Cultural, Governance and Infrastructure).
Social dimension: The average value is 74.27. Guangzhou (Score: 90.51), Shanghai (Score: 89.82), and Nanjing (Score: 87.85) are in the leading position, reflecting the concentration of high-quality resources such as employment, education, and medical care, as well as efficient services, a sound social security system, and harmonious social relations. Cities like Shenyang (Score: 76.04) and Zhengzhou (Score: 71.60) are behind. This may be due to employment fluctuations caused by industrial upgrading, uneven public services, and an unbalanced population structure, leaving room for improvement in social vitality and security.
Economic dimension: The average value is 64.64. Hangzhou (Score: 62.83), Shenzhen (Score: 63.05), and Nanjing (Score: 65.05) are relatively strong, with industrial innovation and upgrading, abundant market vitality, and diversified and substantial incomes. Xi’an (Score: 34.13) and Chengdu (Score: 39.45) have lower scores. Difficulties in industrial transformation, lagging emerging industries, and insufficient enterprise innovation have limited economic impetus and residents’ incomes, weakening the foundation of livability.
Environmental dimension: The average value is 64.16. Haikou (Score: 83.28), Harbin (Score: 79.46), and Fuzhou (Score: 79.03) stand out, with excellent natural endowments, effective ecological protection, efficient pollution prevention and control, beautiful urban greening, and a pleasant environment. Shanghai (Score: 50.56) and Shenyang (Score: 58.34) are behind. Problems such as environmental pollution and ecological damage during the process of industrialization and urbanization remain to be solved, and the pressure of resources and energy endangers the health and well-being of residents.
Cultural dimension: The average value is 63.31. Xi’an (Score: 79.78), Beijing (Score: 73.86), and Hangzhou (Score: 70.75) are in the leading position, with a profound historical heritage, complete cultural facilities, a prosperous cultural industry, colorful cultural activities, and outstanding inheritance and innovation. Shenyang (Score: 52.45) and Guiyang (Score: 52.81) are behind. There is insufficient exploration and utilization of cultural resources, obsolete and scarce facilities, poor scale efficiency of the industry, and a need to cultivate cultural vitality and a sense of identity.
Governance dimension: The average value is 66.31. Hangzhou (Score: 90.03), Beijing (Score: 88.52), and Shenzhen (Score: 93.65) are at the forefront, with efficient and transparent government affairs, a sound and fair legal system, excellent emergency management, active community governance, positive residents’ participation, and stable public security. Changsha (Score: 61.58) and Yinchuan (Score: 82.00) are behind. Lagging governance concepts, insufficient mechanism coordination, slow digital transformation, prominent emergency response weaknesses, and a need to improve residents’ sense of gain.
Infrastructure dimension: The average value is 61.11. Hangzhou (Score: 50.63), Shenzhen (Score: 53.45), and Nanjing (Score: 44.90) perform better, with convenient and smooth transportation, stable water and electricity supply, advanced communication networks, and complete municipal facilities. Shenyang (Score: 30.55) and Yinchuan (Score: 42.88) are relatively weak. Aging and disrepair of infrastructure, traffic congestion, fluctuations in the guarantee of public utilities, and a lagging layout of new infrastructure restrict urban operation and the quality of life.
3.3. Transmission Mechanism of External Factors on Urban Livability
Against the backdrop of globalization, urban livability is increasingly influenced by external factors, primarily transmitted through three pathways:
- (1)
- Economic Transmission Effect
Export-oriented cities like Shenzhen see their “overal labor productivity” (SDG 8.2.1) highly dependent on the international trade environment. In 2023, supply chain fluctuations caused a short-term 1.2% increase in unemployment in the electronics manufacturing industry. However, regional industrial coordination—such as introducing new energy industries via the Shenzhen-Zhongshan Industrial Corridor—boosted the “share of renewable energy consumption” (SDG 7.2.1) by 7%, offsetting economic risks.
- (2)
- Resource Flow Effect
A northern city relying on the Yellow River’s water resources saw its “per capita total water consumption” (SDG 6.4.2) exceed the warning threshold due to upstream ecological degradation, forcing it to reduce its “water loss rate” (SDG 6.4.1) control target from 12% to 8%. Shenzhen achieved a 4.5% improvement in the “reduction rate of CO₂ emissions per unit of GDP” (SDG 9.4.1) through green power transmission in the Guangdong-Hong Kong-Macao Greater Bay Area. However, if cross-city water source coordination mechanisms fail, the “guarantee rate of drinking water safety” (SDG 6.1.1) could drop by 15–20%.
- (3)
- Policy Synergy Effect
The talent integration policy in the Beijing–Tianjin–Hebei region increased Beijing’s “number of people with junior college education and above per 100,000 population” (SDG 4.3.1) by 9%, but its “housing unit-to-household ratio of urban households” (SDG 11.1.1) fell to 0.98, approaching the international warning line of 1.0, requiring cross-regional coordination of affordable housing to mitigate.
- (4)
- Typical Case
Guiyang, an economically lagging but ecologically superior city, has a “forest coverage rate” (SDG 15.1.1) of 55%, but its “share of online retail sales” (SDG 9.b.1) is only one-third that of developed cities. It needs to transform ecological products into economic benefits through the construction of regional e-commerce platforms.
3.4. Differentiated Targeted Strategies by City Type
Existing policy recommendations need further refinement to adapt to urban heterogeneity. According to economic density, ecological index, and infrastructure level, the sample cities are divided into four types (see Table 5), with targeted strategies formulated as follows:
Table 5.
City classification and targeted policies by heterogeneity.
4. Discussion
4.1. Comprehensive Coverage of the Indicator System and Alignment with SDGs
In the research process of this study, the proposed indicator system for livable cities has the remarkable characteristic of comprehensively covering the 17 goals of the Sustainable Development Goals (SDGs). Previous evaluation systems often have many limitations. For example, in terms of evaluation dimensions, they may place too much emphasis on certain specific aspects and are unable to comprehensively and systematically consider the comprehensive development of a city. However, the evaluation system of this study has successfully broken through these limitations. Through careful design and comprehensive consideration, it can evenly align with all aspects of urban sustainable development. Whether it is the dimensions of society, economy, environment, culture, governance, or infrastructure, etc., they can all be fully and reasonably reflected, ensuring the comprehensiveness and scientific nature of the evaluation of urban livability.
4.2. Versatility of Research Methods and Tool Innovation
The research method adopted in this study, which is based on the SDGs and uses the “Indicator Library for Cities’ Sustainable Development (ILCSD)” as a common tool, demonstrates remarkable feasibility and practicality. The research method is not only applicable to the construction of the evaluation system for livable cities but also has strong applicability in refining the evaluation of other different urban characteristics. Through in-depth exploration of the SDGs and the effective application of the “ILCSD” tool, the characteristics of cities in different aspects can be systematically and methodically quantified and analyzed, providing accurate and valuable data support and decision-making basis for urban planning, construction, and development. It fully proves that this research method has broad application prospects for the evaluation of different implementation paths and characteristic features of urban sustainable development (such as smart cities, resilient cities, green cities, humanistic cities, innovative cities, etc.).
4.3. Strategies for Data Consistency Optimization
During the empirical research process, in response to the problem of inconsistent indicator calculation methods and calibers in the nationally statistically published data, this study has conducted in-depth analysis and put forward targeted improvement suggestions. Due to possible differences in data collection and statistical methods in different regions, when conducting national data comparison and analysis, problems such as data mismatch and incomparability are likely to occur. By thoroughly analyzing the root causes of these problems, this study has proposed a series of improvement suggestions, such as unifying calculation methods and standardizing data calibers, aiming to improve the consistency and comparability of national statistical data, to make the research and decision-making based on these data more accurate and reliable.
4.4. Collaborative Advancement of National Standards
Based on the in-depth research of this study, the relevant work of the national standard under research, “Sustainable Cities and Communities—General Requirements for Livable Cities” (Project Plan No: 20230669-T-469), has been simultaneously promoted. Through systematic sorting and refinement, the achievements of this study can be solidified into general standards. The formation of this standard will help Chinese cities further align with international standards in terms of livability evaluation, enabling Chinese cities to better showcase their development levels and characteristics in the global urban system. At the same time, it can also incorporate international advanced experience, continuously improve the sustainable development capabilities and livability levels of Chinese cities, and promote the development of Chinese cities in a more scientific, harmonious, and livable direction.
4.5. Research Limitations and Future Prospects
This study explores the evaluation system and differentiated policies for livable cities, providing a systematic analytical framework for urban sustainable development. Based on existing research, there is still room for further optimization:
- (1)
- Expansion of Sample and Data Scope
This study selects 24 municipally administered cities, provincial capitals, and planned single-list cities with regional representativeness, achieving good coverage in terms of geographical distribution, urban scale, and economic development level. However, to more comprehensively reflect the diversity of urban development in China, future research could include county-level cities, border cities, and resource-exhausted cities to further improve the sample system. In terms of data, while the current study relies on annual statistical yearbooks to ensure data authority and stability, with the acceleration of urban digitization, real-time big data such as traffic flow and social media public opinion could be supplemented in the future to enhance the timeliness of evaluations and dynamic monitoring capabilities.
- (2)
- Deepening of Model and Analysis
In the analysis of the impact mechanisms of external factors on urban livability, this study has preliminarily constructed three pathways: economic transmission, resource flow, and policy coordination. However, it has not yet quantitatively simulated external shocks such as international trade fluctuations and regional policy adjustments through dynamic econometric models. Future research could integrate cutting-edge methods such as system dynamics and machine learning to build more refined analytical models, enhance the study’s predictive capabilities for urban development trends, and provide stronger support for risk early warning.
- (3)
- Practical Implementation of Policy Recommendations
The differentiated policy recommendations proposed for different urban types have provided theoretical guidance for urban development. However, at the policy implementation level, future research could further combine local fiscal conditions, resource endowments, and execution capabilities to carry out cost–benefit analyses and pilot validations. Through practical feedback from typical cities, policy recommendations can be continuously optimized to promote the efficient transformation of theoretical achievements into practical applications.
Future research will continue to advance in these directions, deepening explorations in expanding sample coverage, enriching data dimensions, optimizing analytical models, and strengthening policy practice, so as to further improve the evaluation system and development strategies for livable cities and provide more universal and practical theoretical and empirical references for global urban sustainable development.
5. Conclusions
This study developed an urban assessment framework that integrates ISO TC/268 international standards and the SDGs. The framework covers six dimensions, including society, economy, culture, environment, governance, and infrastructure, to comprehensively evaluate urban livability within the context of global sustainable development visions.
The research employed a systematic methodology combining literature review, Delphi expert consultation, inductive–deductive analysis, and localized empirical analysis. First, a three-level evaluation system was established by mapping SDG-related original indicators to the six dimensions of livable cities and selecting consistent general indicators from the indicator library for cities sustainable development (ILCSD). Secondly, based on the verification of data availability from the official statistical yearbooks published by the statistical departments of 36 Chinese cities, 110 ideal indicators were extracted and reduced to 71 through practical discussion. Finally, data from 24 cities with complete datasets were standardized using methods consistent with the UN Sustainable Development Report, adopted equal-weight assignment to avoid subjective bias, and constructed a five-level maturity model via percentile ranking (referencing ISO/TC 268 standards) to present performance evaluations for each city across different metrics.
The results show the following:
- The livable city indicator system fully covers all 17 SDGs, providing a comprehensive and balanced evaluation of sustainable pathways for livable cities.
- The methodology, leveraging the self-developed “ILCSD” and knowledge graph technology, demonstrates high efficiency and reusable generality in assessing diverse urban characteristics (e.g., livable cities as a representative theme).
- Threshold setting and index standardization methods consistent with global sustainability monitoring improve data consistency and cross-city comparability, “bottom-up” supporting progress monitoring for 2030 SDGs alignment at the urban, regional, national, and transnational levels.
- As pre-research and standard synchronization verification, the findings technically support the development of Chinese national standard for livable cities, facilitating alignment with international standards.
- The maturity model developed in this study has been successfully applied to evaluate livability in Chinese cities, providing clear guidance for continuous improvement in the PDCA (Plan–Do–Check–Act) full life cycle of urban assessment.
The technical methods, evaluation results, and derivative standards proposed in this study, when applied to typical cities, demonstrate that the assessment framework and indicator system are essential for local governments to manage cities in line with SDGs, enabling evidence-based decision-making, resource allocation, and performance monitoring across multiple urban dimensions.
For future work, we aim to engage wide scale users, such as other countries to gain broader empirical experience and incorporate feedback from global users. This will not only further validate the framework’s universality but also expand its practical functions and application scenarios. Through international expansion aspect, the goal is to refine the framework into a more robust and adaptable tool for global urban sustainability initiatives, effectively enhancing cities’ sustainable characteristics (e.g., livability, resilience, and smartness).
Author Contributions
Conceptualization, M.Y. and F.Y.; methodology, M.Y. and F.Y.; data curation, J.S.; validation, M.Y. and J.S.; formal analysis, M.Y. and C.L.; investigation, C.L.; resources, J.S. and C.L.; writing—original draft preparation, M.Y. and J.S.; writing—review and editing, M.Y.; visualization, J.S.; supervision, M.Y.; project administration, M.Y.; funding acquisition, M.Y. All authors have read and agreed to the published version of the manuscript.
Funding
This research was funded by the Basic Research Expenses Project, “Evaluation method and empirical research of comprehensive index of urban development based on SDGs” (grant number 512024Y-11445), and “Research on the standard system for cities’ high-quality and sustainable development by SAC/TC 567 )” (grant number 512025Y-12524).
Data Availability Statement
The original data of 24 empirical cities presented in the study are publicly available in the City Statistical Yearbooks from the official websites of cities’ Municipal Bureaus of Statistics. The details are as follows: 1. Beijing, Official Website of Beijing Municipal Bureau of Statistics: https://tjj.beijing.gov.cn/ (accessed on 1 November 2024), Public Access URL of the 2023 City Statistical Yearbook: https://nj.tjj.beijing.gov.cn/nj/main/2023-tjnj/zk/indexch.htm (accessed on 1 November 2024); 2. Changchun, Official Website of Changchun Municipal Bureau of Statistics: http://tjj.changchun.gov.cn/ (accessed on 1 November 2024), Public Access URL of the 2023 City Statistical Yearbook: http://tjj.changchun.gov.cn/ztlm/tjnj/202404/t20240424_3302053.html (accessed on 1 November 2024); 3. Changsha, Official Website of Changsha Municipal Bureau of Statistics: http://tjj.changsha.gov.cn/ (accessed on 1 November 2024), Public Access URL of the 2023 City Statistical Yearbook: http://tjj.changsha.gov.cn/tjxx/tjsj/tjnj/ (accessed on 1 November 2024); 4. Chengdu, Official Website of Chengdu Municipal Bureau of Statistics: https://cdstats.chengdu.gov.cn/ (accessed on 1 November 2024), Public Access URL of the 2023 City Statistical Yearbook: https://cdstats.chengdu.gov.cn/cdstjj/c155010/2023-12/29/content_d2483a7e5a7244e4be2b7886e0563edc.shtml (accessed on 1 November 2024); 5. Chongqing, Official Website of Chongqing Municipal Bureau of Statistics: http://tjj.cq.gov.cn/wap.html (accessed on 1 November 2024), Public Access URL of the 2023 City Statistical Yearbook: https://tjj.cq.gov.cn/zwgk_233/tjnj/2023/2023cqtjnj.pdf (accessed on 1 November 2024); 6. Dalian, Official Website of Dalian Municipal Bureau of Statistics: https://stats.dl.gov.cn/ (accessed on 1 November 2024), Public Access URL of the 2023 City Statistical Yearbook: https://stats.dl.gov.cn/col/col3811/ (accessed on 1 November 2024); 7. Fuzhou, Official Website of Fuzhou Municipal Bureau of Statistics: http://www.fuzhou.gov.cn/zgfzzt/tjnj/?eqid=a6a63413003320da000000036430bd28 (accessed on 1 November 2024), Public Access URL of the 2023 City Statistical Yearbook: https://www.fuzhou.gov.cn/book/fztjnj/2023tjnj/indexch.htm (accessed on 1 November 2024); 8. Guangzhou, Official Website of Guangzhou Municipal Bureau of Statistics: http://tjj.gz.gov.cn/ (accessed on 1 November 2024), Public Access URL of the 2023 City Statistical Yearbook: http://tjj.gz.gov.cn/stats_newtjyw/zyxz/tjnjdzzz/content/mpost_9343663.html (accessed on 1 November 2024); 9. Guiyang, Official Website of Guiyang Municipal Bureau of Statistics: http://tjj.guiyang.gov.cn/ (accessed on 1 November 2024), Public Access URL of the 2023 City Statistical Yearbook: http://tjj.guiyang.gov.cn/2020_zwgk/2020_zdlygk/2020_sjfb/ydndsj/202312/t20231229_83423200.html (accessed on 1 November 2024); 10. Haikou, Official Website of Haikou Municipal Bureau of Statistics: http://www.haikou.gov.cn/ (accessed on 1 November 2024), Public Access URL of the 2023 City Statistical Yearbook: http://www.haikou.gov.cn/sq/hknj/hknj2023/202405/P020240514636350713210.pdf (accessed on 1 November 2024); 11. Harbin, Official Website of Harbin Municipal Bureau of Statistics: https://www.harbin.gov.cn/haerbin/index.shtml (accessed on 1 November 2024), Public Access URL of the 2023 City Statistical Yearbook: https://www.harbin.gov.cn/haerbin/c104570/navlist.shtml (accessed on 1 November 2024); 12. Hangzhou, Official Website of Hangzhou Municipal Bureau of Statistics: http://tjj.hangzhou.gov.cn/ (accessed on 1 November 2024), Public Access URL of the 2023 City Statistical Yearbook: http://tjj.hangzhou.gov.cn/art/2023/12/4/art_1229453592_4222689.html (accessed on 1 November 2024); 13. Hohhot, Official Website of Hohhot Municipal Bureau of Statistics: http://www.huhhot.gov.cn/ (accessed on 1 November 2024), Public Access URL of the 2023 City Statistical Yearbook: http://tjj.huhhot.gov.cn/nj/2023nj/zk/indexch.htm (accessed on 1 November 2024); 14. Jinan, Official Website of Jinan Municipal Bureau of Statistics: http://jntj.jinan.gov.cn/ (accessed on 1 November 2024), Public Access URL of the 2023 City Statistical Yearbook: http://jntj.jinan.gov.cn/module/download/downfile.jsp?classid=0&showname=%E6%B5%8E%E5%8D%97%E7%BB%9F%E8%AE%A1%E5%B9%B4%E9%89%B4%202023%20-%20%E5%8A%A0%E6%B0%B4%E5%8D%B0.pdf&filename=751f648c40b944a185c29319462e9d30.pdf (accessed on 1 November 2024); 15. Nanjing, Official Website of Nanjing Municipal Bureau of Statistics: http://tjj.nanjing.gov.cn/ (accessed on 1 November 2024), Public Access URL of the 2023 City Statistical Yearbook: http://tjj.nanjing.gov.cn/material/njnj_2023/ (accessed on 1 November 2024); 16. Qingdao, Official Website of Qingdao Municipal Bureau of Statistics: http://qdtj.qingdao.gov.cn/ (accessed on 1 November 2024), Public Access URL of the 2023 City Statistical Yearbook: http://qdtj.qingdao.gov.cn/tongjisj/tjsj_tjnj/tjnj_2023/202310/t20231026_7560532.shtml (accessed on 1 November 2024); 17. Shenyang, Official Website of Shenyang Municipal Bureau of Statistics: https://www.shenyang.gov.cn/ (accessed on 1 November 2024), Public Access URL of the 2023 City Statistical Yearbook: https://www.shenyang.gov.cn/zwgk/fdzdgknr/tjxx/tjnj/202312/t20231225_4579201.html (accessed on 1 November 2024); 18. Shenzhen, Official Website of Shenzhen Municipal Bureau of Statistics: http://tjj.sz.gov.cn/zwgk/zfxxgkml/tjsj/tjnj/ (accessed on 1 November 2024), Public Access URL of the 2023 City Statistical Yearbook: https://tjj.sz.gov.cn/zwgk/zfxxgkml/tjsj/tjnj/content/post_11182604.html (accessed on 1 November 2024); 19. Tianjin, Official Website of Tianjin Municipal Bureau of Statistics: https://stats.tj.gov.cn/tjsj_52032/tjnj/ (accessed on 1 November 2024), Public Access URL of the 2023 City Statistical Yearbook: https://stats.tj.gov.cn/nianjian/2023nj/zk/indexch.htm (accessed on 1 November 2024); 20. Wuhan, Official Website of Wuhan Municipal Bureau of Statistics: https://tjj.wuhan.gov.cn/tjfw/tjnj/202312/t20231204_2312633.shtml (accessed on 1 November 2024), Public Access URL of the 2023 City Statistical Yearbook: https://tjj.wuhan.gov.cn/tjfw/tjnj/202312/P020240228613247234803.pdf (accessed on 1 November 2024); 21. Xi’an, Official Website of Xi’an Municipal Bureau of Statistics: http://tjj.xa.gov.cn/tjsj/1.html (accessed on 1 November 2024), Public Access URL of the 2023 City Statistical Yearbook: http://tjj.xa.gov.cn/tjnj/2023/zk/indexch.htm (accessed on 1 November 2024); 22. Yinchuan, Official Website of Yinchuan Municipal Bureau of Statistics: https://tjj.yinchuan.gov.cn/ (accessed on 1 November 2024), Public Access URL of the 2023 City Statistical Yearbook: https://tjj.yinchuan.gov.cn/tjsj/ndsj/202401/P020240131343532184571.pdf (accessed on 1 November 2024); 23. Shanghai, Official Website of Shanghai Municipal Bureau of Statistics: https://tjj.sh.gov.cn/sjfb/index.html (accessed on 1 November 2024), Public Access URL of the 2023 City Statistical Yearbook: https://tjj.sh.gov.cn/tjnj/20240321/5a35a44acace471f87c75393133fa142.html (accessed on 1 November 2024); 24. Zhengzhou, Official Website of Zhengzhou Municipal Bureau of Statistics: https://tjj.zhengzhou.gov.cn/ (accessed on 1 November 2024), Public Access URL of the 2023 City Statistical Yearbook: https://tjj.zhengzhou.gov.cn/u/cms/tjj/statistical_2023/index.htm (accessed on 1 November 2024).
Conflicts of Interest
The authors declare no conflicts of interest.
Appendix A
Table A1 below presents the mapping relationship between cities’ livability and the SDGs, providing an overview of their interconnections.
Table A1.
Mapping relationship between cities’ livability and the SDGs.
Table A1.
Mapping relationship between cities’ livability and the SDGs.
| SDGs | Number of SDGs Indicators by “Tagging” | SDGs Indicators |
|---|---|---|
| SDG 1 No Poverty | 11 | 1.1.1;1.2.1;1.2.2;1.3.1;1.4.1;1.4.2;1.5.1;1.5.2;1.5.4;1.a.2;1.b.1 |
| SDG 2 Zero Hunger | 13 | 2.1.1;2.1.2;2.2.1;2.2.2;2.2.3;2.3.1;2.3.2;2.4.1;2.5.1;2.5.2;2.a.1;2.a.2;2.c.1 |
| SDG 3 Good Health and Well-being | 27 | 3.1.1;3.1.2;3.2.1;3.2.2;3.3.1;3.3.2;3.3.3;3.3.4;3.4.1;3.4.2;3.5.1;3.5.2;3.6.1;3.7.1;3.7.2;3.8.1;3.8.2;3.9.1;3.9.2;3.9.3;3.a.1;3.b.1;3.b.2;3.b.3;3.c.1;3.d.1;3.d.2 |
| SDG 4 Quality Education | 12 | 4.1.1;4.1.2;4.2.1;4.2.2;4.3.1;4.4.1;4.5.1;4.6.1;4.7.1;4.a.1;4.b.1;4.c.1 |
| SDG 5 Gender Equality | 6 | 5.2.1;5.2.2;5.5.1;5.5.2;5.6.1;5.b.1 |
| SDG 6 Clean Water and Sanitation | 11 | 6.1.1;6.2.1;6.3.1;6.3.2;6.4.1;6.4.2;6.5.1;6.5.2;6.6.1;6.a.1;6.b.1 |
| SDG 7 Affordable and Clean Energy | 5 | 7.1.1;7.1.2;7.2.1;7.3.1;7.b.1 |
| SDG 8 Decent Work and Economic Growth | 10 | 8.1.1;8.2.1;8.3.1;8.4.1;8.4.2;8.5.1;8.5.2;8.6.1;8.8.1;8.9.1 |
| SDG 9 Industry, Innovation and Infrastructure | 12 | 9.1.1;9.1.2;9.2.1;9.2.2;9.3.1;9.3.2;9.4.1;9.5.1;9.5.2;9.a.1;9.b.1;9.c.1 |
| SDG 10 Reduced Inequalities | 7 | 10.1.1;10.2.1;10.4.1;10.5.1;10.7.1;10.a.1;10.b.1 |
| SDG 11 Sustainable Cities and Communities | 13 | 11.1.1;11.2.1;11.3.1;11.3.2;11.4.1;11.5.1;11.5.2;11.5.3;11.6.1;11.6.2;11.7.1;11.7.2;11.c |
| SDG 12 Responsible Consumption and Production | 7 | 12.2.1;12.2.2;12.3.1;12.4.2;12.5.1;12.a.1;12.c.1 |
| SDG 13 Climate Action | 3 | 13.1.1;13.1.3;13.2.2 |
| SDG 14 Life Below Water | 7 | 14.1.1;14.2.1;14.3.1;14.4.1;14.5.1;14.6.1;14.a.1 |
| SDG 15 Life on Land | 13 | 15.1.1;15.1.2;15.2.1;15.3.1;15.4.1;15.4.2;15.5.1;15.6.1;15.7.1;15.8.1;15.9.1;15.a.1,15.b.1 |
| SDG 16 Peace, Justice and Strong Institutions | 18 | 16.1.1;16.1.2;16.1.3;16.1.4;16.2.1;16.2.2;16.2.3;16.3.1;16.3.2;16.3.3;16.5.1;16.5.2;16.6.2;16.7.1;16.7.2;16.9.1;16.10.1;16.10.2 |
| SDG 17 Partnerships for the Goals | 6 | 17.1.1;17.1.2;17.3.2;17.4.1;17.6.1;17.8.1 |
| Total | 181 | - |
Appendix B
Table A2 illustrates the practical operation indicators for livable city evaluation, their sources, and the mapping relationship with the original SDG indicators, while Table A3 presents statistics on how these practical operation indicators respond to different SDGs.
Table A2.
Practical operation indicators of livable city evaluation and their mapping relationship with the original indicators of SDGs.
Table A2.
Practical operation indicators of livable city evaluation and their mapping relationship with the original indicators of SDGs.
| Responses to the SDGs | Indicators from SDGs | Indicators of the Livable City Evaluation | Source | Remark |
|---|---|---|---|---|
| SDG 1 No Poverty | 1.1.1 | Incidence of Poverty | ISO 37120 13.3 [40] | / |
| 1.3.1 | Coverage Rate of Minimum Living Security | ISO 37123 13.2 [41] | One indicator is associated with two SDGs, and the other SDG is SDG 10. | |
| 1.4.2 | Housing Unit-to-Household Ratio of Urban Households | GB/T 39497-2020 [42] | One indicator is associated with two SDGs, and the other SDG is SDG 11. | |
| 1.a.2 | Percentage of General Public Service Expenditure in Local Government Budget Expenditure | ISO 37122 13.1 [43] | / | |
| 1.5.1 | Average Annual Losses Caused by Disasters as a Proportion of GDP | ISO 37123 13.5 [41] | One indicator is associated with three SDGs, and the other two are SDG 11 and SDG 13. | |
| 1.4.1 | Coverage Rate of 15-Minute Community Life Circle | ISO 37120 21.4 [40]; GB/T 39497-2020 9.5 [42] | / | |
| 1.b.1 | Percentage of Social Security Budget Expenditure in Local Government Budget Expenditure | SDGs | / | |
| SDG 2 Zero Hunger | 2.a.2 | Percentage of Public Budget Expenditure on Agriculture, Forestry and Water in Total General Public Budget Expenditure | ISO 37122 20.1 [43] | / |
| 2.4.1 | Qualification Rate of Food Sampling Inspection | ISO 37120 20.1 [40] | / | |
| SDG 3 Good Health and Well-being | SDG 3 | Life Expectancy | ISO 37120 11.1 [40] | / |
| 3.2.1 | Mortality Rate of Infants under 5 Years Old per 1000 Infants | ISO 37120 11.4 [40] | / | |
| 3.2.2 | Neonatal Mortality Rate | SDGs | / | |
| 3.3.1 | Incidence Rate of New AIDS Cases per 1000 Population | SDGs | / | |
| 3.3.2 | Incidence Rate of Tuberculosis per 100,000 Population | SDGs | / | |
| 3.3.4 | Incidence Rate of Hepatitis B per 100,000 Population | SDGs | / | |
| 3.8.1 | Number of Beds in Medical and Health Institutions per 1000 Population | ISO 37120 11.2 [40] | / | |
| 3.8.2 | Percentage of Healthcare Expenditure in the Per Capita Disposable Income of Urban Resident Households in the City | SDGs | / | |
| 3.a.1 | Smoking Rate of People Aged 15 and Above | SDGs | / | |
| 3.c.1 | Number of Licensed (Assistant) Physicians per 1000 Population | ISO 37120 11.3 [40] | / | |
| 3.b.1 | Vaccination Rate of Immunization Program Vaccines for School-Age Children | ISO 37123 11.3 [41] | / | |
| 3.b.2 | Percentage of Expenditure on Health in General Public Budget Expenditure | SDGs | / | |
| 3.6.1 | Number of Traffic Fatalities per 100,000 Population | ISO 37120 19.5 [40] | / | |
| 3.1.1 | Maternal Mortality Rate | SDGs | / | |
| SDG 4 Quality Education | 4.1.2 | Graduation Rate of Primary Education | ISO 37120 6.2 [40] | / |
| 4.3.1 | Number of People with Junior College Education and Above per 100,000 Population | ISO 37120 6.6 [40] | / | |
| 4.2.2 | Gross Enrollment Rate of Preschool Education | SDGs | / | |
| 4.5.1 | Enrollment Rate of Compulsory Education for Persons with Disabilities | ISO 37120 6.1 [40] | / | |
| 4.c.1 | Teacher-Student Ratio in Primary Schools | ISO 37120 6.4 [40] | / | |
| SDG 5 Gender Equality | 5.5.1 | Proportion of Female Members in the Municipal People’s Congress (In the context of China) | ISO 37120 10.1 [40] | / |
| 5.b.1 | Penetration Rate of Mobile Phones | GB/T 40947-2021 F2-S6-T26 [42] | / | |
| SDG 6 Clean Water and Sanitation | 6.3.2 | Proportion of Surface Water Reaching or Better than Class III Water Bodies | GB/T 40482-2021 6.3 [44]; GB/T 39497-2020 7.5 [42] | One indicator is associated with two SDGs, and the other SDG is SDG 14. |
| 6.6.1 | Protection Rate of Natural Wetlands | GB/T 39497-2020 7.3 [42] | / | |
| 6.4.1 | Water Loss Rate | ISO 37120 23.7 [40] | / | |
| 6.1.1 | Guarantee Rate of Drinking Water Safety | IS0 37120 23.1 [40] | / | |
| 6.3.1 | Centralized Treatment Rate of Urban Sewage | ISO 37120 22.2 [40]; GB/T 39497-2020 7.11 [42] | / | |
| 6.4.2 | Per Capita Total Water Consumption | ISO 37120 23.5 [40] | / | |
| SDG 7 Affordable and Clean Energy | 7.1.1 | Percentage of Urban Population with Access to Electricity Service | ISO 37120 7.3 [40] | / |
| 7.2.1 | Proportion of Renewable Energy Consumption | ISO 37120 7.2 [40] | One indicator is associated with two SDGs, and the other SDG is SDG 12. | |
| 7.1.2 | Number of Natural Gas Service Connections per 1000 Population | ISO 37120 7.4 [40] | / | |
| SDG 8 Decent Work and Economic Growth | 8.5.2 | Registered Unemployment Rate in Urban Areas | ISO 37120 5.1 [40] | / |
| 8.2.1 | Overall Labor Productivity | GB/T 40482-2021 5.2 [44] | One indicator is associated with two SDGs, and the other SDG is SDG 10 | |
| 8.8.1 | Number of Fatalities in Work Safety Accidents per 100,000 Population | ISO 37120 15.9 [40] | / | |
| 8.1.1 | Per Capita Regional GDP | GB/T 40482-2021 5.1 [44] | / | |
| SDG 9 Industry, Innovation and Infrastructure | 9.3.2 | Water Supply Penetration Rate | ISO 37120 21.2 [40] | / |
| 9.4.1 | Reduction Rate of Carbon Dioxide Emission per Unit of GDP | GB/T 40482-2021 6.5 [44] | / | |
| 9.5.2 | Number of Scientific Researchers per 1,000,000 Population | ISO 37120 6.6 [40] | / | |
| SDG 9 | Number of Patented Inventions per 10,000 Population | ISO 37120 5.6 [40] | / | |
| 9.1.1 | Kilometers of Urban Roads per 100,000 Population | ISO 37120 19.1 [40] | / | |
| 9.c.1 | Proportion of Internet Broadband Access Subscribers | ISO 37120 18.1 [40] | One indicator is associated with two SDGs, and the other SDG is SDG17. | |
| 9.1.2 | Total Annual Passenger Volume of Public Transit Buses (Including Electric Buses) | SDGs | / | |
| 9.5.1 | Proportion of Expenditure on Scientific Research and Experimental Development (R&D) in GDP | GB/T 39497-2020 5.12 [42] | / | |
| 9.2.1 | Percentage of the Gross Output Value of the Secondary Industry in Regional GDP | SDGs | / | |
| SDG 10 Reduced Inequalities | 10.2.1 | Coverage Rate of Minimum Living Security | ISO 37123 13.2 [41] | / |
| 10.4.1 | Overall Labor Productivity | GB/T 40482-2021 5.2 [44] | / | |
| SDG 11 Sustainable Cities and Communities | 11.3.1 | Population Density | ISO 37120 21.5 [40] | / |
| 11.6.2 | Concentration of Fine Particulate Matter (PM2.5) | ISO 37120 8.1 [40] | / | |
| 11.7.1 | Per Capita Green Space Area in Parks (Per Capita Green Space Area in Parks per 100,000 Population) | ISO 37120 14.2 [40] | / | |
| 11.6.1 | Recycling Rate of Urban Solid Waste | ISO 37120 16.3 [40] | One indicator is associated with two SDGs, and the other SDG is SDG 12. | |
| 11.5.2 | Average Annual Losses Caused by Disasters as a Proportion of GDP | ISO 37123 13.5 [41] | / | |
| 11.5.1 | Number of Fatalities Caused by Fires per 100,000 Population | ISO 37120 15.2 [40] | / | |
| 11.7.2 | Criminal Offense Rate per 10,000 People | SDGs | / | |
| 11.2.1 | Coverage Rate of Bus Stops within 500 m | ISO 37120 19.6 [40] | / | |
| 11.7.1 | Per Capita Area of Public Sports Land | ISO 37120 14.2 [40] | / | |
| 11.1.1 | Housing Unit-to-Household Ratio of Urban Households | GB/T 39497-2020 [42] | / | |
| 11.5.3 | Direct Economic Losses Caused by Fires | ISO 37120 12.4 [40] | / | |
| SDG 12 Responsible Consumption and Production | 12.a.1 | Proportion of Renewable Energy Consumption | ISO 37120 7.2 [40] | / |
| 12.5.1 | Recycling Rate of Urban Solid Waste | ISO 37120 16.3 [40] | / | |
| SDG 13 Climate Action | 13.2.2 | Per Capita Greenhouse Gas Emission | ISO 37120 8.3 [40] | / |
| 13.1.1 | Average Annual Losses Caused by Disasters as a Proportion of GDP | ISO 37123 13.5 [41] | / | |
| SDG 14 Life Below Water | 14.1.1 | Proportion of Surface Water Reaching or Better than Class III Water Bodies | GB/T 40482-2021 6.3 [44]; GB/T 39497-2020 7.5 [42] | / |
| SDG 15 Life on Land | 15.1.1 | Forest Coverage Rate | GB/T 40482-2021 6.11 [44] | / |
| 15.4.2 | Green Coverage Rate in Built-up Areas | SDGs | / | |
| SDG 16 Peace, Justice and Strong Institutions | 16.3.3 | Success Rate of Mediation of Social Conflicts and Disputes | GB/T 39497-2020 8.8 [42] | / |
| 16.7.2 | Voter Turnout Rate in Elections | ISO 37120 10.4 [40] | / | |
| 16.5.2 | Number of Arrests for Corruption and Bribery of Civil Servants per 100,000 Population | ISO 37120 10.2 [40] | / | |
| SDG 17 Partnerships for the Goals | 17.1.1 | Percentage of Local Government Budget Revenue in Regional GDP | SDGs | / |
| 17.6.1 | Proportion of Internet Broadband Access Subscribers | ISO 37120 18.1 [40] | / | |
| 17.8.1 | Proportion of Internet Broadband Access Subscribers | ISO 37120 18.1 [40] | / | |
| 17.1.2 | Percentage of Tax Revenue in Public Budget Revenue | ISO 37120 9.4 [40] | / |
Table A3.
Statistics on the response frequencies of practical operation indicators for livable cities to different SDGs.
Table A3.
Statistics on the response frequencies of practical operation indicators for livable cities to different SDGs.
| SDGs | Times of Indicator Responses (Including the Cases of One To-Many) |
|---|---|
| SDG3 | 15 |
| SDG11 | 12 |
| SDG9 | 9 |
| SDG1 | 7 |
| SDG6 | 6 |
| SDG4 | 5 |
| SDG8 | 4 |
| SDG17 | 4 |
| SDG10 | 2 |
| SDG7 | 3 |
| SDG16 | 3 |
| SDG2 | 2 |
| SDG12 | 2 |
| SDG13 | 2 |
| SDG15 | 2 |
| SDG5 | 2 |
| SDG14 | 1 |
| Total | 81 |
References
- United Nations Human Settlements Programme. World Cities Report 2020 Value of Sustainable Urbanization; United Nations: New York, NY, USA, 2020. [Google Scholar] [CrossRef]
- Kovacs-Györi, A.; Ristea, A.; Havas, C.; Mehaffy, M.; Hochmair, H.H.; Resch, B.; Juhasz, L.; Lehner, A.; Ramasubramanian, L.; Blaschke, T. Opportunities and challenges of geospatial analysis for promoting urban livability in the era of big data and machine learning. ISPRS Int. J. Geo-Inf. 2020, 9, 752. [Google Scholar] [CrossRef]
- Sheikh, W.T.; van Ameijde, J. Promoting livability through urban planning: A comprehensive framework based on the “theory of human needs”. Cities 2022, 131, 103972. [Google Scholar] [CrossRef]
- United Nations General Assembly. Transforming our World: The 2030 Agenda for Sustainable Development. 2015. Available online: https://sustainabledevelopment.un.org/post2015/transformingourworld/publication (accessed on 1 October 2024).
- United Nations General Assembly. Habitat III New Urban Agenda: Quito Declaration on Sustainable Cities and Human Settlements for All; United Nations General Assembly: Quito, Ecuador, 2016. [Google Scholar]
- European Commission. Report from the Commission to the Council on the Urban Agenda for the EU; Theme: Urban Development; European Commission: Brussels, Belgium, 2017. [Google Scholar]
- United Nations. United Nations Conference on Human Settlements: Habitat II. 1996. Available online: https://www.un.org/en/conferences/habitat/istanbul1996 (accessed on 27 December 2024).
- World Bank Group. Livability and Sustainability of Cities. Available online: https://www.worldbank.org/en/cpf/india/what-we-work/resource-efficient-growth/livability-sustainability-cities (accessed on 27 December 2024).
- World Health Organization. Promoting Health Through Good Governance: WHO Manifesto: Build Healthy, Liveable Cities. Available online: https://www.who.int/activities/promoting-health-through-good-governance/who-manifesto-build-healthy-liveable-cities (accessed on 27 April 2025).
- Ahmed, N.O.; El-Halafawy, A.M.; Amin, A.M. A Critical Review of Urban Livability. Eur. J. Sustain. Dev. 2019, 8, 165–182. [Google Scholar] [CrossRef]
- Ruth, M.; Franklin, R.S. Livability for all? Conceptual limits and practical implications. Appl. Geogr. 2014, 49, 18–23. [Google Scholar] [CrossRef] [PubMed]
- Capol, L.; Keshav, S.; Nagy, Z. Activity hours: Assessing liveability during heatwaves. Build. Environ. 2025, 269, 112339. [Google Scholar] [CrossRef]
- Manning, W.J. Urban environment: Recognizing that pollution and social factors can create barriers to development of more healthy and liveable cities. Environ. Pollut. 2013, 183, 1. [Google Scholar] [CrossRef] [PubMed]
- Foglia, C.; Parisi, M.L.; Pontarollo, N. A senior liveability index for European cities. Reg. Sci. Policy Pract. 2023, 15, 769–794. [Google Scholar] [CrossRef]
- Antolín-López, R.; Martínez-Bravo, M.D.M.; Ramírez-Franco, J.A. How to make our cities more livable? Longitudinal interactions among urban sustainability, business regulatory quality, and city livability. Cities 2024, 154, 105358. [Google Scholar] [CrossRef]
- Yan, M.; Yang, F.; Liu, L.; Guo, D.; Li, C. Construction of an indicator library for cities’ sustainable development. Chin. J. Popul. Resour. Environ. 2024, 22, 469–480. [Google Scholar] [CrossRef]
- Economist Intelligence Unit (EIU). The Global Liveability Index 2024. Available online: https://www.eiu.com/n/webinars/global-liveability-index-2024/ (accessed on 15 October 2024).
- Okulicz-Kozaryn, A. City Life: Rankings (Livability) Versus Perceptions (Satisfaction). Soc. Indic. Res. 2013, 110, 433–451. [Google Scholar] [CrossRef]
- Monocle. Monocle’s Quality of Life Survey 2024: The 20 Best Places to Live. 13 June 2024. Available online: https://monocle.com/affairs/urbanism/quality-of-life-survey-2024/ (accessed on 15 October 2024).
- Numbeo. Current Quality of Life Index. Available online: https://www.numbeo.com/quality-of-life/rankings_current.jsp (accessed on 15 October 2024).
- Lodewick, C. 2022 Global Most Livable Cities List Released: Europe and Canada Are Big Winners. Fortune China. 2 July 2022. Available online: https://www.fortunechina.com/shangye/c/2022-07/02/content_414561.htm (accessed on 15 October 2024).
- Fernandez, C. These Are the 10 U.S. Cities with the Best Quality of Life—None Are in Florida; CNBC: Englewood Cliffs, NJ, USA, 2024. [Google Scholar]
- ISO/TC 268; The Technical Committee of Sustainable Cities and Communities. International Organization for Standardization: Geneva, Switzerland, 2012. Available online: https://www.iso.org/committee/656906.html (accessed on 27 April 2025).
- World Values Survey. Available online: https://www.worldvaluesurvey.org/wvs.jsp (accessed on 27 April 2025).
- Gallup. Comprehensive Global Research That Drives Strategic Leadership. Gallup World Poll and Global Survey Research-Gallup. Available online: https://www.gallup.com/analytics/318875/global-research.aspx (accessed on 27 April 2025).
- National Bureau of Statistics of China (NBSC). China City Statistical Yearbook; China Statistics Press: Beijing, China, 2023.
- Ministry of Housing and Urban-Rural Development of the People’s Republic of China. China Urban Construction Status Bulletin; China Statistics Press: Beijing, China, 2023.
- UN—Habitat. The Global Urban Monitoring Framework. Available online: https://unhabitat.org/the-global-urban-monitoring-framework (accessed on 17 June 2024).
- Chen, J.B. The “Five-in-One” Overall Layout; People’s Daily Press: Beijing, China, 2020. [Google Scholar]
- ISO/TC 268/SC1; The Sub—Committee of ISO/TC 268, Smart Community Infrastructures. International Organization for Standardization: Geneva, Switzerland, 2012. Available online: https://www.iso.org/committee/656967.html (accessed on 27 April 2025).
- Yan, M.; Yang, F.; Li, C.; Guo, D. Constructing a standard system of city sustainable development assessment technology based on the SDGs. Chin. J. Popul. Resour. Environ. 2024, 22, 275–290. [Google Scholar] [CrossRef]
- Yan, M.; Yang, F.; Pan, H.; Li, C. Research on the Response of Urban Sustainable Development Standards to the United Nations Sustainable Development Goals Based on Knowledge Graphs. Land 2024, 13, 1962. [Google Scholar] [CrossRef]
- United Nations. The SDGs and the UN Summit of the Future. Sustainable Development Report 2024—Includes the SDG Index and Dashboards. Available online: https://dashboards.sdgindex.org/ (accessed on 17 June 2024).
- United Nations Development Programme (UNDP). Human Development Index (HDI). Available online: https://hdr.undp.org/data-center/human-development-index#/indicies/HDI (accessed on 17 June 2024).
- Sustainable Development Solutions Network (SDSN) & Bertelsmann Stiftung. Introducing the SDG Index & Dashboards. 20 July 2016. Available online: https://www.sustainabledevelopment.report/news/introducing-the-sdg-index-and-dashboards/ (accessed on 17 June 2024).
- ISO/TS 37107:2019; Sustainable Cities and Communities—Maturity Model for Smart Sustainable Communities. International Organization for Standardization: Geneva, Switzerland, 2019.
- ISO 37153:2024; Smart Community Infrastructures—Maturity Model for Assessment and Improvement (Edition 2, 2024). International Organization for Standardization: Geneva, Switzerland, 2024.
- Institute of Finance and Economics Strategy, Chinese Academy of Social Sciences. The 18th Report on China’s Urban Competitiveness. 2020. Available online: https://www.toutiao.com/article/6886972306770362893/?upstream_biz=doubao&source=m_redirect (accessed on 27 April 2025).
- China Center for International Economic Exchanges, Earth Institute, Columbia University. Blue Book of China’s Sustainable Development Evaluation Report. 2024. Available online: http://www.cbcsd.org.cn/xws/xw/20241216/105085.shtml (accessed on 27 April 2025).
- ISO 37120:2018; Sustainable Cities and Communities-Indicators for City Services and Quality of Life. ISO: Geneva, Switzerland, 2018.
- ISO 37123:2019; Sustainable Cities and Communities-Indicators for Resilient Cities. ISO: Geneva, Switzerland, 2019.
- GB/T 39497-2020; New-Type Urbanization—Evaluation Index System of Quality City. Standardization Administration of the People’s Republic of China: Beijing, China, 2020.
- ISO 37122:2019; Sustainable Cities and Communities-Indicators for Smart Cities. ISO: Geneva, Switzerland, 2019.
- GB/T 40482-2021; Evaluation Indicators for Quality of City Development. Standardization Administration of the People’s Republic of China: Beijing, China, 2021.
Disclaimer/Publisher’s Note: The statements, opinions and data contained in all publications are solely those of the individual author(s) and contributor(s) and not of MDPI and/or the editor(s). MDPI and/or the editor(s) disclaim responsibility for any injury to people or property resulting from any ideas, methods, instructions or products referred to in the content. |
© 2025 by the authors. Licensee MDPI, Basel, Switzerland. This article is an open access article distributed under the terms and conditions of the Creative Commons Attribution (CC BY) license (https://creativecommons.org/licenses/by/4.0/).