Article

Tracking the Construction Land Expansion and Its Dynamics of Ho Chi Minh City Metropolitan Area in Vietnam

1
School of Geography and Planning, China Regional Coordinated Development and Rural Construction Institute, Sun Yat-sen University, Guangzhou 510275, China
2
Institute of Area Studies, Sun Yat-sen University, Zhuhai 519082, China
3
Institute of Geographic Sciences and Natural Resources Research, Chinese Academy of Sciences, Beijing 100101, China
4
College of Resources and Environment, University of Chinese Academy of Sciences, Beijing 100049, China
*
Author to whom correspondence should be addressed.
Land 2025, 14(6), 1253; https://doi.org/10.3390/land14061253
Submission received: 28 April 2025 / Revised: 4 June 2025 / Accepted: 9 June 2025 / Published: 11 June 2025

Abstract

International industrial transfer has driven rapid construction land expansion in emerging metropolitan areas, posing challenges for sustainable land management. However, existing research has largely overlooked the spatiotemporal patterns and driving mechanisms of this expansion, particularly in Southeast Asian metropolitan regions. To address this gap, we focused on the Ho Chi Minh City metropolitan area, utilizing construction land data from GLC_FCS30D to analyze the dynamics of construction land expansion during this period. Findings indicated that: (1) Continuous expansion of construction land, with the expansion rate during 2010–2020 being five times that of 2000–2010; (2) The spatial pattern evolved from initial infilling development in urban cores to subsequent leapfrogging and edge expansion toward peripheral counties and transportation corridors; (3) The expansion of construction land occurred alongside substantial losses of wetland and cultivated land. Between 2000 and 2020, the conversion of cultivated land to construction land increased significantly, particularly during 2010–2020 when cultivated land conversion accounted for 93.76% of newly developed construction land. Wetland conversion also showed notable growth during this period, comprising 3.86% of total newly added construction land; (4) Foreign direct investment (FDI) served as the primary catalyst, while industrial park development and transport infrastructure projects functioned as secondary accelerants. This study constructed a framework to systematically analyze the global and local driving mechanisms of metropolitan land expansion. The findings deepen the understanding of land-use transitions in emerging countries and provide both theoretical support and policy references for sustainable land management.

1. Introduction

International industrial transfer has fundamentally transformed land-use patterns in developing countries’ metropolitan areas [1,2]. Empirical studies established that industrial transfer accelerated regional urbanization processes while exacerbating land-use conflicts, particularly between cultivated land and construction land [3,4,5]. These dynamics were demonstrated in China’s coastal megaregions, where the Yangtze and Pearl River Delta witnessed extensive cultivated land to construction land conversion at metropolitan peripheries [6,7]. As these spatial production dynamics increasingly characterize Southeast Asian economies, the region has become particularly significant in global construction land change research [8,9]. Nevertheless, systematic analyses of construction land expansion patterns and their multiscale drivers remain surprisingly limited for Southeast Asia’s fast-growing metropolitan areas.
Existing research primarily investigated metropolitan construction land expansion through three aspects. First, the quantity and structural characteristics of construction land have changed. Extensive research confirmed that construction land expansion predominantly occurred through the conversion of cultivated and ecological lands [10,11]. Rustiadi et al. (2021) demonstrated significant cultivated displacement, while Yang et al. (2019) highlighted substantial ecological land loss through urban expansion [12,13]. Similarly, Manley et al. (2022) documented shrubland and cultivated land conversions as primary sources [14]. Second, the expansion pattern and morphological changes of construction land in metropolitan areas have been examined. Studies identified three fundamental spatial expansion patterns of construction land in metropolitan areas, including leapfrogging, infilling, and edge expansion [15,16]. However, their manifestations varied significantly across regions [17,18]. For instance, Huang et al. (2007) observed edge expansion predominantly along rail transit corridors, while Kuang et al. (2014) found infilling development to be more characteristic of urban core areas [19,20]. Additionally, edge expansion frequently occurred at metropolitan peripheries and along major transport routes [21,22]. Third, the drivers of construction land expansion in metropolitan areas have been analyzed. The dynamics of construction land expansion in developing countries differ markedly from those in developed economies, characterized by dual drivers of globalization and localized urbanization–industrialization processes [23,24,25]. Empirical studies of Guangzhou, China, demonstrated how FDI-driven industrial land demand accelerated urban expansion, compounded by proximity to urban centers or transport corridors and rapid industrialization [26,27,28]. To investigate these dynamics, researchers have employed a variety of methods that reflect the complexity of land-use transitions across spatial and temporal scales. Remote sensing and geographic information systems (GIS) are widely used to monitor and quantify land cover changes, enabling the identification of spatial patterns such as edge expansion, leapfrogging, and infilling [29,30]. These tools allow for high-resolution mapping of construction land expansion, providing critical insights into spatiotemporal dynamics. Statistical and econometric models are also frequently applied to explore the relationships between land-use changes and socioeconomic drivers, such as population growth, industrialization, and infrastructure investment [31,32]. More recently, machine learning algorithms and scenario-based simulation models, such as cellular automata and agent-based models, have gained popularity for predicting future land-use patterns and exploring policy implications [33]. While these approaches have significantly advanced the understanding of land-use dynamics, most studies focus on isolated spatial patterns or individual drivers. The interface between transnational capital flows, industrialization, and urbanization in shaping construction land expansion remains underexplored. For that reason, this study focuses on two critical but insufficiently addressed questions for Southeast Asian metropolitan areas under international industrial transfer: (1) How does FDI interact with local industrialization and urbanization to jointly drive construction land expansion? (2) What distinctive regional characteristics emerge in their expansion patterns and land-use transitions compared to other regions?
Vietnam, positioned as a pivotal destination for international industrial transfer, serves as a highly representative example of globalization-driven industrialization and urbanization in the Global South. Over the past two decades, the country has undergone rapid economic growth and profound land-use transitions [34,35]. These processes have been particularly evident in the Ho Chi Minh City metropolitan area (Vùng đô thị Thành phố Hô Chí Minh), which exemplifies the transformative effects of globalization on land-use dynamics in emerging economies [36]. As the largest economic hub in southern Vietnam, the Ho Chi Minh City metropolitan area accounts for the highest concentration of FDI inflows, industrial park development, and infrastructure construction in the country [37]. It has also experienced significant population growth and extensive land-use changes that reflect broader regional trends across Southeast Asia [38,39]. These characteristics position the Ho Chi Minh City metropolitan area as an exemplary case for examining the interplay between transnational capital flows and localized urbanization processes under globalization. Recent studies have made important strides in understanding land use and urban morphological changes in Ho Chi Minh City. For instance, Schaefer and Thinh (2019) quantified land cover changes from 2010 to 2017, highlighting agricultural land loss and proposing GIS-based tools for zoning agricultural protection sites in urbanizing districts [40]. Similarly, Downes et al. (2024) introduced an urban structure type approach to analyze urbanization patterns from 2010 to 2020, revealing critical growth corridors and the interplay between traditional urban expansion and new town development [41]. While these studies offer valuable perspectives on land-use changes and urbanization in Ho Chi Minh City, several limitations persist. First, existing research often focuses on specific periods or regions, lacking a comprehensive understanding of the dynamic and long-term spatiotemporal patterns of construction land expansion. Second, most studies primarily examine either morphological transformations or urban sprawl but fail to provide an integrated view of how global industrialization and localized urbanization processes interact. Third, there is limited exploration of how monitoring construction land expansion can directly inform urban planning and policy-making to tackle pressing issues such as informal settlements, urban sprawl, and inefficient land use.
This study focuses on the Ho Chi Minh City metropolitan area, a region that has undergone significant agricultural land conversion and rapid urban expansion over the past twenty years. By examining the spatiotemporal patterns and drivers of construction land expansion in this region, the study not only provides valuable insights for Vietnam but also enhances understanding of land-use transitions in other emerging countries under globalization. To build on these insights, this research makes three key contributions. First, it expands the empirical understanding of metropolitan land-use dynamics in the Global South, particularly how emerging countries navigate land-use transitions amid global industrial reorganization. Second, the study adopts a globalization-centered perspective to investigate the interactions between transnational capital flows and localized urbanization processes, highlighting their combined role in shaping construction land expansion in emerging economies. Third, it advances both theoretical and policy-relevant knowledge for sustainable land management in rapidly globalizing and urbanizing contexts. By focusing on Vietnam’s metropolitan area, this research provides critical insights into managing construction land expansion and supporting sustainable metropolitan development.

2. Study Area, Data Sources, and Research Methodology
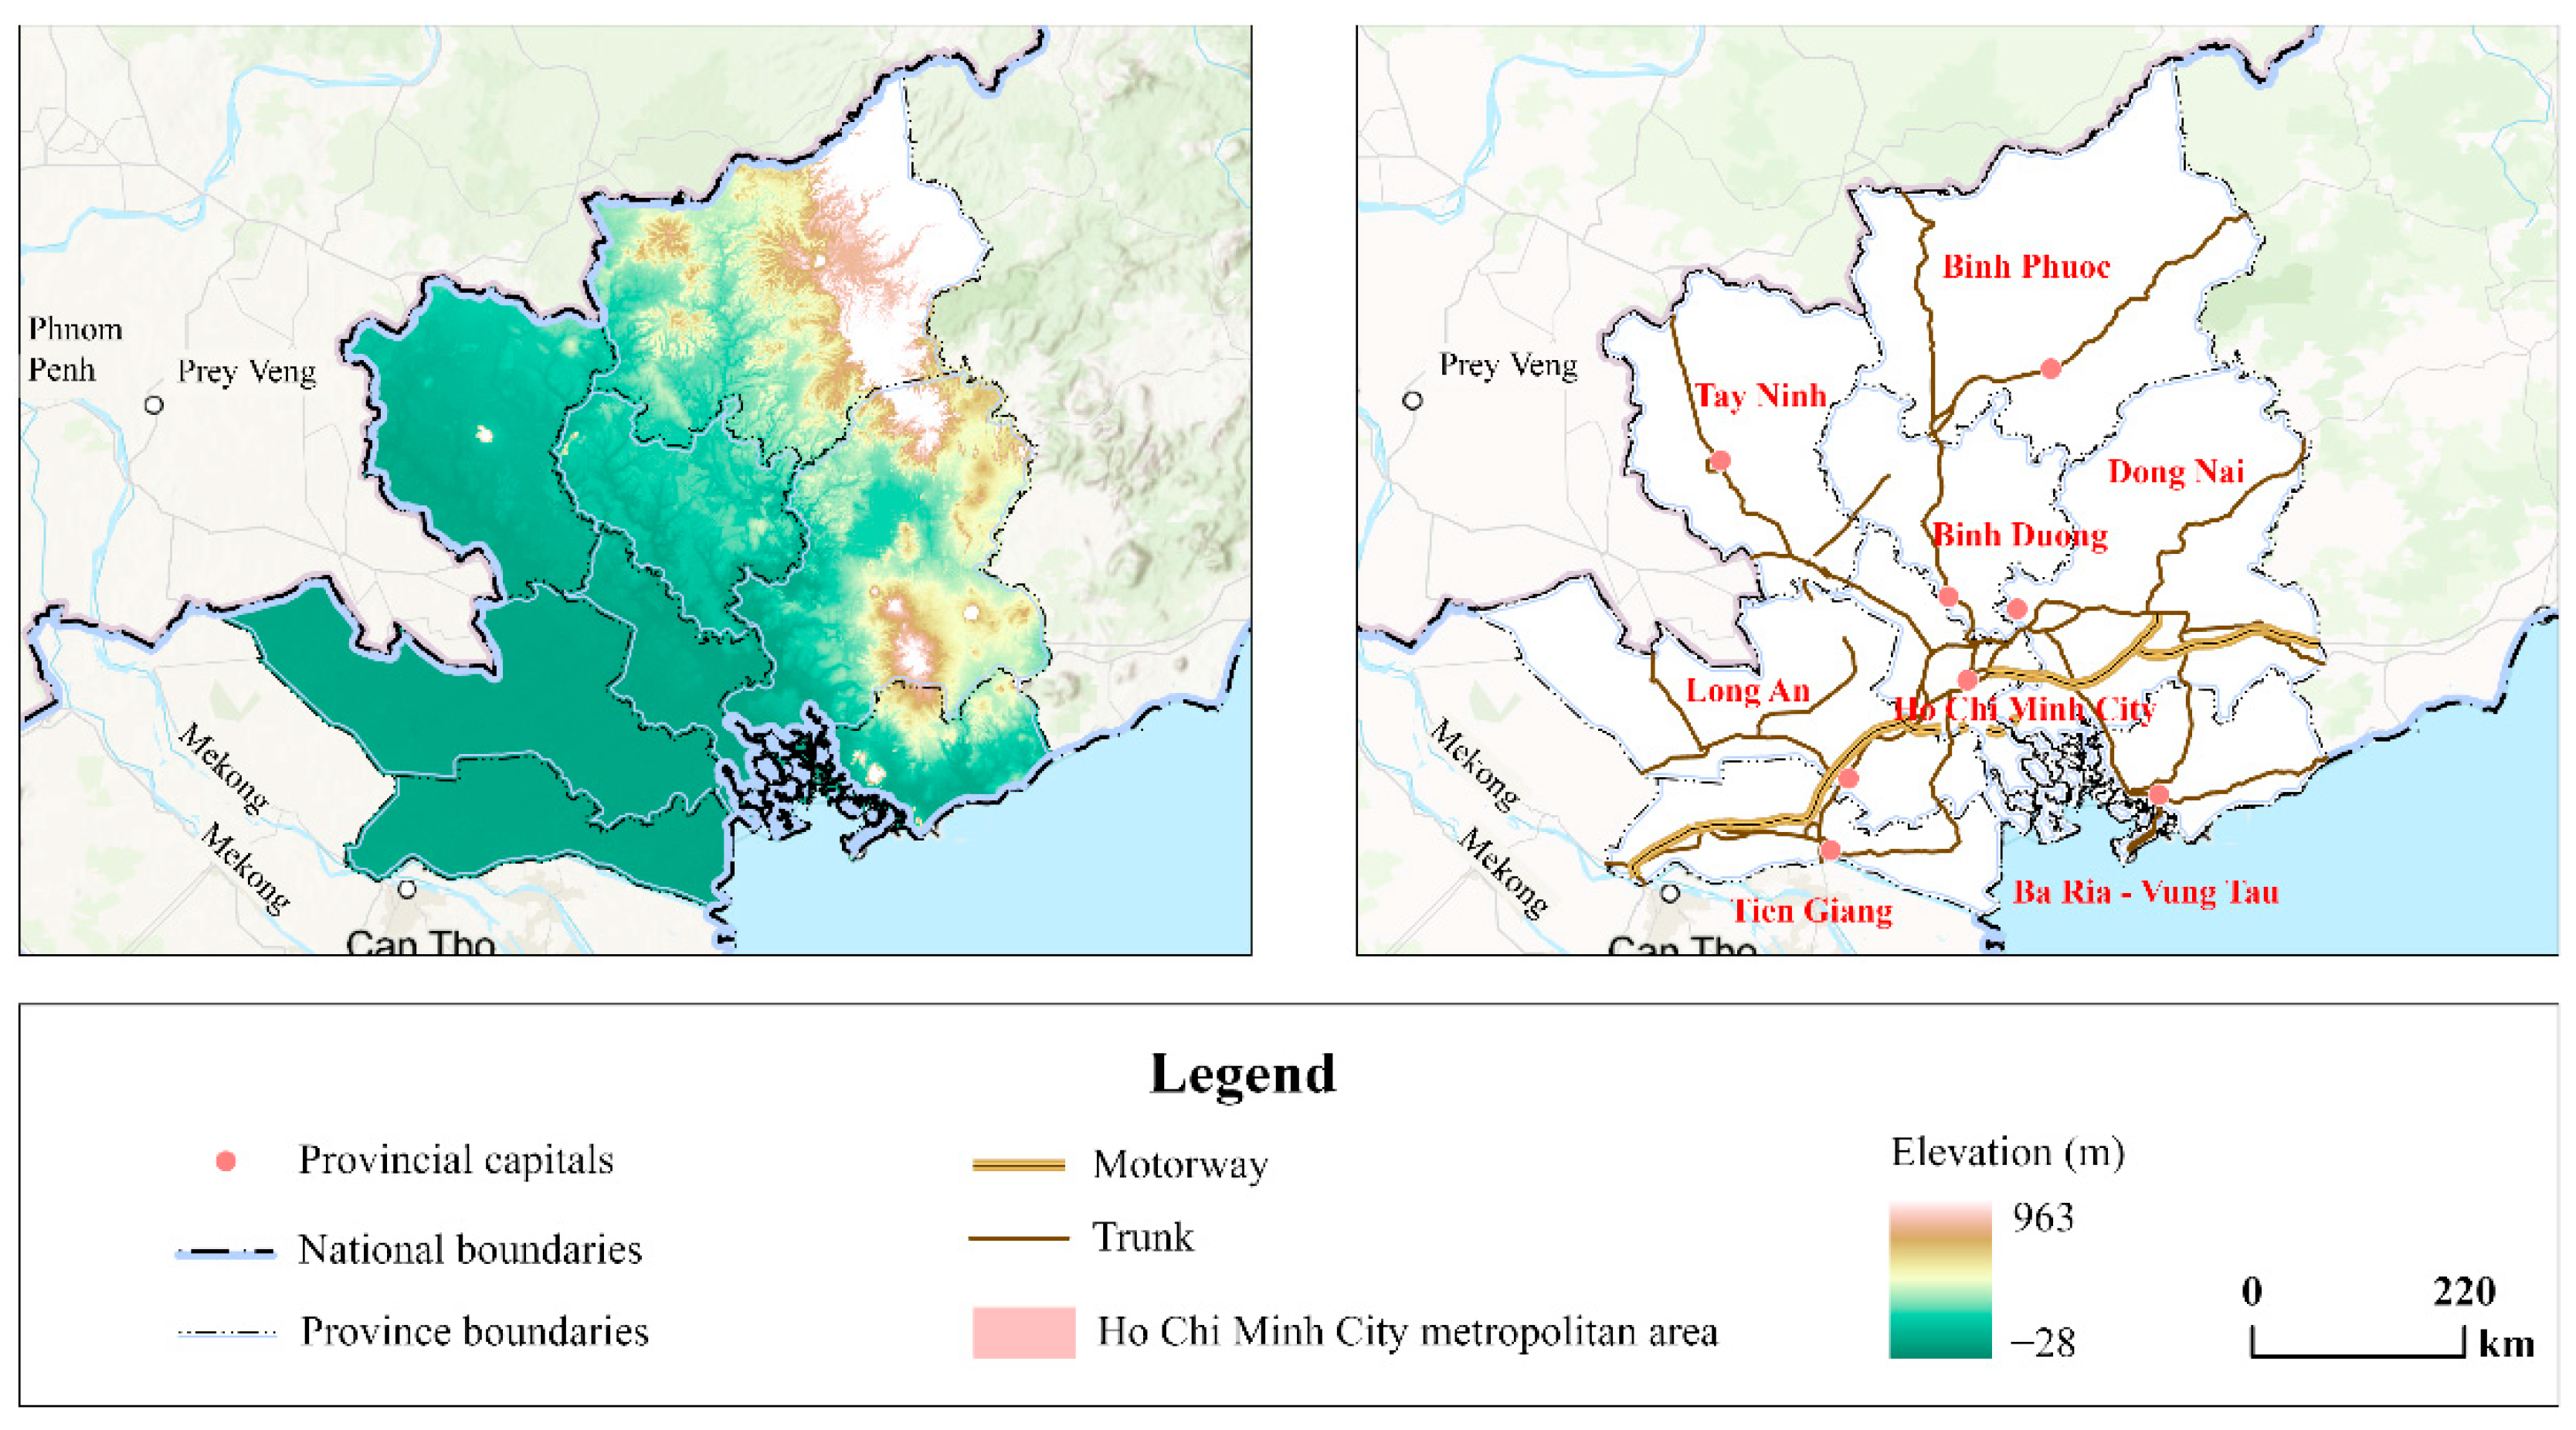
2.1. Study Area

Vietnam is situated in the eastern part of Southeast Asia, sharing borders with China, Laos, and Cambodia. Ho Chi Minh City, located in the southeastern part of Vietnam, is widely recognized as one of the country’s most dynamic economic hubs. Together with seven neighboring provinces, it forms the Ho Chi Minh City metropolitan area (Figure 1). The boundaries of this metropolitan region were defined based on the ‘Ho Chi Minh City metropolitan area 2040–2060 Planning Vision’ issued by the Vietnamese People’s Committee. This area spans 25,000 km2, accommodates a population of approximately 17.18 million, and generated a GDP of USD 116.626 billion in 2020. Several criteria were considered in selecting the Ho Chi Minh City metropolitan area as the study region. First, it is Vietnam’s largest economic center, concentrating the highest levels of FDI inflows, industrial parks, and transport infrastructure in the country [37]. Second, the rapid industrialization and urbanization processes observed in the Ho Chi Minh City metropolitan area reflect broader trends in Southeast Asia, making it a representative case for studying globalization-driven land-use transitions in the Global South [38,39]. Third, the availability of comprehensive, high-quality datasets, including land-use and socioeconomic data, further underscores its suitability as a case study. Since the adoption of Doi Moi, Ho Chi Minh City and its surrounding region have experienced rapid population growth [37] and a remarkable increase in industrial activity. By 2020, the cumulative inflows of FDI into the Ho Chi Minh City metropolitan area amounted to USD 63.482 billion, supporting the establishment of 101 industrial parks. As one of Vietnam’s fastest-growing regions, the Ho Chi Minh City metropolitan area has undergone profound transformations, driven by the combined forces of globalization, industrialization, and urbanization. These dynamics make it a highly representative and exemplary case for research.

2.2. Data Sources

We obtained land-use data from the GLC_FCS30D database. This database categorizes land into various types, such as cultivated lands, forests, grasslands, and artificial surfaces. It is widely used in studies of land expansion and is known for its high accuracy, with approximately 85% reliability [42]. We focused on artificial surfaces to analyze their changes over time.
Socioeconomic data encompassed a range of data, including industrial parks, cities, infrastructure, and FDI. FDI data were sourced from the World Bank and statistical yearbooks of Vietnam and its regions. Data on roads and waterways were obtained from OpenStreetMap. Reports and news on urban development were collected from official websites. In addition, the research team conducted a field survey in 2023, using both online and offline methods. We interviewed four officials, ten park managers, fifteen companies, and other stakeholders, with each interview lasting 2 to 3 h. Lastly, these socioeconomic data were organized into a grid format (30 m × 30 m).

2.3. Research Methodology

2.3.1. Landscape Expansion Index

The Landscape Expansion Index (LEI) indicates ways of expanding construction land. It divides the expansion patterns into three types: infilling, edge expansion, and leapfrogging [43]. Infilling happens when new construction fills in empty spaces within existing areas. Edge expansion occurs when new construction extends outward from existing areas. Leapfrogging is separating from existing areas. Here is the formula:
L E I = L c o m P n e w
L c o m is the length of shared boundaries between new and existing construction land. P n e w is the perimeter of the new construction land. For leapfrogging, LEI = 0; for edge expansion, 0 < LEI ≤ 0.5; for infilling, 0.5 < LEI ≤ 1.

2.3.2. Land-Use Dynamics

Land-use dynamics measures the extent to which a particular type of land has changed over time [44]. It will be used to measure the extent of construction land in the Ho Chi Minh City metropolitan area from 2000 to 2020. Here is the formula:
K = U b U a U a × 1 T × 100 %
In the equation: K represents the degree of change for a specific land type during the study period. U a and U b show the quantity of land type at the study period’s start and end. T is the duration of the study period. If T represents a year, then K indicates the annual change rate of land type in the study area.

2.3.3. Center of Gravity Transfer Model

The centroid migration model is a dynamic tool for analyzing spatial changes, offering high flexibility and efficiency. It not only captures detailed spatiotemporal evolution paths but also provides insights into the spatial dynamics of land-use changes under different scenario conditions. In this study, the centroid migration model is employed to analyze the spatial transformation of construction land in the Ho Chi Minh City metropolitan area from 2000 to 2020. Using administrative boundaries as the basic spatial units, the model quantifies the spatiotemporal distribution changes of construction land during the study period. The centroid positions of construction land in 2000, 2005, 2010, 2015, and 2020 are calculated, with these years serving as the base and comparison periods. The calculation formula for the centroid position is as follows:
X = i = 1 n P i X i i = 1 n P i , Y = i = 1 n P i Y i i = 1 n P i
D m = ( X t + m X t ) 2 + ( Y t + m Y t ) 2
V = D m t
Equation (3) represents the formulas for calculating the centroid coordinates, where ( X i , Y i ) represents the geometric centroid of the i-th unit within the study area, P i is the transformation area of unit i, n is the total number of units in the study area, and ( X , Y ) is the migration centroid of the spatial distribution. These formulas allow for the accurate identification of the overall spatial center based on weighted contributions of each unit. Equation (4) defines the migration distance D m , which quantifies the spatial displacement of the centroid between two time periods, t and t + m. Here, ( X t , Y t ) and ( X t + m , Y t + m ) denote the centroid coordinates at times t and t + m, respectively. This measure reflects the magnitude of spatial changes over time. Equation (5) defines the migration speed V, which represents the rate of centroid movement during the time interval t . It is calculated by dividing the migration distance D m by the time interval t . This metric provides insights into the intensity of spatial changes, helping to evaluate the dynamics of spatial transformation.

2.3.4. Logistic Regression

Logistic regression is a statistical technique widely used for analyzing categorical data, especially when handling binary outcomes (with two possible values) or multiple outcomes represented by discrete categories. When the response variable is nominal (not ordered), the logit model is considered appropriate. The transformation probability of spatial land-use types into construction land will be represented as a nonlinear function composed of a series of explanatory variables [45]. The expression is as follows:
P = e x p ( α + β 1 x 1 + β 2 x 2 + β 3 x 3 + β n x n ) 1 + e x p ( α + β 1 x 1 + β 2 x 2 + β 3 x 3 + β n x n )
In this equation, the dependent variable P represents the probability of an event occurring, x 1 , x 2 x n represents the independent variable, and β 1 , β 2 β n represents the regression coefficients. Based on Equation (6) and its logit transformation, where x is the response variable and P is the response probability, the logistic regression model is expressed as follows:
ln ( p i / 1 p i ) = α + k = 1 k β k x k i
In this equation, p i = P ( y i = 1 | x 1 i , x 2 i , x k i ) is the probability of spatial change when the independent variable, x 1 i ,   x 2 i , x k i , takes a given specific value. Among them, α indicates intercept and β represents slope.
To apply the logistic regression model, a spatial random sampling method was used to select 4000 evenly distributed random points as research samples, with the minimum distance allowed between the random points not less than 50 m [46]. According to the type of explanatory variable, several fields are added to the spatial attribute table of the sampling point, and each sampling point is assigned a value to obtain the observed value of the spatial sample.

3. Expansion of Construction Land in the Metropolitan Area

3.1. Characteristics of Construction Land Expansion Rate Changes

The construction land in the Ho Chi Minh City metropolitan area showed continuous expansion from 2000 to 2020, with a significantly faster growth rate in the second decade (Figure 2). The total construction land area increased by 1.72 times during this period, reaching 1852.52 km2 by 2020. Specifically, the expansion was 101.08 km2 during 2000–2010, compared to 672.92 km2 in 2010–2020. The average annual expansion rate for the entire period was 2.68%. However, there were clear differences between decades. The early period had a modest 0.89% annual growth rate, while the later decade showed rapid expansion at 4.92% per year. This indicated that the growth rate in the second decade not only greatly exceeded that of the first decade but also surpassed the 20-year average.

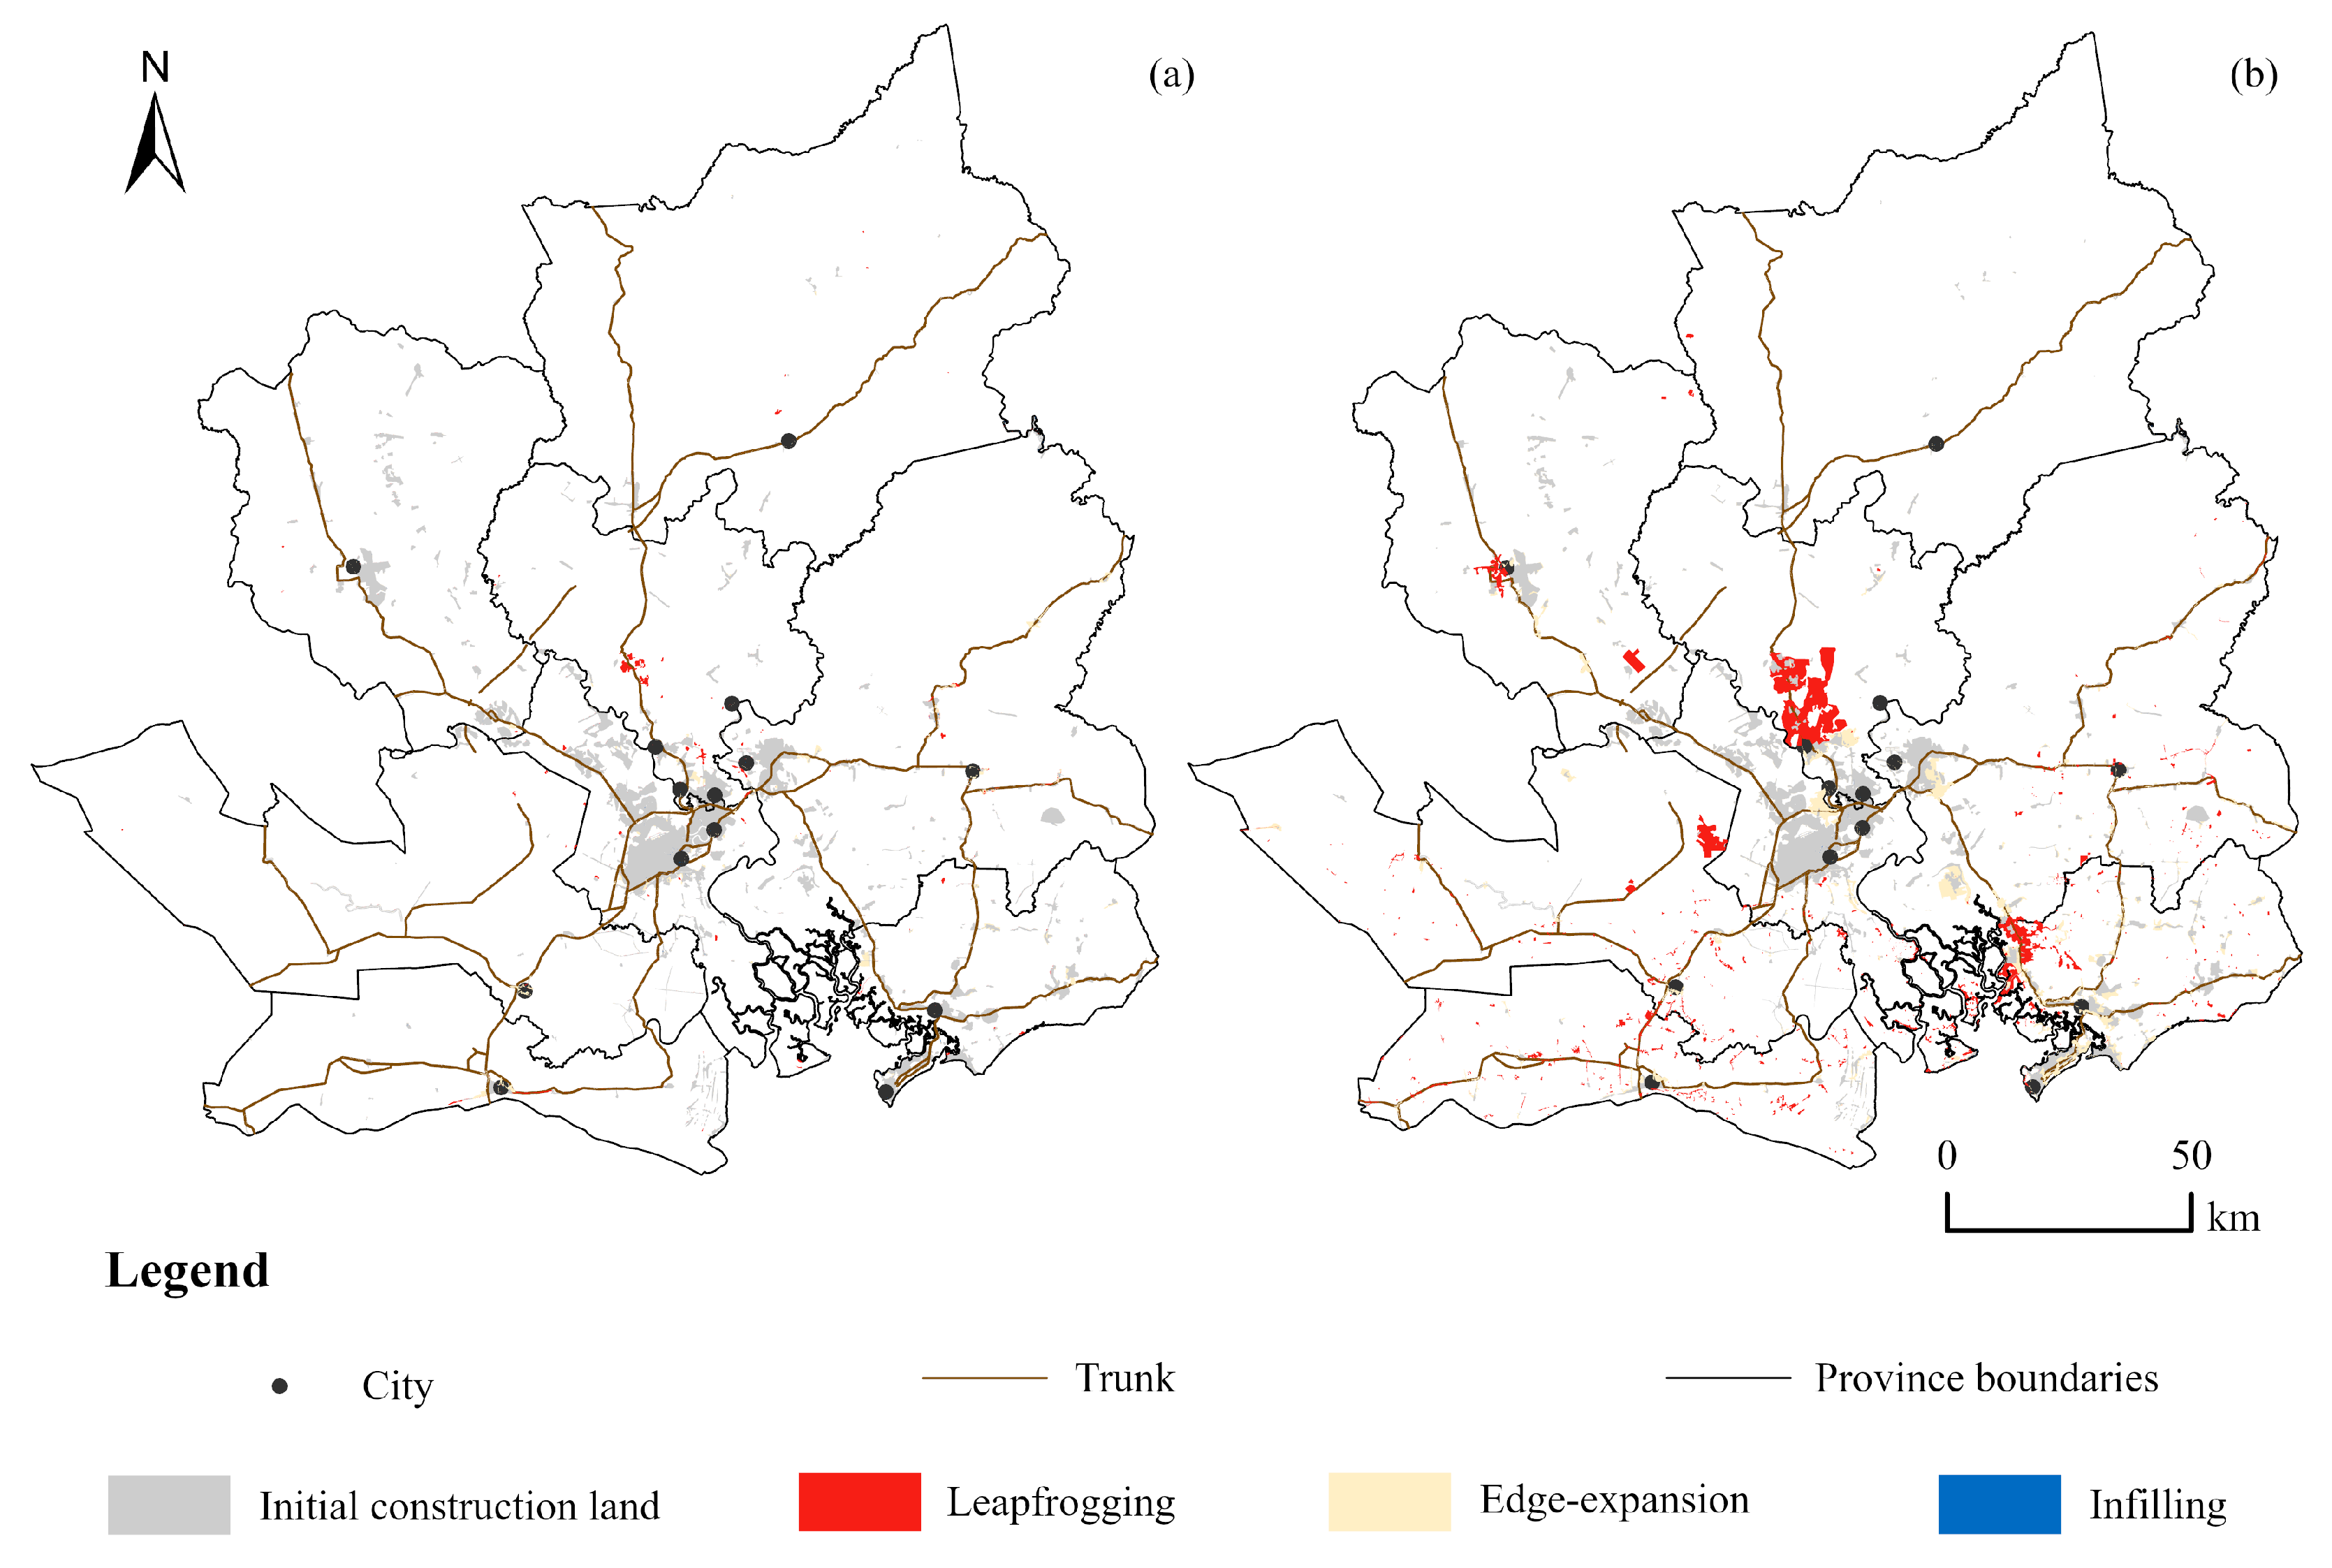
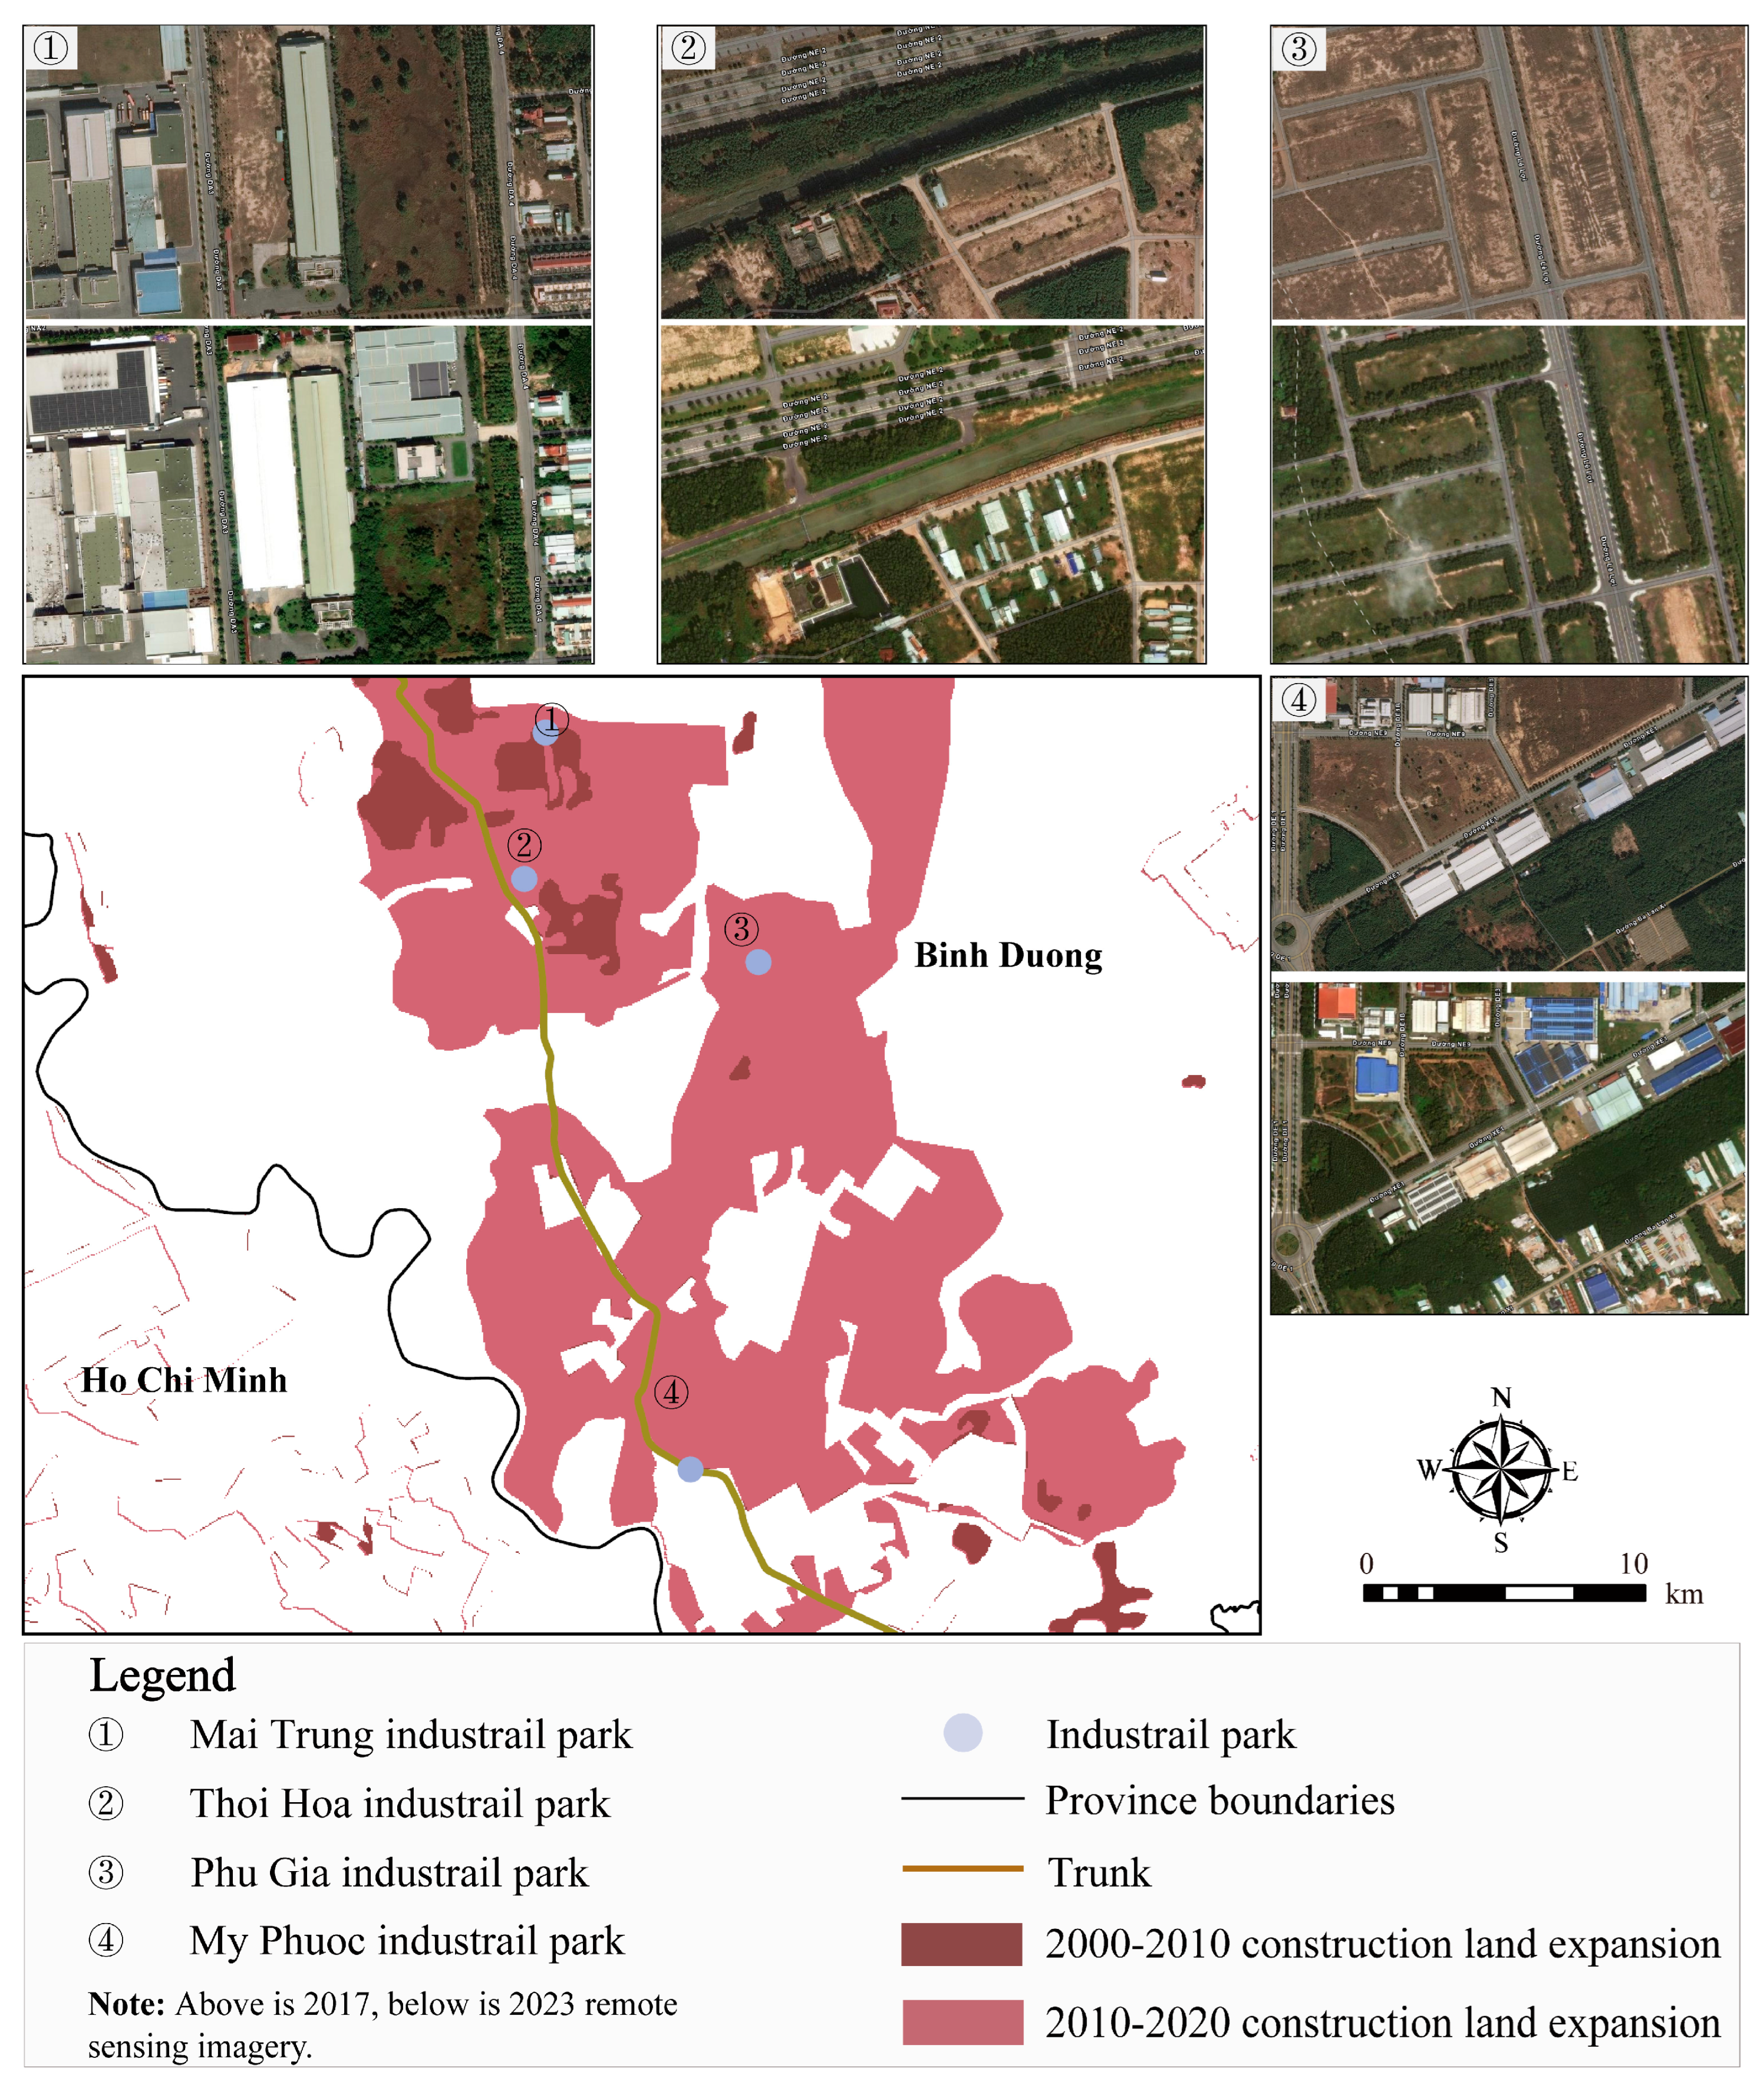
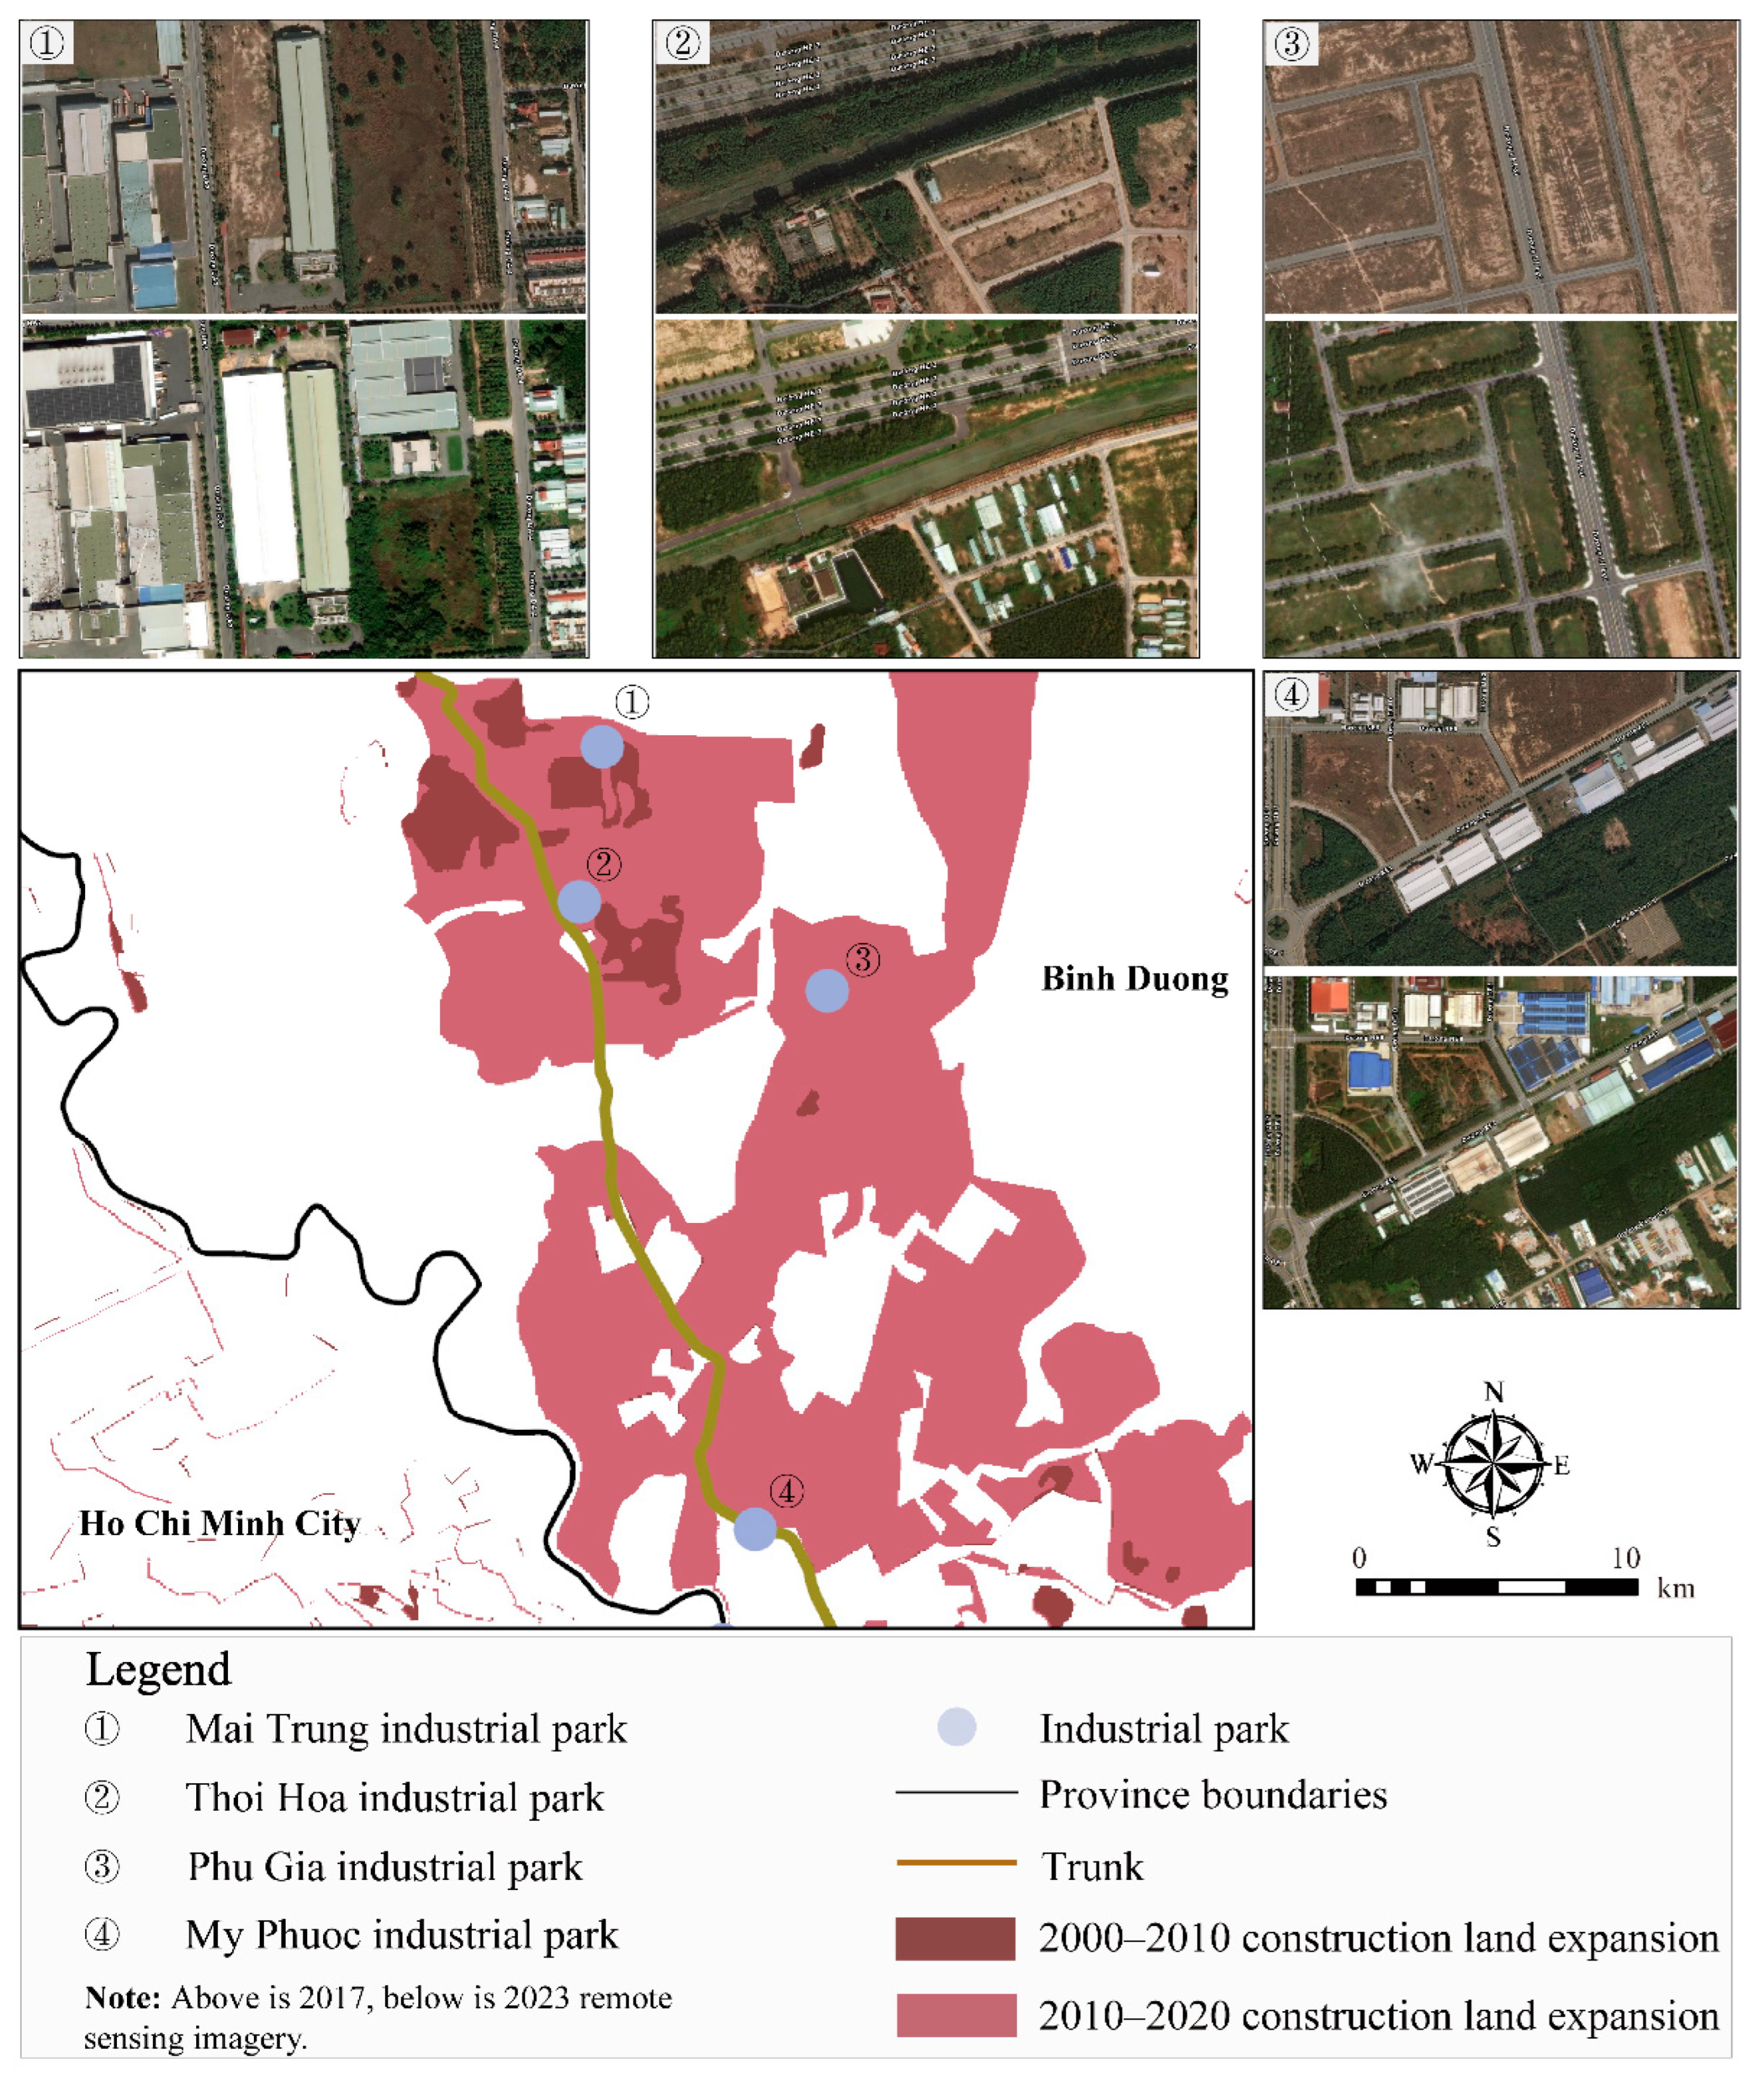
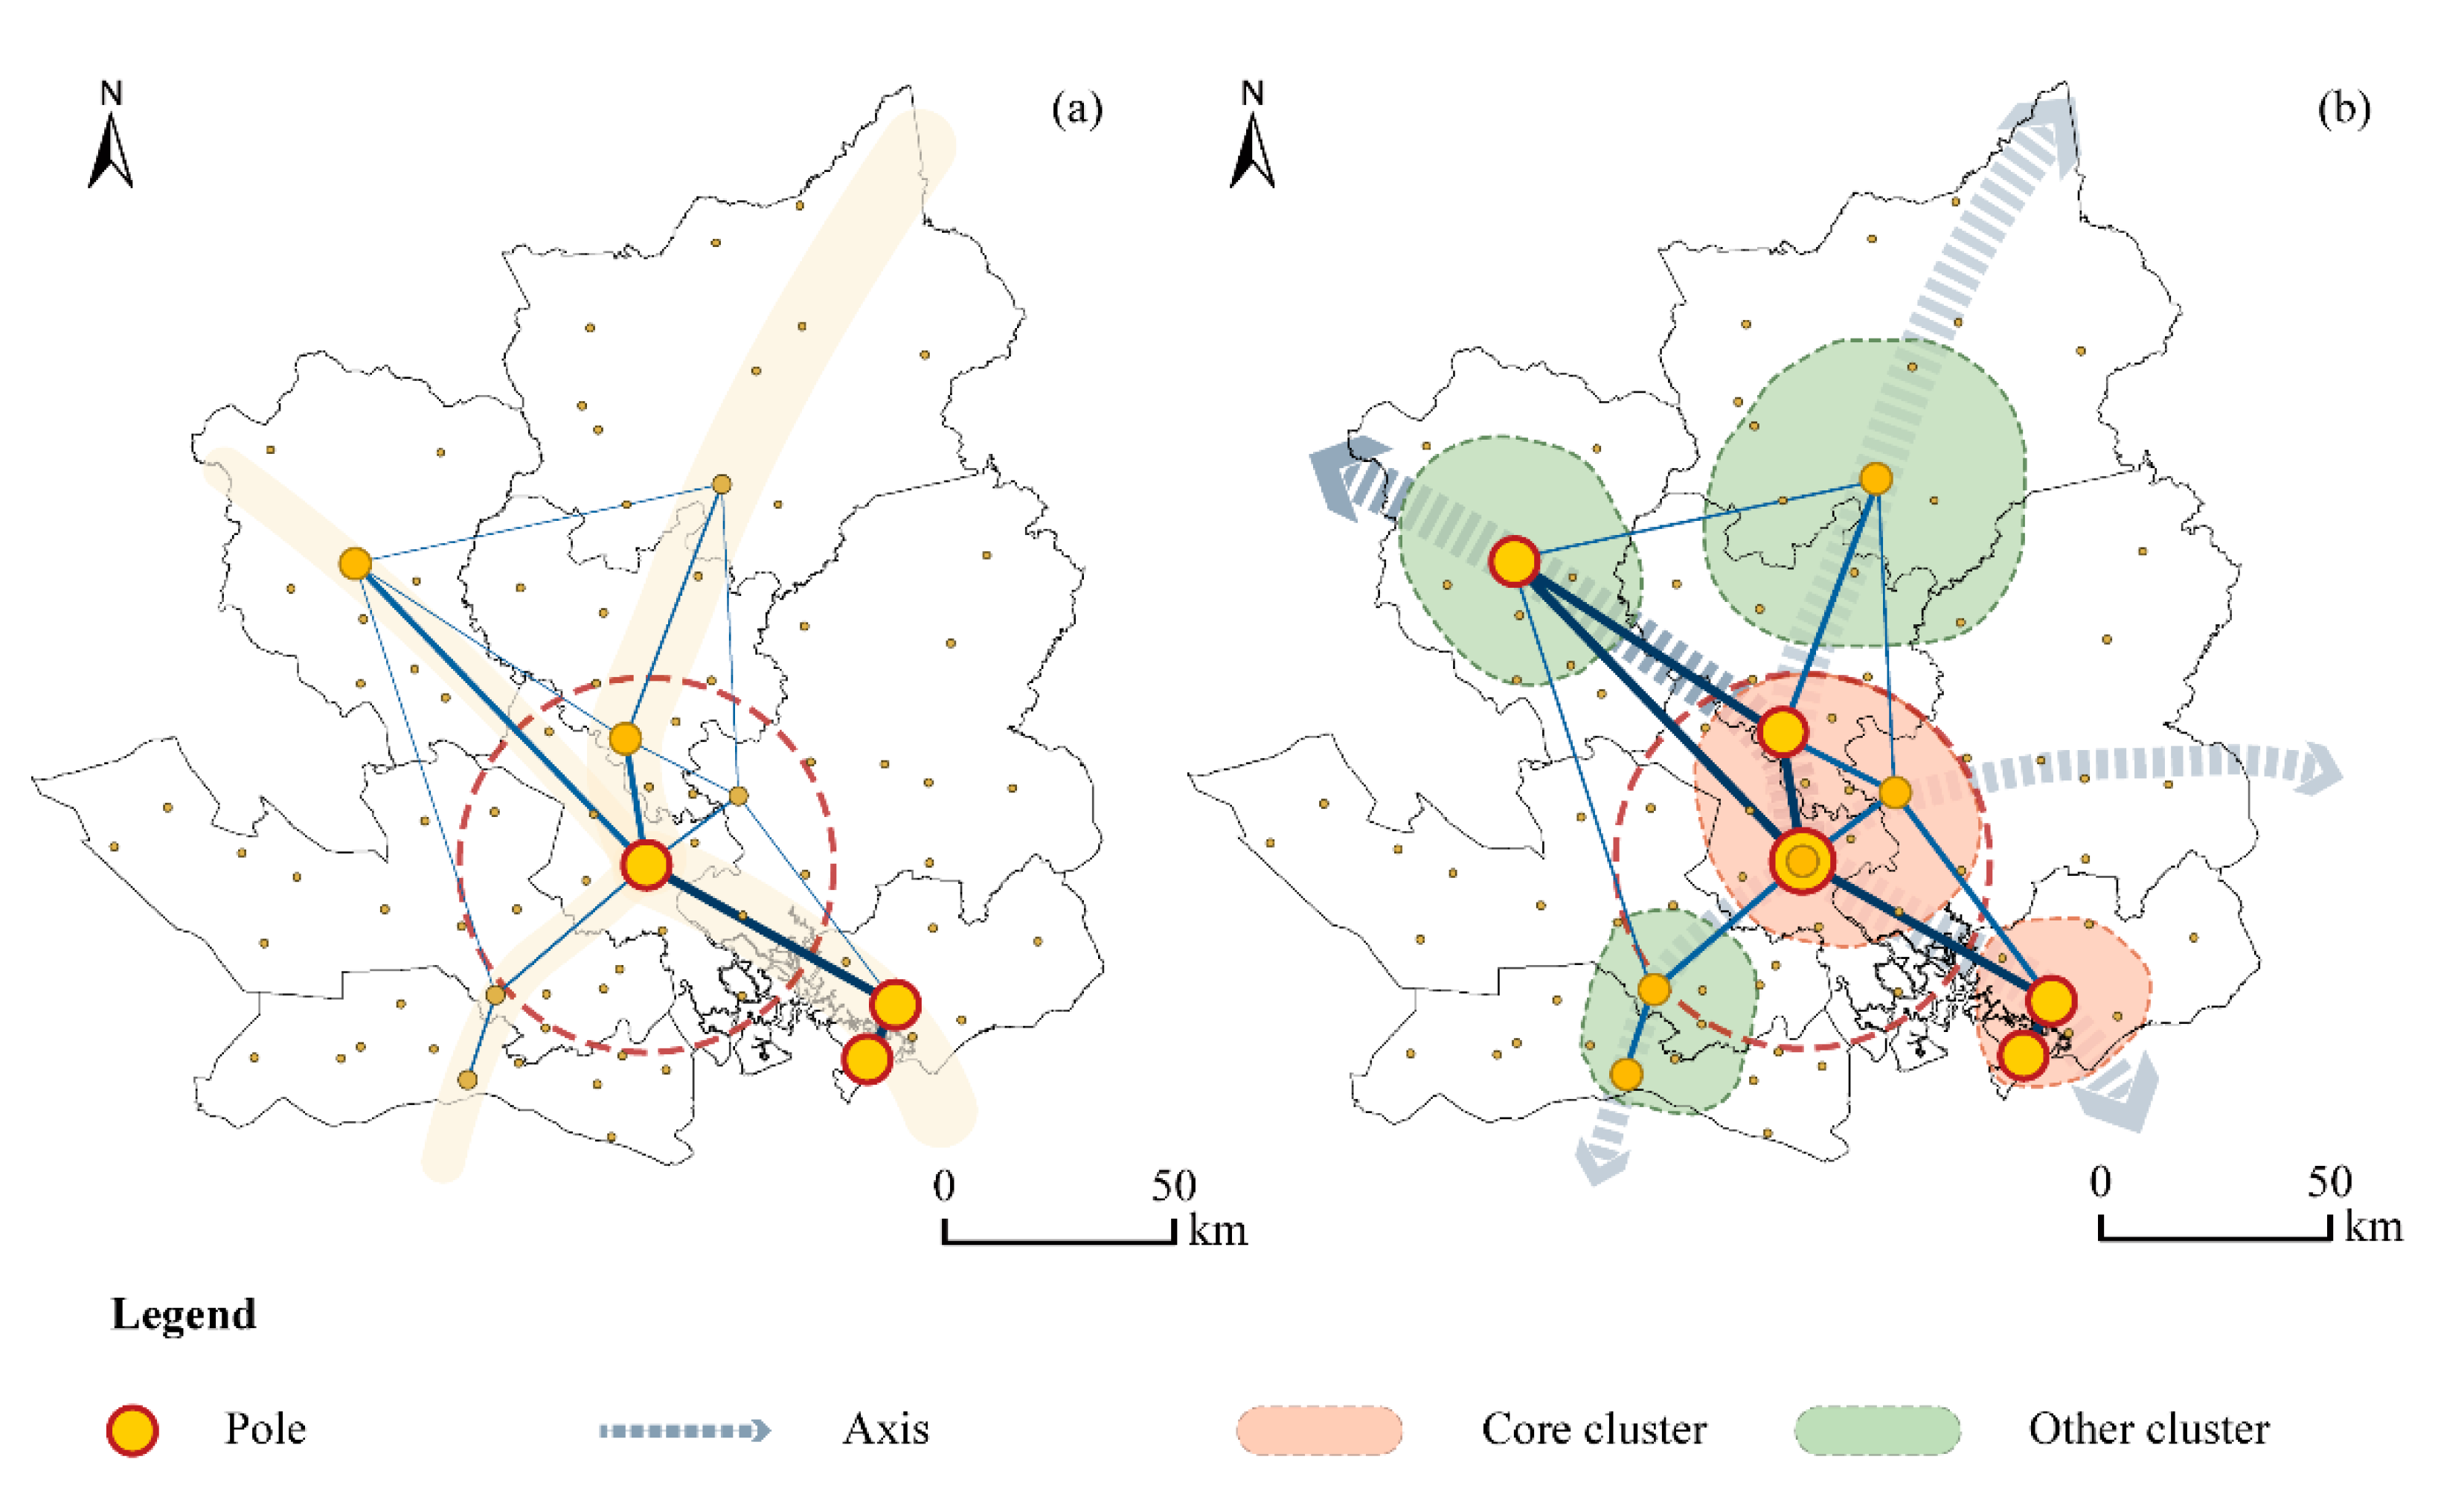
3.2. Spatial Structural Characteristics of Construction Land Expansion

The construction land in the Ho Chi Minh City metropolitan area exhibited a distinct spatial expansion pattern radiating from core urban centers toward surrounding county-level areas and along major transportation corridors (Figure 3). In the first decade, expansion predominantly involved infilling, with new construction land primarily developing adjacent to existing urban areas. Changes were minor and mostly consisted of small-scale extensions around established construction sites, without the creation of many new growth areas. In contrast, the following decade saw significant expansion near major roads through both edge expansion and leapfrogging (Figure 4). The development of industrial parks facilitated the emergence of multiple new growth centers, including new cities and industrial zones. To further quantify the spatial dynamics of this expansion, a centroid migration analysis was conducted, revealing a clear directional shift of construction land expansion toward the northern regions and along major transportation corridors (Table 1). The majority of the expansion occurred in the northern regions of Ho Chi Minh City, while other areas experienced growth along major transportation corridors and within industrial zones.

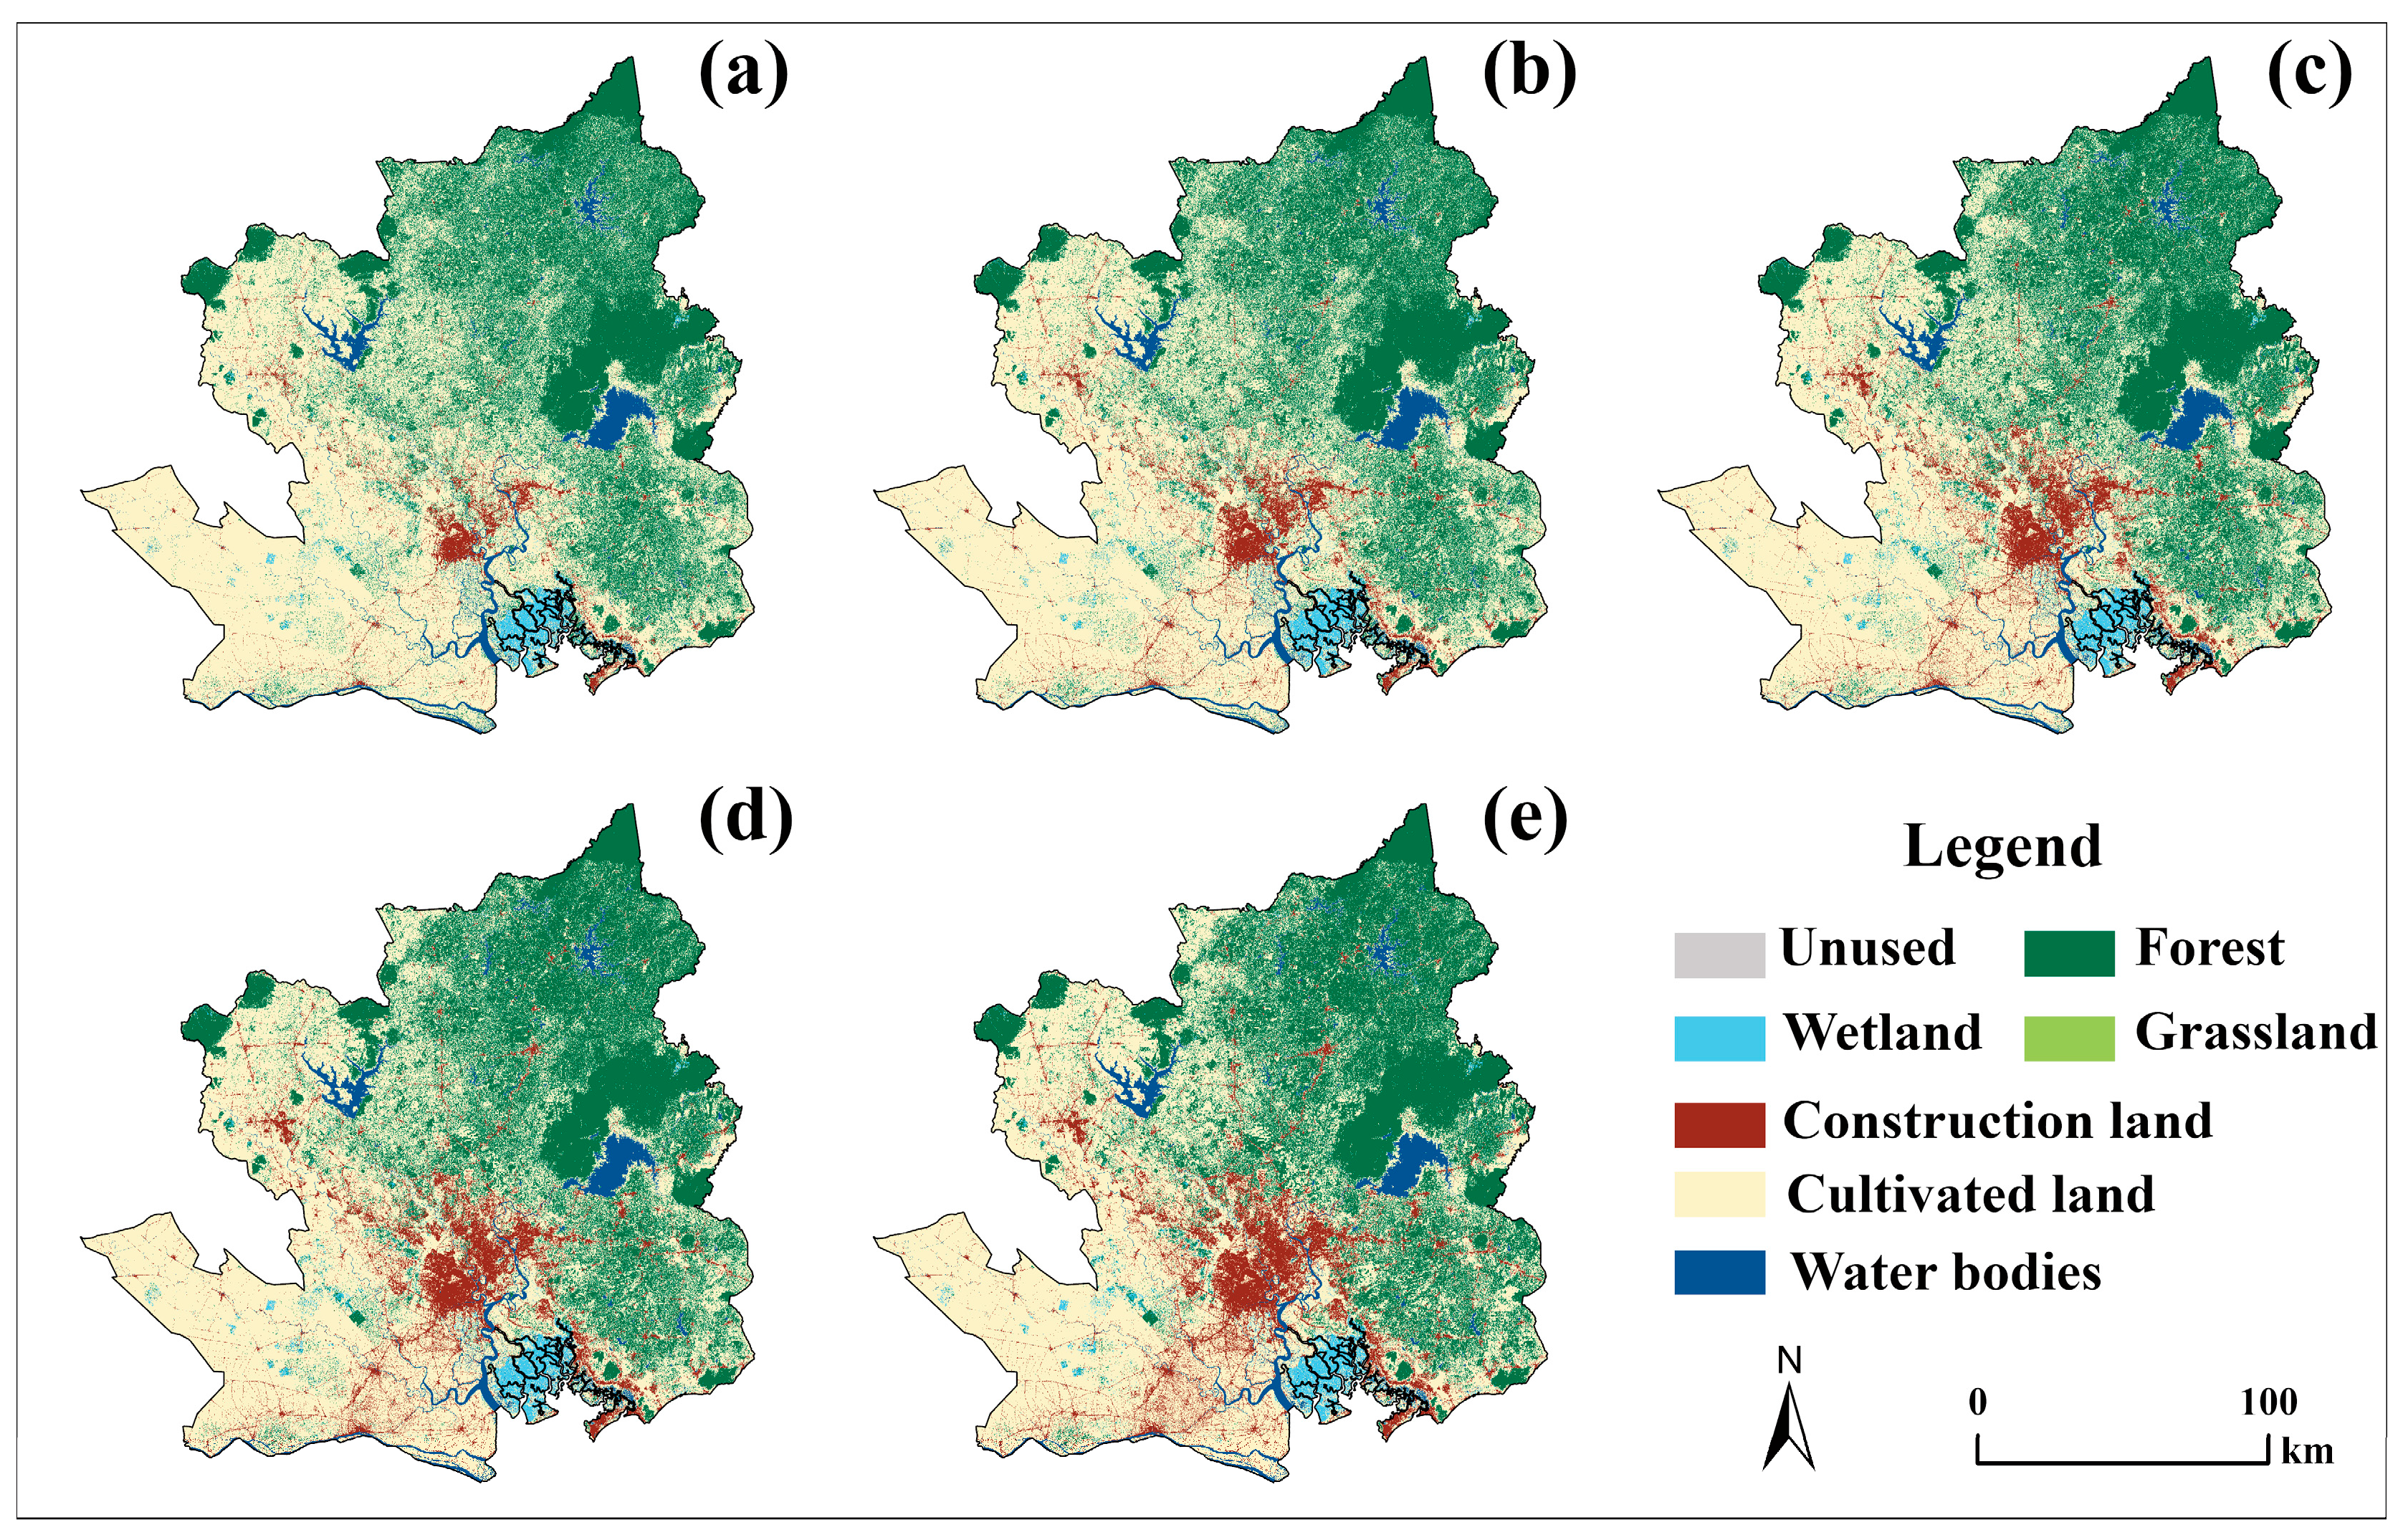
3.3. The Characteristics of Land-Use Type Conversion

In the process of land-use transformation, the conversion of wetlands and cultivated lands has been predominant (Figure 5). From 2000 to 2020, the proportion of cultivated lands converted into construction land increased significantly. Notably, between 2010 and 2020, cultivated lands accounted for 93.76% of newly developed construction land. During the same period, wetland conversion also saw a marked rise, contributing 3.86% to the newly expanded construction land. This transformation has not only resulted in a significant reduction of cultivated land but has also had profound impacts on the ecological environment. Spatially, the expansion of construction land in the Ho Chi Minh City metropolitan area showed clear regional disparities. In the southeastern region, particularly in Ba Ria-Vung Tau Province, construction land expansion was primarily driven by the conversion of wetlands. In contrast, the expansion in the northern region, especially in Binh Duong Province, relied on the conversion of cultivated lands.

4. Driving Forces of Construction Land Expansion

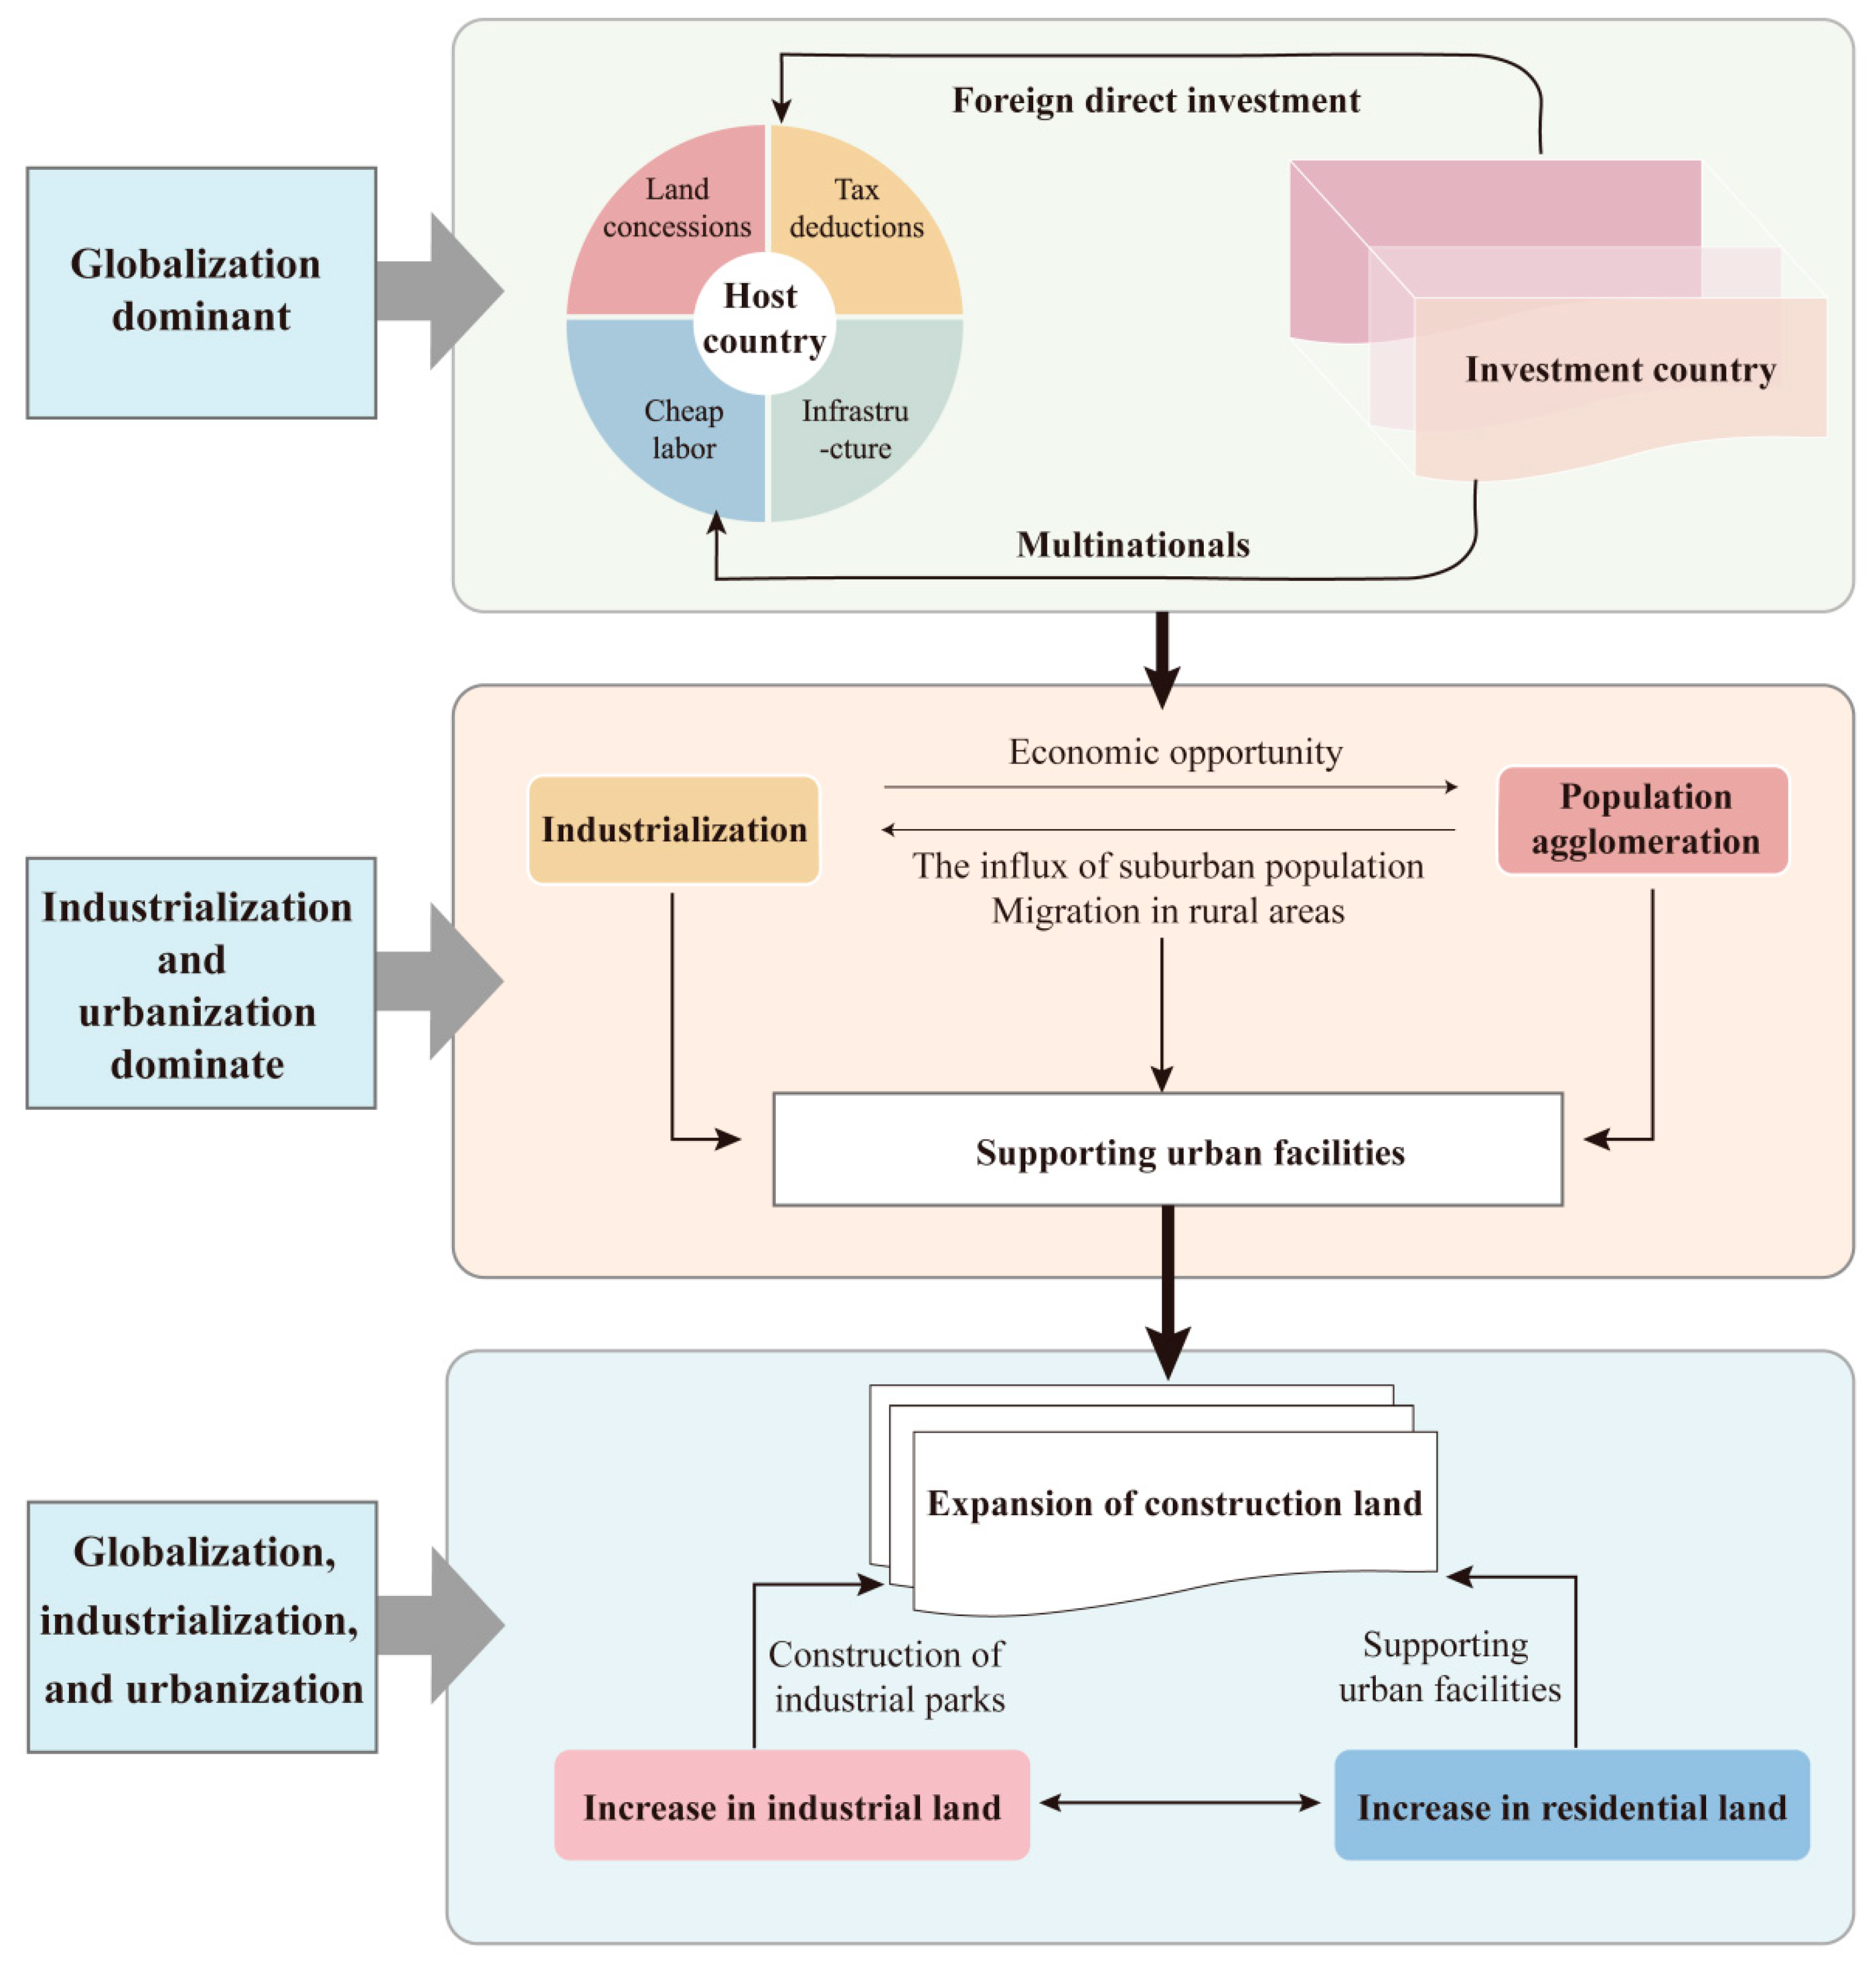
4.1. Macroscopic Factors

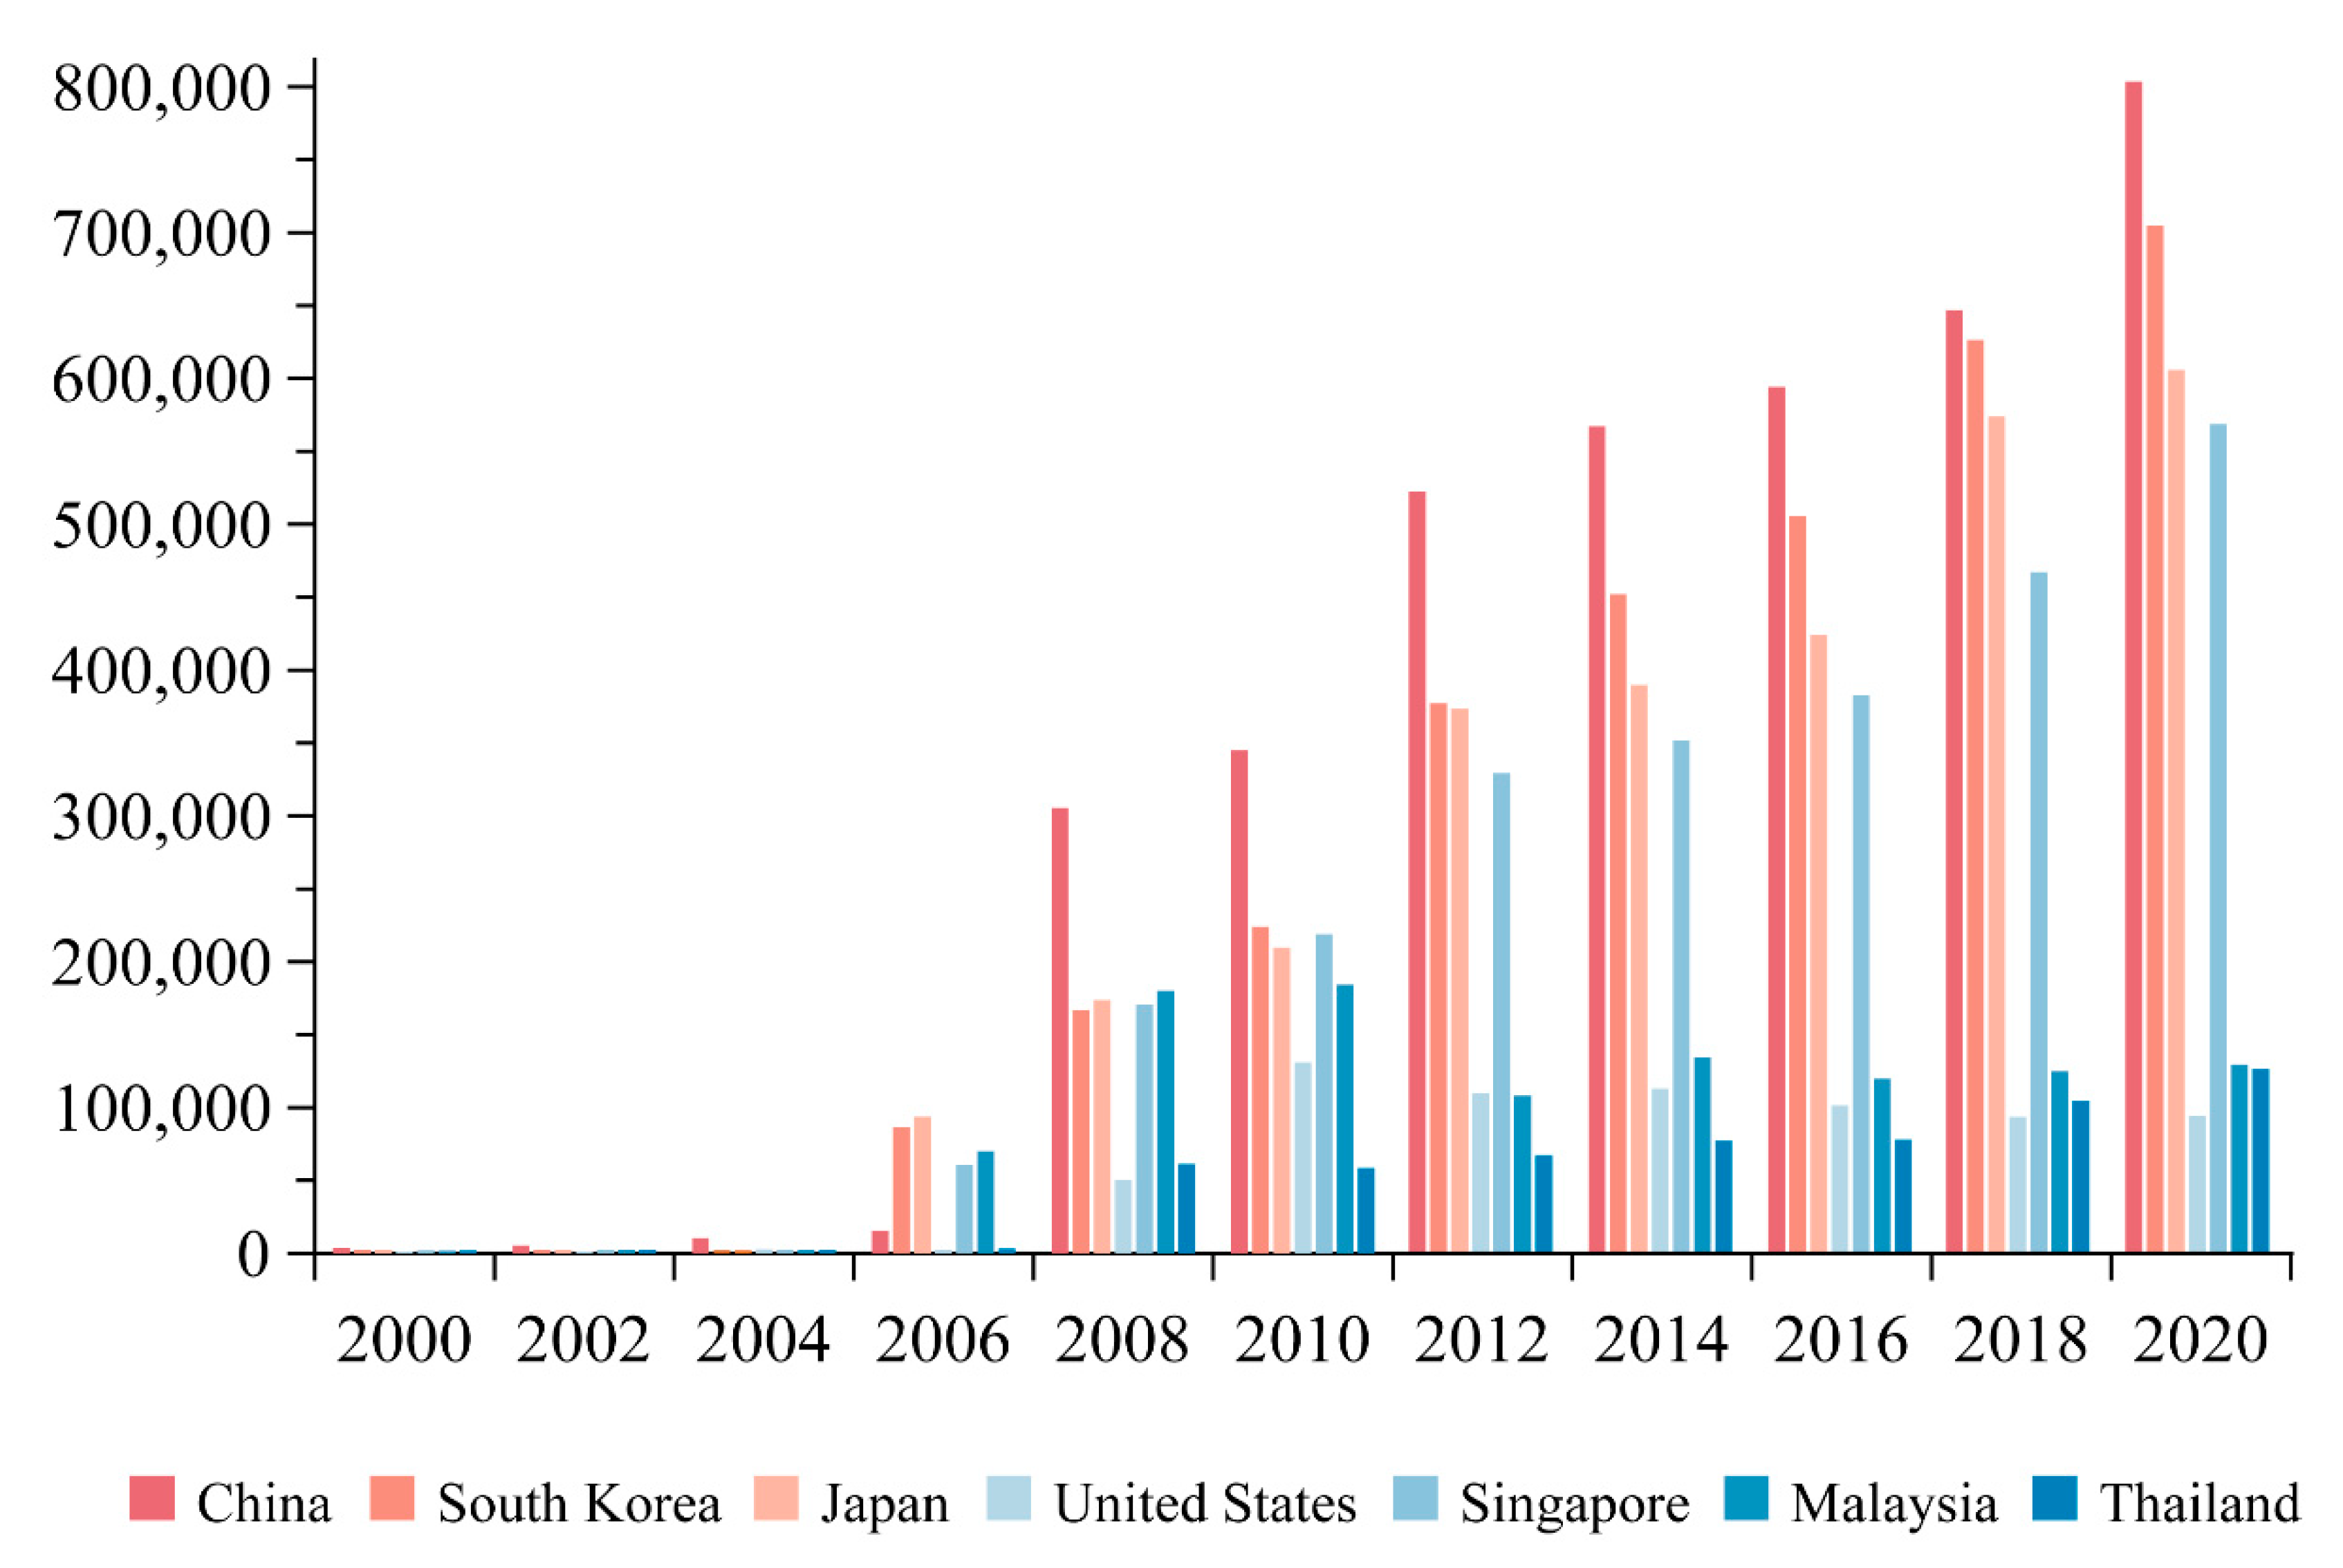
4.1.1. Globalization and FDI

FDI became a crucial driver of socioeconomic development in the Ho Chi Minh City metropolitan area (Figure 6). As a primary destination for international industrial transfer, Vietnam has seen substantial FDI growth over the past decade, with major investments from Japan, South Korea, and China. Multinational corporations served as the primary carriers of FDI in developing countries. According to Wei and Liefner (2012), these corporations evaluated multiple location factors when making investment decisions, including labor costs, infrastructure quality, market size, and government policies [47]. These key production factors were unevenly distributed spatially, forcing firms to optimize location choices to maximize market access and minimize costs. The optimal combinations of these factors tended to concentrate in metropolitan areas, making them major FDI recipients. With increasing FDI, industrialization and urbanization levels in the metropolitan area gradually rose, agglomeration economies emerged, and urban expansion accelerated. Consequently, construction land expansion initially concentrated within 20 km of Ho Chi Minh City’s core before extending to surrounding counties and transportation corridors.

4.1.2. Urbanization and Industrialization

Industrialization and urbanization represented another major driver of construction land expansion in the Ho Chi Minh City metropolitan area. First, industrialization directly increased demand for industrial construction land through production scale expansion. Since 1994, the metropolitan area has established 101 industrial parks (Figure 7). These parks developed rapidly under tax incentive policies, accelerating industrial land expansion. Initially, many parks enjoyed tax exemptions for up to four years, followed by 50% tax reductions for the next nine years, particularly for export-oriented enterprises [48]. Although later policies tightened tax benefits, high-tech industries maintained preferential treatment. Therefore, the construction of industrial parks promoted the expansion of construction land. Second, urbanization’s impact on construction land aligns with industrialization through employment effects. Industrial agglomeration attracts rural-to-urban migration [49]. Population growth drives residential land demand while increasing the need for urban infrastructure and services. This has spurred commercial expansion around industrial hubs, exemplified by districts hosting Samsung and Panasonic facilities.
In summary, the expansion of construction land in the Ho Chi Minh City metropolitan area resulted from the combined effects of external globalization forces and internal urbanization and industrialization processes (Figure 8). The recent international industrial transfer has led to sustained growth in FDI in Vietnam. As the primary agents of FDI, multinational corporations tended to cluster in metropolitan areas due to various locational factors, promoting concentric spatial patterns of urban expansion. Urbanization and industrialization have stimulated socioeconomic development, which in turn has increased demand for construction land, creating an expansion effect. The selection of industrial park locations must consider both cost control and transportation accessibility. Consequently, areas closer to the metropolitan core and with better transport infrastructure exhibit more pronounced construction land expansion trends.

4.2. Quantitative Analysis

Building upon the qualitative analysis presented above, we conducted quantitative analysis using logistic regression to identify 13 key drivers of construction land expansion. Among these, elevation and slope served as explanatory variables for the natural background [50]. FDI acted as a proxy for globalization [47]. The industrialization index, proximity to industrial parks, distance from primary and secondary roads, proximity to waterways, and population density all served as indicators of industrialization [51,52,53]. Distance to the capital city and county, along with nighttime light intensity, served as indicators of urbanization [54,55]. Multicollinearity among independent variables was assessed through correlation tests and Variance Inflation Factor (VIF) analysis. After removing variables exhibiting collinearity, the final set of variables is presented in Table 2.
Using Stepwise Logistic Regression, the models demonstrated a strong fit for the periods 2000–2010 and 2010–2020, with goodness of fit of 81.85% and 83.68%, respectively. The findings showed the following: (1) the combined influence of globalization, industrialization, and urbanization significantly affected the expansion of construction land; (2) in the Ho Chi Minh City metropolitan area, the cities and development axes played a crucial role in driving the expansion of construction land (Table 3).
Table 3 indicated that, between 2000 and 2010, only slope, the industrialization index, and distance to major waterways had no significant impact. But the significance level of other factors was less than 0.01. It indicated that globalization, industrialization, and urbanization have noticeably influenced construction land expansion. The positive coefficient for FDI suggested that globalization has a significant positive effect on construction land expansion. Conversely, the coefficients for distance to the county and different transportation routes were negative, meaning that being closer to the county and main roads facilitated construction land expansion. This implied that construction land tended to spread out by infilling around the county and along the trunks.
During 2010–2020, construction land expansion was influenced by multiple factors, including elevation, industrialization index, distance to industrial parks and waterways, population, distance to the capital city, and nighttime light intensity (Table 3). FDI played a pivotal role in transforming the Ho Chi Minh City metropolitan area into an industrial hub, primarily through the development of industrial parks and infrastructure improvements. This stimulated local industrial growth, creating a surge in demand for industrial land and driving leapfrogging development across the region. Population growth and nighttime light intensity also significantly contributed to the expansion. As the city grew and its economy prospered, increasing demand for residential land pushed urban boundaries outward. This study demonstrated that the interplay between exogenous forces and endogenous processes served as the primary driver of construction land expansion in the Ho Chi Minh City metropolitan area.

5. Discussion

The driving factors of construction land expansion in metropolitan areas of emerging countries exhibited both similarities and differences compared to those in developed countries and some developing countries [56,57]. This study found that in emerging countries, construction land expansion was primarily driven by FDI, distinguishing it from the patterns observed in developed countries. In developed economies, land expansion was predominantly influenced by endogenous factors such as population growth and infrastructure development [58]. For instance, during the Industrial Revolution, the United States experienced a boom in urban centers. Subsequent suburbanization was driven by rapid automobile adoption, employment decentralization, and extensive highway construction, ultimately leading to low-density urban sprawl [59]. In contrast, in the early stages of urban expansion in developing countries, FDI played a crucial role. For example, in the Pearl River Delta, FDI stimulated industrial land demand, triggering significant expansion of construction land [47]. Similarly, in the Ho Chi Minh City metropolitan area, construction land expansion has been shaped by the interplay between globalization as an external force and industrialization and urbanization as endogenous drivers.
The expansion of construction land came at the cost of cultivated land, a trend also evident in the Ho Chi Minh City metropolitan area. This study found that the region exhibited land conversion patterns consistent with findings in other Southeast Asian countries and regions, as well as in China [60]. In both contexts, cultivated land and ecological land were significant sources of new construction land. For example, studies on the Pearl River Delta in China have shown that rapid industrialization and urbanization triggered large-scale conversion of cultivated land into construction land, driven by external forces such as FDI and internal processes like infrastructure development [54]. These transitions highlight the dual pressures of urban expansion and food production, as cultivated land loss intensifies concerns over agricultural sustainability while ecological land loss exacerbates environmental degradation.
Building on the preceding discussion, this study aimed to provide planning guidance for the sustainable expansion of construction land in the Ho Chi Minh City metropolitan area by improving land-use efficiency and regulating expansion patterns (Figure 9). Given that the region will continue to rely on an export-oriented economic model, strategic development should leverage port infrastructure and available low-cost land. Specifically, the study recommended establishing two primary growth corridors extending southeast and northeast. Additionally, enhancing the regional transportation network and developing a one-hour commuting zone centered on Ho Chi Minh City would facilitate more compact metropolitan growth. This approach would guide urban expansion along the proposed corridors—toward the southeastern coast and the northeastern inland areas—while promoting more sustainable and coordinated development.

6. Conclusions and Policy Implications

6.1. Conclusions

Against the backdrop of a new wave of international industrial transfer, this study explored the spatial characteristics and driving mechanisms of construction land expansion in the Ho Chi Minh City metropolitan area. The key findings were as follows: First, construction land in the metropolitan area has exhibited a continuous expansion trend, with the growth rate in the latter decade surpassing that of the former. Second, expansion primarily occurred through leapfrogging and edge-expansion patterns, extending towards surrounding county towns and along major transportation corridors. Third, the expansion process resulted in the large-scale conversion of wetland and cultivated land into construction land. Finally, the interplay of endogenous and exogenous forces served as the primary driver of construction land expansion.
While this study provided an in-depth analysis of construction land expansion patterns in emerging metropolitan regions and developed a multi-level analytical framework to explain the interaction between urbanization, industrialization, and globalization, certain limitations remain. For instance, as Vietnam and other emerging countries continue to develop rapidly, it is essential to conduct scenario-based simulations to predict future construction land expansion. Addressing this issue will be a key direction for future research, contributing to more precise regulation and management of land expansion in emerging metropolitan areas.

6.2. Policy Implications

As key destinations in the latest international industrial transfer, metropolitan areas in emerging countries are expected to continue experiencing construction land expansion. However, challenges, such as low land-use efficiency and the encroachment of wetland and cultivated land, remain inevitable. Therefore, this study drew insights from policy and spatial planning strategies in major metropolitan regions across the Global South, aiming to provide recommendations in two key areas.
The Ho Chi Minh City metropolitan area is expected to continue expanding toward the southeast and north, primarily through leapfrogging and edge expansion. As this expansion continues, the government must guide construction land growth in an orderly manner by formulating urban growth policies and enhancing land-use efficiency. To achieve this, four key strategies were recommended. First, designated growth areas should be strategically reserved in the southeastern and northern parts of Ho Chi Minh City. Second, new industrial parks should be developed with a focus on vertical expansion, encouraging multi-story industrial buildings to optimize land utilization. Third, drawing on the experiences of greenbelt planning in Europe, the optimal distance and width of green buffer zones should be carefully determined. Establishing a greenbelt around the city center would facilitate smart growth across the metropolitan area. Finally, prioritizing the development of a railway transit system will help establish an efficient one-hour commuting zone. This approach will not only improve connectivity between urban and suburban areas but also encourage the orderly and efficient use of construction land.
Implement policies for protecting wetlands and cultivated land to promote ecological stability and food security. Three key measures were proposed. First, production, living, and ecological spaces should be delineated, ensuring a balanced proportion among these land-use categories while maintaining their designated functions. Second, ecological protection plans should be developed to facilitate the gradual restoration of wetland, forests, and other ecological land in eastern Ho Chi Minh City. Third, lessons can be drawn from China’s basic cultivated land protection policies, such as the establishment of strict redlines to prevent arbitrary cultivated land conversion [61,62]. Lastly, to strengthen the regulation of land-use rights transfers, a well-structured land transaction market should be established. The government should align land acquisition policies with regional development plans, ensuring a balanced and strategic approach. Priority should be given to the development of industrial parks, while “public land” should be strictly reserved for infrastructure and public service facilities.

Author Contributions

Conceptualization, Y.L., and W.S.; methodology, Y.L., and J.Z.; formal analysis, Y.L., J.Z., and Z.G.; investigation, Y.L., J.Z., W.S., S.L., and Z.G.; data curation, J.Z., and Z.G.; writing—original draft preparation, Y.L., J.Z., and W.S.; writing—review and editing, Y.L., W.S., and S.L.; visualization, J.Z.; supervision, Y.L., and W.S.; funding acquisition, Y.L. All authors have read and agreed to the published version of the manuscript.

Funding

This research was funded by the National Natural Science Foundation of China, grant numbers 42271180 and 41871114.

Data Availability Statement

Some or all of the data, models, or codes that support the findings of this study are available from the corresponding author upon reasonable request.

Conflicts of Interest

The authors declare no conflicts of interest.

Abbreviations

The following abbreviations are used in this manuscript:
FDIForeign Direct Investment
LEILandscape Expansion Index

References

  1. Firman, T. The restructuring of Jakarta Metropolitan Area: A “global city” in Asia. Cities 1998, 15, 229–243. [Google Scholar] [CrossRef]
  2. Tran, D.; Pla, F.; Latorre-Carmona, P.; Myint, S.; Caetano, M.; Kieu, H. Characterizing the relationship between land use land cover change and land surface temperature. ISPRS J. Photogramm. Remote Sens. 2017, 124, 119–132. [Google Scholar] [CrossRef]
  3. Kalnay, E.; Cai, M. Impact of urbanization and land-use change on climate. Nature 2003, 423, 528–531. [Google Scholar] [CrossRef]
  4. Cohen, B. Urbanization in developing countries: Current trends, future projections, and key challenges for sustainability. Technol. Soc. 2006, 28, 63–80. [Google Scholar] [CrossRef]
  5. Seto, K.; Güneralp, B.; Hutyra, L. Global forecasts of urban expansion to 2030 and direct impacts on biodiversity and carbon pools. Proc. Natl. Acad. Sci. USA 2012, 109, 16083–16088. [Google Scholar] [CrossRef]
  6. Fang, C.; Yu, D. Urban agglomeration: An evolving concept of an emerging phenomenon. Landsc. Urban Plan. 2017, 162, 126–136. [Google Scholar] [CrossRef]
  7. Fang, C.; Yu, X.; Zhang, X.; Fang, J.; Liu, H. Big data analysis on the spatial networks of urban agglomeration. Cities 2020, 102, 102735. [Google Scholar] [CrossRef]
  8. Scott, A. Globalization and the rise of city-regions. Eur. Plan. Stud. 2001, 9, 813–826. [Google Scholar] [CrossRef]
  9. Yan, J.; Wang, J.; Su, F.; Liu, B. Morphology changes and the expansion of major port cities in the Philippines from 1990 to 2020. Cities 2024, 147, 104818. [Google Scholar] [CrossRef]
  10. Hara, Y.; Hiramatsu, A.; Honda, R.; Sekiyama, M.; Matsuda, H. Mixed land-use planning on the periphery of large Asian cities: The case of Nonthaburi Province, Thailand. Sustain. Sci. 2010, 5, 237–248. [Google Scholar] [CrossRef]
  11. Mulya, S.P.; Hudalah, D.; Prilandita, N.; Sakti, A.D. Spatio-temporal changes in agricultural land and rural–urban transitions in Greater Jakarta, Indonesia. Reg. Environ. Change 2024, 24, 145. [Google Scholar] [CrossRef]
  12. Rustiadi, E.; Pravitasari, A.E.; Setiawan, Y.; Mulya, S.P.; Pribadi, D.O.; Tsutsumida, N. Impact of continuous Jakarta megacity urban expansion on the formation of the Jakarta-Bandung conurbation over the rice farm regions. Cities 2021, 111, 103000. [Google Scholar] [CrossRef]
  13. Yang, Y.; Zhang, D.; Nan, Y.; Liu, Z.; Zheng, W. Modeling urban expansion in the transnational area of Changbai Mountain: A scenario analysis based on the zoned land use scenario dynamics-urban model. Sustain. Cities Soc. 2019, 50, 101622. [Google Scholar] [CrossRef]
  14. Manley, E.; Ogneva-Himmelberger, Y.; Ruelle, M.; Hanumantha, R.; Mazari-Hiriart, M.; Downs, T.J. Land-cover change and urban growth in the Mexico-Lerma-Cutzamala Hydrological Region, 1993–2018. Appl. Geogr. 2022, 147, 102785. [Google Scholar] [CrossRef]
  15. Wilson, E.H.; Hurd, J.D.; Civco, D.L.; Prisloe, M.P.; Arnold, C. Development of a geospatial model to quantify, describe and map urban growth. Remote Sens. Environ. 2003, 86, 275–285. [Google Scholar] [CrossRef]
  16. Berling-Wolff, S.; Wu, J. Modeling urban landscape dynamics: A case study in Phoenix, USA. Urban Ecosyst. 2004, 7, 215–240. [Google Scholar] [CrossRef]
  17. Dadashpoor, H.; Azizi, P.; Moghadasi, M. Analyzing spatial patterns, driving forces and predicting future growth scenarios for supporting sustainable urban growth: Evidence from Tabriz metropolitan area, Iran. Sustain. Cities Soc. 2019, 47, 101502. [Google Scholar] [CrossRef]
  18. Savini, F. Towards an urban degrowth: Habitability, finity and polycentric autonomism. Environ. Plan. A Econ. Space 2021, 53, 1076–1095. [Google Scholar] [CrossRef]
  19. Huang, J.; Lu, X.X.; Sellers, J.M. A global comparative analysis of urban form: Applying spatial metrics and remote sensing. Landsc. Urban Plan. 2007, 82, 184–197. [Google Scholar] [CrossRef]
  20. Kuang, W.; Chi, W.; Lu, D.; Dou, Y. A comparative analysis of megacity expansions in China and the U.S.: Patterns, rates and driving forces. Landsc. Urban Plan. 2014, 132, 121–135. [Google Scholar] [CrossRef]
  21. Dong, T.; Jiao, L.; Xu, G.; Yang, L.; Liu, J. Towards sustainability? Analyzing changing urban form patterns in the United States, Europe, and China. Sci. Total Environ. 2019, 671, 632–643. [Google Scholar] [CrossRef]
  22. Wei, G.; He, B.J.; Sun, P.; Liu, Y.; Li, R.; Ouyang, X.; Luo, K.; Li, S. Evolutionary trends of urban expansion and its sustainable development: Evidence from 80 representative cities in the belt and road initiative region. Cities 2023, 138, 104353. [Google Scholar] [CrossRef]
  23. Li, H.; Wei, Y.D.; Zhou, Y. Spatiotemporal analysis of land development in transitional China. Habitat Int. 2017, 67, 79–95. [Google Scholar] [CrossRef]
  24. Dadashpoor, H.; Ahani, S. Explaining objective forces, driving forces, and causal mechanisms affecting the formation and expansion of the peri-urban areas: A critical realism approach. Land Use Policy 2021, 102, 105232. [Google Scholar] [CrossRef]
  25. Zhang, C.; Jing, X.; Wang, Z.; Chen, H. Belt and Road Initiative and Urban Landscapes: Quantifying Land Use Changes and Development Strategies in Minsk, Vientiane, and Djibouti. Land 2025, 14, 875. [Google Scholar] [CrossRef]
  26. Huang, Z.; Wei, Y.D.; He, C.; Li, H. Urban expansion under economic transition in China: A multi-level modeling analysis. Habitat Int. 2015, 47, 69–82. [Google Scholar] [CrossRef]
  27. Gong, J.; Hu, Z.; Chen, W.; Liu, Y.; Wang, J. Urban expansion dynamics and modes in metropolitan Guangzhou, China. Land Use Policy 2018, 72, 100–109. [Google Scholar] [CrossRef]
  28. Li, G.D.; Sun, S.; Fang, C.L. The varying driving forces of urban expansion in China: Insights from a spatial-temporal analysis. Landsc. Urban Plan. 2018, 174, 63–77. [Google Scholar] [CrossRef]
  29. Wei, Y.D.; Li, H.; Yue, W. Urban land expansion and regional inequality in transitional China. Landsc. Urban Plan. 2017, 163, 17–31. [Google Scholar] [CrossRef]
  30. Jiao, L.; Liu, J.; Xu, G.; Dong, T.; Gu, Y.; Zhang, B.; Liu, Y.; Liu, X. Proximity Expansion Index: An improved approach to characterize evolution process of urban expansion. Comput. Environ. Urban Syst. 2018, 70, 102–112. [Google Scholar] [CrossRef]
  31. You, H.; Yang, X. Urban expansion in 30 megacities of China: Categorizing the driving force profiles to inform the urbanization policy. Land Use Policy 2017, 68, 531–551. [Google Scholar] [CrossRef]
  32. Feng, Y.; Wang, X.; Du, W.; Liu, J.; Li, Y. Spatiotemporal characteristics and driving forces of urban sprawl in China during 2003–2017. J. Clean. Prod. 2019, 241, 118061. [Google Scholar] [CrossRef]
  33. Wu, R.; Wang, J.; Zhang, D.; Wang, S. Identifying different types of urban land use dynamics using Point-of-interest (POI) and Random Forest algorithm: The case of Huizhou, China. Cities 2021, 114, 103202. [Google Scholar] [CrossRef]
  34. Fan, P.; Ouyang, Z.; Nguyen, D.D.; Nguyen, T.T.H.; Park, H.; Chen, J. Urbanization, economic development, environmental and social changes in transitional economies: Vietnam after Doimoi. Landsc. Urban Plan. 2019, 187, 145–155. [Google Scholar] [CrossRef]
  35. Phan, D.C.; Trung, T.H.; Truong, V.T.; Sasagawa, T.; Vu, T.P.T.; Bui, D.T.; Hayashi, M.; Tadono, T.; Nasahara, K.N. First comprehensive quantification of annual land use/cover from 1990 to 2020 across mainland Vietnam. Sci. Rep. 2021, 11, 9979. [Google Scholar] [CrossRef]
  36. Kontgis, C.; Schneider, A.; Fox, J.; Saksena, S.; Spencer, J.H.; Castrence, M. Monitoring peri-urbanization in the greater Ho Chi Minh City metropolitan area. Appl. Geogr. 2014, 53, 377–388. [Google Scholar] [CrossRef]
  37. United Nations. World Urbanization Prospects: The 2010 Revision; United Nations Department of Economic and Social Affairs, Population Division: New York, NY, USA, 2011. [Google Scholar]
  38. Goldblatt, R.; Deininger, K.; Hanson, G. Utilizing publicly available satellite data for urban research: Mapping built-up land cover and land use in Ho Chi Minh City, Vietnam. Dev. Eng. 2018, 3, 83–99. [Google Scholar] [CrossRef]
  39. Thinh, N.K.; Kamalipour, H. Mapping informal/formal morphologies over time: Explore urban transformations in Vietnam. Cities 2024, 152, 105168. [Google Scholar] [CrossRef]
  40. Schaefer, M.; Thinh, N.X. Evaluation of Land Cover Change and Agricultural Protection Sites: A GIS and Remote Sensing Approach for Ho Chi Minh City, Vietnam. Heliyon 2019, 5, e01773. [Google Scholar] [CrossRef]
  41. Downes, N.K.; Storch, H.; Viet, P.Q.; Diem, N.K. Assessing Peri-Urbanisation and Urban Transitions between 2010 and 2020 in Ho Chi Minh City using and Urban Structure Type Approach. Urban Sci. 2024, 8, 11. [Google Scholar] [CrossRef]
  42. Zhang, X.; Zhao, T.; Xu, H.; Liu, W.; Wang, J.; Chen, X.; Liu, L. GLC_FCS30D: The first global 30 m land-cover dynamics monitoring product with a fine classification system for the period from 1985 to 2022 generated using dense-time-series Landsat imagery and the continuous change-detection method. Earth Syst. Sci. Data 2024, 16, 1353–1381. [Google Scholar] [CrossRef]
  43. Xu, C.; Liu, M.; Zhang, C.; An, S.; Yu, W.; Chen, J.M. The spatiotemporal dynamics of rapid urban growth in the Nanjing metropolitan region of China. Landsc. Ecol. 2007, 22, 925–937. [Google Scholar] [CrossRef]
  44. Jia, W.X.; Zhao, S.Q. Trends and drivers of land surface temperature along the urban-rural gradients in the largest urban agglomeration of China. Sci. Total Environ. 2020, 711, 134579. [Google Scholar] [CrossRef] [PubMed]
  45. Liu, R.; Gao, M.; Xie, F. Simulation and Analysis of Land Use Patterns Based on Logistic Regression Model—A Case Study of Turpan. Res. Soil Water Conserv. 2009, 16, 74–78. [Google Scholar]
  46. Yang, Y.; Zhou, C.; Wu, B. Urban expansion prediction for Zhangzhou city based on GIS and spatiotemporal logistic regression model. J. Geo-Inf. Sci. 2011, 13, 374–382. [Google Scholar] [CrossRef]
  47. Wei, Y.D.; Liefner, I. Globalization, industrial restructuring, and regional development in China. Appl. Geogr. 2012, 32, 102–105. [Google Scholar] [CrossRef]
  48. Meyer, K.E.; Nguyen, H.V. Foreign investment strategies and sub-national institutions in emerging markets: Evidence from Vietnam. J. Manag. Stud. 2005, 42, 63–93. [Google Scholar] [CrossRef]
  49. World Bank. Vietnam’s Urbanization at a Crossroads: Embarking on an Efficient, Inclusive, and Resilient Pathway; Publishing and Knowledge Division, The World Bank: Washington, DC, USA, 2020. [Google Scholar]
  50. Li, C.; Li, J.; Wu, J. Quantifying the speed, growth modes, and landscape pattern changes of urbanization: A hierarchical patch dynamics approach. Landsc. Ecol. 2013, 28, 1875–1888. [Google Scholar] [CrossRef]
  51. Rifat, S.A.A.; Liu, W. Quantifying spatiotemporal patterns and major explanatory factors of urban expansion in Miami Metropolitan Area during 1992–2016. Remote Sens. 2019, 11, 2493. [Google Scholar] [CrossRef]
  52. Li, Y.; Kong, X.; Zhu, Z. Multiscale analysis of the correlation patterns between the urban population and construction land in China. Sustain. Cities Soc. 2020, 61, 102326. [Google Scholar] [CrossRef]
  53. Chakraborty, S.; Maity, I.; Patel, P.P.; Dadashpoor, H.; Pramanik, S.; Follmann, A.; Novotný, J.; Roy, U. Spatio-temporal patterns of urbanization in the Kolkata Urban Agglomeration: A dynamic spatial territory-based approach. Sustain. Cities Soc. 2021, 67, 102715. [Google Scholar] [CrossRef]
  54. Yang, R.; Zhang, J.; Xu, Q.; Luo, X.L. Urban-rural spatial transformation process and influences from the perspective of land use: A case study of the Pearl River Delta Region. Habitat Int. 2020, 104, 102234. [Google Scholar] [CrossRef]
  55. Alam, T.; Banerjee, A. Characterizing land transformation and densification using urban sprawl metrics in the South Bengal region of India. Sustain. Cities Soc. 2023, 89, 104295. [Google Scholar] [CrossRef]
  56. Li, Y.; Monzur, T. The spatial structure of employment in the metropolitan region of Tokyo: A scale-view. Urban Geogr. 2018, 39, 236–262. [Google Scholar] [CrossRef]
  57. Liang, Y.; Zeng, J.; Sun, W.; Zhou, K.; Zhou, Z. Expansion of construction land along the motorway in rapidly developing areas in Cambodia. Land Use Policy 2021, 109, 105691. [Google Scholar] [CrossRef]
  58. Weilenmann, B.; Seidl, I.; Schulz, T. The socio-economic determinants of urban sprawl between 1980 and 2010 in Switzerland. Landsc. Urban Plan. 2017, 157, 468–482. [Google Scholar] [CrossRef]
  59. Zhao, C.; Weng, Q.; Hersperger, A.M. Characterizing the 3-D urban morphology transformation to understand urban-form dynamics: A case study of Austin, Texas, USA. Landsc. Urban Plan. 2020, 203, 103881. [Google Scholar] [CrossRef]
  60. Xiao, R.; Yin, H.; Liu, R.; Zhang, Z.; Chinzorig, S.; Qin, K.; Tan, W.; Wan, Y.; Gao, Z.; Xu, C.; et al. Exploring the relationship between land use change patterns and variation in environmental factors within urban agglomeration. Sustain. Cities Soc. 2024, 108, 105447. [Google Scholar] [CrossRef]
  61. Gillen, J.; Bunnell, T.; Rigg, J. Geographies of ruralization. Dialogues Hum. Geogr. 2022, 12, 186–203. [Google Scholar] [CrossRef]
  62. Pei, B.; Chen, S. The spatio-temporal variations of cultivated land compensation efficiency and its influencing factors in mainland China. Ecol. Indic. 2024, 166, 112596. [Google Scholar] [CrossRef]
Figure 1. Location map of Ho Chi Minh City metropolitan area.
Land 14 01253 g001
Figure 2. Land-use changes of Ho Chi Minh City metropolitan area. (a) Land use in 2000; (b) land use in 2005; (c) land use in 2010; (d) land use in 2015; (e) land use in 2020.
Land 14 01253 g002
Figure 3. Construction land expansion pattern changes in Ho Chi Minh City metropolitan area, 2000–2020. (a) 2000–2010; (b) 2010–2020.
Land 14 01253 g003
Figure 4. Changes in the construction land of the trunks’ 10 km buffer belts. (a) Construction land in 2000; (b) expansion of construction land in 2010; (c) expansion of construction land in 2020.
Land 14 01253 g004
Figure 5. Conversion of land types to construction land in the Ho Chi Minh City metropolitan area, 2000–2020.
Land 14 01253 g005
Figure 6. Changes in FDI in the Ho Chi Minh City metropolitan area from 2000 to 2020. Source: The World Bank and statistical yearbooks of Vietnam and its regions (2000–2020).
Land 14 01253 g006
Figure 7. Changes in construction land around some industrial parks in Binh Duong. The satellite imagery maps are sourced from Google Maps’ historical imagery for the years 2017 and 2023.
Land 14 01253 g007aLand 14 01253 g007b
Figure 8. The driving mechanisms of globalization, industrialization, and urbanization on the expansion of construction land.
Land 14 01253 g008
Figure 9. Near-term “point-axis model” (a) and long-term “multi-cluster network model” (b) in the Ho Chi Minh City metropolitan area.
Land 14 01253 g009
Table 1. Temporal Dynamics of Centroid Migration for Construction Land (2000–2020).
YearX Coordinate (Longitude)Y Coordinate (Latitude)Migration Distance (m)Migration Rate (m/a)
2000106.6510.76--
2005106.6810.753643.31728.66
2010106.7410.9421,537.704307.54
2015106.6510.7621,777.624355.52
2020106.9310.8432,109.166421.83
Table 2. Driving factors index system.
Variable TypeUnit
Dependent variableY1-Changes in construction land (2000–2010)0 or 10–1
Y2-Changes in construction land (2010–2020)0 or 10–1
Independent variableNatural backgroundTerrainElevationContinuousm
SlopeContinuous°
GlobalizationGlobal investmentForeign direct investmentContinuousdollars
IndustrializationIndustrialization indexIndustrialization indexContinuous
Industrial parkDistance to the industrial parkContinuouskm
Transport infrastructureDistance to the trunkContinuouskm
Distance to the primary roadContinuouskm
Distance to the secondary roadContinuouskm
Distance to the waterwayContinuouskm
LaborNumber of populationsContinuousperson
UrbanizationCapital cityDistance to the capital cityContinuouskm
CountyDistance to the countyContinuouskm
Nighttime lightNighttime lightContinuous
Table 3. Driving factors analysis for construction land changes in 2000–2020.
Coef.Robust Std. Err. ztP > |z|
(a) 2000–2010
Elevation0.761 ***0.04317.8360.000
Foreign direct investment0.417 ***0.0874.7690.000
Distance to the industrial park−0.372 ***0.124−3.0090.003
Distance to the trunk−1.483 ***0.119−12.5030.000
Distance to the primary road−0.891 ***0.114−7.8080.000
Distance to the secondary road−1.939 ***0.194−10.0190.000
Number of populations0.202 ***0.0277.4850.000
Distance to the capital city0.323 ***0.1092.9720.003
Distance to the county−0.875 ***0.167−5.2420.000
Nighttime light1.036 ***0.1526.8190.000
(b) 2010–2020
Elevation0.316 ***0.0457.0180.000
Industrialization index−4.459 ***0.913−4.8850.000
Distance to the industrial park−0.519 ***0.109−4.7700.000
Distance to the trunk−1.548 ***0.106−14.6310.000
Distance to the primary road−0.532 ***0.123−4.3250.000
Distance to the secondary road−1.159 ***0.173−6.7020.000
Distance to the waterways0.547 ***0.1244.4000.000
Number of populations0.220 ***0.0297.6230.000
Distance to the capital city−0.268 ***0.104−2.5920.010
Distance to the county−0.547 ***0.157−3.4870.000
Nighttime light1.655 ***0.09118.2250.000
Note: *** represents significance levels of 1%.
Disclaimer/Publisher’s Note: The statements, opinions and data contained in all publications are solely those of the individual author(s) and contributor(s) and not of MDPI and/or the editor(s). MDPI and/or the editor(s) disclaim responsibility for any injury to people or property resulting from any ideas, methods, instructions or products referred to in the content.

