Article

Optimizing Phosphorus Fertilization for Enhanced Yield and Nutrient Efficiency of Wheat (Triticum aestivum L.) on Saline–Alkali Soils in the Yellow River Delta, China

1
State Key Laboratory of Nutrient Use and Management, Institute of Agricultural Resources and Environment, Shandong Academy of Agricultural Sciences, Jinan 250100, China
2
National Center of Technology Innovation for Comprehensive Utilization of Saline–Alkali Land, Institute of Modern Agriculture on Yellow River Delta of SAAS, Dongying 257091, China
3
China Irrigation and Drainage Development Center, Beijing 100054, China
4
College of Water Resources and Civil Engineering, China Agricultural University, Beijing 100083, China
*
Authors to whom correspondence should be addressed.
Land 2025, 14(6), 1241; https://doi.org/10.3390/land14061241
Submission received: 26 February 2025 / Revised: 6 May 2025 / Accepted: 14 May 2025 / Published: 9 June 2025

Abstract

As the global food crisis worsens, enhancing crop yields on saline–alkali soils has become a critical measure for ensuring global food security. Wheat (Triticum aestivum L.), one of the world’s most important staple crops, is particularly sensitive to phosphorus availability, making appropriate phosphorus fertilization a key and manageable strategy to optimize yield. Although many studies have explored phosphorus fertilization strategies, most have focused on non-saline soils or generalized conditions, leaving a critical gap in understanding how phosphorus application affects wheat yield, soil nutrient dynamics, and nutrient uptake efficiency under saline–alkali stress. Therefore, further investigation is required to establish phosphorus management practices specifically adapted to saline–alkali environments for sustainable wheat production. To address this gap, the experiment was designed with varying phosphorus fertilizer application rates based on P2O5 content (0, 60 kg/hm2, 120 kg/hm2, 180 kg/hm2, and 240 kg/hm2), considering only the externally applied phosphorus without accounting for the inherent phosphorus content of the soil. The results indicated that as the phosphorus application rate increased, the wheat yield first increased and then decreased. The highest yield (6355 kg·hm−2) was achieved when the phosphorus application rate reached 120 kg/hm2, with an increase of 47.2–63.5% compared to the control (no fertilizer). Similarly, biomass, thousand-grain weight, and the absorption of nitrogen, phosphorus, and potassium in both straw and grains exhibited the same increasing-then-decreasing trend. Mechanistic analysis revealed that phosphorus fertilization enhanced soil alkali–hydrolyzable nitrogen, available phosphorus, and available potassium, thereby promoting nutrient uptake and ultimately improving grain yield. The innovations of this study lie in its focus on phosphorus management specifically under saline–alkali soil conditions, its integration of soil nutrient changes and plant physiological responses, and its identification of the optimal phosphorus application threshold for balancing yield improvement and nutrient efficiency. These findings provide a scientific basis for refining phosphorus fertilization strategies to sustainably boost wheat productivity in saline–alkali environments.

1. Introduction

The severity of the global food crisis has reached an all-time high [1]. Increasing crop yields on saline–alkali soils is recognized as a crucial measure to ensure global food security. Saline–alkali land covers approximately 1 billion hectares worldwide, spanning over 100 countries [2,3], this extensive distribution underscores the considerable potential for its reclamation and agricultural utilization [4,5]. For instance, China has about 9913 hectares of saline–alkali land, of which coastal saline–alkali land exceeds 0.14 hectares, accounting for 10.37% of the nation’s arable land [6]. The Yellow River Delta (YRD) in China is a typical coastal saline–alkali land. The salinity ranges from 0.2 to 4.6 g/kg in coastal saline–alkali soils in China, which is a serious menace to crop productivity and decreases grain yield by 10–90% [6,7]. Wheat (Triticum aestivum L.) is one of the most important staple crops grown in saline–alkali soils worldwide; however, its yield is often limited by soil salinity [8,9]. The Yellow River Delta (YRD) in China is a typical coastal saline–alkali region, where such conditions pose significant challenges to crop production [6,7,10]. Therefore, increasing wheat yield under saline–alkali soil conditions is considered one of the effective approaches to alleviating the global food crisis.
Phosphorus is an essential nutrient for wheat growth, and its appropriate application can significantly enhance wheat yield [11,12,13]. As a result, phosphorus supplementation is essential during cultivation to ensure adequate nutrient supply [14]. Nevertheless, prolonged excessive phosphorus application can contribute to soil degradation [15,16], Moreover, overuse not only diminishes phosphorus use efficiency (PUE) but also negatively impacts the uptake efficiency of other essential nutrients, such as nitrogen [17,18], ultimately leading to a decline in crop yield [19]. Therefore, many experts and scholars have explored the optimal phosphorus application rates in different regions. Li et al. (2013) [20] proposed that applying phosphorus at a rate of 120 kg/hm2 could enhance nutrient utilization efficiency from fertilizers while promoting optimal wheat yields, while Jiang et al. (2006) [21] identified 108 kg/hm2 as the optimal phosphorus application rate for wheat. However, these studies have primarily focused on non-saline soils or generalized conditions, with limited attention to the specific challenges posed by saline–alkali environments. In summary, research on the impact and underlying mechanisms of phosphorus application rates on wheat yield under saline–alkali conditions remains scarce. Moreover, there is a lack of comprehensive analysis linking soil nutrient dynamics, plant nutrient uptake, and yield responses under salinity stress. To address these gaps, the present study systematically investigates the effects of varying phosphorus application rates on soil nutrient availability, wheat nutrient uptake, and yield formation in coastal saline–alkali soils. By integrating field experiments with mechanistic pathway analysis, this research aims to refine phosphorus fertilization strategies tailored for saline–alkali environments, thus contributing new insights into sustainable nutrient management and productivity enhancement under saline stress.
Based on the pressing need to enhance wheat productivity in coastal saline–alkali regions, this study aims to systematically evaluate the effects of different phosphorus application rates on wheat growth and yield. The specific objectives are as follows: (1) To quantify the impact of varying phosphorus application rates on wheat yield and associated agronomic traits under saline–alkali soil conditions; (2) To elucidate the physiological and soil nutrient pathways through which phosphorus fertilization influences yield formation, and to assess the relative contributions of key factors; (3) To identify the optimal phosphorus application rate that maximizes wheat yield while maintaining nutrient use efficiency and minimizing environmental risks. This study is intended to provide a scientific basis for refining phosphorus fertilization strategies in saline–alkali soils, thereby contributing to sustainable nutrient management and crop productivity improvement in affected regions.

2. Materials and Methods

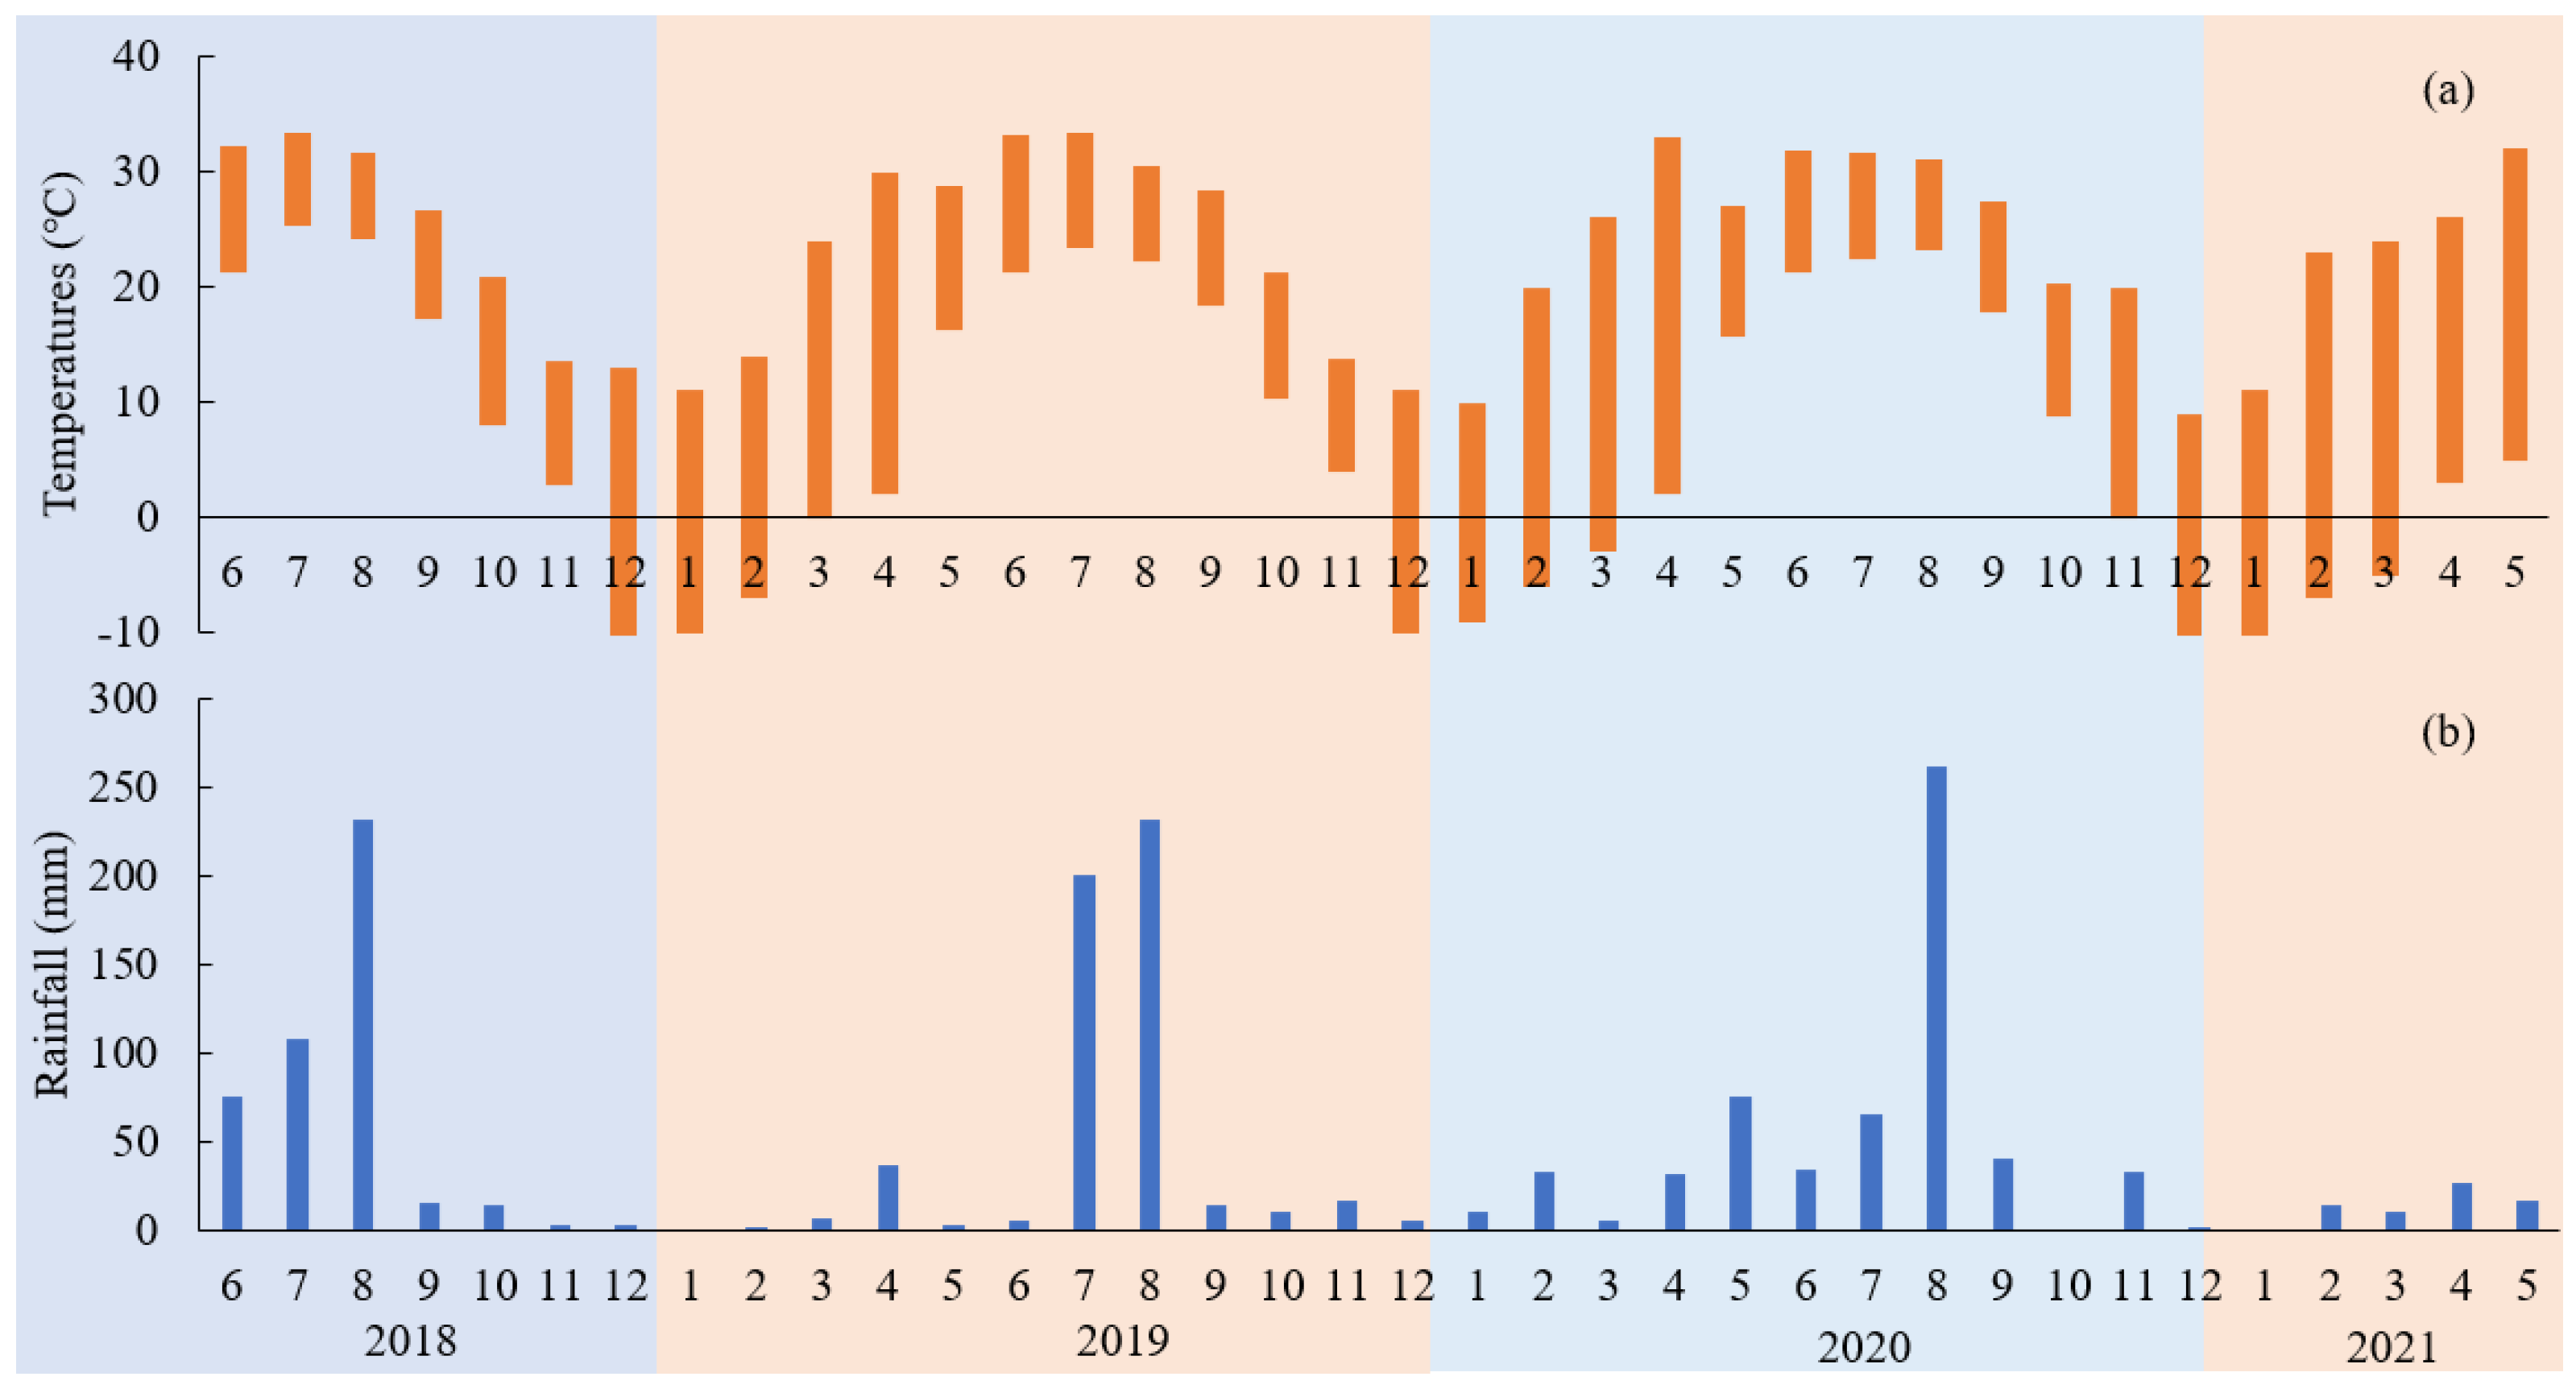
2.1. Experimental Site

The field experiment was conducted at Shuofeng Family Farm, located in Wudi County, Binzhou City, Shandong Province, China (37.77° N, 117.63° E). The study area is characterized by a temperate monsoon climate, with hot, humid summers and cold, dry winters. Meteorological conditions during the experimental period, including monthly temperature and rainfall, are presented in Figure 1. The soils at the study site are classified as coastal saline–alkali soils, with moderate salinity stress affecting crop growth. The baseline physical and chemical properties of the experimental soils before treatment application are summarized in Table 1, including parameters such as soil organic matter content, alkali–hydrolyzable nitrogen, available phosphorus, and available potassium concentrations. These properties provided the initial conditions upon which different phosphorus fertilizer treatments were evaluated in this study.
In this study, the soils at the experimental site were classified as “saline–alkali soils” according to local soil survey standards and regional agricultural management practices in the Yellow River Delta. Although the measured electrical conductivity (EC) values were lower than 2 dS·m−1, the soils were characterized by moderate salinity stress and alkali tendencies, including high pH and periodic surface salt accumulation during certain seasons. It should be noted that the soil salinity classification in this study was based on local definitions rather than international criteria (such as EC ≥ 4 dS·m−1, exchangeable sodium percentage (ESP), or sodium adsorption ratio (SAR)). Future research will incorporate comprehensive soil salinity characterization using internationally recognized indices to further refine soil classification and interpretation.

2.2. Experimental Design

Previous experimental studies have indicated that phosphorus application rates around 100–120 kg P2O5·hm−2 are often optimal for wheat production under both saline and non-saline soil conditions [20,21]. Based on these findings, the present study was designed with five phosphorus fertilization treatments: T1: no phosphorus fertilizer application; T2: phosphorus (P2O5) applied at 60 kg/hm2; T3: phosphorus(P2O5) applied at 120 kg/hm2; T4: phosphorus(P2O5) applied at 180 kg/hm2; T5: phosphorus(P2O5) applied at 240 kg/hm2. Nitrogen was applied at 210 kg/hm2, and potassium at 90 kg kg/hm2, with nitrogen applied in a basal-to-topdressing ratio of 1:1, while phosphorus and potassium fertilizers were fully applied as basal fertilizers. Urea (46% N), superphosphate (16% P2O5), and potassium sulfate (50% K2O) were used as the sources of nitrogen, phosphorus, and potassium, respectively. The wheat cultivar used was Jimai 22, a variety well-adapted to saline–alkali environments. The seeding rate was 225 kg·hm−2. Standard agronomic management practices were applied uniformly across all treatments, including manual weed control, conventional flood irrigation scheduled according to crop growth stages, and pest management following local agricultural extension guidelines. No growth regulators were used during the growing season. The experiment was arranged in a randomized complete block design with three replicates, and each plot covered an area of 40 m2.
At wheat harvest, biomass was assessed by collecting samples from a 0.42 m2 area (0.6 m × 3 rows). Additionally, wheat plant height, the number of grains per spike, and thousand-grain weight were recorded. Grain yield was determined by harvesting a 4.2 m2 area (9 rows × 2.0 m) within each plot. Soil samples for moisture content and nutrient analysis were collected at the wheat harvest stage, with three replicates per treatment, and the average values were used for analysis. After harvest, samples of wheat grain and straw were collected, oven-dried at 65 °C until constant weight, ground, and analyzed for nutrient concentrations. Nitrogen concentrations were determined using the Kjeldahl method [22], while phosphorus and potassium concentrations were analyzed according to the methods described by Yan et al. (2020) [23]. Phosphorus was quantified using the molybdenum blue colorimetric method, while potassium was measured by flame photometry. Nutrient uptake for each element was calculated by multiplying the corresponding concentration by the dry biomass weight of grain or straw. Soil moisture content was determined using the gravimetric method. Samples were collected from the 0–20 cm, 20–40 cm, and 40–60 cm soil layers during key wheat growth stages. The measurements represent total soil water content rather than specifically plant-available water content.

2.3. Data Analysis

Based on the approach described by Ma et al. (2025) [24], the physiological efficiency of nitrogen (NPE), phosphorus (PPE), and potassium (KPE) was calculated using Equations (1)–(3):
N P E = G Y G N U + S N U
P P E = G Y G P U + S P U
K P E = G Y G K U + S K U
where, GY denotes grain yield, kg; GNU denotes the nitrogen uptake of grain; GPU denotes the phosphorus uptake of grain; GKU denotes the potassium uptake of grain; SNU denotes the nitrogen uptake of straw; SPU denotes the phosphorus uptake of straw; and SKU denotes the potassium uptake of straw.

2.4. Statistical Analysis

A two-way analysis of variance (ANOVA) was performed to evaluate the effects of phosphorus fertilizer rates, year (2018–2020), and their interaction on wheat yield, biomass yield, nutrient uptake, and nutrient use efficiency parameters. Phosphorus treatment and year were considered as fixed factors. Where significant effects were found, means were compared using Dunnett’s test at significance levels of p < 0.05 (*) and p < 0.01 (**). All statistical analyses were conducted using SPSS software (version 20.0, IBM, Chicago, IL, USA). Additionally, structural equation model analysis (SEMA) was utilized to assess the relationships among grain yield, soil nutrients, and wheat nutrient parameters.

3. Results and Analysis

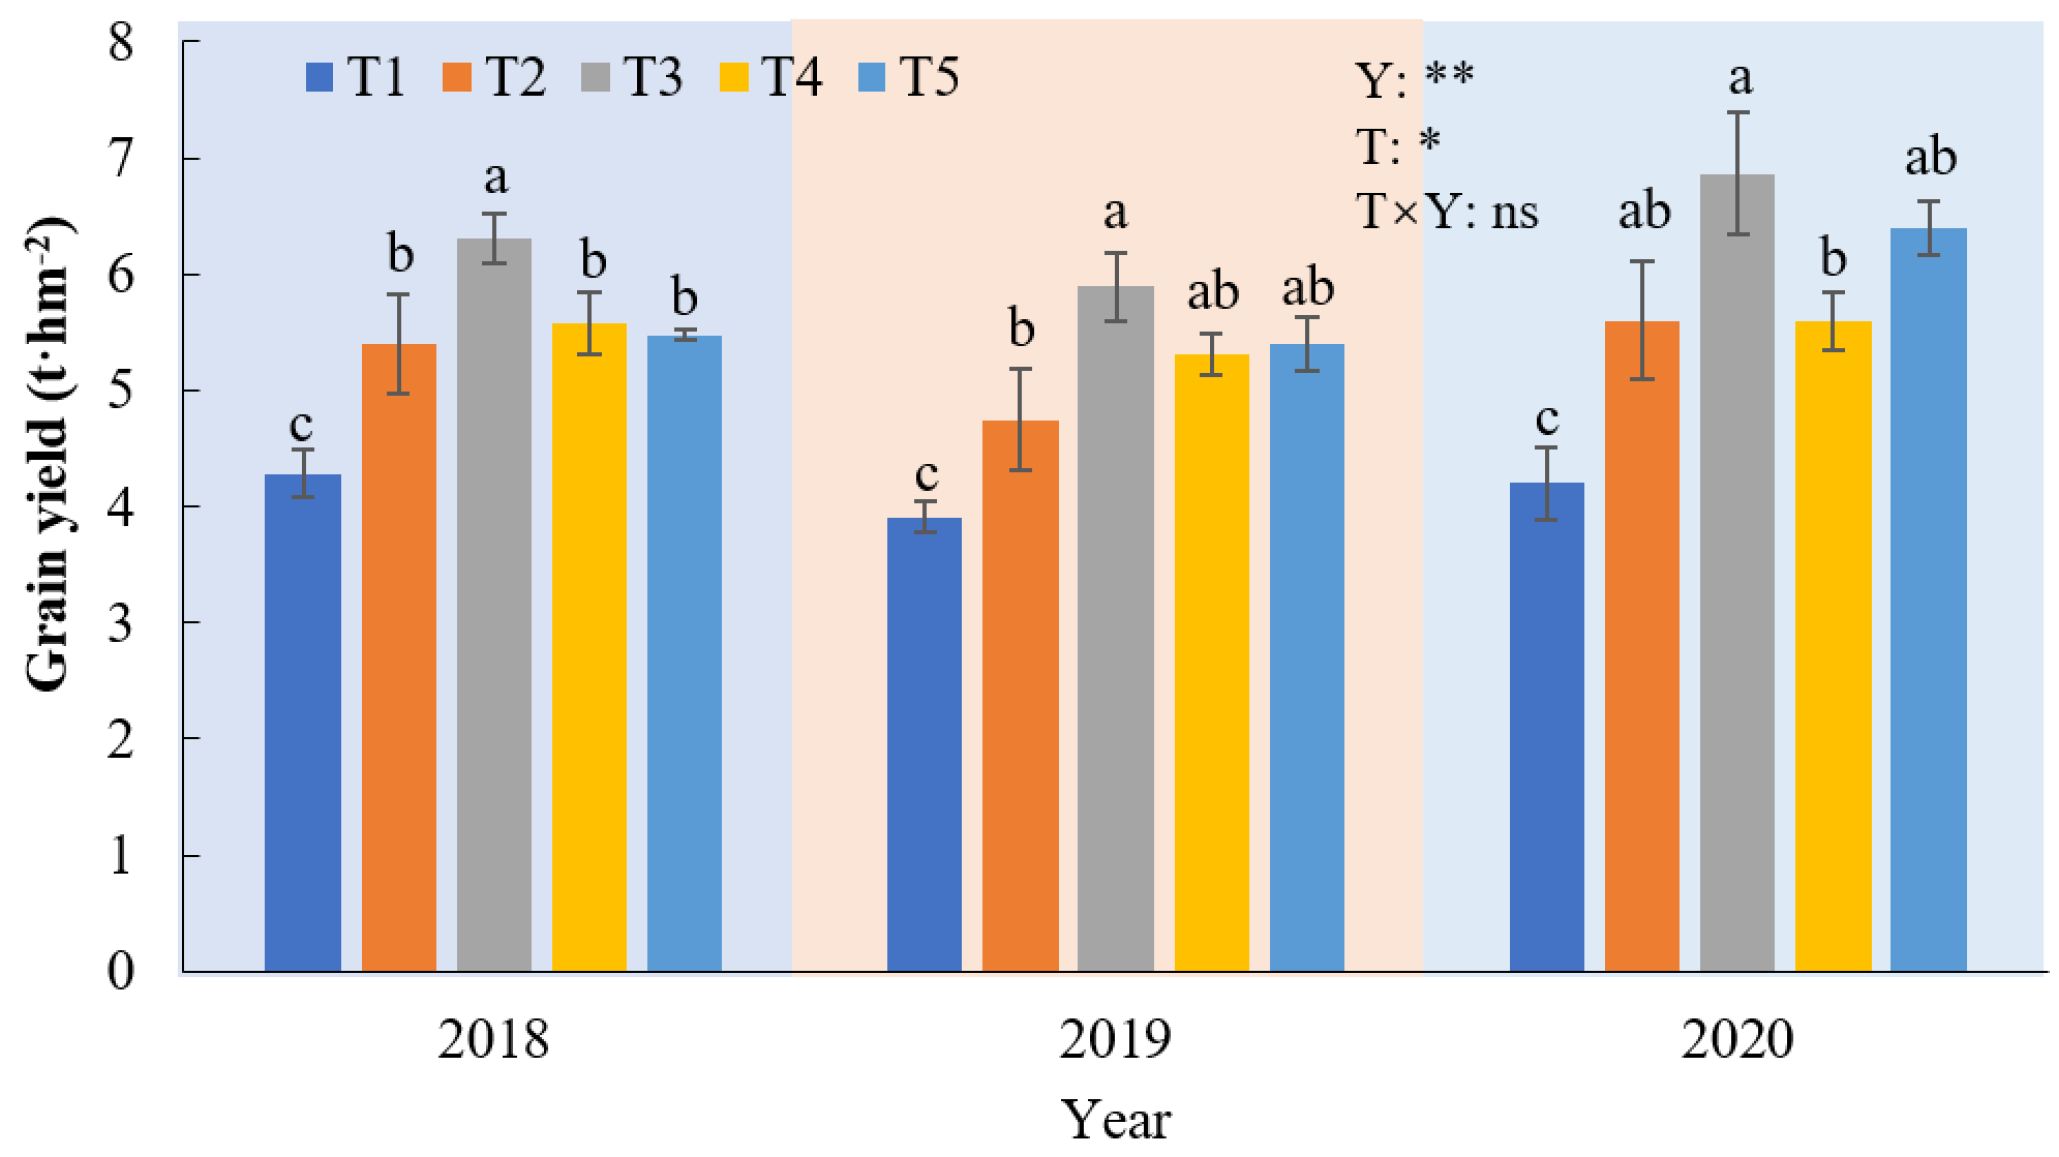
3.1. Effects of Phosphate Fertilizer Application on Yield

The wheat grain yield is shown in Figure 2. Wheat yield exhibited a trend of first increasing and then decreasing as phosphorus application rates increased (p < 0.05), with the highest yield achieved at the phosphorus application rate of T3. Over the three seasons, compared to the no-phosphorus treatment (T1), the yields increased by 21.4–33.3%, 47.2–63.5%, 30.2–35.9%, and 27.8–52.3% under phosphorus application rates of T2, T3, T4, T5, respectively.

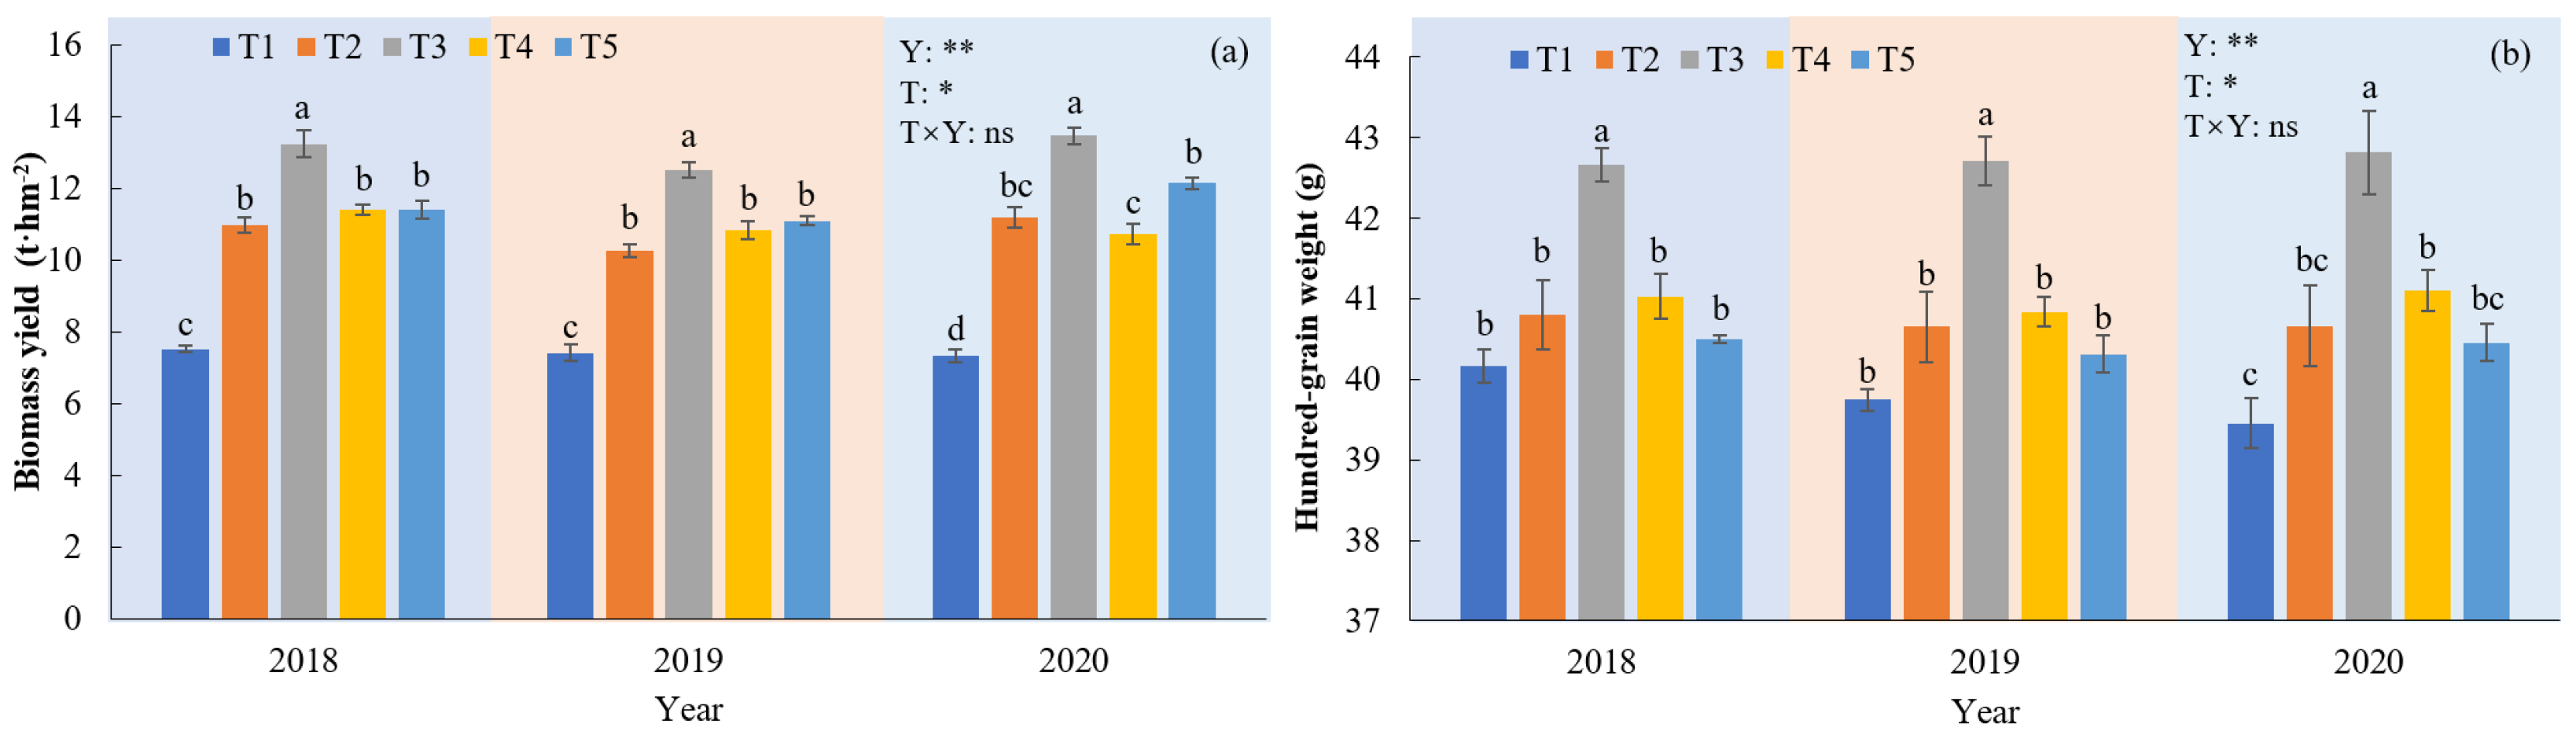
3.2. Effects of Phosphate Fertilizer Application on Wheat Biomass Yield and Thousand-Grain Weight

The biomass yield (BY) and thousand-grain weight (TGW) of wheat are shown in Figure 3. Both BY and TGW followed a trend of first increasing and then decreasing as phosphorus application rates increased (p < 0.05). Over the three seasons, compared to the no-phosphorus treatment (T1), biomass increased by 38.2–52.7%, 68.5–83.6%, 46.1–51.7%, and 49.4–65.5%, and thousand-grain weight increased by by 1.62–3.11%, 6.24–8.5%, 2.14–4.22%, and 0.812–2.53% under phosphorus application rates of T2, T3, T4, T5, respectively.

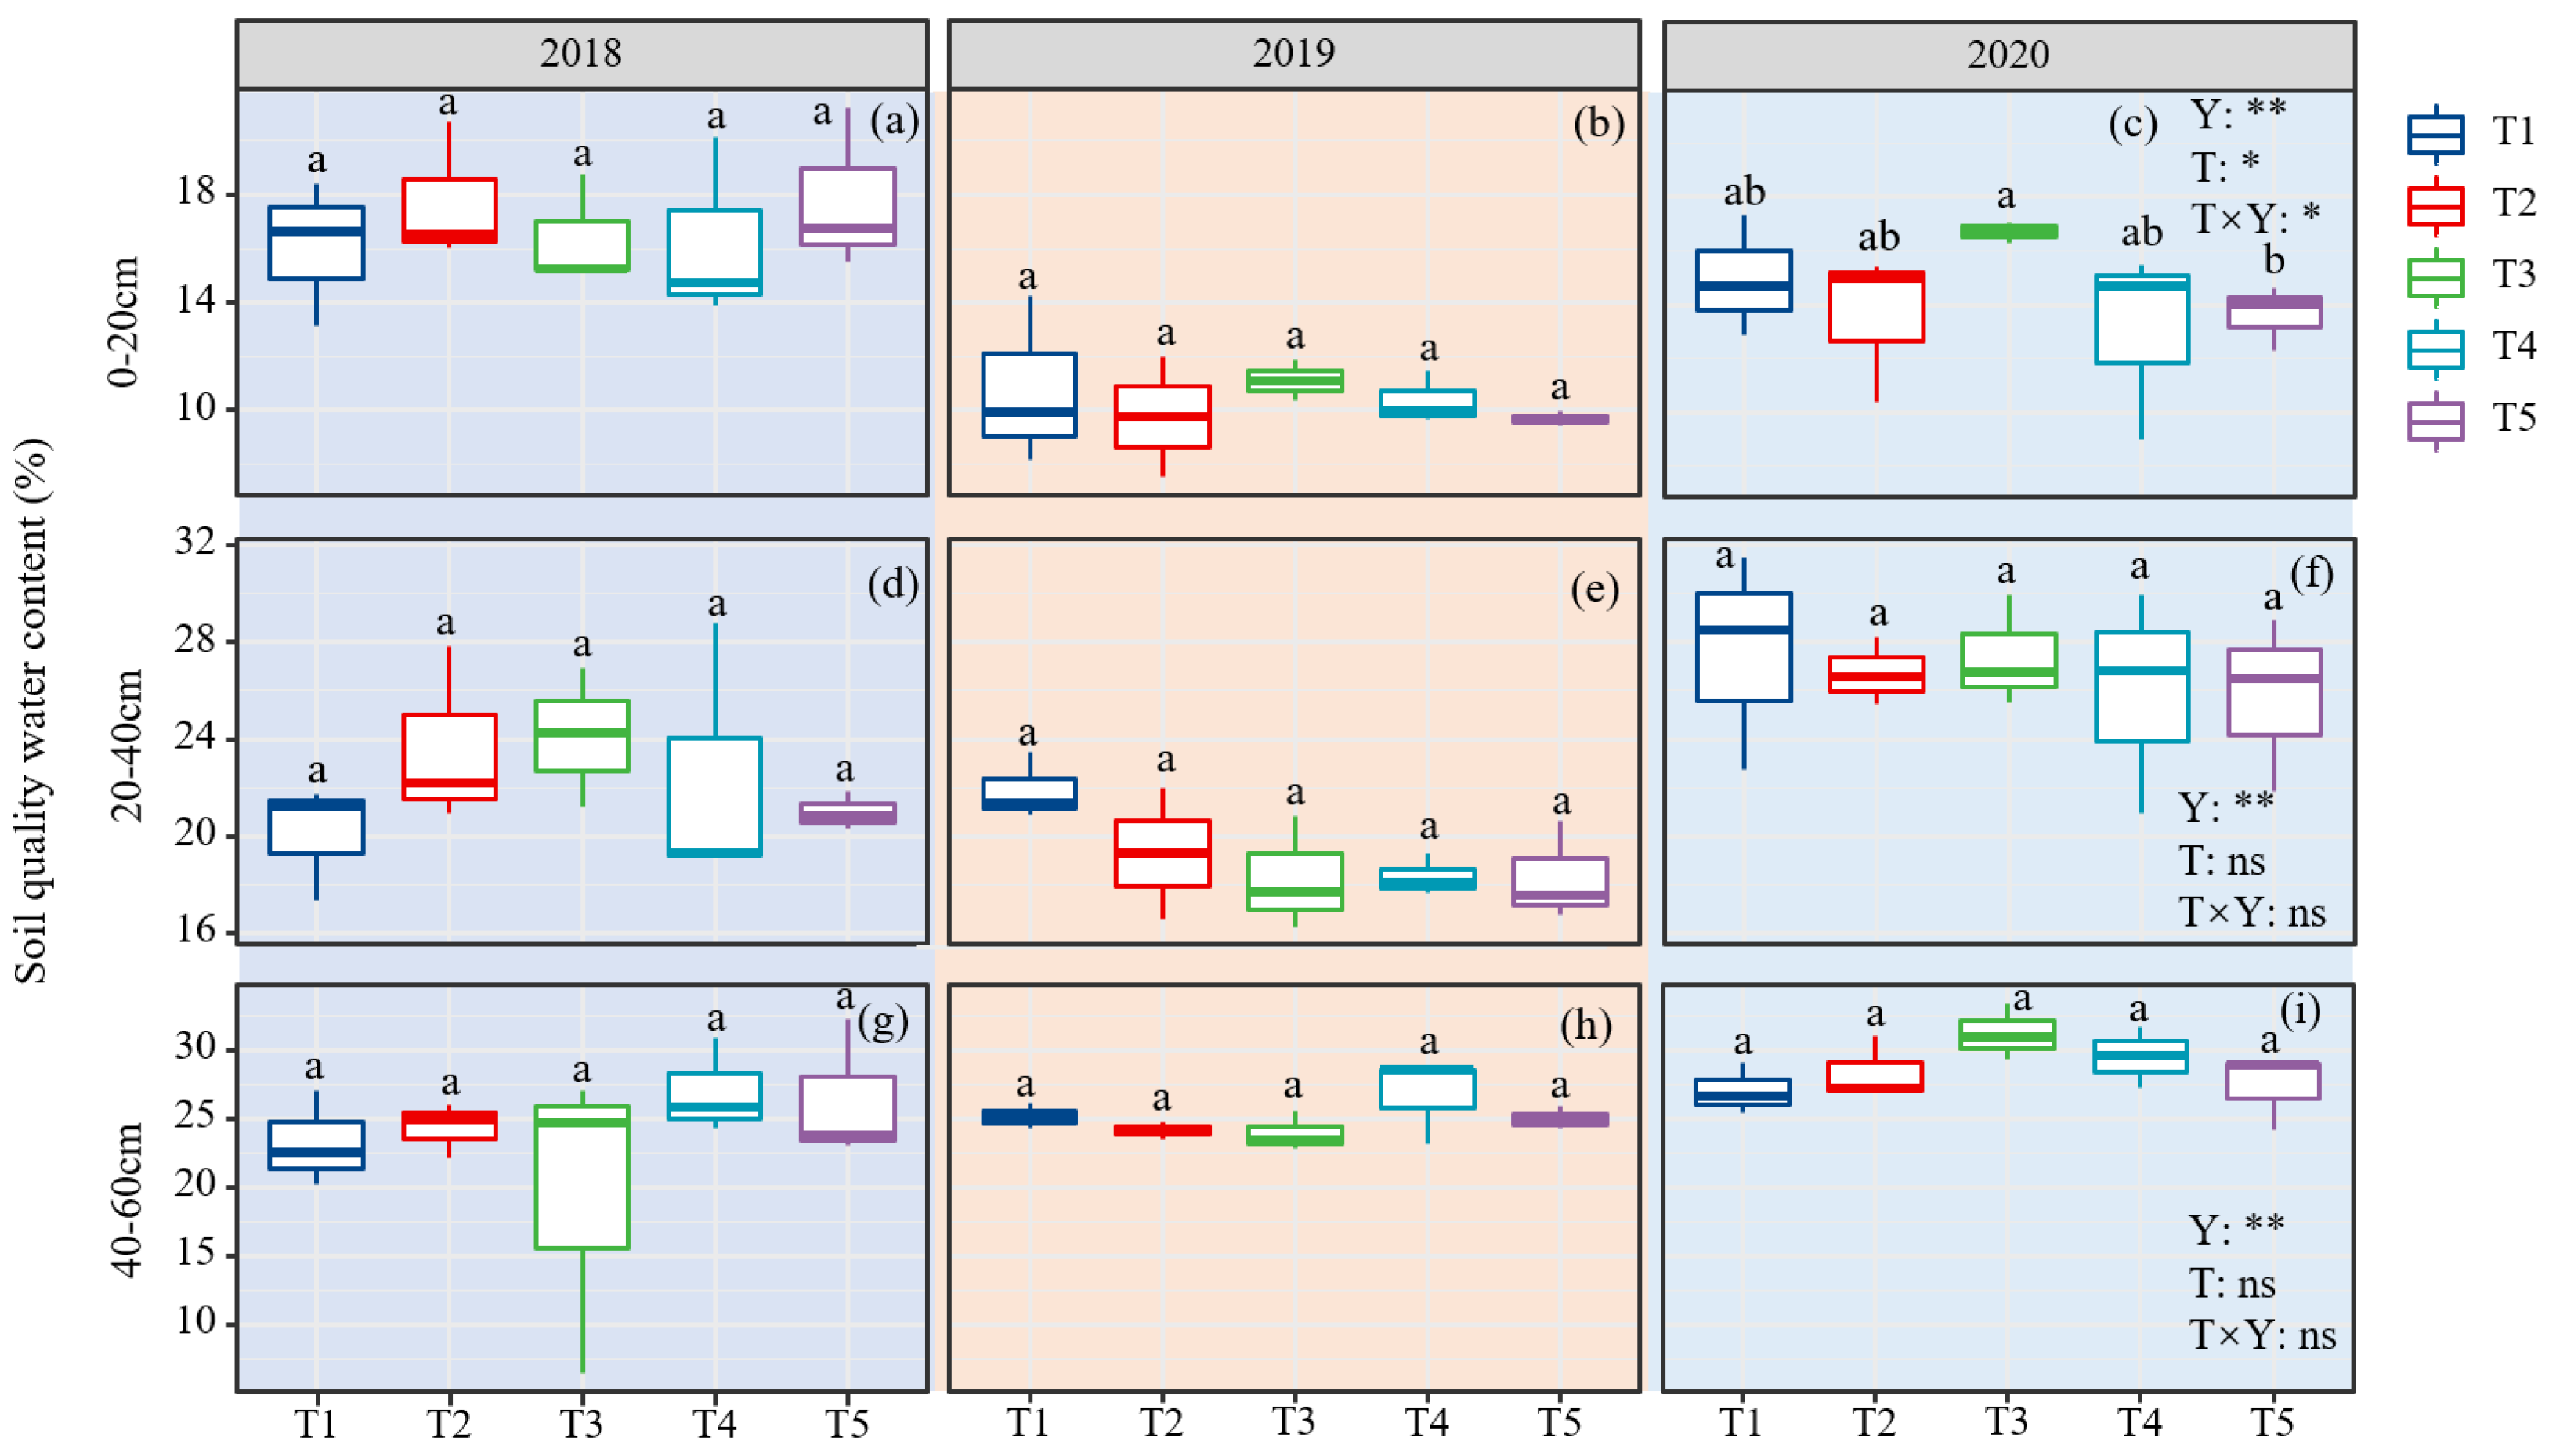
3.3. Effects of Phosphate Fertilizer Application on Soil Quality Water Content

The soil water content is shown in Figure 4. Seasonal variations had a significant impact on soil moisture content (p < 0.05). Soil moisture content exhibited an increasing trend with depth. Compared to the 0–20 cm layer, the average moisture content in the 20–40 cm and 40–60 cm layers increased by 25.08–103.02% and 37.15–158.02%, respectively.

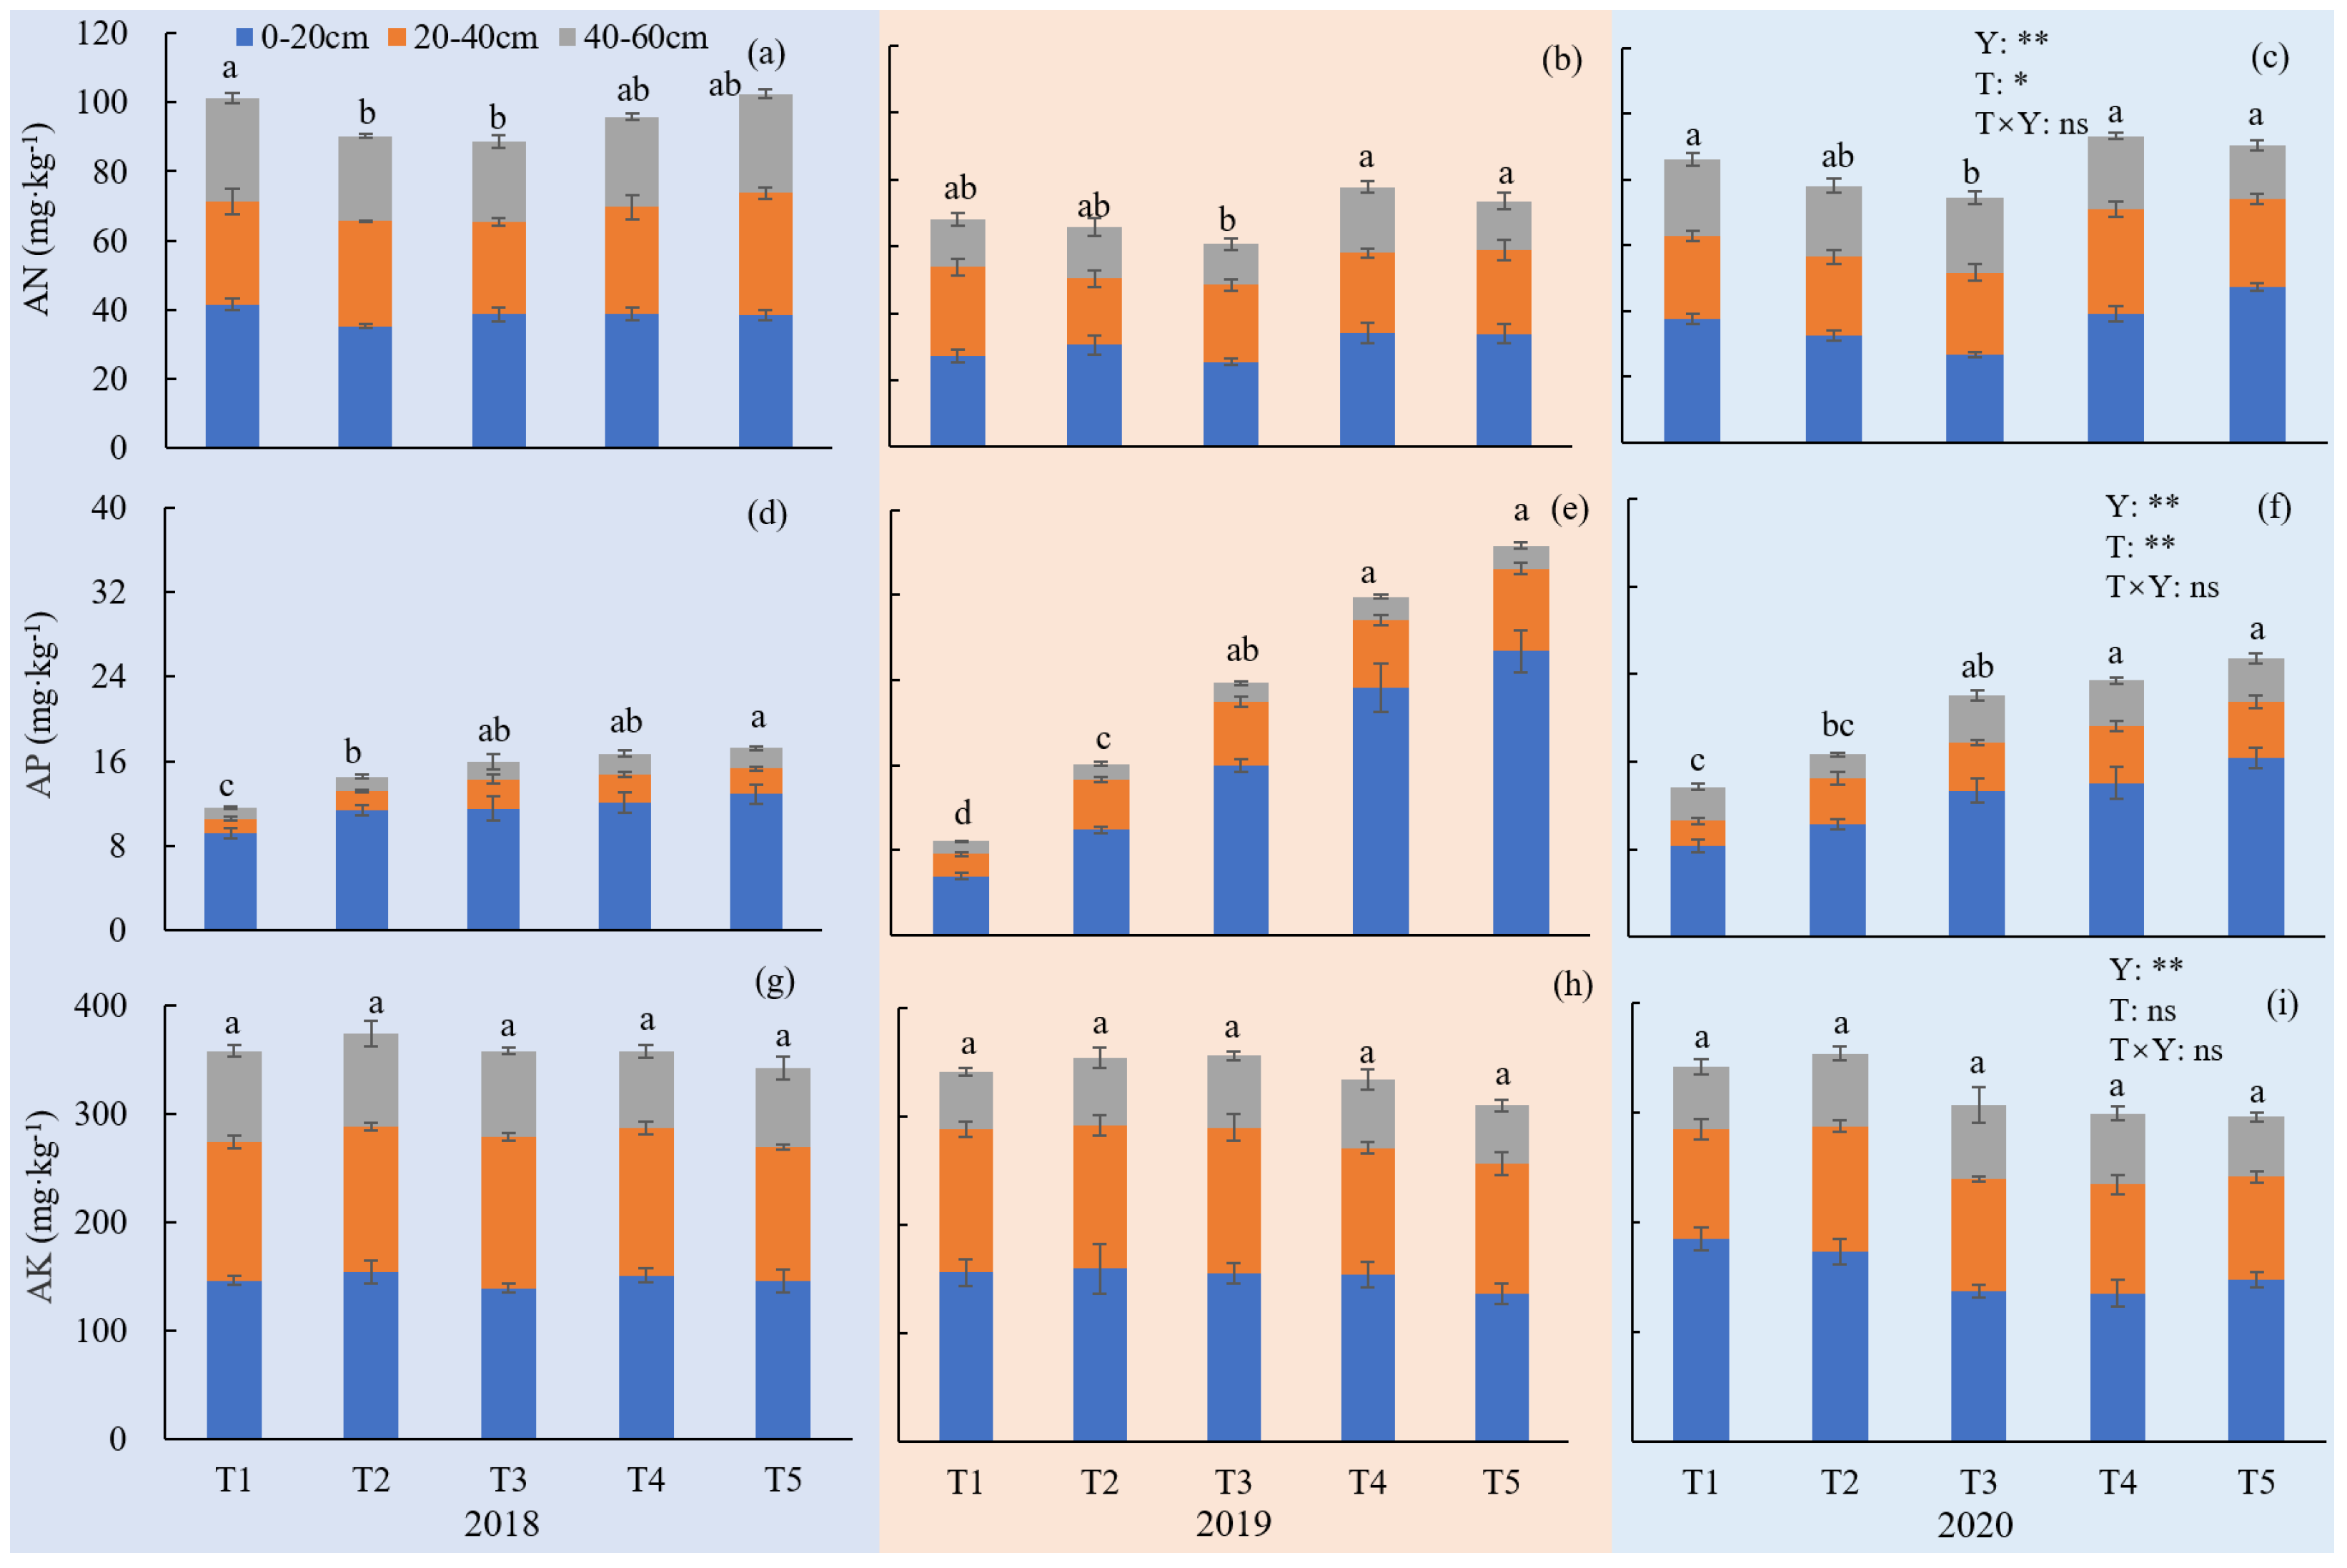
3.4. Effects of Phosphate Fertilizer Application on Soil Nutrients

The concentrations of alkali–hydrolyzable nitrogen, available phosphorus, and available potassium in the soil after wheat harvest are presented in Figure 5. Phosphorus application had a significant effect on soil nutrient status. Compared to the no-phosphorus treatment (T1), phosphorus application increased post-harvest soil available phosphorus by 21.8% to 314.7% across the T2 to T5 treatments. The increase was particularly notable under higher phosphorus application rates (T4 and T5). In contrast, alkali–hydrolyzable nitrogen showed variable responses. Under the T2 and T4 treatments, the changes ranged from slight decreases to moderate increases (between approximately −10% and +14% relative to T1), suggesting that phosphorus application indirectly influenced nitrogen mineralization dynamics. These changes in soil nutrient availability, particularly the substantial enhancement in available phosphorus, were positively associated with the observed improvements in wheat biomass accumulation and grain yield under saline–alkaline soil conditions.

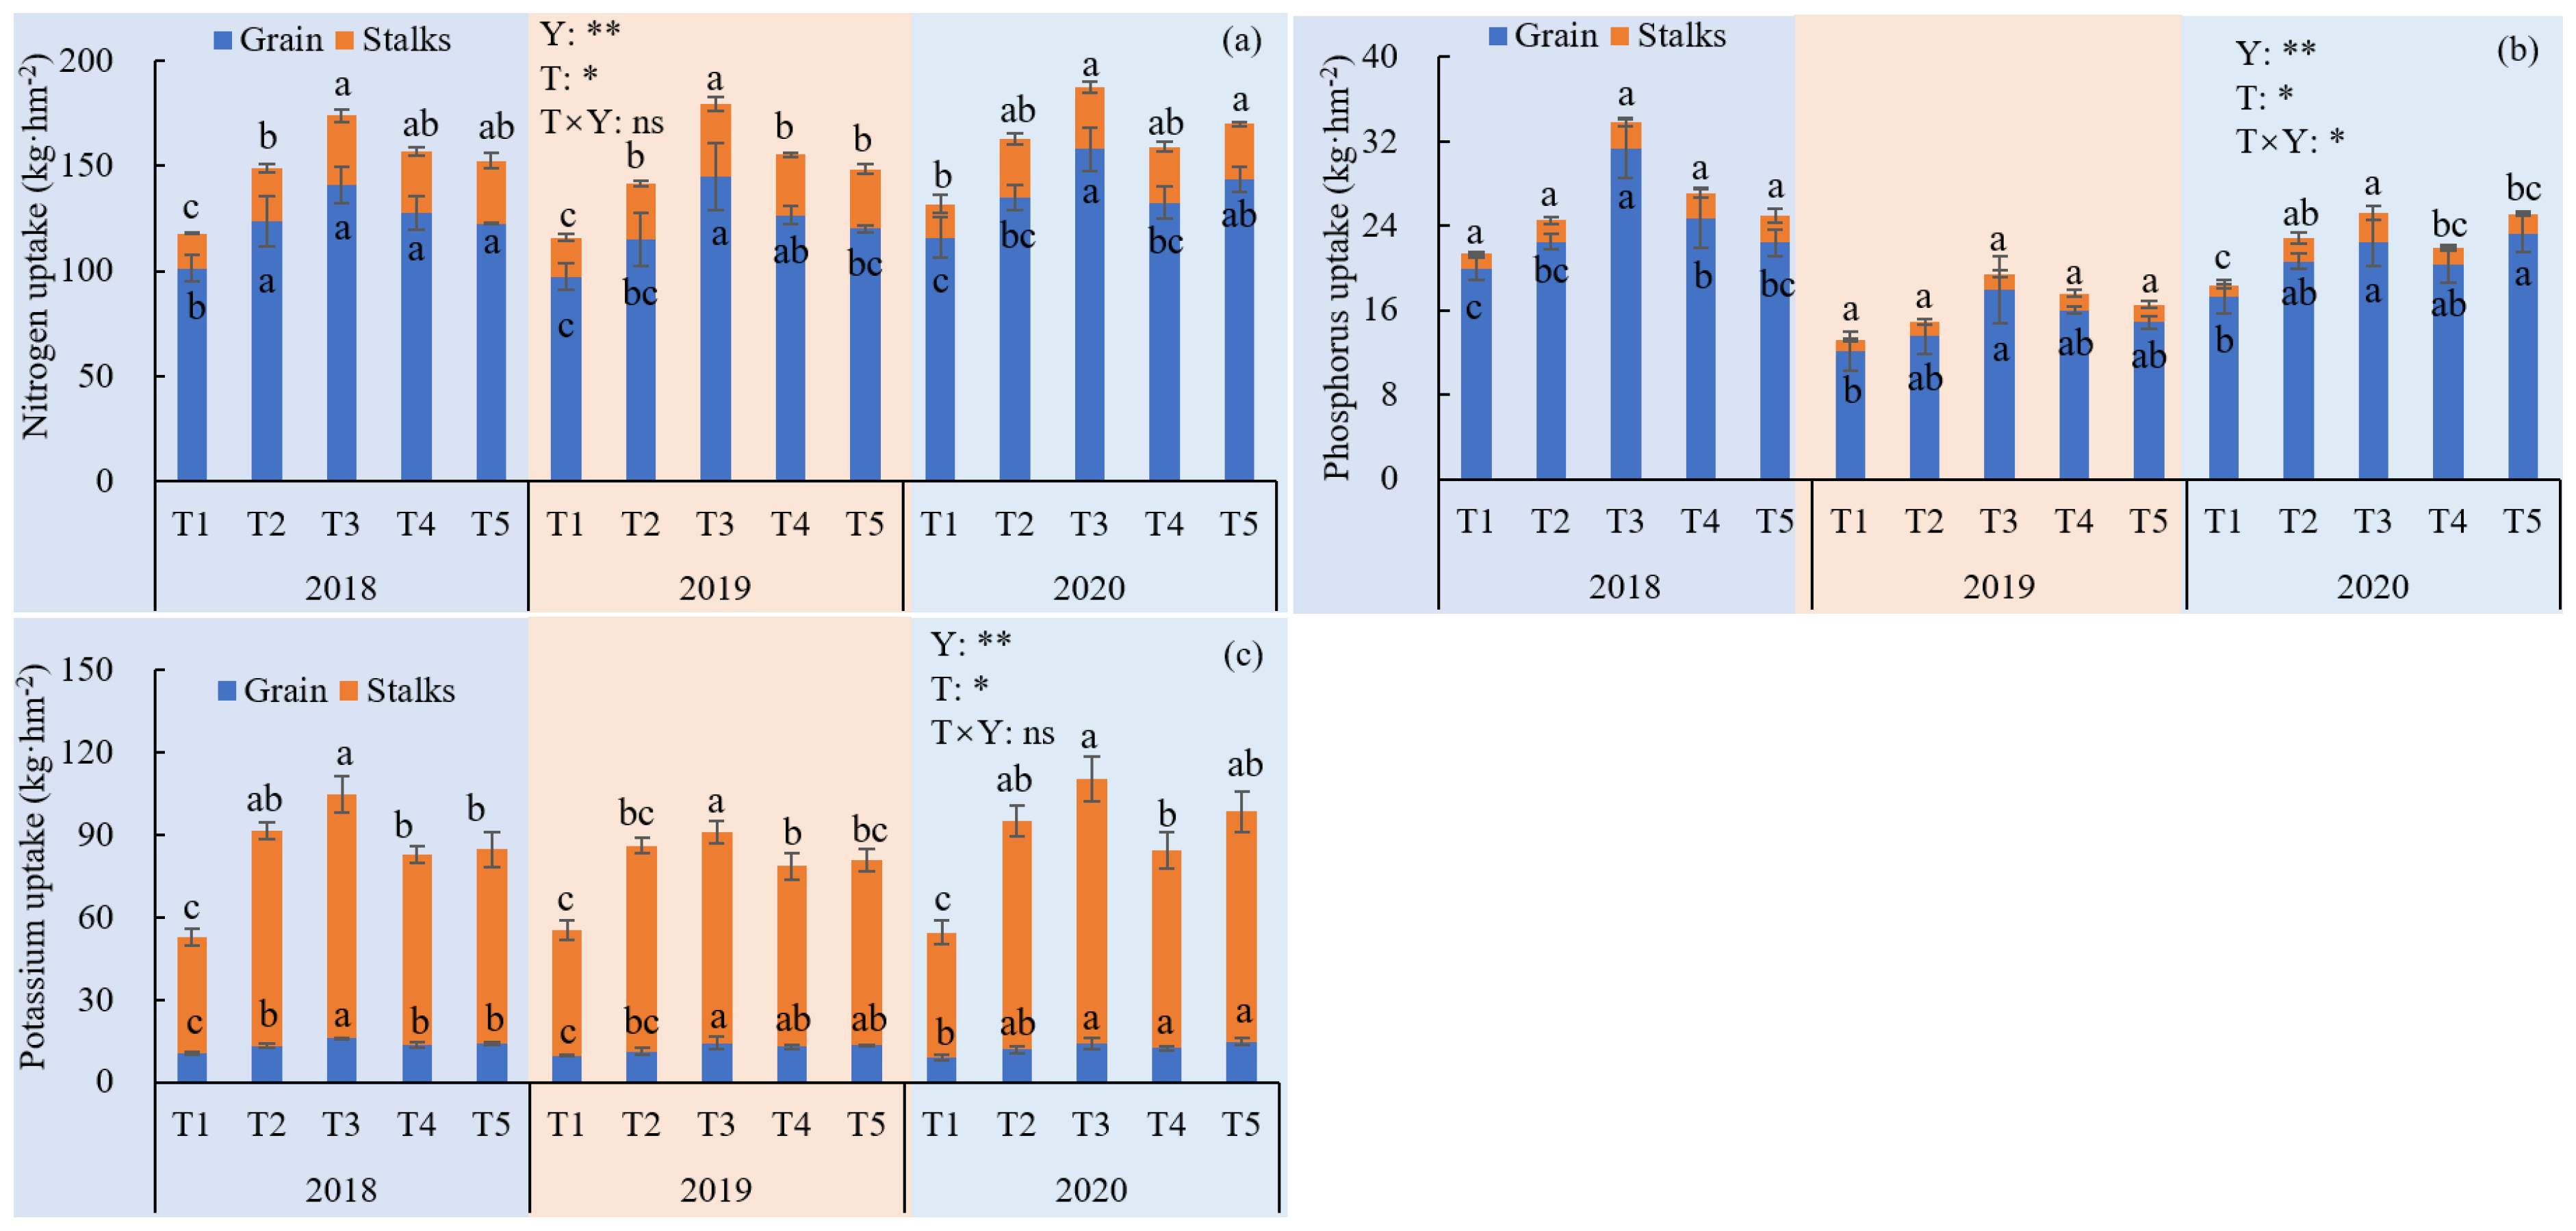
3.5. Effects of Phosphate Fertilizer Application on Plant Nutrients

The total nitrogen (N), phosphorus (P), and potassium (K) uptake in wheat straw and grain are shown in Figure 6 and Table 2. Phosphorus application significantly influenced nutrient uptake, with the most pronounced effect observed on phosphorus uptake itself. Compared to the no-phosphorus treatment (T1), grain phosphorus uptake increased by 11.5–19.5%, 29.6–56.8%, 17.4–31.9%, and 12.1–34.9% under the T2, T3, T4, and T5 treatments, respectively. Similarly, straw phosphorus uptake increased by 32.2–113.7%, 42.9–171.5%, 49.0–65.8%, and 58.3–77.8%, respectively. Although nitrogen and potassium uptakes also exhibited some variations, these changes were less consistent than those observed for phosphorus. The uniform application of N and K fertilizers across all treatments ensured that the observed differences were primarily attributable to phosphorus fertilization effects. These findings suggest that enhanced phosphorus availability under appropriate fertilization rates effectively improved wheat nutrient acquisition and yield performance under saline–alkali soil conditions.

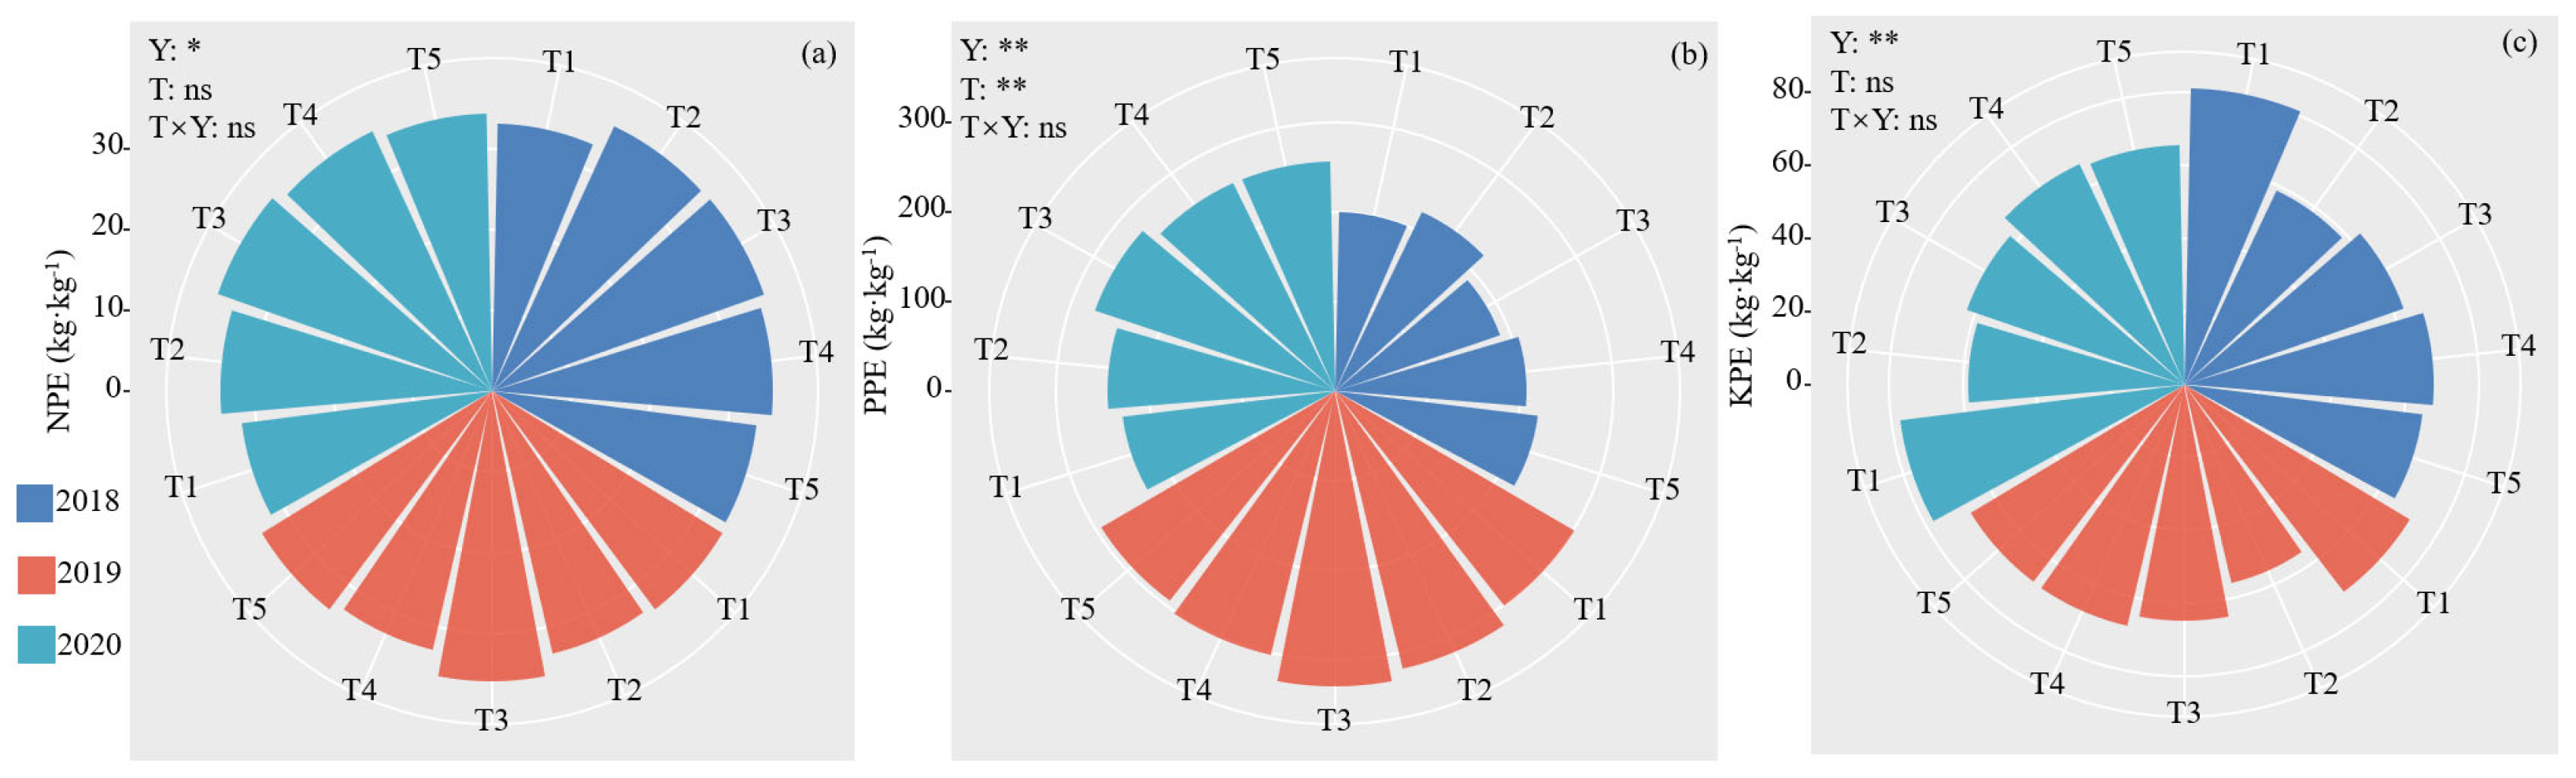
3.6. Effects of Phosphate Fertilizer Application on Production Efficiency

The nitrogen, phosphorus, and potassium use efficiencies of wheat are shown in Figure 7. Nitrogen and phosphorus use efficiencies increased with higher phosphorus application rates, while potassium use efficiency decreased as phosphorus application increased. Compared to the no-phosphorus treatment (T1), nitrogen use efficiency increased by 1.52–9.57%, 5.92–14.9%, 0.225–11.3%, and 1.14–7.78%, while phosphorus use efficiency increased by 5.81–9.91%, 0.545–18.9%, 0.016–11.8%, and 0.637–11.5% under the T2, T3, T4, T5 phosphorus treatments, respectively. In contrast, potassium use efficiency decreased by 21.9–27.7%, 9.32–22.2%, 5.11–16.7%, and 5.43–19.8%.

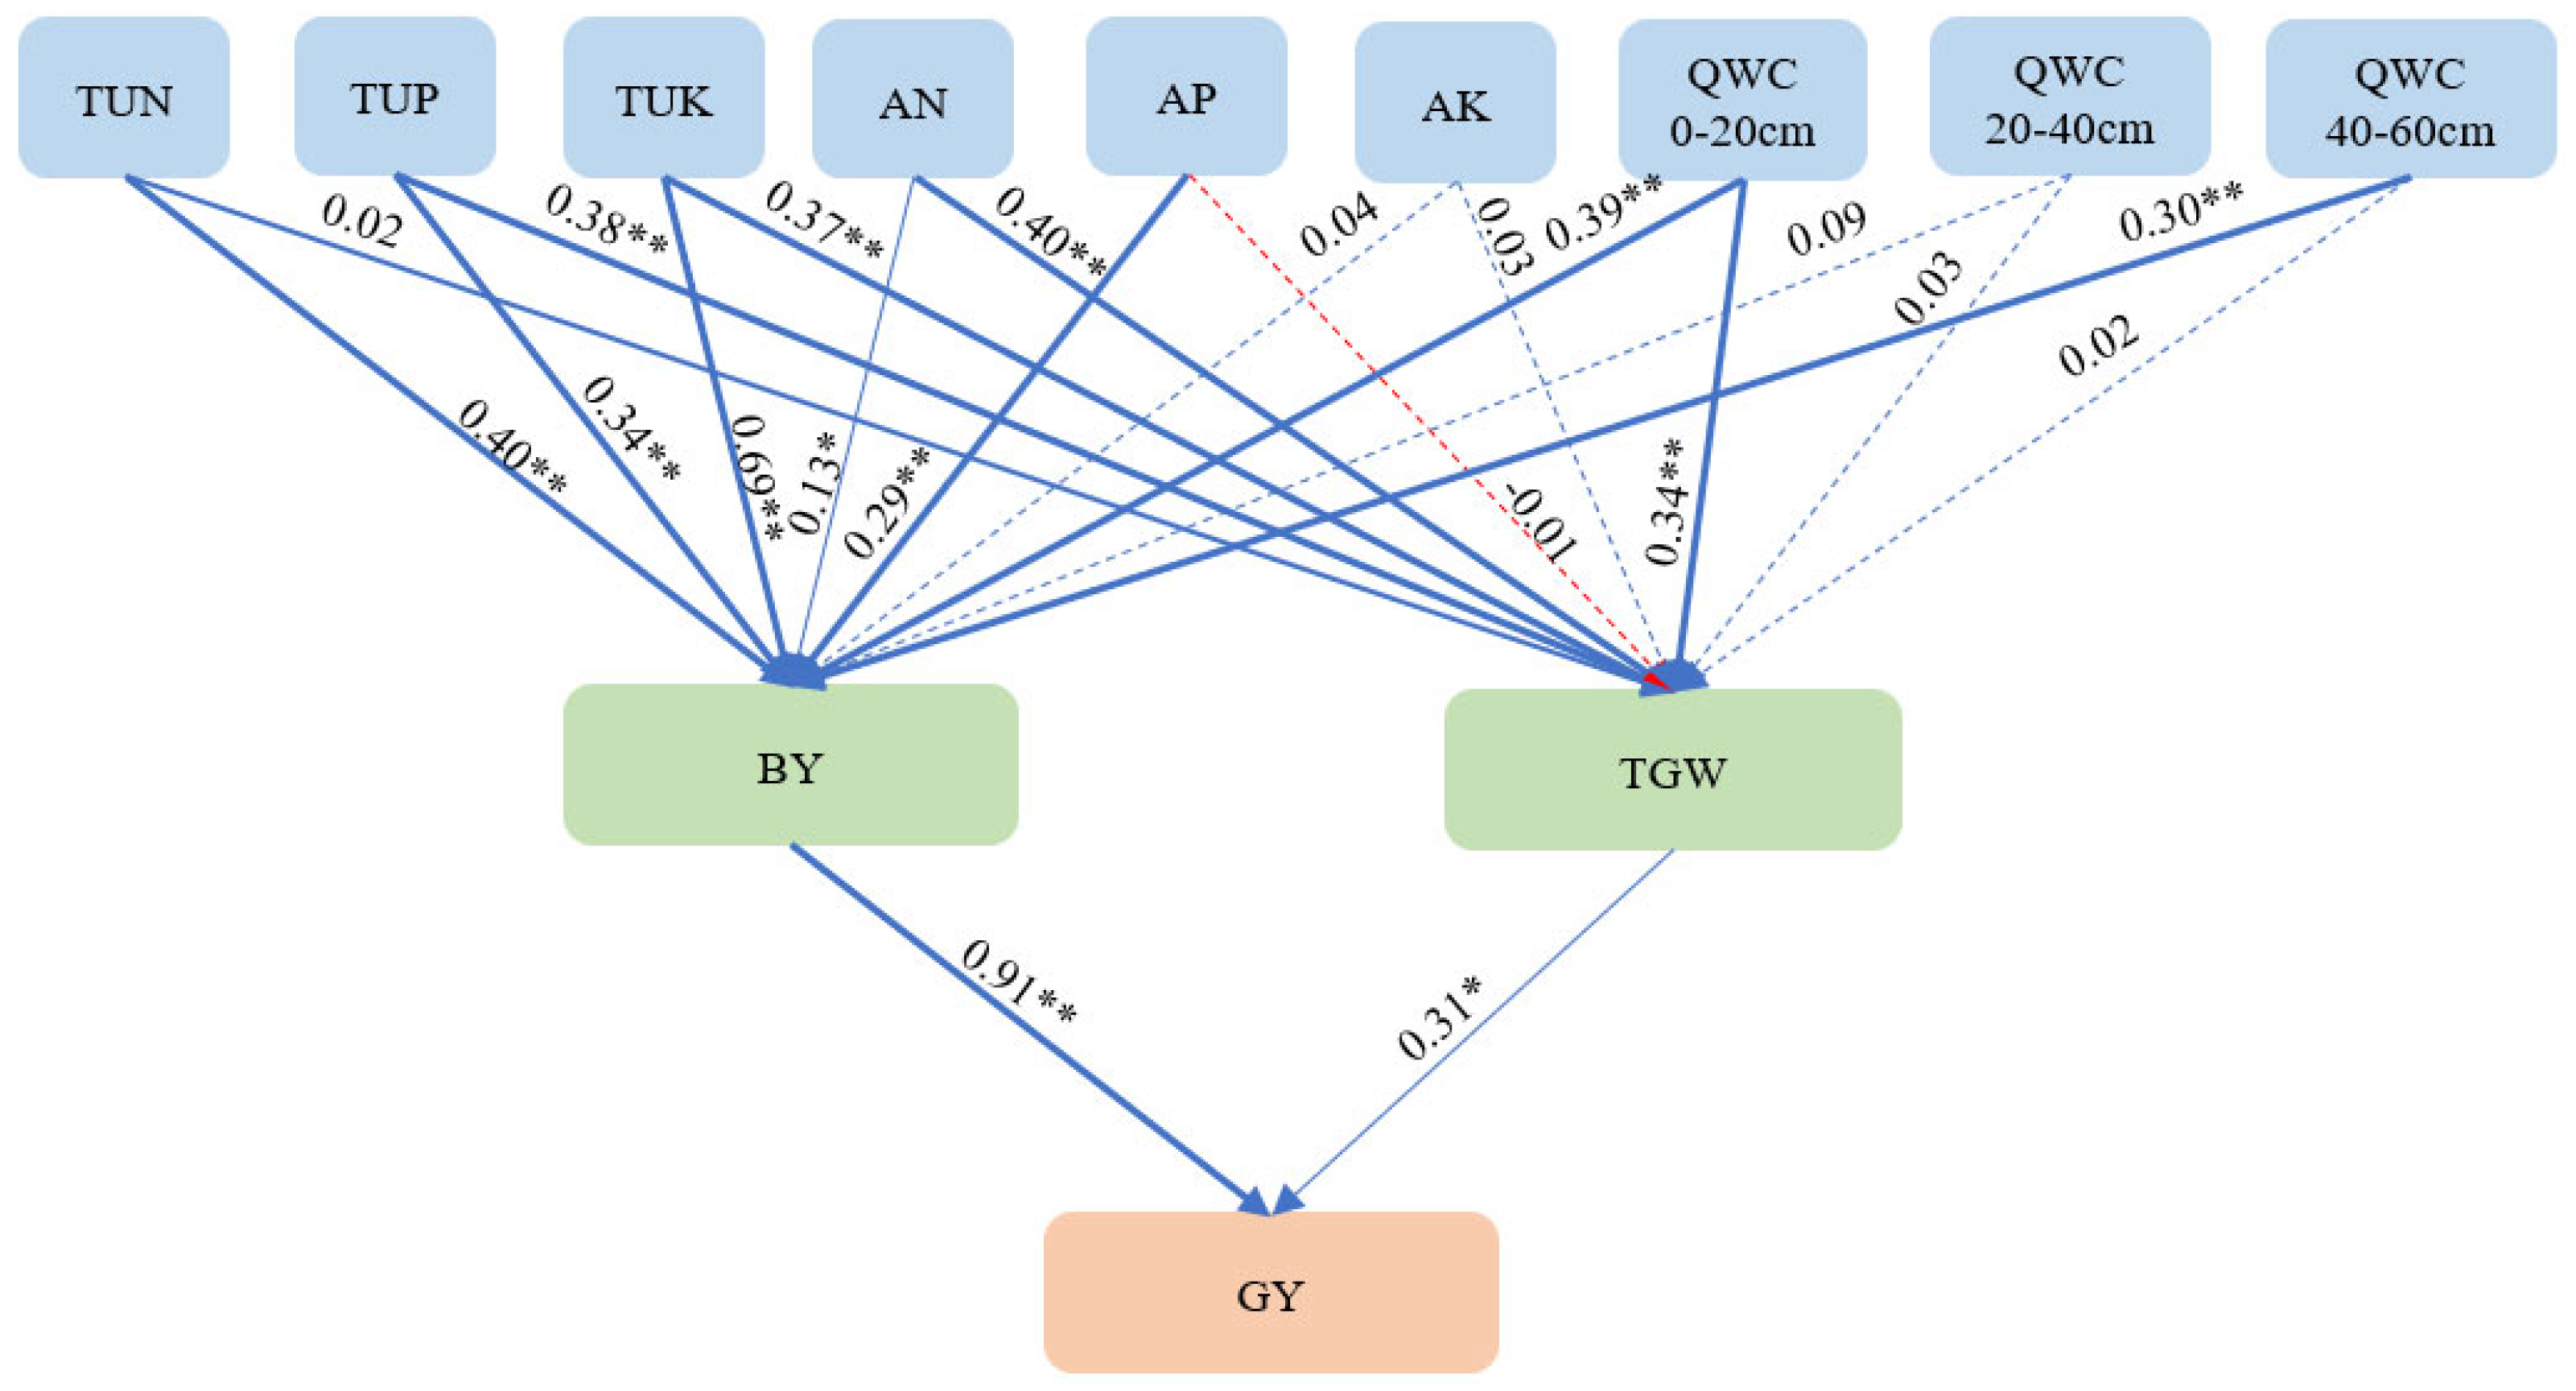
3.7. Path Analysis of Factors Affecting Yield

The Structural Equation Model Analysis (SEMA, Figure 8) was developed to further elucidate the direct and indirect pathways influencing yield. Changes in soil AN, AP, AK, nutrient uptake (TNU, TPU, TKU), and QWC were found to affect wheat BY and TGW, subsequently influencing GY. Among these factors, BY had the most significant impact on GY (SPC = 0.912). The key determinants of wheat BY included soil AN (SPC = 0.131), AP (SPC = 0.288), TNU (SPC = 0.401), TPU (SPC = 0.339), TKU (SPC = 0.691), and QWC at 0–20 cm QWC (SPC = 0.388).

4. Discussion

4.1. The Optimal Phosphorus Application Rate for Wheat Cultivation on Saline–Alkali Soils

This study demonstrated that wheat yield exhibited an initial increase followed by a decline with increasing phosphorus application rates, with the highest yield achieved at 120 kg/hm2 P2O5. The average yield increase ranged from 47.2% to 63.5% compared to the no-phosphorus treatment. Despite applying nitrogen at 210 kg/hm2 and potassium at 90 kg·hm−2 uniformly across treatments, the observed yield gap relative to the potential wheat yield (6850–9210 kg/hm2) [17,25], which can be largely attributed to salinity-induced physiological limitations on root growth, water absorption, and nutrient uptake [26]. Particularly in phosphorus-deficient plots, salt stress further reduced photosynthesis and plant vitality due to insufficient osmotic regulation and impaired energy metabolism [27,28].
The phosphorus application–yield response curve followed a classic “increase–plateau–decline” trend, with the optimal yield achieved at 120 kg/hm2. Phosphorus plays a crucial role in energy transfer (via ATP), genetic regulation (as a component of nucleic acids), and membrane integrity (phospholipids), all of which are essential for plant resilience under salt-alkali stress [29,30]. In saline–alkali soils, phosphorus availability is often reduced due to precipitation with calcium ions. Phosphorus fertilization compensates for this limitation by enhancing soil phosphorus availability, strengthening root activity, and improving crop tolerance to osmotic and ionic stress.
Additionally, crop root absorption of phosphorus is often inhibited by competition from other salt ions, reducing its availability [15,31]. Phosphorus application increases the soil’s phosphorus content and availability, enhancing the phosphorus supply and promoting crop growth and development [32,33]. However, when phosphorus input exceeds plant uptake, the surplus accumulates in the soil, eventually migrating to water bodies, leading to resource waste and environmental pollution [34,35,36]. Moreover, excessive phosphorus application can reduce nitrogen uptake by crops, resulting in a diminished yield increase [17,19].
Therefore, an appropriate phosphorus application rate is essential for enhancing wheat yield under saline–alkali soil conditions [37,38]. Although previous studies have reported optimal phosphorus rates ranging from 100–120 kg/hm2 in general wheat production [21,39], research specifically targeting saline–alkali conditions remains limited. This study therefore provides region-specific evidence for 120 kg/hm2 as a practical threshold that balances yield gain and environmental safety.

4.2. Pathways of the Impact of Phosphorus Application on Wheat Yield

Structural Equation Model Analysis (SEMA) provided insights into the causal pathways linking phosphorus fertilization, soil properties, nutrient uptake, and yield formation. Phosphorus application significantly increased soil available phosphorus (AP) content, which in turn enhanced phosphorus uptake by wheat plants (TPU). Improved nutrient uptake, particularly of phosphorus, contributed to greater biomass accumulation (BY) and higher thousand-grain weight (TGW), both of which directly and significantly influenced final grain yield (GY). Additionally, the application of phosphorus influenced soil alkali–hydrolyzable nitrogen (AN) and available potassium (AK) to a lesser extent. These secondary changes suggest that phosphorus may have indirect synergistic effects on other nutrient cycles by promoting microbial activity or modifying soil chemical conditions [40,41,42].
Phosphorus use efficiency (PPE) initially increased with phosphorus application but declined at excessive application rates, indicating a threshold beyond which additional phosphorus is less efficiently utilized. This trend aligns with the well-documented phenomenon of luxury consumption under abundant phosphorus conditions [43,44]. Furthermore, interactions among nitrogen, phosphorus, and potassium uptakes were observed, consistent with previous studies showing mutual influences among major macronutrients [31]. Notably, in saline–alkaline soils, the physiological efficiency of phosphorus uptake is particularly sensitive to soil water availability and salt concentrations. Although this study primarily focused on phosphorus fertilization effects, it is recognized that salt stress can impair root membrane integrity and hinder active nutrient uptake processes, ultimately affecting phosphorus acquisition
The results of this study underscore that phosphorus fertilization can effectively alleviate nutrient limitations and improve wheat productivity under saline–alkaline conditions when applied at optimal rates. However, phosphorus alone cannot fully offset the physiological stresses imposed by salinity. Uniform nitrogen and potassium supplementation across treatments helped to isolate the phosphorus effect in this study, yet in practical agricultural settings, integrated nutrient management considering salinity-induced nutrient interactions remains essential. Achieving balanced N-P-K nutrition while avoiding excessive phosphorus accumulation is critical for sustaining soil fertility, minimizing environmental risks, and optimizing crop performance in saline–alkaline regions.

5. Conclusions

This study demonstrated that phosphorus fertilization significantly improves wheat yield, biomass, thousand-grain weight, and nutrient accumulation in saline–alkali soils. The optimal phosphorus application rate was identified as 120 kg/hm2, at which point wheat productivity peaked. Application rates exceeding this threshold led to a decline in physiological efficiency and diminished yield gains, indicating the risk of nutrient imbalance and inefficiency with excessive phosphorus input.
The yield improvement was primarily driven by enhanced soil available phosphorus, which promoted root nutrient uptake, biomass accumulation, and grain development. Phosphorus fertilization also indirectly influenced soil alkali–hydrolyzable nitrogen and available potassium levels, contributing to better nutrient acquisition and yield formation under saline–alkali conditions.
Based on these findings, a phosphorus application rate of 120 kg/hm2 is recommended for irrigated wheat production in the saline–alkali soils of the Yellow River Delta. Over-application should be avoided to maintain nutrient balance and prevent environmental degradation. Future studies should further refine nutrient management strategies by incorporating assessments of soil physicochemical properties and evaluating the long-term sustainability of nutrient use under saline stress conditions.

Author Contributions

Conceptualization, C.M., Z.S., Y.X., X.G. and Y.L.; methodology, C.M., X.W., Z.S. and Y.X.; software, P.S., C.L., L.L. and X.W.; validation, P.S., C.L., L.L. and X.W.; formal analysis, C.M., P.S., C.L. and L.L.; resources, Z.S., Y.X., X.G. and Y.L.; data curation, C.M., P.S. and C.L.; writing—original draft preparation, C.M. and X.W.; writing—review and editing, C.M., Z.S. and Y.X.; visualization, C.M., P.S., C.L. and L.L.; supervision, X.G. and Y.L.; project administration, Z.S. and Y.X.; funding acquisition, Z.S. and Y.X. All authors have read and agreed to the published version of the manuscript.

Funding

This research was funded by National Natural Science Foundation of China (U24A20359), Key R&D Program of Shandong Province, China (2024CXPT075, 2023TZXD087, 2024TZXD054), Technical System of Ecological Agriculture of Modern Agricultural Technology System in Shandong Province (SDAIT-30–01, SDAIT-30-15), and the Taishan Scholars Program (tstp20230646).

Data Availability Statement

The raw data supporting the conclusions of this article will be made available by the authors on request.

Conflicts of Interest

The authors declare that they have no known competing financial interests or personal relationships that could have appeared to influence the work reported in this paper.

References

  1. FAO. 2022 Global Report on Food Crises. 2022. Available online: https://www.fao.org/3/cb9997en/cb9997en (accessed on 13 May 2025).
  2. Xia, J.B.; Ren, R.R.; Zhang, S.Y.; Wang, Y.H.; Fang, Y. Forest and grass composite patterns improve the soil quality in the coastal saline-alkali land of the Yellow River Delta, China. Geoderma 2019, 349, 25–35. [Google Scholar] [CrossRef]
  3. Liu, S.; Yang, M.; Cheng, F.; Coxixo, A.; Wu, X.; Zhang, Y. Factors driving the relationships between vegetation and soil properties in the Yellow River Delta, China. Catena 2018, 165, 279–285. [Google Scholar] [CrossRef]
  4. Shrivastava, P.; Kumar, R. Soil salinity: A serious environmental issue and plant growth promoting bacteria as one of the tools for its alleviation. Saudi J. Biol. Sci. 2015, 22, 123–131. [Google Scholar] [CrossRef]
  5. Bu, X.X.; Xie, X.W.; Wu, C.X.; Liu, M.Q.; Xu, Y.M. Optimizing Phosphatic Fertilizer Drip Timing to Improve Cotton Yield in Saline–Alkali Soil and Mitigate Phosphorus–Calcium Binding Risks. Agronomy 2025, 15, 138. [Google Scholar] [CrossRef]
  6. Xie, H.; Li, J.; Zhang, Y.; Xu, X.; Wang, L.; Ouyang, Z. Evaluation of coastal farming under salinization and optimized fertilization strategies in China. Sci. Total Environ. 2021, 797, 149038. [Google Scholar] [CrossRef]
  7. Eynard, A.; Lal, R.; Wiebe, K. Crop Response in Salt-Affected Soils. J. Sustain. Agric. 2005, 27, 5–50. [Google Scholar] [CrossRef]
  8. Huang, X.M.; Xu, X.P.; Zhu, Q.C.; Zhang, Y.T. Optimizing water and nitrogen inputs for sustainable wheat yields and minimal environmental impacts. Agric. Syst. 2024, 220, 104061. [Google Scholar] [CrossRef]
  9. Huang, M.Y.; Zhang, Z.Y.; Zhai, Y.M.; Lu, P.R.; Zhu, C.L. Effect of straw biochar on soil properties and wheat production under saline water irrigation. Agronomy 2019, 9, 457. [Google Scholar] [CrossRef]
  10. Hou, P.; Li, B.W.; Cao, E.K.; Liu, Z.H.; Li, Y.; Sun, Z.Q.; Xiao, Y.; Ma, C.J. Optimizing Nitrogen and Phosphorus Fertilizer Application for Wheat Yield on Alkali Soils: Mechanisms and Effects. Agronomy 2025, 15, 734. [Google Scholar] [CrossRef]
  11. Liu, S.; Zhang, Q.; Li, Z.; Tian, C.; Qiao, Y.; Du, K.; Cheng, H.; Chen, G.; Li, X.; Li, F. Soil salinity weakening and soil quality enhancement after long-term reclamation of different croplands in the Yellow River Delta. Sustainability 2023, 15, 1173. [Google Scholar] [CrossRef]
  12. He, K.; Xu, Y.; He, G.; Zhao, X.; Wang, C.; Li, S.; Zhou, G.; Hu, R. Combined application of acidic biochar and fertilizer synergistically enhances Miscanthus productivity in coastal saline-alkaline soil. Sci. Total Environ. 2023, 893, 164811. [Google Scholar] [CrossRef] [PubMed]
  13. El-Syed, N.M.M.; Helmy, A.M.; Fouda, S.E.E.; Nabil, M.M.; Abdullah, T.A.; Alhag, S.K.; Al-Shuraym, L.A.; Al Syaad, K.M.; Ayyoub, A.; Mahmood, M.; et al. Biochar with organic and inorganic fertilizers improves defenses, nitrogen use efficiency, and yield of maize plants subjected to water deficit in an alkaline soil. Sustainability 2023, 15, 12223. [Google Scholar] [CrossRef]
  14. Zhang, T.; Wan, W.; Sun, Z.; Li, H. Phosphorus uptake and rhizosphere properties of alfalfa in response to phosphorus fertilizer types in sandy soil and saline-alkali soil. Front. Plant Sci. 2024, 15, 1377626. [Google Scholar] [CrossRef] [PubMed]
  15. Tunturk, M.; Tunturk, R.; Yasar, F. Changes in micronutrients, dry weight and plant growth of soybean (Glycine max L. Merrill) cultivars under salt stress. Afr. J. Biotechnol. 2008, 7, 1650–1654. [Google Scholar] [CrossRef]
  16. Wang, H.; Ren, H.; Han, K.; He, Q.; Zhang, L.; Zhao, Y.; Liu, Y.; Zhang, J.; Zhao, B.; Ren, B. Sustainable improvement strategies for summer maize yield, nitrogen use efficiency and greenhouse gas emission intensity in the North China Plain. Eur. J. Agron. 2023, 143, 126712. [Google Scholar] [CrossRef]
  17. Chen, X.; Yan, X.; Wang, M.; Cai, Y.; Weng, X.; Su, D.; Guo, J.; Wang, W.; Hou, Y.; Ye, D. Long-term excessive phosphorus fertilization alters soil phosphorus fractions in the acidic soil of pomelo orchards. Soil Tillage Res. 2022, 215, 105214. [Google Scholar] [CrossRef]
  18. Dai, Y.; Wang, X.; Li, X. The response strategies to saline-alkali stress in wheat: Soil improvement, agronomic management, salt-tolerant variety breeding, and biochemical regulation. Geogr. Res. Bull. 2025, 4, 179–182. [Google Scholar] [CrossRef]
  19. Kim, G.W.; Lim, J.Y.; Islam Bhuiyan, M.S.; Das, S.; Khan, M.I.; Kim, P.J. Investigating the arable land that is the main contributor to global warming between paddy and upland vegetable crops under excessive nitrogen fertilization. J. Clean. Prod. 2022, 346, 131197. [Google Scholar] [CrossRef]
  20. Li, T.L.; Xie, Y.H.; Hong, J.P.; Feng, Q.; Sun, C.H.; Wang, Z.W. Effects of phosphorus application rates on winter wheat yield and phosphorus use efficiency in drylands of South Shanxi Province. Chin. J. Eco-Agric. 2013, 21, 658–665. [Google Scholar] [CrossRef]
  21. Jiang, Z.Q.; Feng, C.N.; Huang, L.L.; Guo, W.S.; Zhu, X.K.; Peng, Y.X. Effects of phosphorus application on dry matter production and phosphorus uptake in wheat (Triticum aestivum L.). Soil Sci. Plant Nutr. 2006, 12, 628–634. [Google Scholar] [CrossRef]
  22. Bremner, J.M. Use of an ammonia electrode for determination of ammonium in Kjeldahl analysis of soils. Commun. Soil Sci. Plant Anal. 1972, 3, 159–165. [Google Scholar] [CrossRef]
  23. Yan, S.; Wu, Y.; Fan, J.; Zhang, F.; Zheng, J.; Qiang, S.; Guo, J.; Xiang, Y.; Zou, H.; Wu, L. Dynamic change and accumulation of grain macronutrient (N, P and K) concentrations in winter wheat under different drip fertigation regimes. Field Crops Res. 2020, 250, 107767. [Google Scholar] [CrossRef]
  24. Ma, C.J.; Wu, W.B.; Hou, P.; Wang, Y.; Li, B.W.; Yuan, H.B.; Liu, L.N.; Wang, X.J.; Sun, Z.Q.; Li, Y. Effect of combined nitrogen and phosphorus fertilization on summer maize yield and soil fertility in coastal saline-alkali land. Agric. Water Manag. 2025, 309, 109277. [Google Scholar] [CrossRef]
  25. Meng, F.G.; Zhao, L.D.; Li, W.L.; Zhao, C.X. Optimizing nitrogen application for enhanced yield and quality of strong-gluten wheat: A case study of zhongmai 578 in the north china plain. Agronomy 2024, 14, 301. [Google Scholar] [CrossRef]
  26. Byrt, C.S.; Munns, R.; Gilliham, R.A.B.M.; Wege, S. Root cell wall solutions for crop plants in saline soils. Plant Sci. 2018, 269, 47–55. [Google Scholar] [CrossRef]
  27. Plaza-Bonilla, D.; Lampurlanes, J.; Fernandez, F.G.; Cantero-Martinez, C. Nitrogen fertilization strategies for improved Mediterranean rainfed wheat and barley performance and water and nitrogen use efficiency. Eur. J. Agron. 2021, 124, 126238. [Google Scholar] [CrossRef]
  28. Talbi-Zribi, O.; Abdelly, C.; Debez, A. Interactive effects of salinity and phosphorus availability on growth, water relations, nutritional status and photosynthetic activity of barley (Hordeum vulgare L.). Plant Biol. 2011, 13, 872–880. [Google Scholar] [CrossRef]
  29. Wang, N.; Wu, J.J.; Gu, Y.H.; Jiang, K.T.; Ma, X.Y. Factors influencing the spatiotemporal variability in the irrigation requirements of winter wheat in the north China plain under Climate Change. Agronomy 2022, 12, 1987. [Google Scholar] [CrossRef]
  30. Liu, Y.J.; Chen, Q.M.; Tan, Q.H. Responses of wheat yields and water use efficiency to climate change and nitrogen fertilization in the North China plain. Food Sec. 2019, 11, 1231–1242. [Google Scholar] [CrossRef]
  31. Ma, C.J.; Yuan, H.; Shi, N.; Sun, Z.; Liu, S.; Wang, X.; Li, B.; Li, S.; Liu, Z. Effects of Phosphate Application Rate on Grain Yield and Nutrition Use of Summer Maize under the Coastal Saline-Alkali Land. Agronomy 2023, 13, 2668. [Google Scholar] [CrossRef]
  32. Zhang, Y.; Wei, W.; Gao, W.; Cui, H.; Xu, X.; Jiang, W.; Liu, S. Content patterns of maize endogenous hormones and grain yield influenced by field phosphorus application. Agronomy 2023, 13, 1911. [Google Scholar] [CrossRef]
  33. Zhang, Z.B.; Jia, C.L.; Ren, B.Z.; Liu, P.; Zhao, B.; Zhang, J.W. Effects of combined application of nitrogen and phosphorus on yield and leaf senescence physiological characteristics in summer maize. Acta Agron. Sin. 2023, 49, 1616–1629. [Google Scholar] [CrossRef]
  34. Aulakh, M.S.; Garg, A.K.; Kabba, B.S. Phosphorus accumulation, leaching and residual effects on crop yields from long-term applications in the subtropics. Soil Use Manag. 2007, 23, 417–427. [Google Scholar] [CrossRef]
  35. Cecilia, C.I.; Fabrizio, D.I.A.; Rosa, G.A. Phosphorus downward movement in soil highly charged with cattle manure. Environ. Earth Sci. 2016, 75, 5687. [Google Scholar] [CrossRef]
  36. Djodjic, F.; Borling, K.; Bergstrom, L. Phosphorus leaching in relation to soil type and soil phosphorus content. J. Environ. 2004, 33, 678–684. [Google Scholar] [CrossRef]
  37. Luo, X.; Mazer, S.J.; Guo, H.; Zhang, N.; Weiner, J.; Hu, S. Nitrogen: Phosphorous supply ratio and allometry in five alpine plant species. Ecol. Evol. 2016, 6, 8881–8892. [Google Scholar] [CrossRef]
  38. Shi, Z.; Liu, D.; Liu, M.; Hafeez, M.B.; Wen, P.; Wang, X.; Wang, R.; Zhang, X.; Li, J. Optimized fertilizer recommendation method for nitrate residue control in a wheat–maize double cropping system in dryland farming. Field Crops Res. 2021, 271, 108258. [Google Scholar] [CrossRef]
  39. Dai, J.; Wang, Z.; Li, M.; He, G.; Li, Q.; Cao, H.; Wang, S.; Gao, Y.; Hui, X. Winter wheat grain yield and summer nitrate leaching: Long-term effects of nitrogen and phosphorus rates on the Loess Plateau of China. J. Field Crops Res. 2016, 196, 180–190. [Google Scholar] [CrossRef]
  40. Wen, Z.; Shen, J.; Blackwell, M.; Li, H.; Zhao, B.; Yuan, H. Combined applications of nitrogen and phosphorus fertilizers with manure increase maize yield and nutrient uptake via stimulating root growth in a long-term experiment. Pedosphere 2016, 26, 62–73. [Google Scholar] [CrossRef]
  41. Galindo, F.S.; Strock, J.S.; Pagliari, P.H. Nutrient accumulation affected by corn stover management associated with nitrogen and phosphorus fertilization. Agriculture 2021, 11, 1118. [Google Scholar] [CrossRef]
  42. Schlegel, A.J.; Havlin, J.L. Corn yield and grain nutrient uptake from 50 years of nitrogen and phosphorus fertilization. Agron. J. 2017, 109, 335–342. [Google Scholar] [CrossRef]
  43. Ashley, K.; Cordell, D.; Mavinic, D. A brief history of phosphorus: From the philosopher’s stone to nutrient recovery and reuse. Chemosphere 2011, 84, 737–746. [Google Scholar] [CrossRef] [PubMed]
  44. Khan, A.; Lu, G.; Ayaz, M.; Zhang, H.; Wang, R.; Lv, F.; Yang, X.; Sun, B.; Zhang, S. Phosphorus efficiency, soil phosphorus dynamics and critical phosphorus level under long-term fertilization for single and double cropping systems. Agric. Ecosyst. Environ. 2018, 256, 1–11. [Google Scholar] [CrossRef]
Figure 1. Maximum and minimum air temperatures and monthly rainfall during the wheat season: (a) Temperatures, (b) Rainfall.
Land 14 01241 g001
Figure 2. Influence of different fertilizer rates on grain yield in the 2018, 2019, and 2020 wheat seasons. T: treatment; Y: year; ns: not significant. Different letters indicate a significant difference at * p < 0.05; ** p < 0.01. The vertical bars represent the standard errors (SE) of the means.
Land 14 01241 g002
Figure 3. The differences in wheat biomass and hundred-grain weight under different treatments during the 2018, 2019, and 2020 wheat seasons. (a): wheat biomass; (b): hundred-grain weigt. T: treatment; Y: year; ns: not significant. Different letters indicate a significant difference at * p < 0.05; ** p < 0.01. The vertical bars represent the standard errors (SE) of the means.
Land 14 01241 g003
Figure 4. Differences in soil moisture content under different treatments in the 2018, 2019, and 2020 wheat seasons (ai). T: treatment; Y: year; ns: not significant. Different letters indicate a significant difference at * p < 0.05; ** p < 0.01. The vertical bars represent the standard errors (SE) of the means.
Land 14 01241 g004
Figure 5. The differences in soil alkali–hydrolyzable nitrogen, available phosphorus, and available potassium under different treatments during the 2018, 2019, and 2020 wheat seasons (ai). T: treatment; Y: year; ns: not significant. Different letters indicate a significant difference at * p < 0.05; ** p < 0.01. The vertical bars represent the standard errors (SE) of the means.
Land 14 01241 g005
Figure 6. The differences in total nitrogen (a), phosphorus (b), and potassium (c) uptake under different treatment conditions during the 2018, 2019, and 2020 wheat seasons. T: treatment; Y: year; ns: not significant. Different letters indicate a significant difference at * p < 0.05; **p < 0.01. The vertical bars represent the standard errors (SE) of the means.
Land 14 01241 g006
Figure 7. Influence of different phosphate fertilizer rates on nitrogen physiological efficiency (NPE) (a), phosphorus physiological efficiency (PPE) (b), and potassium physiological efficiency (KPE) (c) in the 2018, 2019 and 2020 wheat seasons. T: treatment; Y: year; ns: not significant; * p < 0.05; ** p < 0.01.
Land 14 01241 g007
Figure 8. Analysis of the impact path of grain yield and biomass yield in the 2018, 2019 and 2020 wheat seasons. TNU: Total nitrogen uptake; TPU: Total phosphorus uptake; TKU: Total potassium uptake; AN: alkaline hydrolyzable nitrogen, AP: available phosphorus, AK: quick-acting potassium; QWC: Soil quality water content; BY: biomass yield; TGW: thousand-grain weight; GY: grain yield. * p < 0.05; ** p < 0.01.
Land 14 01241 g008
Table 1. Main chemical properties of the test soil.
Soil Depth
(cm)
Conductivity
(mS/cm)
pHOrganic Matter
(g/kg)
Alkaline–Hydrolyzable Nitrogen
(mg/kg)
Available Phosphorus
(mg/kg)
Quick-Acting Potassium
(mg/kg)
0–200.218.169.6350.7210.36152
20–400.478.076.8356.175.96122
40–600.598.013.6823.295.7959
Table 2. Two-factor ANOVA parameter for grain and straw nutrient content.
GNUGPUGKUSNUSPUSKU
Treatment10.03 **13.44 **3.14 *31.36 **6.59 **9.72 **
Year18.86 **67.92 **20.25 **1.67 ns10.23 **57.66 **
Treatment × year0.44 ns2.28 *0.65 ns0.84 ns1.43 ns1.36 ns
Note: GNU, grain nitrogen uptake; GPU, grain phosphorus uptake; GKU, grain potassium uptake; SNU, stalk nitrogen uptake; SPU, stalk phosphorus uptake; SKU, stalk potassium uptake; ns, not significant. * p < 0.05; ** p < 0.01.
Disclaimer/Publisher’s Note: The statements, opinions and data contained in all publications are solely those of the individual author(s) and contributor(s) and not of MDPI and/or the editor(s). MDPI and/or the editor(s) disclaim responsibility for any injury to people or property resulting from any ideas, methods, instructions or products referred to in the content.

