Article

Spatiotemporal Patterns of Vegetation Coverage and Its Response to Land-Use Change in the Agro-Pastoral Ecotone of Inner Mongolia, China

1
College of Grassland Science, Inner Mongolia Agricultural University, Hohhot 010020, China
2
Key Laboratory of Grassland Resources, Ministry of Education, Hohhot 010020, China
3
Key Laboratory of Forage Cultivation, Processing and High Efficient Utilization, Ministry of Agriculture, Hohhot 010020, China
*
Author to whom correspondence should be addressed.
Land 2025, 14(6), 1202; https://doi.org/10.3390/land14061202
Submission received: 27 March 2025 / Revised: 20 April 2025 / Accepted: 21 April 2025 / Published: 4 June 2025
(This article belongs to the Section Land Use, Impact Assessment and Sustainability)

Abstract

In agro-pastoral transitional zones, monitoring vegetation fraction coverage (FVC) and understanding its relationship with land use and climate change are crucial for comprehending how complex land-use/land-cover change (LUCC) improves ecological restoration and land management. This study focuses on the agro-pastoral transitional zone of Inner Mongolia, aiming to analyze vegetation cover changes from 2000 to 2020 using the Mann–Kendall (MK) significance test, Theil–Sen median trend analysis, and coefficient of variation (CV) analysis. Additionally, the study explores the impacts of LUCC, precipitation, and temperature on vegetation cover using methods such as geo-detector, pixel-based statistical analysis, and univariate linear regression. Based on the PLUS land-use prediction model and linear regression results, vegetation cover was simulated under different land-use scenarios for the future. The main findings are as follows: first, from 2000 to 2020, the spatial distribution of vegetation cover in the study area showed a distinct pattern of higher vegetation cover in the east compared to the west, with significant spatiotemporal heterogeneity. Although the overall vegetation cover slightly increased, there were notable differences in the trend across regions, with some areas experiencing a decrease in FVC. Second, LUCC is the most significant explanatory factor for vegetation cover changes, and the interactions between LUCC and other factors have a particularly notable impact on vegetation cover. Third, scenario simulations based on the PLUS model indicate that, by 2040, vegetation cover will perform optimally under the farmland protection and sustainable development scenarios. Particularly under the farmland protection scenario, the conversion of cropland, forestland, and grassland is notably suppressed. In contrast, the unmanaged natural development scenario will lead to a decline in vegetation cover. The results of this study show that vegetation cover in the agro-pastoral transitional zone of Inner Mongolia exhibits substantial fluctuations due to land-use change. Future ecological restoration policies should incorporate land-use optimization to promote vegetation recovery and address ecological degradation.

1. Introduction

Globally, land-use and land-cover change (LUCC) and vegetation fraction coverage (FVC) in semi-arid regions are significantly influenced by climate change and human activities [1,2]. According to recent studies, over the past millennium, approximately three-quarters of the Earth’s land area has been altered by human activities. With the advancement of human society, the pace of global land use change has accelerated [3,4]. Additionally, global land-cover trajectories have shown significant transitions over the past few decades, with large-scale shifts in forests, wetlands, and croplands [5]. The agro-pastoral transitional zone in Inner Mongolia has long faced competition between grasslands and arable land, with increasing land-use conflicts making it more challenging than in other semi-arid regions worldwide. As an important transitional zone, it serves both as an ecological barrier and a region for agricultural and pastoral production, playing a dual role in safeguarding agricultural productivity in northern China and maintaining the balance of grassland ecosystems [6]. However, due to its complex natural conditions and high-intensity human interference, the region has experienced significant dynamic changes in vegetation cover under the influence of land use and climate change. In recent years, issues such as the expansion of arable land, urbanization, and grassland degradation have become more prominent, presenting severe challenges to regional ecological stability and sustainable development [7]. Understanding regional differences is crucial to studying land-use changes in the agro-pastoral transitional zone in northern China. In this region, the conversion of grasslands to arable land is the primary form of land-use change, which not only weakens ecosystem service functions, but also exacerbates soil erosion and vegetation degradation. Taking the Hebei Bashang area as an example, unreasonable agricultural and pastoral development has led to severe desertification and land degradation, requiring long-term policy support and technical intervention for ecological restoration [8]. These challenges highlight the urgency of adjusting land-use structures and emphasize the importance of regional sustainable development strategies. To address ecological degradation, the Chinese government has implemented several policies since 2000, such as the Grain-for-Green Program, grazing bans, and ecological restoration initiatives. These policies have significantly increased vegetation cover, reduced soil erosion, and promoted grassland recovery. Significant progress has been achieved in areas like the Horqin Sandy Land and Duolun County, where grassland restoration policies were implemented earlier, resulting in remarkable recovery of both grassland and forest vegetation [9]. For example, in the Horqin Sandy Land, converting farmland to grasslands and forests has greatly enhanced the region’s carbon sink capacity [10]. However, the effectiveness of such policies varies spatially. For instance, in Ulanqab City, western Inner Mongolia, the combined effects of overgrazing and agricultural expansion have hindered significant improvements in vegetation cover in degraded areas [11]. Previous studies have provided valuable insights into the relationship between land use and vegetation change. Methods such as the Mann–Kendall (MK) trend test, Theil–Sen slope estimation, coefficient of variation (CV) analysis, and Hurst index have been widely used to analyze vegetation dynamics. MK–Theil–Sen analysis can identify significant trends in vegetation change over time, and its combination with CV analysis reflects the spatiotemporal stability and health of vegetation. On the other hand, the Hurst index assesses the long-term persistence of vegetation dynamics, providing a scientific basis for understanding vegetation restoration potential [12]. However, time-series algorithms based on the Google Earth Engine (GEE) platform, such as LandTrendr and continuous change detection and classification (CCDC), are gaining popularity for tracking the spatiotemporal characteristics of vegetation cover. These methods have advantages in detecting subtle changes in vegetation patterns and can provide more accurate assessments of vegetation dynamics [13,14]. Despite these advantages, due to limitations in data resolution, model complexity, and the spatial extent of the study area, these algorithms were not employed in this research. The methods we selected—Mann–Kendall (MK), Theil–Sen, and Hurst—are well-suited for analyzing long-term trends and, more directly, assessing changes in vegetation cover over time.
To further explore the potential impacts of land-use change under different policy scenarios, the PLUS (patch-based land-use simulation) model has gained increasing attention in recent studies. This model integrates the Markov transition matrix and cellular automata (CA) rules, not only simulating the spatial distribution of land-use change, but also assessing the long-term impacts of land-use policies on ecosystem services [15]. For example, scenario simulations using the PLUS model in the Ili River Valley indicate that, under ecological protection scenarios, afforestation and optimization of land-use structures significantly improved vegetation cover, while converting unused land to forests and grasslands resulted in significant ecological benefits. However, under conventional scenarios, due to the pressure of urbanization and the expansion of arable land, the improvement in vegetation was still limited [16].
To address these shortcomings, this study focuses on the agro-pastoral transitional zone in Inner Mongolia. Using Landsat imagery from 2000 to 2020, we analyze the spatiotemporal changes in vegetation cover while studying land-use changes over the same period. The GeoDetector method is applied to assess the effects of land-use changes, precipitation, and temperature on vegetation cover, and pixel-based statistical methods are used to analyze vegetation-cover changes under different land-use types. The PLUS model is utilized to simulate land-use changes and their potential impacts on vegetation cover under different scenarios for 2040, providing scientific evidence for optimizing land-use structure and enhancing regional ecological functions in the agro-pastoral transitional zone.

2. Materials and Methods
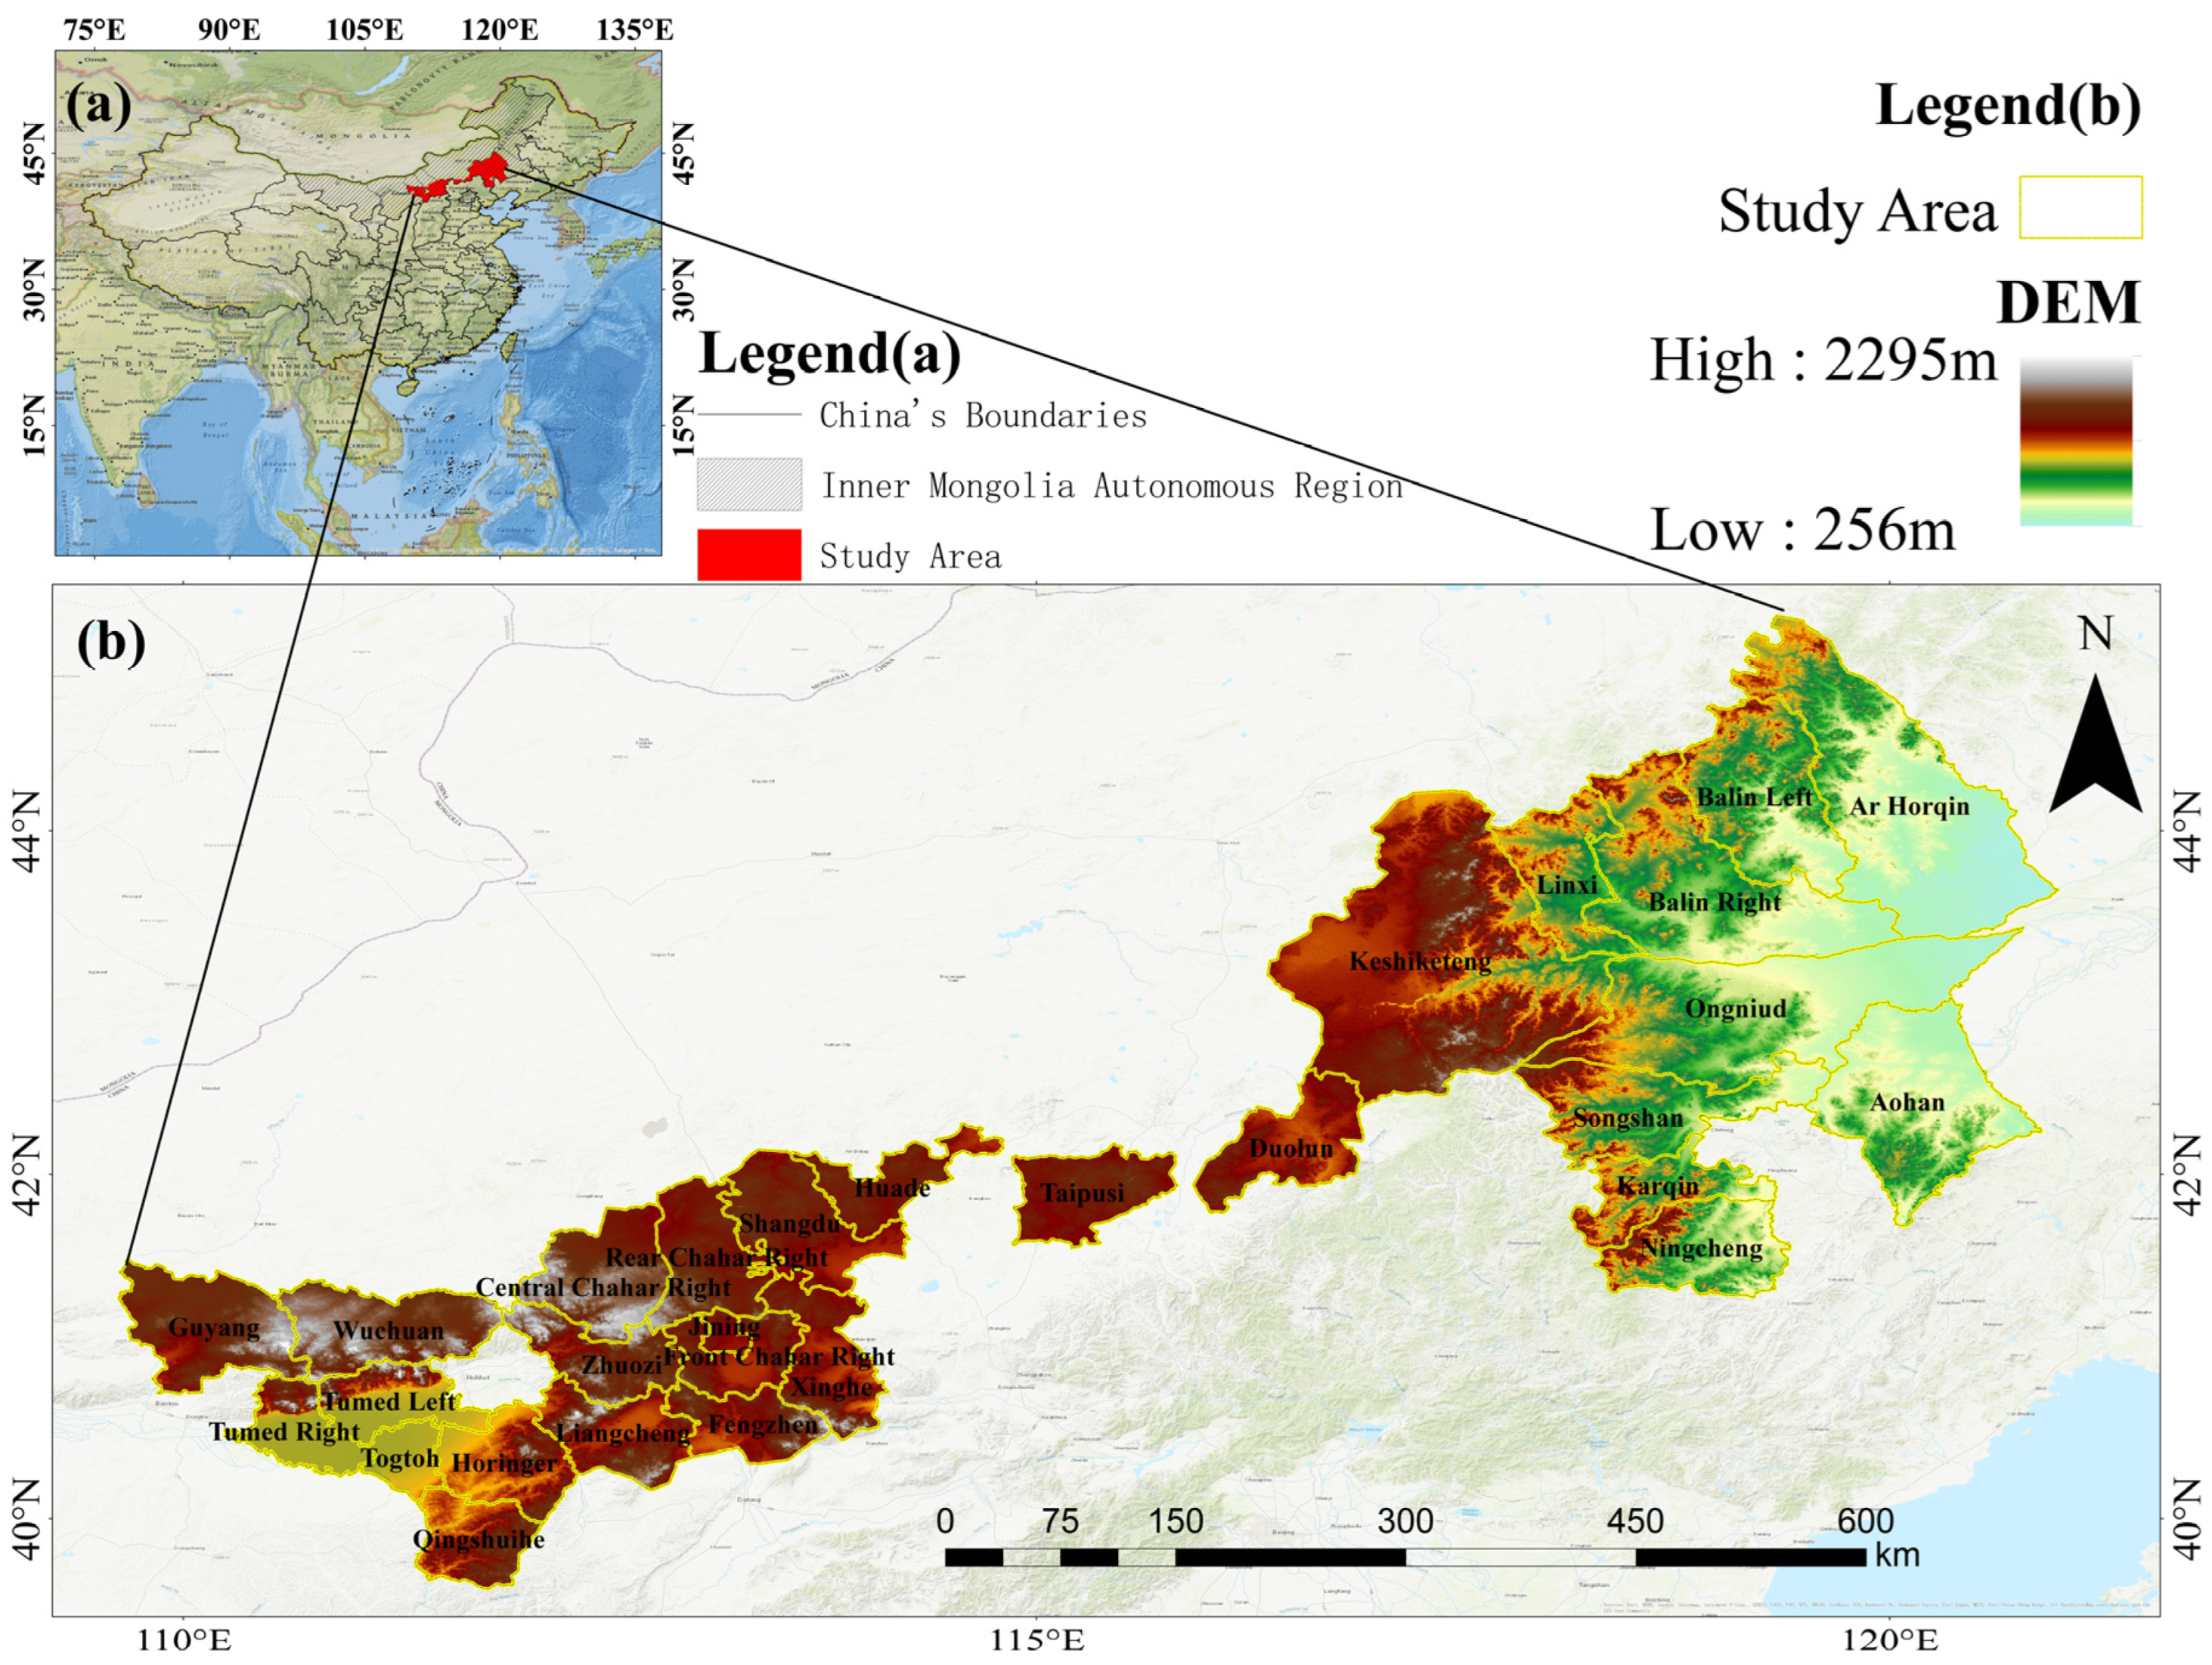
2.1. Study Area

The agro-pastoral transitional zone in Inner Mongolia is located at the intersection of arid, semi-arid, and humid climatic regions, spanning desert steppe and typical steppe ecosystems (Figure 1). Geographically, this region is situated in the northern part of China, bordering Mongolia to the north. This strategic location makes it a key area for ecological transition between China and Mongolia. The region serves as both an ecological barrier and a zone of agricultural and pastoral production, making it a critical ecological transition belt in northern China. The study area, as defined by the Guiding Opinions on Agricultural Structural Adjustment in the Northern Agro-Pastoral Transitional Zone, issued by the Ministry of Agriculture in 2017, encompasses 29 counties and banners in Chifeng City, Xilin Gol League, Ulanqab City, Hohhot City, and Baotou City. Within this region, grasslands, croplands, and built-up lands are intricately interwoven, with land-use patterns shaped by both natural environmental conditions and human activities. These dynamics have profound implications for the ecosystem service functions of the region.

2.2. Data Acquisition

2.2.1. Remote Sensing Data

This study utilized Landsat 5/7/8 satellite imagery from 2000 to 2020, with a spatial resolution of 30 m and a temporal interval of 16 days, obtained from the United States Geological Survey (USGS). The data were processed through the Google Earth Engine (GEE) platform, including cloud removal and Savitzky–Golay (SG) filtering. Specifically, we applied the maximum value composite (MVC) method to reduce cloud contamination and enhance the vegetation signal. Given that Landsat 5, 7, and 8 satellites belong to the same series but exhibit slight differences in sensors and sensed bands, we addressed the potential incompatibilities between these datasets by following the guidelines provided in the GEE official documentation for Landsat algorithms. To ensure the 100% compatibility of these datasets, we applied the recommended radiometric calibration and atmospheric correction coefficients specific to each satellite model. These coefficients help to minimize differences in sensor characteristics, such as calibration offsets and spectral responses across the Landsat series. However, we acknowledge that cloud and shadow removal methods can sometimes lead to inaccuracies, particularly in areas with frequent cloud cover. To assess the impact of these methods, we performed a sensitivity analysis by comparing results from different cloud removal techniques (e.g., clear-sky composite and temporal median) to evaluate their effects on FVC calculation accuracy. Furthermore, we considered the implications of using maximum, mean, and median composites for NDVI and FVC extraction, recognizing that each method has its limitations in capturing vegetation dynamics, especially in areas with seasonal or sudden fluctuations in vegetation cover [17].

2.2.2. Land-Use Data

The land-use data for the agro-pastoral transition zone of Inner Mongolia were obtained from the Resource and Environment Science and Data Center of the Chinese Academy of Sciences (https://www.resdc.cn/ (accessed on 11 December 2024)), using the China Multi-Period Land Use Remote Sensing Monitoring Dataset (1980–2023). Data for the years 2000, 2010, and 2020 were extracted for use in this study. The overall accuracies of the land-use data for 2000, 2010, and 2020 ranged from 88.95% to 96.55%, with Kappa coefficients ranging from 0.78 to 0.83, indicating strong consistency and reliability of the classification results. The data were reclassified into six primary categories: cropland, forestland, grassland, water bodies, built-up land, and unused land. The reclassification standards used for land-use categories are provided in Table 1.

2.2.3. Meteorological Data

The annual precipitation and annual average temperature data for the agro-pastoral transitional zone of Inner Mongolia were obtained from the National Qinghai-Tibet Plateau Data Center (https://cstr.cn/ (accessed on 11 December 2024)), using the China 1 km Resolution Monthly Precipitation Dataset (1901–2023) and the China 1 km Resolution Monthly Average Temperature Dataset (1901–2023). The data are divided into three periods: 2000, 2010, and 2020. The source data, recorded as monthly averages, were processed using Python 3.9 batch processing to obtain the annual average data.

2.3. Research Methods

2.3.1. Calculation of Fractional Vegetation Cover (FVC)

FVC is a key indicator that intuitively reflects the extent of vegetation coverage on the surface and serves as an important metric for evaluating ecosystem health [18,19]. In this study, the pixel dichotomy model was employed to calculate FVC [20]:
F V C = N D V I N D V I s o i l N D V I v e g N D V I s o i l
In the formula, FVC represents the fractional vegetation cover, which is derived from the normalized difference vegetation index (NDVI) of each pixel. NDVI reflects the difference between soil and vegetation, where NDVIsoil represents the NDVI value of completely bare soil, and NDVIveg corresponds to areas fully covered by vegetation. The difference between NDVIveg and NDVIsoil is a key factor in calculating vegetation cover; thus, the selection of NDVIveg and NDVIsoil is critical to the FVC estimation. In this study, FVC was calculated using the pixel dichotomy model, where 0% and 100% correspond to areas completely covered by bare soil and areas fully covered by vegetation, respectively. The threshold values for 0% and 100% were initially set at the 5% and 95% confidence levels. However, due to the potential for significant data loss in arid and semi-arid regions, where vegetation cover may fluctuate significantly within small ranges, these thresholds were reconsidered. After conducting a sensitivity analysis, the thresholds were adjusted to 3% and 97%, as these values better capture vegetation cover in areas with lower-density vegetation [21]. This adjustment reduces data loss and improves the accuracy of FVC estimates in these regions. The FVC classification standards in this study were based on commonly used methods from relevant literature [22,23]. According to these standards, FVC values were classified into five categories, covering a range from low to high coverage, with each category corresponding to different ecological significance. For example, low coverage areas (0–20%) typically represent degraded or arid ecosystems, while high coverage areas (80–100%) indicate healthy and well-functioning ecosystems. The literature suggests that in arid and semi-arid regions, adjusting the thresholds for FVC classification is crucial to accommodate variations in vegetation density and ecological conditions. The classification standards for FVC are shown in Table 2.

2.3.2. Theil–Sen Trend Analysis and Mann–Kendall Significance Test

The Theil–Sen median trend analysis method is a robust, non-parametric statistical approach that is not sensitive to outliers and does not require data to follow a normal distribution. It is widely used for analyzing long-term trends in time-series data. In this study, the Theil–Sen method was applied to calculate the trend of FVC changes across the agro-pastoral transitional zone in Inner Mongolia from 2000 to 2020 on a per-pixel basis using MATLAB 2023. The formula is as follows:
β = m e d i a n   ( x j x i j i ) , j > i
In the formula, xi and xj represent the FVC values for year i and year j, respectively, where i, j = 1, 2, 3, …, n, and median denotes the median function. When β > 0, it indicates an overall increasing trend in FVC during the study period, suggesting that vegetation conditions in the study area are improving. When β = 0, it indicates that FVC remains generally stable during the study period, meaning that the vegetation conditions in the study area remain relatively unchanged. When β < 0, it indicates an overall decreasing trend in FVC, suggesting vegetation degradation in the study area.
The Mann–Kendall (MK) significance test is a widely used non-parametric method for assessing the significance of trends in time-series data. In this study, the MK test was applied to evaluate the significance of NDVI trends over long time series within the study area. The MK test is particularly advantageous because it is robust to outliers and does not require the data to follow a normal distribution, making it suitable for our dataset, which may exhibit non-linear or skewed trends. However, we acknowledge that the MK test may not be sensitive to abrupt changes in time-series data, especially in regions with high interannual variability. To address this limitation, we combined the MK test with Theil–Sen’s slope estimator, which provides a robust estimate of trend magnitude, and the Hurst exponent, which assesses the long-term persistence of trends. These methods were selected based on their demonstrated effectiveness in analyzing vegetation dynamics in semi-arid regions, as supported by previous studies [12,24,25]. For a given confidence level, the formula is as follows:
Z = S 1 V a r ( S ) ,   S > 0 0 ,   S = 0 S + 1 V a r ( S ) ,   S < 0
S = i = 1 n 1 j = i + 1 n s g n ( x j x i )
s g n ( x j x i ) = 1 , x j x i > 0 0 , x j x i = 0 1 , x j x i < 0
The variance expression for the statistic S is given as follows:
V a r ( S ) = n ( n 1 ) ( 2 n + 5 ) i = 1 n t i ( i 1 ) ( 2 i + 5 ) 18
where n represents the total number of observations in the time series, and tk represents the number of tied groups for the k-th value. The summation i = 1 n t i (i − 1)(2i + 5) accounts for ties in the dataset. This expression is used to adjust for ties and ensures that the variance calculation remains robust. The test statistic Z is then computed using S and its variance to evaluate the significance of the trend. The degree of variation is classified as shown in Table 3.

2.3.3. Coefficient of Variation (CV) Analysis

The coefficient of variation (CV) is a statistical metric used to quantify the degree of variability in a sequence of observations. It is particularly effective in capturing the differences in temporal variability of spatial data and in evaluating the stability of time series data. A larger CV indicates a more dispersed distribution of FVC values and greater fluctuation, whereas a smaller CV suggests a more concentrated distribution with lower fluctuation [26,27]. The formula for calculating CV is as follows:
C V = 1 X 1 / ( n 1 ) i = 1 n ( X i X ¯ ) 2  
In the formula, CV represents the coefficient of variation, and X ¯ is the multi-year average value of FVC. The degree of variation is classified as shown in Table 4.

2.3.4. Future Trend Analysis

The Hurst exponent is a key metric for describing the persistence of future short-term trends, enabling a more detailed analysis of interannual variation characteristics [28]. In this study, the rescaled range analysis (R/S) method was used to calculate the Hurst exponent and analyze the short-term vegetation dynamics within the study area. The basic principles of the method consist of the following components:
Differential sequence:
F V C = F V C i F V C i 1
Cumulative deviation:
F V C ¯ ( m ) = 1 m i = 1 m F V C i
Range (R):
R ( m ) = x ( t ) 1 m n m a x x ( t ) 1 m n m i n
Standard deviation (S):
S ( m ) = 1 m i = 1 m F V C i F V C m ¯ 2 1 2
In the formula, FVCi represents the annual mean FVC for year I; n is a positive integer, and the time series is defined using any positive integer m. The Hurst exponent (H) generally falls within the range of [0, 1]: when 0 ≤ H < 0.5, the time series exhibits anti-persistence, indicating that future trends will likely be opposite to past trends. When H = 0.5, the time series is in an independent state, meaning that future trends are unrelated to past trends. When H > 0.5, the time series exhibits persistence, indicating that future trends will likely continue past trends. The closer H is to 1, the stronger the persistence [29,30].
In this study, the Hurst exponent was combined with Sen’s slope trend analysis to evaluate changes in vegetation coverage, with the results categorized into different levels of variation (Table 5).

2.3.5. Land-Use Transition Matrix

The land-use transition matrix is one of the mainstream methods for analyzing land-use changes. Arranging the area of land-use changes in a matrix format provides a clear and straightforward way to describe the structural changes and functional transitions of land use between any two periods. The formula for the land-use transition matrix is as follows:
S i j = S 11 S 12 S 1 n S 21 S 22 S 2 n S n 1 S n 2 S n n
In the formula, Sij represents the land area transferred from land-use type i in the initial period to land-use type j in the final period, n represents the total number of land-use categories, i represents the land-use type in the initial study period, and j represents the land-use type in the final study period.
In this study, ArcGIS 10.8 was used to perform spatial overlay analysis on remote sensing images or land-use maps from different periods to calculate the land-use transition matrices for two time intervals: 2000–2010 and 2010–2020.

2.3.6. Geographical Detector

This study employed the method of geographical detector (GeoDetector) to analyze the impacts of land-use and land-cover change (LUCC), precipitation, and temperature on the fractional vegetation cover (FVC) [31]. Both the single-factor detection and the interaction-factor detection methods were used to evaluate the explanatory ability of individual factors and combined factors for the spatial variation of FVC.
Single-factor detection is used to quantify the explanatory power of individual factors, such as LUCC, precipitation, and temperature, on the spatial distribution of FVC. The method partitions the study area based on factor categories (e.g., different land-use types, climate zones, temperature ranges) and evaluates how well the spatial variation in FVC can be explained by each factor. The mathematical formulation for single-factor detection is as follows:
Q d = 1 V a r ( ε ) V a r ( Y )
where
Qd is the GeoDetector value for a single factor, indicating its ability to explain the spatial variation in FVC.
Var(ε) is the variance of the residuals after grouping the data based on the factor, representing the intra-group variability.
Var(Y) is the total variance of FVC, representing the overall variation in vegetation cover across the entire study area before grouping. A higher Q value indicates that the factor is more effective in explaining the spatial variation in FVC, such as precipitation or temperature [32].
Interaction-factor detection assesses the combined effects of multiple factors, such as LUCC, precipitation, and temperature, on the spatial variation in FVC. This method extends the single-factor detection approach by evaluating how the interaction between two or more factors affects the distribution of FVC. The formula for interaction-factor detection is as follows:
Q d ( 1,2 ) = 1 V a r ( ε ( 1,2 ) ) V a r ( Y )
where
Q d ( 1,2 ) is the GeoDetector value for the interaction between factors 1 and 2.
V a r ( ε ( 1,2 ) ) is the variance of the residuals after considering the interaction between the factors.
Var(Y) is the total variance of FVC.
Interaction-factor detection helps identify synergistic effects among LUCC, precipitation, and temperature, offering insights into how their combined influence shapes the spatial distribution of vegetation cover [33]. For instance, the interplay between land-use changes and precipitation may have a stronger influence on vegetation than each factor individually [34].

2.3.7. Linear Regression Fitting

Trend fitting methods were employed to explore the relationship between land-use changes and vegetation coverage. Land-use change data for 2000, 2010, and 2020, along with the corresponding mean FVC values for the period 2000–2020, were collected. Independent variables (the proportions of different land-use types in various years) and dependent variables (the mean FVC values for the respective years) were identified. A linear regression model was then constructed to establish the relationship:
y = a 0 + a 1 x 1 + a 2 x x + + a n x n
In the formula, y represents the mean fractional vegetation cover (FVC). The term xi represents the proportion of various land-use types, while ai represents the coefficients for each land-use type.
This linear regression model captures the relationship between the proportion of land-use types and vegetation coverage, allowing for a quantitative assessment of how changes in land-use patterns impact FVC dynamics.

2.3.8. Future Scenario Projections

The PLUS (patch-generating land-use simulation) model, an extension of the FLUS model, operates at the patch level and incorporates both policy-driven and policy-guided factors to enable detailed predictions of land-use changes [35]. The model is built on the Markov module for land-use demand forecasting and integrates two additional modules: CARS and LEAS.
(1) Using the land expansion analysis strategy (LEAS) within the PLUS model, the conversion rules of LUT in the JRB are explored, and the development probabilities for each type are obtained. The mathematical formula is as follows [36]:
P i , k t x = n + 1 M I h x = d M
where x is the vector representing the driving factor; P i , k t x indicates the probability of LUT growth in the cell i; when d is 1, non k-type land is converted to k-type, and when d is 0, the conversion of k-type land is not included; M stands for the total number of decision trees; I() indicates the exponential function of the decision tree; and hn(x) indicates the indicator function for the xth decision tree combination of vector n.
(2) By using the CARS module, constraints are applied to the development probabilities of various land types, and their overall probabilities are calculated to model the land-use distribution pattern. The formula is as follows [36]:
O P i , k d = 1 , t = P i , k d Ω i , k t D k t
where O P i , k d = 1 , t represents the comprehensive probability of the ith cell transitioning to land type k at t; P i , k d refers to the probability of land type k expanding within i cells; Ω i , k t is the domain effect of cell i; and D k t refers to the impact of future demand on the type of k land.
In this study, four land-use change scenarios were defined for the agro-pastoral transition zone of Inner Mongolia in 2040:
(1)
Natural development scenario: this scenario assumes a continuation of the land-use change trends observed from 2000 to 2020, maintaining the original land-use transition probabilities and neighborhood weights. The land-use demand for 2040 is predicted based on these parameters, serving as the baseline scenario for other scenario constraints.
(2)
Sustainable development scenario: based on the Guiding Opinions on Agricultural Structural Adjustment in the Northern Agro-Pastoral Transition Zone, issued by the Chinese Ministry of Agriculture, this scenario acknowledges the severe challenges in the region, such as overexploitation of water resources, land desertification, and grassland degradation. Future development emphasizes resource-efficient and environmentally friendly agricultural practices to enhance sustainability. Under this scenario, the following are true:
  • The probability of cropland and forestland transitioning to built-up land decreases by 10%.
  • The probability of grassland and water bodies transitioning to built-up land decreases by 20%.
  • The probability of built-up land transitioning to forestland decreases by 20%.
  • The probability of built-up land transitioning to grassland, water bodies, and unused land decreases by 10% [37].
(3)
Ecological protection scenario: this scenario aligns with China’s ecological priority policies in northern regions, aimed at protecting the environment. To simulate this, the following adjustments are made:
  • The probability of forestland and grassland transitioning to built-up land decreases by 20%.
  • The probability of water bodies transitioning to built-up land decreases by 30% [38].
(4)
Cropland protection scenario: based on the ecological and agricultural priorities in Inner Mongolia, this scenario includes the following adjustments:
  • The probability of forestland and grassland transitioning to built-up land decreases by 20%.
  • The probability of cropland transitioning to built-up land decreases by 60%.
  • The probability of built-up land transitioning to cropland increases by 20% [39].
The field factor weight values range from 0 to 1, with higher values indicating that the land type is more resistant to conversion to other land uses and has a stronger expansion capacity. Conversely, lower values suggest that the land type is more likely to be converted to other land uses and is more easily occupied by other land types. In this study, by analyzing the actual land-use situation in the study area and incorporating the land-use transition matrix of the agro-pastoral transitional zone of Inner Mongolia, we obtained the field weight values in the PLUS model after continuous adjustments and validation, which resulted in high simulation accuracy, as shown in Table 6.
Using the land-use data from 2000 and 2010 as training samples, the land-use patterns for 2020 were simulated. The simulated results were compared with the actual 2020 land-use data using the Kappa coefficient. The analysis of the confusion matrix yielded a Kappa coefficient of 0.8 and an overall accuracy of 0.863.

3. Results

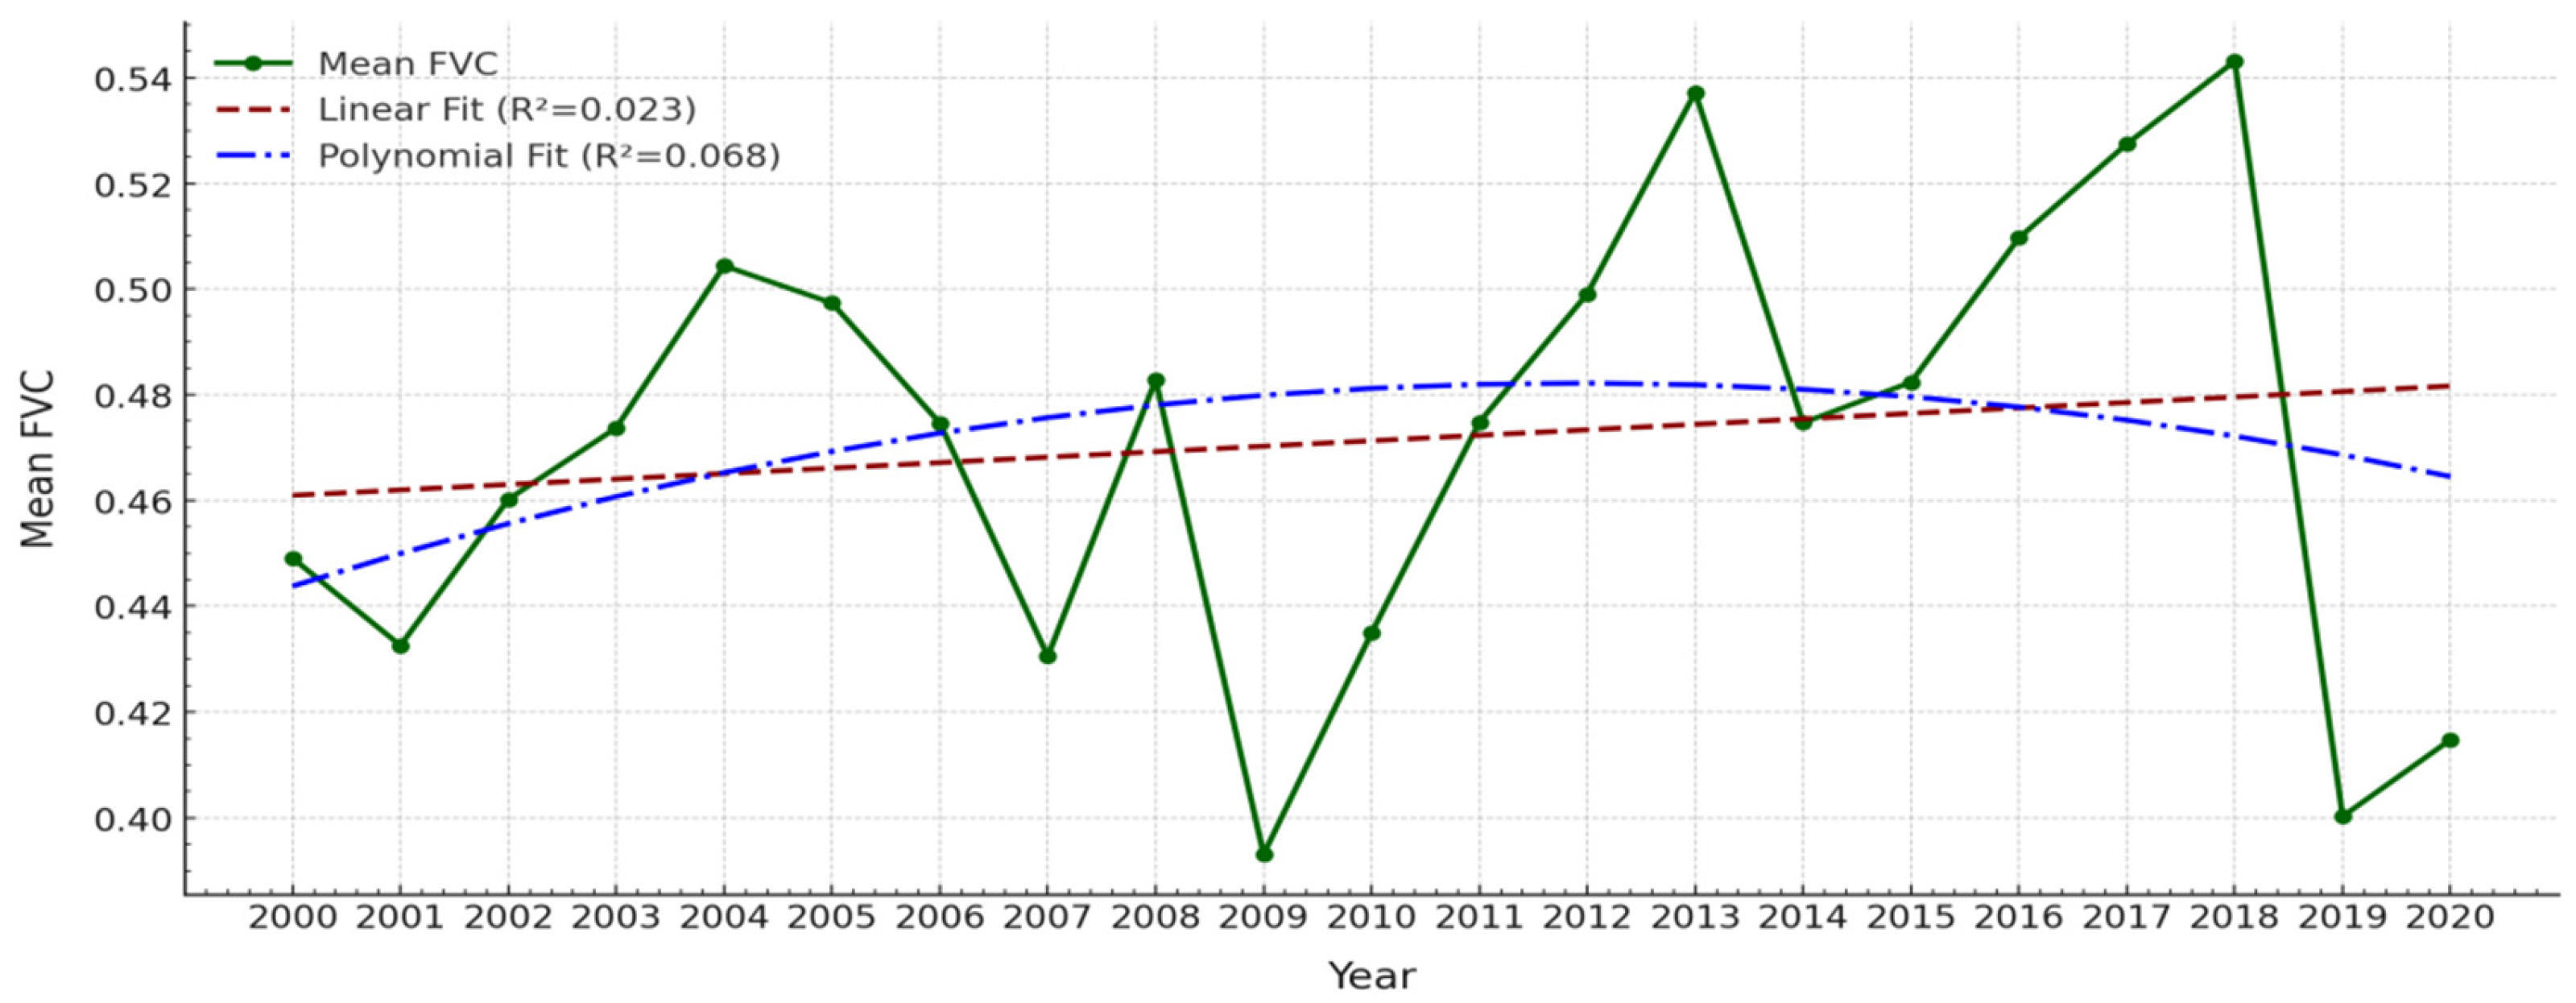
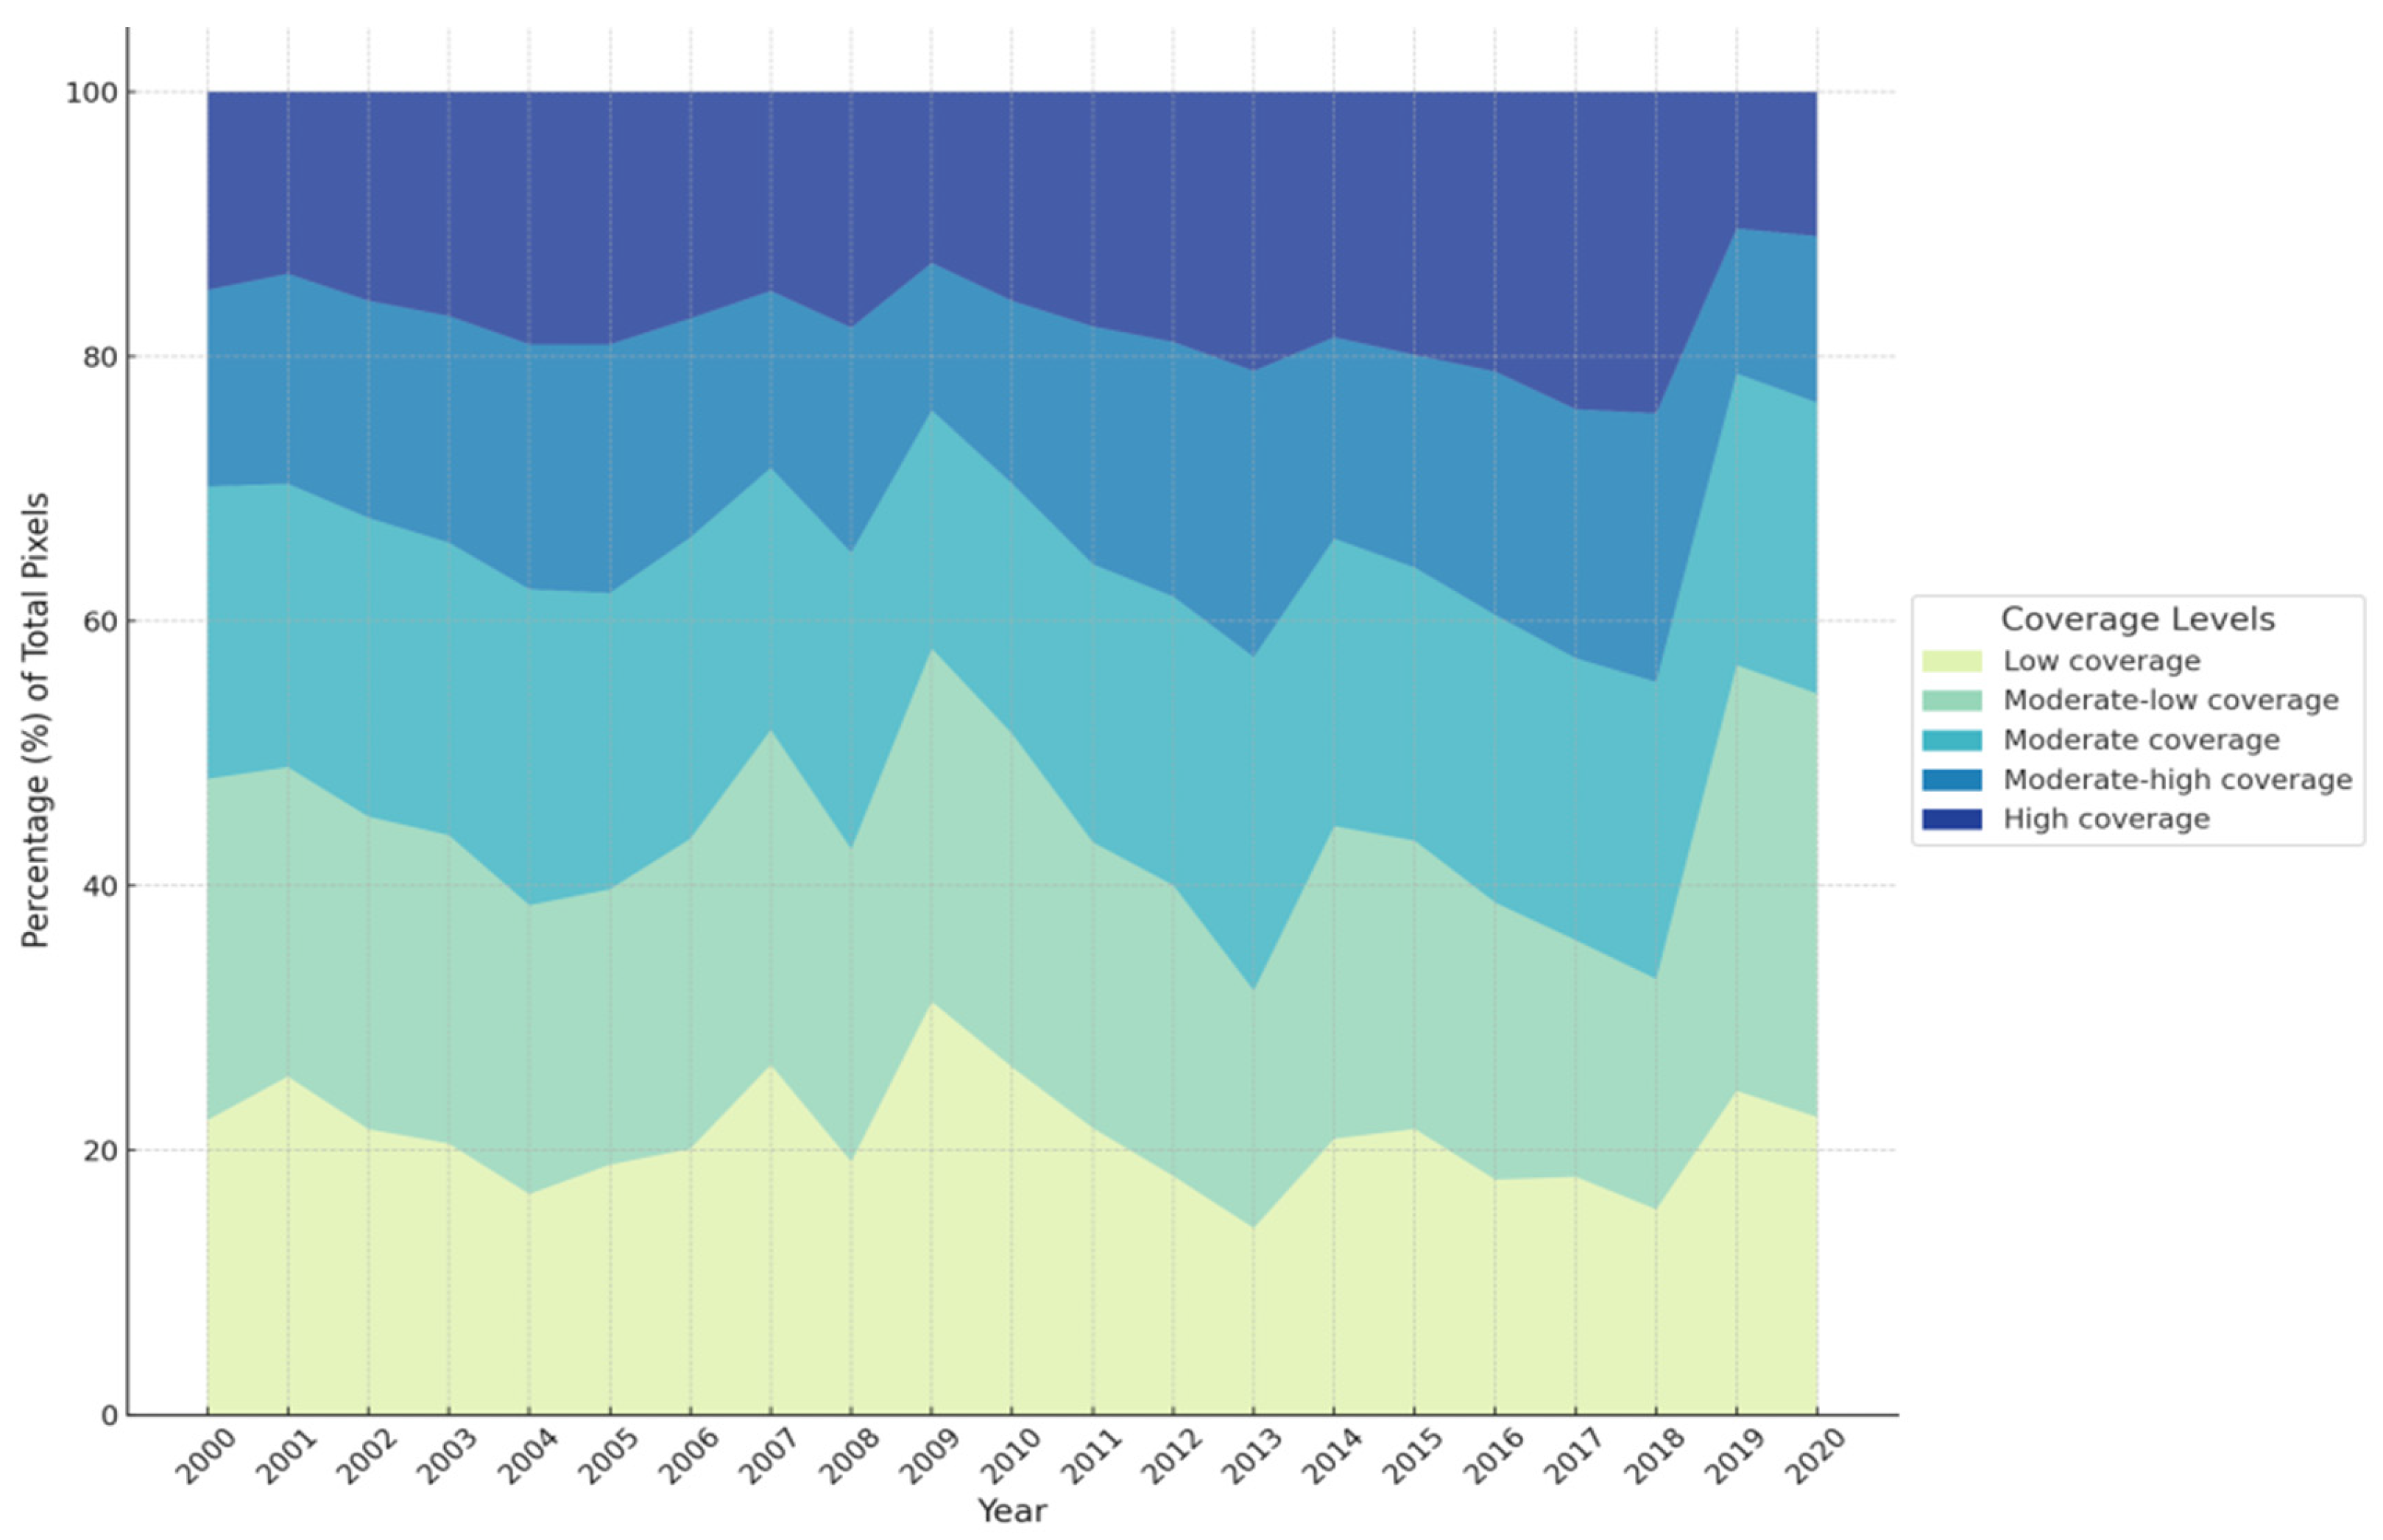
3.1. Temporal Characteristics of Vegetation Coverage

From 2000 to 2020, the mean fractional vegetation cover (FVC) in the agro-pastoral transitional zone of Inner Mongolia exhibited significant fluctuations, with an overall slightly increasing trend (Figure 2). Annual mean FVC data show a slight upward trend starting in the early 2000s, reaching a peak in 2004. However, it subsequently fluctuated downward, reaching its lowest value of 0.3931 in 2009.
Between 2010 and 2018, FVC showed a rapid upward trend, peaking at 0.5431 in 2018, the highest value over the 20-year study period. Following this, a sharp decline in FVC was observed in 2019.
Linear fitting results indicate that the linear trend of FVC change is relatively weak (R2 = 0.023), suggesting no significant directional change over the entire period. However, the non-linear fitting curve (R2 = 0.068) better captures the complexity of FVC dynamics, revealing distinct phases such as rapid growth before 2004 and a sharp decline after 2018.
The interannual variation of different vegetation coverage categories within the study area is illustrated in Figure 3. During the period from 2000 to 2020, the low coverage category exhibited significant fluctuations. In contrast, the high coverage category displayed a relatively stable trend, although it, along with the medium-high coverage category, experienced a rapid decline in proportion after 2018. During this same period, the proportion of the medium-low coverage category increased sharply, while the low coverage and medium coverage categories showed only minor changes.
This pattern indicates that, after 2018, regions with high and medium-high coverage gradually transitioned to the medium-low coverage category, reflecting a decline in vegetation quality in these areas.

3.2. Spatial Characteristics of Vegetation Coverage

From 2000 to 2020, the overall spatial distribution of FVC in the agro-pastoral transitional zone of Inner Mongolia exhibited a distinct “high in the east, low in the west” pattern, with significant spatiotemporal heterogeneity (Figure 4). Low coverage areas (FVC < 20%) were primarily concentrated in the desert steppe regions in the western part of the study area and the Horqin Sandy Land in Chifeng City. In contrast, high coverage areas (FVC > 80%) were mainly distributed in natural reserves located in Hohhot and Ulanqab, as well as in the natural forested areas along the southern slopes of the Greater Khingan Mountains in northern Chifeng City.
From a temporal perspective, during 2000–2010, the overall FVC in the agro-pastoral transitional zone of Inner Mongolia exhibited a decreasing trend in the northern regions and an increasing trend in the south, with areas of decline slightly exceeding those of increase (Figure 5). Slightly significant increasing regions (p < 0.1) were primarily concentrated in the southern parts of the study area, including Duolun County and the central areas of Taibus Banner in Xilingol League. In contrast, regions with extremely significant (p < 0.01) and highly significant (p < 0.05) declines were predominantly located in the central-western parts of the study area, particularly in Ulanqab City, as well as in the northern Chifeng City. Areas with slightly significant increases accounted for 31.32% of the total study area and were mainly distributed in Duolun County, southern Chifeng City, and southern Ulanqab City. Meanwhile, slightly significant decrease areas accounted for 41.57%, concentrated in eastern Ulanqab City and the northern grassland-pastoral areas of Chifeng City. Between 2010 and 2020, the proportion of slightly significant increase areas rose to 35.08%, predominantly in Hohhot, Baotou, and central Chifeng City, while slightly significant decrease areas shrank to 38.04%. The significance of FVC increase and decrease trends highlighted the spatial differentiation in vegetation changes, with northern Chifeng City (Keshiketeng Banner) and parts of Ulanqab City remaining hot spots for vegetation decline.
The stability analysis of FVC revealed that during 2000–2010, areas with extremely high variability (CV > 0.45) accounted for 33.51% of the study area and were primarily distributed in the western desert steppe and the Horqin Sandy Land within Chifeng City. Moderate variability areas (0.15 < CV ≤ 0.30) covered 26.82% of the study area and were largely located in the eastern regions. In the subsequent decade (2010–2020), the proportion of extremely high variability areas decreased by 6.38%, while moderate variability areas expanded to 32.93%, indicating that vegetation restoration measures effectively reduced fluctuations in FVC across certain regions. During the same period, the Hurst index analysis indicated that regions of continuous growth (H > 0.5 and slope > 0) accounted for 28.75% of the total study area and were concentrated in southern Hohhot, Chifeng City, and Duolun County in Xilingol League. Conversely, regions of continuous decline (H > 0.5 and slope < 0) accounted for 32.21%, mainly distributed in northern Chifeng City, eastern Ulanqab City, and Shangdu County, where FVC decline remained evident. Short-term reverse growth regions (H < 0.5 and slope > 0) covered 15.38% of the study area, primarily located in Baotou, Ulanqab, and northeastern Chifeng City. These regions, despite recent FVC increases, displayed limited sustainability for future vegetation trends.

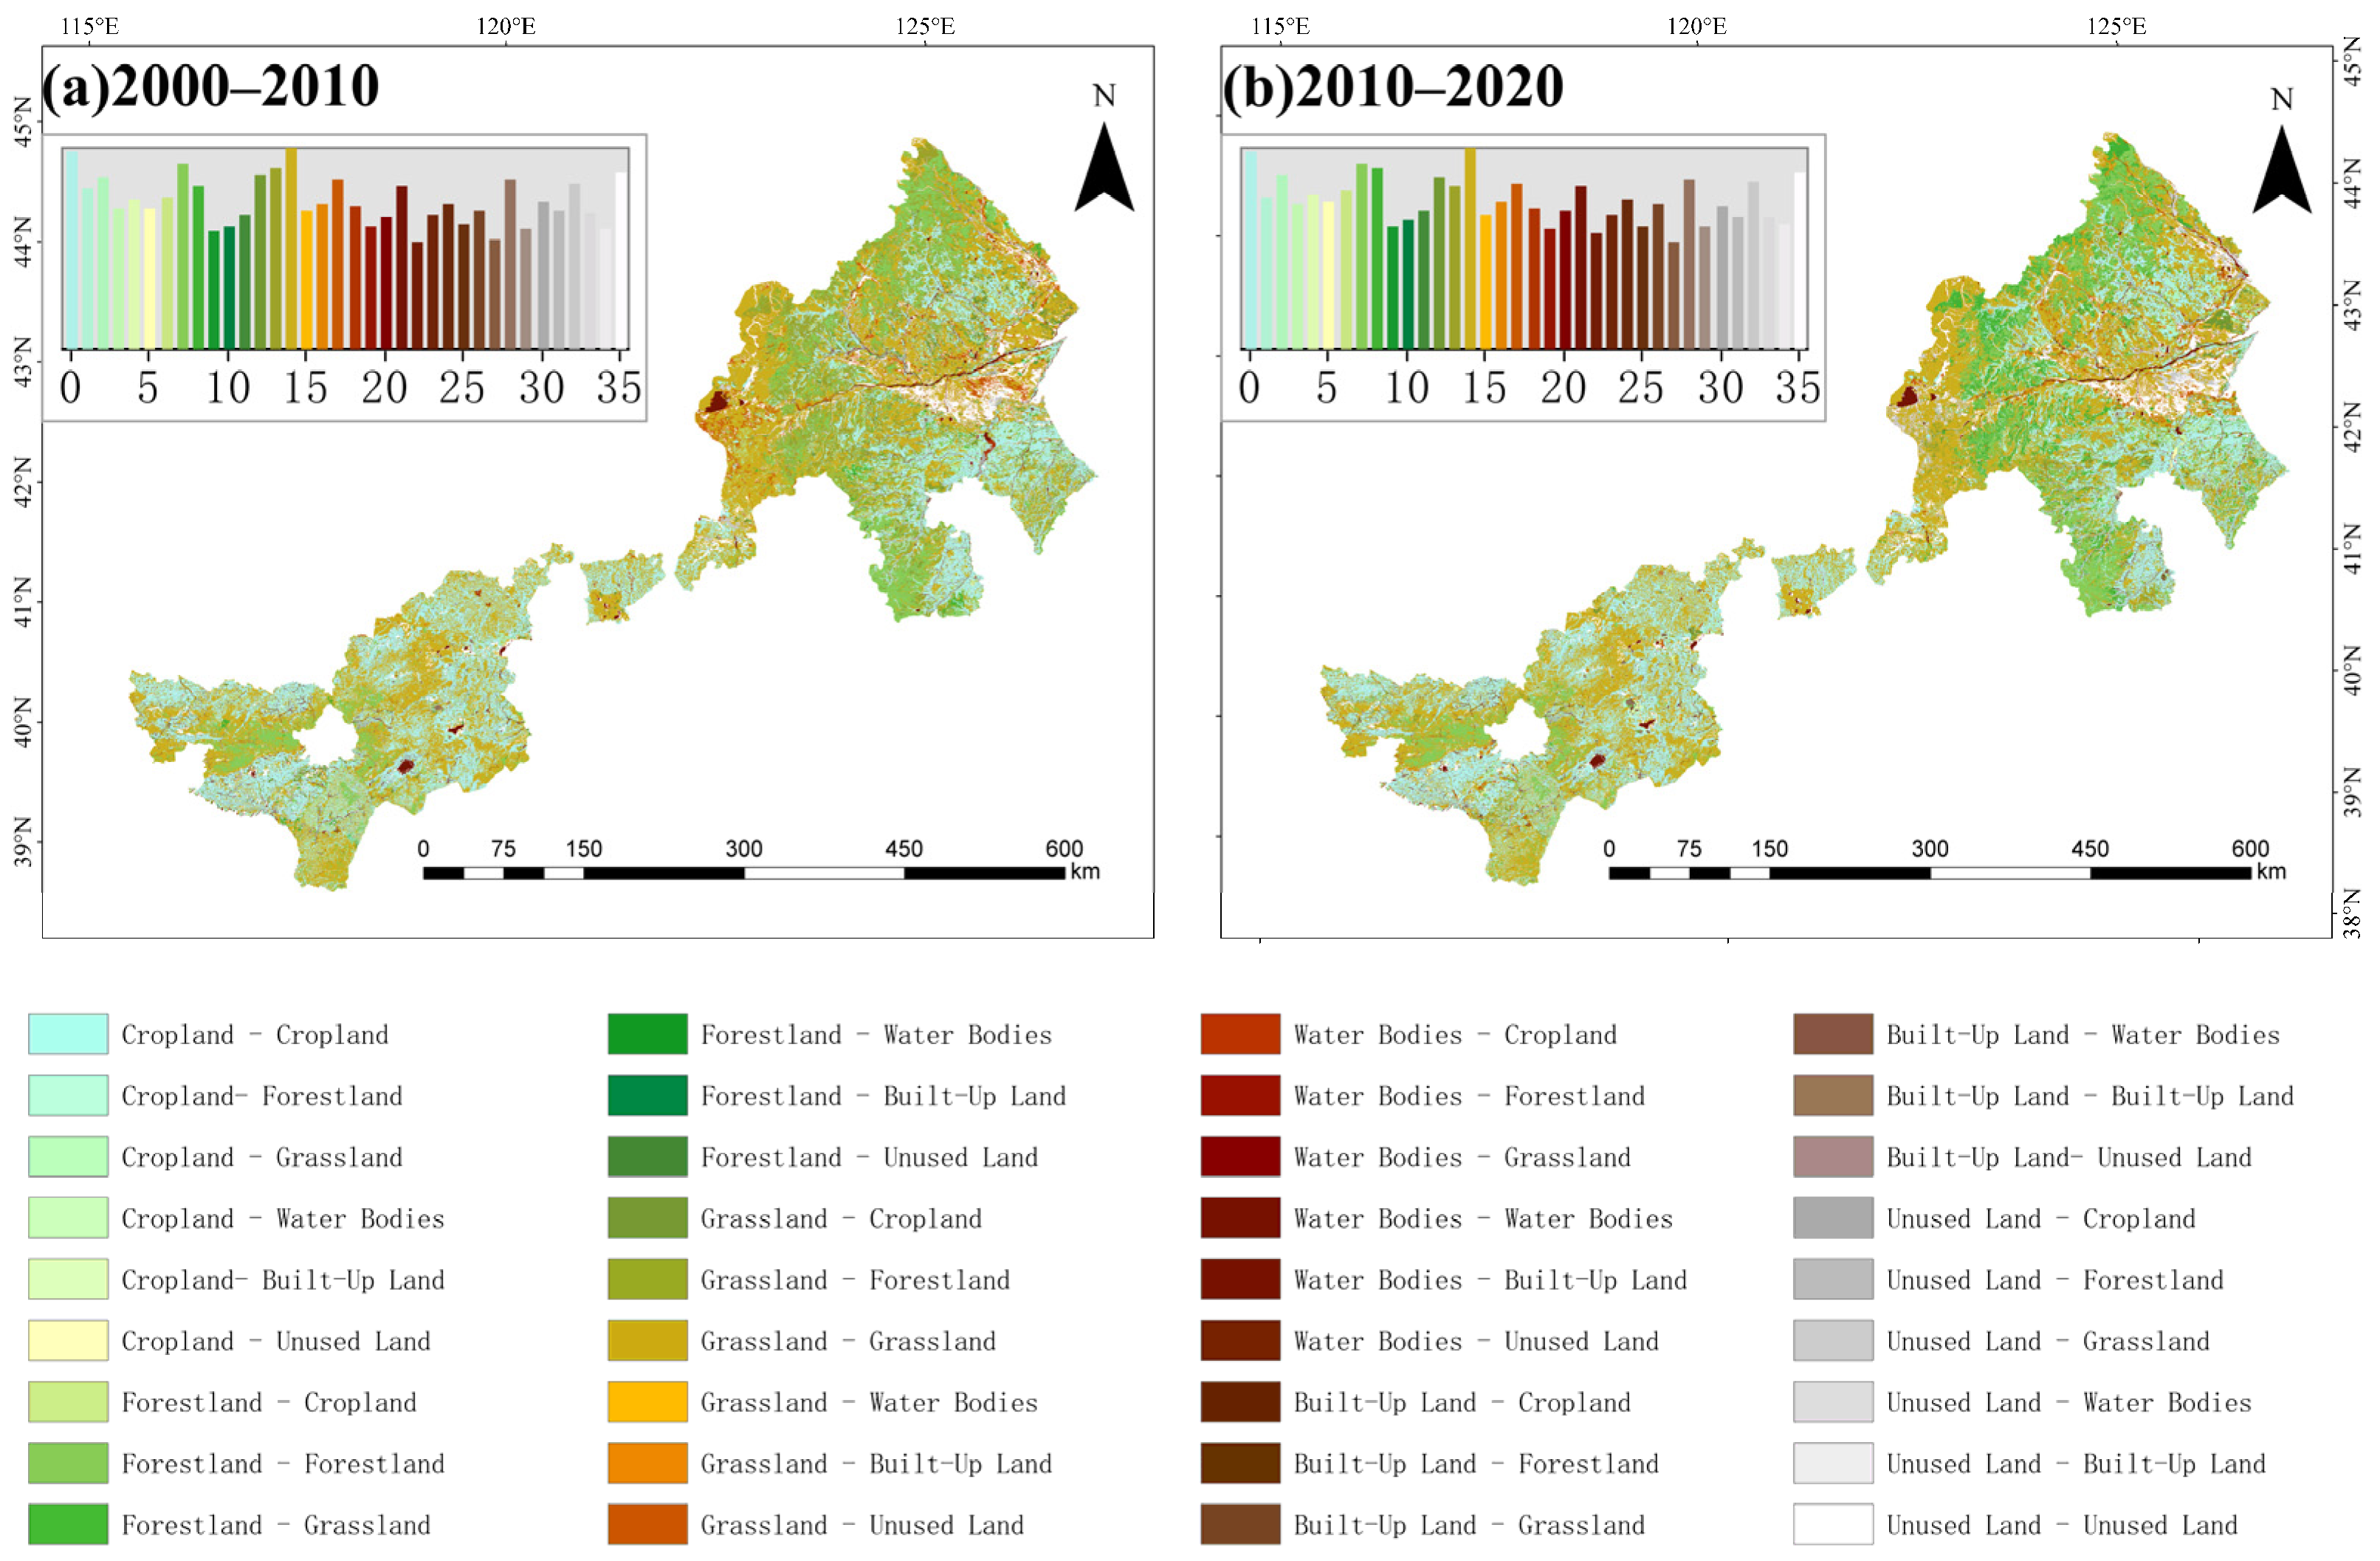
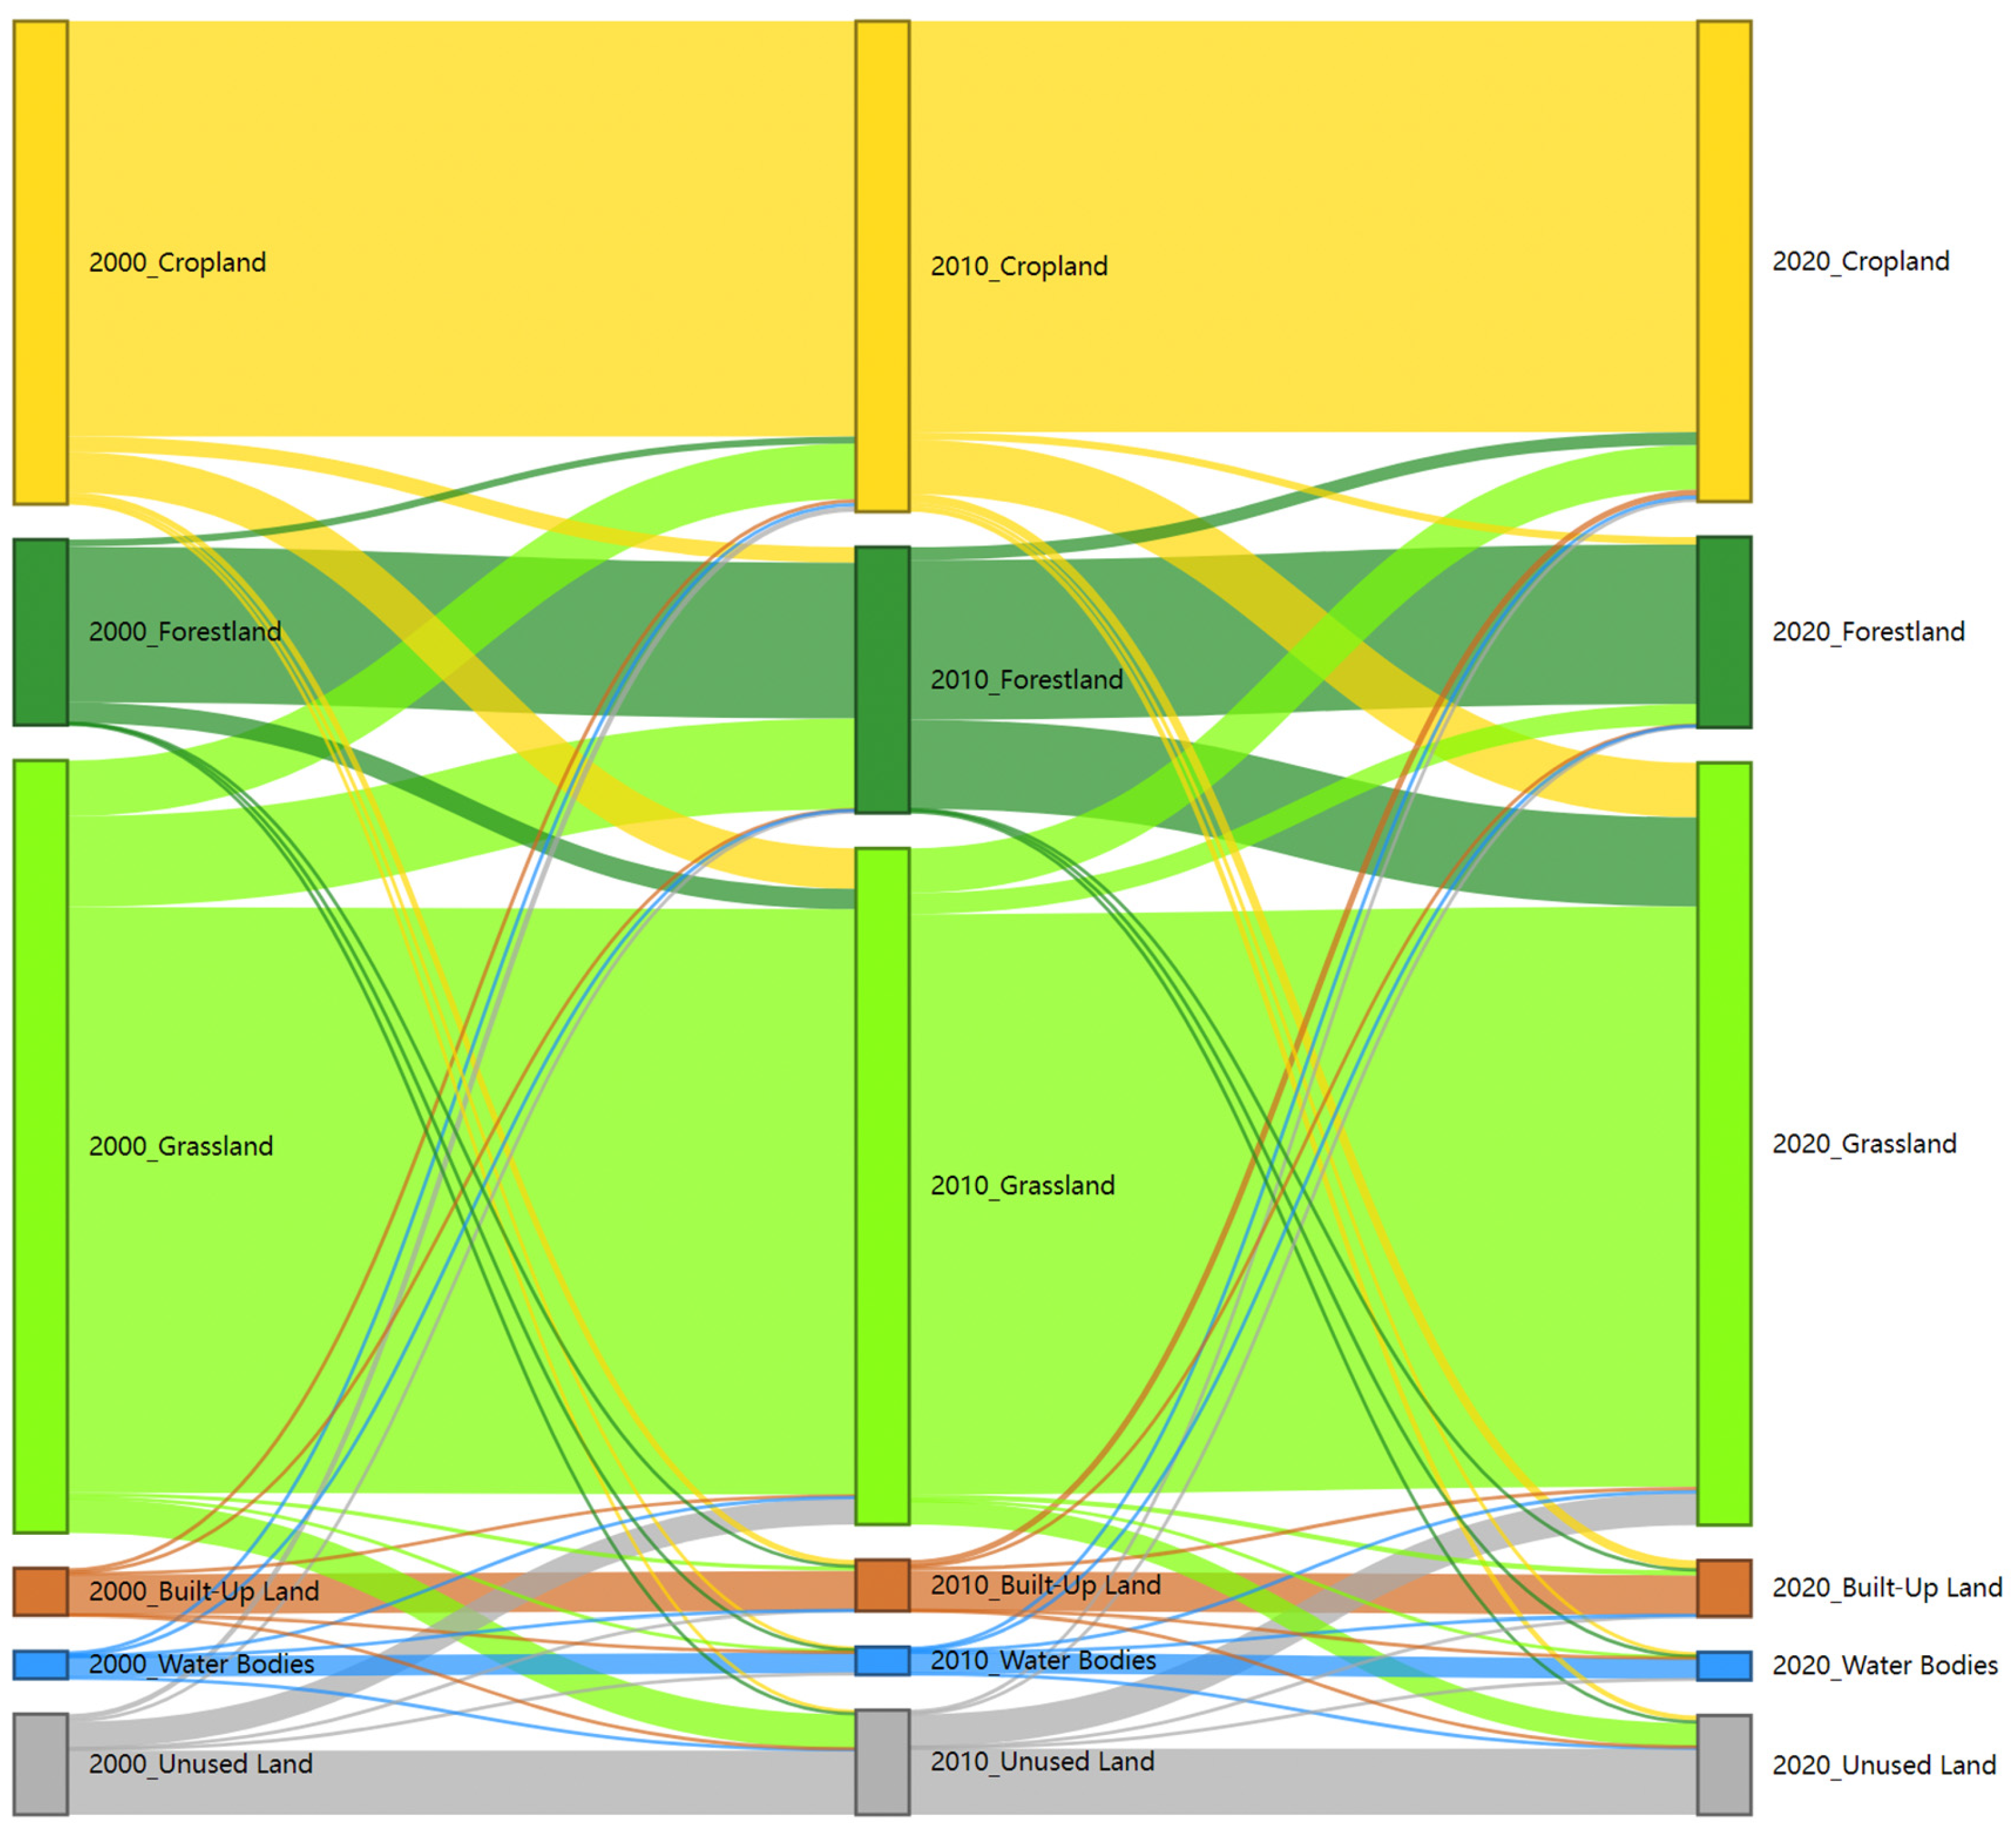
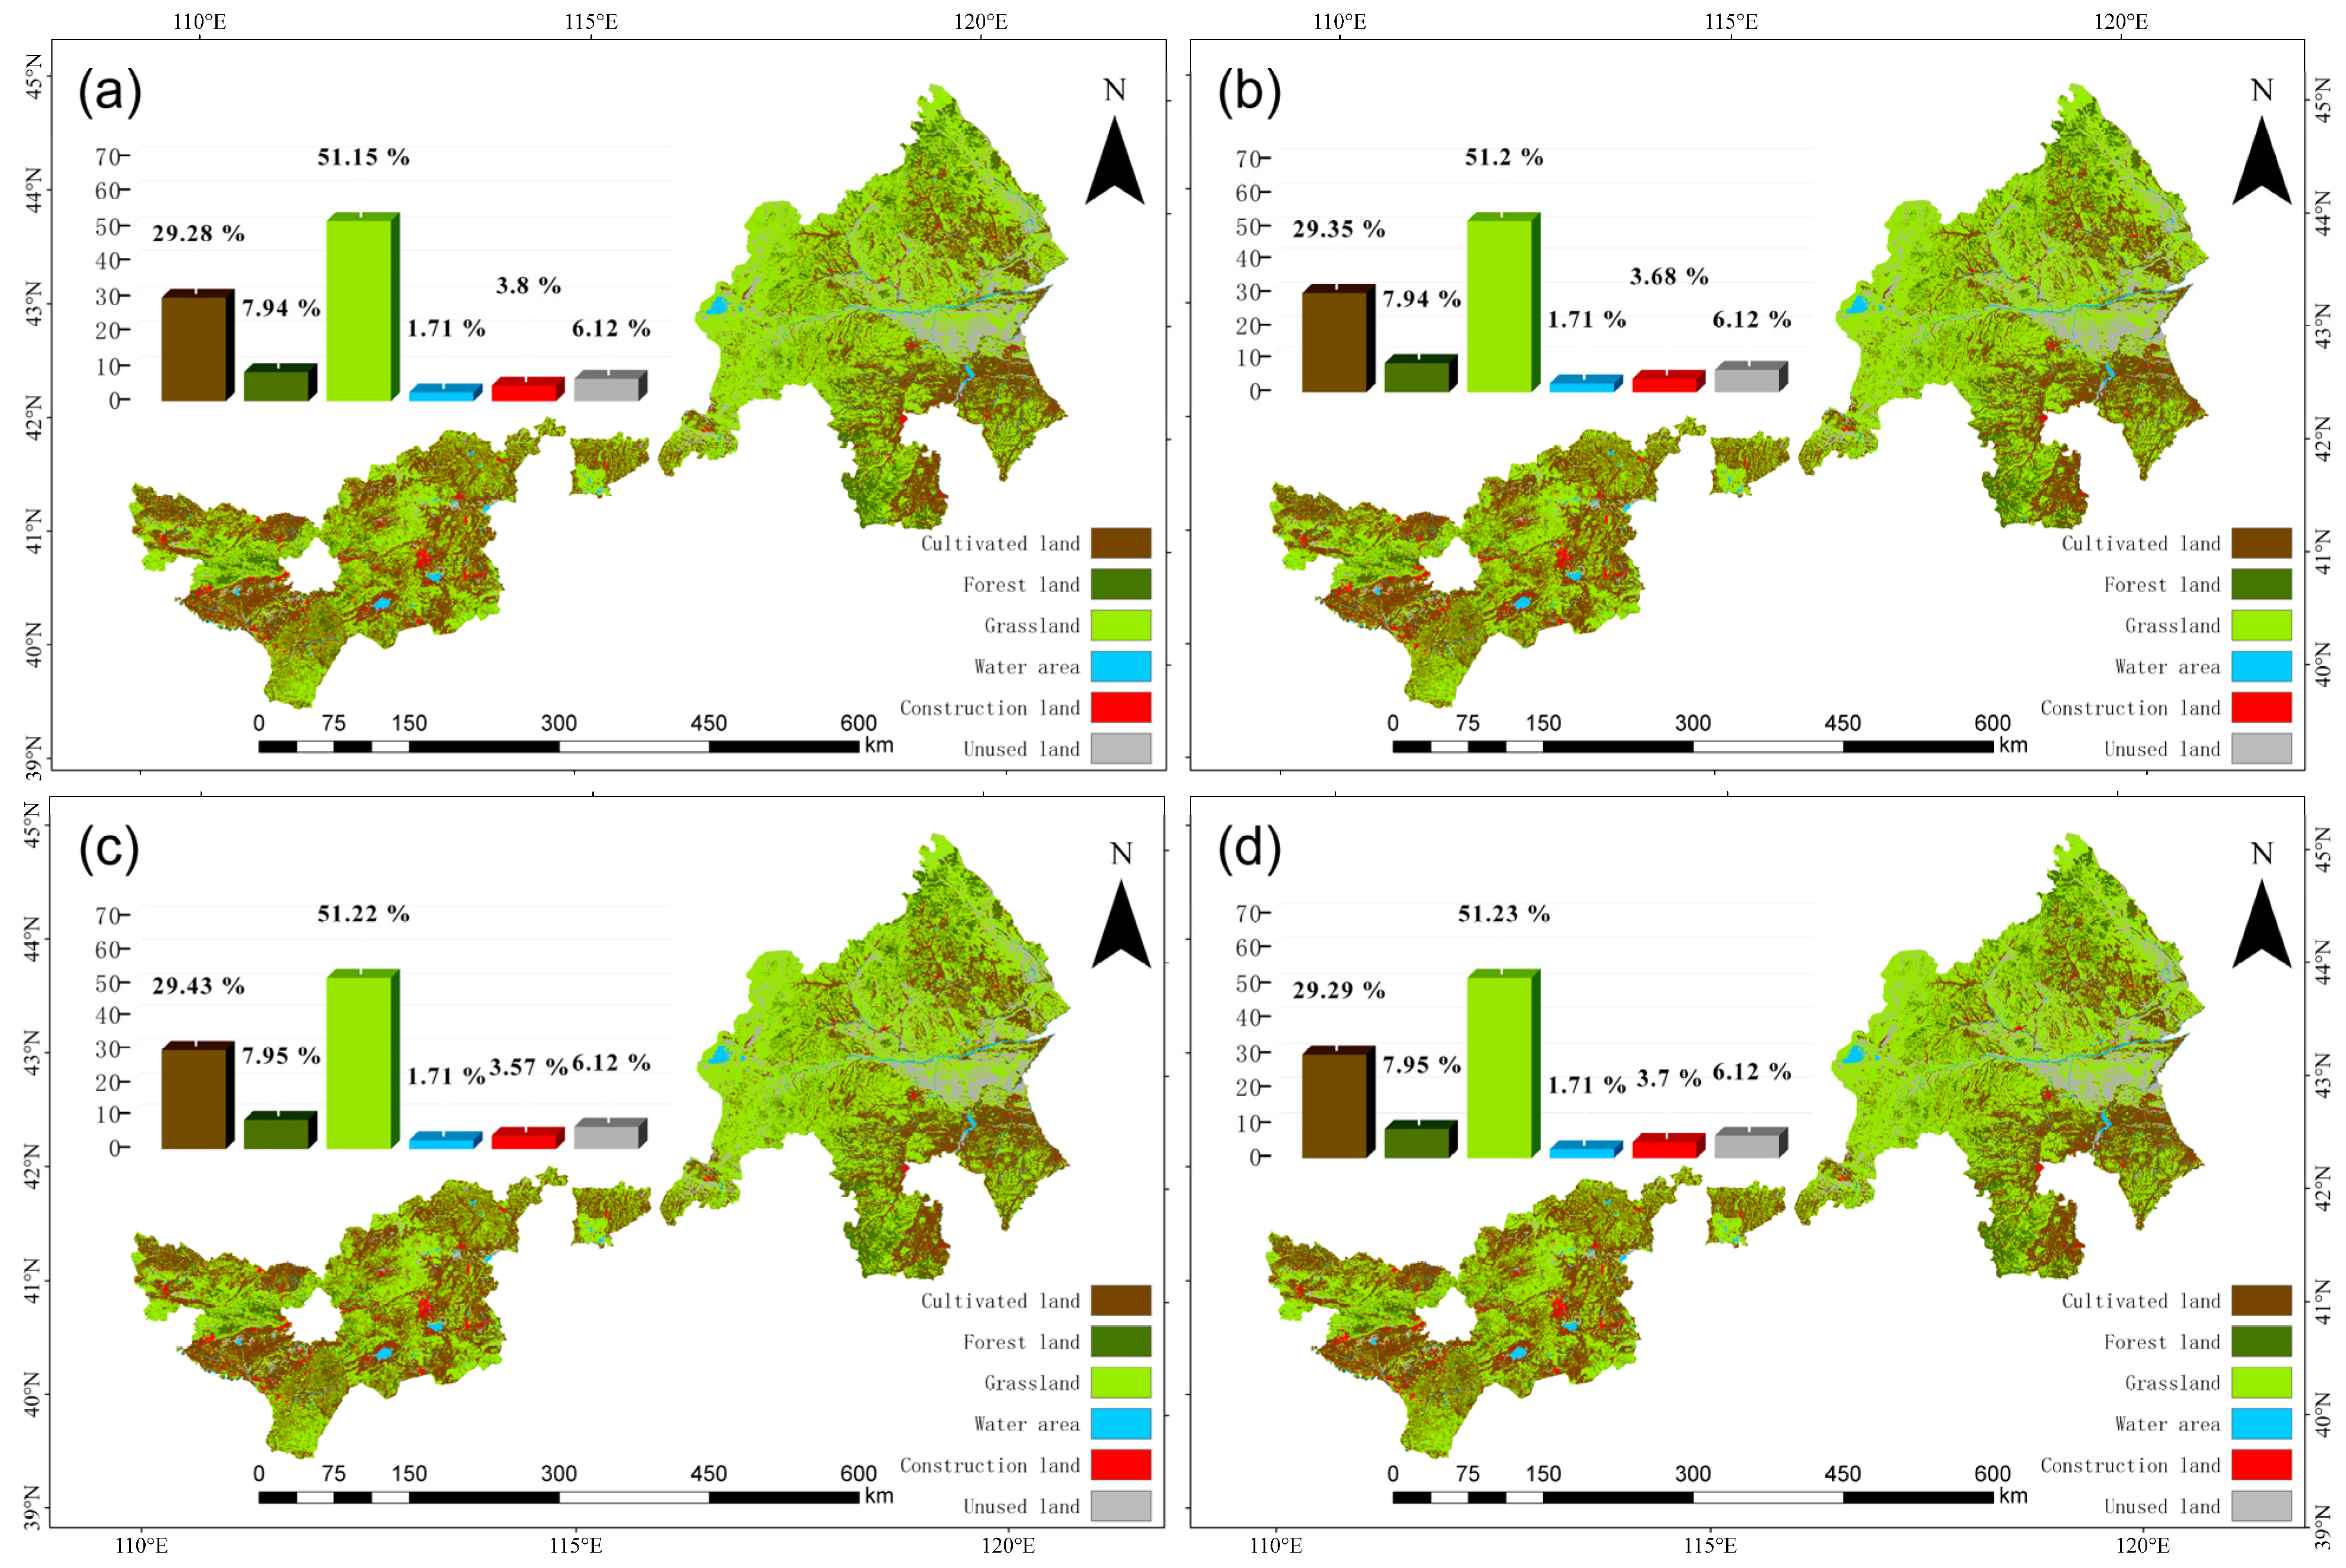
3.3. Land-Use Changes

Using the ArcGIS raster calculator, land-use data from 2000, 2010, and 2020 were processed to generate maps of primary land-use type transitions for the periods 2000–2010 and 2010–2020 (Figure 6). Additionally, Excel was used to organize and summarize the land-use area transfer matrices for these two periods (Table 7). Subsequently, R language 4.4.2 was employed to process the matrices and generate a Sankey diagram illustrating land-use transitions from 2000 to 2020 (Figure 7). From the results, the following statements can be made.
Between 2000 and 2010, the spatial distribution and transition patterns of land-use types in the study area exhibited significant regional variability (Figure 6). Cropland was primarily distributed in the western regions and the southeastern part of the eastern regions. The transition characteristics of cropland showed that the area of cropland converted to forestland was relatively small and mainly concentrated in the eastern regions, whereas the area of cropland converted to grassland was larger and widely distributed across the eastern regions, as well as Wuchuan County and Helingeer County in the west. Forestland was more abundant in the eastern regions and sparse in the west, primarily distributed in the northern and southern parts of Chifeng City, including Ningcheng County and the western part of Kalaqin Banner. In the western regions, forestland was sporadically distributed in Tumd Left Banner and Wuchuan County in Hohhot, as well as Zhuozi County and Liangcheng County in Ulanqab. Forestland transitions were mainly characterized by conversion to grassland, which was concentrated in southeastern Ningcheng County, northwestern Songshan District, and northern Chifeng City. Additionally, small-scale forestland-to-grassland transitions occurred in Wuchuan County, Helingeer County, and Tuoketuo County in Hohhot. The area of forestland converted to cropland was minimal, mainly occurring in southern Chifeng City. Grassland covered a vast area, almost spanning the entire study region, with transitions primarily involving conversions to cropland and forestland. Grassland-to-cropland transitions were widespread across Chifeng City, with scattered occurrences in Tuoketuo County in Hohhot and southeastern Ulanqab. Grassland-to-forestland transitions were concentrated in the northern and western parts of Chifeng City, as well as Aohan Banner. Unused land was primarily concentrated in the eastern regions, particularly within the Horqin Sandy Land, including Ongniud Banner and its northeastern areas, western Keshiketeng Banner, and Duolun County. In the west, unused land was sparsely distributed. Unused land was predominantly converted to grassland, mainly in Ongniud Banner and its northern areas in Chifeng City, as well as in Duolun County in Xilingol League. Conversions of unused land to cropland or forestland were relatively small and occurred mainly in southeastern Chifeng City and Tuoketuo County in Hohhot.
Between 2010 and 2020, the area of cropland converted to forestland significantly decreased, primarily occurring in Chifeng City, with sporadic instances in Tuoketuo County in Hohhot, Chahar Right Front Banner, Chahar Right Back Banner, Zhuozi County, and Xinghe County in Ulanqab. Cropland-to-grassland transitions occurred throughout the study area but were more prevalent in the eastern regions than in the west (Figure 6). Forestland-to-cropland and forestland-to-grassland transitions were mainly concentrated within Chifeng City, with fewer occurrences in the western regions. Grassland-to-cropland transitions were widespread across Chifeng City, particularly concentrated in the southern parts of Ar Horqin Banner. In the western regions, grassland-to-cropland transitions were scattered in Helingeer County in Hohhot and parts of Ulanqab. Unused land transitions during this period were relatively rare. Conversions of unused land to cropland and forestland were scattered and limited to the eastern regions, while unused land-to-grassland transitions were primarily concentrated in Ongniud Banner and its northeastern regions, the central-western parts of Keshiketeng Banner, and the central part of Taibus Banner in Xilingol League.
As shown in Table 7, during 2000–2010, land-use transitions in the study area were primarily characterized by an increase in cropland and forestland areas, along with a substantial decrease in grassland area. Cropland was predominantly converted to grassland, forestland, and unused land, with transition areas of 3649.76 km2, 1405.61 km2, and 265.74 km2, respectively. Grassland was mainly converted to forestland, cropland, and unused land, with transition areas of 8176.48 km2, 5013.27 km2, and 3081.51 km2, respectively. Forestland transitions were primarily to grassland and cropland, with areas of 1829.97 km2 and 638.10 km2, respectively. Unused land was predominantly converted to grassland and cropland, with areas of 2373.17 km2 and 487.17 km2, respectively. Transitions involving built-up land and water bodies were relatively minor.
During 2010–2020, land-use transitions were marked by an increase in grassland area, a decrease in forestland area, and a slight reduction in cropland area. Grassland was primarily converted to cropland, forestland, and unused land, with transition areas of 4017.81 km2, 1899.41 km2, and 2126.40 km2, respectively. Cropland was mainly converted to grassland, built-up land, and forestland, with transition areas of 4900.23 km2, 795.76 km2, and 678.89 km2, respectively. Forestland transitions were primarily to grassland and cropland, with areas of 8039.95 km2 and 1170.22 km2, respectively. Unused land was mainly converted to grassland and cropland, with areas of 2904.92 km2 and 274.33 km2, respectively. Transitions involving built-up land and water bodies remained minimal.
During 2000–2020, the dynamic transitions between various land-use types in the study area were highly complex, with cropland, grassland, and forestland being the primary categories of change (Figure 7). Between 2000 and 2010, grassland experienced the largest area of conversion to other land-use types, particularly to forestland and cropland, with these transitions occurring extensively across the entire study area. In contrast, during 2010–2020, grassland showed significant recovery, becoming the only land-use type with a net increase in area. Meanwhile, forestland and cropland experienced reductions, with a particularly large area of forestland transitioning to grassland. During this period, the overall conversion of unused land decreased, with most transitions occurring toward grassland.

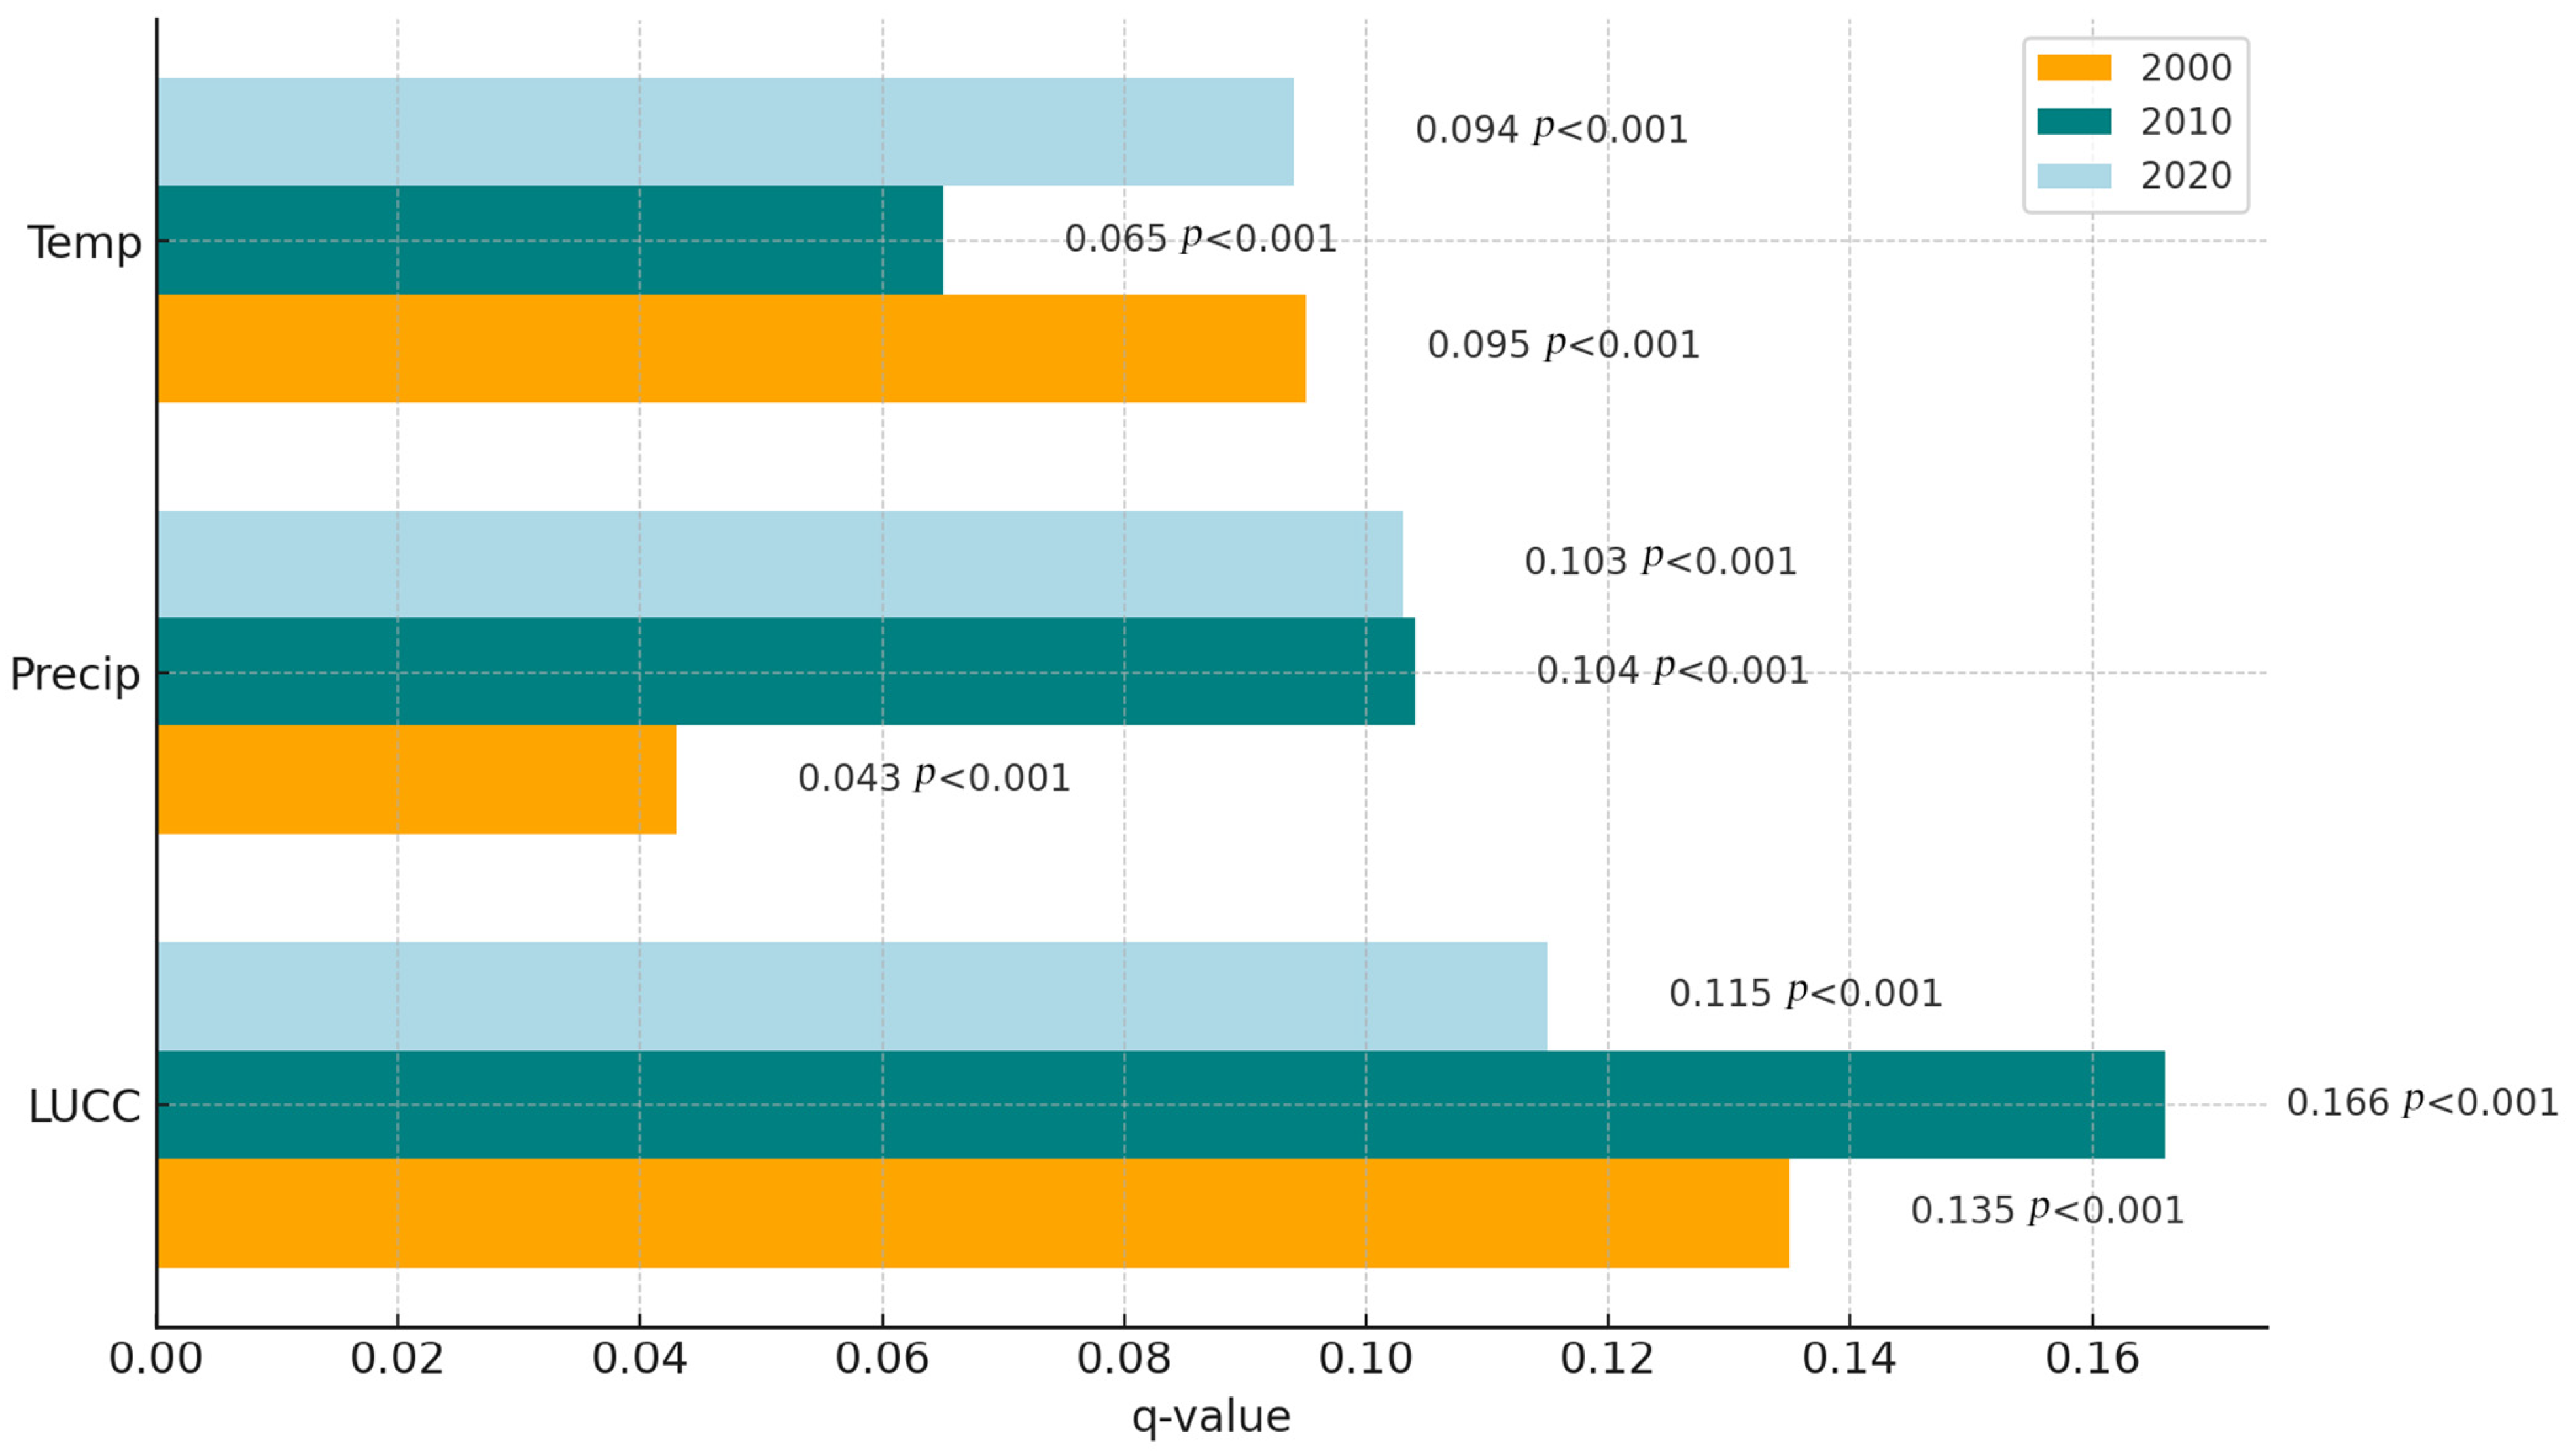
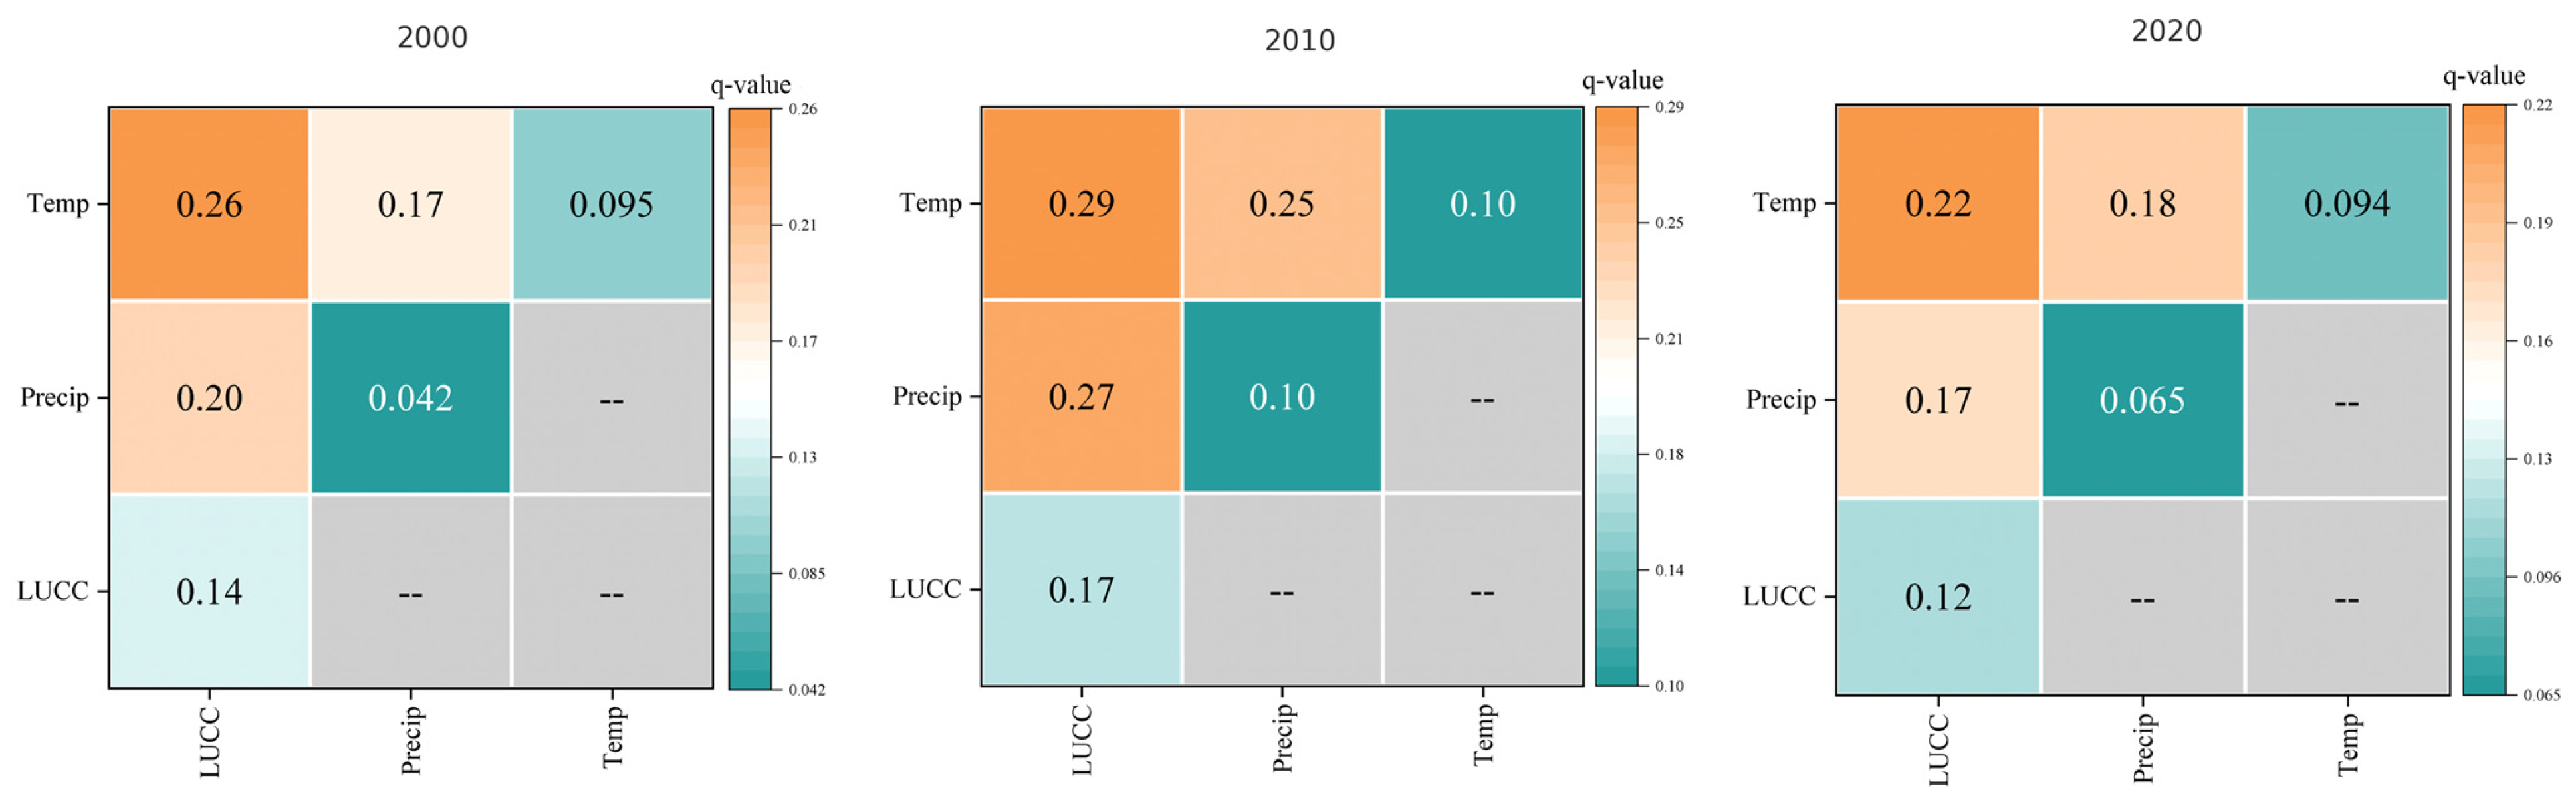
3.4. Drivers Influencing Vegetation Cover Change

The results of the GeoDetector analysis show that, among the three driving factors—land-use/land-cover change (LUCC), annual average precipitation (Precip), and annual average temperature (Temp)—LUCC had the highest explanatory power in detecting changes in vegetation cover in single-factor analysis. In 2000, 2010, and 2020, LUCC consistently had a highly significant impact on vegetation cover change (p < 0.01) (Figure 8). In the interaction-factor analysis, the interaction between LUCC and Temp consistently exhibited the strongest explanatory power, followed by the interaction between LUCC and Precip, and lastly, the interaction between Temp and Precip (Figure 9). These results suggest that LUCC not only directly affects vegetation cover but also plays an important role in vegetation change through interactions with climate factors.
Building on these findings, this study further explores the specific impact of different land-cover types on vegetation coverage. Specifically, the research analyzes the promoting or inhibiting effects of conversions between land-use types, such as grasslands, croplands, and forests, on vegetation coverage. By overlaying the MK–Sen trend analysis maps with the land-use change maps, significance analysis maps were generated to assess the impact of land-use changes on FVC trends during the periods 2000–2010 and 2010–2020 (Figure 10 and Figure 11). These maps provide a spatial representation of the correlation between land-use transitions and FVC dynamics, highlighting the areas where land-use changes had significant positive or negative effects on vegetation coverage.
During 2000–2010, the transitions of cropland primarily to grassland and forestland showed varying impacts on FVC. For cropland-to-grassland conversions, the areas with slightly significant increases and decreases were nearly equal, though areas with highly significant increases slightly exceeded those with highly significant decreases (Figure 10). For cropland-to-forestland transitions, the slightly significant decrease area was marginally larger than the slightly significant increase area. However, at the highly significant and extremely significant levels, the increase area was larger than the decrease area. Forestland was primarily converted to grassland and cropland, with a smaller portion converted to unused land. For forestland-to-cropland transitions, areas with slightly significant increases and decreases were comparable. In forestland-to-grassland transitions, slightly significant decreases exceeded slightly significant increases, though at the highly significant and extremely significant levels, increases outweighed decreases. Grassland was mainly converted to cropland, forestland, and unused land. For grassland-to-cropland transitions, slightly significant decreases slightly exceeded increases, and a similar pattern was observed for grassland-to-forestland transitions. However, for grassland-to-unused land transitions, slightly significant decreases were larger than increases. Water bodies transitioning to other land use types had a significant positive impact on FVC. Whether water bodies were converted to cropland, grassland, or forestland, the areas with slightly significant, significant, highly significant, and extremely significant increases were all larger than the corresponding decreases. For water bodies converted to unused land, areas with slightly significant, highly significant, and extremely significant increases exceeded those with decreases, showing an overall trend of FVC improvement. For built-up land converted to cropland, areas with FVC increases exceeded those with decreases, though transitions to forestland or grassland did not show significant changes. For unused land converted to cropland, areas with slightly significant, significant, highly significant, and extremely significant increases were all larger than the corresponding decreases. However, for unused land converted to forestland and grassland, slightly significant and significant decreases slightly exceeded increases, while at extremely significant levels, decreases were smaller than increases.
As shown in Figure 11, during 2010–2020, the transition of cropland to forestland did not exhibit a clear trend in FVC changes across different significance levels. However, cropland-to-grassland transitions showed a decreasing trend at slightly significant and highly significant levels, and cropland-to-built-up land transitions indicated a slightly significant decline in FVC. Forestland-to-grassland transitions were associated with significant FVC reductions, while forestland-to-cropland transitions showed slightly significant decreases. Grassland-to-cropland transitions were only observed at slightly significant levels, with balanced FVC increasing and decreasing trends. Grassland-to-forestland and grassland-to-built-up land transitions did not show notable FVC changes. For water bodies converted to cropland, slightly significant decreases in FVC slightly exceeded increases. Water bodies converted to forestland did not exhibit significant differences in FVC changes, while those converted to grassland showed larger areas of FVC increases than decreases at significant, highly significant, and extremely significant levels. For water bodies converted to unused land, slightly significant increases and decreases were nearly equal. Built-up land converted to cropland showed significant FVC reductions, and built-up land converted to forestland or grassland also showed FVC decreases at slightly significant and extremely significant levels. For unused land converted to cropland, forestland, and grassland, no significant differences in FVC trends were observed.
Overall, the transitions of grassland, forestland, and unused land played a key role in enhancing FVC, while cropland transitions exerted dual pressure on FVC improvement and built-up land expansion. During the study period, cropland-to-forestland and water-body-to-cropland, forestland, and grassland transitions consistently resulted in FVC increases, particularly in areas with high levels of significance. Additionally, transitions of water bodies to unused land also contributed to FVC improvement. In contrast, grassland-to-unused land and forestland-to-grassland or cropland transitions generally led to FVC declines. This trend was especially prominent during 2010–2020, where these transitions resulted in noticeable FVC decreases across significance levels, from slightly significant to extremely significant. Furthermore, during 2010–2020, built-up land converted to cropland exhibited slightly significant declines in FVC over small areas.

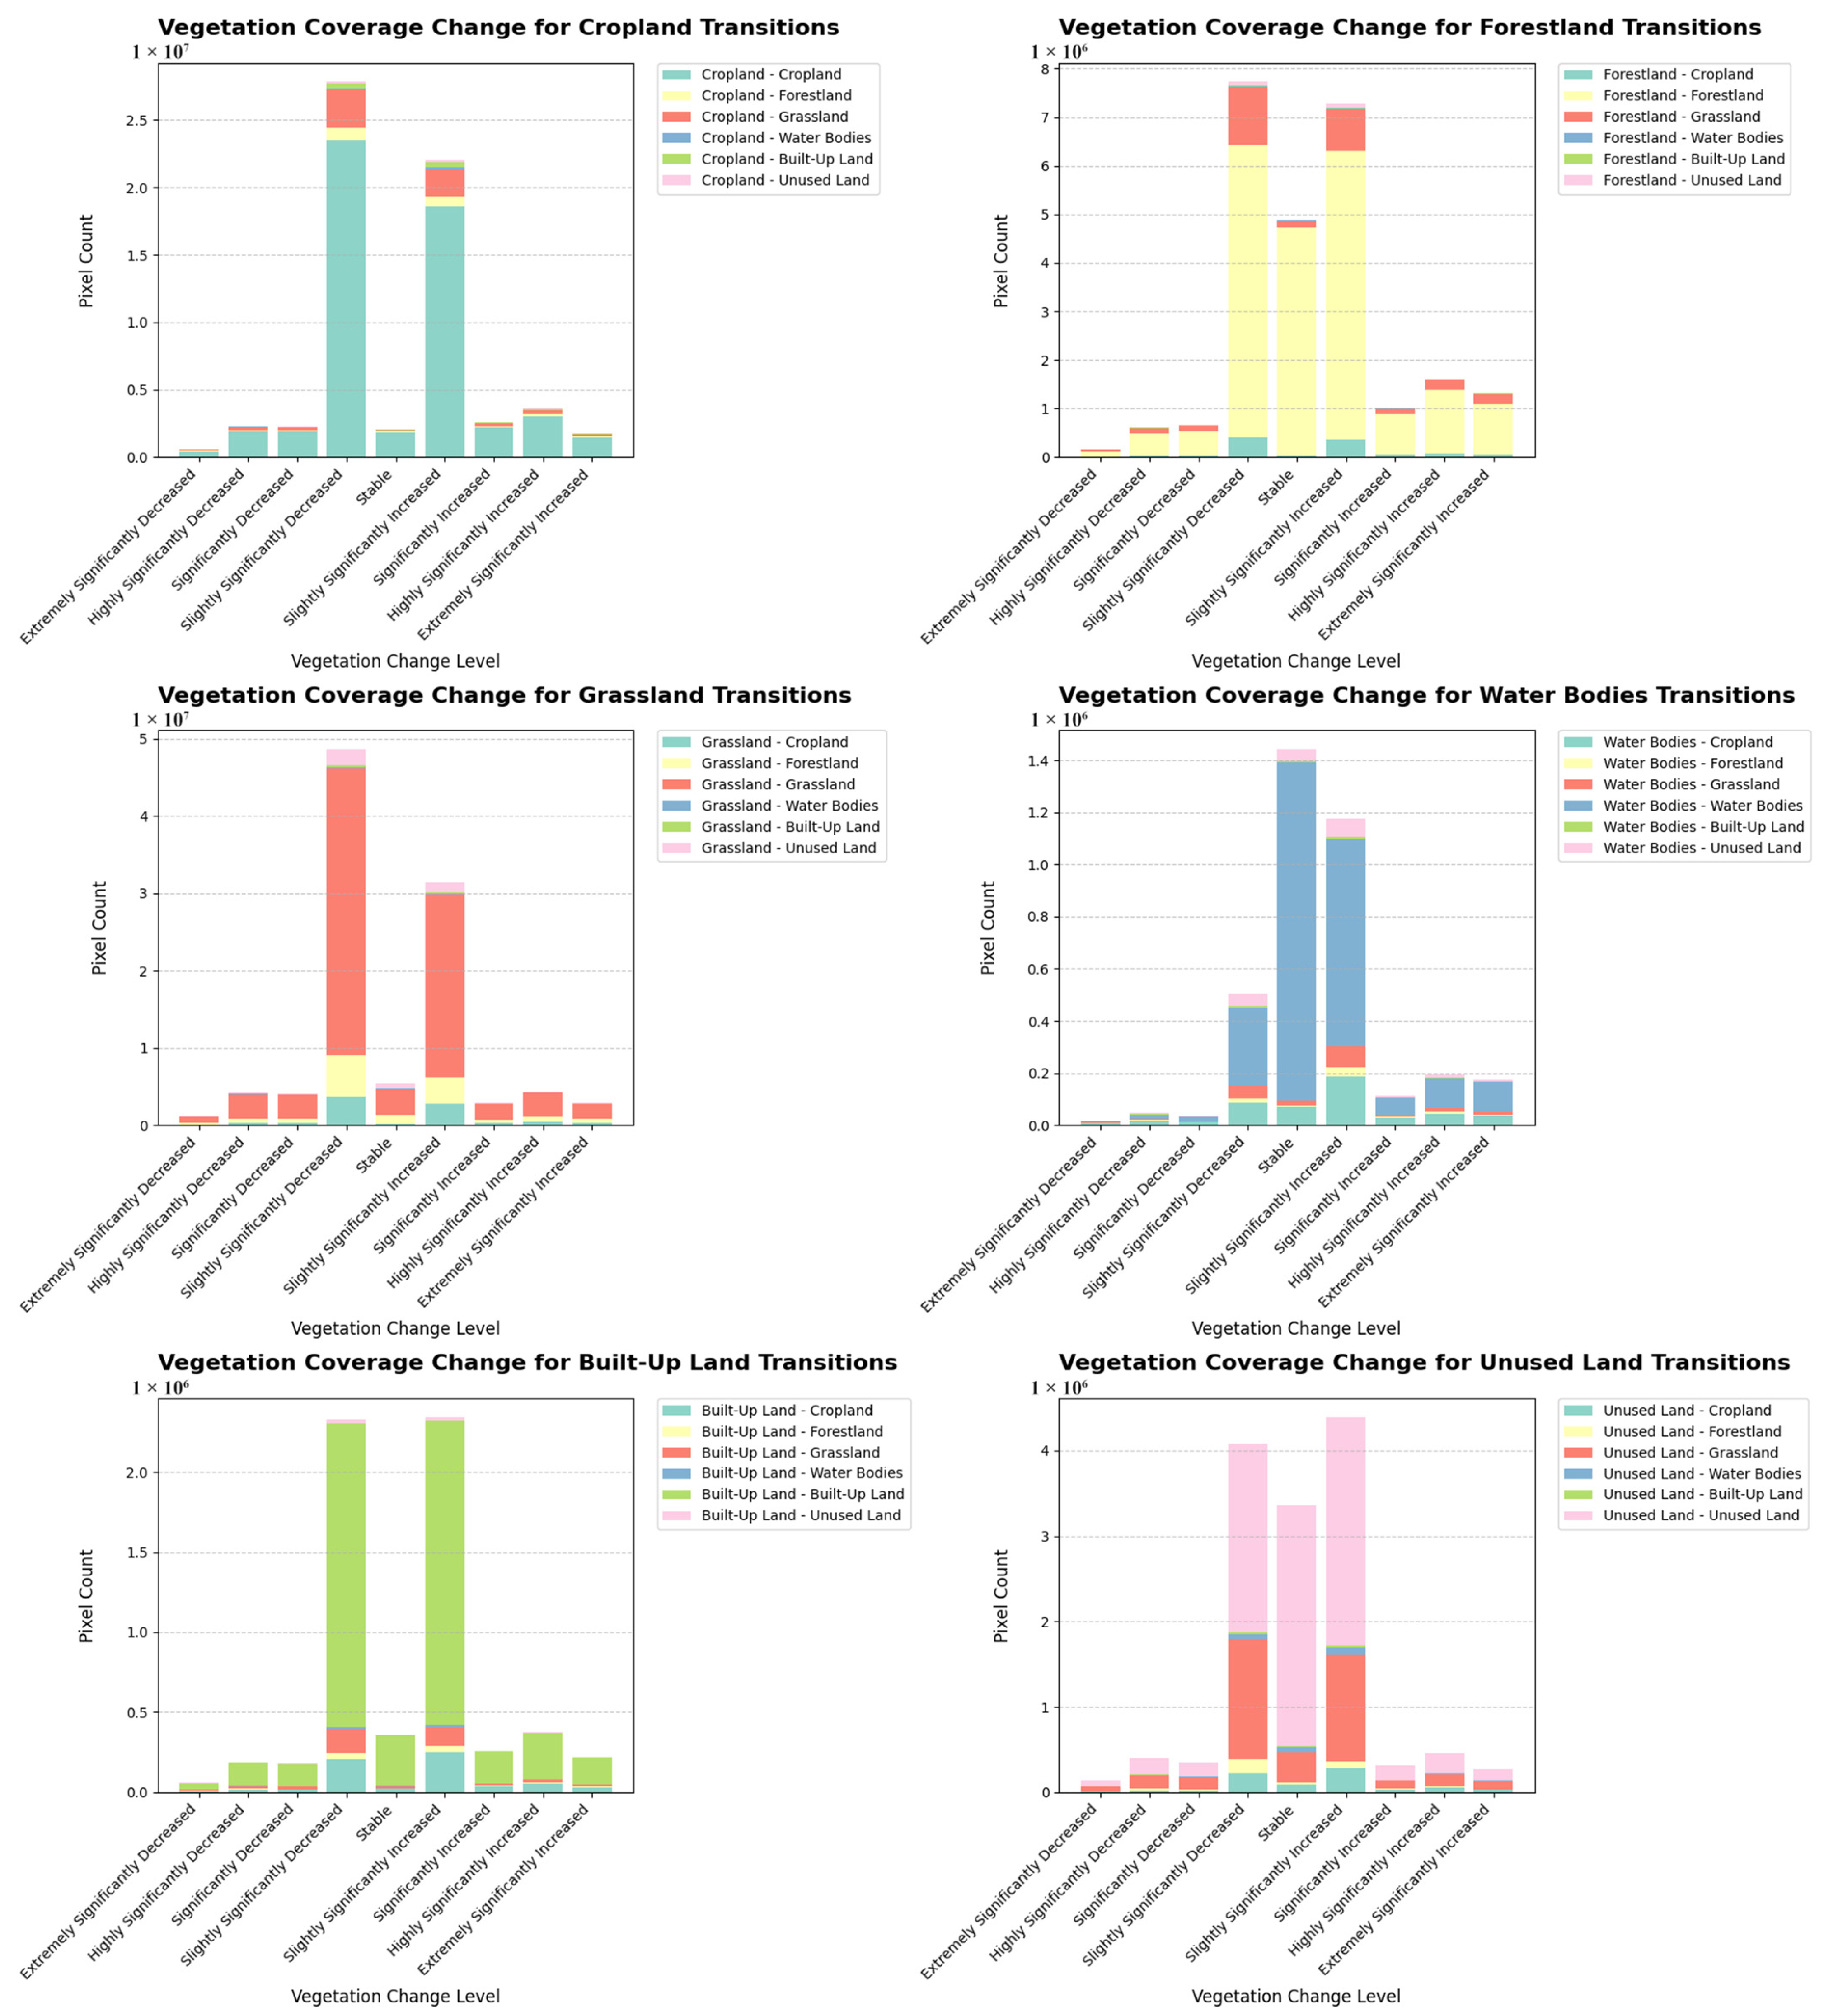
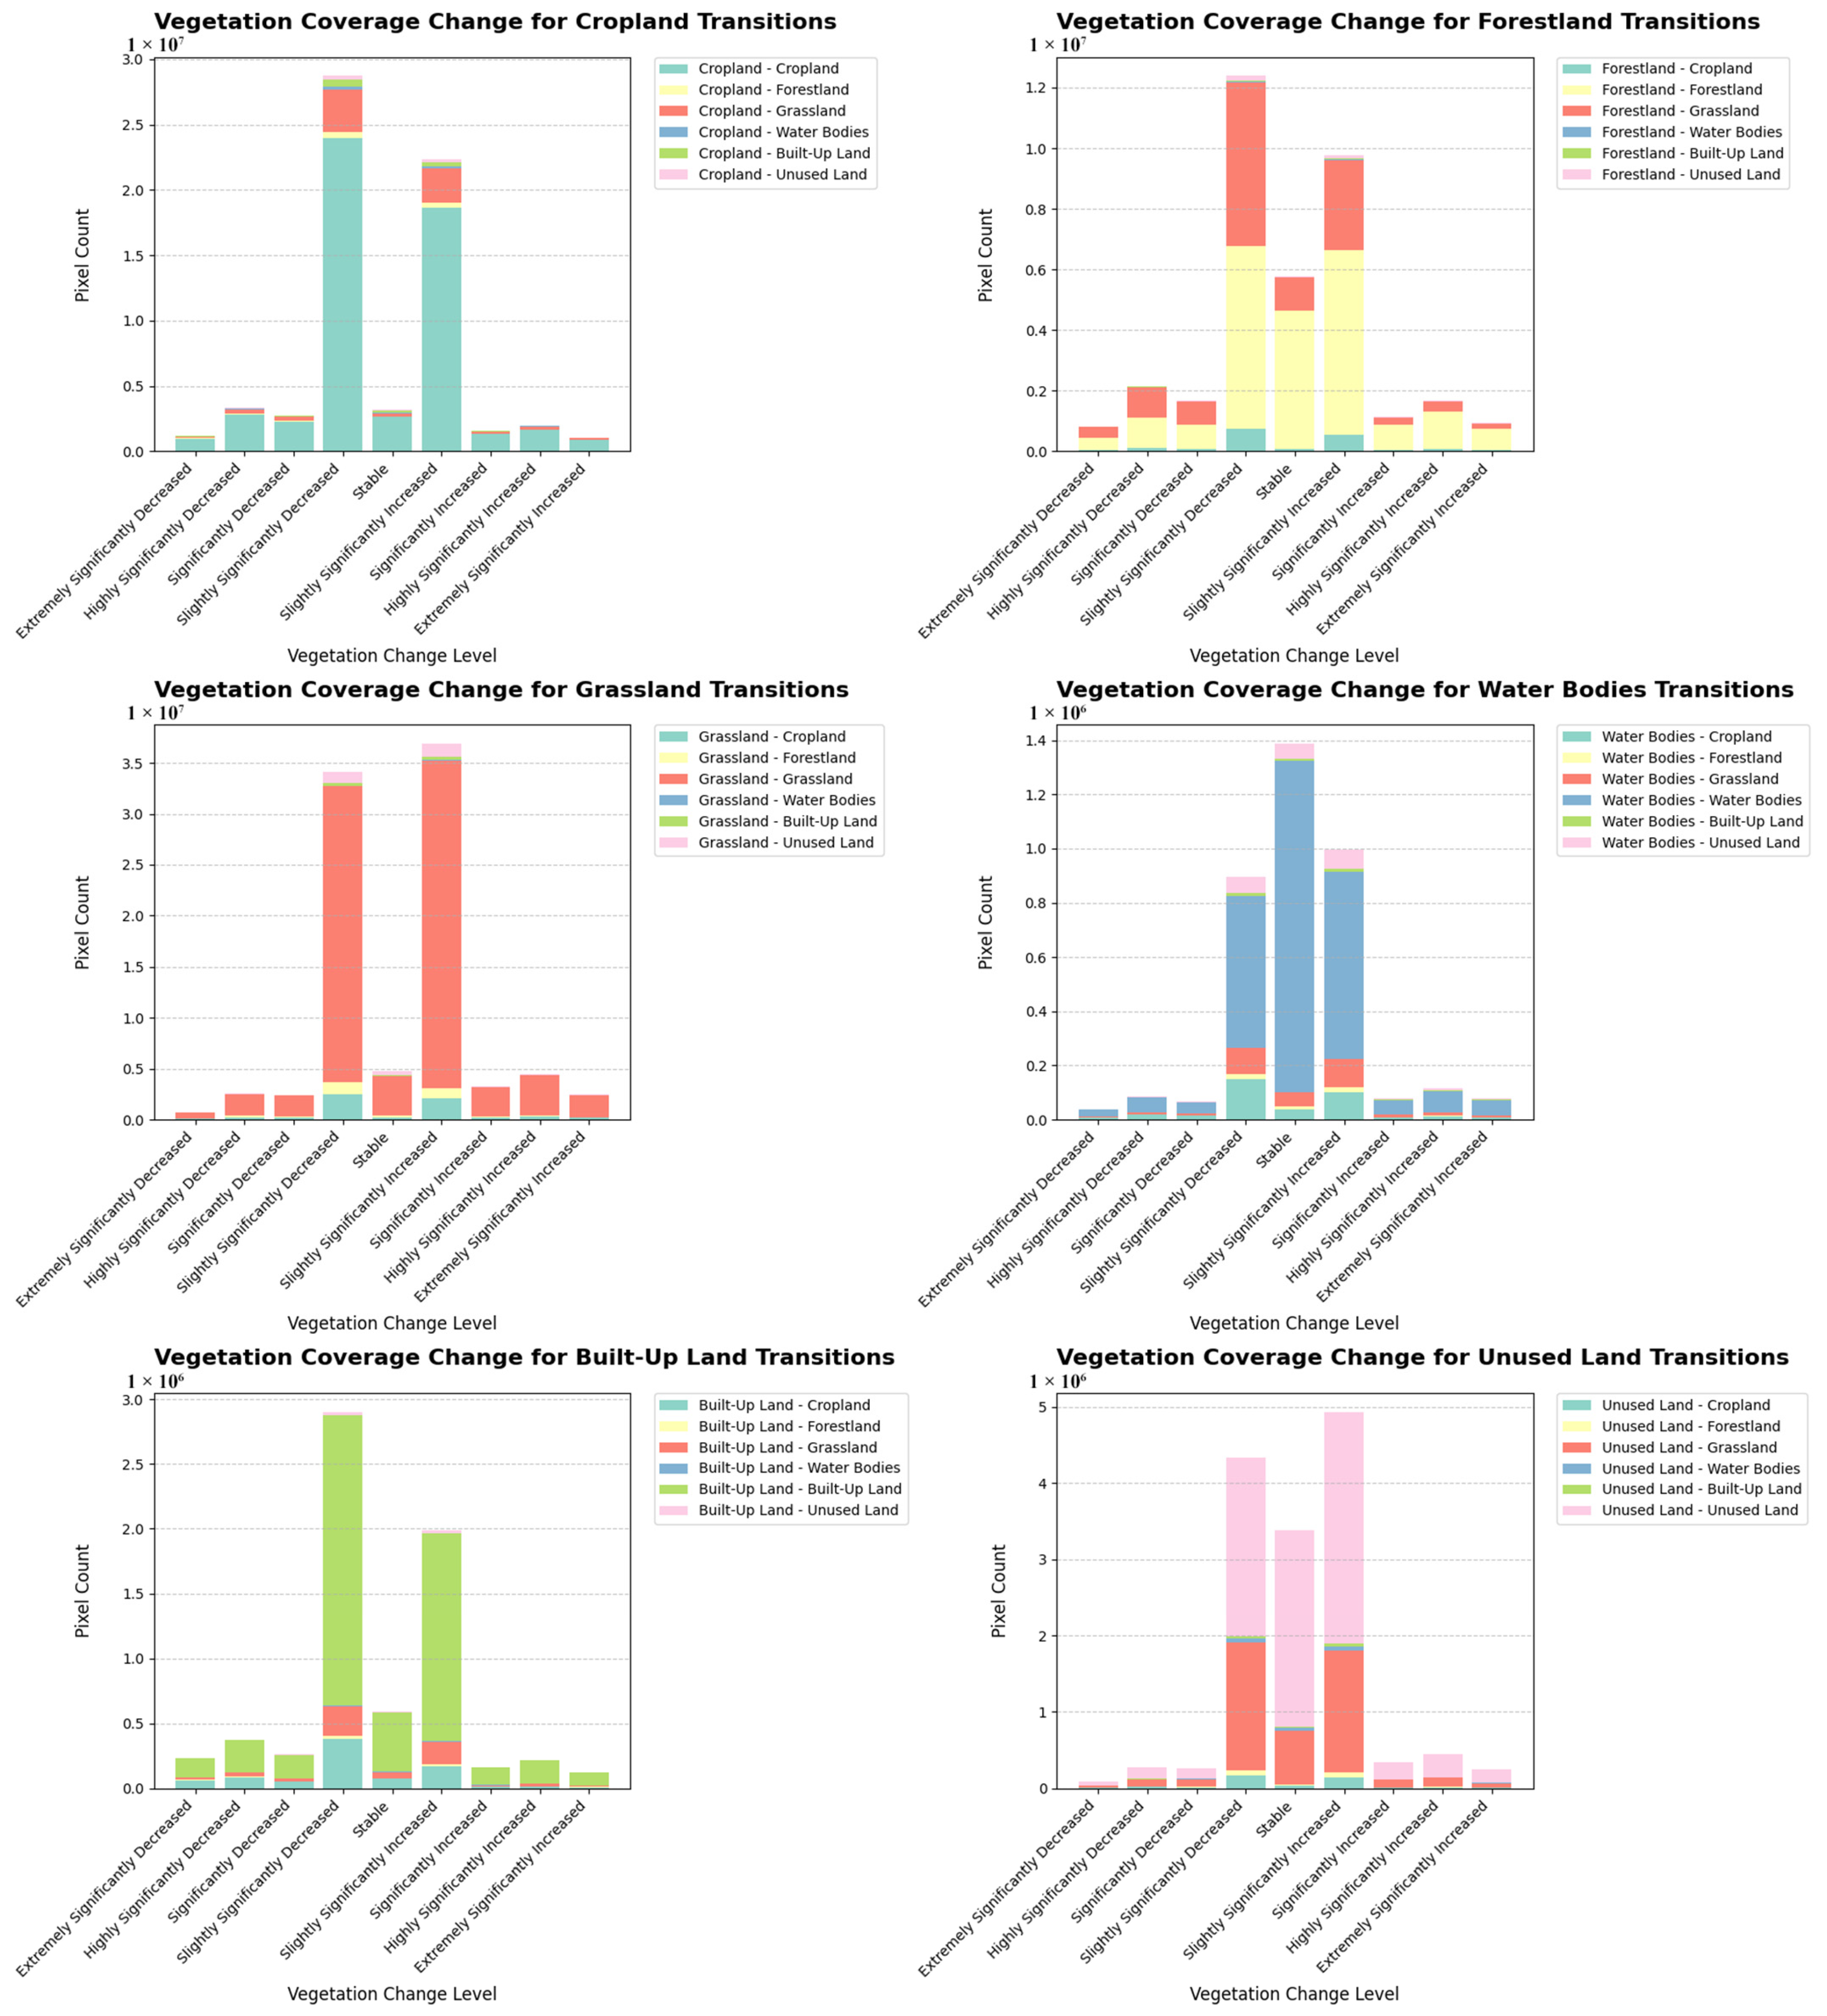
3.5. Fitting Vegetation Coverage with Different Land-Use Types

The regression fitting method was applied using land-use data from 2000, 2010, and 2020, along with the annual mean FVC values, to analyze the impact of different land-use types on vegetation coverage. This predictive analysis allowed for the quantification of each land use type’s contribution to FVC. The fitting results, summarized in Table 8, illustrate the relative contributions of cropland, forestland, grassland, water bodies, built-up land, and unused land to vegetation coverage. These results provide insights into the varying ecological functions of different land-use types and their influence on regional vegetation dynamics.
The results from the regression analysis revealed that cropland, forestland, grassland, and unused land all had positive coefficients, indicating a positive contribution to the increase in FVC in the study area. Specifically, forestland (coefficient = 1.602985), grassland (coefficient = 1.451349), and cropland (coefficient = 0.509843) were found to exert a significant positive influence on FVC, with forestland and grassland showing the highest contributions. This suggests that these land use types promote vegetation coverage in the region, likely due to the ecological functions they provide, such as biodiversity support, carbon sequestration, and ecosystem stability.
On the other hand, water bodies and built-up land exhibited negative coefficients. The coefficient for water bodies was −0.152119, which indicates a slight negative impact on FVC. This could be attributed to the relatively low vegetation coverage associated with water bodies, which typically have limited vegetation in their immediate surroundings. Built-up land showed the most significant negative impact on FVC, with a coefficient of −5.174780. This result highlights the strong adverse effect of urbanization and infrastructure development on vegetation coverage, likely due to the conversion of natural land into built environments that disrupt local ecosystems.

3.6. Future Scenario Simulations

The predicted LUCCs for 2040 under four scenarios indicate distinct spatial patterns of land-use types across the study area (Figure 12). Cropland is projected to be concentrated in the central-western and southeastern regions, while forestland is distributed around Hohhot in the west, the northern parts of Chifeng City in the east, and the southwestern areas of the study region. Grassland is expected to remain widely distributed across the entire study area.
The spatial differences in land-use types under the four scenarios are as follows: the natural development scenario reflects land-use transitions consistent with trends observed from 2010 to 2020. In the cropland protection scenario, compared to the natural development scenario, there is a reduction in the conversion of built-up land to cropland, forestland, and grassland. The sustainable development scenario and ecological protection scenario demonstrate a tendency for unused land around water bodies in the eastern region of the study area to transition to grassland and forestland. In the western region, under the sustainable development scenario, built-up land is projected to transition into unused land and cropland. Under the ecological protection scenario, built-up land in the western region is predicted to transition into unused land, forestland, and grassland.
Under the natural development scenario, cropland maintains its natural distribution, while in the cropland protection scenario, its area increases significantly. In contrast, under the ecological protection scenario, some cropland is converted into grassland or forestland. In both the sustainable development and ecological protection scenarios, grassland and forestland areas increase noticeably, with their distribution becoming more concentrated in the northern and central regions of the study area. Comparatively, the natural development and cropland protection scenarios have limited effects on the expansion of grassland and forestland.
Built-up land experiences the most significant expansion under the natural development scenario, while its expansion is notably restricted under the sustainable development, ecological protection, and cropland protection scenarios. Unused land retains a relatively high proportion under the natural development scenario, whereas under the ecological protection scenario, it is almost entirely converted into other land-use types, reflecting a comprehensive shift toward ecological restoration.
As shown in Table 9, by 2040, under the natural development scenario, cropland is projected to cover 42,685.53 km2, forestland 11,576.48 km2, grassland 74,567.92 km2, and unused land 8922.80 km2. The mean fractional vegetation cover (FVC Mean) under this scenario is 0.3899, the lowest among all four scenarios, reflecting the limitations of relying solely on natural development to improve vegetation coverage.
In contrast, under the sustainable development scenario, cropland and grassland areas increase slightly to 42,796.99 km2 and 74,640.16 km2, respectively. Built-up land area decreases from 5548.24 km2 in the natural development scenario to 5363.53 km2, resulting in an improved FVC mean of 0.3975. This demonstrates that a balanced approach to land development and ecological protection can positively impact vegetation coverage.
The cropland protection scenario exhibits the highest effectiveness in enhancing vegetation coverage, with cropland area increasing to 42,911.78 km2, the largest among the four scenarios. Built-up land area decreases significantly to 5208.46 km2, the lowest across scenarios, while grassland expands to 74,667.76 km2. Consequently, the FVC mean reaches 0.4039, the highest among all scenarios, underscoring the positive impact of cropland protection measures on vegetation recovery.
Under the ecological protection scenario, the focus shifts to the conservation of grassland and forestland, resulting in grassland reaching the highest area of 74,686.97 km2 among the four scenarios, while forestland slightly increases to 11,589.95 km2. Unused land area increases slightly to 8928.60 km2, and the FVC mean improves to 0.3970. These results highlight the importance of targeted conservation measures in enhancing vegetation coverage while preserving ecological integrity.
Together, these findings demonstrate that policy interventions, particularly under the cropland protection and ecological protection scenarios, are vital in promoting vegetation restoration and improving FVC. In comparison, the natural development scenario, with its rapid expansion of built-up land and limited increases in grassland and forestland, falls short in effectively addressing vegetation decline.

4. Discussion

This study examines the dynamic changes in vegetation cover (FVC) in the agro-pastoral transitional zone of Inner Mongolia between 2000 and 2020, focusing on the impacts of land use and climate factors. We found that the expansion of grasslands and forests played a key role in enhancing FVC, particularly between 2010 and 2020. During this period, grassland area increased by 7758.51 km2, accounting for 8.25% of the total study area, significantly improving FVC in the central and southern parts of Xilin Gol League and Chifeng City. This trend is closely linked to the implementation of ecological policies such as the Grain-for-Green Program and grazing bans, highlighting the critical role of ecological restoration policies in increasing vegetation cover [40,41,42,43]. However, the effectiveness of these measures varied by region. For example, FVC continued to decline in parts of eastern Ulanqab City and northern Chifeng City, suggesting that in areas with low grassland productivity or arid climatic conditions, the effects of ecological restoration measures are limited [8]. Additionally, the Hurst index showed that these regions have limited restoration potential, likely due to the combined effects of long-term overgrazing and agricultural expansion [44,45]. Further analysis revealed that specific land use transitions, such as the conversion of grasslands to unused land and forests to grasslands, were among the causes of FVC decline in localized areas. This suggests that, while significant ecological restoration success has been achieved in certain areas, the spatial heterogeneity of vegetation change is closely related to land-use patterns.
Globally, understanding vegetation change dynamics is crucial for understanding ecosystem functions and their responses to human activities and climate change [46]. The agro-pastoral transitional zone is a critical area where the agricultural and pastoral production systems converge, and population pressure has led to a series of issues such as excessive cultivation and overgrazing. These phenomena directly impact vegetation cover and ecosystem health and are reflected in land-use change (LUCC). However, in addition to human activities, climatic hydrological factors also play an indispensable role in vegetation cover changes. To evaluate the importance of LUCC driving factors in vegetation cover dynamics, this study employed the GeoDetector method, considering LUCC, precipitation (Precip), and temperature (Temp), to analyze the combined effects of natural and human factors on FVC. The results showed that LUCC is the stron gest explanatory factor for FVC changes, indicating that land-use change is the primary driver of vegetation cover dynamics in the region. This finding aligns with the study by Abera et al. (2024) in semi-arid Ethiopia which suggested that human activities have a greater impact on vegetation dynamics than climate factors in semi-arid and arid regions [47].
After establishing LUCC as the primary driver of vegetation cover change, pixel-based statistical methods for land-use conversion and FVC trend analysis were applied. Further research found that the expansion of cropland and built-up areas were major drivers of FVC decline. From 2000 to 2010, the conversion of grasslands to cropland and unused land was significantly higher than from 2010 to 2020, at 5013.27 km2 and 3081.51 km2, respectively. The observed low vegetation cover during this period is closely related to these transitions. This trend is consistent with the findings of Lyu et al. (2023) [48], who noted the negative impact of urban land expansion on the grassland ecosystems of the agro-pastoral transitional zone, emphasizing the long-term cumulative effects of human activities on grassland degradation. Furthermore, the expansion of built-up areas from 2010 to 2020 (an increase of 423.31 km2) was particularly pronounced in northern Chifeng City and Ulanqab City, exacerbating the decline in FVC in these areas. This finding is consistent with the conclusions of Zhang and Huang (2019) [49], who stated that the negative impact of human activities on ecologically fragile areas is more significant than that of climate change. Therefore, targeted intervention measures should be implemented in areas with significant FVC decline (such as northern Chifeng City), combining land-use optimization and resource allocation to enhance the sustainability of FVC.
Regression fitting methods can capture the contributions of land-use area changes to vegetation cover and quantify future vegetation cover based on future land-use scenarios. In selecting the appropriate regression models, in addition to multiple linear regression, we also explored nonlinear polynomial regression methods and applied ridge and Lasso regression to address overfitting issues. Both linear and nonlinear models yielded prediction errors of mean FVC below 0.08, and the results from these models were similarly meaningful. During the model evaluation, polynomial regression exhibited a high R2 in the training set but a negative R2 in the test set, indicating severe overfitting. To mitigate this, regularization techniques such as ridge and Lasso regression were introduced. Lasso regression, with an optimal regularization parameter alpha = 0.01, showed improved generalization performance (training set MSE: 0.00606; test set MSE: 0.0227; training set R2: 0.3596; test set R2: 0.2271), but the explanatory power remained relatively weak. In comparison, multiple linear regression achieved more stable performance (MSE: 0.0812, R2: 0.6164), likely due to the small dataset causing more complex models to overfit. Therefore, we selected multiple linear regression for the experiment [50,51]. Combined with the PLUS model for predicting future land-use scenarios, the results showed variations in FVC changes under different development scenarios for 2040. The FVC mean values for the farmland protection and sustainable development scenarios were the highest, at 0.4039 and 0.3975, respectively, indicating that these two scenarios are the most likely to effectively enhance vegetation cover. Particularly in the farmland protection scenario, the increase in cropland and the reduction of built-up areas contributed to FVC restoration, which aligns with findings from other studies, such as Wang et al. (2022) [52], who also indicated that farmland protection can significantly improve vegetation cover, especially in fragile areas like the agro-pastoral transitional zone.
In existing research, the analysis of land-use change and vegetation cover has mainly relied on relatively low-spatial-resolution remote sensing data. With the continuous development of remote sensing technology, high-spatial-resolution satellite data (such as Sentinel-2, WorldView-3, etc.) have become increasingly popular. These data provide finer spatial resolution and higher temporal-frequency data, offering more details and greater accuracy for monitoring vegetation changes. Future research can combine high-resolution remote sensing imagery to further improve the accuracy of vegetation cover change monitoring, particularly in complex agro-pastoral transitional zones. This will help reveal finer-grained vegetation change trends and the microlevel impacts of different land-use types on vegetation changes, thus more accurately assessing the effectiveness of ecological restoration policies [53]. Although the results of this study reveal the impacts of land-use change and climate factors on vegetation cover, there are some potential sources of error. First, the quality and time span of the model input data may affect the stability of the analysis results. While we employed multiple linear regression to quantify future FVC dynamics, this method still faces limitations related to insufficient data and the risk of overfitting when addressing complex land-use transitions. Future research should consider improving the continuity of time-series data and applying more powerful nonlinear machine learning algorithms such as random forest and XGBoost. These approaches may offer more accurate predictions of complex future FVC changes, particularly when combined with spatial autocorrelation measures such as Moran’s I to address issues related to data dimensional inconsistencies. Additionally, climate factors such as precipitation and temperature changes may have varying impacts on vegetation cover depending on regional differences, particularly in arid and semi-arid regions where climate fluctuations may have a significant effect on vegetation changes in certain years. These factors need further investigation in future studies. Future research could also focus on other unrecognized potential factors and their interactions with land use to better understand their combined effects on vegetation dynamics [54]. For example, soil properties, irrigation methods, and the complexity of human activities may have significant impacts on vegetation cover in certain regions [55,56]. Furthermore, the land-use scenario simulations in this study were based on existing data to predict future changes, but land-use changes are influenced by multiple factors and are inherently uncertain and dynamic [57]. Therefore, future research should explore the complex interactions among land-use policies, food security, and rural livelihoods, considering both ecological restoration and the socioeconomic challenges faced by local communities. The incorporation of these elements into land-use planning can help create policies that are not only environmentally sustainable but also socially equitable, supporting both ecological health and rural development. Time-series data synthesis methods (such as maximum, median, or mean synthesis methods) may influence the interpretation of the analysis results. Previous studies have shown that different synthesis methods emphasize different aspects of the data [58,59]. This study used the maximum value synthesis method to highlight peak information and reduce the impact of outliers, but future studies could consider testing the sensitivity of different synthesis methods to the results to further validate the stability of the findings.

5. Conclusions

This study investigates the dynamic changes in vegetation fraction coverage (FVC) in the agro-pastoral transitional zone of Inner Mongolia from 2000 to 2020. The findings are as follows: (1) the spatial distribution of vegetation cover in the study area generally shows that the vegetation coverage in the eastern region is higher than that in the western region, exhibiting significant spatiotemporal heterogeneity. While the overall vegetation cover has slightly increased, there are considerable regional differences in trends, with some areas experiencing a decline in FVC. (2) Based on GeoDetector analysis of land-use/land-cover change (LUCC), precipitation, and temperature, LUCC is the most powerful explanatory factor for FVC changes in the region, with interaction factors providing stronger explanatory power than individual factors. (3) The expansion of grasslands and forests has been the primary driver of increased vegetation cover, particularly between 2010 and 2020. In contrast, the conversion of grassland to cropland and built-up areas is the main driver of FVC decline. (4) Land-use simulations for 2040 under different development scenarios show that the farmland protection and sustainable development scenarios are most likely to lead to increased vegetation cover. Notably, these scenarios help mitigate land-use conversions that contribute to vegetation degradation.
Given these findings, the study suggests that effective land management and ecological restoration policies should prioritize optimizing land use and focusing on sustainable land development.

Author Contributions

Conceptualization, H.L., Y.W., Z.L. and Y.N.; methodology, Z.Q., S.L. and Y.N.; software, Z.Q., S.L. and R.J.; validation, H.L., Y.W., Z.L. and N.S.; formal analysis, H.L. and Y.N.; investigation, Y.W., Z.L., R.J., N.S. and D.H.; resources, Z.L. and Y.W.; data curation, H.L., Z.L., Y.N., R.J. and D.H.; writing—original draft preparation, H.L. and Y.N.; writing—review and editing, Y.W., Z.L., R.J. and N.S.; visualization, Z.Q., S.L. and R.J.; supervision, Y.W., Z.L. and N.S.; project administration, Z.L.; funding acquisition, Y.N. All authors have read and agreed to the published version of the manuscript.

Funding

This research was supported by the Inner Mongolia Autonomous Region Fundamental Research Funds for Universities—Program for Improving the Scientific Research Ability of Youth Teachers of Inner Mongolia Agricultural University (BR230108); the First-Class Prataculture Discipline Research Project of Inner Mongolia Agricultural University (YLXKZX-NND-010); and the Inner Mongolia Autonomous Region Overseas Students Innovation and Entrepreneurship Start-Up Support Program.

Data Availability Statement

Data will be made available on request.

Acknowledgments

We would like to express our sincere gratitude to all the individuals and organizations that contributed to this research. We would like to thank the College of Grassland Science and the Key Laboratory of Grassland Resources at the Ministry of Education for their invaluable support in facilitating the research. Our appreciation extends to the United States Geological Survey (USGS) for providing the Landsat remote sensing data, and the Resource and Environment Science and Data Center of the Chinese Academy of Sciences for providing land-use data. Special thanks to the Google Earth Engine (GEE) platform for their tools, which were integral to data processing. Finally, we acknowledge the continuous support and insightful feedback from our colleagues and mentors, whose expertise helped improve this manuscript.

Conflicts of Interest

The authors declare no conflicts of interest.

References

  1. Soto, G.E.; Wilcox, S.W.; Clark, P.E.; Fava, F.P.; Jensen, N.D.; Kahiu, N.; Liao, C.; Porter, B.; Sun, Y.; Barrett, C.B. Mapping Rangeland Health Indicators in Eastern Africa from 2000 to 2022. Earth Syst. Sci. Data 2024, 16, 5375–5404. [Google Scholar] [CrossRef]
  2. Saad, K.; Kallel, A.; Castaldi, F.; Sahli Chahed, T. Soil Salinity Detection and Mapping by Multi-Temporal Landsat Data: Zaghouan Case Study (Tunisia). Remote Sens. 2024, 16, 4761. [Google Scholar] [CrossRef]
  3. Luyssaert, S.; Jammet, M.; Stoy, P.C.; Estel, S.; Pongratz, J.; Ceschia, E.; Churkina, G.; Don, A.; Erb, K.; Ferlicoq, M.; et al. Land management and land-cover change have impacts of similar magnitude on surface temperature. Nat. Clim. Change 2014, 4, 389–393. [Google Scholar] [CrossRef]
  4. Arneth, A.; Denton, F.; Agus, F.; Elbehri, A.; Erb, K.H.; Elasha, B.O.; Rahimi, M.; Rounsevell, M.; Spence, A. Framing and Context. In Climate Change and Land: An IPCC Special Report on Climate Change, Desertification, Land Degradation, Sustainable Land Management, Food Security, and Greenhouse Gas Fluxes in Terrestrial Ecosystems; Shukla, P.R., Ed.; Chapter 1; IPCC: Geneva, Switzerland, 2019; Available online: https://research.vu.nl/en/publications/framing-and-context (accessed on 11 December 2024).
  5. Radwan, T.M.; Blackburn, G.A.; Whyatt, J.D.; Atkinson, P.M. Global land cover trajectories and transitions. Sci. Rep. 2021, 11, 12814. [Google Scholar] [CrossRef]
  6. Xu, L.; Li, Y.; Tian, W.; Xu, X.; He, C. Land Use and Land Cover Change in Agro-Pastoral Ecotone in Northern China: A Review. Chin. J. Appl. Ecol. 2018, 29, 3487–3495. [Google Scholar] [CrossRef]
  7. Guo, M.; Wang, S. Remote Sensing Monitoring and Ecological Risk Assessment of Landscape Patterning in the Agro-Pastoral Ecotone of Northeast China. Complexity 2021, 2021, 8851543. [Google Scholar] [CrossRef]
  8. Xu, X.; Jiang, H.; Wang, L.; Guan, M.; Li, J.; Li, J.; Liu, X.; Li, L.; Zhang, X. Major Consequences of Land-Use Changes for Ecosystems in the Agro-Pastoral Transitional Zone of Northern China. Appl. Sci. 2020, 10, 6714. [Google Scholar] [CrossRef]
  9. Lian, J.; Zhao, X.; Li, X.; Zhang, T.; Wang, S.; Luo, Y.; Zhu, Y.; Feng, J. Detecting Sustainability of Desertification Reversion: Vegetation Trend Analysis in Part of the Agro-Pastoral Transitional Zone in Inner Mongolia, China. Sustainability 2017, 9, 211. [Google Scholar] [CrossRef]
  10. Yuan, J.; Ouyang, Z.; Zheng, H.; Su, Y. Ecosystem carbon storage following different approaches to grassland restoration in south-eastern Horqin Sandy Land, northern China. Glob. Ecol. Conserv. 2021, 27, e01438. [Google Scholar] [CrossRef]
  11. Dong, J.; Liu, J.; Yan, H.; Tao, F.; Kuang, W. Spatio-temporal pattern and rationality of land reclamation and cropland abandonment in mid-eastern Inner Mongolia of China. Environ. Monit. Assess. 2011, 179, 137–153. [Google Scholar] [CrossRef]
  12. Gelata, F.T.; Han, J.; Gemeda, S.C. Application of MK trend and test of Sen’s slope estimator to measure impact of climate change on the adoption of conservation agriculture in Ethiopia. J. Water Clim. Change 2023, 14, 977–988. [Google Scholar] [CrossRef]
  13. Zhu, Z.; Zhang, J.; Yang, Z.; Aljaddani, A.H.; Cohen, W.B.; Qiu, S.; Zhou, C. Continuous monitoring of land disturbance based on Landsat time series. Remote Sens. Environ. 2020, 238, 111116. [Google Scholar] [CrossRef]
  14. Fu, B.; Lan, F.; Yao, H.; Qin, J.; He, H.; Liu, L.; Huang, L.; Fan, D.; Gao, E. Spatio-temporal monitoring of marsh vegetation phenology and its response to hydro-meteorological factors using CCDC algorithm with optical and SAR images: In case of Honghe National Nature Reserve, China. Sci. Total Environ. 2022, 843, 156990. [Google Scholar] [CrossRef] [PubMed]
  15. Su, Y.; Feng, Q.; Liu, W.; Zhu, M.; Xia, H.; Ma, X.; Cheng, W.; Zhang, J.; Zhang, C.; Yang, L.; et al. Improved Understanding of Trade-Offs and Synergies in Ecosystem Services via Fine Land-Use Classification and Multi-Scale Analysis in the Arid Region of Northwest China. Remote Sens. 2023, 15, 4976. [Google Scholar] [CrossRef]
  16. Shi, M.; Wu, H.; Fan, X.; Jia, H.; Dong, T.; He, P.; Baqa, M.F.; Jiang, P. Trade-Offs and Synergies of Multiple Ecosystem Services for Different Land Use Scenarios in the Yili River Valley, China. Sustainability 2021, 13, 1577. [Google Scholar] [CrossRef]
  17. Mahcer, I.; Baahmed, D.; Oudin, L.; Kaf, C.H.; Boudhar, A.; Boukhris, M.; Boukhris, A.; Djebbar, K.E.-B. Multidimensional Analysis of NDVI Dynamics in Response to Climate and Land Use/Land Cover Change in Northwest Algeria. J. Hydrol. Hydromech. 2024, 72, 123–134. [Google Scholar] [CrossRef]
  18. Gutman, G.; Ignatov, A. The Derivation of the Green Vegetation Fraction from NOAA/AVHRR Data for Use in Numerical Weather Prediction Models. Int. J. Remote Sens. 1998, 19, 1533–1543. [Google Scholar] [CrossRef]
  19. Li, S.; Liu, M. The Development Process, Current Situation and Prospects of the Conversion of Farmland to Forests and Grasses Project in China. J. Resour. Ecol. 2022, 13, 120–128. [Google Scholar]
  20. Jing, X.; Yao, W.Q.; Wang, J.H.; Song, X.Y. A Study on the Relationship between Dynamic Change of Vegetation Coverage and Precipitation in Beijing’s Mountainous Areas during the Last 20 Years. Math. Comput. Model. 2011, 54, 1079–1085. [Google Scholar] [CrossRef]
  21. Shi, F.; Liu, M.; Qiu, J.; Zhang, Y.; Su, H.; Mao, X.; Li, X.; Fan, J.; Chen, J.; Lv, Y.; et al. Assessing Land Cover and Ecological Quality Changes in the Forest-Steppe Ecotone of the Greater Khingan Mountains, Northeast China, from Landsat and MODIS Observations from 2000 to 2018. Remote Sens. 2022, 14, 725. [Google Scholar] [CrossRef]
  22. Chu, D. Fractional Vegetation Cover. In Remote Sensing of Land Use and Land Cover in Mountain Region; Springer: Singapore, 2020. [Google Scholar] [CrossRef]
  23. Chen, X.; Jiapaer, G.; Bao, A. A Comparison of Methods for Estimating Fractional Vegetation Cover in Arid Regions. Agric. For. Meteorol. 2011, 151, 1698–1710. [Google Scholar] [CrossRef]
  24. Tian, Y.; Bai, X.; Wang, S.; Qin, L.; Li, Y. Spatial-temporal Changes of Vegetation Cover in Guizhou Province, Southern China. Chin. Geogr. Sci. 2017, 27, 761–772. [Google Scholar] [CrossRef]
  25. Guo, M.; Li, J.; He, H.; Xu, J.; Jin, Y. Detecting Global Vegetation Changes Using Mann-Kendall (MK) Trend Test for 1982–2015 Time Period. Chin. Geogr. Sci. 2018, 28, 320–334. [Google Scholar] [CrossRef]
  26. Yuan, J.; Xu, Y.; Xiang, J.; Wu, L.; Wang, D. Spatiotemporal Variation of Vegetation Coverage and Its Associated Influence Factor Analysis in the Yangtze River Delta, Eastern China. Environ. Sci. Pollut. Res. 2019, 26, 12006–12018. [Google Scholar] [CrossRef]
  27. Vandandorj, S.; Boldgiv, B.; Gantsetseg, B. Spatial and Temporal Variability in Vegetation Cover of Mongolia and Its Implications. J. Arid Land 2015, 7, 450–461. [Google Scholar] [CrossRef]
  28. Rahman, S.; Ghosh, S. Spatio-Temporal Variability of Spectral Indices and Land Surface Temperature for Ecological Change Detection in Faridabad District, India Between 1991 and 2021. In Proceedings of the 2024 International Conference on Remote Sensing and Geoinformation, Singapore, 21–23 August 2024; Springer: Berlin/Heidelberg, Germany, 2024; pp. 123–134. [Google Scholar] [CrossRef]
  29. Shi, X.; Yang, D.; Zhou, S.; Li, H.; Zeng, S.; Chen, Y.; Yang, M. Citation Analysis of Spatiotemporal Variation Characteristics and Influencing Factors of Grassland Vegetation Coverage in the Qinghai-Tibet Plateau from 2000 to 2023. Land 2024, 13, 2127. [Google Scholar] [CrossRef]
  30. Huang, Y.; Jin, Y.; Chen, S. The Spatiotemporal Dynamics of Vegetation Cover and Its Response to the Grain for Green Project in the Loess Plateau of China. Forests 2024, 15, 1949. [Google Scholar] [CrossRef]
  31. Yang, Q.; Chen, J.; Li, B.; Zhu, Y. Evolution and Driving Force Detection of Urban Human Settlement Environment at Urban Agglomeration in the Middle Reaches of the Yangtze River. Sci. Geogr. Sin. 2018, 38, 195–205. [Google Scholar] [CrossRef]
  32. Wang, J.; Xu, C. Geodetector: Principle and prospective. Acta Geogr. Sin. 2017, 72, 116–134. [Google Scholar] [CrossRef]
  33. Ge, Q.; Zhang, Z. Interaction of Multiple Geographic Factors in Spatial Analysis: The Geographic Detector Model. Geogr. Anal. 2014, 46, 317–328. [Google Scholar] [CrossRef]
  34. Zhang, K.; Feng, R.; Zhang, Z.; Deng, C.; Zhang, H.; Liu, K. Exploring the Driving Factors of Remote Sensing Ecological Index Changes from the Perspective of Geospatial Differentiation: A Case Study of the Weihe River Basin, China. Int. J. Environ. Res. Public Health 2022, 19, 10930. [Google Scholar] [CrossRef] [PubMed]
  35. Feng, D.; Bao, W.; Fu, M.; Zhang, M.; Sun, Y. Current and Future Land Use Characters of a National Central City in Eco-Fragile Region—A Case Study in Xi’an City Based on FLUS Model. Land 2021, 10, 286. [Google Scholar] [CrossRef]
  36. Zhang, L.N.; Li, X.B. Assessing Hydrological Effects of Human Activities by Hydrological Characteristic Parameters: A Case Study in the Yunzhou Reservoir Basin. Resour. Sci. 2004, 26, 62–67. (In Chinese) [Google Scholar] [CrossRef]
  37. Chen, Q.; Lin, J. Prediction of the Impact of Land Use Change on Ecosystem Services in the Pearl River Delta under Different Scenarios. J. Ecol. Rural Environ. 2024, 40, 612–621. [Google Scholar] [CrossRef]
  38. Yuan, X. Simulation of Land Use Change Scenarios and Study on Landscape Ecological Risks in Wuhan City Based on PLUS Model. Master’s Thesis, East China University of Technology, Fuzhou, China, 2023. (In Chinese). [Google Scholar] [CrossRef]
  39. Xie, X.D.; Lin, X.S.; Wang, Y.; Tu, R.Y.; Zhang, J.X. Multi-Scenario Simulation of Land Use in Nanchuan District of Chongqing Based on PLUS Model. J. Chang. River Sci. Res. Inst. 2023, 40, 86–92+113. [Google Scholar] [CrossRef]
  40. Yi, H.; Zhang, X.; He, L.; He, J.; Tian, Q.; Zou, Y.; An, Z. Detecting the Impact of the “Grain for Green” Program on Land Use/Land Cover and Hydrological Regimes in a Watershed of the Chinese Loess Plateau over the Next 30 Years. Ecol. Indic. 2023, 150, 110181. [Google Scholar] [CrossRef]
  41. Hu, Y.; Zhang, S.; Shi, Y.; Guo, L. Quantifying the Impact of the Grain-for-Green Program on Ecosystem Service Scarcity Value in Qinghai, China. Sci. Rep. 2023, 13, 29937. [Google Scholar] [CrossRef]
  42. Huo, T.; Wang, J.; Zhang, Y.; Wei, B.; Chen, K.; Zhuang, M.; Liu, N.; Zhang, Y.; Liang, J. Grazing Exclusion and Climate Change Effects on Temperate Grassland Vegetation Recovery. Sci. Total Environ. 2024, 857, 159516. [Google Scholar] [CrossRef]
  43. Jiang, C.; Li, B.; Wang, W. Environmental Change in the Agro-Pastoral Transitional Zone, Northern China: Patterns, Drivers, and Implications. Int. J. Environ. Res. Public Health 2016, 13, 165. [Google Scholar] [CrossRef]
  44. Carreiras, J.M.B.; Jones, J.; Lucas, R.M.; Gabriel, C. Land Use and Land Cover Change Dynamics across the Brazilian Amazon: Insights from Extensive Time-Series Analysis of Remote Sensing Data. PLoS ONE 2014, 9, e104144. [Google Scholar] [CrossRef]
  45. Papoutsa, C.; Kouhartsiouk, D.; Themistocleous, K.; Christoforou, M.; Hadjimitsis, D.G. Monitoring of Land Degradation from Overgrazing Using Space-Borne Radar and Optical Imagery: A Case Study in Randi Forest, Cyprus. In Proceedings of the Earth Resources and Environmental Remote Sensing/GIS Applications VII, Edinburgh, UK, 26–29 September 2016; International Society for Optics and Photonics. SPIE: Philadelphia, PA, USA, 2016; 10005, pp. 331–340. [Google Scholar] [CrossRef]
  46. Zhang, Y.; Lu, Y.; Song, X. Identifying the Main Factors Influencing Significant Global Vegetation Changes. Forests 2023, 14, 1607. [Google Scholar] [CrossRef]
  47. Abera, B.; Adem, S.; Gebrehiwot, G.; Tsegaye, M. Impact of Climate Variability and Environmental Policies on Vegetation Dynamics in the Semi-Arid Tigray. npj Climate Atmos. Sci. 2024, 7, 24. [Google Scholar] [CrossRef]
  48. Lyu, F.; Pan, Y.; Yu, L.; Wang, X.; Yu, Z. The Impact of Anthropogenic Activities and Natural Factors on the Grassland over the Agro-Pastoral Ecotone of Inner Mongolia. Land 2023, 12, 2009. [Google Scholar] [CrossRef]
  49. Zhang, X.; Huang, X.R. Human Disturbance Caused Stronger Influences on Global Vegetation Change Than Climate Change. PeerJ 2019, 7, e7763. [Google Scholar] [CrossRef] [PubMed]
  50. Hastie, T.; Tibshirani, R.; Friedman, J. The Elements of Statistical Learning: Data Mining, Inference, and Prediction, 2nd ed.; Springer: New York, NY, USA, 2009. [Google Scholar] [CrossRef]
  51. James, G.; Witten, D.; Hastie, T.; Tibshirani, R. An Introduction to Statistical Learning: With Applications in R; Springer: New York, NY, USA, 2013. [Google Scholar] [CrossRef]
  52. Wang, R.; Zhao, J.; Chen, G.; Lin, Y.; Yang, A.; Cheng, J. Coupling PLUS–InVEST Model for Ecosystem Service Research in Yunnan Province, China. Sustainability 2022, 15, 271. [Google Scholar] [CrossRef]
  53. Senthil, K.; Ramasamy, K. High Spatial Resolution Satellite Imagery for Vegetation Monitoring in Semi-Arid Regions. Remote Sens. Environ. 2020, 246, 111816. [Google Scholar] [CrossRef]
  54. Sun, R.; Chen, S.; Su, H. Trend Analysis and Driving Factors of Vegetation Dynamics in Northern China from 1982 to 2015. Remote Sens. 2022, 14, 6163. [Google Scholar] [CrossRef]
  55. Wang, Q.; Zhang, W.; Li, N.; Zhao, Y.; Zhang, D. Effects of Climate Change and Human Activities on Vegetation Coverage Change in Northern China Considering Extreme Climate and Time-Lag and -Accumulation Effects. Sci. Total Environ. 2022, 808, 152295. [Google Scholar] [CrossRef]
  56. Liu, L.; Yu, S.; Zhang, H.; Wang, Y.; Liang, C. Analysis of Land Use Change Drivers and Simulation of Different Future Scenarios: Taking Shanxi Province of China as an Example. Int. J. Environ. Res. Public Health 2023, 20, 1626. [Google Scholar] [CrossRef]
  57. Han, H.; Yang, C.; Song, J. Scenario Simulation and the Prediction of Land Use and Land Cover Change in Beijing, China. Sustainability 2015, 7, 4260–4279. [Google Scholar] [CrossRef]
  58. Thomas, C.; Ranchin, T.; Wald, L.; Chanussot, J. Synthesis of Multispectral Images to High Spatial Resolution: A Critical Review of Fusion Methods Based on Remote Sensing Physics. IEEE Trans. Geosci. Remote Sens. 2007, 45, 3012–3028. [Google Scholar] [CrossRef]
  59. Wang, B.; Wang, B.; Bao, J.; Peng, J.; Zhang, J.; Wang, P. An NDVI Synthesis Method for Multi-Temporal Remote Sensing Images Based on k–NN Learning: A Case Based on GF-1 Data. Remote Sens. Lett. 2018, 9, 541–549. [Google Scholar] [CrossRef]
Figure 1. (a) Global-scale Location of Study Area. (b) Study Area Details & Elevation.
Land 14 01202 g001
Figure 2. Interannual changes in FVC in the agro-pastoral transition zone of Inner Mongolia (2000–2020).
Land 14 01202 g002
Figure 3. Interannual changes in the classification of fractional vegetation coverage.
Land 14 01202 g003
Figure 4. Spatial distribution of FVC: 2000 (a), 2010 (b), and 2020 (c).
Land 14 01202 g004
Figure 5. MK–Sen trend test for FVC: 2000–2010 (a), 2010–2020 (b); CV stability test: 2000–2010 (c), 2010–2020 (d); Hurst–Sen persistence analysis: 2000–2010 (e), 2010–2020 (f).
Land 14 01202 g005
Figure 6. Land-use transition maps for 2000–2010 (a) and 2010–2020 (b).
Land 14 01202 g006
Figure 7. Land-use transitions from 2000 to 2020.
Land 14 01202 g007
Figure 8. Single-factor test based on the geographic detector (2000–2020).
Land 14 01202 g008
Figure 9. Interaction-factor test based on the geographic detector (2000–2020).
Land 14 01202 g009
Figure 10. Spatial overlay analysis of land-use transitions and FVC Mann–Kendall trends (2000–2010).
Land 14 01202 g010
Figure 11. Spatial overlay analysis of land-use transitions and FVC Mann–Kendall trends (2010–2020).
Land 14 01202 g011
Figure 12. Land-use projections for 2040: natural development scenario (a), sustainable development scenario (b), cropland protection scenario (c), ecological protection scenario (d).
Land 14 01202 g012
Table 1. Land-use classification.
ObjectLand UseSubcategories of Land Use
1CroplandPaddy fields, dryland
2ForestlandForested land, shrubland, sparse forestland, non-afforested land, abandoned land, and various types of orchards
3GrasslandHigh-cover grassland, medium-cover grassland, low-cover grassland
4Water bodiesRivers and channels, lakes, reservoirs and ponds, permanent glaciers, tidal flats, and shorelines
5Built-up landUrban land, rural settlements, factories, industrial zones, transportation roads, and special-purpose land
6Unused landSandy land, Gobi Desert, saline–alkali land, marshes, bare land, barren rocky land, alpine desert, and tundra
Table 2. Classification standards for fractional vegetation coverage (FVC).
CategoryFVC RangeEcological Significance
Low coverage0–20%Sparse vegetation, almost no vegetation present.
Medium-low coverage20–40%Limited vegetation coverage, with average ecological quality.
Medium coverage40–60%Moderate vegetation coverage, with relatively stable ecological conditions.
Medium-high coverage60–80%Good vegetation coverage, with a relatively intact ecosystem.
High coverage80–100%Very high vegetation coverage, indicating a healthy and well-functioning ecosystem
Table 3. Classification standards for Mann–Kendall−Sen’s slope trend analysis.
CategoryCriteriaMK–Sen Definition
StableElseFVC changes are negligible, with no significant trend.
Extremely significantly decreasedp ≤ 0.01 and β < 0FVC exhibits an extremely significant negative trend, with the most severe reduction.
Highly significantly decreased0.01 < p ≤ 0.05 and β < 0FVC exhibits a highly significant negative trend, with a severe reduction.
Significantly decreased0.05 < p ≤ 0.1 and β < 0FVC exhibits a significant negative trend, with a noticeable reduction.
Slightly significantly decreasedp ≥ 0.1 and β < 0FVC exhibits a slightly significant negative trend, with a minor reduction.
Slightly significantly increasedp ≥ 0.1 and β > 0FVC exhibits a slightly significant positive trend, with a minor improvement.
Significantly increased0.05 < p ≤ 0.1 and β > 0FVC exhibits a significant positive trend, with a noticeable improvement.
Highly significantly increased0.01 < p ≤ 0.05 and β > 0FVC exhibits a highly significant positive trend, with a substantial improvement.
Extremely significantly increasedp ≤ 0.01 and β > 0FVC exhibits an extremely significant positive trend, with the most substantial improvement.
Table 4. Classification standards for the coefficient of variation (CV) of fractional vegetation coverage.
CategoryCriteriaDefinition
StableV = 0Regions with minimal interannual fluctuations, indicating high FVC stability.
Low variation0 < V ≤ 0.15Regions with small interannual fluctuations, suggesting relatively high FVC stability.
Medium variation0.15 < V ≤ 0.3Regions with moderate FVC fluctuations, possibly influenced by some external disturbances.
High variation0.3 < V ≤ 0.45Regions with significant FVC fluctuations, strongly influenced by human or natural factors.
Extreme variation0.45 < VRegions with the most severe FVC fluctuations, often ecological hot spots or sensitive areas.
Table 5. Classification standards for vegetation changes based on the combined analysis of the Hurst index and Sen’s slope.
CategoryCriteriaDefinition
Regions of continuous growthHurst > 0.5 and β > 0.5FVC exhibits a sustained growth trend, indicating long-term potential for vegetation improvement.
Regions of anti-continuous growthHurst < 0.5 and β > 0.5FVC shows short-term growth but lacks long-term persistence for continued improvement.
Regions of continuous declineHurst > 0.5 and β < 0.5FVC exhibits a sustained decline trend, indicating potential long-term risks of vegetation loss.
Regions of anti-continuous declineHurst < 0.5 and β < 0.5FVC shows short-term decline, but the long-term trend may reverse.
Random variationHurst = 0.5 and β = 0.5FVC changes are weak, with no significant long-term trend.
Table 6. Field factor weight parameter table.
TypeCroplandForestlandGrasslandWater BodiesBuilt-Up LandUnused Land
Natural development0.39710.000110.46560.49370.4319
Sustainable development0.43900.000110.48990.50310.5053
Cropland protection0.44620.000110.48540.50180.4847
Ecological protection0.47140.000110.49690.50510.5121
Table 7. Land-use (km2) transition matrix for 2000–2020.
Year2010
Land-Use Type (km2)CroplandForestlandGrasslandWater BodiesBuilt-Up LandUnused LandTotal Outflows
2000Cropland37,422.061405.613649.76230.76555.67265.746107.54
Forestland638.1014,036.591829.9736.2246.78129.922680.99
Grassland5013.278176.4852,775.31192.00368.323081.5116,831.58
Water Bodies309.6948.26113.301853.8111.63127.47610.35
Built-Up Land339.6766.97192.1516.773578.8839.79655.35
Unused Land487.17220.632373.17161.0339.925779.523281.92
Total Inflows6787.99917.958158.35636.781022.323644.43
Year2020
Land-Use Type (km2)CroplandForestlandGrasslandWater BodiesBuilt-Up LandUnused LandTotal Outflows
2010Cropland37,024.72678.894900.23337.12795.76471.747183.74
Forestland1170.2214,372.878039.9552.4497.83220.269580.7
Grassland4017.811899.4152,293.60126.48468.212126.408638.31
Water Bodies241.1637.38193.101853.8526.75138.00636.39
Built-Up Land562.1349.89358.6213.333571.3445.891029.86
Unused Land274.33122.002904.92118.6064.625939.263484.47
Total Inflows6265.652787.5716,396.82647.971453.173002.29
Table 8. Contributions of different land-use types to FVC based on data from 2000 to 2020.
Land Use TypeCroplandForestlandGrasslandWater BodiesBuilt-Up LandUnused Land
Coefficient0.5098431.6029851.451349−0.152119−5.1747801.330517
Table 9. Land-use areas (km2) and FVC mean values under different scenarios in 2040.
ScenarioCroplandForestlandGrasslandWater BodiesBuilt-Up LandUnused LandFVC Mean
Natural development42,685.5311,576.4774,567.912491.305548.248922.790.389882898
Sustainable development42,796.9811,572.6774,640.152495.615363.528923.310.397506362
Cropland protection42,911.7711,587.3974,667.762491.055208.468925.830.403876101
Ecological protection42,699.0411,589.9474,686.962499.905387.828928.590.397001299
Disclaimer/Publisher’s Note: The statements, opinions and data contained in all publications are solely those of the individual author(s) and contributor(s) and not of MDPI and/or the editor(s). MDPI and/or the editor(s) disclaim responsibility for any injury to people or property resulting from any ideas, methods, instructions or products referred to in the content.

