
Spatiotemporally Heterogeneous Effects of Urban Landscape Pattern on PM2.5: Seasonal Mechanisms in Urumqi, China


Abstract
1. Introduction
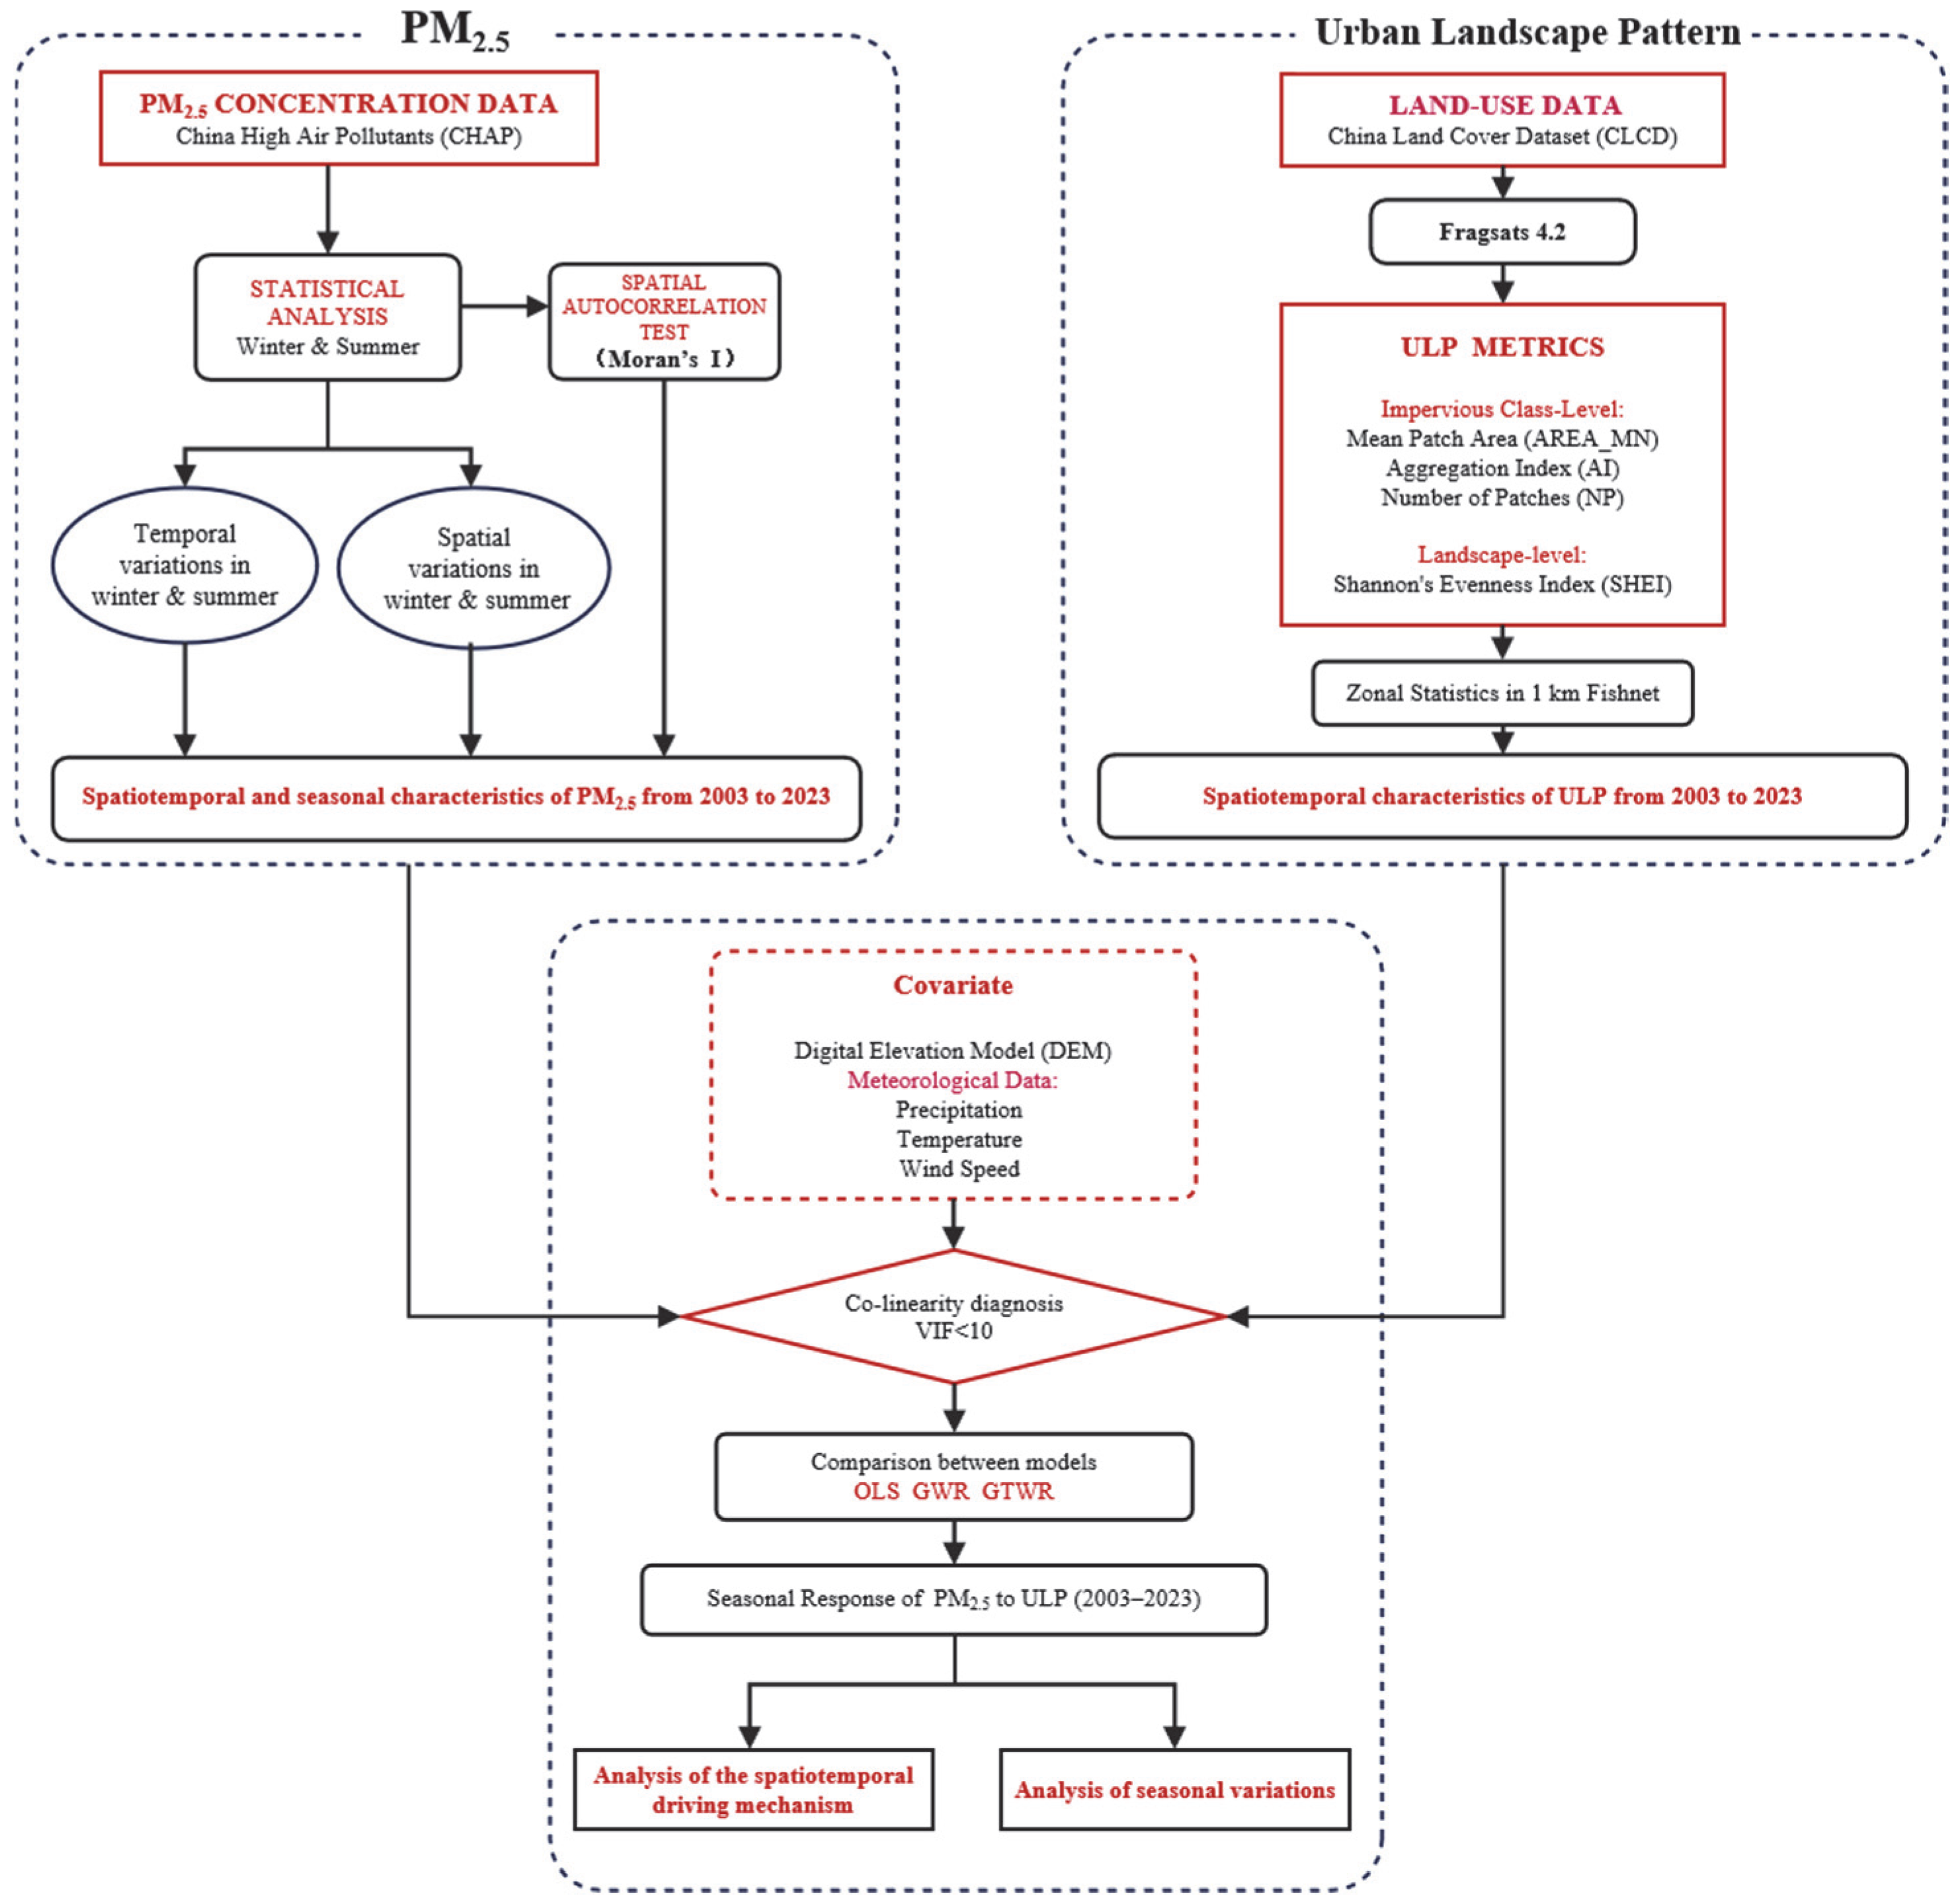
2. Materials and Methods
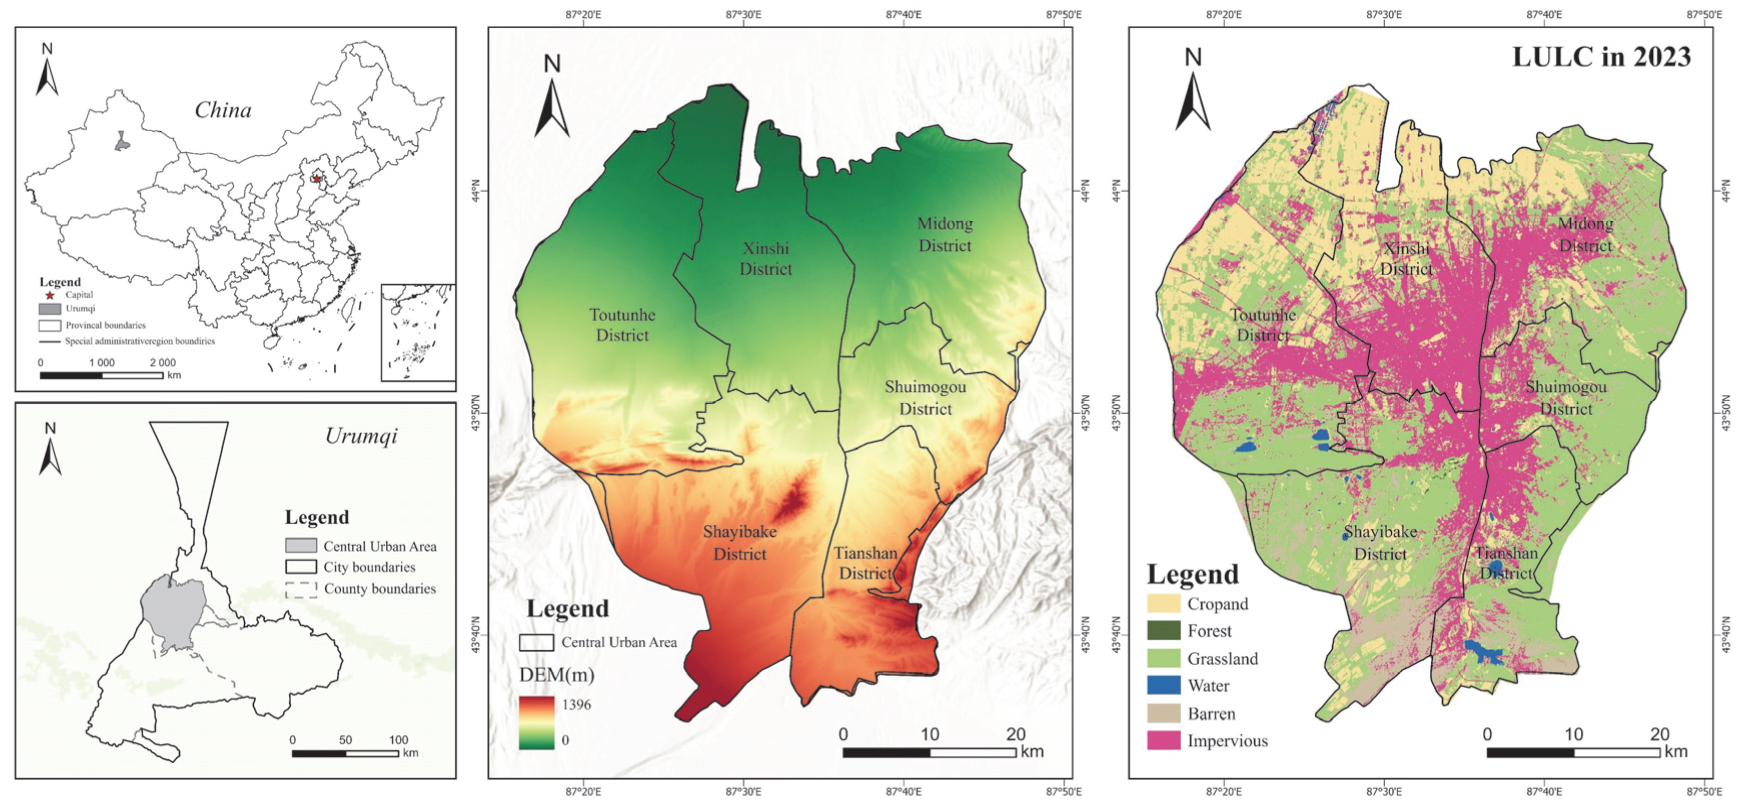
2.1. Study Area
2.2. Data Sources
2.3. Urban Landscape Pattern Metrics
2.4. Statistical Models
2.4.1. Spatial Autocorrelation Test
2.4.2. Co-Linearity Diagnosis
2.4.3. Global Linear Regression
2.4.4. GTWR Model
3. Results
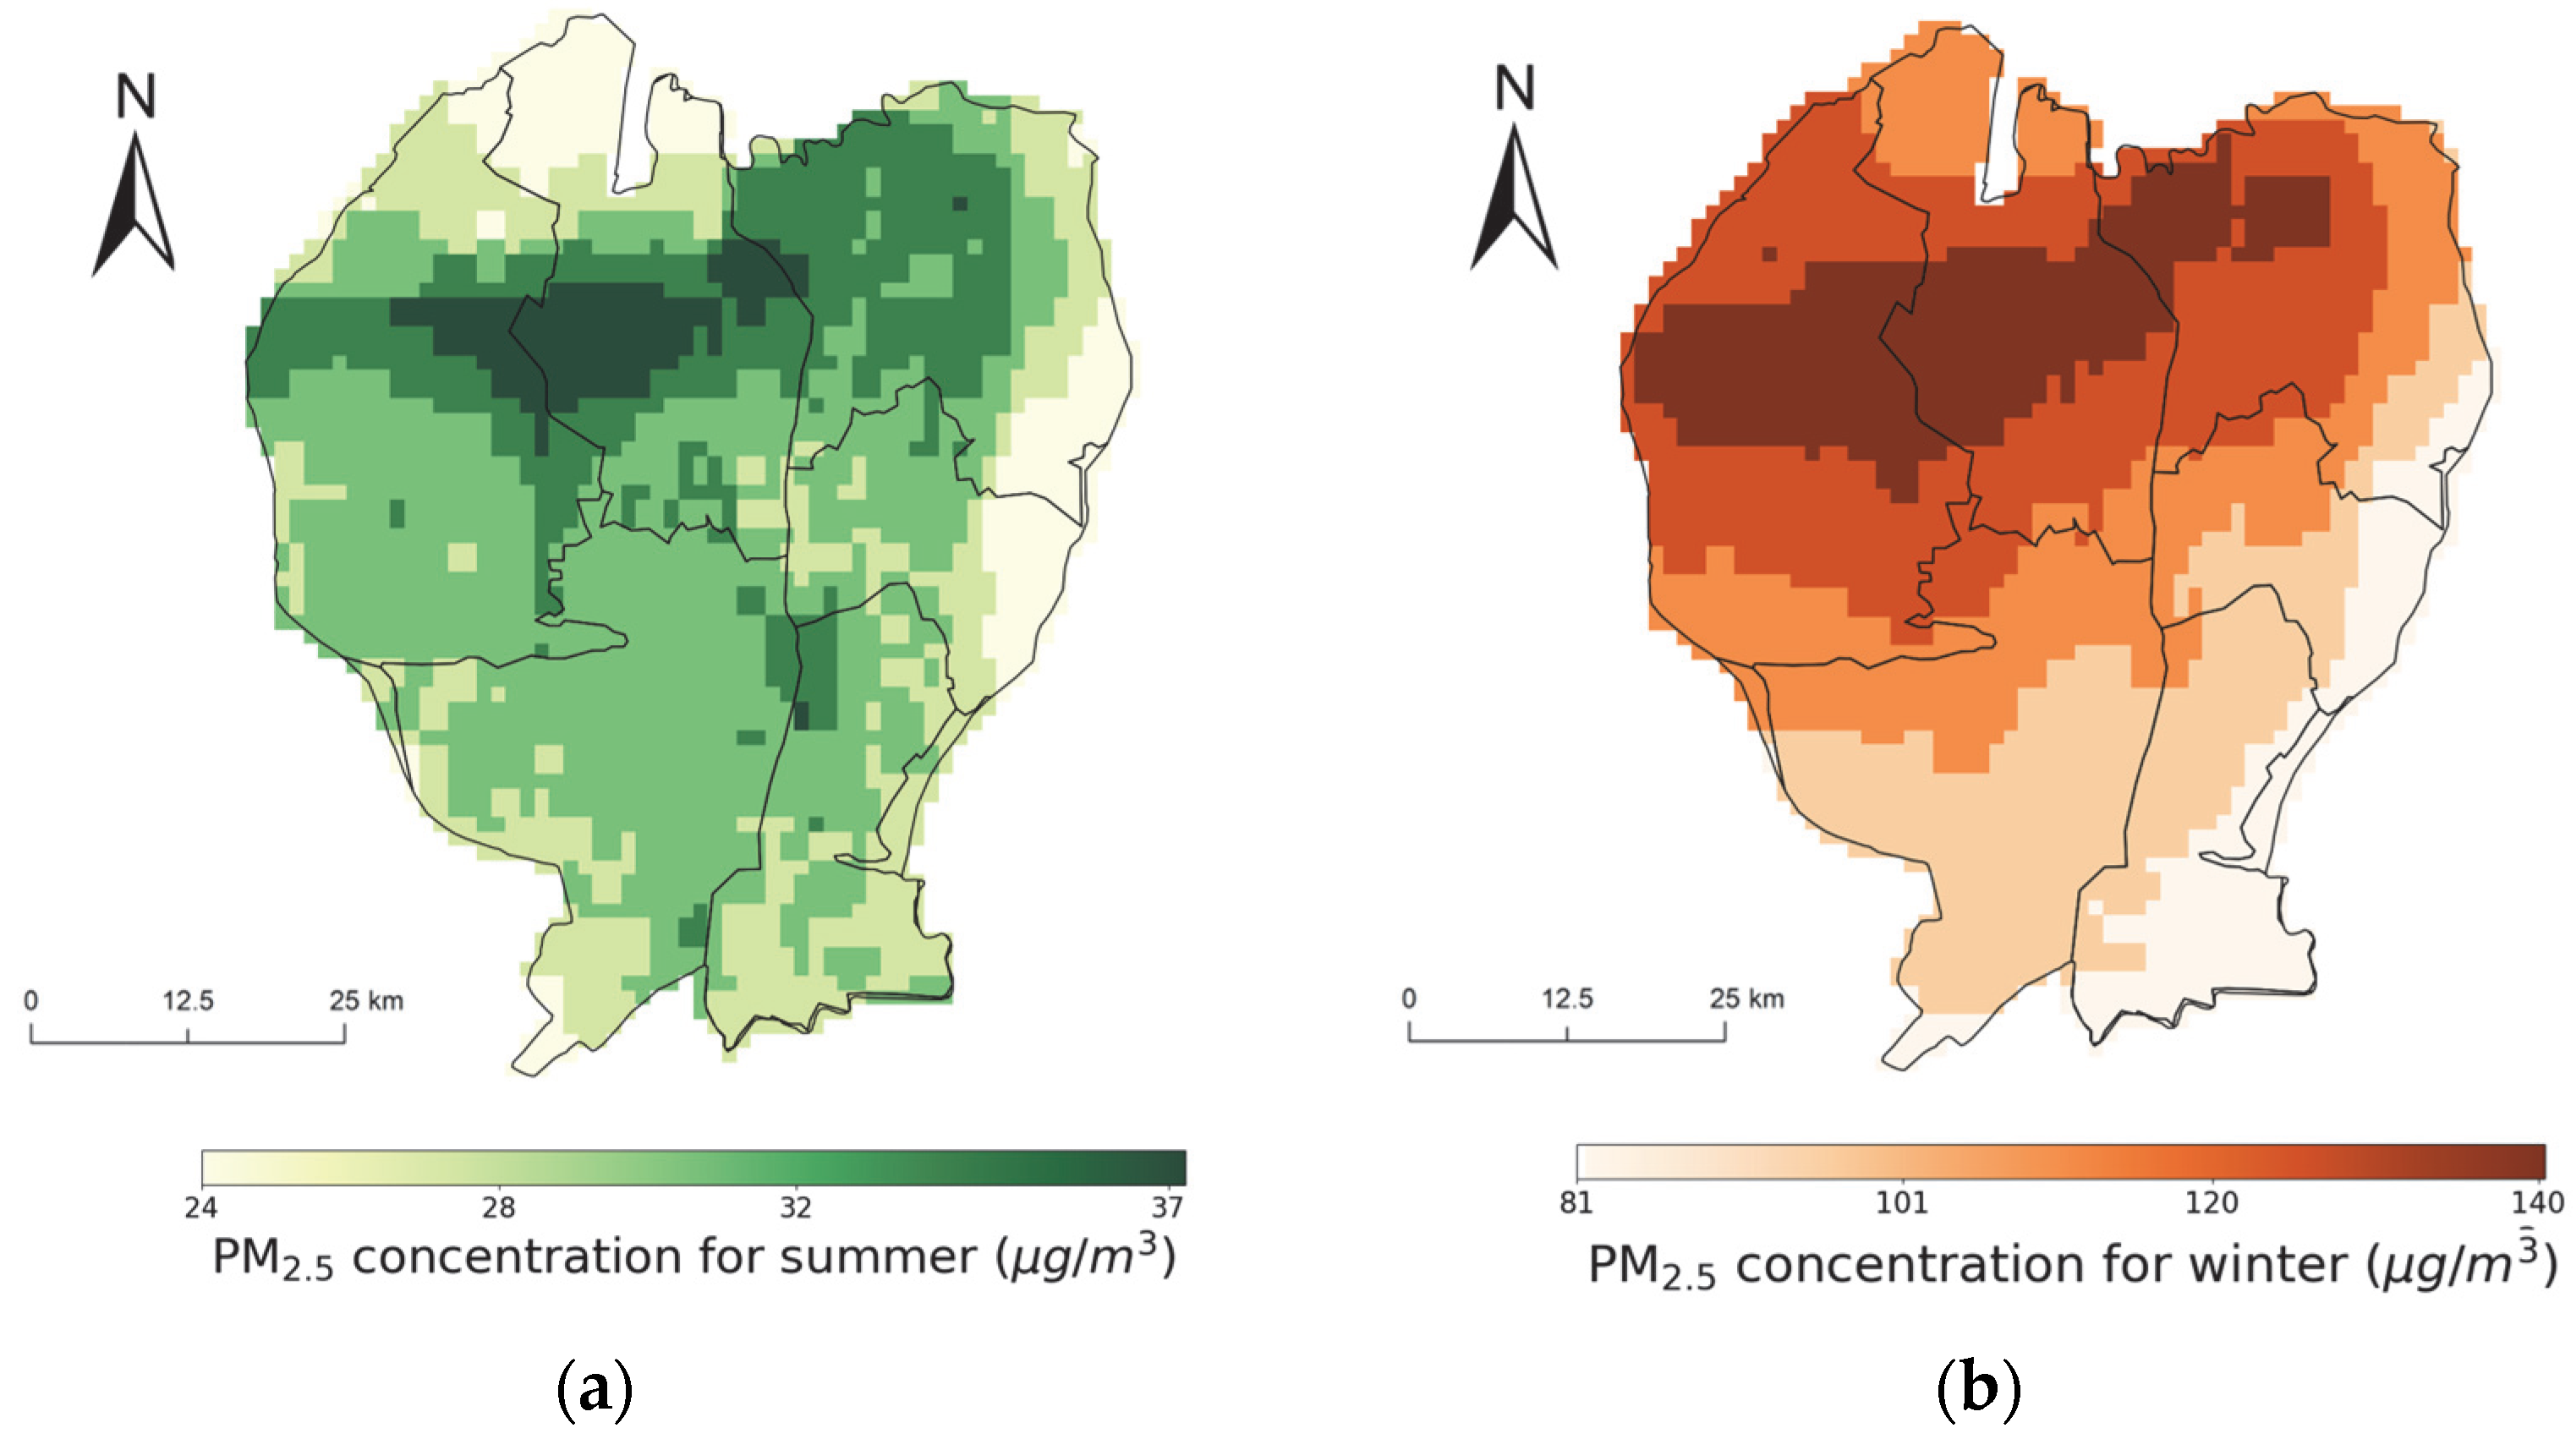
3.1. Spatiotemporal Characteristics of PM2.5
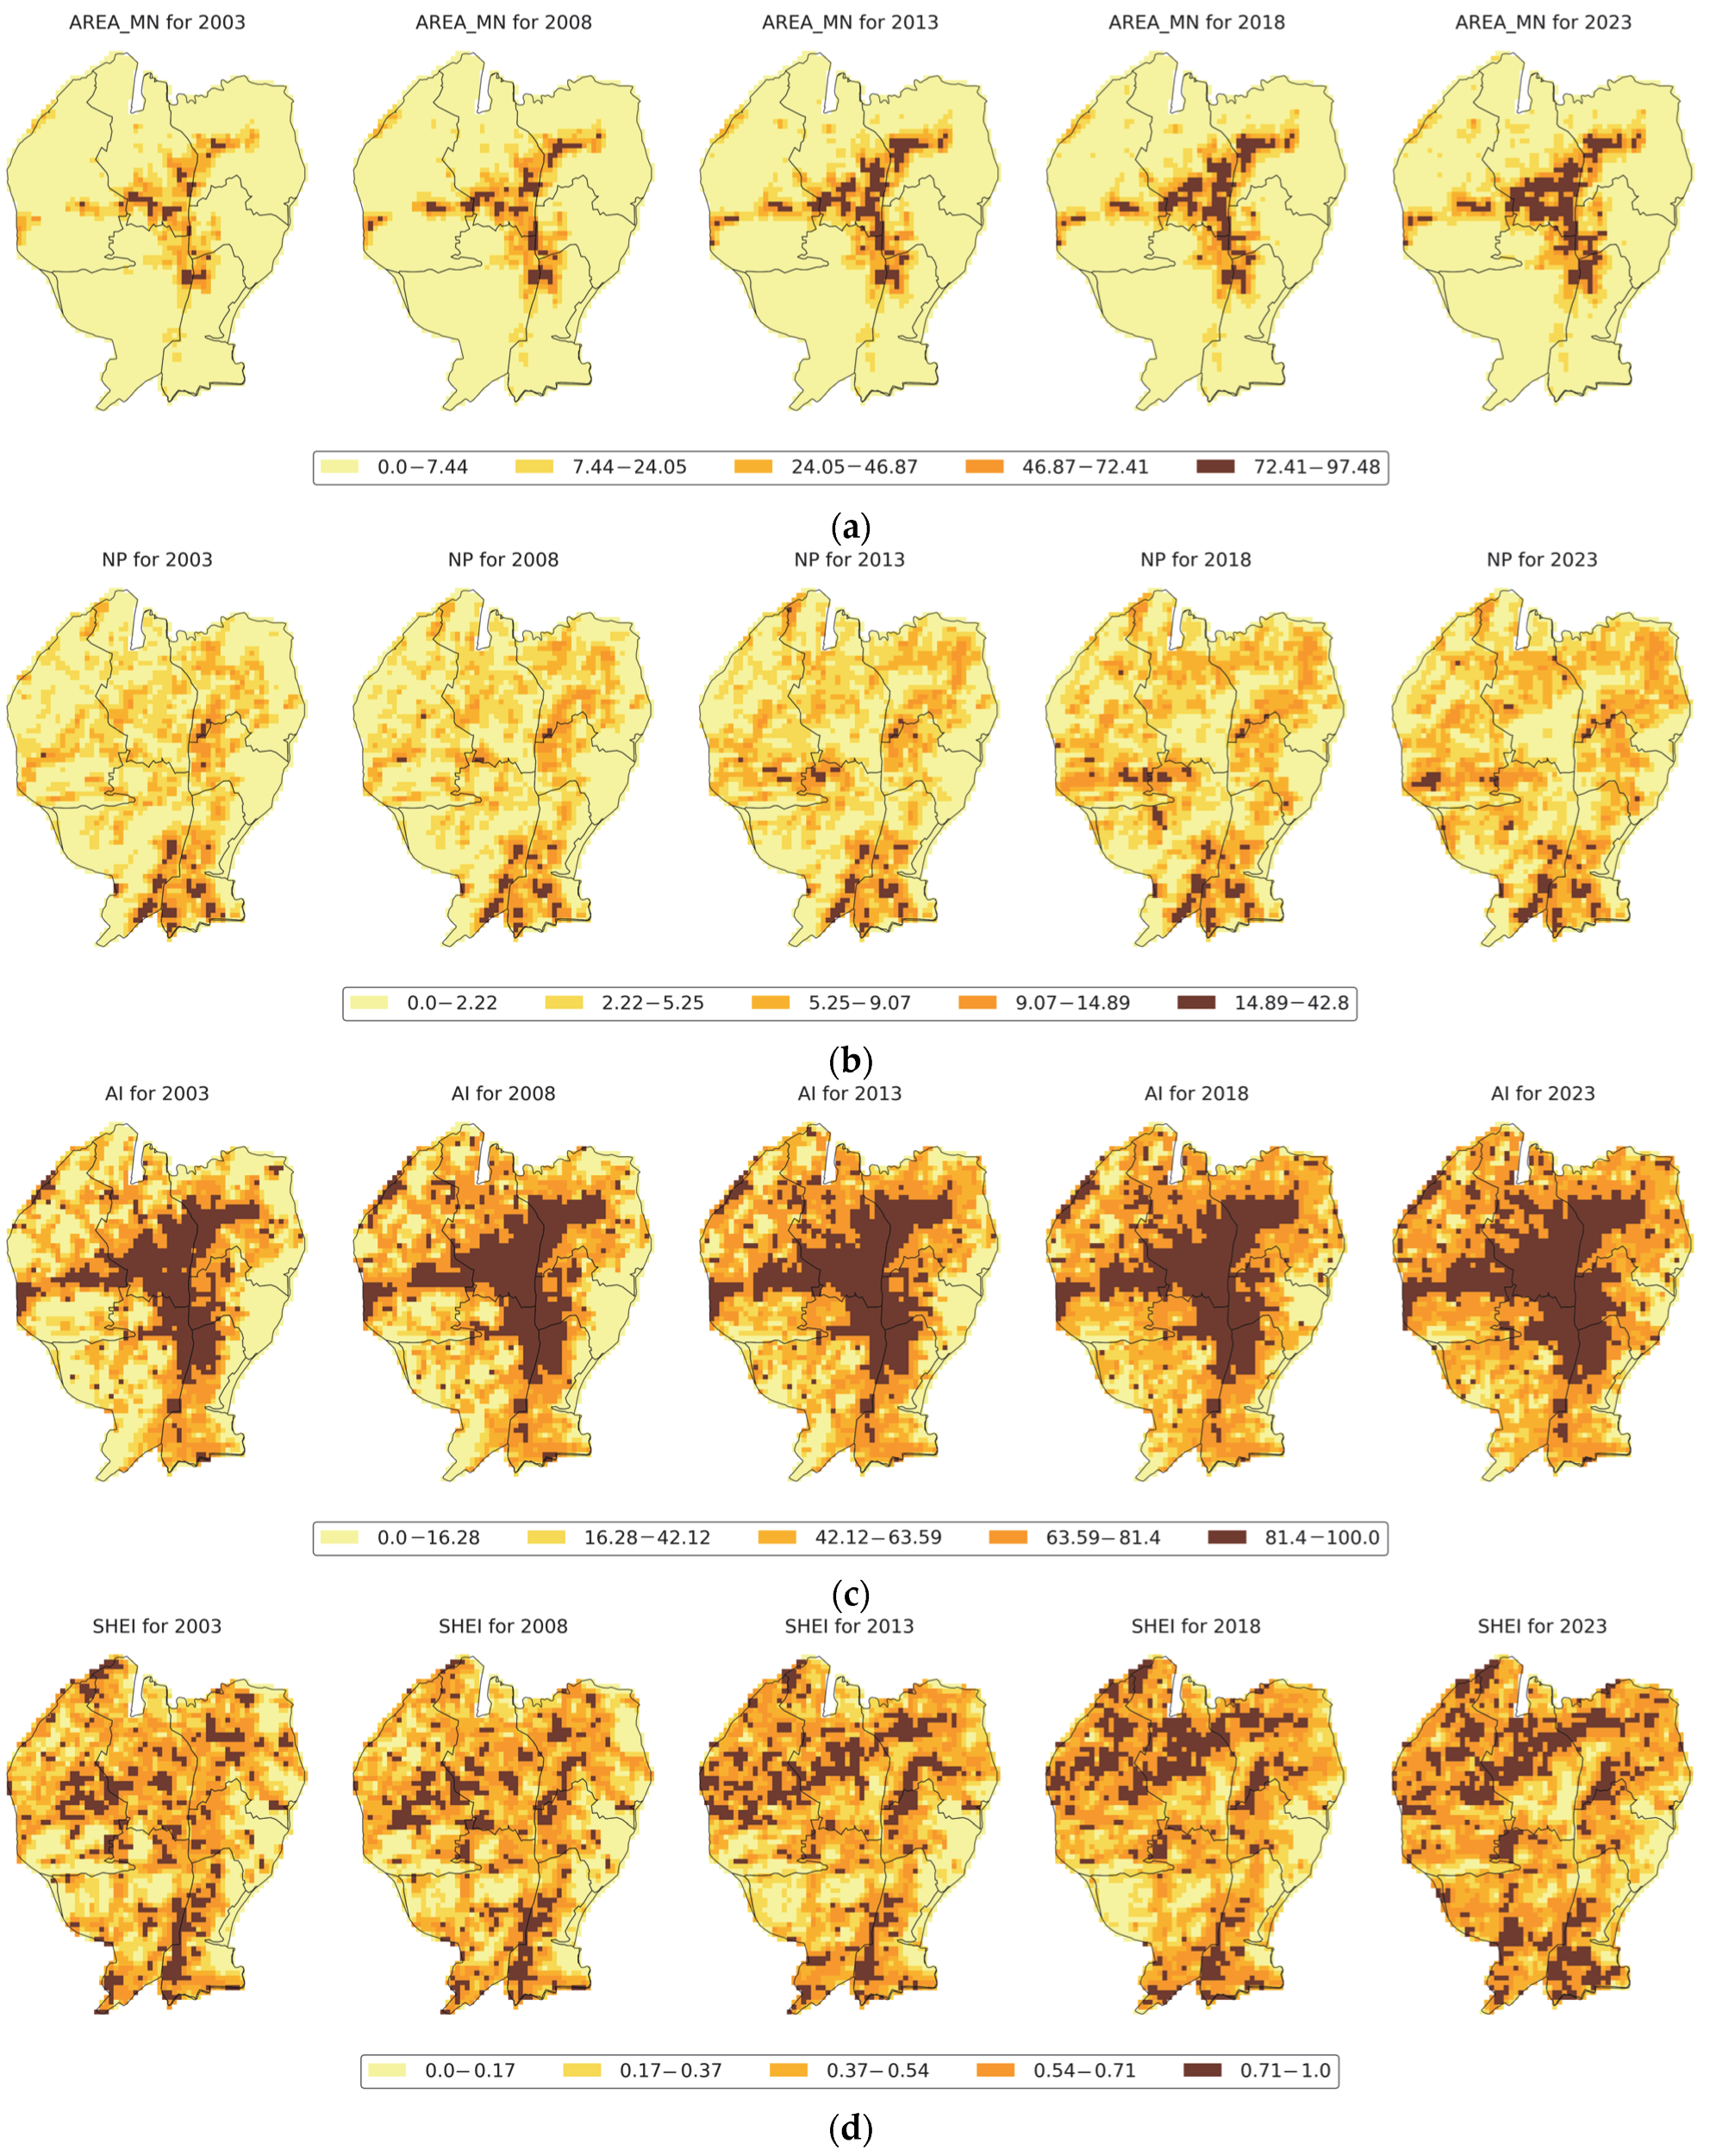
3.2. Spatiotemporal Characteristics of ULP
3.3. Comparison Between Models
3.4. Response of PM2.5 to ULP
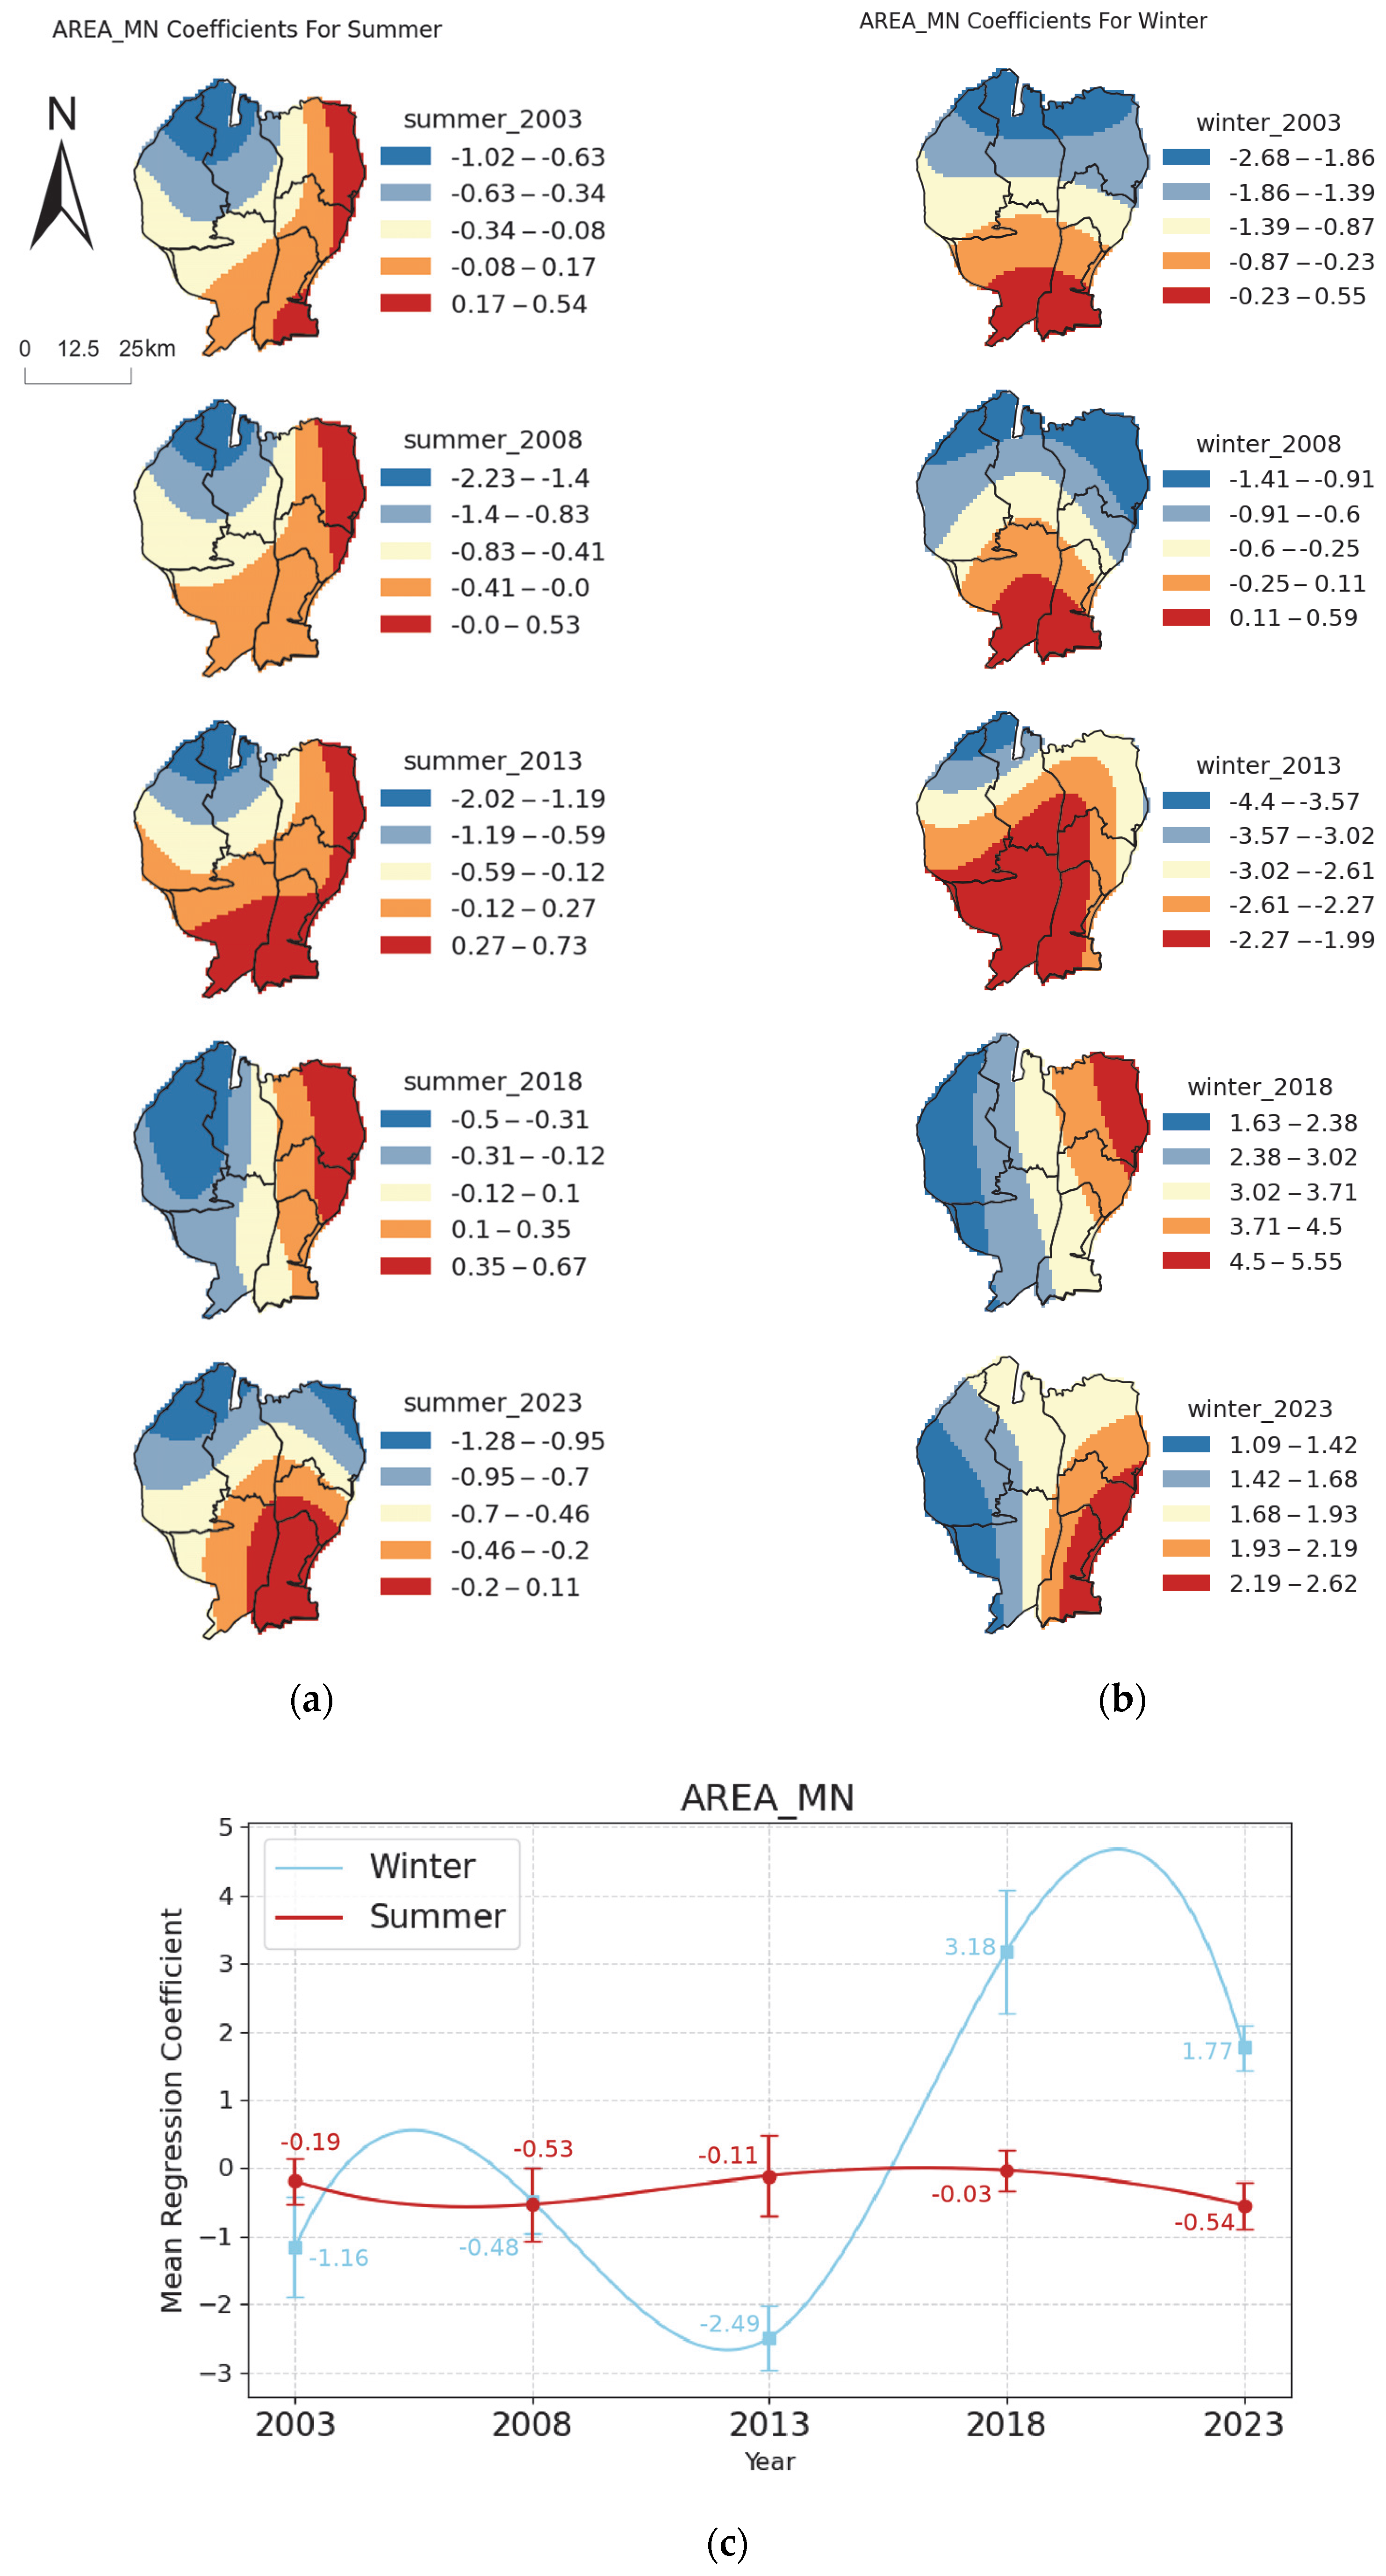
3.4.1. Response of PM2.5 to AREA_MN
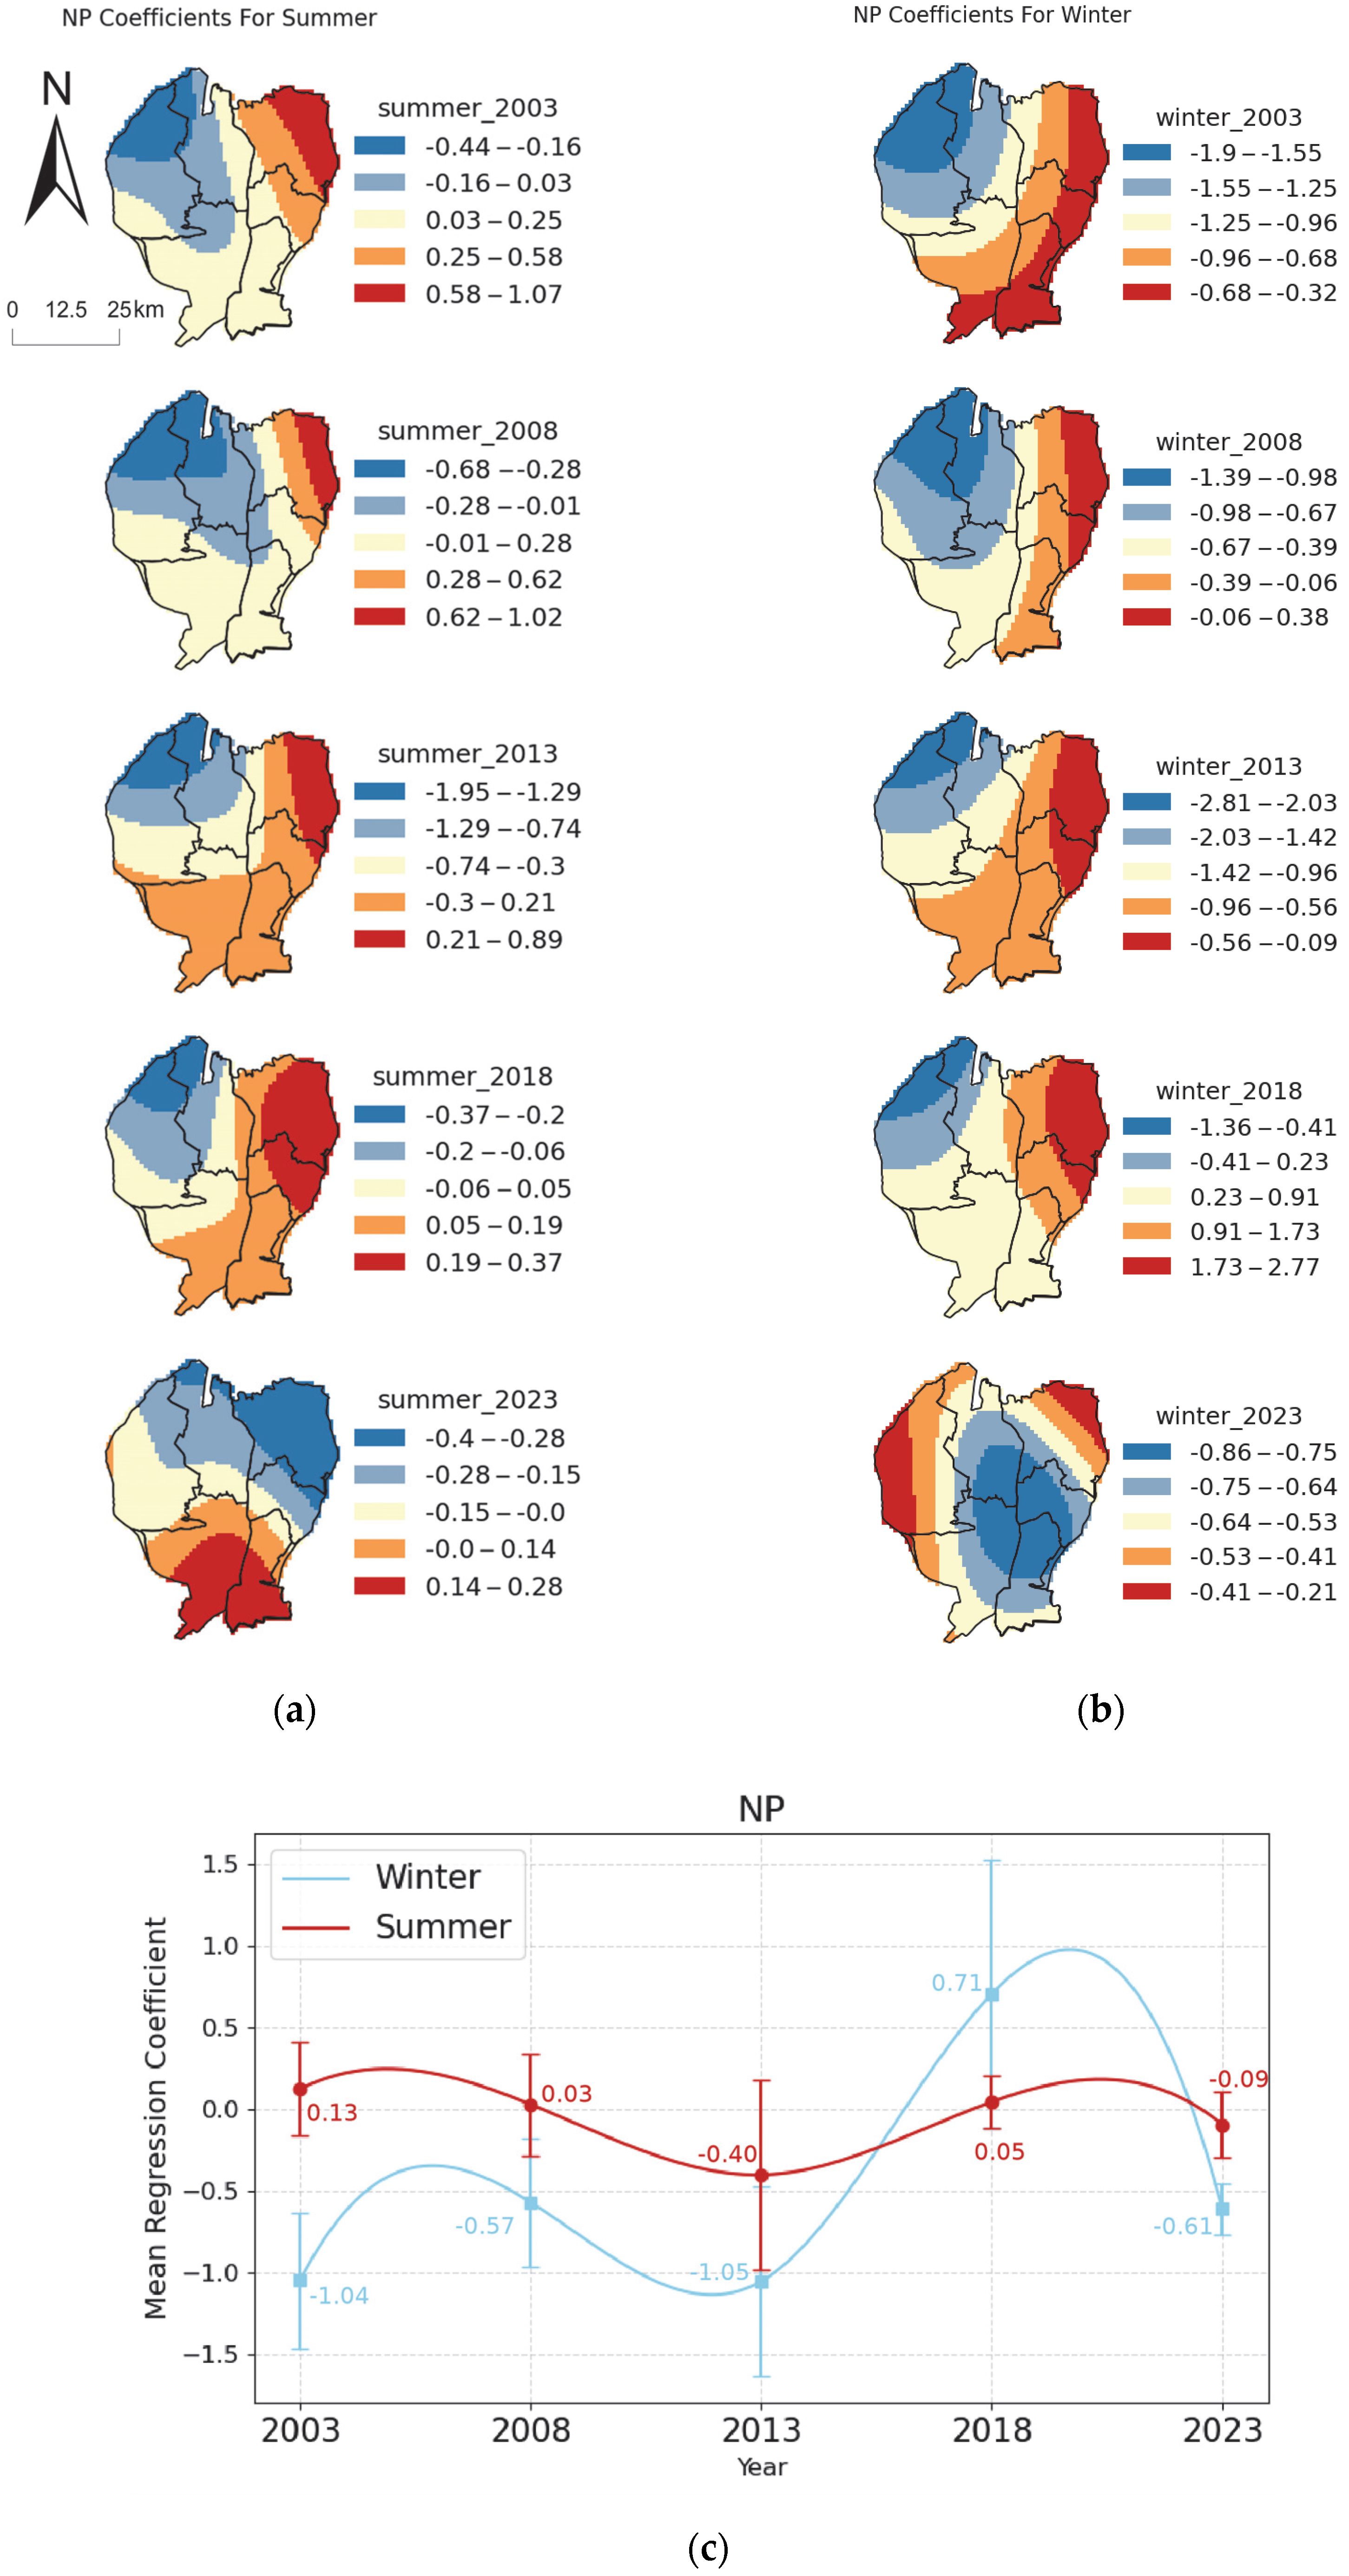
3.4.2. Response of PM2.5 to NP
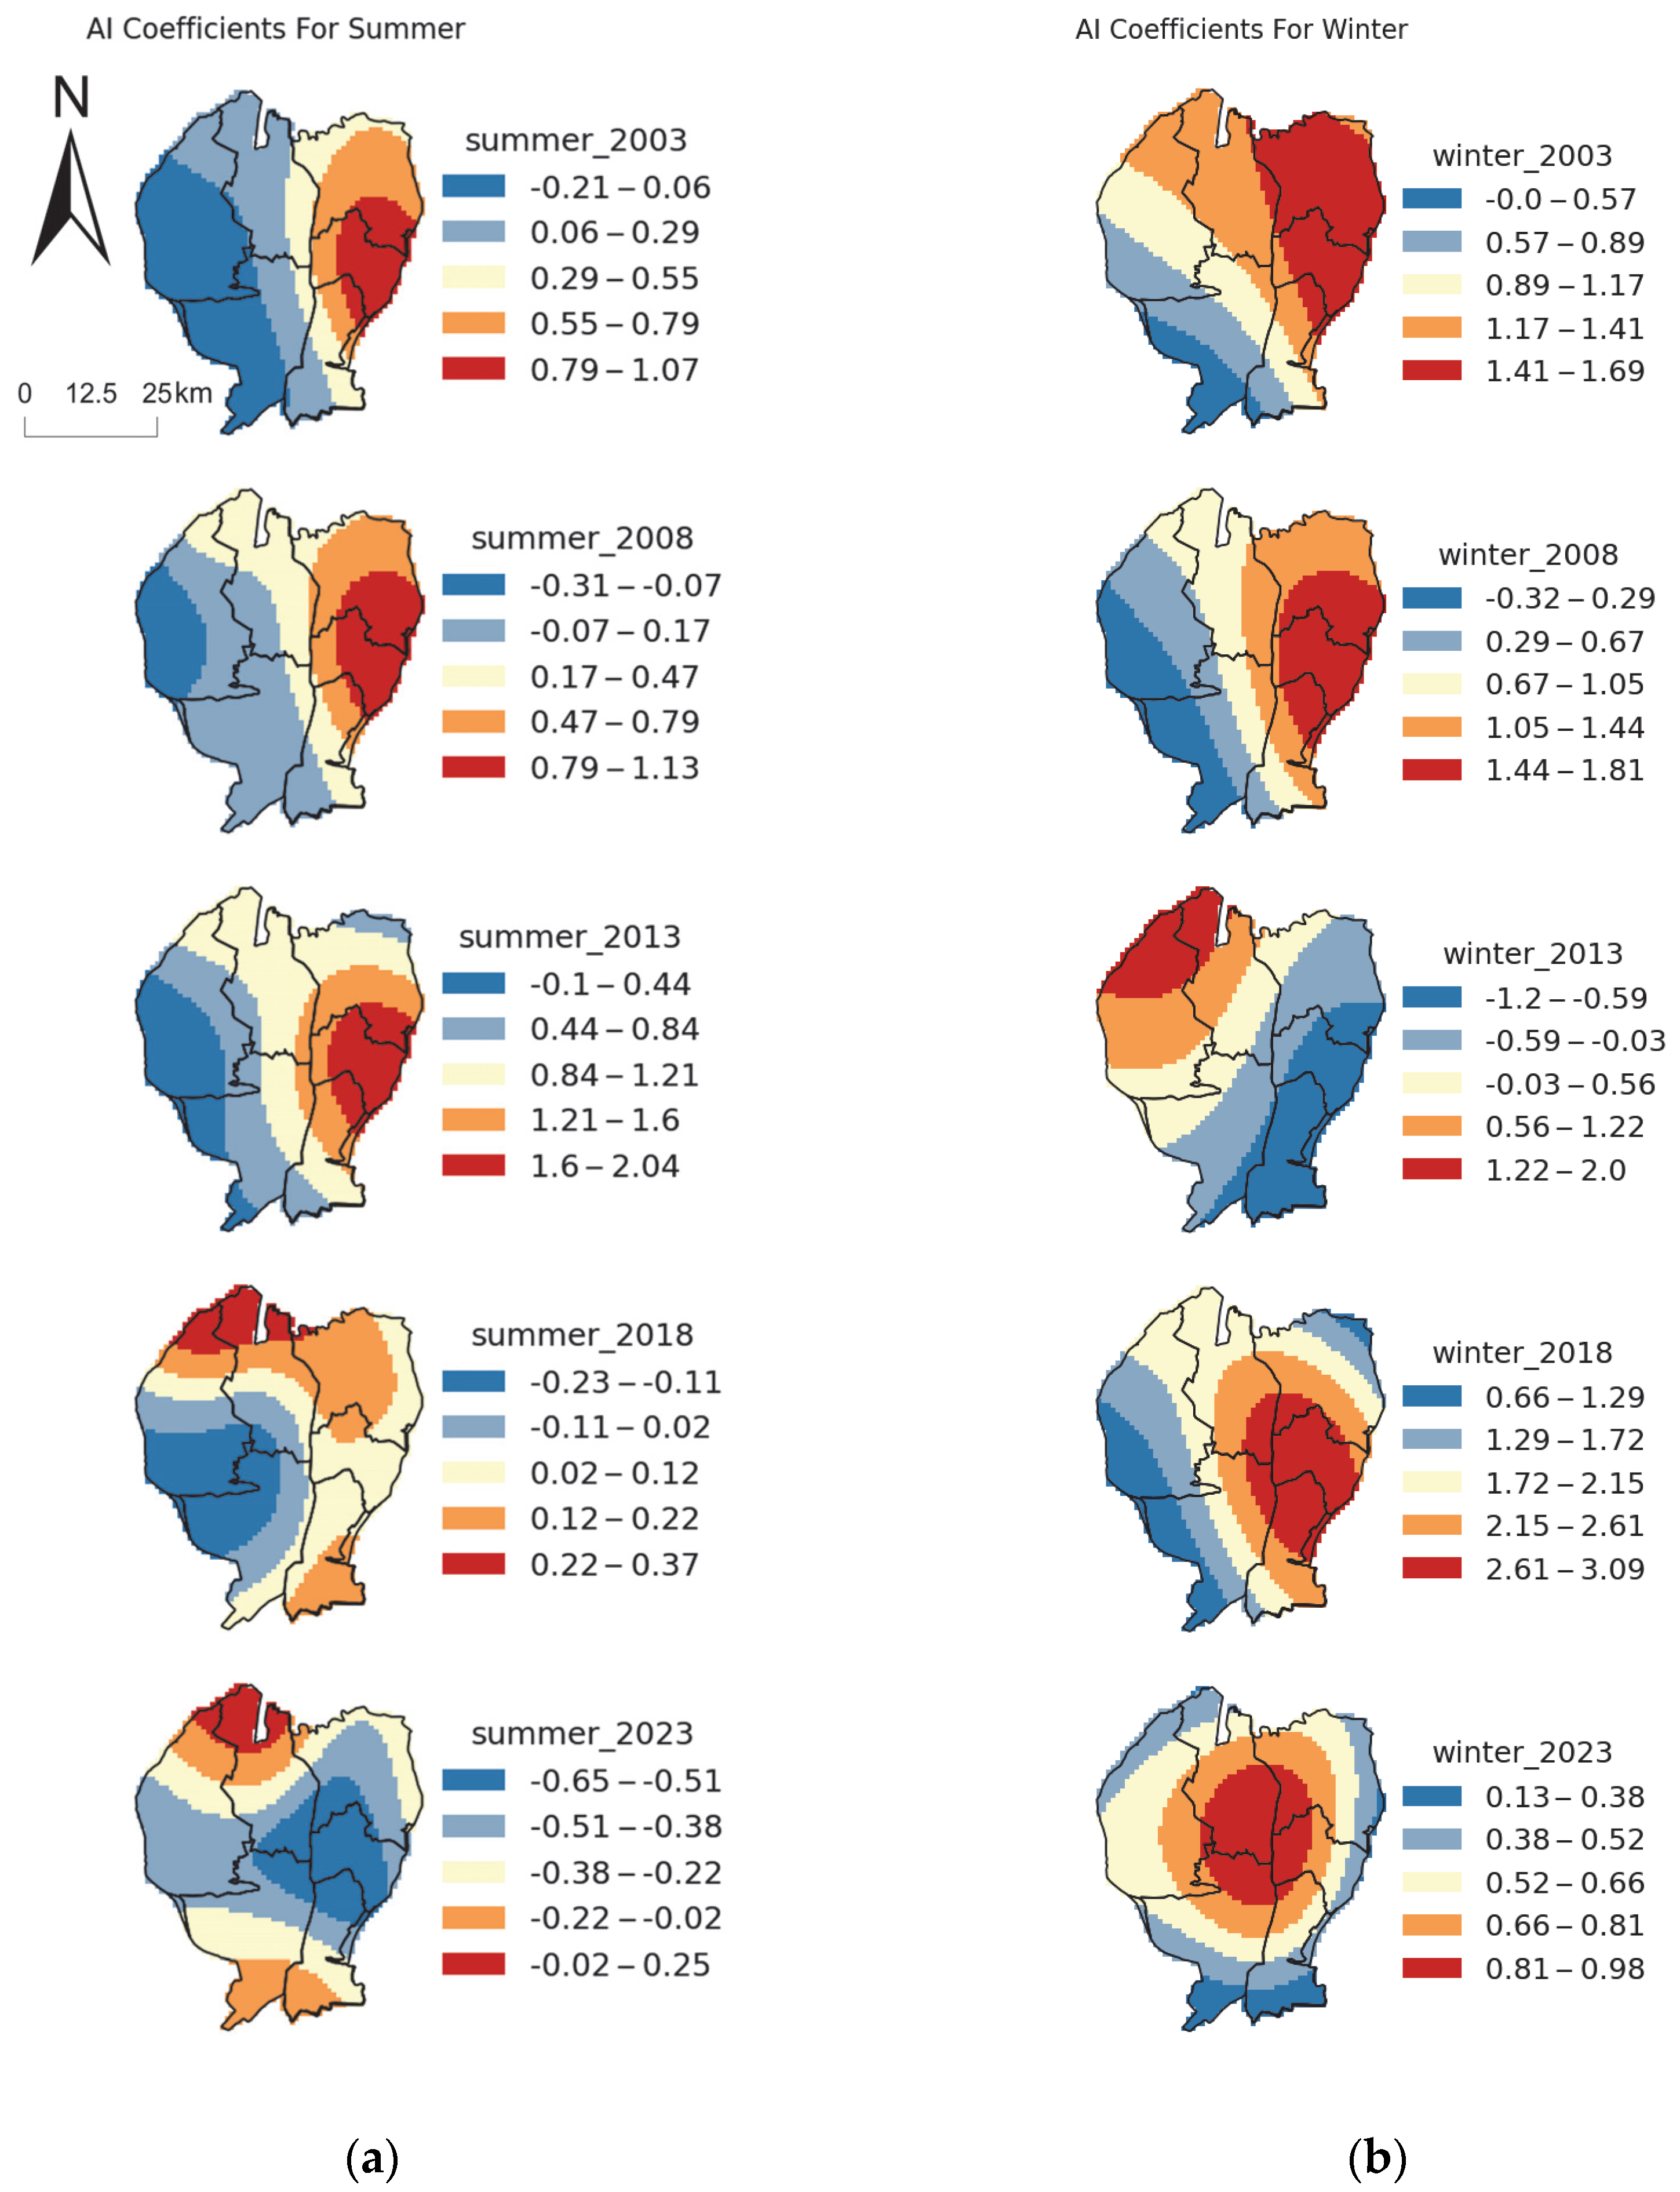
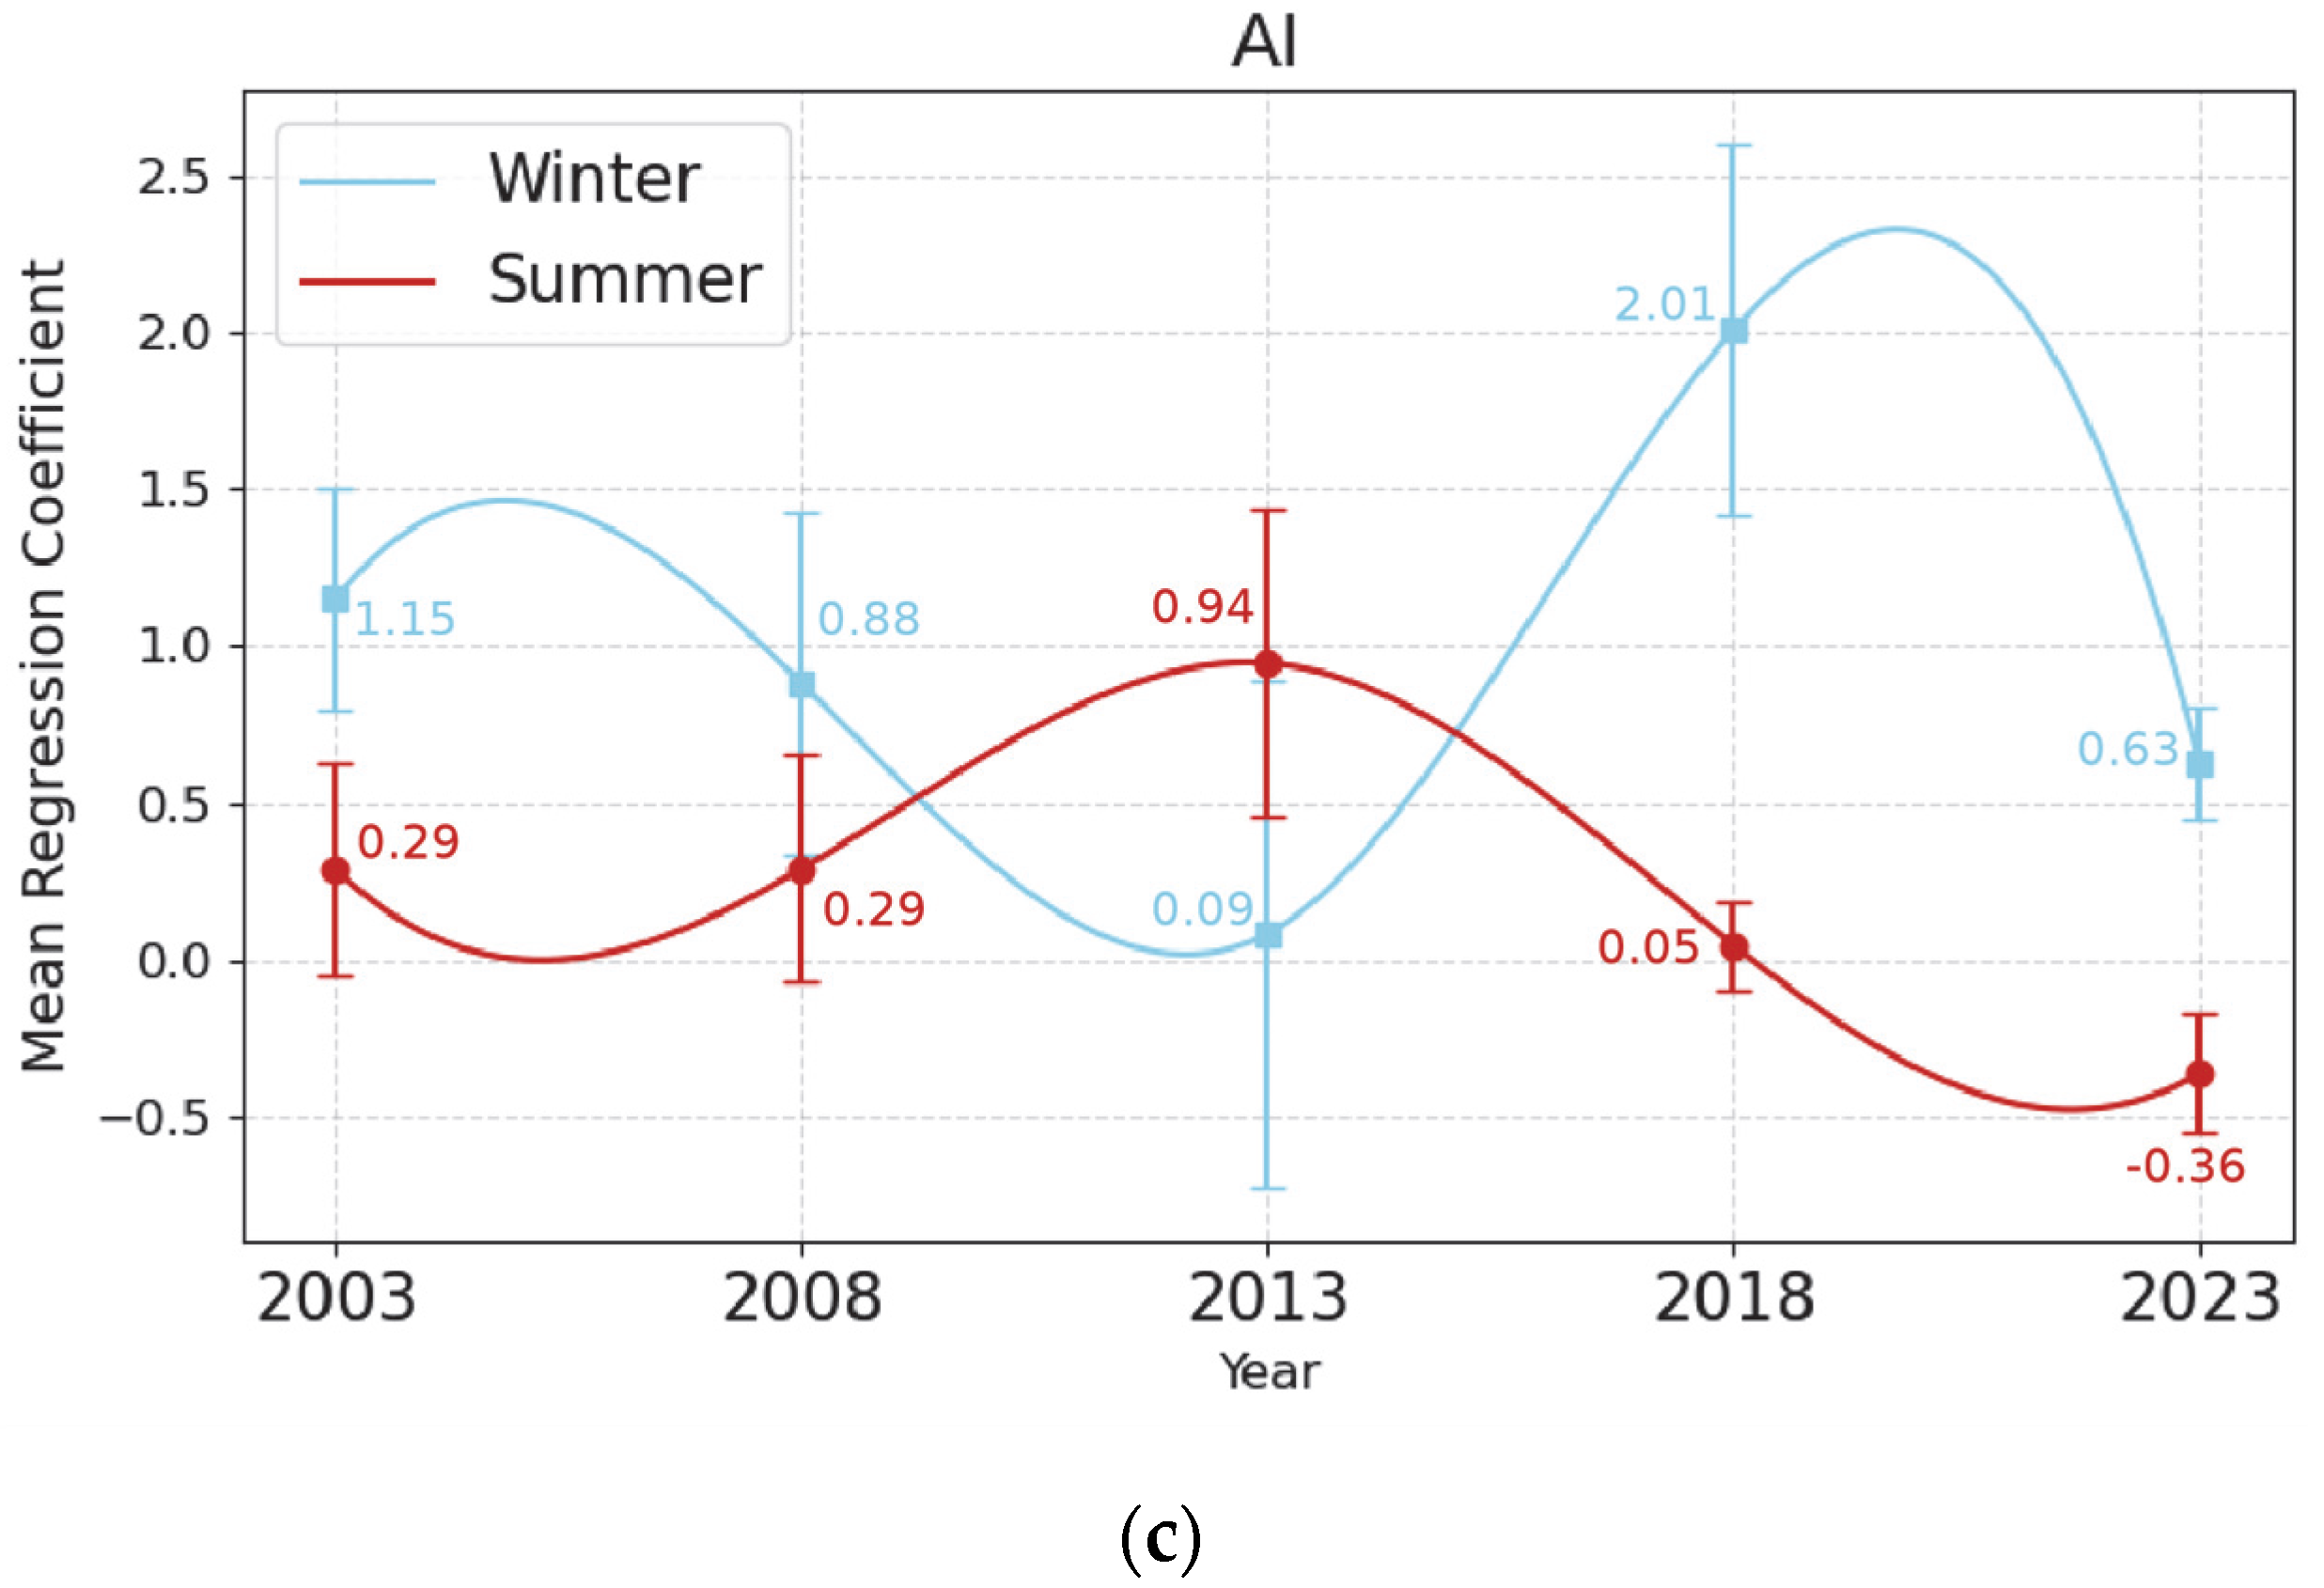
3.4.3. Response of PM2.5 to AI
3.4.4. Response of PM2.5 to SHEI
4. Discussion
4.1. Analysis of the Spatiotemporal Driving Mechanism of ULP on PM2.5
4.2. Analysis of Seasonal Variations
5. Conclusions, Limitations, and Future Work
5.1. Major Findings
- (1)
- The ULP has changed significantly from 2003 to 2023 in the central urban area of Urumqi. The trend of urban expansion is obvious, and the four ULP metrics have exhibited an overall upward trajectory, reflecting the continuous enhancement of urban continuity and agglomeration. Concurrently, the landscape diversity surrounding the CUA has undergone an increase.
- (2)
- The PM2.5 concentration in Urumqi changed significantly from 2003 to 2023, with initially rising and subsequently declining. This trend was primarily attributed to the implementation of environmental protection policies, such as Urumqi’s ‘Coal to Gas’ initiative initiated in 2012. Moreover, seasonal variations were pronounced, with winter concentrations significantly exceeding those in summer.
- (3)
- The influence of ULP on PM2.5 concentrations exhibits significant spatiotemporal variability, even within the same city. The mechanism varies significantly based on geographical location and time. Consequently, the regulation of PM2.5 pollution should take into account the variations in functional zoning and geographical space within the city.
- (4)
- The effect of ULP on PM2.5 has significant seasonal differences, which are mainly due to meteorological conditions and heating periods. The difference caused by meteorology is more obvious overall, while the difference caused by heating is more prominent in central CUA. Consequently, the management of PM2.5 must prioritize the control of seasonal factors, particularly during the winter months, when PM2.5 pollution issues are frequently more severe.
5.2. Limitations and Future Work
Author Contributions
Funding
Data Availability Statement
Conflicts of Interest
References
- Van Donkelaar, A.; Martin, R.V.; Brauer, M.; Kahn, R.; Levy, R.; Verduzco, C.; Villeneuve, P.J. Global estimates of ambient fine particulate matter concentrations from satellite-based aerosol optical depth: Development and application. Environ. Health Perspect. 2010, 118, 847–855. [Google Scholar] [CrossRef]
- Yang, D.Y.; Meng, F.; Liu, Y.; Dong, G.P.; Lu, D.B. Scale Effects and Regional Disparities of Land Use in Influencing PM2.5 Concentrations: A Case Study in the Zhengzhou Metropolitan Area, China. Land 2022, 11, 1538. [Google Scholar] [CrossRef]
- Yang, H.C.; Ma, J.T.; Jiao, X.Y.; Shang, G.F.; Yan, H.M. Characteristics and Driving Mechanism of Urban Construction Land Expansion along with Rapid Urbanization and Carbon Neutrality in Beijing, China. Land 2023, 12, 1388. [Google Scholar] [CrossRef]
- Mumtaz, M.; Jahanzaib, S.H.; Hussain, W.; Khan, S.; Youssef, Y.M.; Qaysi, S.; Abdelnabi, A.; Alarifi, N.; Abd-Elmaboud, M.E. Synergy of Remote Sensing and Geospatial Technologies to Advance Sustainable Development Goals for Future Coastal Urbanization and Environmental Challenges in a Riverine Megacity. ISPRS Int. J. Geo-Inf. 2025, 14, 30. [Google Scholar] [CrossRef]
- Wang, J.D.; Zhao, B.; Wang, S.X.; Yang, F.M.; Xing, J.; Morawska, L.; Ding, A.J.; Kulmala, M.; Kerminen, V.M.; Kujansuu, J.; et al. Particulate matter pollution over China and the effects of control policies. Sci. Total Environ. 2017, 584, 426–447. [Google Scholar] [CrossRef]
- Xiao, Q.Y.; Geng, G.N.; Xue, T.; Liu, S.G.; Cai, C.L.; He, K.B.; Zhang, Q. Tracking PM2.5 and O3 Pollution and the Related Health Burden in China 2013–2020. Environ. Sci. Technol. 2022, 56, 6922–6932. [Google Scholar] [CrossRef]
- Luck, M.; Wu, J. A gradient analysis of urban landscape pattern: A case study from the Phoenix metropolitan region, Arizona, USA. Landsc. Ecol. 2002, 17, 327–339. [Google Scholar] [CrossRef]
- Cao, Q.; Luan, Q.; Liu, Y.; Wang, R. The effects of 2D and 3D building morphology on urban environments: A multi-scale analysis in the Beijing metropolitan region. Build. Environ. 2021, 192, 107635. [Google Scholar] [CrossRef]
- Huang, X.; Ding, A.J.; Wang, Z.L.; Ding, K.; Gao, J.; Chai, F.H.; Fu, C.B. Amplified transboundary transport of haze by aerosol-boundary layer interaction in China. Nat. Geosci. 2020, 13, 428–434. [Google Scholar] [CrossRef]
- Tianheng, S.; Taofang, Y.; Xia, L.; Shuo, Y. Unearthing the impact of urban sprawl on transport carbon dioxide emissions: Fresh evidence from 274 Chinese cities. J. Geogr. Sci. 2024, 34, 1953–1976. [Google Scholar] [CrossRef]
- Guo, L.; Di, L.; Zhang, C.; Lin, L.; Chen, F.; Molla, A. Evaluating contributions of urbanization and global climate change to urban land surface temperature change: A case study in Lagos, Nigeria. Sci. Rep. 2022, 12, 14168. [Google Scholar] [CrossRef] [PubMed]
- Kumar, P.; Druckman, A.; Gallagher, J.; Gatersleben, B.; Allison, S.; Eisenman, T.S.; Hoang, U.; Hama, S.; Tiwari, A.; Sharma, A.; et al. The nexus between air pollution, green infrastructure and human health. Environ. Int. 2019, 133, 14. [Google Scholar] [CrossRef] [PubMed]
- Chen, Y.Y.; Ke, X.L.; Min, M.; Zhang, Y.; Dai, Y.Q.; Tang, L.P. Do We Need More Urban Green Space to Alleviate PM2.5 Pollution? A Case Study in Wuhan, China. Land 2022, 11, 776. [Google Scholar] [CrossRef]
- Lu, D.; Mao, W.; Yang, D.; Zhao, J.; Xu, J. Effects of land use and landscape pattern on PM2.5 in Yangtze River Delta, China. Atmos. Pollut. Res. 2018, 9, 705–713. [Google Scholar] [CrossRef]
- Wang, L.; Xiong, Q.; Wu, G.; Gautam, A.; Jiang, J.; Liu, S.; Zhao, W.; Guan, H. Spatio-temporal variation characteristics of PM2.5 in the Beijing–Tianjin–Hebei Region, China, from 2013 to 2018. Int. J. Environ. Res. Public Health 2019, 16, 4276. [Google Scholar] [CrossRef]
- Fan, C.; Myint, S. A comparison of spatial autocorrelation indices and landscape metrics in measuring urban landscape fragmentation. Landsc. Urban Plan. 2014, 121, 117–128. [Google Scholar] [CrossRef]
- Zhang, Z.; Zhang, H.; Meng, X.; Wang, Y.; Yao, Y.; Li, X. The role of data resolution in analyzing urban form and PM2.5 concentration. Comput. Environ. Urban Syst. 2025, 115, 102214. [Google Scholar] [CrossRef]
- Cao, W.; Wang, L.; Li, R.; Zhou, W.; Zhang, D. Unveiling the nonlinear relationships and co-mitigation effects of green and blue space landscapes on PM2.5 exposure through explainable machine learning. Sustain. Cities Soc. 2025, 122, 106234. [Google Scholar] [CrossRef]
- Jiang, M.; Wu, Y.; Chang, Z.; Shi, K. The Effects of Urban Forms on the PM2.5 Concentration in China: A Hierarchical Multiscale Analysis. Int. J. Environ. Res. Public Health 2021, 18, 3785. [Google Scholar] [CrossRef]
- Zhang, D.H.; Zhou, C.S.; He, B.J. Spatial and temporal heterogeneity of urban land area and PM2.5 concentration in China. Urban Clim. 2022, 45, 15. [Google Scholar] [CrossRef]
- Wang, J.; Ogawa, S. Effects of meteorological conditions on PM2.5 concentrations in Nagasaki, Japan. Int. J. Environ. Res. Public Health 2015, 12, 9089–9101. [Google Scholar] [CrossRef] [PubMed]
- Gao, P.; Yang, Y.; Liang, L. Influence of urban construction landscape pattern on PM 2.5 pollution: Theory and demonstration-a case of the Pearl River Delta region. Appl. Ecol. Environ. Res. 2020, 18, 7915–7939. [Google Scholar] [CrossRef]
- Tu, M.; Liu, Z.; He, C.; Fang, Z.; Lu, W. The relationships between urban landscape patterns and fine particulate pollution in China: A multiscale investigation using a geographically weighted regression model. J. Clean. Prod. 2019, 237, 117744. [Google Scholar] [CrossRef]
- Yingxue, R.; Chenxi, W.; Qingsong, H. The antagonistic effect of urban growth pattern and shrinking cities on air quality: Based on the empirical analysis of 174 cities in China. Sustain. Cities Soc. 2023, 97, 11. [Google Scholar] [CrossRef]
- Liu, Y.; He, L.; Qin, W.; Lin, A.; Yang, Y. The effect of urban form on PM2.5 concentration: Evidence from China’s 340 prefecture-level cities. Remote Sens. 2021, 14, 7. [Google Scholar] [CrossRef]
- Huang, B.; Wu, B.; Barry, M. Geographically and temporally weighted regression for modeling spatio-temporal variation in house prices. Int. J. Geogr. Inf. Sci. 2010, 24, 383–401. [Google Scholar] [CrossRef]
- Zhu, S.; Tang, J.; Zhou, X.; Li, P.; Liu, Z.; Zhang, C.; Zou, Z.; Li, T.; Peng, C. Spatiotemporal analysis of the impact of urban landscape forms on PM2.5 in China from 2001 to 2020. Int. J. Digit. Earth 2023, 16, 3417–3434. [Google Scholar] [CrossRef]
- Gou, A.-P.; Li, W.-X.; Wang, J.-B. Spatiotemporal Correlation Between Green Space Landscape Pattern and PM2.5 Concentration in Chongqing City, China. J. Earth Sci. Environ. 2024, 46, 25–37. (In Chinese) [Google Scholar] [CrossRef]
- Yang, N.; Shi, H.; Tang, H.; Yang, X. Geographical and temporal encoding for improving the estimation of PM2.5 concentrations in China using end-to-end gradient boosting. Remote Sens. Environ. 2022, 269, 112828. [Google Scholar] [CrossRef]
- Zhang, J.; Chen, J.; Zhu, W.; Ren, Y.; Cui, J.; Jin, X. Impact of urban space on PM2.5 distribution: A multiscale and seasonal study in the Yangtze River Delta urban agglomeration. J. Environ. Manag. 2024, 363, 121287. [Google Scholar] [CrossRef]
- Wei, J.; Li, Z.Q.; Cribb, M.; Huang, W.; Xue, W.H.; Sun, L.; Guo, J.P.; Peng, Y.R.; Li, J.; Lyapustin, A.; et al. Improved 1 km resolution PM 2.5 estimates across China using enhanced space-time extremely randomized trees. Atmos. Chem. Phys. 2020, 20, 3273–3289. [Google Scholar] [CrossRef]
- Wei, J.; Li, Z.; Lyapustin, A.; Sun, L.; Peng, Y.; Xue, W.; Su, T.; Cribb, M. Reconstructing 1-km-resolution high-quality PM2.5 data records from 2000 to 2018 in China: Spatiotemporal variations and policy implications. Remote Sens. Environ. 2021, 252, 17. [Google Scholar] [CrossRef]
- Yang, J.; Huang, X. The 30 m annual land cover dataset and its dynamics in China from 1990 to 2019. Earth Syst. Sci. Data Discuss. 2021, 2021, 1–29. [Google Scholar] [CrossRef]
- Tian, Y.; Yao, X.B.A.; Mu, L.; Fan, Q.J.; Liu, Y.J. Integrating meteorological factors for better understanding of the urban form-air quality relationship. Landsc. Ecol. 2020, 35, 2357–2373. [Google Scholar] [CrossRef]
- Huang, X.-G.; Zhao, J.-B.; Xin, W.-D. Factors and Their Interaction Effects on the Distribution of PM2.5 in the Yangtze River Delta Based on Grids. Environ. Sci. 2021, 42, 3107–3117. (In Chinese) [Google Scholar] [CrossRef]
- Huang, C.; Hu, J.; Xue, T.; Xu, H.; Wang, M. High-resolution spatiotemporal modeling for ambient PM2.5 exposure assessment in China from 2013 to 2019. Environ. Sci. Technol. 2021, 55, 2152–2162. (In Chinese) [Google Scholar] [CrossRef]
- Li, F.; Zhou, T. Effects of urban form on air quality in China: An analysis based on the spatial autoregressive model. Cities 2019, 89, 130–140. [Google Scholar] [CrossRef]
- Wang, Y.F.; Lv, W.Y.; Wang, M.J.; Chen, X.; Li, Y. Application of improved Moran’s I in the evaluation of urban spatial development. Spat. Stat. 2023, 54, 20. [Google Scholar] [CrossRef]
- Kalnins, A. Multicollinearity: How common factors cause Type 1 errors in multivariate regression. Strateg. Manag. J. 2018, 39, 2362–2385. [Google Scholar] [CrossRef]
- Ren, Y.; Wang, G.; Wu, C.; Wang, J.; Li, J.; Zhang, L.; Han, Y.; Liu, L.; Cao, C.; Cao, J.; et al. Changes in concentration, composition and source contribution of atmospheric organic aerosols by shifting coal to natural gas in Urumqi. Atmos. Environ. 2017, 148, 306–315. [Google Scholar] [CrossRef]
- Guo, B.; Wang, X.X.; Zhang, D.H.; Pei, L.; Zhang, D.M.; Wang, X.F. A Land Use Regression Application into Simulating Spatial Distribution Characteristics of Particulate Matter (PM2.5) Concentration in City of Xi’an, China. Pol. J. Environ. Stud. 2020, 29, 4065–4076. [Google Scholar] [CrossRef] [PubMed]
- Wang, R.; Ding, J.; Ma, W. Spatio-Temporal Evolution and Diffusion Trajectory Simulation of PM2.5 in Urumqi City. Environ. Sci. Technol. 2021, 44, 13–20. [Google Scholar] [CrossRef]
- Wang, R.; Chen, Q.; Wang, D. Effects of altitude, plant communities, and canopies on the thermal comfort, negative air ions, and airborne particles of mountain forests in summer. Sustainability 2022, 14, 3882. [Google Scholar] [CrossRef]
- Ma, X.L.; Zhang, J.Y.; Ding, C.; Wang, Y.P. A geographically and temporally weighted regression model to explore the spatiotemporal influence of built environment on transit ridership. Comput. Environ. Urban Syst. 2018, 70, 113–124. [Google Scholar] [CrossRef]
- Fan, Z.; Zhan, Q.; Wang, Y.; Shao, Z.; Fan, Y.; Zhang, Y. Investigating the effect of spatial patterns of artificial impervious surface on PM2.5 at the intra-urban scale. Geo-Spat. Inf. Sci. 2024, 27, 1–20. [Google Scholar] [CrossRef]
- Zhang, B.; Wang, S. Dynamic changes of the sand-fixing service in the sandstorm source control region of Xilin Gol League. J. Ecol. Rural Environ. 2020, 36, 291–299. [Google Scholar] [CrossRef]
- Jiang, Z.B.; Qian, Z.; Feng, Y.; Yi, S. Construction Site Dust Management Engineering Technology Overview. Resour. Conserv. Environ. Prot. 2019, 2, 52–53. (In Chinese) [Google Scholar] [CrossRef]
- Lyu, R.F.; Zhang, J.M.; Pang, J.L.; Zhang, J.M. Modeling the impacts of 2D/3D urban structure on PM2.5 at high resolution by combining UAV multispectral/LiDAR measurements and multi-source remote sensing images. J. Clean. Prod. 2024, 437, 13. [Google Scholar] [CrossRef]
- McCarty, J.; Kaza, N. Urban form and air quality in the United States. Landsc. Urban Plan. 2015, 139, 168–179. [Google Scholar] [CrossRef]
- Meng, J.; Han, W.; Yuan, C. Seasonal and multi-scale difference of the relationship between built-up land landscape pattern and PM2.5 concentration distribution in Nanjing. Ecol. Indic. 2023, 156, 15. [Google Scholar] [CrossRef]
- Li, S.; Zou, B.; Liu, N.; Feng, H.-H.; Chen, J.; Zhang, H.-H. Simulation of PM2.5 Concentration Based on Optimized Indexes of 2D/3D Urban Form. Huan Jing Ke Xue = Huanjing Kexue 2022, 43, 4425–4437. [Google Scholar] [CrossRef]
- Chen, Z.; Zhang, Z. Analysis of spatiotemporal variation and relationship to land use—Landscape pattern of PM2.5 and O3 in typical arid zone. Sustain. Cities Soc. 2024, 113, 15. [Google Scholar] [CrossRef]
- Shi, T.; Wang, S.; Yang, L. The spatial-temporal change of PM2.5 concentration and its relationship with landscape pattern in East China. Remote Sens. Technol. Appl. 2024, 39, 435–446. (In Chinese) [Google Scholar] [CrossRef]
- Wu, J.; Xie, W.; Li, W.; Li, J. Effects of Urban Landscape Pattern on PM2.5 Pollution—A Beijing Case Study. PLoS ONE 2015, 10, e0142449. [Google Scholar] [CrossRef] [PubMed]
- Shi, K.F.; Li, Y.; Chen, Y.; Li, L.Y.; Huang, C. How does the urban form-PM2.5 concentration relationship change seasonally in Chinese cities? A comparative analysis between national and urban agglomeration scales. J. Clean. Prod. 2019, 239, 13. [Google Scholar] [CrossRef]
- Zhao, B.; Zheng, H.T.; Wang, S.X.; Smith, K.R.; Lu, X.; Aunan, K.; Gu, Y.; Wang, Y.; Ding, D.; Xing, J.; et al. Change in household fuels dominates the decrease in PM2.5 exposure and premature mortality in China in 2005–2015. Proc. Natl. Acad. Sci. USA 2018, 115, 12401–12406. [Google Scholar] [CrossRef]


| Index | Formula | Unit | Description |
|---|---|---|---|
| Mean Patch Area (AREA_MN) | km2 | aij is the area of patch j of class i; n is the number of impervious-surface landscape patches in the grid. | |
| Number of Patches (NP) | count | n is the total number of patches in the impervious-surface category. | |
| Aggregation Index (AI) | % | gii is the number of adjacent edges between patches of class i, and max_gii is the maximum number of adjacent edges between patches of class i under a fully aggregated configuration. | |
| Shannon’s Evenness Index (SHEI) | None | pi is the proportion of landscape class i in the total area, and m is the total number of landscape categories. |
| Control Variables | Season | Metric | 2003 | 2008 | 2013 | 2018 | 2023 |
|---|---|---|---|---|---|---|---|
| Precipitation (mm) | Winter | max | 9.20 | 4.50 | 5.60 | 8.90 | 13.80 |
| min | 4.70 | 2.70 | 3.10 | 5.30 | 8.70 | ||
| mean | 6.72 | 3.58 | 4.21 | 6.86 | 10.76 | ||
| Summer | max | 60.10 | 26.60 | 35.40 | 15.60 | 20.60 | |
| min | 33.00 | 15.50 | 22.00 | 9.20 | 11.30 | ||
| mean | 42.35 | 20.17 | 27.62 | 11.69 | 14.99 | ||
| Temperature (°C) | Winter | max | −9.40 | −13.70 | −8.80 | −13.90 | −10.00 |
| min | −15.00 | −20.70 | −15.20 | −21.20 | −16.90 | ||
| mean | −12.88 | −17.75 | −12.52 | −18.15 | −13.97 | ||
| Summer | max | 25.10 | 27.90 | 26.30 | 26.80 | 28.80 | |
| min | 20.20 | 22.70 | 21.40 | 22.00 | 23.90 | ||
| mean | 22.89 | 25.59 | 24.07 | 24.56 | 26.54 | ||
| Wind Speed (m/s) | Winter | mean | 5.72 | 5.92 | 5.48 | 5.53 | 5.37 |
| Summer | mean | 9.16 | 9.70 | 9.32 | 9.55 | 9.77 |
| Season | Year | Moran’s I | p-Value | z-Score |
|---|---|---|---|---|
| Summer | 2003 | 0.916 | 0.000 | 69.083 |
| 2008 | 0.922 | 0.000 | 69.594 | |
| 2013 | 0.924 | 0.000 | 69.710 | |
| 2018 | 0.948 | 0.000 | 71.523 | |
| 2023 | 0.910 | 0.000 | 68.640 | |
| Winter | 2003 | 0.947 | 0.000 | 71.448 |
| 2008 | 0.976 | 0.000 | 73.632 | |
| 2013 | 0.989 | 0.000 | 74.612 | |
| 2018 | 0.970 | 0.000 | 73.191 | |
| 2023 | 0.957 | 0.000 | 72.164 |
| Model | OLS | GWR | GTWR | |||
|---|---|---|---|---|---|---|
| Metric | summer | winter | summer | winter | summer | winter |
| R2 | 0.257 | 0.554 | 0.403 | 0.784 | 0.941 | 0.895 |
| Adjusted R2 | 0.256 | 0.553 | 0.385 | 0.774 | 0.940 | 0.894 |
| AIC | 101,429.2 | 118,371.1 | 99,008.2 | 108,663.7 | 62,913.4 | 93,514.7 |
| CV-RMSE | 16.06 | 14.15 | 11.68 | 6.01 | 1.72 | 3.75 |
Disclaimer/Publisher’s Note: The statements, opinions and data contained in all publications are solely those of the individual author(s) and contributor(s) and not of MDPI and/or the editor(s). MDPI and/or the editor(s) disclaim responsibility for any injury to people or property resulting from any ideas, methods, instructions or products referred to in the content. |
© 2025 by the authors. Licensee MDPI, Basel, Switzerland. This article is an open access article distributed under the terms and conditions of the Creative Commons Attribution (CC BY) license (https://creativecommons.org/licenses/by/4.0/).
Share and Cite
Zhou, X.; Xi, Y.; Wang, S.; Zhang, Y. Spatiotemporally Heterogeneous Effects of Urban Landscape Pattern on PM2.5: Seasonal Mechanisms in Urumqi, China. Land 2025, 14, 1184. https://doi.org/10.3390/land14061184
Zhou X, Xi Y, Wang S, Zhang Y. Spatiotemporally Heterogeneous Effects of Urban Landscape Pattern on PM2.5: Seasonal Mechanisms in Urumqi, China. Land. 2025; 14(6):1184. https://doi.org/10.3390/land14061184
Chicago/Turabian StyleZhou, Xingchi, Yantao Xi, Shuangqiao Wang, and Yuanfan Zhang. 2025. "Spatiotemporally Heterogeneous Effects of Urban Landscape Pattern on PM2.5: Seasonal Mechanisms in Urumqi, China" Land 14, no. 6: 1184. https://doi.org/10.3390/land14061184
APA StyleZhou, X., Xi, Y., Wang, S., & Zhang, Y. (2025). Spatiotemporally Heterogeneous Effects of Urban Landscape Pattern on PM2.5: Seasonal Mechanisms in Urumqi, China. Land, 14(6), 1184. https://doi.org/10.3390/land14061184