Article

Is Green Space More Equitable in High-Income Areas? A Case Study of Hangzhou, China

1
School of Civil Engineering and Architecture, Zhejiang Sci-Tech University, Hangzhou 310018, China
2
Zhejiang Neusense Smart Science and Technology Ltd., Hangzhou 310012, China
*
Authors to whom correspondence should be addressed.
Land 2025, 14(6), 1183; https://doi.org/10.3390/land14061183
Submission received: 1 April 2025 / Revised: 22 May 2025 / Accepted: 26 May 2025 / Published: 30 May 2025

Abstract

Urban green spaces are essential for public health and well-being, emphasizing the importance of their equitable distribution in urban development. Despite efforts to expand green spaces, however, significant disparities persist between their spatial and social allocation. This study classified urban green spaces into community parks, urban parks, and country parks, and examined the relationship of their green coverage and park accessibility to neighborhood property prices in Hangzhou. We then assessed the urban green space equity using Gini coefficients. We found that (1) urban green space inequities occurred in both green coverage and accessibility; (2) high-priced neighborhoods occupied more green resources, especially green coverage and community park accessibility, but exhibited less green equity; and (3) low-priced neighborhoods and urban villages had the lowest green resources but more equity for country parks. This study highlights the relationship between property price (as a proxy for income) and urban green space equity at the neighborhood scale. The results offer guidance for policymakers and planners aiming to promote green equity and sustainable development in cities.

1. Introduction

Urbanization has emerged as one of the most pressing global challenges to sustainable development. By 2050, 68% of the global population will reside in urban areas, with China’s urbanization rate projected to reach 71.2% [1]. While urbanization remains an essential driver of socioeconomic advancement, its uncontrolled spatial growth has exacerbated multidimensional inequalities [2], including significant socioeconomic inequities in green spaces [3,4].
Urban green spaces are the essential green infrastructure of an urban landscape, characterized by an ecosystem containing both natural and artificial vegetation [5]. These diverse vegetated areas provide multifunctional benefits encompassing physical and mental health promotion, socioeconomic enhancement, and environmental conservation [6]. In general, green spaces deprivation disproportionately burdens low-priced neighborhoods, manifesting through inadequate park provision, substandard green infrastructure quality, and heightened exposure to environmental stressors [7]. This spatial mismatch between urban green resources and socioeconomic demographics has been extensively documented [8], underscoring the need to examine the implications of green space patterns for sustainable and equitable urban governance [9]. Within this context, equity analysis has emerged as a powerful analytical framework that enables rigorous quantification of green space distribution patterns through integrating geospatial vegetation coverage with demographic characteristics. This evidence-based approach not only informs the development of equitable urban planning policies, but also establishes a monitoring strategy that benefits the realization of green space justice in rapidly urbanizing contexts.
Urban green space equity posits that individuals of diverse races, incomes, classes, or social statuses should equally enjoy the benefits of environmental improvements and be spared from environmental harms within the same spatiotemporal context. Recent studies have revealed two distinct but interrelated patterns. First, urban density and green space availability are inversely correlated, where urban cores exhibit reduced vegetation coverage, compounded by limited visibility and accessibility challenges owing to high population concentrations [10]. Second, disparities in environmental privilege manifest through disproportionate access to high-quality green environments, favoring high-income over low-income groups [11,12,13], which has been described as “green gentrification”.
Urban green space equity has three main dimensions: spatial equity, social equity, and social justice [14,15]. Spatial equity emphasizes fair spatial distribution of urban green spaces across large geographic areas, but also focuses on quantity and often overlooks the actual spatial layout of urban green spaces within a city. It is more narrowly focused on the specific issue of green space distribution and access, aiming to achieve fairness. Social equity focuses on a “spatial match” between urban green space supply and demand. Social justice refers to the fair and equitable distribution, access, and use of urban green spaces within a society, taking into account the diverse needs and rights of all individuals and groups to urban green spaces [16]. It recognizes that the unequal distribution of urban green spaces is often related to larger social and economic inequalities and that addressing these issues requires a more comprehensive approach that takes into account the interconnections between different aspects of society [17]. Social justice of urban green spaces is receiving increasing attention in urban green space equity research. Poorer areas are more limited in urban green spaces than wealthier ones [18], because resource allocation tends to favor areas with a higher socioeconomic status to ensure that green spaces can be maintained [19].
Multiple studies have identified a significantly positive correlation between proximity to green environments and property prices [20,21] even at a small scale [22]. In the Chinese city Chengdu, urban green spaces improvements elevate property value and establish ecologically privileged zones, eventually displacing the initial low-priced neighborhoods, with the emigration of poor groups [23]. However, many large western cities exhibit marked spatial inequity in daily accessible urban green spaces, exacerbating environmental injustice [24]. Specifically, higher-income groups tend to benefit from more urban green spaces, while lower-income, less-educated neighborhoods with more unemployment, as well as minority neighborhoods, tend to lack access to urban green spaces in US cities [25,26]. In addition, while increased greenery undoubtedly improves human habitats, this may drive up property value and negatively impact housing affordability [27]. Indeed, a rise in property prices and the subsequent relocation of residents exacerbate inequity in urban green spaces [22,26].
In most previous studies, we also found they usually used only one indicator to evaluate urban green space equity [28], which did not fully reflect the spatial distribution of urban green spaces, and failed to address their fairness. We also noted another two major shortcomings in the studies of the relationship between green equity and wealth. First, research on urban green space equity tends to focus on a single dimension, with few studies simultaneously considering all three dimensions of equity [29,30]. Chen et al. quantified the relationship between green space accessibility and property prices in Cook County, Illinois. They found that private green spaces have the most significant impact on property prices. However, their research did not consider social justice [29]. Second, less independent comparison was available on urban green space equity across neighborhoods with different income levels. Alexis et al. analyzed urban green space accessibility for different ethnic and religious groups in Leicester. While the study considers these groups and their communities, it did so without varying income levels [31].
The transformation of modern China’s economic structure has significantly altered income patterns, evolving from a largely egalitarian society to one characterized by a widening income gap. This increase in social inequality is reflected in residential patterns, with some research showing that differences in land tenure and socio-economic status are the primary drivers of residential segregation in Chinese cities [32]. Current evidence suggests that high-income groups are more likely to reside in neighborhoods with private services and are less dependent on public amenities. In contrast, socially disadvantaged groups such as rural migrants and low-income citizens tend to be concentrated in the rental housing market, which is largely situated in older neighborhoods and dilapidated zones of urban centers [33]. As a result, urban green spaces are becoming more and more inequitable, in line with the urbanizing areas.
To address these gaps, we conducted a comprehensive analysis of the spatial and social equity of urban green spaces in Hangzhou, China. We collected multi-source datasets with landscape use, property prices, and other socioeconomic information, then independently calculated green coverage and park accessibility of neighborhoods. We assessed the spatial equity, social equity, and social justice using spatial analysis and Gini coefficients to explore the equity of green spaces and wealth in this city. Finally, we provided some suggestions for urban planners and policymakers regarding urban green space equity based on the key findings.

2. Materials and Methods
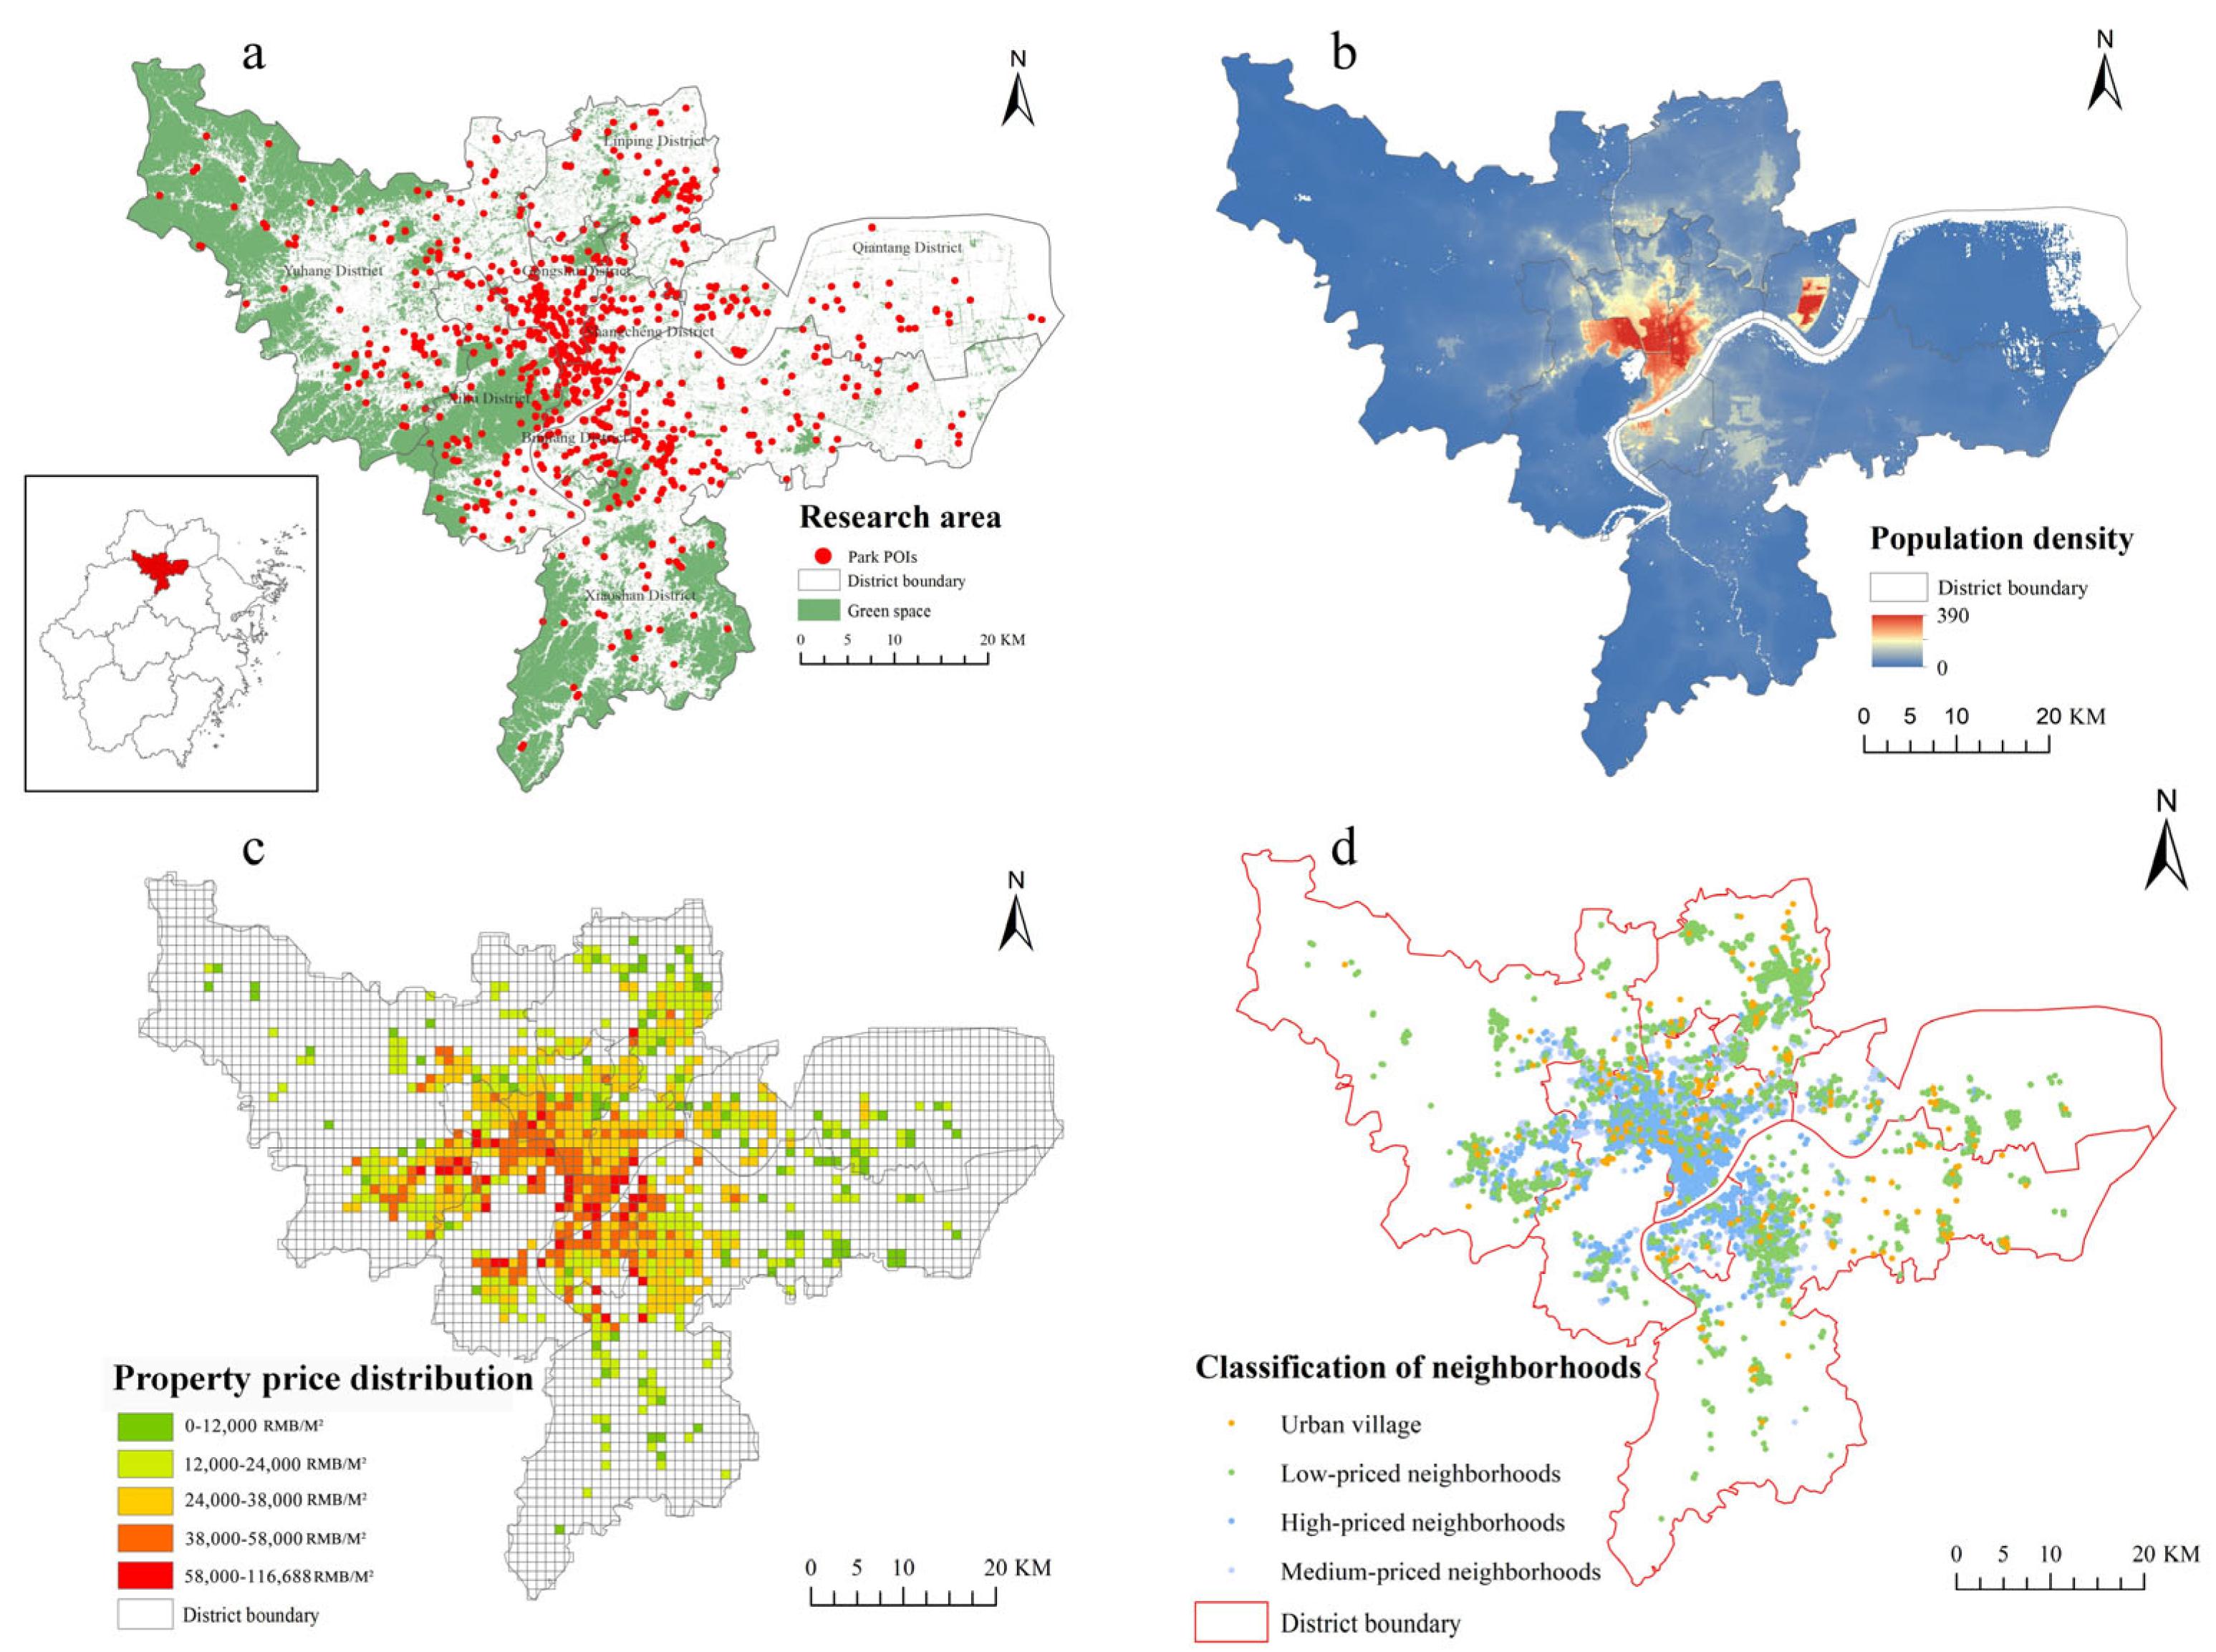
This study explores urban green space equity involving green coverage and park accessibility across different neighborhood types in Hangzhou. Raw data were collected from multiple sources, including land use data, park information, property prices of neighborhoods, population, and road networks. Urban green space equity, measured via the Gini coefficients, was applied to evaluate the urban green space equity.

2.1. Study Area

Hangzhou (29°11′–30°34′ N, 118°20′–120°37′ E) is the capital city of Zhejiang Province, China, located in the core area of the Yangtze River Delta, one of the nation’s most developed regions. China’s economic reforms have rapidly advanced Hangzhou’s economy, with its gross domestic product (GDP) per capita reaching 161,129 RMB in 2023 [34]. The local government of Hangzhou has actively pursued the development of a “park city” and achieved significant progress. Key milestones include the creation of an eco-forest city, hosting the G20 Summit, and the 2023 Asian Games. Large-scale tree planting along city streets has further enhanced urban green space accessibility and use. Currently, Hangzhou’s regional green space covers approximately 236.2 square kilometers, accounting for around 560 urban parks.
The study area (3351.06 km2) was primarily concentrated in Hangzhou’s urban center, spanning eight administrative districts: Binjiang, Shangcheng, Gongshu, Xihu, Xiaoshan, Yuhang, Linping, and Qiantang. The resident population was approximately 9.17 million in 2023. Property prices generally exhibited a radial distribution centered around West Lake, with prices gradually decreasing outward in all directions. The average property price was RMB 32,285 per m2, ranging from RMB 5225 to RMB 151,733 per m2, with a median of RMB 30,043 per m2. The West Lake Cultural Plaza, Qingchun Street, and Changhe Street have the highest property prices, ranging from RMB 54,000 to RMB 116,680 per m2 (Figure 1).

2.2. Data Collection

2.2.1. Green Space Data

Land use data (10 m resolution) for 2021 were obtained from the European Space Agency’s global land use type dataset (https://viewer.esa-worldcover.org/worldcover/ (accessed on 24 July 2024)). Four categories of satellite images from Sentinel-2 (woodland, shrub, grassland, and wetland) were used to calculate green coverage.
Area of Interest data for parks in Hangzhou and Points of Interest data for park entrances in 2024 were obtained via the Baidu and Gaode online map Application Programming Interfaces, respectively. The final analysis included 786 parks after excluding abandoned or closed parks [35]. Based on service scope and accessibility, parks were classified into three types: community, urban, and country (Table 1). Here, the country park was a large area designated for people to visit and enjoy recreation in a countryside environment. Selected urban green spaces were then used to calculate park accessibility across different neighborhood types.

2.2.2. Property Price

As resident income was difficult to obtain, this study used property prices as a proxy indicator for household income. Neighborhood names, number of households, locations, and property prices in Hangzhou’s main urban area were obtained from Anjuke (https://hangzhou.anjuke.com/ (accessed on24 July 2024)), an online real estate agency platform. The final dataset included property prices for 5998 neighborhoods after removing erroneous entries. To classify neighborhoods based on property prices, they were divided into three groups using trisection. Neighborhood groups were high-priced, medium-priced, or low-priced if property unit prices were >38,000 yuan/m2, 24,000–38,000 yuan/m2, or <24,000 yuan/m2, respectively. Additionally, 216 special urban villages were identified. Urban villages are a unique phenomenon in China’s urbanization development. These informal settlements were the initial villages that became surrounded by urban built-up areas. They are often distinguished by higher building density, less open space, insufficient public infrastructure, affordable rent, and a resident population primarily comprising low-income individuals, such as students in universities and migrant laborers (Table 2).

2.2.3. Urban Population

The total population of Hangzhou was derived from the 2020 WorldPop dataset (https://www.worldpop.org/ (accessed on 11 March 2024)). Population count within individual neighborhoods was calculated based on the data from the online platform of real estate agents Anjuke (accessed on 14 July 2024, https://hangzhou.anjuke.com/) using the following equation:
P i = N i N   ×   P
where Pi represents number of people in the ith neighborhood, Ni represents the number of households in the ith neighborhood, N represents the total number of households in all neighborhoods, and P represents the total population of the urban area.

2.2.4. Urban Road Network

Road network data were obtained from the Open Street Map (https://www.openstreetmap.org/ (accessed on 20 August 2024)) and used to calculate the level of urban green space accessibility per neighborhood after topology checks and road network correction.

2.3. Data Analysis

The core concept of urban green space equity is that all urban residents should have equal access to the green ecosystem services [36]. Here, green ecosystem services are derived from the concept of ecosystem services, which are characterized as the contributions or advantages that humans derive from green spaces [37]. Hence, green coverage and park accessibility were used to assess spatial and social equity, respectively. Social justice was evaluated using the Gini coefficient.

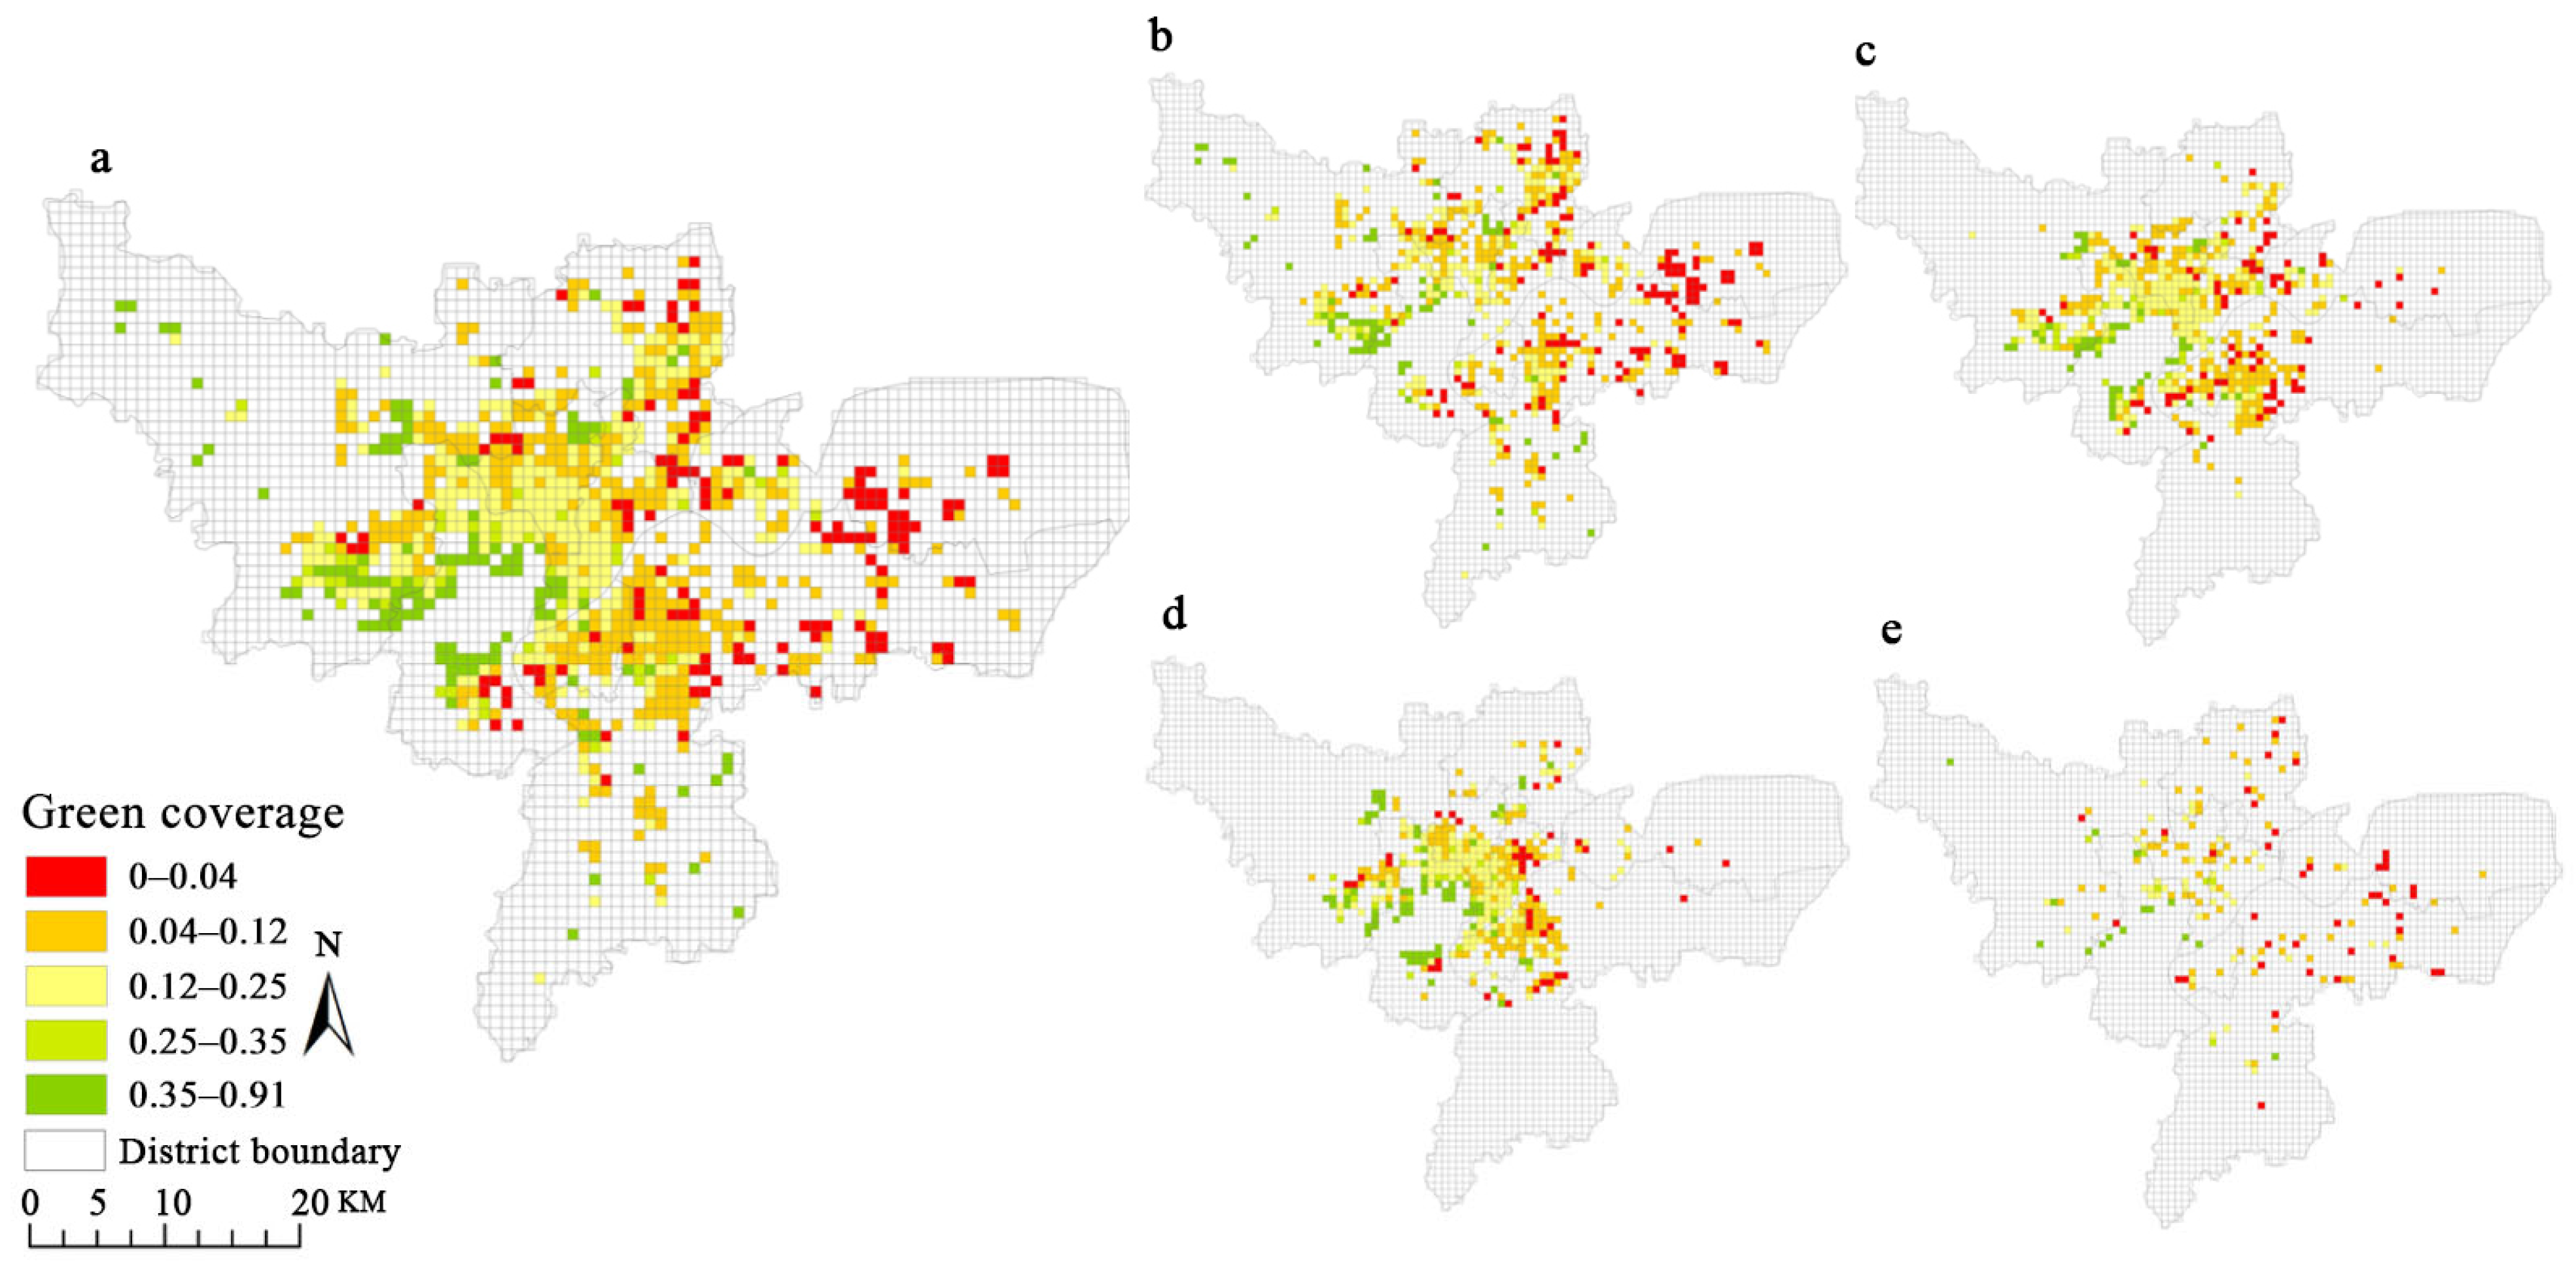
2.3.1. Green Coverage

Green coverage is an indicator of green space development in a region without considering population distribution. It is defined as the coverage of vegetation, such as the tree canopy of woodlands, understory coverage of shrublands and the vegetated area of grassland and wetland. It represents a comprehensive and multifaceted green space that can be used in the analysis of green resources across multiple scales. The default assumption is an even distribution of coverage [38]. Based on the urban green space planning standards [35], this study created a 500 m radial buffer zone from the neighborhood center to calculate green coverage, using the following formula:
G r e e n   c o v e r a g e = S i S
where Si represents the green space area of the ith neighborhood within the 500 m buffer zone and S represents the area of the buffer zone. In the study, one-way analysis of variance (ANOVA), alongside Fisher’s least significant difference (LSD) post hoc tests, was applied to compare the levels of green coverage across distinct neighborhoods.

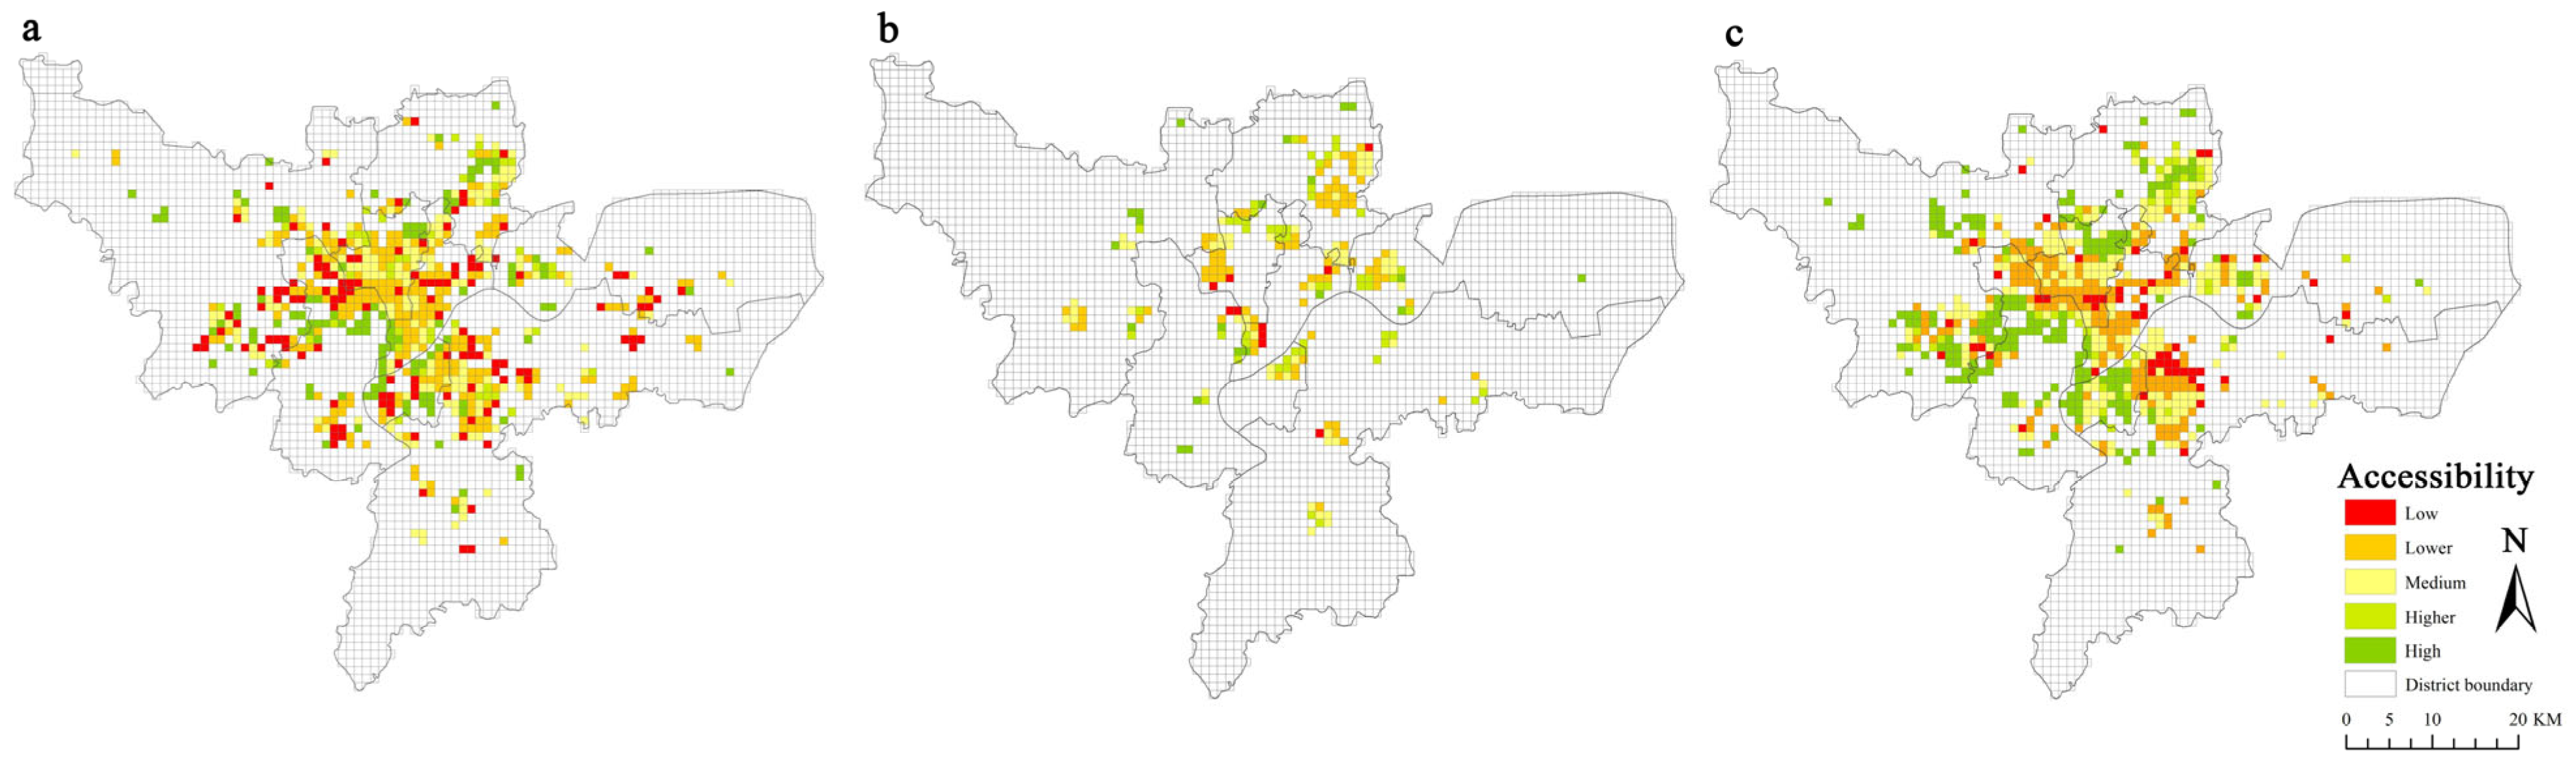
2.3.2. Park Accessibility

Park accessibility was calculated using the Gaussian two-step moving search method (G2SFCA) [39]. Based on supply points of green spaces and demand points of residences, G2SFCA performs two rounds of searches within a defined threshold and compares available resources under that threshold. A higher value indicates greater accessibility.
Additionally, urban residents have distinct expectations for time spent traveling to different types of parks. Hence, time thresholds for walking to parks were set based on park types, as outlined in Urban Residential Design Planning [34], and used to determine accessibility. Thresholds were 15 min for community parks, 30 min for urban parks, and 60 min for country parks. In the study, one-way analysis of variance (ANOVA) with Fisher’s least significant difference (LSD) post hoc tests was employed to assess the accessibility levels of community parks, urban parks, and country parks across distinct residential zones.

2.3.3. Equity Measurement

Originally developed in economics, the Gini coefficient measures the balance in resource and wealth disparity within populations [40]. The Gini coefficient ranges from 0 to 1, with values closer to 0 indicating a more equal resource distribution. According to international standards from the United Nations [41], the Gini coefficient ranges are categorized as follows: <0.2, absolute income equality; 0.2–0.3, relatively equal; 0.3–0.4, relatively reasonable; 0.4–0.5, significant disparity; and >0.5, extreme disparity. This study used the Gini coefficient to evaluate urban green space equity involving green coverage and park accessibility across neighborhoods in Hangzhou’s main urban area. The Gini coefficient was calculated as follows:
Gini = 1 i = 1 n P i P G i 1 + G i
where Gini represents the Gini coefficient, P is the total population in the study area, Pi is the total population in a neighborhood, and Gi is the cumulative green space area within 500 m of the neighborhood.

3. Results

3.1. Spatial Patterns of Green Coverage and Accessibility

In the main urban area, urban green spaces and green coverage decreased in all directions from the western to the northern and eastern parts (Figure 2). Elevated green coverage was concentrated in the wealthy central-southwestern part of the city. In contrast, green coverage was more scattered in low-priced neighborhoods and urban villages, with low coverage predominating (Figure 2d,e). The distribution of green coverage showed different spatial patterns across neighborhoods with different property prices.
Using time thresholds for walking to parks as a measure of accessibility, we found significant variation across park types (Figure 3a–c). High accessibility to community parks was primarily clustered around the edges of the West Lake Scenic Area, exhibiting a pattern of low accessibility at the center and higher accessibility at the periphery. Urban parks are scattered throughout various neighborhoods. The West Lake District also exhibited the highest accessibility to country parks, with accessibility again increasing from the central area outward. Overall, park and green accessibility in the main urban area of Hangzhou exhibited strong spatial heterogeneity.

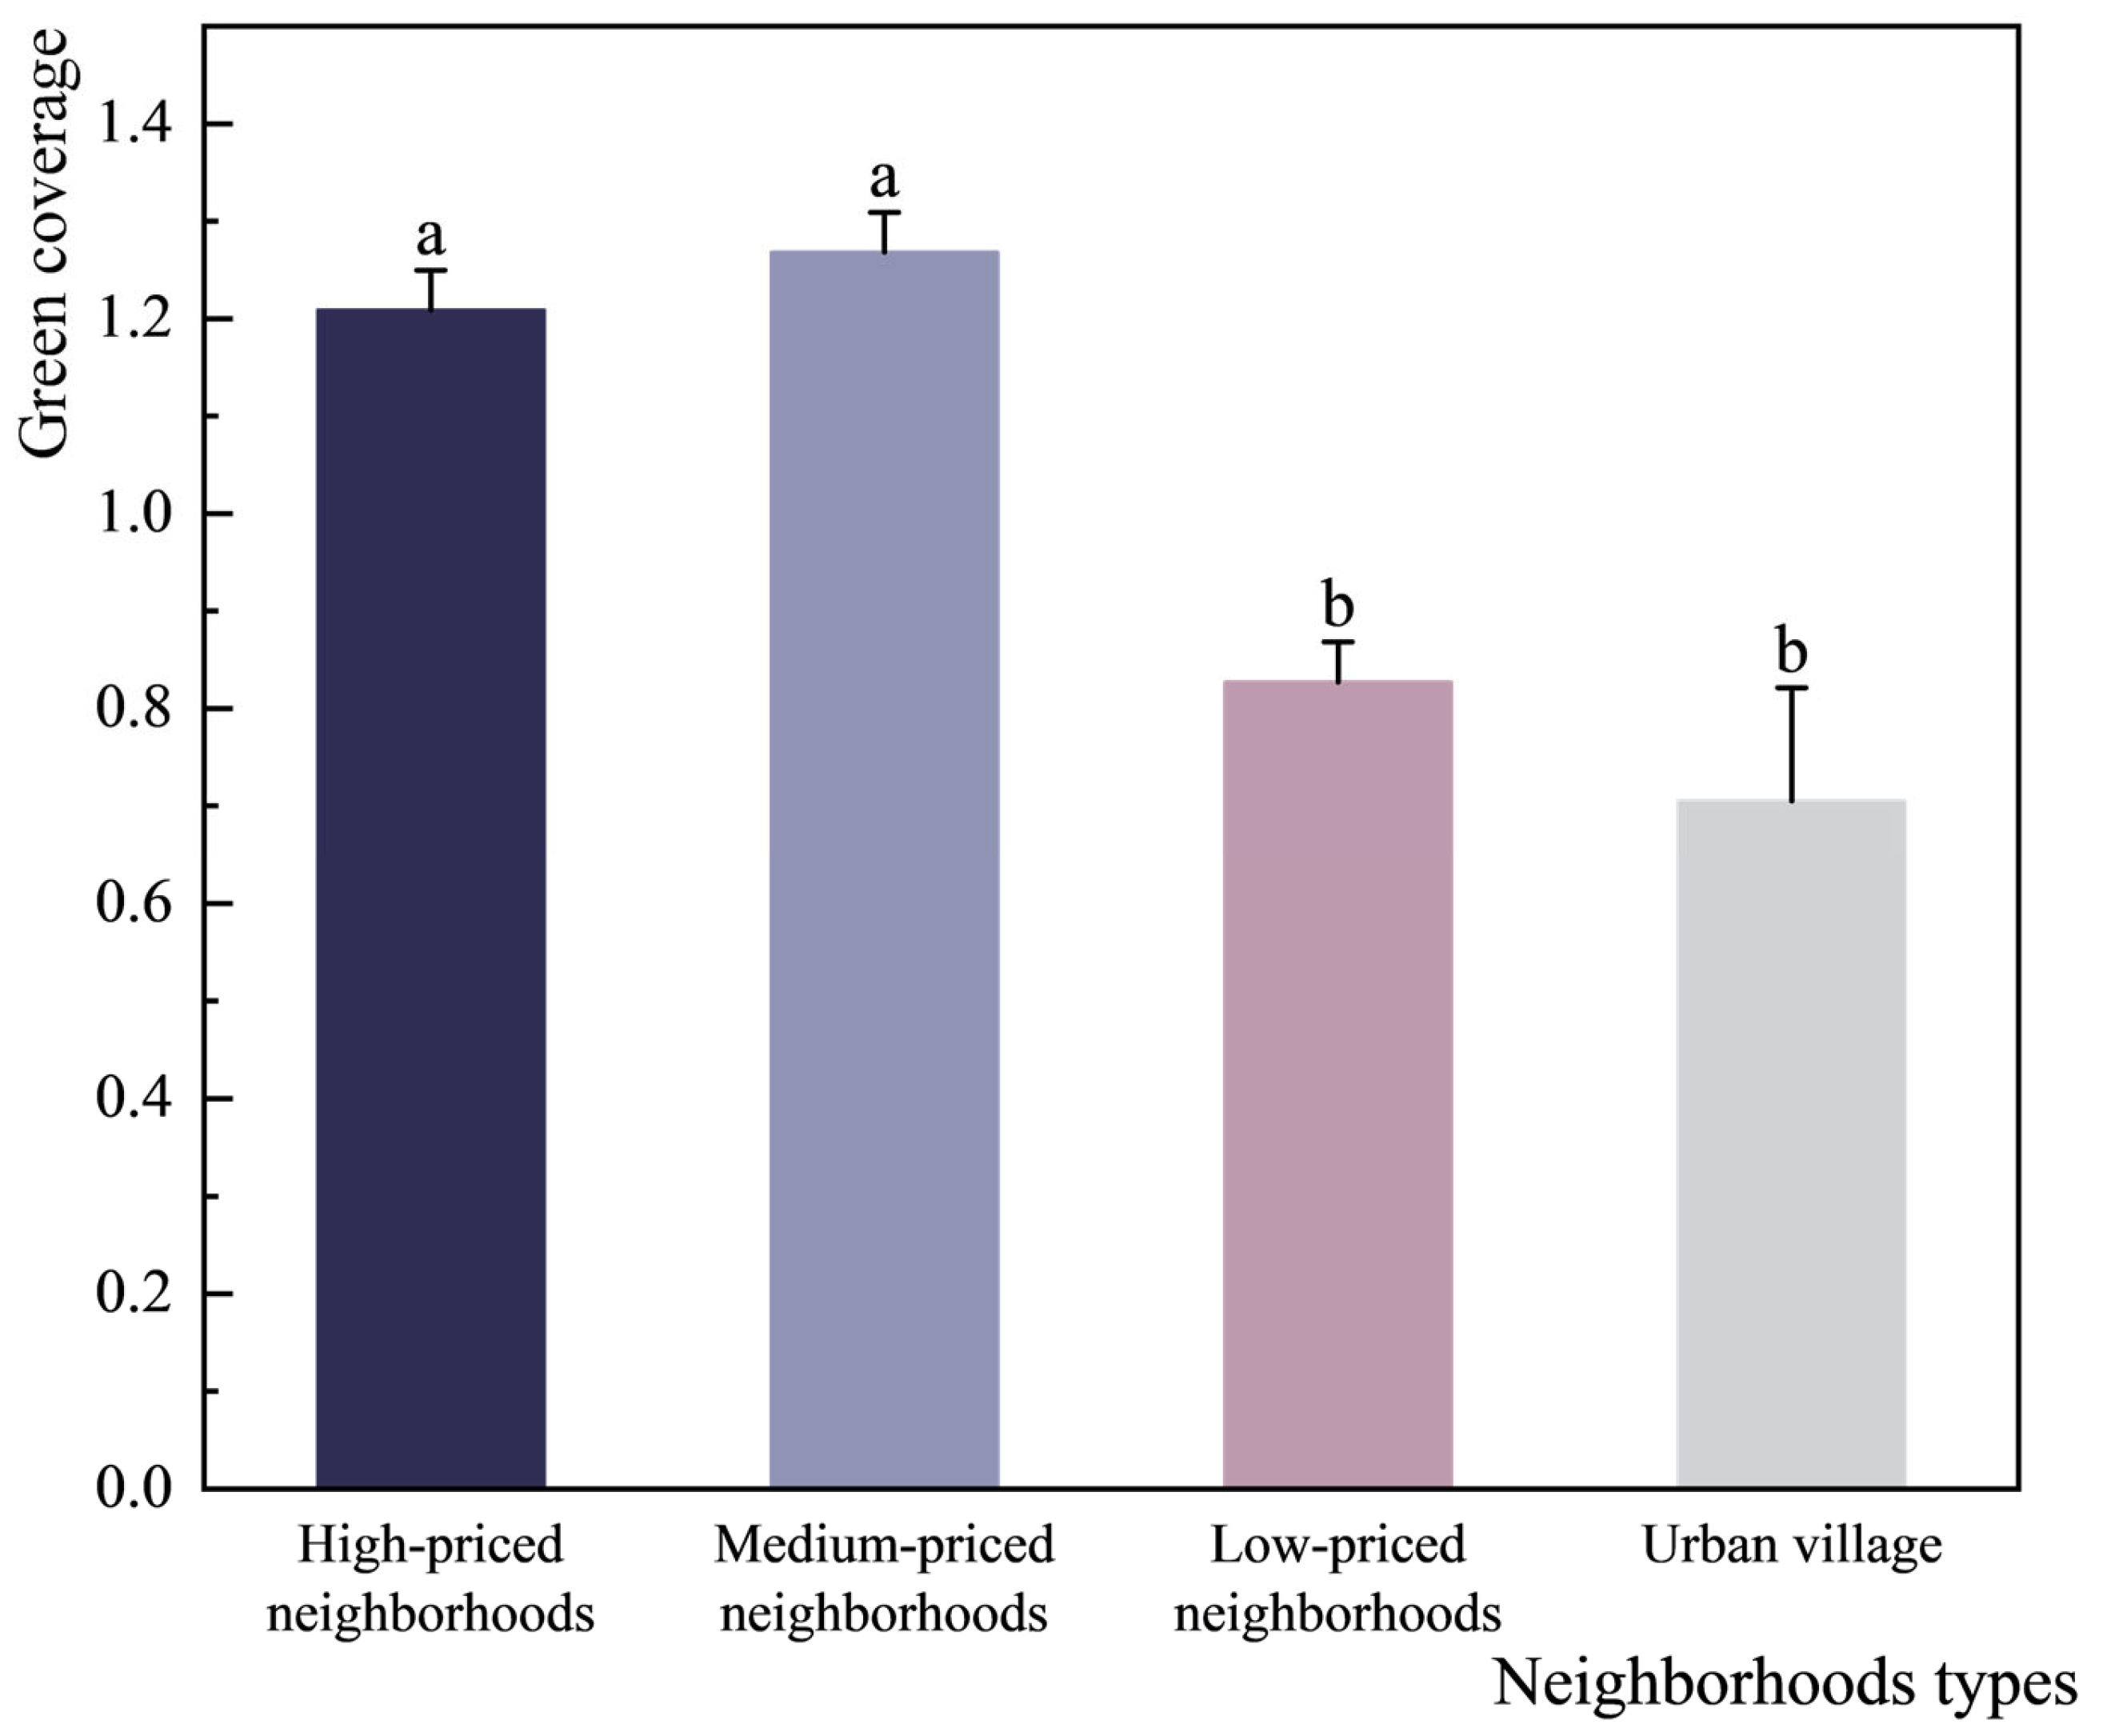
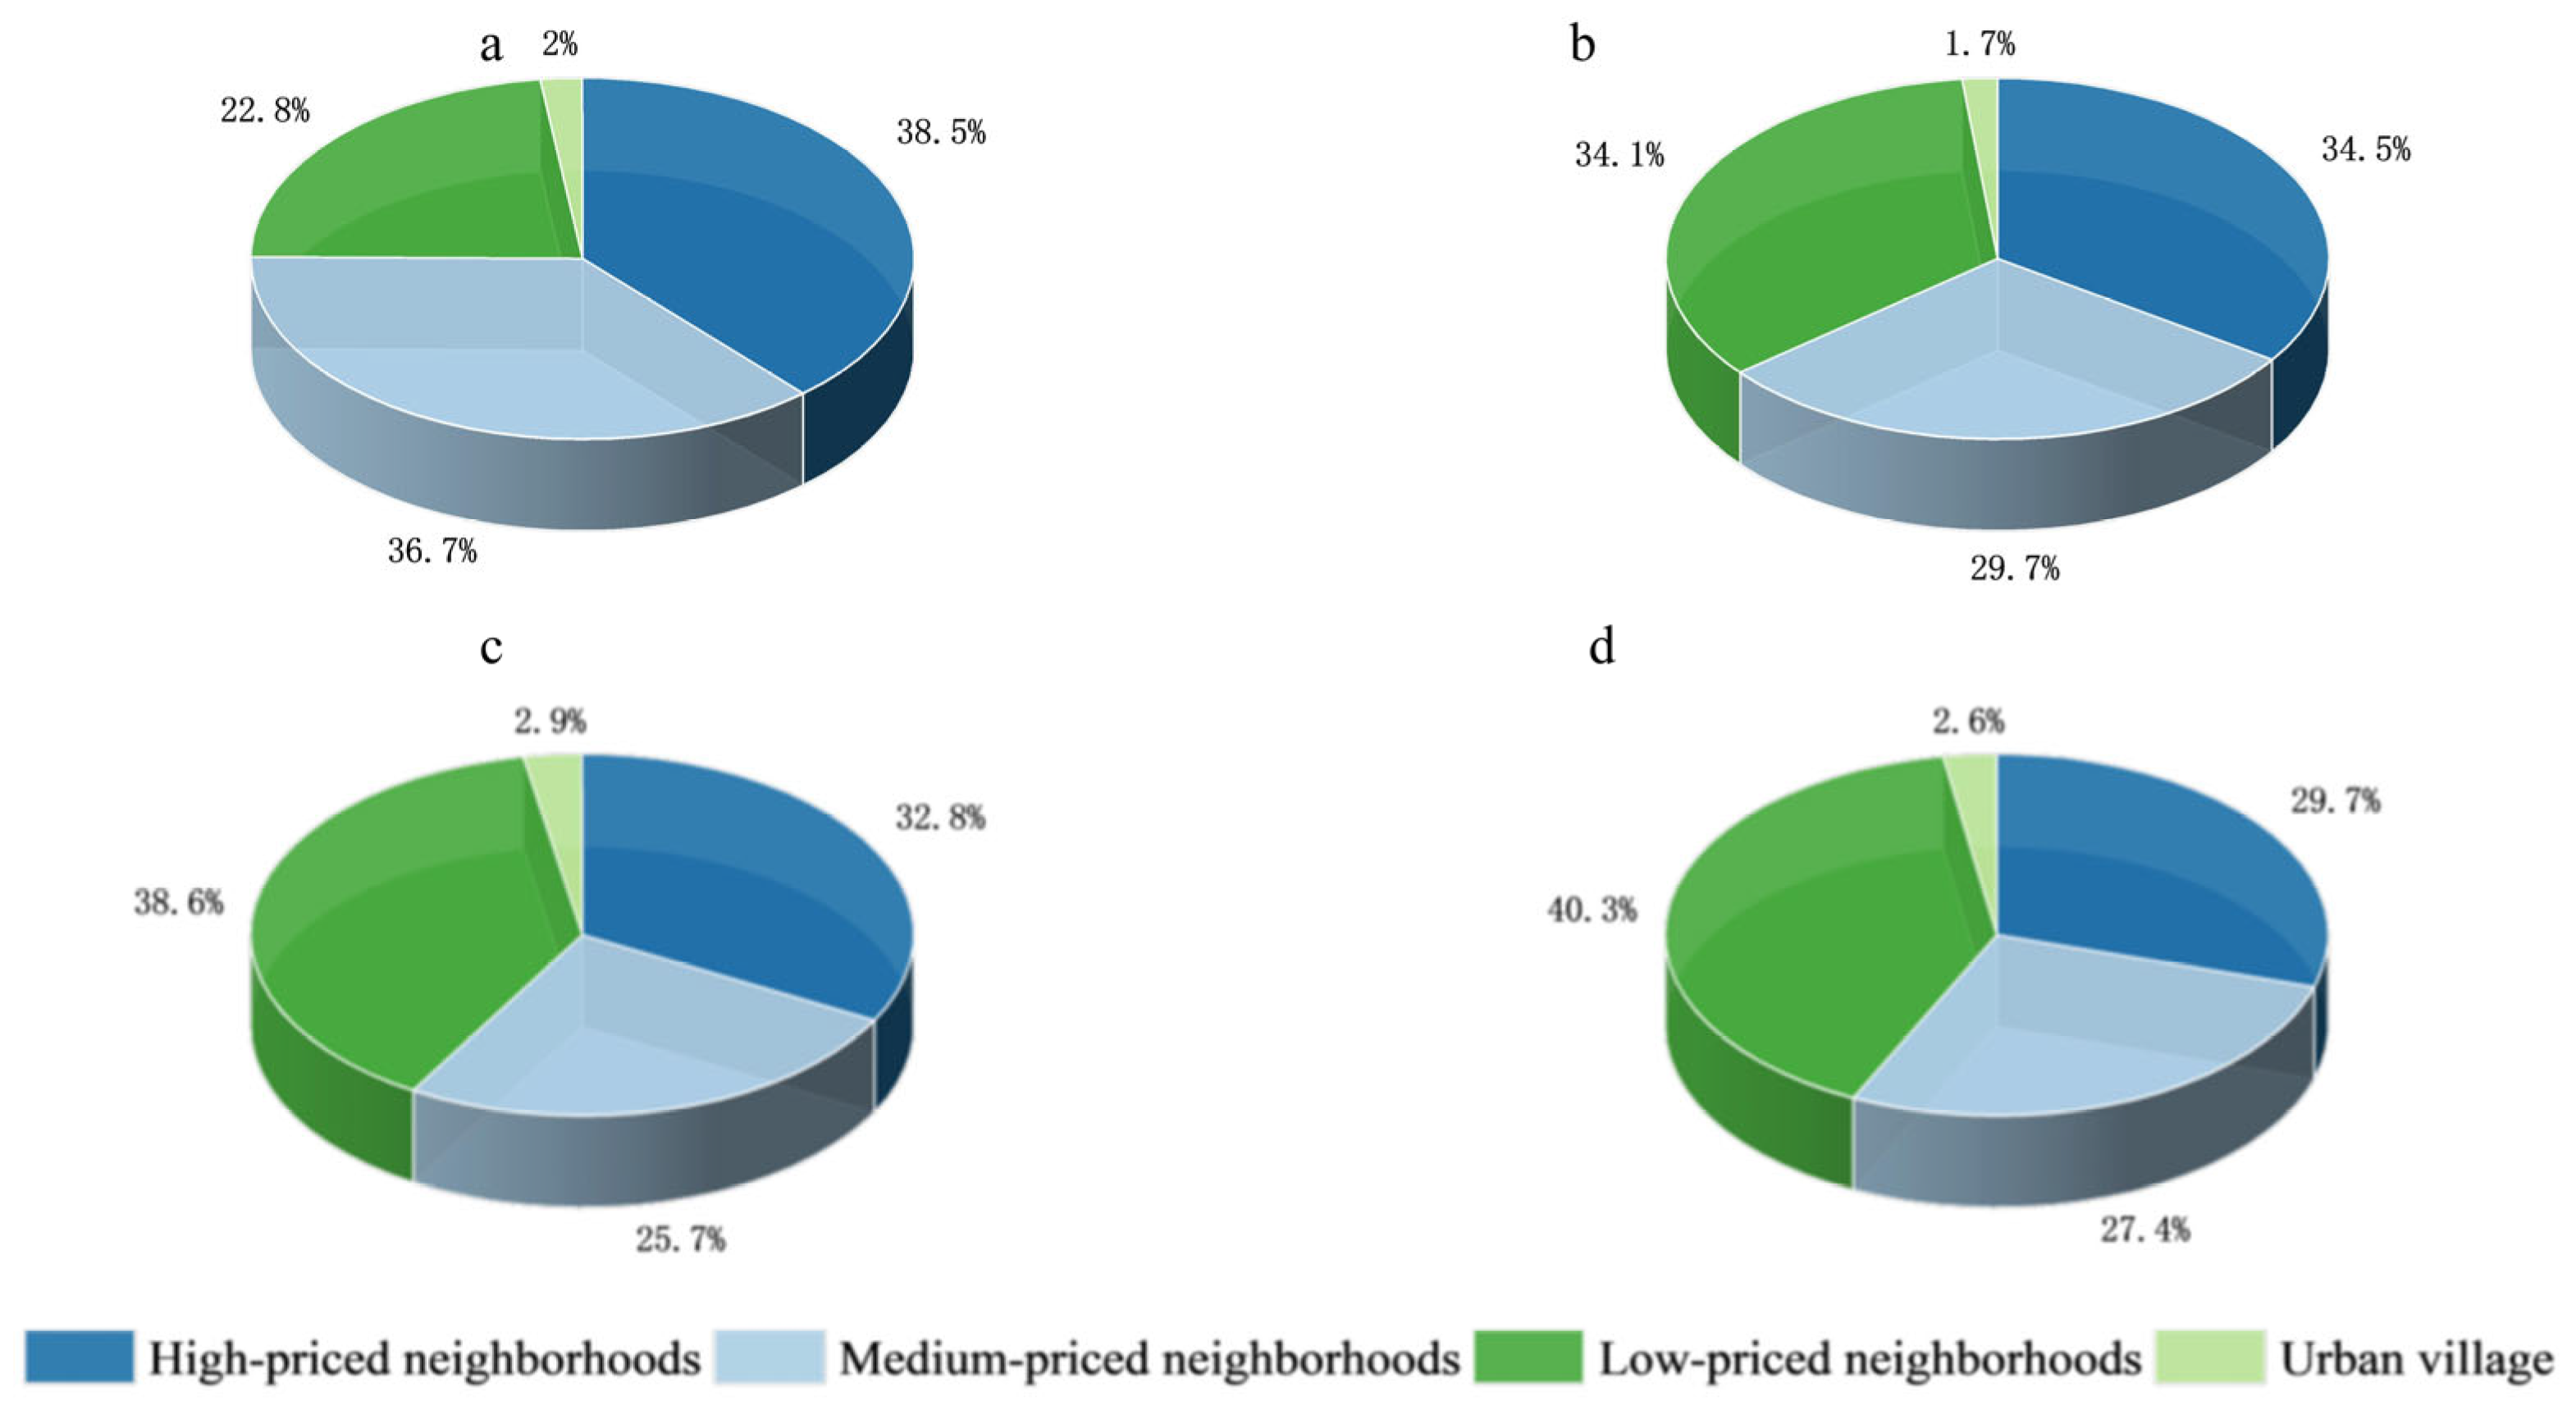
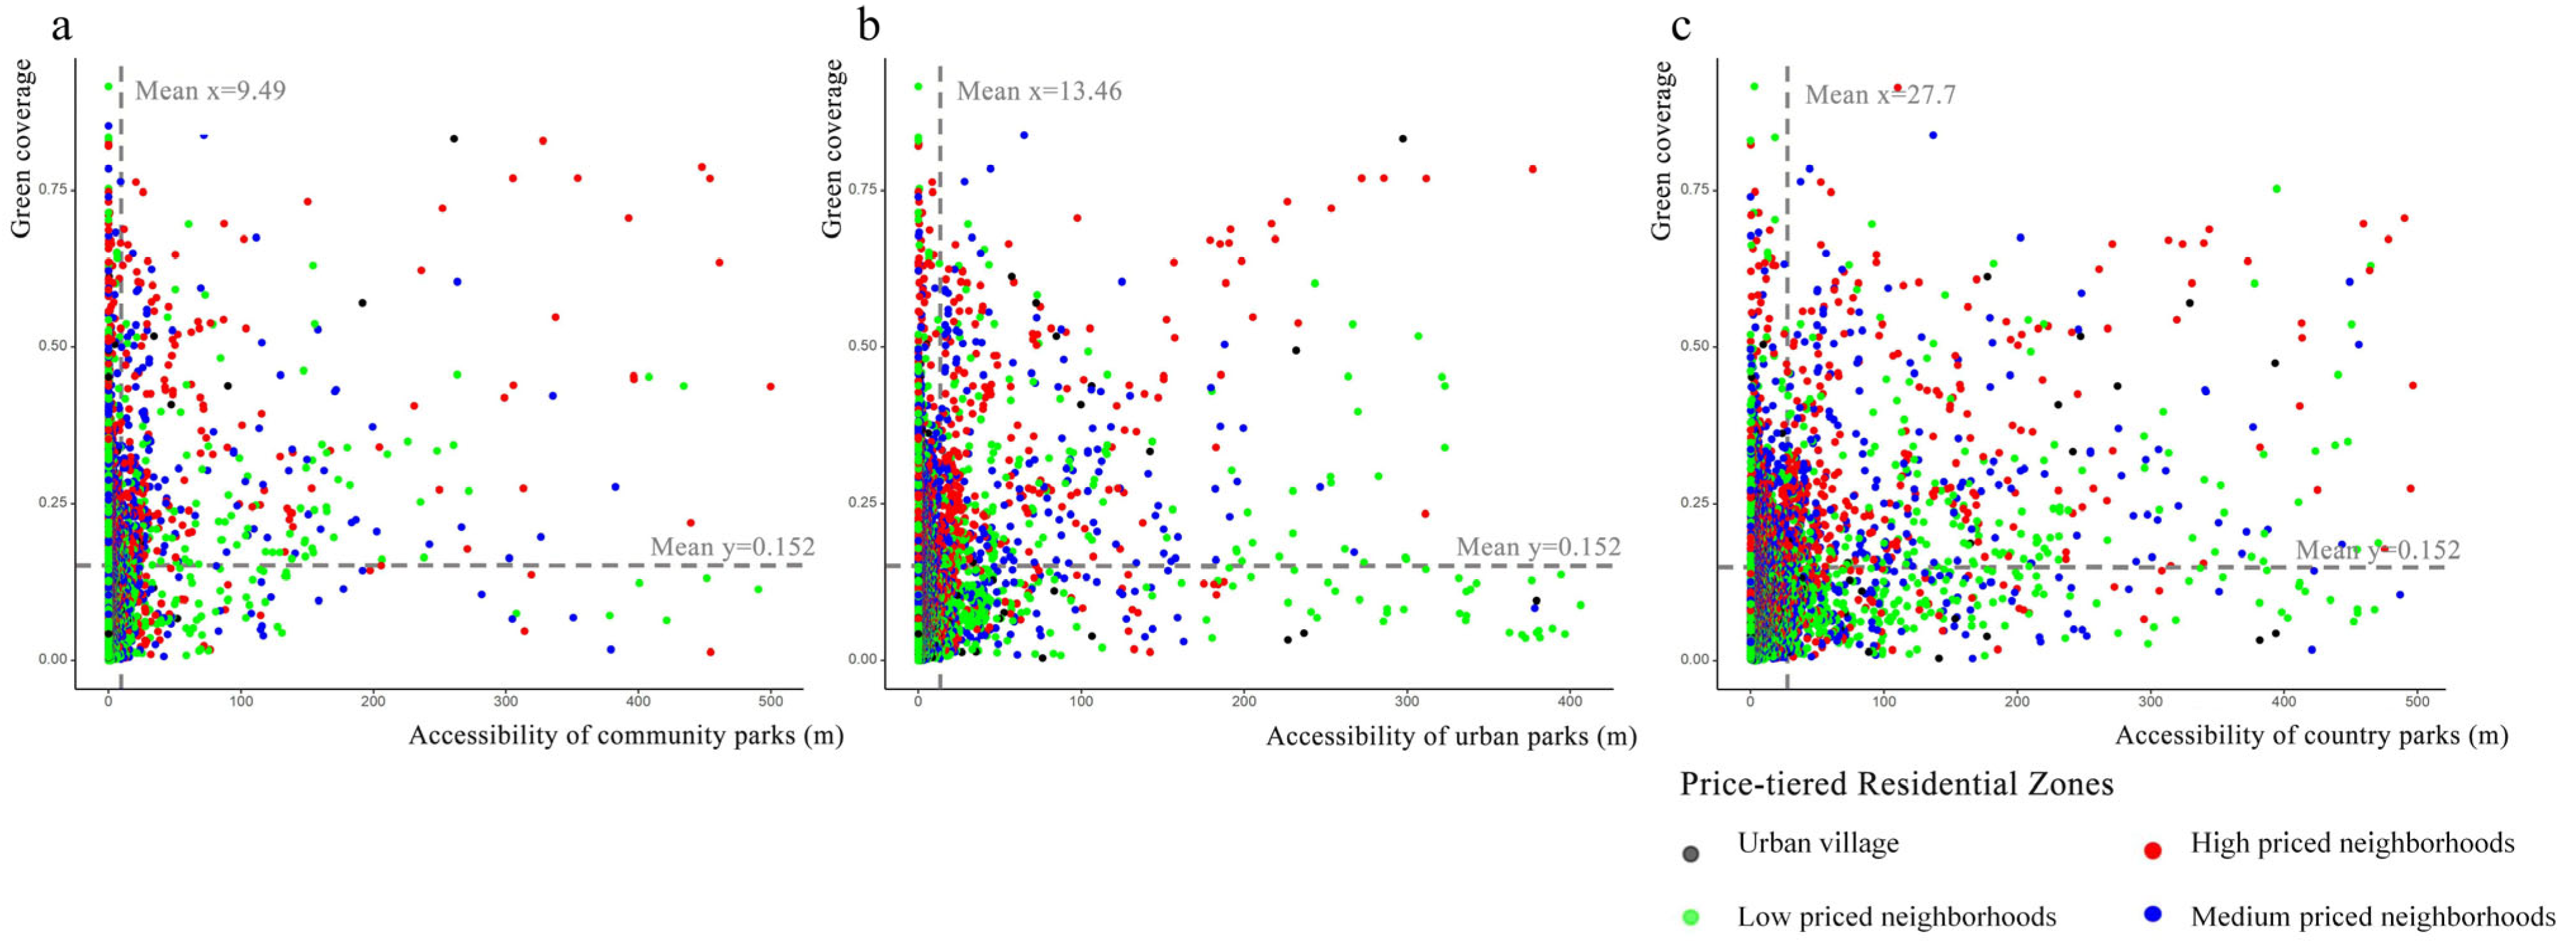
3.2. Relationship Among Property Prices, Green Coverage, and Park Accessibility

Further investigation of the variation of urban green spaces in neighborhoods with different property prices found that high green coverage was most prevalent in high-priced neighborhoods (Figure 4), followed by medium- and low-priced neighborhoods, with urban villages at the bottom. High-priced neighborhoods occupied the largest green space area, followed by medium-priced neighborhoods. In contrast, low-priced neighborhoods and urban villages had access to a relatively small amount of green space.
The one-way ANOVA test revealed significant disparities (Table 3) across different neighborhoods (high-, medium-, and low-priced, and urban villages). Further, LSD post-hoc tests revealed that high- and medium-priced neighborhoods differ significantly from their low-priced counterparts and urban villages (all p < 0.001).
Three distinct one-way ANOVA models revealed significant variations in park accessibility across neighborhood types. LSD post-hoc tests showed medium-priced neighborhoods had the lowest community park accessibility, while no statistical difference emerged between high-priced neighborhoods, low-priced neighborhoods, and urban villages (Figure 5). The ANOVA test for urban park accessibility demonstrated more pronounced stratification (Table 3). Subsequent LSD tests revealed that high-priced areas significantly outperformed both medium- (p = 0.025) and low-priced neighborhoods (p < 0.001). The reversed trends were found in the tests for country park accessibility (F = 8.64, p < 0.001), with the extreme disadvantage of high- and medium-priced neighborhoods over both low-priced neighborhoods and urban villages. Compared across the four ANOVA models, the explanatory power of neighborhood types (R2) for park accessibility was lower than that for green coverage (Table 3).
Furthermore, we focus on the neighborhoods with high-quality urban green space resources, whose values of green coverage and park accessibility were higher than the average level. High-priced neighborhoods occupied the largest ratios of high-quality green coverage and community park accessibility (Figure 6a,b). Low-priced neighborhoods occupied the largest ratios of high-quality urban and country park accessibility (Figure 6c,d). Urban villages had the least high-quality urban green space resources.

3.3. Relationship Between Property Prices and Urban Green Space Equity

Equities of green coverage and park accessibility were also highly inequitable in Hangzhou, as were their absolute values. Contrary to our expectations, urban green space equity showed different relationships with property price, compared with absolute values of green coverage and park accessibility. High-priced neighborhoods had the highest Gini coefficients, indicating unequitable accessibility for green coverage and accessibility of community and urban parks (Table 4). Urban villages had highest coefficient for the country park accessibility.
High-priced neighborhoods generally had the highest Gini coefficients, indicating that their green space distribution was the most inequitable. In contrast, low-priced neighborhoods and urban village residents had lower Gini coefficients and a more equitable distribution, except for country park accessibility. Thus, we observed an inconsistency between green coverage and park accessibility (Figure 7). Notably, most neighborhoods lacked the necessary urban green space resources. To summarize, green coverage was greater in high-priced neighborhoods (Figure 7), while park accessibility was worse but more equivalent to poorer neighborhoods, except for community and urban parks (Figure 7a,b). Urban villages had the least green coverage and park accessibility, resulting in even more pronounced inequities and larger gaps in urban green space resources between different social groups.

4. Discussion

4.1. Differences in Equity Between Green Coverage and Park Accessibility

In our study area, green coverage and park accessibility both gradually decreased with increasing distance from the city center. Both spatial and social equity in green coverage and park accessibility exhibited significant disparities across neighborhood types. Low-priced neighborhoods and urban villages faced the worst park accessibility. High-priced neighborhoods tended to have lower building densities with abundant greenery and good amenities. By contrast, low-priced neighborhoods and urban villages were characterized by higher building densities and a lack of greenery, aligning with previous findings in Seoul, where high-priced flats offered better greenery and visual appeal [42,43]. At the same time, it was found that resident wealth (as indicated by property prices) was more strongly correlated with green space than with park accessibility (Figure 4 and Figure 6a). This finding is consistent with a study in Shenzhen, where the limited purchasing power of residents in low-priced neighborhoods resulted in prioritization of property prices and less attention to additional services, such as green spaces. By contrast, residents of high-priced neighborhoods were more focused on the aesthetic and ecosystem service value of green spaces around their homes than on public park accessibility and usability [44,45]. Furthermore, in the city center, community green coverage rose with increasing income. In addition, large scenic areas in Hangzhou, such as the West Lake Scenic Area and Xixi National Wetland Park, are located in the city center area, contributing to high green coverage there. The results of ANOVA also indicated that wealth had a stronger effect on GC than on park accessibility, consequently revealing that residents were more concerned with the amount of surrounding urban green spaces than with visiting them.

4.2. Variation in Green Space Equity Across Different Park Types

The city government generated a Hangzhou Urban Master Plan (2001–2020) (Revised 2016), which sets a target greening rate of 43% for urban construction in the city center by 2038. Currently, large green spaces are mainly located on the urban fringe, resulting in low accessibility in the center and higher accessibility in the surrounding areas.
Accessibility varied across park types. Community parks are not widely distributed and thus have a small accessibility range. In contrast, the accessibility range of urban and national parks has progressively expanded. Community parks are typically small and located within or around individual neighborhoods, serving a small number of residents. Urban parks are slightly larger and are distributed across the city, serving a wider range of residents. Country parks are the largest and located on the city’s outskirts, attracting both city residents and visitors from surrounding areas. This pattern is supported by previous research on large parks dispersed around Shenyang and Beijing [46,47]. Two main factors explain the dispersion patterns of urban and country parks, along with the observation of high center accessibility and low accessibility in the surrounding areas. First, the central areas of a city have the highest population density, and second, the urban periphery offers more space for the development of large-scale integrated green spaces [48]. In this study, the neighborhoods with high-quality urban green space resources, such as green coverage and community park accessibility, were dominated by rich groups, while poor groups occupied urban and country parks (Figure 6). This finding was partly supported by Wang’s study in Beijing, which found that high-priced neighborhoods enjoy higher park accessibility than low-priced ones. This suggests that the local government was improving the social equity of urban green space resource through the rational planning of large and medium parks.

4.3. Urban Green Space Equity Is Not Equal to Sufficient Supply

We found that high-priced and low-priced neighborhoods were the most inequitable in terms of green coverage and park accessibility, whereas medium-priced neighborhoods and urban villages were more equitable (Table 1 and Table 3; Figure 6). However, the absolute amount of green coverage and accessibility values were still largest in high-priced neighborhoods. Low-priced neighborhoods and urban villages had fewer green spaces, and a higher proportion of neighborhoods did not enjoy park services (Figure 6). These outcomes suggest that while the Gini coefficient measures relative equality in the distribution of green resources, it cannot provide a comprehensive picture of green resource supply. Inequity may exist even when resources are abundant, or equity may be achieved despite a lack of resources. The inequity observed in high-priced neighborhoods reflects an uneven distribution of green spaces. Developers of high-priced neighborhoods are more inclined to build green parks to increase property values [49], but significant differences exist in the quality of green space facilities and supporting parks, reflecting the wide price range within such neighborhoods [50]. This phenomenon is consistent with studies conducted in the US and European countries [51,52].
Equity must consider the spatial and social dimensions together, as well as the potential impact of urban disparities on the environment. Our findings demonstrate the insufficiency of assessing the relative urban green space equity in a city solely using common equity measurements such as the Gini coefficient. The absolute supply of urban green space resources must also be considered simultaneously [53]. In our study, high-priced neighborhoods had three to four times the amount of green space as low-priced neighborhoods, and their overall park accessibility was better than that in low-priced neighborhoods and urban villages. However, the Gini coefficient was higher in these rich areas. Therefore, the total amount of green space in a neighborhood does not necessarily indicate an improvement in spatial inequalities.
Our findings further enhance the understanding of the relationship between spatial equity, social equity, and green justice. We draw similar conclusions as previous assessments of green justice across other Chinese cities [41]. Successful promotion of green equity involves ensuring equitable park accessibility and increasing the total area of green space in a way that focuses on neighborhoods with insufficient green coverage. Social equity can be enhanced by improving spatial equity in disadvantaged areas [14].

4.4. Policy Implications

We propose the following improvement initiatives in response to inequitable green space distribution:
(1)
Insert greenery into available spatial gaps in the urban region. To address the mismatch between total GC and park accessibility, additional greening facilities should be installed in low-green coverage neighborhoods. Local special urban green space planning, integrated with urban renewal strategy, should focus on building pocket or community parks around old residential areas. It also aims to create a green web system by developing linear parks that combine waterways and road greenery. Small and decentralized urban green spaces are encouraged in the vulnerable-group aggregation areas, while large and centralized parks should be located in suburban districts, allowing more people to enjoy both the visual and tactile benefits of urban green spaces.
(2)
Increase three-dimensional greening. We suggest enhancing supervision and guidance of different ancillary green spaces and advancing the three-dimensional greening. Low-priced neighborhoods and urban villages generally have limited access to the benefits of park services. These areas often have high building densities; therefore, measures that account for urban structures should be considered, including wall greening and rooftop gardens. Such measures can increase greening within and around neighborhoods and enhance the ecological services of green infrastructure. Inaccessible pocket parks can also be opened up with more entrances, while fragmented vegetated areas can be connected to increase the total amount of accessible green space. In regions with low park accessibility, road network services should be upgraded in addition to building new parks and improving low-quality urban green spaces.
(3)
Enhance the efficiency of park utilization. High-priced neighborhoods typically have abundant urban green space resources, but utilization efficiency varies widely. For neighborhoods with high GC but low accessibility, creating more entrances and providing parts of the interior green space to share with the surrounding community will increase the utilization of green resources. Community parks are most frequently visited by residents. Therefore, adjusting existing urban green space planning to build more small-scale greening facilities (e.g., greenways or pocket parks) can further improve accessibility and enhance the quality of urban settlements.

4.5. Limitations

This study has several limitations:
(1)
The calculation of park accessibility using G2SFCA simulated access time based on the network analysis module. However, this method did not consider differences in traffic conditions between the city center and the outskirts, or other factors that affect actual access costs. In the future, accuracy could be improved by combining path-planning techniques with transportation internet of things information.
(2)
The scope of this study only covered economically developed cities. Therefore, the policy implications are also place-based, and can be applied to these developed cities in East China. Urban green space equity varies in cities with different physical, social, and cultural contexts. Future research could expand this analysis to developing cities and incorporate multi-source data such as remote sensing data, statistical yearbooks, and other sources for cross-regional comparisons.
(3)
This study measured green space quantity without considering its quality. Future studies could include indicators of park green space quality, such as NDVI and biodiversity, in their analyses.

5. Conclusions

Equitable distribution of urban green spaces is increasingly regarded as a core issue in environmental justice and requires urgent attention. This study constructs a framework for evaluating multi-dimensional urban green space equity based on multi-source data in Hangzhou, China. This study assesses the green coverage and park accessibility and introduces a new approach to evaluate spatial equity, social equity, and social justice in urban green spaces at neighborhood scale. The results showed that the distribution of green coverage and park accessibility in Hangzhou was uneven, generally following a decreasing trend from the center to the periphery. High-priced neighborhoods occupied more green resources, especially the green coverage and community park accessibility, but exhibited less green equity. Low-priced neighborhoods and urban villages had the lowest green resources, but more equitable in terms of country park accessibility.
This study also revealed a mismatch between the absolute supply and relative equity of urban green space resources in urban regions, providing valuable insight for policymakers to identify areas lacking sufficient urban green space resources. The policymakers also should focus on disadvantaged groups, whose habitats with less urban green space resource. It is essential to develop suitable greening strategies and policies for urban sustainability. These policies should consider the absolute urban green space supply and relative equalities across different zones and social groups. In conclusion, we offer empirical support for the construction of livable cities with equitable urban green spaces. Our findings could serve as a reference for other countries and regions to promote urban green space sustainable development.

Author Contributions

Conceptualization, G.H. and S.D.; methodology, G.H. and S.D.; validation, G.H., Y.S. and S.D.; formal analysis, Y.S. and S.D.; data curation, S.D., H.Y., M.L. and J.T.; writing—original draft preparation, S.D.; writing—review and editing, G.H., Y.S., Y.T., M.L. and S.D.; visualization, Y.S. and S.D.; supervision, G.H. and Y.T.; project administration, G.H.; funding acquisition, G.H and Y.T. All authors have read and agreed to the published version of the manuscript.

Funding

This research was funded by the “Pioneer” and “Leading Goose” R&D Program of Zhejiang [Grant No. 2024C03227] and the National Natural Science Foundation of China [Grant No. 32171570].

Data Availability Statement

The raw data supporting the conclusions of this study will be made available by the authors upon request.

Acknowledgments

We are grateful to the editor and the reviewers for their valuable comments regarding this manuscript. The authors thank the graduate students of the Landscape Architecture program from Zhejiang Sci-Tech University for their assistance with data collection.

Conflicts of Interest

Authors Yangyang Sun, Miaoyan Liu and Yuan Tian were employed by the company Zhejiang Neusense Smart Science and Technology Ltd. The remaining authors declare that the research was conducted in the absence of any commercial or financial relationships that could be construed as a potential conflict of interest.

References

  1. United Nations Human Settlements Programme. World Cities Report 2022: Envisaging the Future of Cities. Nairobi: United Nations Human Settlements Programme. 2022. Available online: https://unhabitat.org/wcr/ (accessed on 2 November 2024).
  2. Aguilar, A.G.; Hernandez-Lozano, J. Mega-Urbanization, Territorial Fragmentation and Social Inequality in the Global South: The Case of Mexico City and Its City-Region. Appl. Geogr. 2024, 163, 103183. [Google Scholar] [CrossRef]
  3. Racial Disparities in Pollution Exposure and Employment at US Industrial Facilities | PNAS. Available online: https://www.pnas.org/doi/full/10.1073/pnas.1721640115 (accessed on 4 November 2024).
  4. Yan, L.; Jia, W.; Zhao, S. The Cooling Effect of Urban Green Spaces in Metacities: A Case Study of Beijing, China’s Capital. Remote Sens. 2021, 13, 4601. [Google Scholar] [CrossRef]
  5. Teixeira, C.P.; Fernandes, C.O.; Ryan, R.; Ahern, J. Attitudes and Preferences towards Plants in Urban Green Spaces: Implications for the Design and Management of Novel Urban Ecosystems. J. Environ. Manag. 2022, 314, 115103. [Google Scholar] [CrossRef] [PubMed]
  6. Salvatore, M.A.; Grundy, E. Area Deprivation, Perceived Neighbourhood Cohesion and Mental Health at Older Ages: A Cross Lagged Analysis of UK Lon-gitudinal Data. Health Place 2021, 67, 102470. [Google Scholar] [CrossRef]
  7. Dean, A.J.; Ross, H.; Roiko, A.; Fielding, K.S.; Saeck, E.; Johnston, K.; Beatson, A.; Udy, J.; Maxwell, P. Beyond Proximity: How Subjective Perceptions of Enablers and Constraints Influence Patterns of Blue Space Recreation. Landsc. Urban Plan. 2022, 228, 104557. [Google Scholar] [CrossRef]
  8. Tian, D.; Wang, J.; Xia, C.; Zhang, J.; Zhou, J.; Tian, Z.; Zhao, J.; Li, B.; Zhou, C. The Relationship between Green Space Accessibility by Multiple Travel Modes and Housing Prices: A Case Study of Beijing. Cities 2024, 145, 104694. [Google Scholar] [CrossRef]
  9. Dickinson, D.C.; Hobbs, R.J. Cultural Ecosystem Services: Characteristics, Challenges and Lessons for Urban Green Space Research. Ecosyst. Serv. 2017, 25, 179–194. [Google Scholar] [CrossRef]
  10. Diener, A.; Mudu, P. How Can Vegetation Protect Us from Air Pollution? A Critical Review on Green Spaces’ Mitigation Abilities for Air-Borne Par-ticles from a Public Health Perspective—With Implications for Urban Planning. Sci. Total Environ. 2021, 796, 148605. [Google Scholar] [CrossRef]
  11. Bressane, A.; Loureiro, A.I.S.; Negri, R.G. Environmental Racism in the Accessibility of Urban Green Space: A Case Study of a Metropolitan Area in an Emerging Economy. Urban Sci. 2024, 8, 224. [Google Scholar] [CrossRef]
  12. Sun, Y.; Saha, S.; Tost, H.; Kong, X.; Xu, C. Literature Review Reveals a Global Access Inequity to Urban Green Spaces. Sustainability 2022, 14, 1062. [Google Scholar] [CrossRef]
  13. Bressane, A.; Cunha Pinto, J.P.D.; Castro Medeiros, L.C.D. Urban Green Space Disparities: Implications of Environmental Injustice for Public Health. Urban For. Urban Green. 2024, 99, 128441. [Google Scholar] [CrossRef]
  14. Kronenberg, J.; Haase, A.; Łaszkiewicz, E.; Antal, A.; Baravikova, A.; Biernacka, M.; Dushkova, D.; Filčak, R.; Haase, D.; Ignatieva, M.; et al. Environmental Justice in the Context of Urban Green Space Availability, Accessibility, and Attractiveness in Postsocialist Cities. Cities 2020, 106, 102862. [Google Scholar] [CrossRef]
  15. Zhang, J.; Xu, E. Investigating the Spatial Distribution of Urban Parks from the Perspective of Equity-Efficiency: Evidence from Chengdu, China. Urban For. Urban Green. 2023, 86, 128019. [Google Scholar] [CrossRef]
  16. Gu, X.; Tao, S.; Dai, B. Spatial Accessibility of Country Parks in Shanghai, China. Urban For. Urban Green. 2017, 27, 373–382. [Google Scholar] [CrossRef]
  17. Gu, X.; Li, Q.; Chand, S. Factors Influencing Residents’ Access to and Use of Country Parks in Shanghai, China. Cities 2020, 97, 102501. [Google Scholar] [CrossRef]
  18. Nesbitt, L.; Meitner, M.J.; Girling, C.; Sheppard, S.R.J.; Lu, Y. Who Has Access to Urban Vegetation? A Spatial Analysis of Distributional Green Equity in 10 US Cities. Landsc. Urban Plan. 2019, 181, 51–79. [Google Scholar] [CrossRef]
  19. Deng, Z.; Ning, L. Inequity in Accessibility to Urban Parks in Environmental Gentrification Areas Based on Multi-G3SFCA: A Case Study of Wu-han’s Main Urban Districts. Ecol. Indic. 2024, 169, 112899. [Google Scholar] [CrossRef]
  20. Grove, J.M.; Locke, D.H.; O’Neil-Dunne, J.P.M. An Ecology of Prestige in New York City: Examining the Relationships Among Population Density, Socio-Economic Status, Group Identity, and Residential Canopy Cover. Environ. Manag. 2014, 54, 402–419. [Google Scholar] [CrossRef]
  21. Chen, S.; Knöll, M. Environmental Justice in the Context of Access to Urban Green Spaces for Refugee Children. Land 2024, 13, 716. [Google Scholar] [CrossRef]
  22. Larson, E.K.; Perrings, C. The Value of Water-Related Amenities in an Arid City: The Case of the Phoenix Metropolitan Area. Landsc. Urban Plan. 2013, 109, 45–55. [Google Scholar] [CrossRef]
  23. Bressane, A.; Pinto, J.P.D.C.; Medeiros, L.C.D.C. Countering the Effects of Urban Green Gentrification through Nature-Based Solutions: A Scoping Review. Nat.-Based Solut. 2024, 5, 100131. [Google Scholar] [CrossRef]
  24. Anguelovski, I.; Connolly, J.J.T.; Masip, L.; Pearsall, H. Assessing Green Gentrification in Historically Disenfranchised Neighborhoods: A Longitudinal and Spatial Analysis of Barce-lona. Urban Geogr. 2018, 39, 458–491. [Google Scholar] [CrossRef]
  25. Rigolon, A.; Yañez, E.; Aboelata, M.J.; Bennett, R. “A Park Is Not Just a Park”: Toward Counter-Narratives to Advance Equitable Green Space Policy in the United States. Cities 2022, 128, 103792. [Google Scholar] [CrossRef]
  26. Wolch, J.R.; Byrne, J.; Newell, J.P. Urban Green Space, Public Health, and Environmental Justice: The Challenge of Making Cities ‘Just Green Enough’. Landsc. Urban Plan. 2014, 125, 234–244. [Google Scholar] [CrossRef]
  27. Shang, L.; Zhang, X.; Tang, D.; Ma, X.; Lu, C. The Impact of Housing Support Expenditure on Urban Residents’ Consumption—Evidence from China. Sustainability 2023, 15, 9223. [Google Scholar] [CrossRef]
  28. Dong, Q.; Lu, H.; Luo, X.; He, P.; Li, D.; Wu, L.; Wei, Y.; Chen, X. Evaluation and Optimization of Green Space Fairness in Urban Built-Up Areas Based on an Improved Supply and Demand Model: A Case Study of Chengdu, China. Sustainability 2023, 15, 15014. [Google Scholar] [CrossRef]
  29. Chen, S.; Zhang, L.; Huang, Y.; Wilson, B.; Mosey, G.; Deal, B. Spatial Impacts of Multimodal Accessibility to Green Spaces on Housing Price in Cook County, Illinois. Urban For. Urban Green. 2022, 67, 127370. [Google Scholar] [CrossRef]
  30. Xia, N.; Cheng, L.; Chen, S.; Wei, X.; Zong, W.; Li, M. Accessibility Based on Gravity-Radiation Model and Google Maps API: A Case Study in Australia. J. Transp. Geogr. 2018, 72, 178–190. [Google Scholar] [CrossRef]
  31. Comber, A.; Brunsdon, C.; Green, E. Using a GIS-Based Network Analysis to Determine Urban Greenspace Accessibility for Different Ethnic and Religious Groups. Landsc. Urban Plan. 2008, 86, 103–114. [Google Scholar] [CrossRef]
  32. Zhang, Y.; Luo, F.; Dai, Y.; Zhang, C. Changing Spatial Inclusion of Migrants in Chinese Cities: How Housing Matters. Habitat Int. 2025, 157, 103319. [Google Scholar] [CrossRef]
  33. Rigolon, A.; Browning, M.; Jennings, V. Inequities in the Quality of Urban Park Systems: An Environmental Justice Investigation of Cities in the United States. Landsc. Urban Plan. 2018, 178, 156–169. [Google Scholar] [CrossRef]
  34. GB50180—2018; Urban Residential Area Planning and Design Standard. Ministry of Housing and Urban-Rural Development; China Architecture & Building Press: Beijing, China, 2018.
  35. GB/T 51346—2019; Urban Green Space Planning Standard. Ministry of Housing and Urban-Rural Development; China Architecture & Building Press: Beijing, China, 2019.
  36. Chang, J.; Qu, Z.; Xu, R.; Pan, K.; Xu, B.; Min, Y.; Ren, Y.; Yang, G.; Ge, Y. Assessing the Ecosystem Services Provided by Urban Green Spaces along Urban Center-Edge Gradients. Sci. Rep. 2017, 7, 11226. [Google Scholar] [CrossRef] [PubMed]
  37. Díaz, S.; Pascual, U.; Stenseke, M.; Martín-López, B.; Watson, R.T.; Molnár, Z.; Hill, R.; Chan, K.M.A.; Baste, I.A.; Brauman, K.A.; et al. Assessing Nature’s Contributions to People. Science 2018, 359, 270–272. [Google Scholar] [CrossRef] [PubMed]
  38. Liu, S.; Zhang, X.; Feng, Y.; Xie, H.; Jiang, L.; Lei, Z. Spatiotemporal Dynamics of Urban Green Space Influenced by Rapid Urbanization and Land Use Policies in Shanghai. Forests 2021, 12, 476. [Google Scholar] [CrossRef]
  39. Dai, D. Black Residential Segregation, Disparities in Spatial Access to Health Care Facilities, and Late-Stage Breast Cancer Diagnosis in Metropolitan Detroit. Health Place 2010, 16, 1038–1052. [Google Scholar] [CrossRef]
  40. Martin, A.J.F.; Conway, T.M. Using the Gini Index to Quantify Urban Green Inequality: A Systematic Review and Recommended Reporting Standards. Landsc. Urban Plan. 2025, 254, 105231. [Google Scholar] [CrossRef]
  41. Chen, Y.; Ge, Y.; Yang, G.; Wu, Z.; Du, Y.; Mao, F.; Chang, J. Inequalities of Urban Green Space Area and Ecosystem Services along Urban Center-Edge Gradients. Landsc. Urban Plan. 2022, 217, 104266. [Google Scholar] [CrossRef]
  42. Wu, L.; Kim, S.K.; Lin, C. Socioeconomic Groups and Their Green Spaces Availability in Urban Areas of China: A Distributional Justice Perspective. Environ. Sci. Policy 2022, 131, 26–35. [Google Scholar] [CrossRef]
  43. Lee, J.-W.; Lee, S.-W.; Kim, H.G.; Jo, H.-K.; Park, S.-R. Green Space and Apartment Prices: Exploring the Effects of the Green Space Ratio and Visual Greenery. Land 2023, 12, 2069. [Google Scholar] [CrossRef]
  44. Gu, W.; Tang, Z.; Chen, Y.; Dai, M. Research on the Greening Rate and Spatial Differences of Urban Residential Neighborhoods in Shenzhen. Landsc. Archit. Front. 2021, 9, 60. [Google Scholar] [CrossRef]
  45. Chen, K.; Lin, H.; You, S.; Han, Y. Review of the Impact of Urban Parks and Green Spaces on Residence Prices in the Environmental Health Context. Front. Public Health 2022, 10, 993801. [Google Scholar] [CrossRef] [PubMed]
  46. Guo, Y.; Lei, G.; Zhang, L. Quality Evaluation of Park Green Space Based on Multi-Source Spatial Data in Shenyang. Sustainability 2023, 15, 8991. [Google Scholar] [CrossRef]
  47. Wu, J.; He, Q.; Chen, Y.; Lin, J.; Wang, S. Dismantling the Fence for Social Justice? Evidence Based on the Inequity of Urban Green Space Accessibility in the Central Ur-ban Area of Beijing. Environ. Plan. B Urban Anal. City Sci. 2020, 47, 626–644. [Google Scholar] [CrossRef]
  48. Shan, L.; He, S. The Role of Peri-Urban Parks in Enhancing Urban Green Spaces Accessibility in High-Density Contexts: An Environmental Jus-tice Perspective. Landsc. Urban Plan. 2025, 254, 105244. [Google Scholar] [CrossRef]
  49. Chen, B.; Wu, S.; Song, Y.; Webster, C.; Xu, B.; Gong, P. Contrasting Inequality in Human Exposure to Greenspace between Cities of Global North and Global South. Nat. Commun. 2022, 13, 4636. [Google Scholar] [CrossRef]
  50. Yuan, F.; Wei, Y.D.; Wu, J. Amenity Effects of Urban Facilities on Housing Prices in China: Accessibility, Scarcity, and Urban Spaces. Cities 2020, 96, 102433. [Google Scholar] [CrossRef]
  51. Wu, L.; Rowe, P.G. Green Space Progress or Paradox: Identifying Green Space Associated Gentrification in Beijing. Landsc. Urban Plan. 2022, 219, 104321. [Google Scholar] [CrossRef]
  52. Pearsall, H.; Eller, J.K. Locating the Green Space Paradox: A Study of Gentrification and Public Green Space Accessibility in Philadelphia, Pennsylva-nia. Landsc. Urban Plan. 2020, 195, 103708. [Google Scholar] [CrossRef]
  53. Richards, D.R.; Passy, P.; Oh, R.R.Y. Impacts of Population Density and Wealth on the Quantity and Structure of Urban Green Space in Tropical Southeast Asia. Landsc. Urban Plan. 2017, 157, 553–560. [Google Scholar] [CrossRef]
Figure 1. Basic information on Hangzhou’s urban center. (a) Research area; (b) population density; (c) average property prices of neighborhoods; (d) neighborhood types.
Land 14 01183 g001
Figure 2. Distribution of green coverage across different neighborhoods. (a) All neighborhoods; (b) low-priced neighborhoods; (c) medium-priced neighborhoods; (d) high-priced neighborhoods; (e) urban villages.
Land 14 01183 g002
Figure 3. Distribution of park accessibility across different park types. (a) Community parks; (b) urban parks; (c) country parks.
Land 14 01183 g003
Figure 4. Comparison of green coverage in high-, medium-, and low-priced neighborhoods plus urban villages. The values of green coverage were standardized. Different letters on the bars indicate significant differences between groups.
Land 14 01183 g004
Figure 5. Comparative analysis of park accessibility across high-, medium-, low-priced neighborhoods, and urban villages. The values of park accessibility were standardized. Different letters on the bars indicate significant differences between groups.
Land 14 01183 g005
Figure 6. Distribution of high-quality urban green space resources in various neighborhoods. (a) High-quality GC; (b) high-quality community park accessibility; (c) high-quality urban park accessibility; (d) high-quality country park accessibility. High-quality urban green space resources mean the values of GC and park accessibility are higher than the average level.
Land 14 01183 g006
Figure 7. Green coverage and park accessibility across (a) community parks; (b) urban parks; and (c) country parks. Each dot represents a single neighborhood.
Land 14 01183 g007
Table 1. Urban green space classification in Hangzhou.
Park TypeArea Range (ha)NumberProportion of Total Number (%)Total Area (km2)Proportion of Total Area (%)
Community≤1072181.112.32.5
Urban10–209210.37.61.5
Country>20768.6470.796
Table 2. Basic information on different neighborhood types in Hangzhou.
Neighborhood TypeNumberGreeningSocial GroupPopulation Density
High-priced neighborhoods1879Luxury gardens and poolsRich classLow
Medium-priced neighborhoods2040General greeningMiddle classMedium
Low-priced neighborhoods1981Scattered vegetationCareer startersHigh
Urban villages216NoneStudents, migrant laborersOvercrowded
Table 3. One-way ANOVA test for GC and park accessibility across neighborhood types.
Urban Green SpacesSSDFMSSR2Fp
Community park accessibility7.5932.530.012.530.057
Urban park
accessibility
9.8333.280.020.850.001
Country park
accessibility
1.46 × 10634.87 × 1060.018.63<0.001
Green coverage79.86326.620.0426.64<0.001
Table 4. Gini coefficients of green coverage and park accessibility across neighborhood types.
Urban Green SpacesHigh-Priced NeighborhoodsMedium-Priced NeighborhoodsLow-Priced NeighborhoodsUrban VillagesOverall
Community park accessibility0.980.950.940.920.94
Urban park
accessibility
0.950.880.910.850.90
Country park
accessibility
0.920.940.950.980.93
Green coverage0.820.610.600.670.66
Disclaimer/Publisher’s Note: The statements, opinions and data contained in all publications are solely those of the individual author(s) and contributor(s) and not of MDPI and/or the editor(s). MDPI and/or the editor(s) disclaim responsibility for any injury to people or property resulting from any ideas, methods, instructions or products referred to in the content.

