Article

Ecological Management Zoning Through Integration of Ecosystem Service and Landscape Ecological Risk: A Case Study in Chongli, China

1
School of Landscape Architecture, Beijing Forestry University, Beijing 100083, China
2
National Academy for Mayors of China (Professional Training Institute of Housing and Urban-Rural Development), Beijing 100029, China
*
Author to whom correspondence should be addressed.
Land 2025, 14(6), 1133; https://doi.org/10.3390/land14061133
Submission received: 2 April 2025 / Revised: 13 May 2025 / Accepted: 15 May 2025 / Published: 22 May 2025

Abstract

:
Balancing ecological conservation with development pressures remains a critical challenge in regions hosting mega-events like the Winter Olympics. This study evaluates the ecological impacts of pre-Olympic construction in Chongli, China (2016–2021), through the integrated analysis of ecosystem service value (ESV) and landscape ecological risk (LERI). Using Sentinel-2 imagery and spatial statistics, we quantified land-use changes, applied benefit transfer methods for ESV assessment, and calculated the LERI using landscape pattern indices. The results revealed a 4.6% increase in the total ESV (266.4 to 278.7 million CNY), which was driven by afforestation initiatives that expanded the area of shrub-grassland and forests. Concurrently, the proportion of high/moderate LERI areas decreased by 12.3%, indicating reduced ecological vulnerability. Spatial correlation analysis demonstrated significant negative relationships between the ESV and LERI, particularly in zones that were undergoing ecological restoration. However, urban expansion weakened these synergies locally. The findings of this study highlight that strategic greening effectively enhanced ecosystem services while mitigating landscape risks during preparations for the Olympics. We propose an adaptive zoning framework that emphasizes dynamic ESV-LERI monitoring, tourism carrying capacity regulation, and payment for ecosystem service mechanisms to optimize post-event management. This integrated approach provides a transferable model for ecological governance in ecologically sensitive areas facing rapid development pressures, demonstrating the value of dual assessment methodologies in sustainable spatial planning.

1. Introduction

Rapid urbanization and industrialization have precipitated profound ecological crises worldwide, which manifest as habitat fragmentation, pollution escalation, and the degradation of ecosystem services that are critical to human survival [1]. Urban regions, despite their role as socioecological hubs, face intensified pressures due to overlapping demands for their development and conservation [2]. Addressing these challenges necessitates robust, integrative frameworks that are capable of navigating the complex trade-offs between economic progress and ecological integrity. Particularly crucial is the ability to reconcile the landscape ecological risk (LER) of an area with its ecosystem service value (ESV), especially within ecologically sensitive areas that are subjected to large-scale, rapid infrastructural transformations, such as those hosting mega-events like the Winter Olympics [3]. These events concentrate significant development pressures into relatively short timeframes and specific geographical locations, making them critical testbeds for sustainable planning approaches.
The ecosystem service value (ESV) quantifies the tangible and intangible benefits that humans derive from natural systems, which encompass provisioning (e.g., food, water), regulation (e.g., climate mitigation, water purification), support (e.g., nutrient cycling), and cultural services (e.g., recreation) [4]. Methodological advancements, including spatially explicit models like InVEST and ARIES, enable dynamic ESV assessments by linking land-use/land-cover changes (LUCC) to service provision potentials [5,6]. Recent innovations have emphasized the need for localized valuation frameworks that can be adjusted for regional biophysical and socioeconomic heterogeneity [7]. However, despite these advances, significant gaps persist, particularly in conducting longitudinal analyses that track ESV dynamics through periods of intense change and translating these assessments into actionable, policy-relevant guidance for adaptive management [8].
Concurrently, the Landscape Ecological Risk Index (LERI) has emerged as a key tool for evaluating the cumulative stressors on an ecosystem. LERI assessments typically integrate spatialized metrics of landscape patterns (reflecting potential exposure and sensitivity, such as fragmentation or connectivity) with disturbance probabilities, often utilizing landscape pattern indices calculated via tools like Fragstats or integrated into broader land-use change models like CLUE-S [9,10,11,12]. These models provide valuable decision-support tools for identifying vulnerable areas and prioritizing preemptive risk mitigation strategies. Nonetheless, many LERI methodologies focus primarily on the structure of a landscape and potential disturbances, often overlooking the explicit, functional synergies and trade-offs between the landscape risk status and the actual provision and value of multiple ecosystem services within that landscape [13].
The relationship between the ESV and LERI—the ESV-LERI nexus—is fundamental to sustainable landscape management, yet it remains significantly underexplored, particularly regarding its dynamic nature over time. While conceptually linked (healthier, service-rich ecosystems are generally less ecologically risky), much existing research tends to examine either the ESV [14,15,16] or LERI [17,18,19] in relative isolation, focusing on quantifying one aspect or the other at specific time points or under generalized change scenarios. Some studies have begun to investigate this relationship using methods like geospatial correlation analysis [20] or driver-detection models [21,22]. However, as noted by critics of fragmented approaches [13,20], these initial integration efforts often lack a deep investigation into the co-evolution of and temporal feedback mechanisms between service provision and risk exposure, especially under the intense, targeted pressures of large-scale development projects. This gap is particularly acute in the context of event-driven landscape transformations, such as those experienced by Olympic host regions. The rapid, concentrated land-use transitions associated with constructing venues and infrastructure dramatically amplify ecological trade-offs and synergies [23,24], creating a unique opportunity and critical need to understand how ESV and LERI dynamics unfold concurrently. Longitudinal studies tracking both indices through distinct development phases are scarce, limiting our predictive capacity and the development of truly adaptive ecological management strategies for such sensitive environments.
This study aims to directly address these gaps by providing an integrated analysis of the ESV and LERI dynamics within the core area of the Chongli Winter Olympics site during its crucial pre-event construction phase (2016–2021). Specifically, we seek to do the following: (1) quantify the spatio-temporal changes in both the ESV and LERI using high-resolution Sentinel-2 data and established methodologies; (2) explicitly analyze the spatiotemporal correlations and interactions between the ESV and LERI using grid-based spatial statistics to understand their relationship under development pressure; and (3) propose an evidence-based ecological management zoning framework informed by the observed ESV-LERI synergies and trade-offs. By examining the co-evolution of these critical ecological indicators during a period of intense, event-driven change, this research offers valuable insights into the effectiveness of concurrent development and ecological restoration efforts, providing a potentially transferable model for sustainable spatial planning in other ecologically sensitive areas that are facing similar pressures.

2. Materials and Methods

2.1. Study Area

The study area (40°52′–41°17′ N, 115°24′–115°30′ E) is located in the core area designated for the 2022 Winter Olympics in Chongli District, Zhangjiakou City, Hebei Province, China (Figure 1). This region experiences a temperate continental monsoon climate characterized by cold, dry winters and warm, humid summers. The average annual temperature is 3.9 °C, with average monthly temperatures ranging from approximately −12 °C in January to 19 °C in July. Average annual precipitation is 477 mm, with the majority (around 70–80%) concentrated in the summer months (from June to August). Situated in the transitional zone between the Inner Mongolia Plateau and the North China Plain, the area is characterized by mountainous and hilly terrain, with slopes ranging from 0 to 47.3° and altitudes between 1365 and 2387 m above sea level. The dominant soil types are brunisolic and cinnamon soils. The vegetation is diverse, including broad-leaved forests, mixed coniferous forests, deciduous coniferous forests, evergreen coniferous forests, shrubs, and meadows, and primarily consists of natural secondary forests and artificial plantations. Key tree species include Larix principis-rupprechtii, Pinus tabulae, Betula platyphylla, and Populus davidiana.
In preparation for the Winter Olympics, Chongli implemented a substantial greening project reportedly covering 30,000 hectares across the wider district, aiming to increase the forest coverage rate to over 80% in key zones. While specific project blueprints are not publicly detailed, implementation typically involved large-scale afforestation, the ecological restoration of degraded slopes, and the creation of ecological corridors, and likely prioritized areas immediately surrounding competition venues, along major transport routes, and on visually prominent slopes to enhance landscape aesthetics, improve soil stability, and bolster local ecological functions. However, the construction of venues and supporting infrastructure inevitably impacted vegetation cover and the local environment. This study aims to objectively assess the changes in the ESV and LERI before and after the construction of the Winter Olympics facilities, providing a scientific basis for evaluating the ecological landscape planning and construction in the Chongli core area and informing future ecological protection and restoration efforts.

2.2. Data Sources and Preprocessing

Land-use/land cover (LULC) data were derived from Sentinel-2 satellite imagery representing conditions in 2016 (representing the early stage of venue construction) and 2021 (representing the later stage of construction). These images were acquired during the summer months (July and August) of the respective years to minimize cloud cover (less than 10%) and to ensure optimal vegetation observation. These images were obtained from the Google Earth Engine (GEE) platform. Atmospheric correction was performed using the Sen2Cor algorithm (version 2.8) within the Sentinel Application Platform (SNAP) software (version 8.0).
LULC classification was performed using a random forest (RF) classifier, a robust machine learning algorithm known for its high accuracy and ability to handle high-dimensional data [25,26]. The RF classifier was implemented in the GEE platform, utilizing spectral bands, vegetation indices (specifically, the Normalized Difference Vegetation Index (NDVI) and Enhanced Vegetation Index (EVI)), and texture features derived from the Sentinel-2 images. Training samples were collected based on visual interpretation of high-resolution imagery and field surveys conducted in 2017 and 2020. The LULC was classified into six categories: cropland, forest, shrub-grassland, water body, built-up land, and barren land. Accuracy assessment was conducted using an independent set of validation samples, and overall accuracy and Kappa coefficients were calculated to evaluate the classification results [27]. The overall accuracy was 84%, and the Kappa coefficient was 0.81, indicating substantial agreement and acceptable accuracy of the results of this study.
Socioeconomic data, including the national average grain price (CNY/t), planting area (hm2), and annual yield of each grain type (t), were obtained from the Hebei Province Statistical Yearbook and the Data Collection of Cost and Income of National Agricultural Products for the years 2016 and 2021.

2.3. Ecosystem Service Value (ESV) Assessment

The ESV was calculated using the benefit transfer method based on the national framework of equivalent value per unit area of ecosystem services proposed by Costanza et al. [4] and modified by Xie et al. [28] for the Chinese context. The equivalent value factors represent the relative contribution of different ecosystem types to various ecosystem services compared to a standard unit, which was defined as the economic value of grain production from 1 hm2 of farmland. To localize this national framework, the monetary value of a standard unit equivalent factor (E) was calculated for the study area using Formula (1), based on the average market value of the main local grain crops (rice, wheat, maize) per unit area (1 hm2) for the relevant years (2016 and 2021).
E = 1 7 A i P i Y i
where E is the economic value of one standard ESV equivalent factor (CNY/hm2); i represents the crop type (rice, wheat, maize); Aᵢ, Pᵢ, and Yᵢ are the sown area (hm2), average price (CNY/kg), and average yield (kg/hm2) of crop i, respectively, obtained from statistical data for 2016 and 2021. The calculated standard equivalent value (E) for the study area was determined to be 1930.44 CNY/hm2 (this value represents an average value used for consistency across the study period). The final ecosystem service value coefficients ( V C i ) for each land-use category i (presented in Table 1) were then derived by multiplying the relative equivalent value factors from the national framework [28] by this locally determined standard equivalent economic value (E). Therefore, the ESV results for 2016 and 2021 are expressed in the nominal currency values (CNY) of those respective years, reflecting changes in both land use and the economic value underpinning the standard equivalent.
The ESV for each land-use category was calculated using the following formula:
E S V = ( A i × V C i )
where ESV is the total ecosystem service value, A i is the area (hm2) of land-use category i, and V C i is the ecosystem service value coefficient (CNY/hm2) for land-use category i, as shown in Table 1.

2.4. Landscape Ecological Risk Index (LERI) Calculation

The LERI was calculated based on landscape pattern indices and the area proportions of different landscape types, as represented by the assessment units, following methods adapted from previous studies [29]. The study area was divided into a 500 m × 500 m grid, resulting in a total of 3157 assessment units. This grid size was chosen to balance the need for spatial detail in capturing landscape patterns with computational efficiency, and it aligns with scales used in similar landscape ecological risk assessments in the region [30,31]. Each grid cell was considered an assessment unit. The LERI for each grid cell was calculated as follows:
L E R I i = A k A i × R k  
where L E R I i is the Landscape Ecological Risk Index for grid cell i, A k is the area of landscape type k within grid cell i, A i is the total area of grid cell i (25 hm2), and R k is the ecological risk index calculated specifically for landscape type k.
To calculate R k , landscape pattern indices—specifically the landscape fragmentation index ( C k ), landscape separation index ( S k ), and landscape dominance index ( D k )—were first computed using Fragstats software (version 4.2) [32] for each landscape type k present within each grid cell i. The formulas for these indices are as follows:
C k = n k A k
S k = A i 2 A k n k A i
D k = ( Q k + L k ) / 2
where nk is the number of patches of landscape type k within the grid cell, Q k is the ratio of the number of patches of landscape type k to the total number of patches of all types in the grid cell, and L k is the ratio of the area of landscape type k to the total area of the grid cell.
The ecological risk index (Rk) for each landscape type k was then calculated by combining these indices:
R k = a × C k + b × S k + c × D k
where a, b, and c are the weights assigned to Ck, Sk, and Dk, respectively. This additive weighted model was chosen based on its widespread use in landscape ecological risk assessments, as it allows for the integration of multiple indices that reflect different aspects of landscape vulnerability [33,34]. The weights were determined through a combination of ecological significance (e.g., fragmentation’s role in increasing disturbance vulnerability) and consistency with previous studies in similar environments [35,36]. Specifically, weights of a = 0.5, b = 0.3, and c = 0.2 were assigned to Ck, Sk, and Dk, respectively, emphasizing the dominant influence of fragmentation (Ck) on ecological risk. While alternative approaches, such as calculating relative importance values based on local data or using proportions of fragmented areas, could be explored, the current weighting scheme was selected for its alignment with established methodologies and its ability to capture key risk factors in mountainous regions. Sensitivity analyses in similar studies [35,36] have shown that this approach provides robust results, although future research could refine the weights applied herein using site-specific data. Finally, the overall LERI for grid cell i was calculated using Formula (3), which represents an area-weighted average of the risks ( R k ) associated with the different landscape types (k) within a given cell.

2.5. Spatial Autocorrelation Analysis

Spatial autocorrelation analysis was used to explore the spatial clustering patterns of the ESV and LERI. Global Moran’s I was used to measure the overall spatial autocorrelation, while Local Moran’s I (LISA) was used to identify local clusters and spatial outliers. These analyses were conducted using GeoDa software (version 1.18) [37]. The significance of the Moran’s I statistics was assessed using a permutation test with 999 permutations.
Pearson correlation analysis was initially used to examine the relationship between the ESV and LERI at the grid cell level. However, because the data did not meet the assumption of normality (as determined by the Kolmogorov–Smirnov test), Spearman’s rank correlation was used instead. The correlation coefficient (ρ) was calculated to quantify the strength and direction of the monotonic relationship between the two variables. All statistical analyses were performed using SPSS Statistics (version 26).

2.6. Ecological Management Zoning Analysis

Based on the spatial distribution of the ESV and LERI, we proposed an ecological management zoning scheme for the study area. The zoning was based on a combination of standardized ESV and LERI values and used z-score standardization. This resulted in four zones: (1) Ecological Protection Zone: high ESV and low LERI; (2) Ecological Restoration Zone: low ESV and high LERI; (3) Ecological Coordination Zone: high ESV and high LERI or low ESV and low LERI; (4) Sustainable Development Zone: moderate ESV and moderate LERI. This zoning scheme aims to provide a framework for targeted ecological management strategies in different areas based on their ecological conditions and risks.

3. Results

3.1. Land Use/Land Cover (LULC) Dynamics

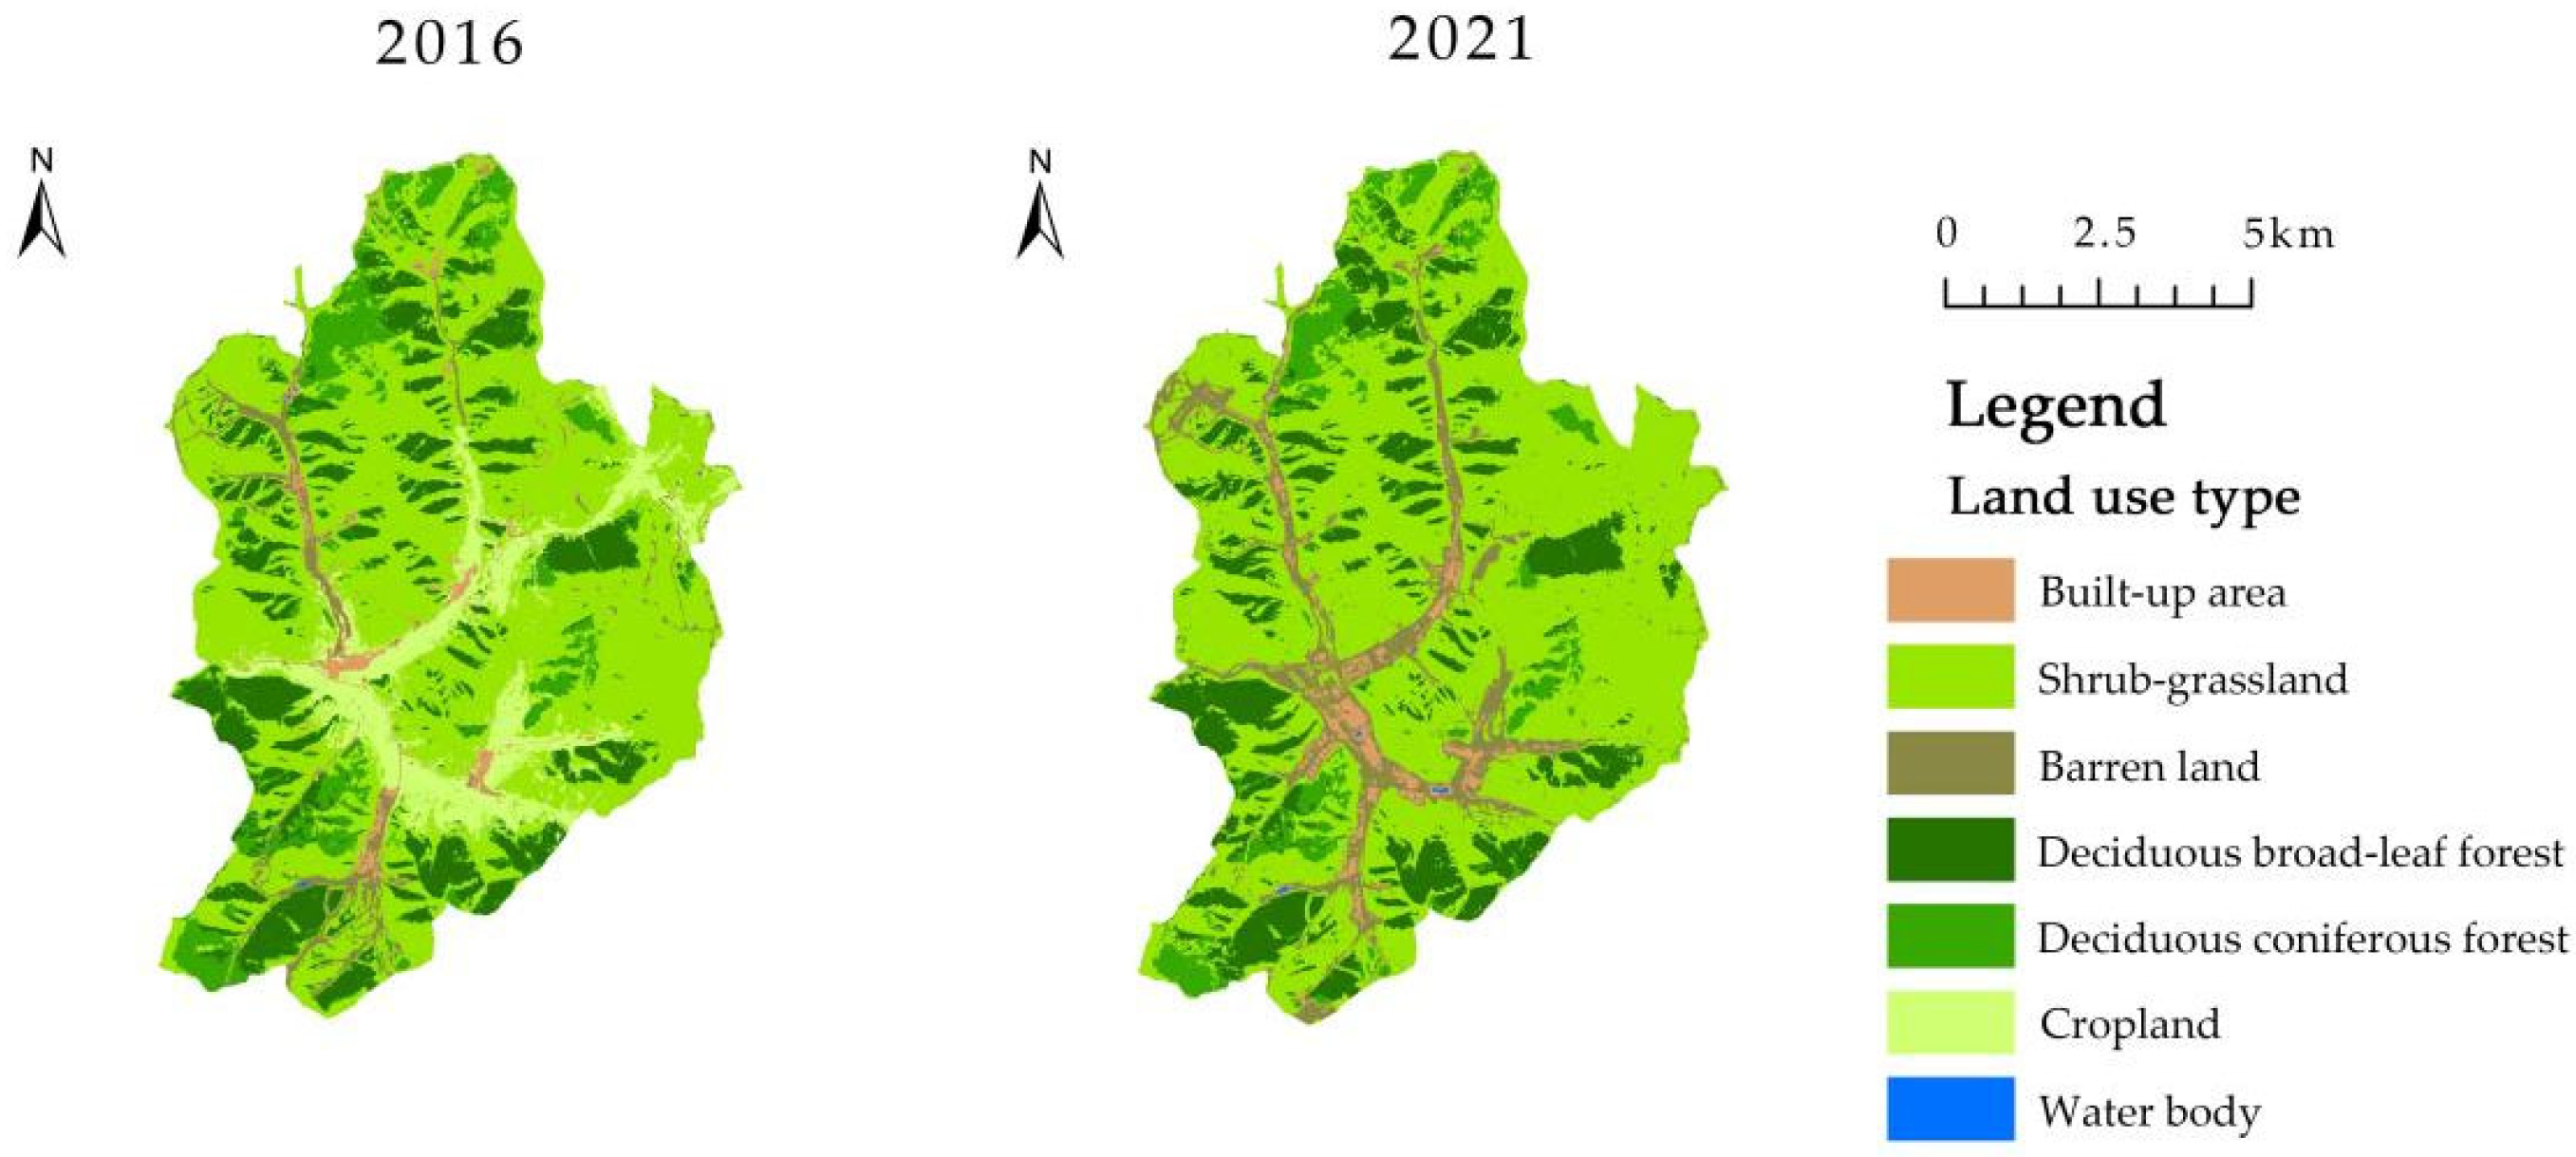
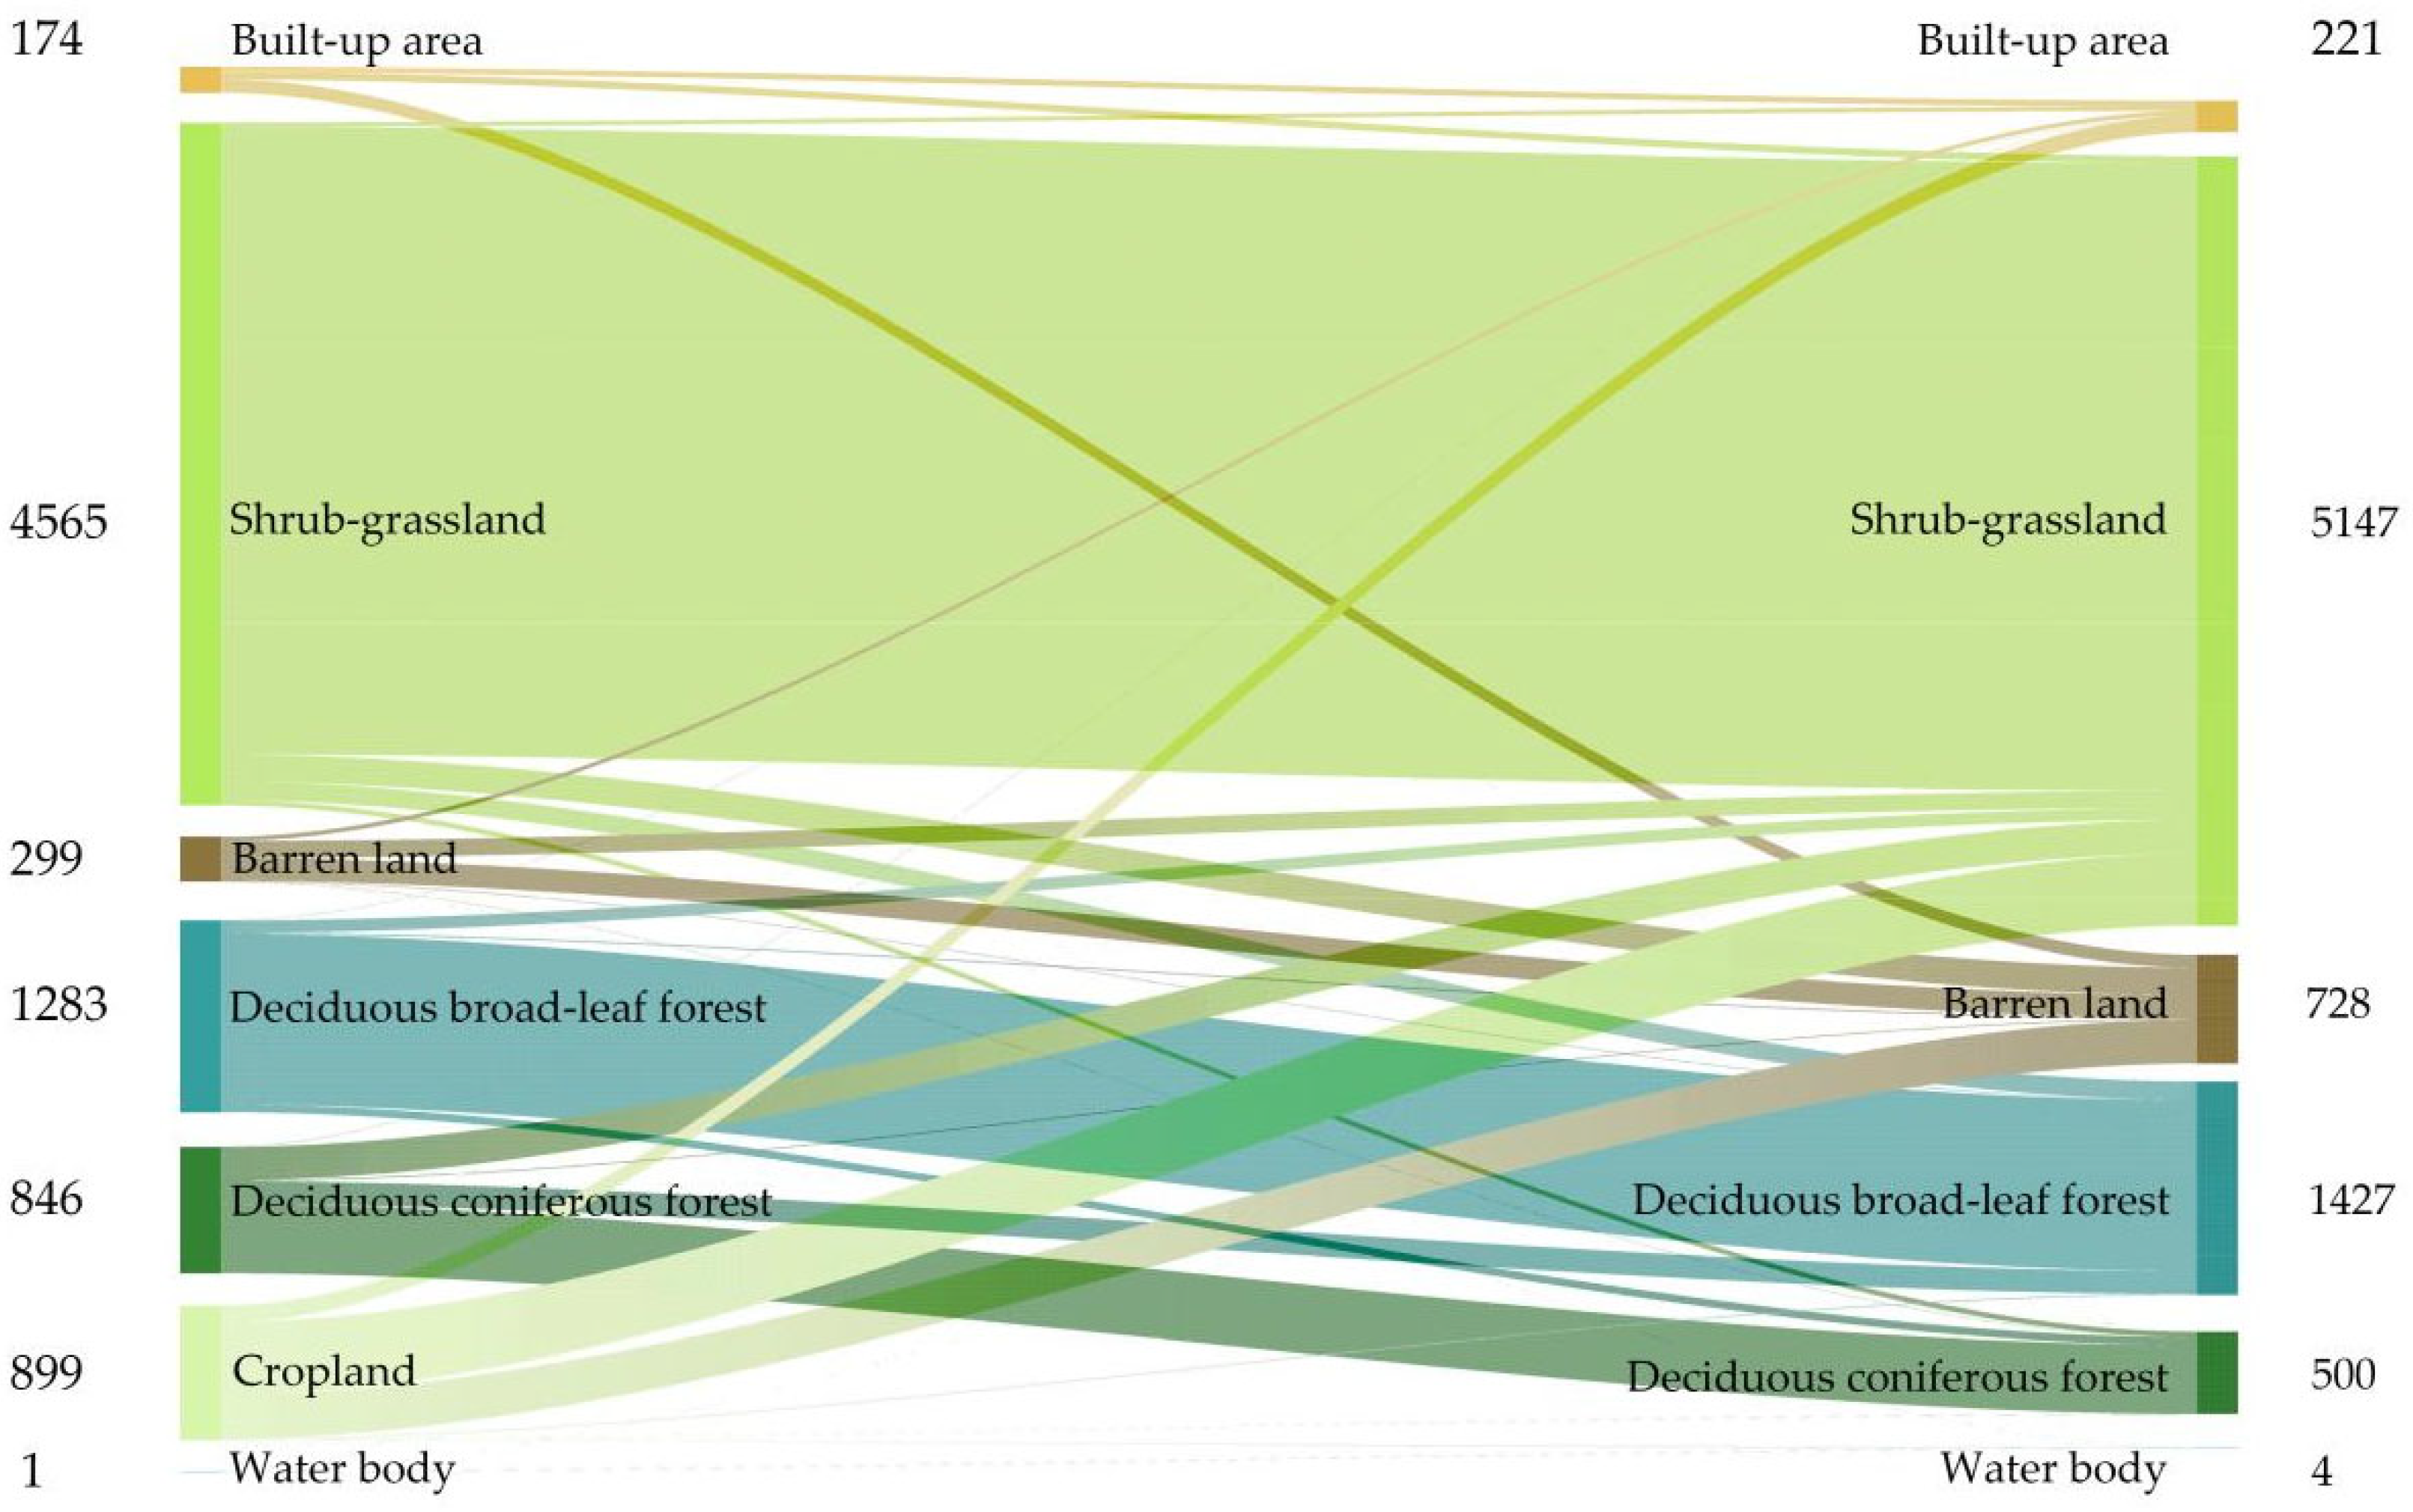
Based on the spatial distribution of land use in the study area in 2016 and 2021 (Figure 2), we obtained the land-use area and change proportion (Table 2) as well as the land-use transfer matrix (Figure 3). The results show that, in 2016, shrub-grassland covered the largest area in the study area, followed by deciduous broad-leaf forest, cropland, deciduous coniferous forest, barren land, built-up area, and water body area. By 2021, the sequence of land-use occupation ordered from largest to smallest area had changed slightly, becoming the following: shrub-grassland, deciduous broad-leaf forest, barren land, deciduous coniferous forest, built-up area, water body area, and, finally, cropland (which had become negligible). The area of all land-use types changed during the study period, with increases being observed in shrub-grassland, deciduous broad-leaf forest, built-up land, water body area, and barren land. Among these, shrub-grassland, the dominant land-use type in the study area, increased by 12.75%. The areas of deciduous coniferous forest and cropland both decreased, and cropland had almost disappeared from the study area by 2021. Analysis of the land-use transfer matrix (Figure 3) reveals that this near-disappearance of cropland was primarily due to its conversion into shrub-grassland (as part of vegetation restoration or greening initiatives) and barren land (likely areas cleared for or affected by construction). This significant land-use change reflects landscape modifications that were undertaken in preparation for the Winter Olympics, including ecological restoration projects (such as planting shrubs and grasses to enhance vegetation cover) and infrastructure development.
According to the land-use transfer matrix, cropland was mainly converted to shrub-grassland and barren land. Shrub-grassland expansion occurred at the expense of cropland and deciduous coniferous forest. In relatively flat areas, the built-up areas primarily expanded into former cropland.

3.2. Ecosystem Service Value (ESV) Changes

The calculation of the ESV change proportion in Table 3 followed the standard formula: [(ESV_2021 − ESV_2016)/ESV_2016] × 100%. The changes in the ESV for each land-use type are determined by multiplying the changes in their respective areas (as shown in Table 2 and Figure 3) by their specific ecosystem service value coefficients ( V C i from Table 1), which are based on the modified Xie et al. [28] framework and reflect the potential service provision capacity per unit area. During the study period, the total ESV in the study area increased from 266.4 million CNY to 278.7 million CNY (Table 3), indicating a slight overall increase of 4.6%. Among all land-use types, shrub-grassland exhibited the highest ESV, followed by deciduous broad-leaf forest and deciduous coniferous forest. During the study period, the ESVs of the deciduous coniferous forest and cropland areas decreased, while the ESVs of other land-use types increased. The largest increment was observed for shrub-grassland, which reached 22.1 million CNY.
The ES types and sub-types (Table A1), listed in descending order by their ESV, are as follows: climate regulation, regulation of water flows, soil conservation, habitat quality, air-quality regulation, environmental purification, landscape aesthetics, raw material supply, food supply, water supply, and nutrient cycling. Climate regulation services accounted for the largest proportion (27%) of the total ESV. The dominance of shrub-grassland and forests in the study area resulted in their regulation service values being considerably higher than those of other ecosystems. This highlights the ecological role of shrub-grassland and forest land in conserving soil and water resources, improving air quality, and providing timber resources. The ESV of food supply decreased by 18.4% from 2016 to 2021, reflecting the negative impact of cropland reduction on food supply services. Overall, the increment of the total ESV from 2016 to 2021 was 4.6%. The value of provisioning services decreased, while the values of other service functions increased (Table 4). Among all ES types, water flow regulation showed the largest increase (7.3%), followed by water supply (7.2%), environmental purification (6.9%), landscape aesthetics (6.53%), and habitat quality (6.5%).
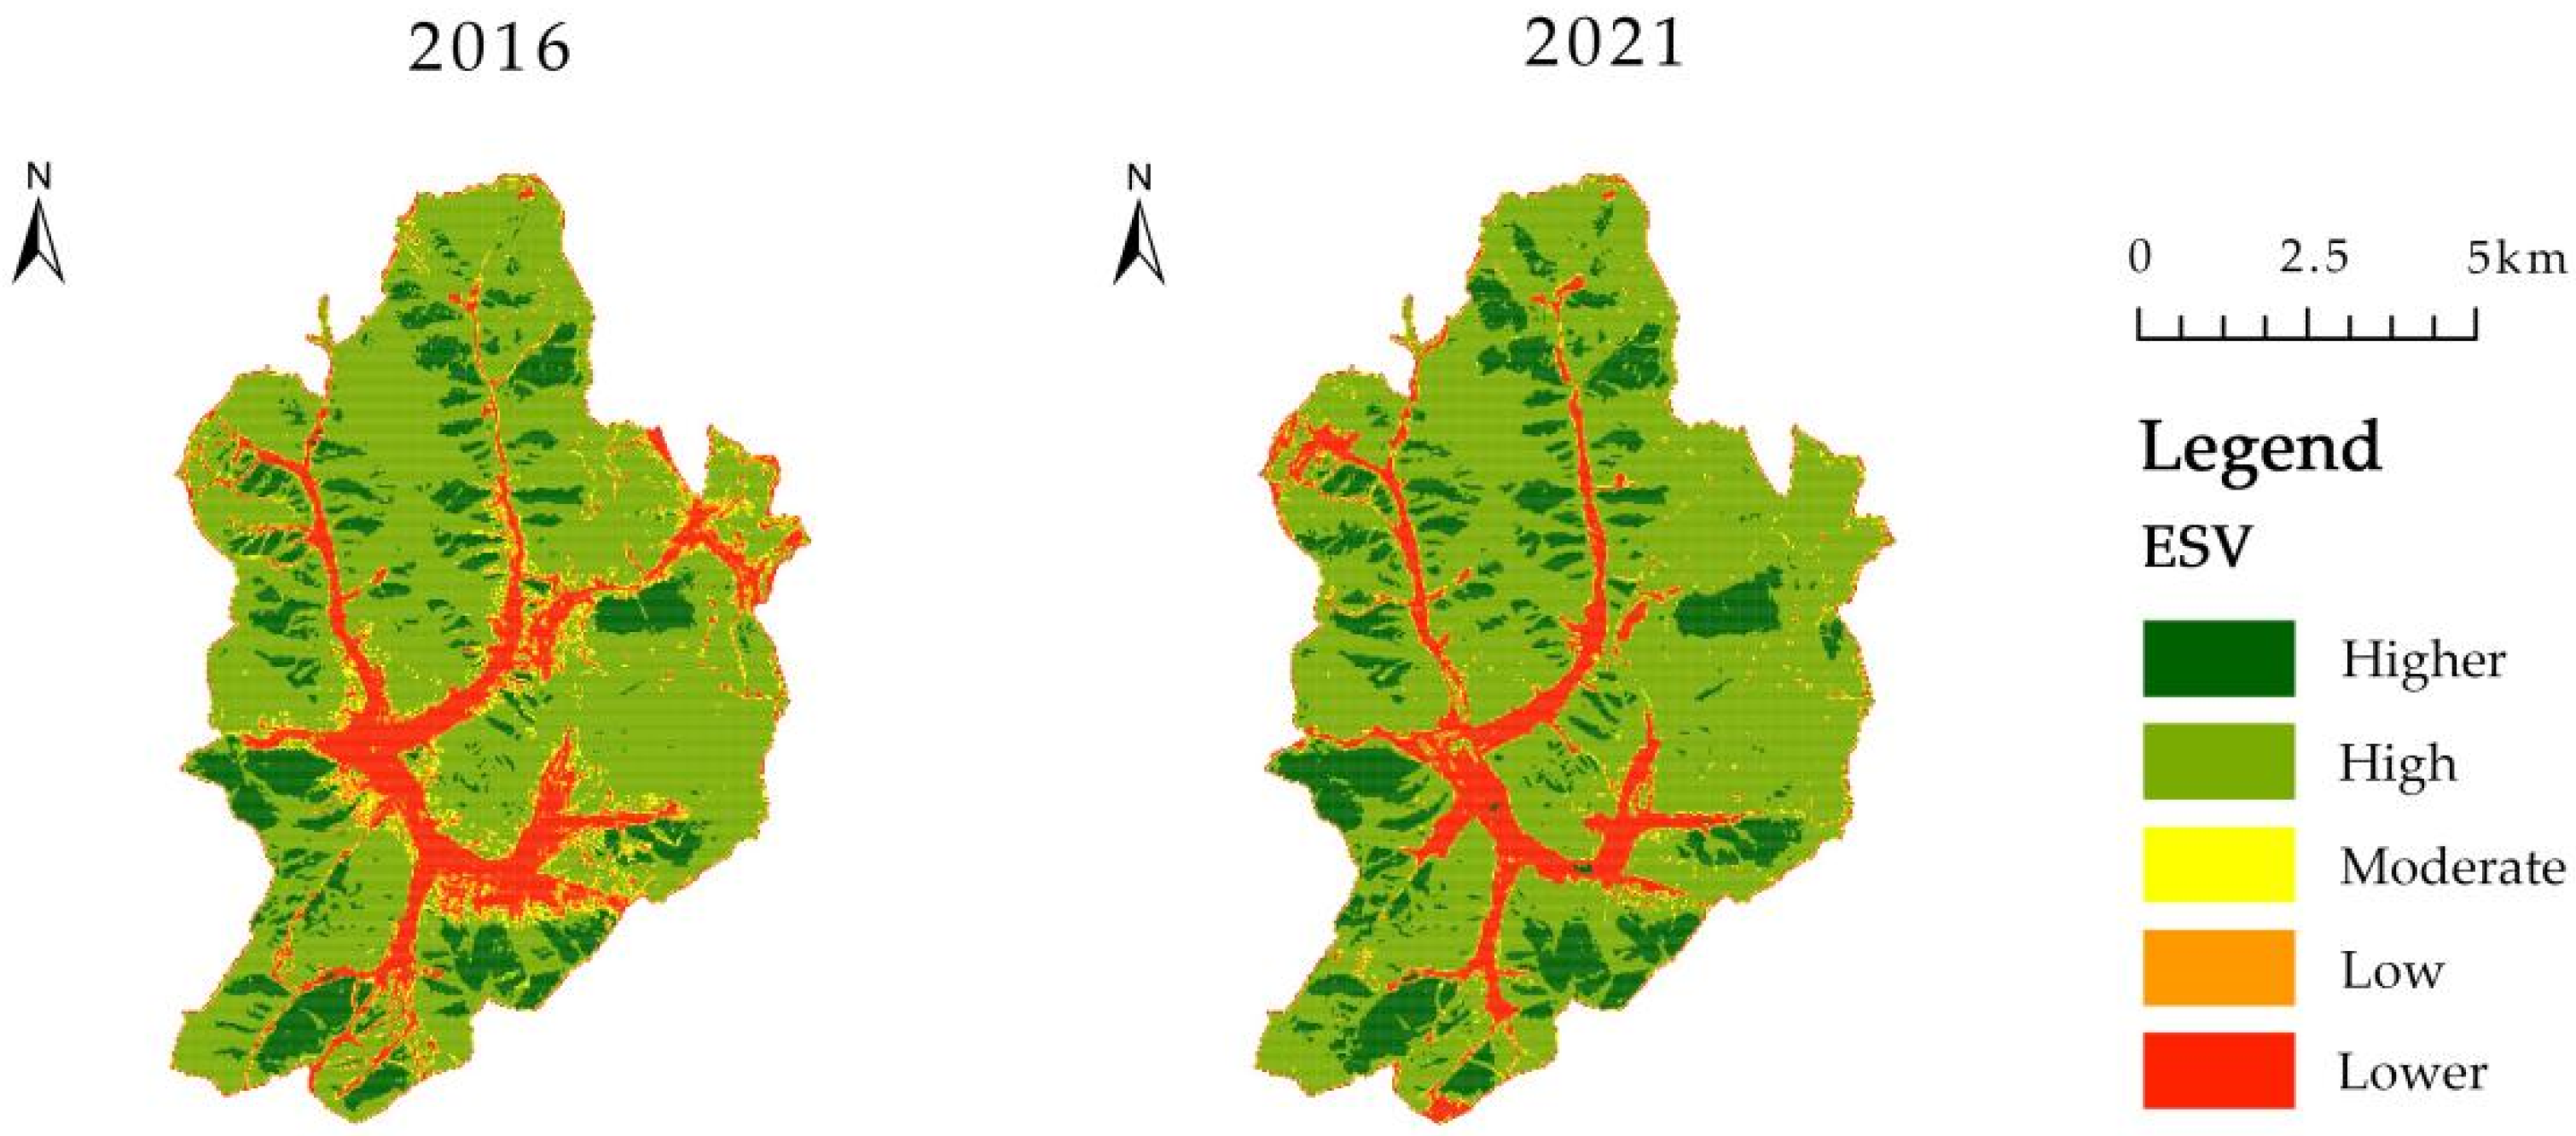
To visualize the spatial distribution patterns, we directly classified the ESVs that were calculated for each 500 m × 500 m grid cell using the natural breaks (Jenks) method in the ArGIS 10.8. This classification method identifies statistically optimal class ranges by minimizing the variance within classes and maximizing the variance between classes, effectively grouping similar values and highlighting natural clusters that are inherent in the data distribution. The resulting ESVs were classified into five categories: lower ESV (0, 787,233,168), low ESV (787,233,168, 1,958,430,723), moderate ESV (1,958,430,723, 2,890,446,843), high ESV (2,890,446,843, 3,652,198,211), and higher ESV (>3,652,198,211). Overall, the ESV of the study area showed an increasing trend, with “high” and “higher” ESVs dominating, accounting for 86% of the total area in 2021. The proportion of “lower” and “low” ESV areas decreased, while the proportion of “moderate” and “high” ESV areas increased (Table 5).
The spatial distribution of the ESVs in the study area exhibited obvious spatial heterogeneity (Figure 4). The low ESVs were primarily concentrated in the central valley and its surrounding areas. The high ESVs were mainly distributed in the mountainous areas covered by forest and shrub-grassland. The spatial distribution of the ESVs indicated an overall increase across the study area.

3.3. Landscape Ecological Risk Index (LERI) Patterns

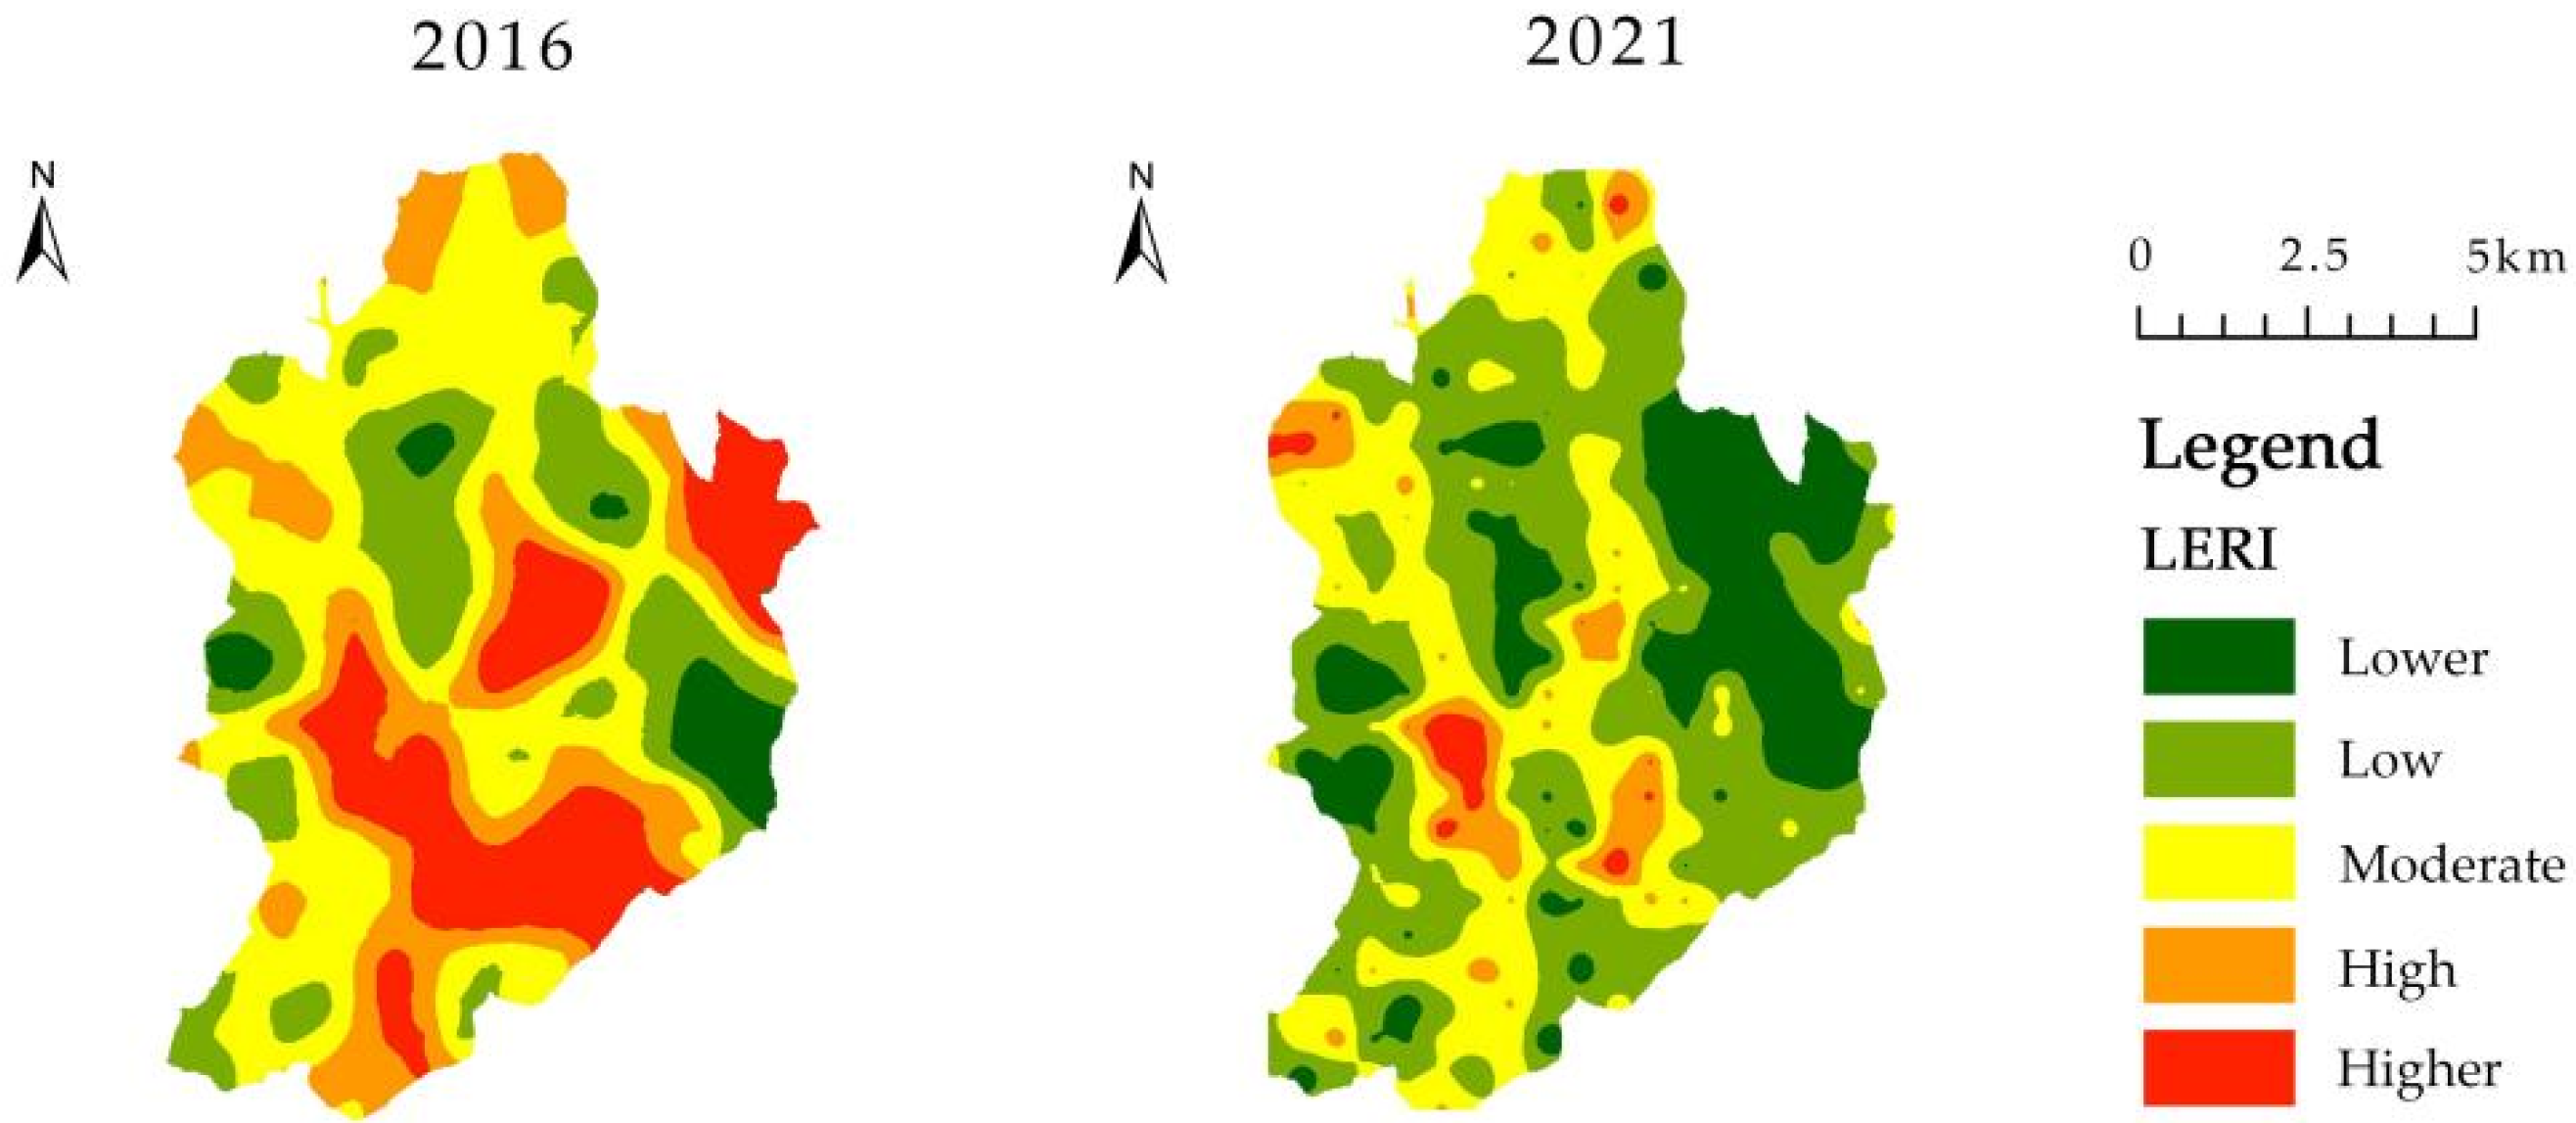
Based on the natural breaks (Jenks) method, which was similarly applied to the LERI values calculated per grid cell to identify inherent data groupings, the landscape ecological risks in the core area of the Winter Olympics were divided into five levels: lower LERI (0.01883634–0.084637795), low LERI (0.084637795–0.126928481_, moderate LERI (0.126928481–0.170354488), high LERI (0.170354488–0.214631984), and higher LERI (>0.214631984). The specific breakpoints that are reported are the direct output of the Jenks algorithm when it was applied to the 2016 and 2021 LERI datasets.
The LERI in the study area showed a decreasing trend from 2016 to 2021 (Table 6), indicating an improvement in landscape structure and a reduction in potential ecological vulnerability. In 2016, the area with a moderate LERI was the largest, while in 2021, the area with a low LERI became dominant. The area of “lower” and “low” LERI values increased, while the area of “moderate”, “high”, and “higher” LERI values decreased during the study period. This reduction in landscape risk, calculated based on indices of fragmentation, separation, and dominance (with fragmentation being weighted the highest), suggests that the landscape became more homogenous and less fragmented overall, which is indicative of landscape structure improvements resulting from ecological planning, design, and human intervention during this period.
The spatial distribution of the LERI showed a marked improvement in 2021. In 2021, the high-risk areas were mainly distributed in the central valley (e.g., the area around the Olympic Village and Prince City) and the northwestern ski resort region, potentially due to high construction intensity. The “lower” and “low” LERI values were primarily distributed in the eastern and southwestern regions. Mountainous areas with higher elevations exhibited lower LERI values, and these low-risk areas expanded and transitioned from a fragmented to a clustered distribution (Figure 5). These areas were dominated by deciduous coniferous forest and deciduous broad-leaf forest, which experienced less human disturbance. The spatial change in the LERI suggests that ecological risks were mitigated during the construction of competition venues, and that the applied protection measures (such as large-scale vegetation restoration initiatives, including afforestation and shrub-grassland planting, restrictions on development in sensitive zones, and targeted ecological restoration projects) were effective. While the total forested area showed a net decrease (primarily deciduous coniferous forest), the increase in shrub-grassland and deciduous broad-leaf forest indicates successful greening efforts in specific areas, which contributed to reduced fragmentation and risk.

3.4. ESV-LERI Spatial Correlation

The Kolmogorov–Smirnov (K-S) normality test was conducted for the ESV and LERI using SPSS v26.0. The results indicated that neither the ESV nor the LERI followed a normal distribution. Therefore, Spearman’s rank correlation coefficient was used to quantify their relationship. The correlation coefficients for 2016 and 2021 were −0.65 and −0.55, respectively (Figure 6). A significant negative correlation existed between the LERI and most ESVs, indicating that the ecological risk tended to increase when the ESV decreased. Only the food supply service value showed a positive correlation with the LERI in 2016, which shifted to a negative relationship in 2021. The positive correlation in 2016 likely occurred because cropland (the primary source of the food supply ESV) was concentrated in the relatively flat valley areas, which were also the zones that experienced higher initial landscape fragmentation and disturbance (higher LERI) due to existing settlements and early-phase construction activities. By 2021, with the cropland largely being replaced by restored shrub-grassland (lower LERI), this specific spatial coincidence disappeared, resulting in the expected negative correlation.
The Global Moran’s I index reflects the overall spatial clustering (or dispersion) of attribute values in the study area. The Global Moran’s I values for the total ESV in the study area in 2016 and 2021 were 0.381 and 0.307, respectively. The Global Moran’s I values for LERI in 2016 and 2021 were both 0.283. Both the ESV and LERI exhibited significant spatial clustering characteristics, although the clustering trend of the ESV weakened slightly over time. The Moran’s I values for the total ESV were consistently higher than those for the LERI. The spatial autocorrelation between the ESV and LERI was statistically significant (p ≤ 0.01), with Global Bivariate Moran’s I values of −0.277 and −0.181 in 2016 and 2021, respectively. This indicates a significant negative spatial correlation between the ESV and LERI, showing a dispersed pattern that became less pronounced in 2021.
The local spatial autocorrelation index (LISA) was used to identify local clusters (or dispersions) that passed the significance test. The clustering patterns of the ESV and LERI were categorized based on the LISA results (Figure 7). The correlation patterns between the ESV and LERI in the study area were classified into five types: not significant, high ESV—high LERI (H-H), low ESV–low LERI (L-L), low ESV–high LERI (L-H), and high ESV–low LERI (H-L) (Figure 7). The spatial relationships between the individual ESVs and LERI values were generally similar to the relationship between the total ESV and LERI, with the exceptions of food supply (FS) in 2016 and climate regulation (CR) in both years, consistent with the Spearman correlation analysis. Among the four significant relationship types, the high ESV–low LERI (H-L) relationship covered the largest area, followed by low ESV–high LERI (L-H), high ESV–high LERI (H-H), and low ESV–low LERI (L-L). Compared to 2016, the high ESV–low LERI (H-L) area increased by 36.8%, the low ESV–low LERI (L-L) area doubled, the low ESV–high LERI (L-H) area decreased by 17.6%, and the high ESV–high LERI (H-H) area decreased slightly (7.1%). This shift indicates an improved ecological situation in the study area. For food supply services in 2016, the dominant relationship was high ESV–high LERI (H-H), followed by low ESV–low LERI (L-L) and high ESV–low LERI (H-L). For climate regulation services in 2016, the low ESV–high LERI (L-H) relationship covered the largest area, followed by the low ESV–low LERI (L-L) relationship. However, in 2021, the low ESV–low LERI (L-L) area increased by 55.2% and became the dominant relationship, suggesting an improved ecological situation for climate regulation as well.

3.5. Ecological Management Zoning

Integrating ESV and LERI data spatially delineated four distinct ecological management zones (EMZs), as visualized in Figure 8. This zoning represents the primary outcome of integrating the two assessments, which is classification of the landscape based on the combined state of the ecosystem service value and ecological risk. The area coverage and changes from 2016 to 2021 for each zone are described below. Interpretations and specific management recommendations derived from these zones are further elaborated in the Section 4.
Ecological protection zone (H-L): As depicted in Figure 8, the ecological protection zone, characterized by a high ESV and low LERI, is predominantly concentrated in the northern and southwestern mountainous regions of Chongli. This zone, which significantly expanded from 36% to 55.3% of the study area between 2016 and 2021, spatially aligns with areas that exhibited a low LERI (Figure 5) and high ESV (Figure 4), particularly in the northeast and southwest. The LISA map (Figure 7, 2021) confirms significant H-L (high ESV–low LERI) clustering in these same regions, indicating strong statistical support for this classification in these core areas. This spatial congruence confirms that these regions possess robust ecological foundations, deliver strong ecosystem services, and face low ecological risks. Therefore, these areas represent the highest priority for conservation.
Ecological restoration zone (L-H): The ecological restoration zone, identified by a low ESV and high LERI, was initially scattered across the central and northwestern parts of the study area in 2016, occupying 9.9% of the area (Figure 8). Spatially, these zones, as shown in Figure 8 and compared in Figure 4 and Figure 5, partially overlapped with areas of high LERI and low ESV, indicating locations where ecological damage was most pronounced. These were typically areas that experienced intensive land-use changes associated with Olympic infrastructure development and urbanization. However, a remarkable reduction to just 0.3% of the study area by 2021 (Figure 8) signifies the substantial spatial shrinkage of areas with this combination of low service value and high risk. These drastically reduced zones still indicate areas that require ecological improvement.
Ecological coordination zone (L-L or H-H): Representing a more complex ecological scenario, the ecological coordination zone, covering 0.9% of the study area in 2016 and expanding to 5.9% by 2021 (Figure 8), encompasses areas where either a low ESV coincides with a low LERI (L-L) or a high ESV coexists with a high LERI (H-H). Spatially, as visualized in Figure 8, this zone type is more fragmented and dispersed across the landscape, with an increased presence in the central and southeastern parts of the study area in 2021. These zones represent areas with either low service and low risk, or high service facing high risk.
Sustainable development zone (M-M): The sustainable development zone, characterized by a moderate ESV and moderate LERI, is primarily located in the central valley region of Chongli (Figure 8). This zone, which decreased in area from 14.0% to 7.1% between 2016 and 2021, spatially corresponds to areas that exhibit intermediate levels for both their ESV and LERI (Figure 4 and Figure 5). As the main area for urban development and human activities, as evident in Figure 8, this zone represents areas where development pressures and ecological values are both moderate.

4. Discussion

This study presents an integrated approach to ecological management zoning by rigorously examining the interplay between the ecosystem service value (ESV) and Landscape Ecological Risk Index (LERI) within the ecologically sensitive core area of the 2022 Winter Olympics in Chongli, China. Leveraging Sentinel-2 imagery (with 10 m spatial resolution for key bands) from 2016 and 2021 and a spatially explicit 500 m × 500 m grid system for analysis, our analysis provides a nuanced understanding of the spatio-temporal dynamics of landscape ecological risk and ecosystem service provision in a region undergoing rapid development driven by a mega-event. The findings reveal not only significant land-use changes but, critically, demonstrate indicators that point towards a positive trajectory in the ecological condition of the study area (as measured by ESV and LERI), underscoring the potential effectiveness of strategically implemented ecological interventions even amidst large-scale infrastructural projects. This outcome challenges the often-assumed negative ecological impact of mega-events and offers valuable insights for sustainable development in similar contexts.

4.1. Land Use and Ecosystem Service Value Dynamics: Vegetation Restoration and Shifts as Key Drivers

Our analysis revealed a notable expansion of shrub-grassland and deciduous broad-leaf forest cover between 2016 and 2021, alongside a significant decrease in deciduous coniferous forest and the elimination of cropland. These complex shifts directly contributing to the observed 4.6% increase in the total ESV. Shrub-grasslands, the dominant land cover type, exhibited the most substantial ESV contribution, emphasizing their critical role in this region. This is likely due to their effectiveness in providing key regulating services such as carbon sequestration, soil stabilization on slopes, and watershed protection in this mountainous terrain [38]. The increase in deciduous broad-leaf forests further enhanced the ESV, particularly in terms of climate regulation and habitat provision. The data indicate a complex scenario: a decrease in coniferous forest (−35.0%) but an increase in broad-leaf forest (+11.27%) and a large increase in shrub-grassland (+12.75%). These changes suggest that targeted greening initiatives or vegetation restoration efforts were undertaken in preparation for the Winter Olympics [39]. This ESV growth, occurring concurrently with built-up land expansion, is a significant finding. It indicates that ecological restoration and specific vegetation planting efforts may have effectively counterbalanced or outweighed the typical ESV losses associated with urbanization and the loss of certain forest types [40]. The net increase in the ESV, despite the complete removal of cropland and reduction in coniferous forest, can be reconciled by examining the relative ESV coefficients (Table 1). LULC types such as shrub-grassland and broad-leaf forest possess substantially higher ESV coefficients per unit area for critical regulating and supporting services compared to cropland and, in some cases, coniferous forest. Therefore, the conversion of lower-ESV cropland and the partial replacement of coniferous forest with higher-ESV shrub-grassland and broad-leaf forest appear to be the primary drivers of the overall positive ESV trend, suggesting a potential strategic shift towards land cover types that are valued for their higher for non-provisioning services. However, the complete disappearance of cropland and the associated decline in provisioning services, particularly the food supply (18.4% decrease), warrants careful consideration. This highlights a potential trade-off: while regulating and supporting services improved, provisioning services from agriculture were diminished, emphasizing the need for integrated land-use planning that considers food security alongside ecological goals [41].

4.2. Landscape Ecological Risk Reduction: Evidence of Changes Indicating Enhanced Landscape Stability

The 12.3% reduction in high and moderate LERI areas from 2016 to 2021 provides evidence that is indicative of an improved landscape structure and potentially enhanced ecological stability in Chongli. This significant decrease in the Landscape Ecological Risk Index can potentially be attributed to the implementation of stringent land-use policies and proactive greening and restoration measures during the Olympic preparation phase [42]. These measures likely focused on vegetation restoration and minimizing the landscape fragmentation in specific areas, leading to enhanced landscape connectivity and resilience in parts of the study area [28]. The shift from the dominance of a moderate LERI in 2016 to a low LERI in 2021 indicates a fundamental change in the calculated risk profile of the region. This finding aligns with broader trends observed in Zhangjiakou [29] that suggest a consistent positive trajectory in ecological indicators. The observed increases in shrub-grassland and broad-leaf forest suggest vegetation planting programs. However, it is crucial to acknowledge the concurrent 143% increase in barren land, likely resulting from construction activities (venues, roads, ski slopes) or the clearing of areas for planting that were not yet fully vegetated by 2021. An overall reduction in the LERI occurred despite this increase in barren land, suggesting that the positive structural effects of consolidating larger patches of shrub-grassland and broad-leaf forest (reducing fragmentation, a key component of the LERI calculation) outweighed the negative impacts of increased barren land and coniferous forest loss at the scale of the entire study area. However, the localized persistence of a high LERI in the central valley and northwestern ski resort area, particularly around newly developed infrastructure hubs, is a critical point. This suggests that, while broad-scale LERI values improved, concentrated construction activities still generated localized ecological risks [43]. These areas require continued monitoring and targeted mitigation strategies to address the ongoing impacts of concentrated development.

4.3. ESV-LERI Correlation and Spatial Patterns: Reinforcing the Ecosystem Service-Risk Nexus

The consistently significant negative correlation between the ESV and LERI that was observed in this study aligns with findings from other landscape ecology research, suggesting that areas with higher ecosystem service values tend to exhibit lower ecological risks [21,44]. This inverse relationship underscores the inherent link between ecosystem health (as represented by the ESV) and resilience (as inversely represented by the LERI). Robust ecosystem services contribute to landscape stability, buffering areas against environmental stressors and reducing their ecological vulnerability [45]. Conversely, areas with degraded ecosystem services are inherently more susceptible to ecological risks, e.g., barren land is prone to erosion and fragmented habitats are more vulnerable to disturbance [46]. Spatially, the concentration of low ESVs and a high LERI in the central valley, coinciding with built-up areas and intensive land use, and the inverse pattern in mountainous regions with forests and shrub-grasslands, further validates this relationship within the study area. The slight weakening of the negative correlation from 2016 to 2021, although it was still significant, could reflect the complex and potentially non-linear responses of ecological systems to both restoration efforts and ongoing development pressures [39].

4.4. Olympic Construction as an Ecological Catalyst: Considering the Role of Mega-Event Driven Greening

A key and somewhat paradoxical finding of this study is that the period encompassing intensive construction activities associated with the Winter Olympics coincided with measurable improvements in overall ESV and LERI indicators within the core study area. Large-scale greening initiatives, reported to cover substantial areas (e.g., the 30,000 hectares mentioned in the regional context for Chongli District) [47], were implemented as part of the Olympic preparations. While our specific study area covers approximately 8067 hectares, the observed increase in shrub-grassland and broad-leaf forest within this zone is consistent with the aims of these broader regional programs and likely a primary driver of the calculated ESV increase and LERI reduction, despite the concurrent decrease in coniferous forest area [47,48]. These projects likely aimed to enhance the biodiversity, improve the soil health, and stabilize the local microclimates of the region [48]. This case study provides empirical data which suggests the potential for “ecological leverage” in mega-event planning [49]. When strategically planned with ecological considerations being integrated from the outset, mega-events might, in specific contexts, drive significant environmental improvements, challenging the conventional narrative of solely negative ecological consequences. Sustainability in event planning is increasingly recognized [50], and Chongli’s experience offers a case study on the potential for mega-events to serve as opportunities for regional ecological enhancement, setting a precedent for future large-scale developments in ecologically sensitive regions. However, it is crucial to acknowledge the trade-offs that were observed, such as the loss of cropland and coniferous forest and the increase in barren land.

4.5. Management Implications for Sustainable Development: Towards an Integrated Zoning Framework

The observed LERI reduction and ESV enhancement, both spatially and statistically validated within this study, support the consideration of integrated ecological frameworks in large-scale development projects, particularly the ecological management zoning (EMZ) approach presented in Figure 8. Policymakers could benefit from exploring similar integrative strategies that prioritize a balanced approach to development and ecological sustainability, especially in ecologically vulnerable regions like Chongli [51]. Drawing directly from our zoning framework and findings, we propose the following key management strategies, which are tailored to each EMZ, while acknowledging that these zones are derived from analysis at a 500 m grid resolution and serve as a strategic framework rather than definitive, fine-scale management prescriptions. Applying these requires further ground-truthing and the consideration of finer-scale ecological and socio-economic factors:
Zone-specific vegetation restoration (ecological restoration zone): Sustained and targeted investment in vegetation restoration, utilizing native species, is suggested, particularly within the ecological restoration zone (L-H). Despite its significant reduction, this zone requires ongoing, focused ecological rehabilitation to reverse past degradation and enhance ecosystem service delivery [52].
Stringent protection and land-use control (ecological protection zone): The rigorous enforcement of land-use regulations that prioritizes ecological preservation appears paramount for the ecological protection zone (H-L). Development should be strictly limited or prohibited in this zone to safeguard critical ecosystem services and maintain its high ecological value.
Adaptive monitoring and evaluation (all zones): Regular, multi-scale ecological monitoring that leverages remote sensing and spatial analytics complemented by field data is essential across all EMZs. The monitoring should be adaptive and zone-specific, tracking key ecological indicators that are relevant to each zone’s management objectives and providing timely data for adaptive management adjustments [53].
Community engagement and benefit sharing (all zones): The meaningful and sustained involvement of local communities in ecological management, coupled with equitable benefit sharing from ecosystem services, is vital for long-term stewardship. Community-based conservation approaches should be integrated into the management of all zones, ensuring local ownership and support for ecological goals [54]. Decisions based on ESVs, such as promoting land uses with higher calculated values, should carefully weigh potential trade-offs, like the impact on local agriculture or other traditional land uses, ensuring a balanced approach.
These integrated and zone-specific management strategies, directly informed by the ESV-LERI-based ecological management zoning developed in this study, are essential for achieving truly sustainable development in regions undergoing rapid socio-economic transformation like Chongli. They ensure that economic progress is aligned with, rather than at the expense of, long-term ecological health and resilience [55]. It is important to note that the adoption and practical implementation of this specific zoning framework by Chongli’s authorities were not assessed within this study, but the framework is proposed as a potentially valuable tool based on the research findings.

4.6. Limitations and Future Research: Refining Methodologies and Expanding Scope

While this study provides valuable insights, certain methodological limitations warrant acknowledgement. The reliance on Sentinel-2 imagery, providing 10 m resolution for key spectral bands, while advantageous for broad-scale analysis, was aggregated to 500 m × 500 m grid cells for the ESV and LERI calculations. This aggregation inevitably led to a loss of spatial detail and may not fully capture fine-scale ecological variations, particularly when applied to heterogeneous landscapes. Future research should incorporate higher-resolution data (e.g., drone or aerial imagery) and field assessments to refine its LULC classification and LERI assessments, especially in areas with complex topography and land cover [56]. Furthermore, the ESV assessment conducted herein, based on the benefit transfer method and standardized valuation coefficients, may not fully reflect the nuanced local socio-economic and cultural contexts of Chongli. Integrating participatory approaches and local ecological knowledge into ESV assessments could enhance the accuracy and relevance of valuation estimates [57]. Expanding the temporal scope beyond 2016–2021 to include pre-Olympic baseline data and long-term post-Olympic monitoring would provide a more comprehensive understanding of ecological dynamics and the long-term sustainability of implemented management practices [58]. Future research could also delve deeper into the specific mechanisms driving the ESV–LERI relationship to explore the roles of landscape connectivity, biodiversity, and specific ecosystem service trade-offs in influencing ecological risk [59]. Finally, investigating the socio-economic drivers of land-use change and their interactions with ecological outcomes (including impacts on local livelihoods from changes like cropland loss) would further enhance the policy relevance of this research, providing a more holistic understanding of the socio-ecological system in Chongli.

5. Conclusions

This study illustrates the application and potential utility of integrating the ecosystem service value (ESV) and Landscape Ecological Risk Index (LERI) in ecological management zoning, particularly within the context of large-scale infrastructural projects like the Winter Olympics preparations in Chongli. The observed positive trends—an increased ESV and reduced LERI between 2016 and 2021 in the study area– underscore the possibility of strategic ecological planning and greening initiatives contributing to enhanced regional ecological security and promoting sustainable human well-being, even amidst development pressures and complex land-use shifts including forest type changes and increases in barren land. The Chongli Winter Olympics core area serves as a compelling case study, illustrating how targeted ecological interventions may yield certain environmental benefits alongside developmental objectives and challenging conventional assumptions about the inevitability of negative ecological impacts of mega-events. However, this study also highlights potential trade-offs, such as the loss of agricultural land. While the LERI methodology aligned with established practices for weighting landscape indices, a limitation is noted in the reliance on these pre-defined weights; future research could explore more data-driven methods, such as sensitivity analyses or proportional area-based metrics, to further refine weight determination and enhance the site-specific robustness of the risk assessment underpinning the proposed zoning.
By employing a grid-based spatial analysis using Sentinel-2 imagery, this research emphasizes the critical importance of spatially explicit methodologies in assessing and managing complex ecological landscapes. The robust negative correlation between the ESV and LERI further reinforces the fundamental role that may be played by healthy ecosystem services in mitigating ecological risks and fostering resilient landscapes.
The findings of this study strongly support the consideration of integrative frameworks that effectively harmonize economic development with ecological sustainability. Such approaches are essential for navigating the complex challenges posed by rapid urbanization and industrialization, and ensuring that infrastructural advancements contribute to, rather than compromise, ecological integrity. Moving forward, the integrated assessment of the ESV and LERI, coupled with adaptive ecological management zoning, could potentially serve as a cornerstone for sustainable landscape management, providing a balanced and scientifically sound pathway for future development initiatives to achieve both environmental and socio-economic goals. While this study proposes such a zoning framework based on its findings, its practical consideration or adoption by management authorities was not evaluated here; however, it is recommended for use in the exploration of post-event planning and management, both in Chongli and other regions facing similar development challenges.
Based on this study’s findings, we reiterate the following key recommendations for policymakers and practitioners: (1) implement integrated ecological frameworks; (2) enhance targeted vegetation restoration and conservation efforts; (3) strengthen land-use regulations; (4) promote continuous multi-scale monitoring; (5) foster community engagement and consider socio-economic impacts; (6) expand the research on ESV-LERI dynamics and trade-offs. By proactively implementing these recommendations, regions undergoing rapid development can effectively pursue ecological sustainability, ensuring that their infrastructural growth contributes positively to both environmental health and long-term human well-being.

Author Contributions

Conceptualization, F.X. and X.W. (Xiyue Wang); methodology, F.X. and X.W. (Xiyue Wang); software, F.X.; validation, F.X.; formal analysis, F.X.; investigation, F.X.; resources, F.X. and X.W. (Xiyue Wang); data curation, F.X.; writing, F.X. and X.W. (Xiyue Wang); writing—review and editing, F.X., X.W. (Xiyue Wang) and S.Y.; visualization, F.X.; supervision, F.X., X.W. (Xiyue Wang), X.W. (Xiangrong Wang) and S.Y.; project administration, F.X., X.W. (Xiyue Wang) and X.W. (Xiangrong Wang); funding acquisition, F.X., X.W. (Xiyue Wang) and X.W. (Xiangrong Wang). All authors have read and agreed to the published version of the manuscript.

Funding

This research was financially supported by National key R&D Program of China “Urban Ecological Space Control and Layout Optimization Technology” (2022YFC3802603), MOE (Ministry of Education in China) Project of Humanities and Social Sciences (23YJCZH252) and the Fundamental Research Funds for the Central Universities (2024SKQ08).

Data Availability Statement

The raw data supporting the conclusions of this article will be made available by the authors on request.

Conflicts of Interest

The authors declare no conflicts of interest.

Appendix A

Table A1. Detailed ESVs in the study area from 2016 to 2021(Unit: CNY).
ES TypeSub-TypeShrub-GrasslandBarren LandDeciduous Broad-Leaf ForestDeciduous Coniferous ForestCroplandWater BodySum
20162021201620212016202120162021201620212016202120162021
Provisioning
Services
FS3,348,9533,775,99900718,085798,997359,238233,4641,474,4070211659305,902,7984,814,390
RMS4,935,2995,564,629001,634,2621,818,406849,108551,825693,838060817058,113,1167,936,565
WS273,20403,080,42000841,893936,755440,883286,52434,692021,92561,4534,071,4334,365,152
Regulating ServicesAQR17,361,67519,575,57111,56328,0995,373,2565,978,7002,775,9311,804,0421,162,17902036570826,686,64027,392,119
CR45,915,90351,770,9270016,095,00617,908,5488,278,8055,380,289624,4550605616,97670,920,22575,076,739
EP15,158,41717,091,36257,813140,4944,778,9795,317,4612,433,0221,581,189173,460014,67841,14222,616,36824,171,647
WFR33,665,78737,958,72217,34442,14811,736,97413,059,4645,453,8883,544,411468,3410270,394757,89351,612,72755,362,639
Supporting ServicesSC21,151,28023,848,41211,56328,0996,561,8107,301,1773,363,7752,186,0741,786,63402460689432,877,52133,370,655
NC1,586,3461,788,63100495,231551,032261,264169,792208,15201855192,551,1782,509,974
HQ19,212,41221,662,30711,56328,0995,967,5336,639,9383,069,8531,995,058225,4980674418,90328,493,60230,344,305
Cultural ServicesLA8,460,5129,539,365578114,0492,624,7242,920,4711,338,978870,185104,0760499914,01012,539,07013,358,080
(Abbreviations: food supply (FS), raw material supply (RMS), water supply (WS), air-quality regulation (AQR), climate regulation (CR), environmental purification (EP), regulation of water flows (WFR), soil conservation (SC), nutrient cycling (NC), habitat quality (HQ) and landscape aesthetics (LA).).

References

  1. Sarkodie, S.A.; Owusu, P.A.; Leirvik, T. Global effect of urban sprawl, industrialization, trade and economic development on carbon dioxide emissions. Env. Res. Lett. 2020, 15, 34049. [Google Scholar] [CrossRef]
  2. Haase, D.; Larondelle, N.; Andersson, E.; Artmann, M.; Borgström, S.; Breuste, J.; Gomez-Baggethun, E.; Gren, Å.; Hamstead, Z.; Hansen, R.; et al. A quantitative review of urban ecosystem service assessments: Concepts, models, and implementation. Ambio 2014, 43, 413–433. [Google Scholar] [CrossRef] [PubMed]
  3. Liu, G.; Bian, S.; Lu, X. Green technologies behind the Beijing 2022 Olympic and Paralympic winter games. Env. Sci. Ecotechnol. 2023, 16, 100262. [Google Scholar] [CrossRef] [PubMed]
  4. Costanza, R.; d’Arge, R.; De Groot, R.; Farber, S.; Grasso, M.; Hannon, B.; Limburg, K.; Naeem, S.; O’Neill, R.V.; Paruelo, J.; et al. The value of the world’s ecosystem services and natural capital. Nature 1997, 387, 253–260. [Google Scholar] [CrossRef]
  5. Hamel, P.; Guerry, A.D.; Polasky, S.; Han, B.; Douglass, J.A.; Hamann, M.; Janke, B.; Kuiper, J.J.; Levrel, H.; Liu, H.; et al. Mapping the benefits of nature in cities with the InVEST software. Npj Urban Sustain. 2021, 1, 25. [Google Scholar] [CrossRef]
  6. Bagstad, K.J.; Johnson, G.W.; Voigt, B.; Villa, F. Spatial dynamics of ecosystem service flows: A comprehensive approach to quantifying, mapping, and modeling. Ecosyst. Serv. 2013, 4, 117–125. [Google Scholar] [CrossRef]
  7. Hein, L.; Van Koppen, K.; De Groot, R.S.; Van Ierland, E.C. Spatial scales, stakeholders and the valuation of ecosystem services. Ecol. Econ. 2006, 57, 209–228. [Google Scholar] [CrossRef]
  8. Schröter, M.; Van der Zanden, E.H.; Van Oudenhoven, A.P.; Remme, R.P.; Serna-Chavez, H.M.; De Groot, R.S.; Opdam, P. Ecosystem services as a contested concept: A synthesis of critique and counter-arguments. Conserv. Lett. 2014, 7, 514–523. [Google Scholar] [CrossRef]
  9. Ran, P.; Hu, S.; Frazier, A.E.; Qu, S.; Yu, D.; Tong, L. Exploring changes in landscape ecological risk in the Yangtze River Economic Belt from a spatiotemporal perspective. Ecol. Indic. 2022, 137, 108744. [Google Scholar] [CrossRef]
  10. Zou, Y.; Wang, S.; Luo, X.; Jin, H.; Xiao, X.; Li, Y. A new multivariate index for ecological. Sustain. Cities Soc. 2024, 364, 105442. [Google Scholar]
  11. Verburg, P.H.; Soepboer, W.; Veldkamp, A.; Limpiada, R.; Espaldon, V.; Mastura, S.S.A. Modeling the spatial dynamics of regional land use: The CLUE-S model. Env. Manag. 2002, 30, 391–405. [Google Scholar] [CrossRef] [PubMed]
  12. Liao, G.; He, P.; Gao, X.; Lin, Z.; Huang, C.; Zhou, W.; Deng, O.; Xu, C.; Deng, L. Land use optimization of rural production–living–ecological space at different scales based on the BP–ANN and CLUE–S models. Ecol. Indic. 2022, 137, 108710. [Google Scholar] [CrossRef]
  13. Wang, L.; Ma, S.; Zhao, Y.; Zhang, J. Ecological restoration projects did not increase the value of all ecosystem services in Northeast China. Ecol. Manag. 2021, 495, 119340. [Google Scholar] [CrossRef]
  14. Sannigrahi, S.; Chakraborti, S.; Joshi, P.K.; Keesstra, S.; Sen, S.; Paul, S.K.; Kreuter, U.P.; Sutton, P.C.; Jha, S.; Dang, K.B. Ecosystem service value assessment of a natural reserve region for strengthening protection and conservation. J. Environ. Manag. 2019, 244, 208–227. [Google Scholar] [CrossRef]
  15. Jiang, W.; Lü, Y.; Liu, Y.; Gao, W. Ecosystem service value of the Qinghai-Tibet Plateau significantly increased during 25 years. Ecosyst. Serv. 2020, 44, 101146. [Google Scholar] [CrossRef]
  16. Shi, J.; Li, S.; Song, Y.; Zhou, N.; Guo, K.; Bai, J. How socioeconomic factors affect ecosystem service value: Evidence from China. Ecol. Indic. 2022, 145, 109589. [Google Scholar] [CrossRef]
  17. Xu, W.; Wang, J.; Zhang, M.; Li, S. Construction of landscape ecological network based on landscape ecological risk assessment in a large-scale opencast coal mine area. J. Clean. Prod. 2021, 286, 125523. [Google Scholar] [CrossRef]
  18. Luo, F.; Liu, Y.; Peng, J.; Wu, J. Assessing urban landscape ecological risk through an adaptive cycle framework. Landsc. Urban Plann. 2018, 180, 125–134. [Google Scholar] [CrossRef]
  19. Du, L.; Dong, C.; Kang, X.; Qian, X.; Gu, L. Spatiotemporal evolution of land cover changes and landscape ecological risk assessment in the Yellow River Basin, 2015–2020. J. Env. Manag. 2023, 332, 117149. [Google Scholar] [CrossRef]
  20. Li, J.; Hu, D.; Wang, Y.; Chu, J.; Yin, H.; Ma, M. Study of identification and simulation of ecological zoning through integration of landscape ecological risk and ecosystem service value. Sustain. Cities Soc. 2024, 107, 105442. [Google Scholar] [CrossRef]
  21. Guo, H.; Cai, Y.; Li, B.; Yang, Z.; Liu, Y. An improved approach for evaluating landscape ecological risks and exploring its coupling coordination with ecosystem services. J. Env. Manag. 2023, 348, 119277. [Google Scholar] [CrossRef] [PubMed]
  22. Gong, J.; Cao, E.; Xie, Y.; Xu, C.; Li, H.; Yan, L. Integrating ecosystem services and landscape ecological risk into adaptive management: Insights from a semi-arid area, China. J. Environ. Manag. 2021, 288, 112417. [Google Scholar]
  23. Müller, M. What makes an event a mega-event? Definitions and sizes. Leis. Stud. 2015, 34, 627–642. [Google Scholar] [CrossRef]
  24. Preuss, H. The conceptualisation and measurement of mega sport event legacies. J. Sport Tour. 2007, 12, 207–228. [Google Scholar] [CrossRef]
  25. Belgiu, M.; Drăguţ, L. Random forest in remote sensing: A review of applications and future directions. ISPRS J. Photogramm. Remote Sens. 2016, 114, 24–31. [Google Scholar] [CrossRef]
  26. Gislason, P.O.; Benediktsson, J.A.; Sveinsson, J.R. Random forests for land cover classification. Pattern Recognit. Lett. 2006, 27, 294–300. [Google Scholar] [CrossRef]
  27. Congalton, R.G. A review of assessing the accuracy of classifications of remotely sensed data. Remote Sens. Environ. 1991, 37, 35–46. [Google Scholar] [CrossRef]
  28. Xie, G.; Zhang, C.; Zhen, L.; Zhang, L. Dynamic changes in the value of China’s ecosystem services. Ecosyst. Serv. 2017, 26, 146–154. [Google Scholar] [CrossRef]
  29. Li, M.; Zhang, L.; Chen, Y.; Liu, S.; Cai, M.; Sun, Q. Construction of Landscape Ecological Risk Collaborative Management Network in Mountainous Cities—A Case Study of Zhangjiakou. Land 2024, 13, 1586. [Google Scholar] [CrossRef]
  30. Ai, J.; Yu, K.; Zeng, Z.; Yang, L.; Liu, Y.; Liu, J. Assessing the dynamic landscape ecological risk and its driving forces in an island city based on optimal spatial scales: Haitan Island, China. Ecol. Indic. 2022, 137, 108771. [Google Scholar] [CrossRef]
  31. Chen, J.; Yang, Y.; Feng, Z.; Huang, R.; Zhou, G.; You, H.; Han, X. Ecological risk assessment and prediction based on scale optimization—A case study of Nanning, a landscape garden city in China. Remote Sens. 2023, 15, 1304. [Google Scholar] [CrossRef]
  32. McGarigal, K. FRAGSTATS: Spatial Pattern Analysis Program for Quantifying Landscape Structure; US Department of Agriculture: Washington DC, USA; Forest Service: Missoula, MT, USA; Pacific Northwest Research Station: Portland, OR, USA, 1995; Volume 351. [Google Scholar]
  33. Fardila, D.; Kelly, L.T.; Moore, J.L.; McCarthy, M.A. A systematic review reveals changes in where and how we have studied habitat loss and fragmentation over 20 years. Biol. Conserv. 2017, 212, 130–138. [Google Scholar] [CrossRef]
  34. Banks-Leite, C.; Ewers, R.M.; Folkard-Tapp, H.; Fraser, A. Countering the effects of habitat loss, fragmentation, and degradation through habitat restoration. One Earth 2020, 3, 672–676. [Google Scholar] [CrossRef]
  35. Yu, J.; Tang, B.; Chen, Y.; Zhang, L.; Nie, Y.; Deng, W. Landscape ecological risk assessment and ecological security pattern construction in landscape resource-based city: A case study of Zhangjiajie City. Acta Ecol. Sin. 2022, 42, 1290–1299. [Google Scholar]
  36. Chen, X.; Xie, G.; Zhang, J. Landscape ecological risk assessment of land use changes in the coastal area of Haikou City in the past 30 years. Acta Ecol. Sin. 2021, 41, 975–986. [Google Scholar]
  37. Anselin, L.; Syabri, I.; Kho, Y. GeoDa: An introduction to spatial data analysis. Geog. Anal. 2006, 38, 5–22. [Google Scholar] [CrossRef]
  38. Ma, Y.; Liu, Y.; López-Vicente, M.; Wu, G.L. Divergent shift of normal alpine meadow towards shrub and degraded meadows reduces soil water retention and storage capacity. J. Hydrol. 2023, 625, 130109. [Google Scholar] [CrossRef]
  39. Zhang, Y.; Xu, Z.; Wu, J. Influence of Beijing Winter Olympic Games construction on vegetation coverage around Zhangjiakou competition zone. Int. J. Environ. Res. Public Health 2021, 18, 12777. [Google Scholar] [CrossRef]
  40. Wang, Z.; Zhang, L.; Li, X.; Li, Y.; Fu, B. Integrating ecosystem service supply and demand into ecological risk assessment: A comprehensive framework and case study. Landsc. Ecol. 2021, 36, 2977–2995. [Google Scholar] [CrossRef]
  41. Li, Z.; Cheng, X.; Han, H. Future impacts of land use change on ecosystem services under different scenarios in the ecological conservation area, Beijing, China. Forests 2020, 11, 584. [Google Scholar] [CrossRef]
  42. Cheng, Y.; Wu, H.; Yang, B. Conserving habitat and ecosystem in protected areas amid increasing intensive human modification: A case study of China’s Pan-Pearl River Delta. Ecol. Indic. 2023, 154, 110799. [Google Scholar] [CrossRef]
  43. Zhang, W.; Chang, W.; Zhu, Z.; Hui, Z. Landscape ecological risk assessment of Chinese coastal cities based on land use change. Appl. Geogr. 2020, 117, 102174. [Google Scholar] [CrossRef]
  44. Abson, D.J.; Termansen, M. Valuing ecosystem services in terms of ecological risks and returns. Conserv. Biol. 2011, 25, 250–258. [Google Scholar] [CrossRef] [PubMed]
  45. Keyes, A.A.; McLaughlin, J.P.; Barner, A.K.; Dee, L.E. An ecological network approach to predict ecosystem service vulnerability to species losses. Nat. Commun. 2021, 12, 1586. [Google Scholar] [CrossRef]
  46. Jiang, H.; Peng, J.; Dong, J.; Zhang, Z.; Xu, Z.; Meersmans, J. Linking ecological background and demand to identify ecological security patterns across the Guangdong-Hong Kong-Macao Greater Bay Area in China. Landsc. Ecol. 2021, 36, 2135–2150. [Google Scholar] [CrossRef]
  47. Bastin, J.F.; Finegold, Y.; Garcia, C.; Mollica, G.; Rezende, M.; Routh, D.; Zohner, C.M.; Crowther, T.W. The global tree restoration potential. Science 2019, 365, 76–79. [Google Scholar] [CrossRef]
  48. Fu, B.; Liu, Y.; Meadows, M.E. Ecological restoration for sustainable development in China. Natl. Sci. Rev. 2023, 10, nwad033. [Google Scholar] [CrossRef] [PubMed]
  49. Mitchell, M.G.; Devisscher, T. Strong relationships between urbanization, landscape structure, and ecosystem service multifunctionality in urban forest fragments. Landsc. Urban Plann. 2022, 228, 104548. [Google Scholar] [CrossRef]
  50. Backman, K.F. Event management research: The focus today and in the future. Tour. Manag. Perspect. 2018, 25, 169–171. [Google Scholar] [CrossRef]
  51. Selin, N.E.; Giang, A.; Clark, W.C. Progress in modeling dynamic systems for sustainable development. PNAS 2023, 120, e2216656120. [Google Scholar] [CrossRef]
  52. Littles, C.; Karnezis, J.; Blauvelt, K.; Creason, A.; Diefenderfer, H.; Johnson, G.; Krasnow, L.; Trask, P. Adaptive management of large-scale ecosystem restoration: Increasing certainty of habitat outcomes in the Columbia River estuary, USA. Restor. Ecol. 2022, 30, e13634. [Google Scholar] [CrossRef]
  53. Chen, W.; Gu, T.; Xiang, J.; Luo, T.; Zeng, J.; Yuan, Y. Ecological restoration zoning of territorial space in China: An ecosystem health perspective. J. Env. Manag. 2024, 364, 121371. [Google Scholar] [CrossRef] [PubMed]
  54. Berkes, F. Sacred Ecology; Routledge: Abingdon, UK, 2017. [Google Scholar]
  55. Agbedahin, A.V. Sustainable development, Education for Sustainable Development, and the 2030 Agenda for Sustainable Development: Emergence, efficacy, eminence, and future. Sustain. Dev. 2019, 27, 669–680. [Google Scholar] [CrossRef]
  56. Wu, J. Effects of changing scale on landscape pattern analysis: Implications for scaling relations. Landsc. Ecol. 2004, 19, 125–138. [Google Scholar] [CrossRef]
  57. Wilson, M.A.; Hoehn, J.P. Valuing environmental goods and services using benefit transfer: The state-of-the-art and science needs. Ecol. Econ. 2006, 60, 335–342. [Google Scholar] [CrossRef]
  58. Watts, K.; Whytock, R.C.; Park, K.J.; Fuentes-Montemayor, E.; Macgregor, N.A.; Duffield, S.; McGowan, P.J. Ecological time lags and the journey towards conservation success. Nat. Ecol. Evol. 2020, 4, 304–311. [Google Scholar] [CrossRef]
  59. Feng, Z.; Jin, X.; Chen, T.; Wu, J. Understanding trade-offs and synergies of ecosystem services to support the decision-making in the Beijing–Tianjin–Hebei region. Land Use Policy 2021, 106, 105446. [Google Scholar] [CrossRef]
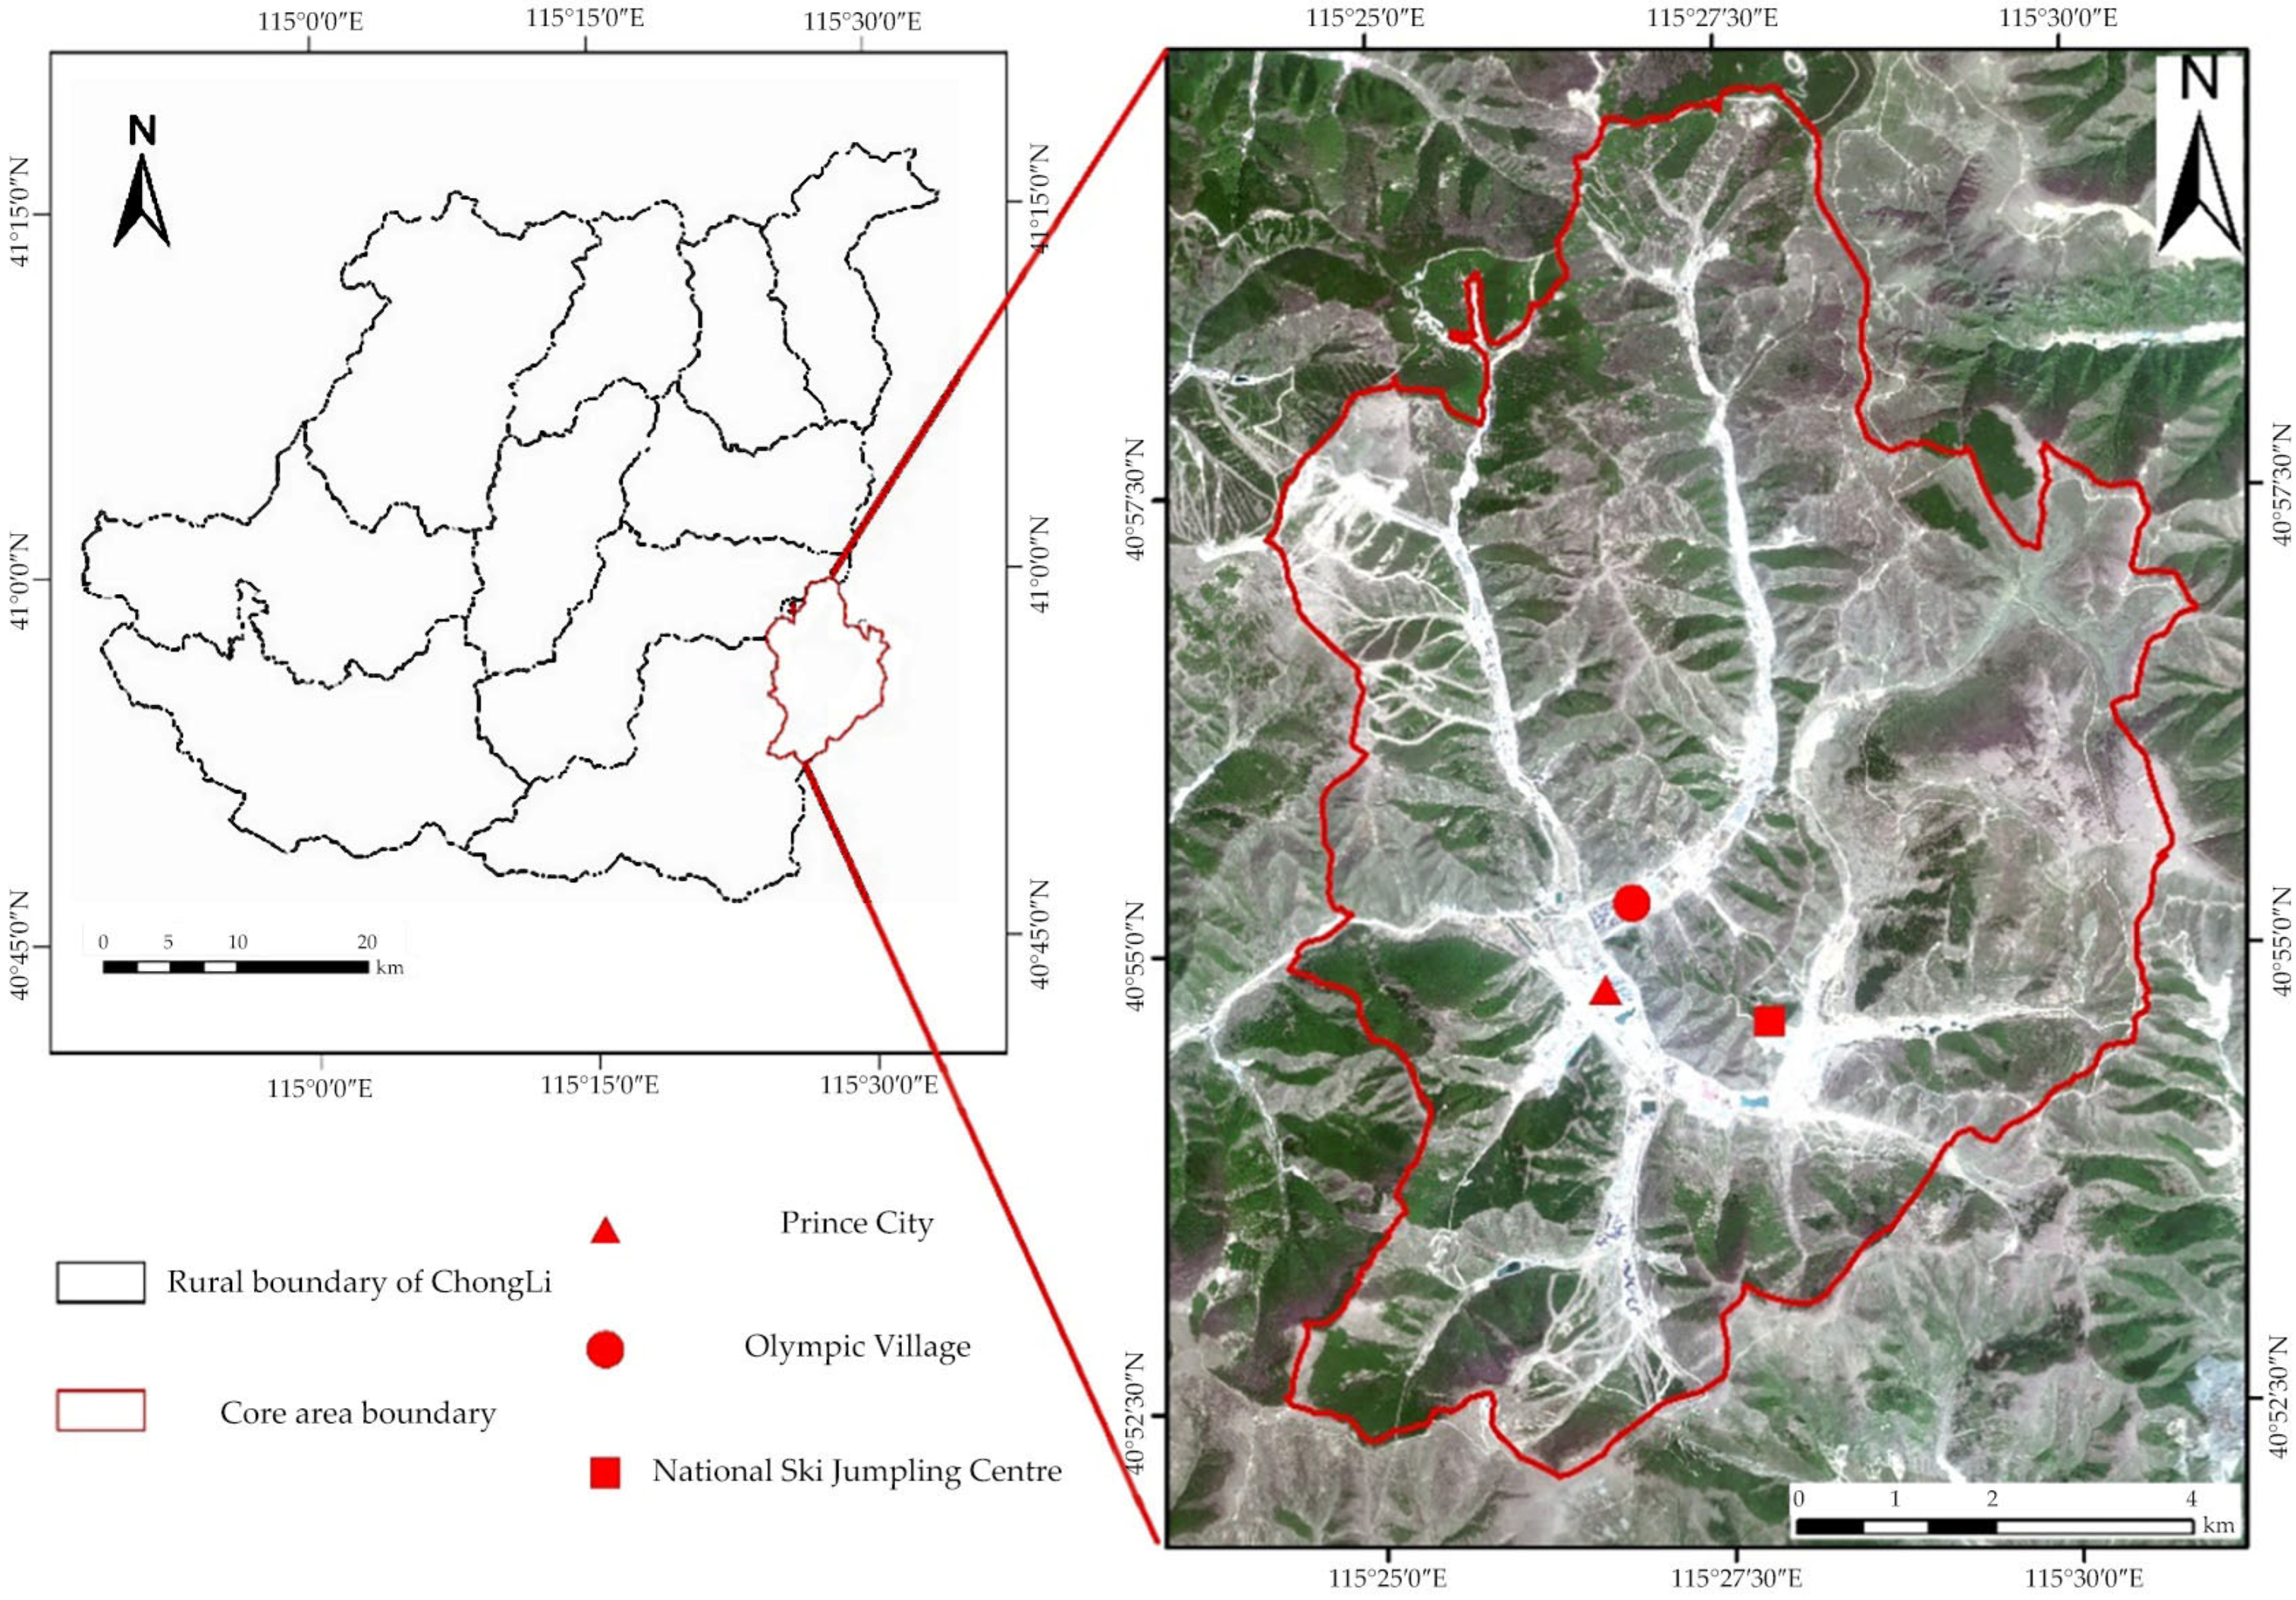
Figure 1. Overview of the study area.
Land 14 01133 g001
Figure 2. Land-use map of the study area.
Land 14 01133 g002
Figure 3. Sankey diagram of land-use transfer matrix from 2016 to 2021 (unit: hm2).
Land 14 01133 g003
Figure 4. The spatial distribution of ESVs in the study area from 2016 to 2021.
Land 14 01133 g004
Figure 5. The spatial distribution of LERI in the study area from 2016 to 2021.
Land 14 01133 g005
Figure 6. The Spearman correlation coefficient between the ESV and LERI in the study area from 2016 to 2021 (Abbreviations: food supply (FS), raw material supply (RMS), water supply (WS), air-quality regulation (AQR), climate regulation (CR), environmental purification (EP), regulation of water flows (WFR), soil conservation (SC), nutrient cycling (NC), habitat quality (HQ), and landscape aesthetics (LA)).
Land 14 01133 g006
Figure 7. LISA cluster map of ESV and LERI in the study area from 2016 to 2021. (Abbreviations: food supply (FS), raw material supply (RMS), water supply (WS), air-quality regulation (AQR), climate regulation (CR), environmental purification (EP), regulation of water flows (WFR), soil conservation (SC), nutrient cycling (NC), habitat quality (HQ), and landscape aesthetics (LA).).
Land 14 01133 g007
Figure 8. Ecological management zones (EMZs) in the study area, based on the integration of ESV and LERI data.
Land 14 01133 g008
Table 1. The ecosystem service value coefficient for land-use types in the study area (CNY/hm2).
ES TypeES Sub-TypeShrub-GrasslandBarren LandDeciduous Broad-Leaf ForestDeciduous Coniferous ForestCroplandWater Body
Provisioning
Services
FS733.57 0.00 559.83 424.70 1640.87 1544.35
RMS1081.05 0.00 1274.09 1003.83 772.18 444.00
WS598.44 0.00 656.35 521.22 38.61 16,003.34
Regulating ServicesAQR3802.97 38.61 4189.05 3281.75 1293.39 1486.44
CR10,057.59 0.00 12,547.86 9787.33 694.96 4420.71
EP3320.36 193.04 3725.75 2876.35 193.04 10,713.94
WFR7374.28 57.91 9150.28 6447.67 521.22 197,368.12
Supporting ServicesSC4633.05 38.61 5115.66 3976.71 1988.35 1795.31
NC347.48 0.00 386.09 308.87 231.65 135.13
HQ4208.36 38.61 4652.36 3629.23 250.96 4922.62
Cultural ServicesLA1853.22 19.30 2046.27 1582.96 115.83 3648.53
(Abbreviations: food supply (FS), raw material supply (RMS), water supply (WS), air-quality regulation (AQR), climate regulation (CR), environmental purification (EP), regulation of water flows (WFR), soil conservation (SC), nutrient cycling (NC), habitat quality (HQ), and landscape aesthetics (LA).).
Table 2. Land-use area and change proportion from 2016 to 2021.
Land-Use TypeLand-Use Area (hm2)Change Proportion (%)
201620212016–2021
Deciduous coniferous forest845.87549.72−35.0
Deciduous broad-leaf forest1282.691427.2211.27
Shrub-grassland4565.35147.4512.75
Built-up area173.96211.3121.47
Water body1.473.84161.22
Barren land299.48727.78143.01
Cropland898.550−100
Table 3. ESVs of land-use types in the study area from 2016 to 2021.
YearShrub
-Grassland
Barren LandDeciduous Broad-Leaf ForestDeciduous Coniferous ForestCroplandWater BodySum
ESV (CNY)2016173,528,623.1 115,625.6 56,827,752.7 28,624,744.7 6,955,729.8 332,201.0 266,384,676.7
2021195,656,344.8 280,987.0 63,230,948.4 18,602,852.3 0931,132.6 278,702,265.0
ESV change (CNY) 2016–202122,127,721.7 165,361.4 6,403,195.7 −10,021,892.4 −6,955,729.8 598,931.6 12,317,588.2
Change proportion (%)2016–202112.8%143.0%11.3%−35.0%−100%180.3%4.6%
Table 4. ESV change in the study area from 2016 to 2021.
YearProvisioning
Services
Regulating ServicesSupporting
Services
Cultural ServicesTotal ESV
ESV (CNY)2016 18,087,346.1 171,835,960.3 63,922,300.612,539,069.8 266,384,676.7
2021 17,116,106.7 182,003,143.7 66,224,934.6 13,358,080.0 278,702,265.0
ESV change (CNY) 2016–2021−971,239.4 10,167,183.4 2,302,634.0 819,010.212,317,588.2
Change proportion (%)2016–2021−5.45.93.66.54.6
Table 5. ESV categories in the study area from 2016 to 2021.
YearLower ESVLow ESVModerate ESVHigh ESVHigher ESV
Area
(hm2)
Proportion (%)Area
(hm2)
Proportion (%)Area
(hm2)
Proportion (%)Area
(hm2)
Proportion (%)Area
(hm2)
Proportion (%)
20165,772,622.97.33,046,662.13.92,373,189.43.042,781,549.454.224,958,576.331.6
20215,483,991.77.02,565,610.23.33,118,819.84.043,807,793.455.523,956,384.930.4
2016–2021−288,631.1 −0.3−481,051.9 −0.6745,630.5 1.01,026,244.1 1.3−1,002,191.5−1.2
Table 6. LERI categories in the study area from 2016 to 2021.
YearLower LERILow LERIModerate LERIHigh LERIHigher LERI
Area
(hm2)
Proportion (%)Area
(hm2)
Proportion (%)Area
(hm2)
Proportion (%)Area
(hm2)
Proportion (%)Area
(hm2)
Proportion (%)
20163,669,260.1 4.65%16,556,157.3 20.98%28,329,561.7 35.89%15,867,271.7 20.10%14,510,349.3 18.38%
202116,442,717.7 20.83%34,533,799.5 43.75%21,907,719.7 27.75%4,848,488.6 6.14%1,199,874.5 1.52%
2016–202112,773,457.6 16.18%17,977,642.2 22.78%−6,421,842.0 −8.14%−11,018,783.1−13.96%−13,310,474.7−16.86%
Disclaimer/Publisher’s Note: The statements, opinions and data contained in all publications are solely those of the individual author(s) and contributor(s) and not of MDPI and/or the editor(s). MDPI and/or the editor(s) disclaim responsibility for any injury to people or property resulting from any ideas, methods, instructions or products referred to in the content.