1. Introduction
Tourism has become one of the primary driving forces for the development of many countries and regions [
1], while the rise of homestays has significantly influenced the fundamental dynamics of tourism markets globally [
2], with their role and prominence within the industry becoming increasingly vital. Consequently, a spatial distribution analysis of homestays is widely regarded as one of the most critical tasks in their regional development processes. Rural homestays, in particular, not only represent a supplement to and innovation in the traditional accommodation system but, more critically, serve as an essential catalyst for advancing rural tourism development [
3]. In China, rural homestays have become a significant sector driving tourism investment and leisure consumption in rural areas [
4].
The development of rural homestays exhibits diversified, personalized, and regionally distinct characteristics shaped by geographical and cultural contexts [
5]. In China, these establishments are formally defined as small-scale, experience-oriented accommodations situated in rural areas, utilizing underutilized resources such as local dwellings. Their operational paradigm emphasizes authentic immersion in rural landscapes, local customs, and cultural heritage [
6]. Following the emergence of specialized rural homestays circa 2000, China’s rural hospitality sector entered a phase of accelerated growth, culminating in over 210,000 operational units by 2022—constituting 87.98% of the nation’s total homestay inventory [
7] and establishing itself as a cornerstone industry within the tourism sector. Rural homestays demonstrate dual socioeconomic impacts: on one front, they activate broader tourist markets while maximizing the utilization of local resources to regenerate socioeconomic value from underused properties [
8], thereby directly contributing to rural revitalization and sustainable development [
9]; on another front, rural homestays have progressively emerged as both a preferred choice for domestic and international tourists to experience authentic Chinese rural culture and a novel impetus driving the high-quality development of regional tourism destinations [
10].
Rural homestays, characterized by small-scale operations and strong autonomy, demonstrate inherent flexibility and adaptability in spatial distribution while exhibiting cyclical and dynamic patterns temporally. Coupled with thriving internet platforms, these establishments achieve extensive geographical dispersion across vast rural territories [
11]. This operational flexibility introduces blind spots in site selection, resulting in uneven geographical distribution patterns [
12]. Functionally, rural homestays operate both as tourism-supporting facilities and distinct tourism products, exhibiting unique developmental patterns influenced by multifaceted factors such as tourism resource availability [
9]. The uneven distribution of tourism resources frequently leads to regional mismatches between supply and demand [
13]. Therefore, conducting a systematic analysis of rural homestays’ spatial distribution characteristics is imperative for optimizing market regulation and regional resource allocation. Investigating the development of rural homestays across temporal spans provides macro-level guidance for their long-term prosperity [
14]. According to Butler’s Tourism Area Life Cycle theory, the dynamics of development dictate distinct characteristics across each stage of the lifecycle. China’s rural homestay sector, characterized by a late inception and rapid growth within a compressed timeline, exhibits intense developmental fluctuations. However, the limited understanding of their spatial distribution across developmental stages constrains future progress, despite the acute challenges emerging from this accelerated trajectory [
15]. The spatiotemporal configuration of these accommodations exhibits clustering characteristics emblematic of the new hospitality paradigm driven by sharing economy principles and digital technologies, rendering their study uniquely positioned to capture region-specific tourism dynamics with enhanced precision. Investigating the spatial distribution patterns of rural homestays enables an examination of their alignment with core–periphery theory [
16] and spatial polarization theory [
17], facilitates the analysis of localized development mechanisms within regions, allows the assessment of spatial disparities in tourism development levels across regions, and further explores the evolutionary relationships between geographical elements—such as economic, demographic, and industrial factors—and the spatial dispersion–agglomeration dynamics of these accommodations [
18].
Existing research has extensively examined various factors influencing the spatial distribution of homestays, yet they predominantly address urban and rural homestays as an integrated entity when discussing distribution patterns and mechanisms [
19]. This approach creates critical gaps in explicating the agglomeration dynamics and determinant factors unique to rural homestay clusters. Empirical findings indicate that at the rural cluster scale, distinctive natural resources [
20] and cultural environments—contrasting with urban settings—foster homestay concentration [
21], particularly in tourism–resource-rich zones such as resort areas. Within the context of China, research predominantly operates at macro scales—provincial, municipal, or major scenic area levels [
22]. Notably, metropolitan peripheral rural regions exemplified by Beijing—areas experiencing intensive urban–rural factor mobility and substantial homestay development demand—remain understudied, despite China’s accelerating urban–rural integration. Field investigations in sampled regions reveal heightened homestay concentrations near transportation corridors, areas with abundant vacant dwellings, and localities exhibiting elevated economic indices, empirically validating transportation infrastructure and socioeconomic conditions as pivotal spatial determinants [
10].
Rural homestays exhibit distinct agglomeration characteristics across varying spatial scales, with multiple GIS spatial analysis methods [
23] providing multidimensional analytical perspectives to elucidate their distribution patterns and clustering intensities. The Geodetector method, a robust analytical tool embedded within GIS platforms, has gained extensive application in deciphering geographical phenomena and their determinants, particularly in environmental science, public health, resource management, and ecological risk assessments [
24]. Compared to alternative approaches like Random Forest and Geographically Weighted Regression (GWR) models for spatial determinant analysis, the Geodetector method excels in holistically integrating heterogeneous factors—including natural resources, historical–cultural elements, and economic development indicators—through a unified analytical framework to quantify their differential impacts on homestay distributions [
25,
26]. Beyond the Geodetector framework, the Nearest Neighbor Index method determines clustering typologies at both global and local scales, while the Kernel Density Estimation method reveals spatial concentration gradients of point data across study areas. A concentration zone analysis further identifies agglomeration intensities within medium–small zones, and the Standard Deviational Ellipse method captures directional dynamics in spatial configurations [
27]. The methodological integration of these techniques with Geodetector provides robust analytical support for deciphering the spatial distribution patterns and influencing mechanisms of rural homestays.
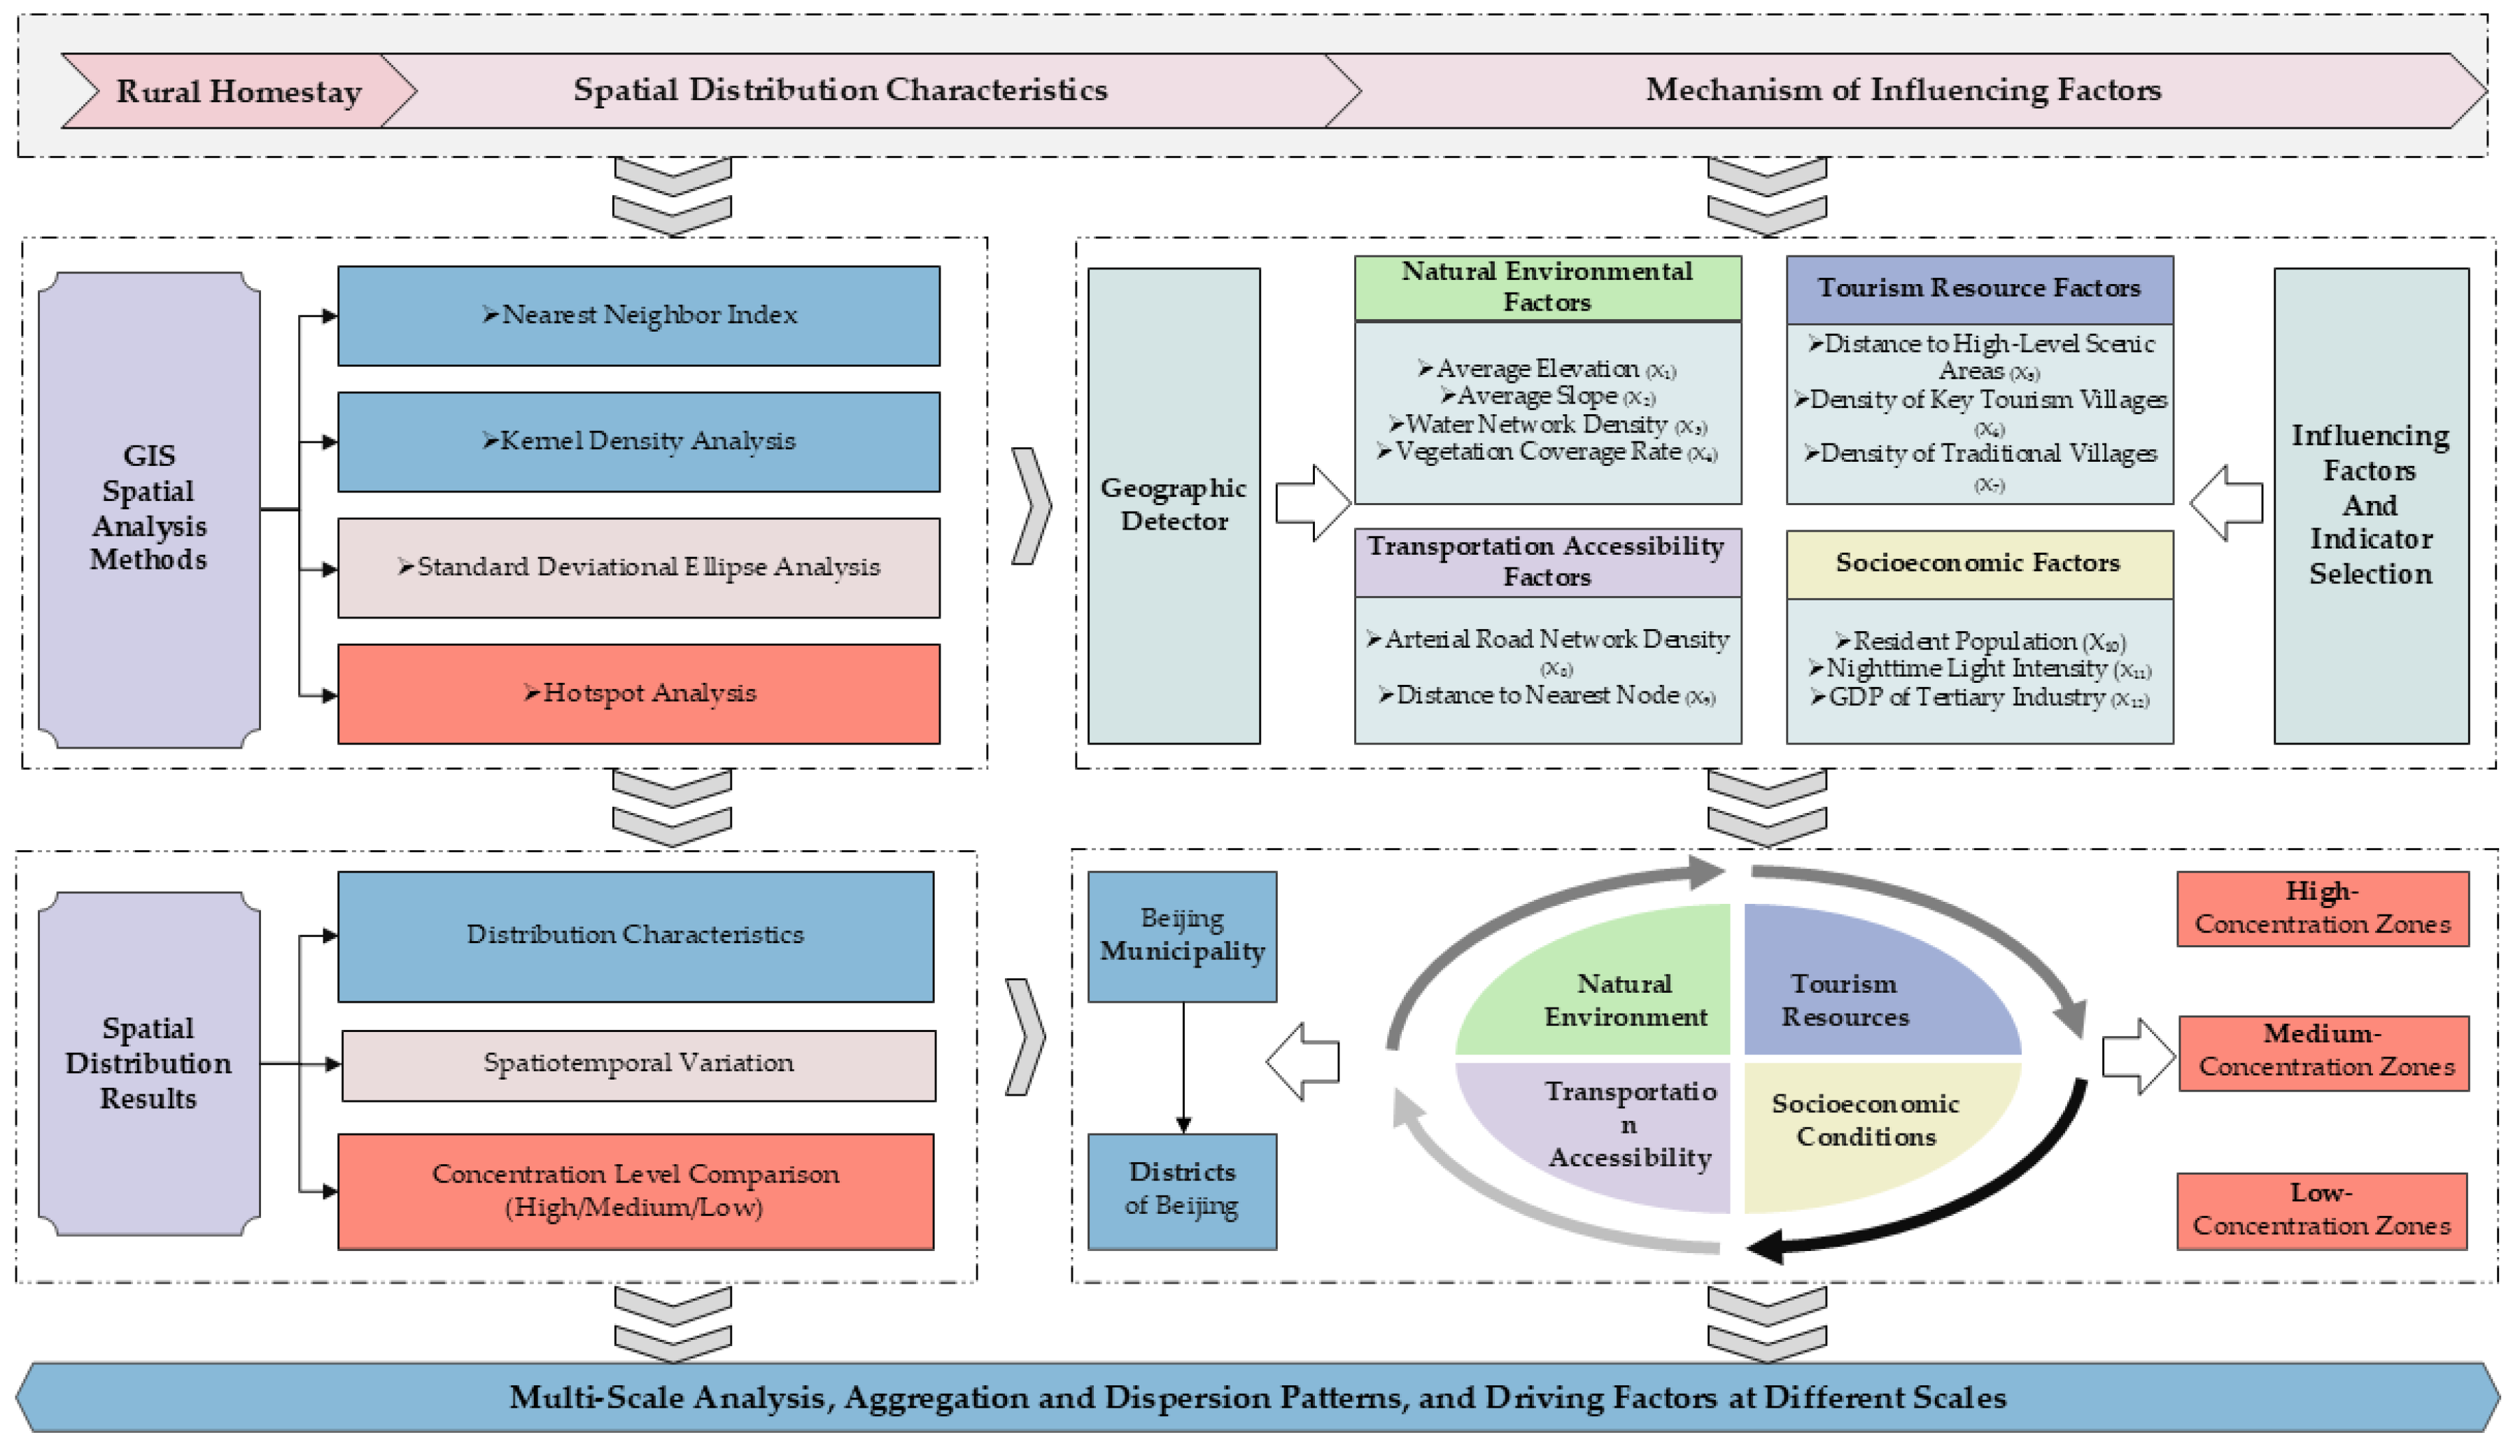
Most existing studies focus solely on broad spatial locational factors such as accessibility and service convenience, yet insufficient scholarly attention is given to the analysis of agglomeration effects and the integration of spatiotemporal distribution patterns [
28]. This study employs Beijing’s rural areas as a representative case, utilizing the Nearest Neighbor Index analysis, Kernel Density Estimation, Standard Deviational Ellipse, and Hotspot Analysis to delineate the spatiotemporal distribution patterns and typological characteristics of rural homestays. Through agglomeration intensity stratification, these accommodations are classified into a three-tiered concentration zone typology. The research constructs an analytical framework integrating spatial configuration and determinant factors, subsequently applying the Geodetector model to systematically examine quantitative distributions, typological variations, spatial allocation mechanisms, and interactive effects among influencing elements.
3. Results and Discussion
3.1. Spatial Distribution Pattern
3.1.1. Distribution Characteristics of Rural Lodging: Large-Scale Discrete and Small-Scale Agglomeration
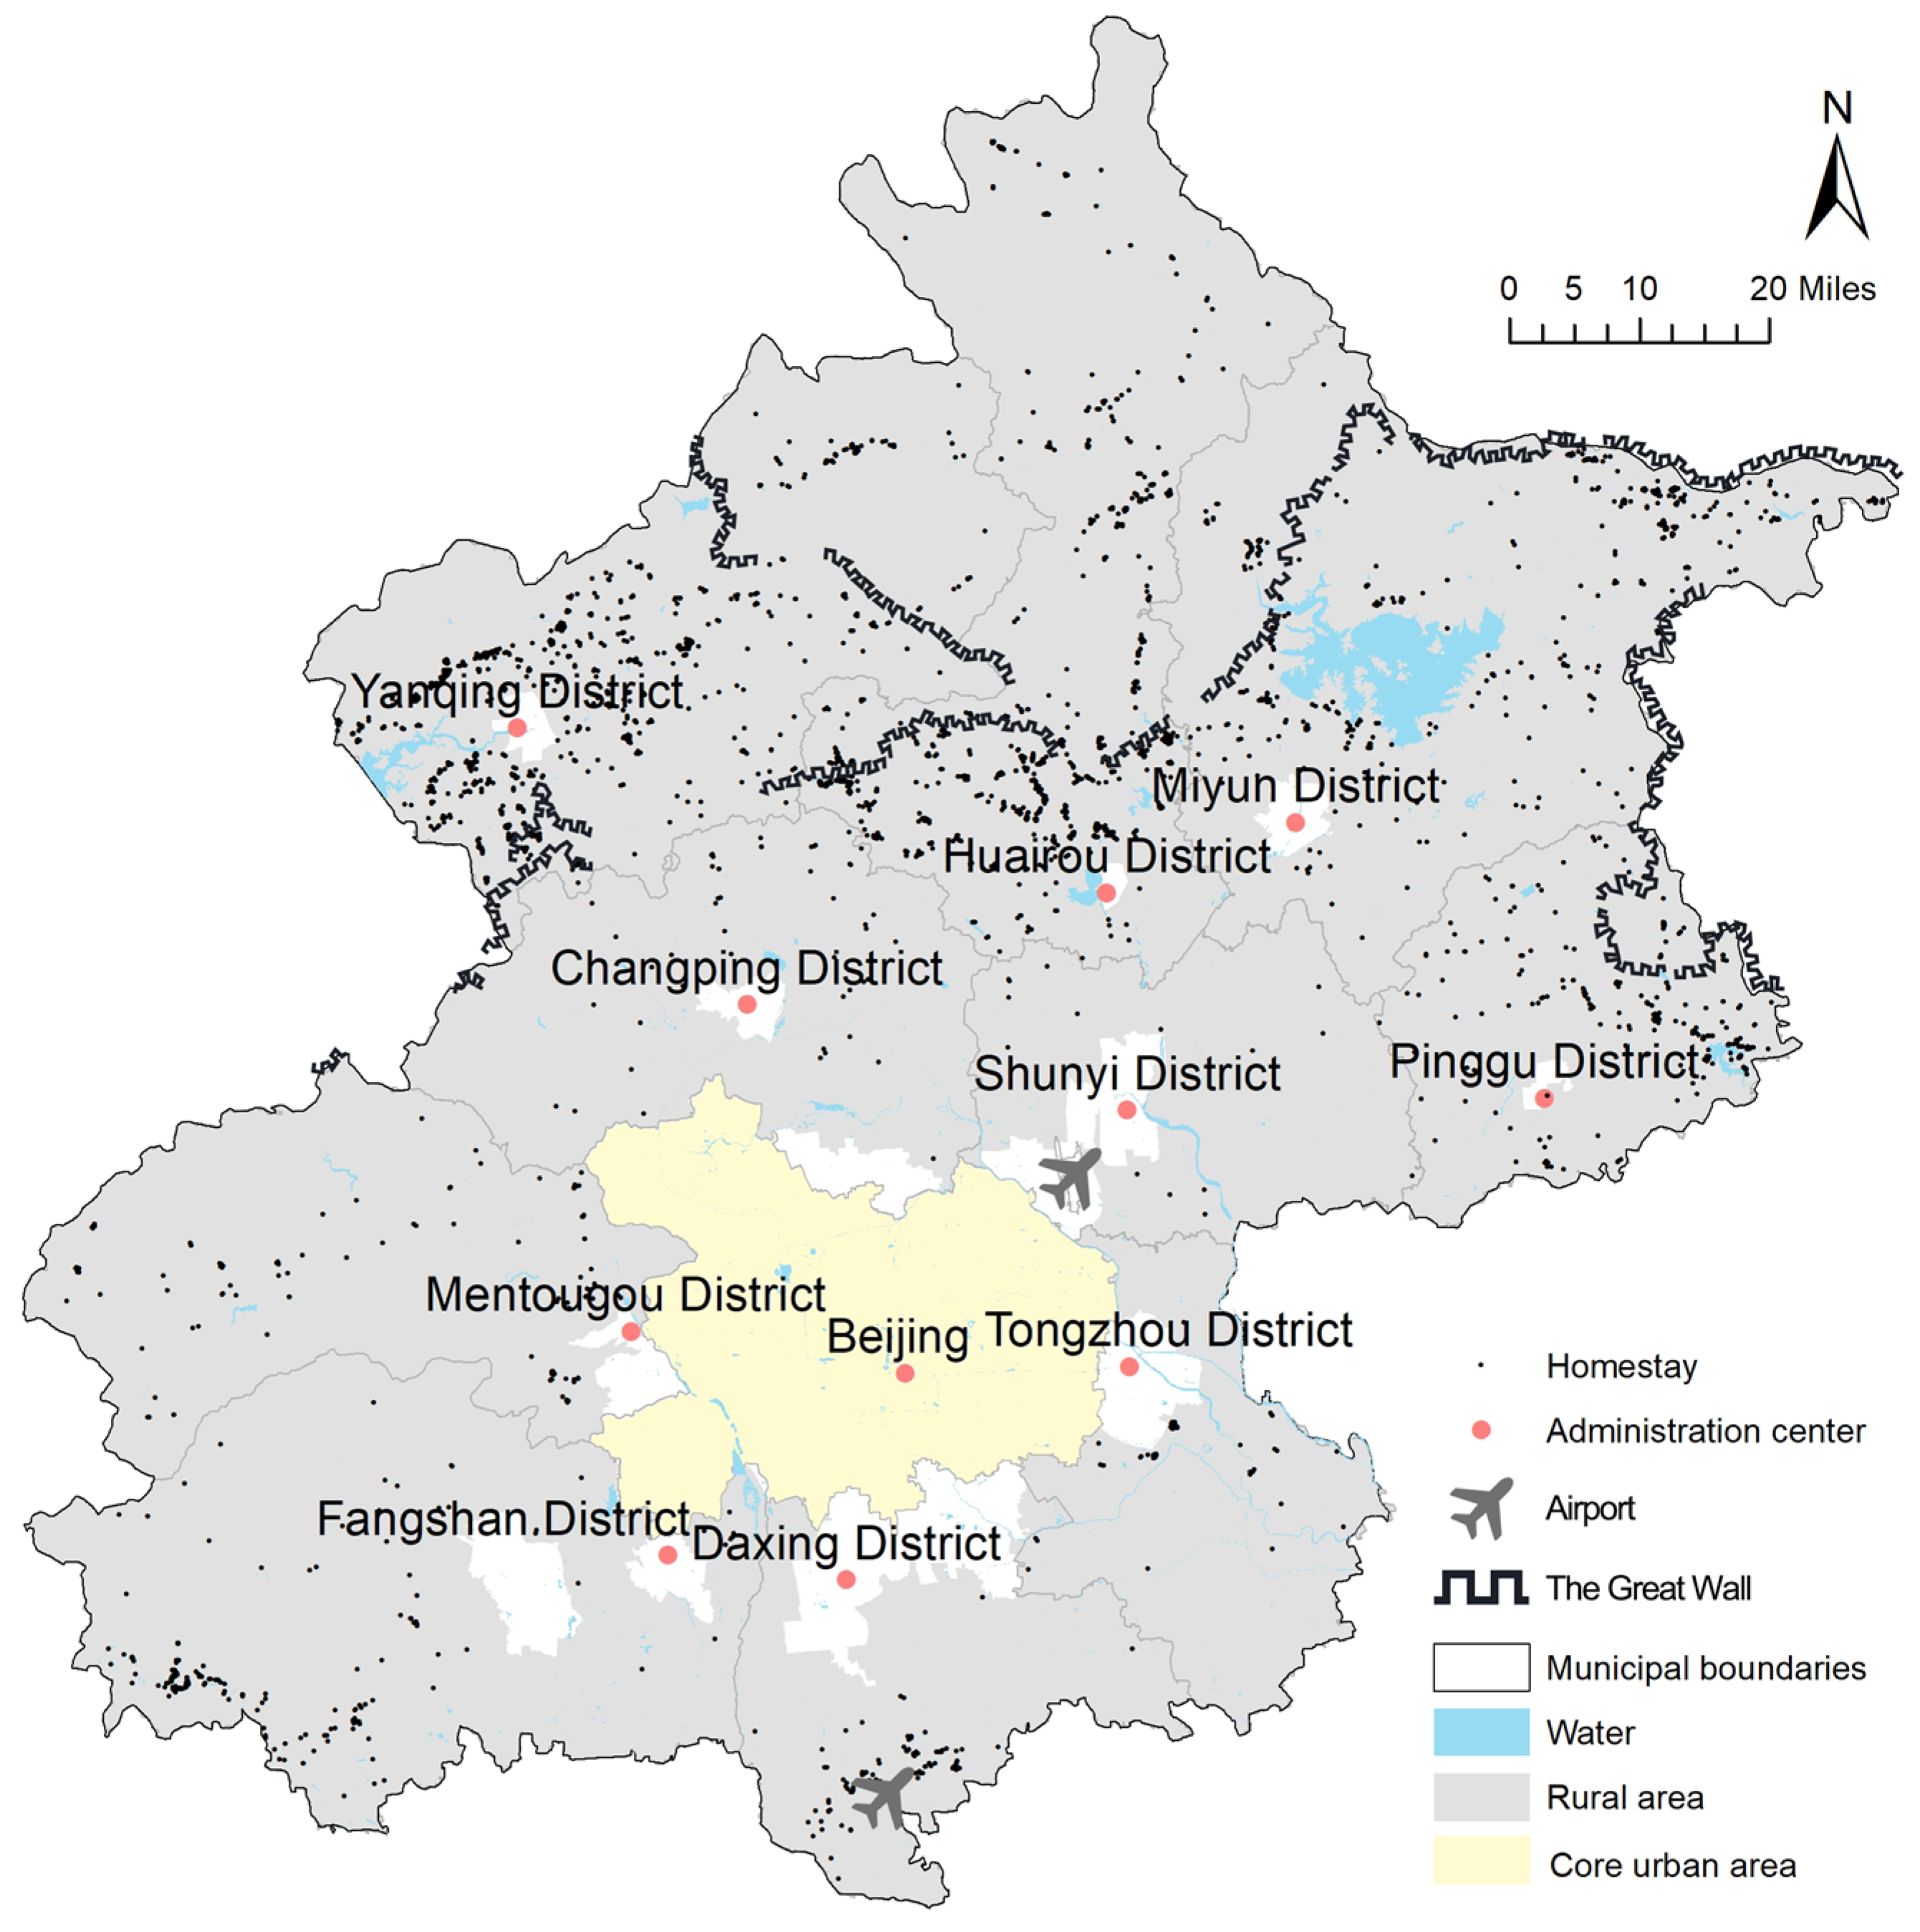
Through the statistics in
Table 3 on the spatial distribution of rural homestays in Beijing, it can be observed that Huairou District has the largest number (1186), accounting for 30.81% of the total, while Shunyi District has the smallest number (15). This significant variation highlights the uneven development across districts, contributing to the heterogeneous spatial distribution of rural homestays. Based on the spatial proximity of each district to Beijing’s core area, the rural regions can be categorized into peri-urban and far-urban areas. Peri-urban areas refer to those adjacent to the urban core, while far-urban areas are more distant. Although the number of far-urban areas (4) is fewer than that of peri-urban areas (6), the total number of homestays in far-urban areas (3088) is four times greater than in peri-urban areas (762). This indicates an uneven distribution of rural homestays and disparities in tourism development across regions in Beijing, with pronounced spatial heterogeneity. Rural homestays are primarily concentrated in mountainous areas distant from the city’s center of gravity. To further explore the spatial distribution characteristics of rural lodgings in Beijing, this study conducts a comprehensive analysis across multiple spatial scales.
The Nearest Neighbor Index analysis reveals discrete distribution patterns of rural homestays across Beijing’s administrative regions and its ten sub-districts, with all districts demonstrating statistically significant dispersion characteristics. The spatial distribution characteristics of rural homestays can be identified through the Nearest Neighbor Index (NNI) R-values. Shunyi District exhibits exceptionally high R-values due to its smaller homestay sample size, resulting in significantly greater spatial dispersion. At the macro scale, rural homestays lack dominant agglomeration cores, failing to form cohesive clusters even at municipal or district administrative levels. This is corroborated by observed average nearest neighbor distances consistently below the expected values, indicating localized multi-point clustering amidst macro-scale dispersion. Notably, interregional distance differentials vary dramatically—a phenomenon directly correlated with magnitude disparities between the study area dimensions and homestay quantity distributions.
To unveil spatial heterogeneity in Beijing’s rural homestay distribution, this study employs the Kernel Density Estimation method for an in-depth spatial pattern analysis (
Figure 3). The spatial analysis demonstrates findings while exhibiting macro-scale dispersion, and localized clustering emerges prominently in northern suburban districts (Yanqing, Huairou, and Miyun), with density levels significantly surpassing those of southern counterparts, corroborating the Nearest Neighbor Index results.
3.1.2. Time-Varying Characteristics: Expansion Followed by Contraction
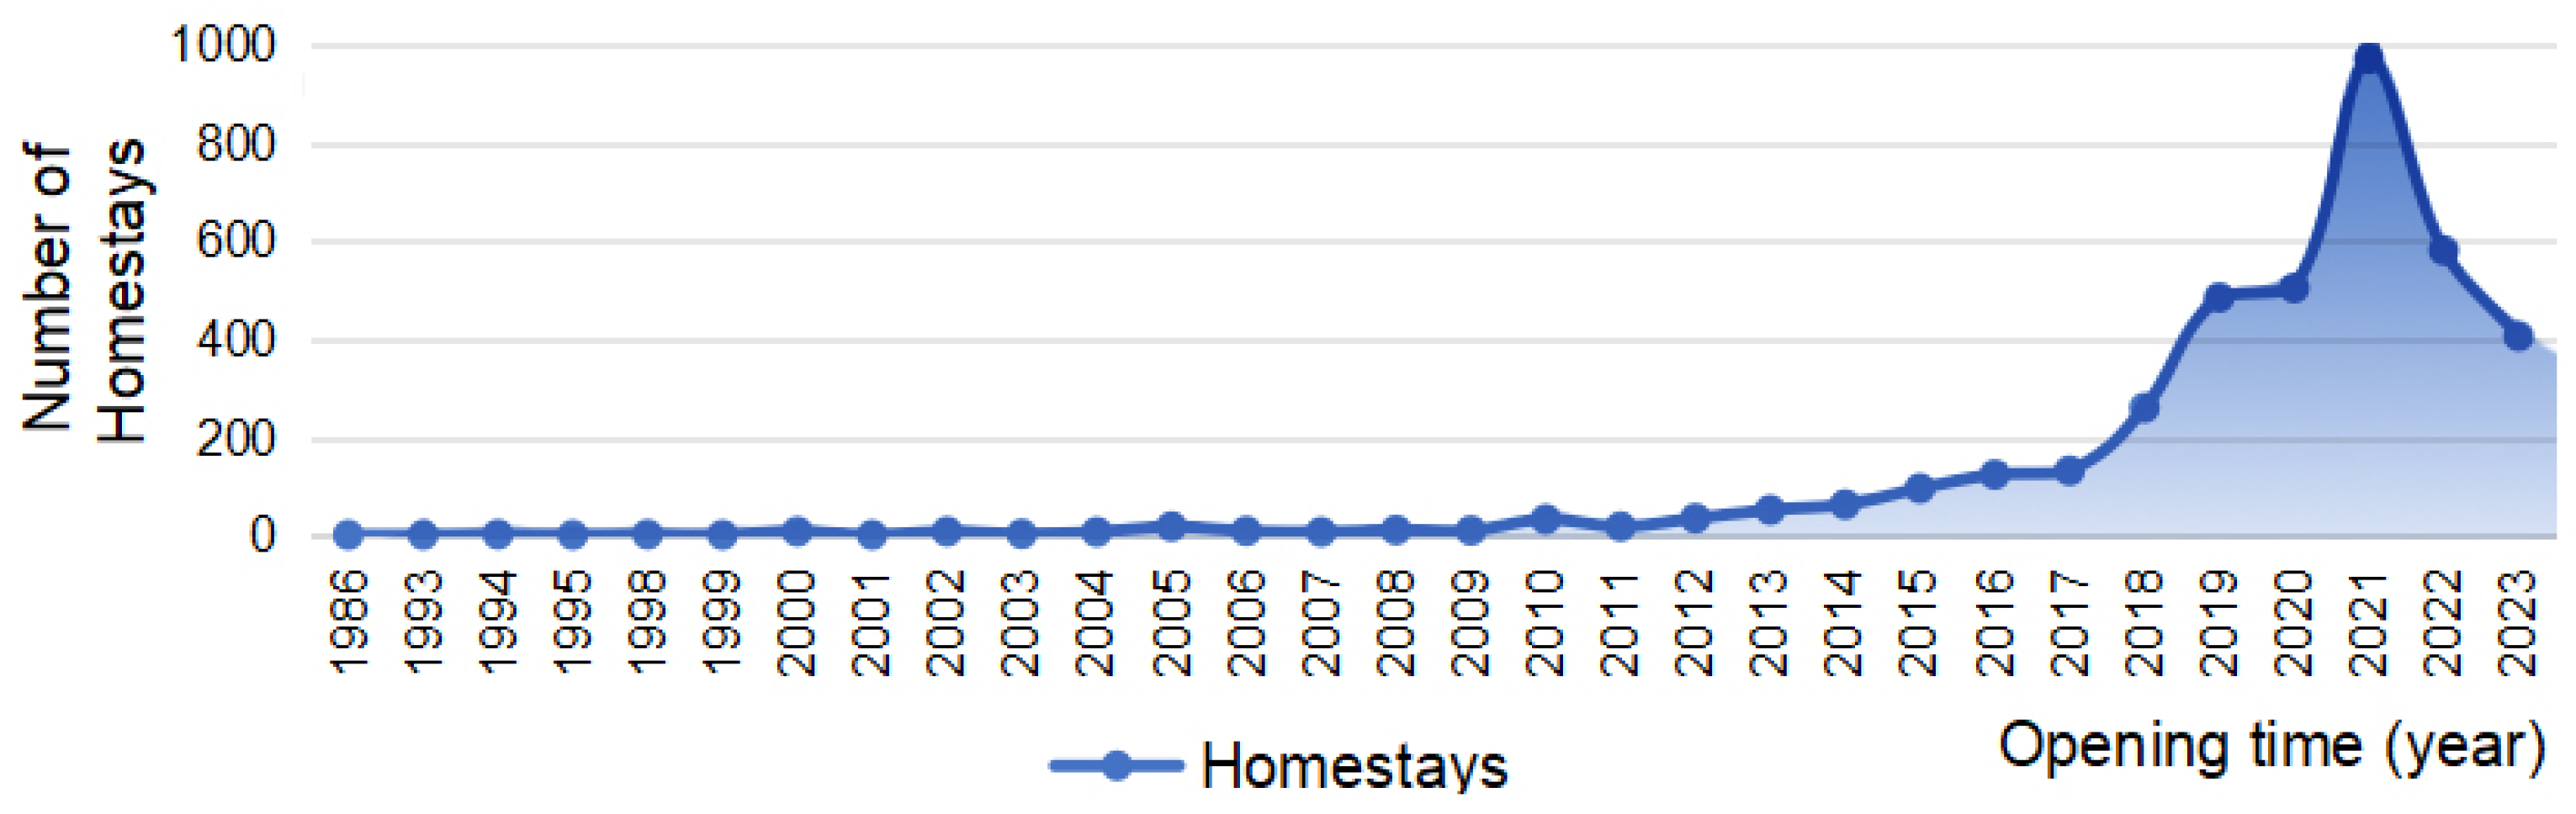
The spatial evolution of Beijing’s rural homestays demonstrates event-driven phase transitions with inherent temporal lags. Tracing the developmental trajectory of rural homestays in Beijing reveals four distinct phases: the embryonic phase (1986 to 2010), the exploratory phase (2010 to 2015), the acceleration phase (2015 to 2019), and the current consolidation phase (2019 to 2023) (
Figure 4) [
20]. The embryonic phase (late 1980s–2008) commenced with villager-operated hospitality services, later accelerated by post-Olympic tourism influxes. Subsequently, the exploratory phase (2010–2015) witnessed platform-mediated professionalization through internet-enabled sharing economies, marked by northeastward spatial expansion and nascent clustering around major scenic zones. Capital infusion propelled rapid southwestward expansion during the acceleration phase (2016–2019), intensifying concentration around premier attractions. The COVID-19 pandemic triggered an adaptive consolidation phase (2021-present), halving total homestay inventories (
Figure 5). The spatiotemporal analysis through Standard Deviational Ellipse (SDE) mapping reveals cyclical expansion–contraction patterns, with centroid migration progressing southeast-to-northwest while remaining geopolitically anchored in Huairou District.
3.1.3. Conjugate Impact Element Disassembly
This study employs a tripartite analytical framework to elucidate the spatial determinants of rural homestay agglomeration patterns in Beijing, focusing on three critical dimensions: altitudinal distribution patterns, tourism resource attraction dynamics, and transportation network accessibility metrics.
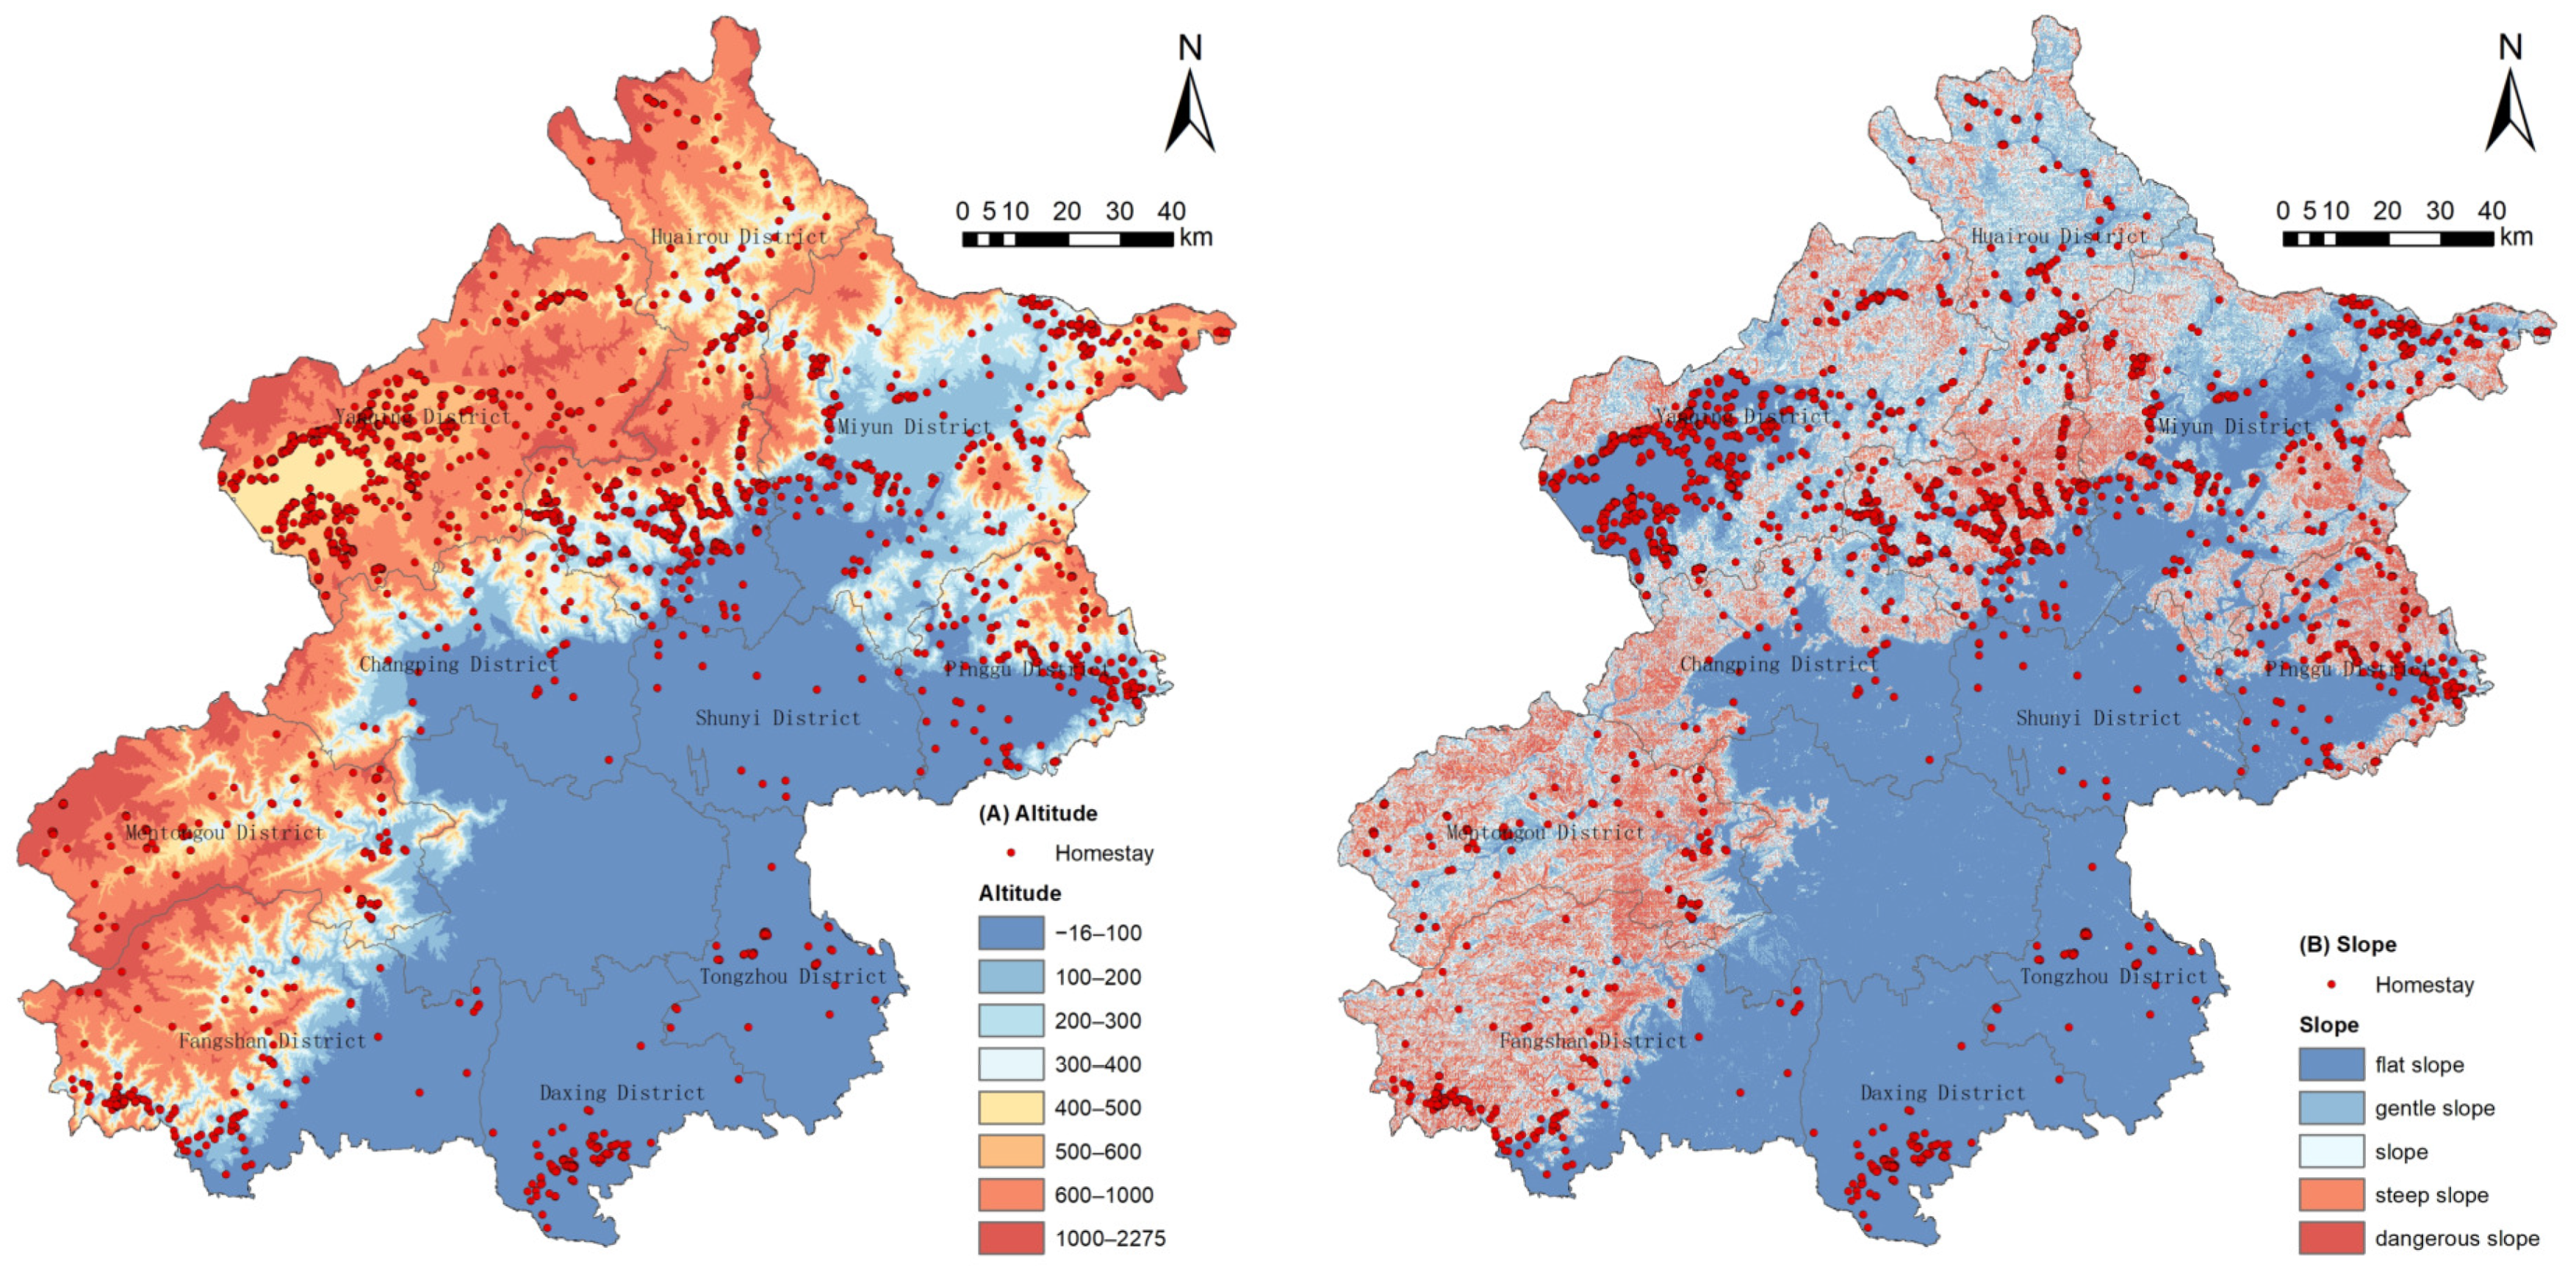
Firstly, the spatial distribution of Beijing’s rural homestays exhibits distinct geomorphological preferences, with over 80% concentrated in low-elevation mountainous zones (<500 m) (
Figure 6A) featuring gentle slopes (<15°) (
Figure 6B). While nearly half occupy near-flat terrains (<2°), the maximum gradients reach 42.16°, spanning elevations from 16 m to 1497 m—demonstrating substantial elevation differentials that mirror Beijing’s complex topography. A bimodal elevation distribution emerges at 100–200 m and 500–600 m, corresponding to shallow and deep mountainous zones, respectively.
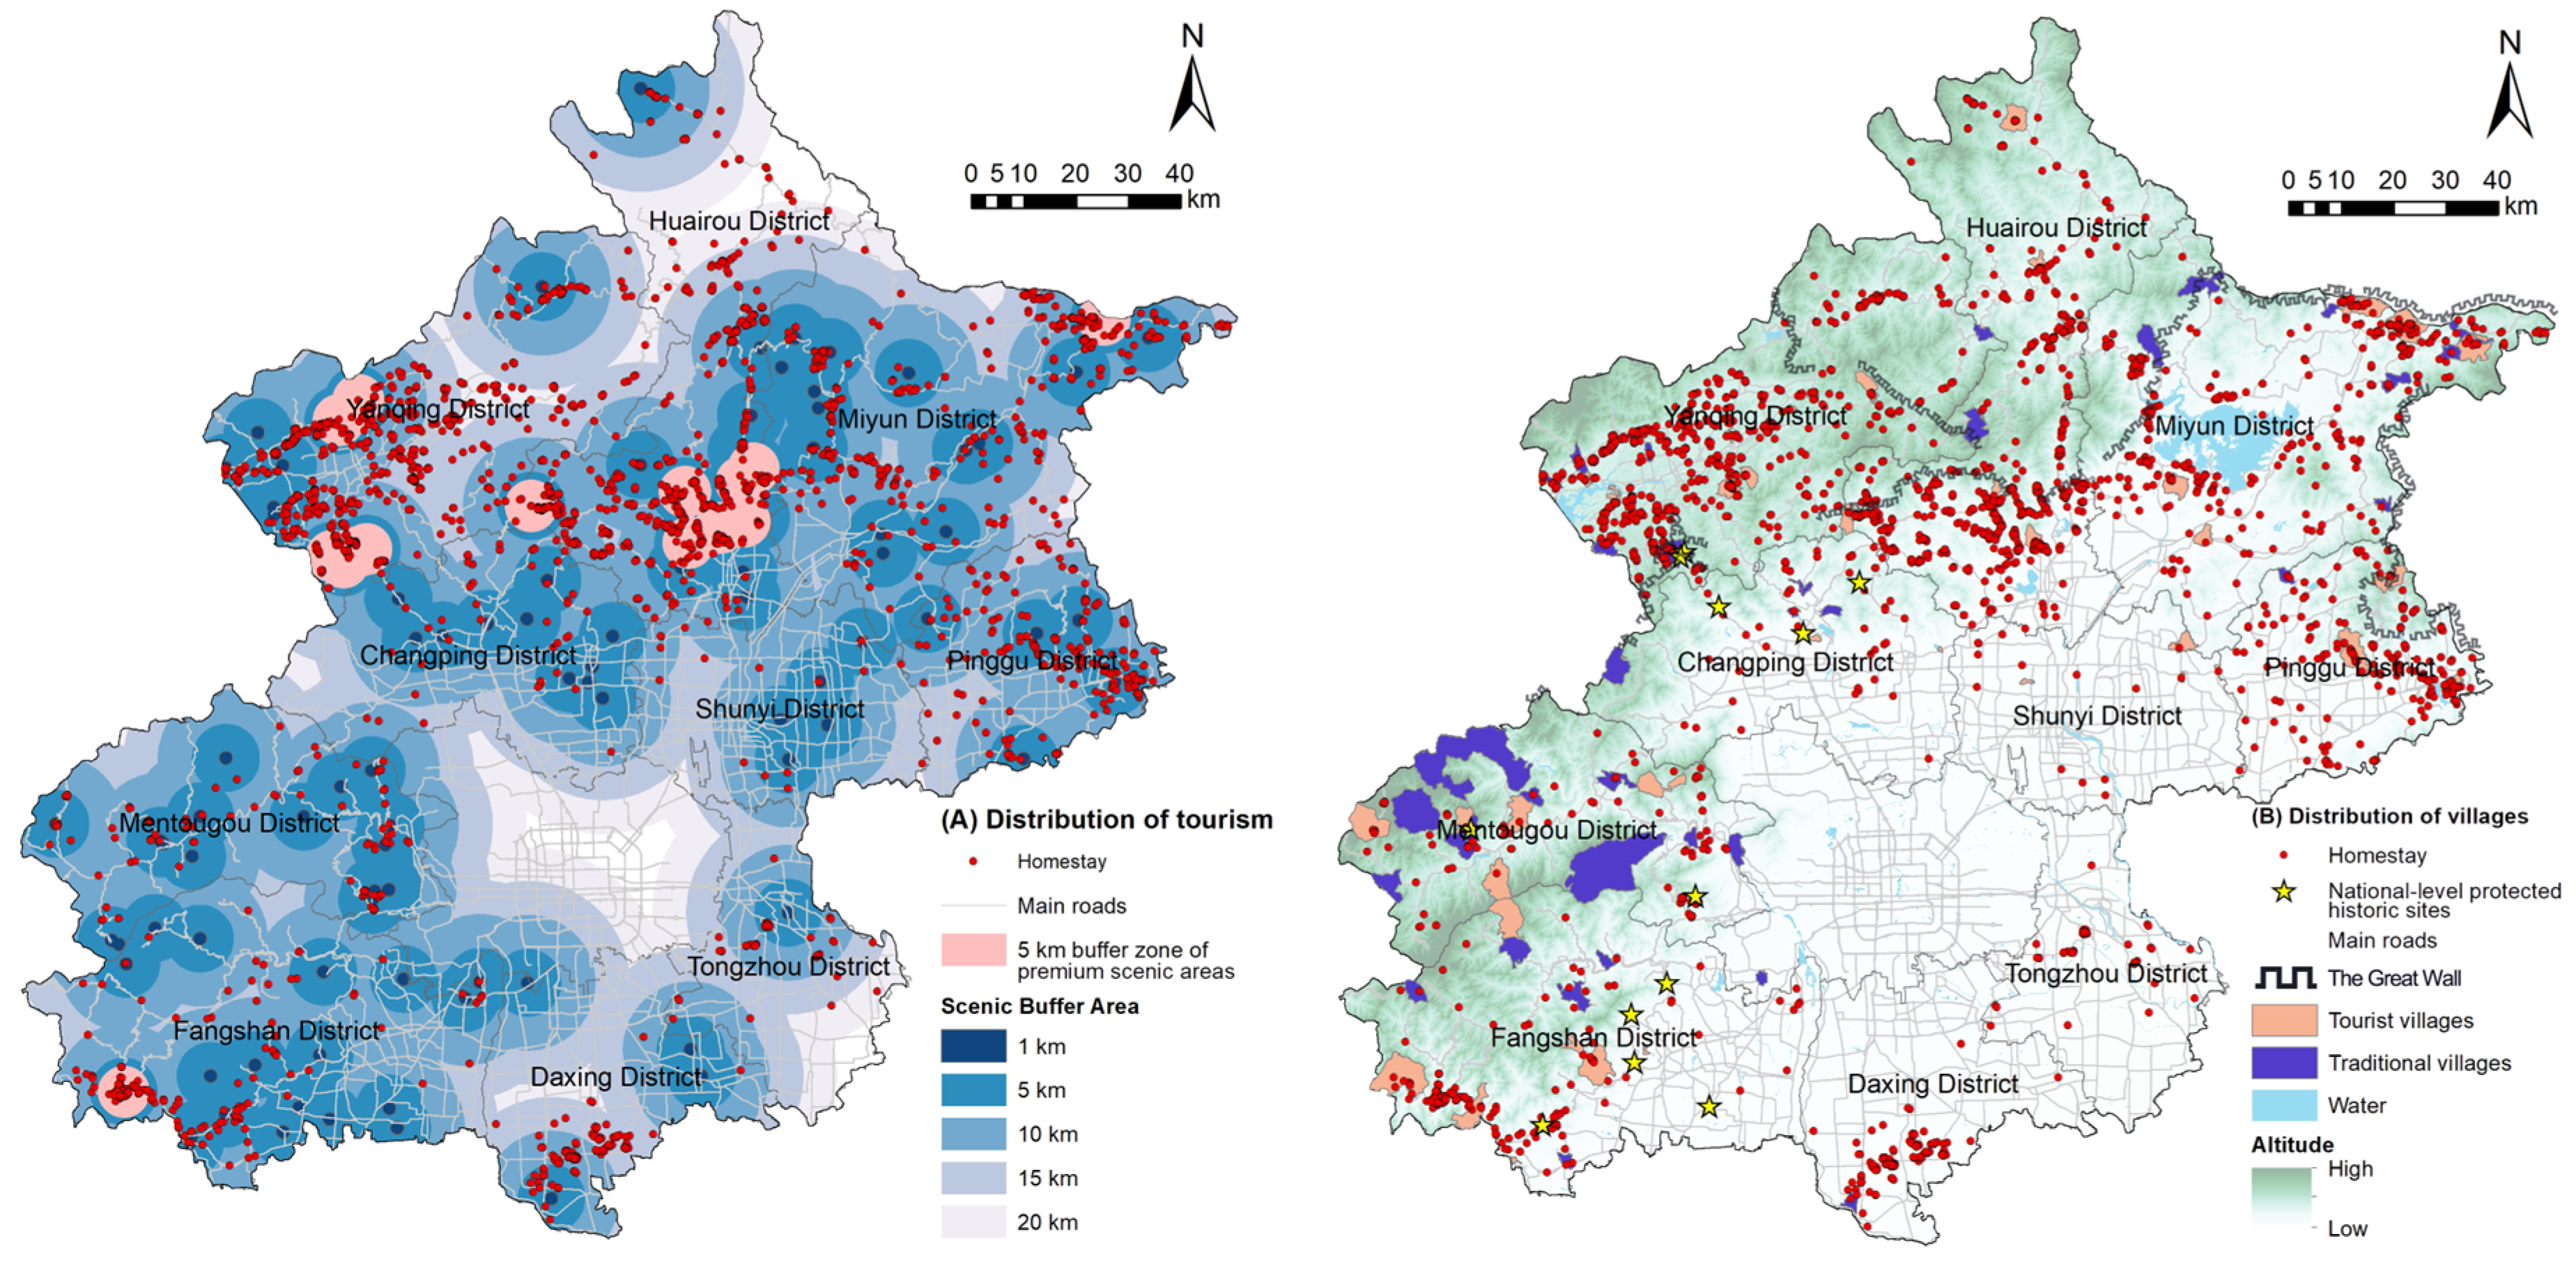
Secondly, regarding tourism resources, a spatial analysis of multi-radius buffer zones encompassing Beijing’s tourist attractions (
n = 106;
Table 4) (
Figure 7A), traditional villages (
n = 43), and tourist villages (
n = 41) (
Figure 7B) reveals distinct spatial relationships with rural homestays. The homestay distribution relative to attraction proximity follows a unimodal pattern, initially increasing then gradually decreasing with distance. Notably, numerous homestays cluster near attraction peripheries, strategically spanning multiple attraction buffer zones to maximize market coverage and customer acquisition. Overall, more than half (2096 units) of rural homestays are distributed within a 5 km radius of tourist attractions, while less than 15% of key tourist attractions concentrate nearly half of rural homestays within their 5 km radius (
Table 5).
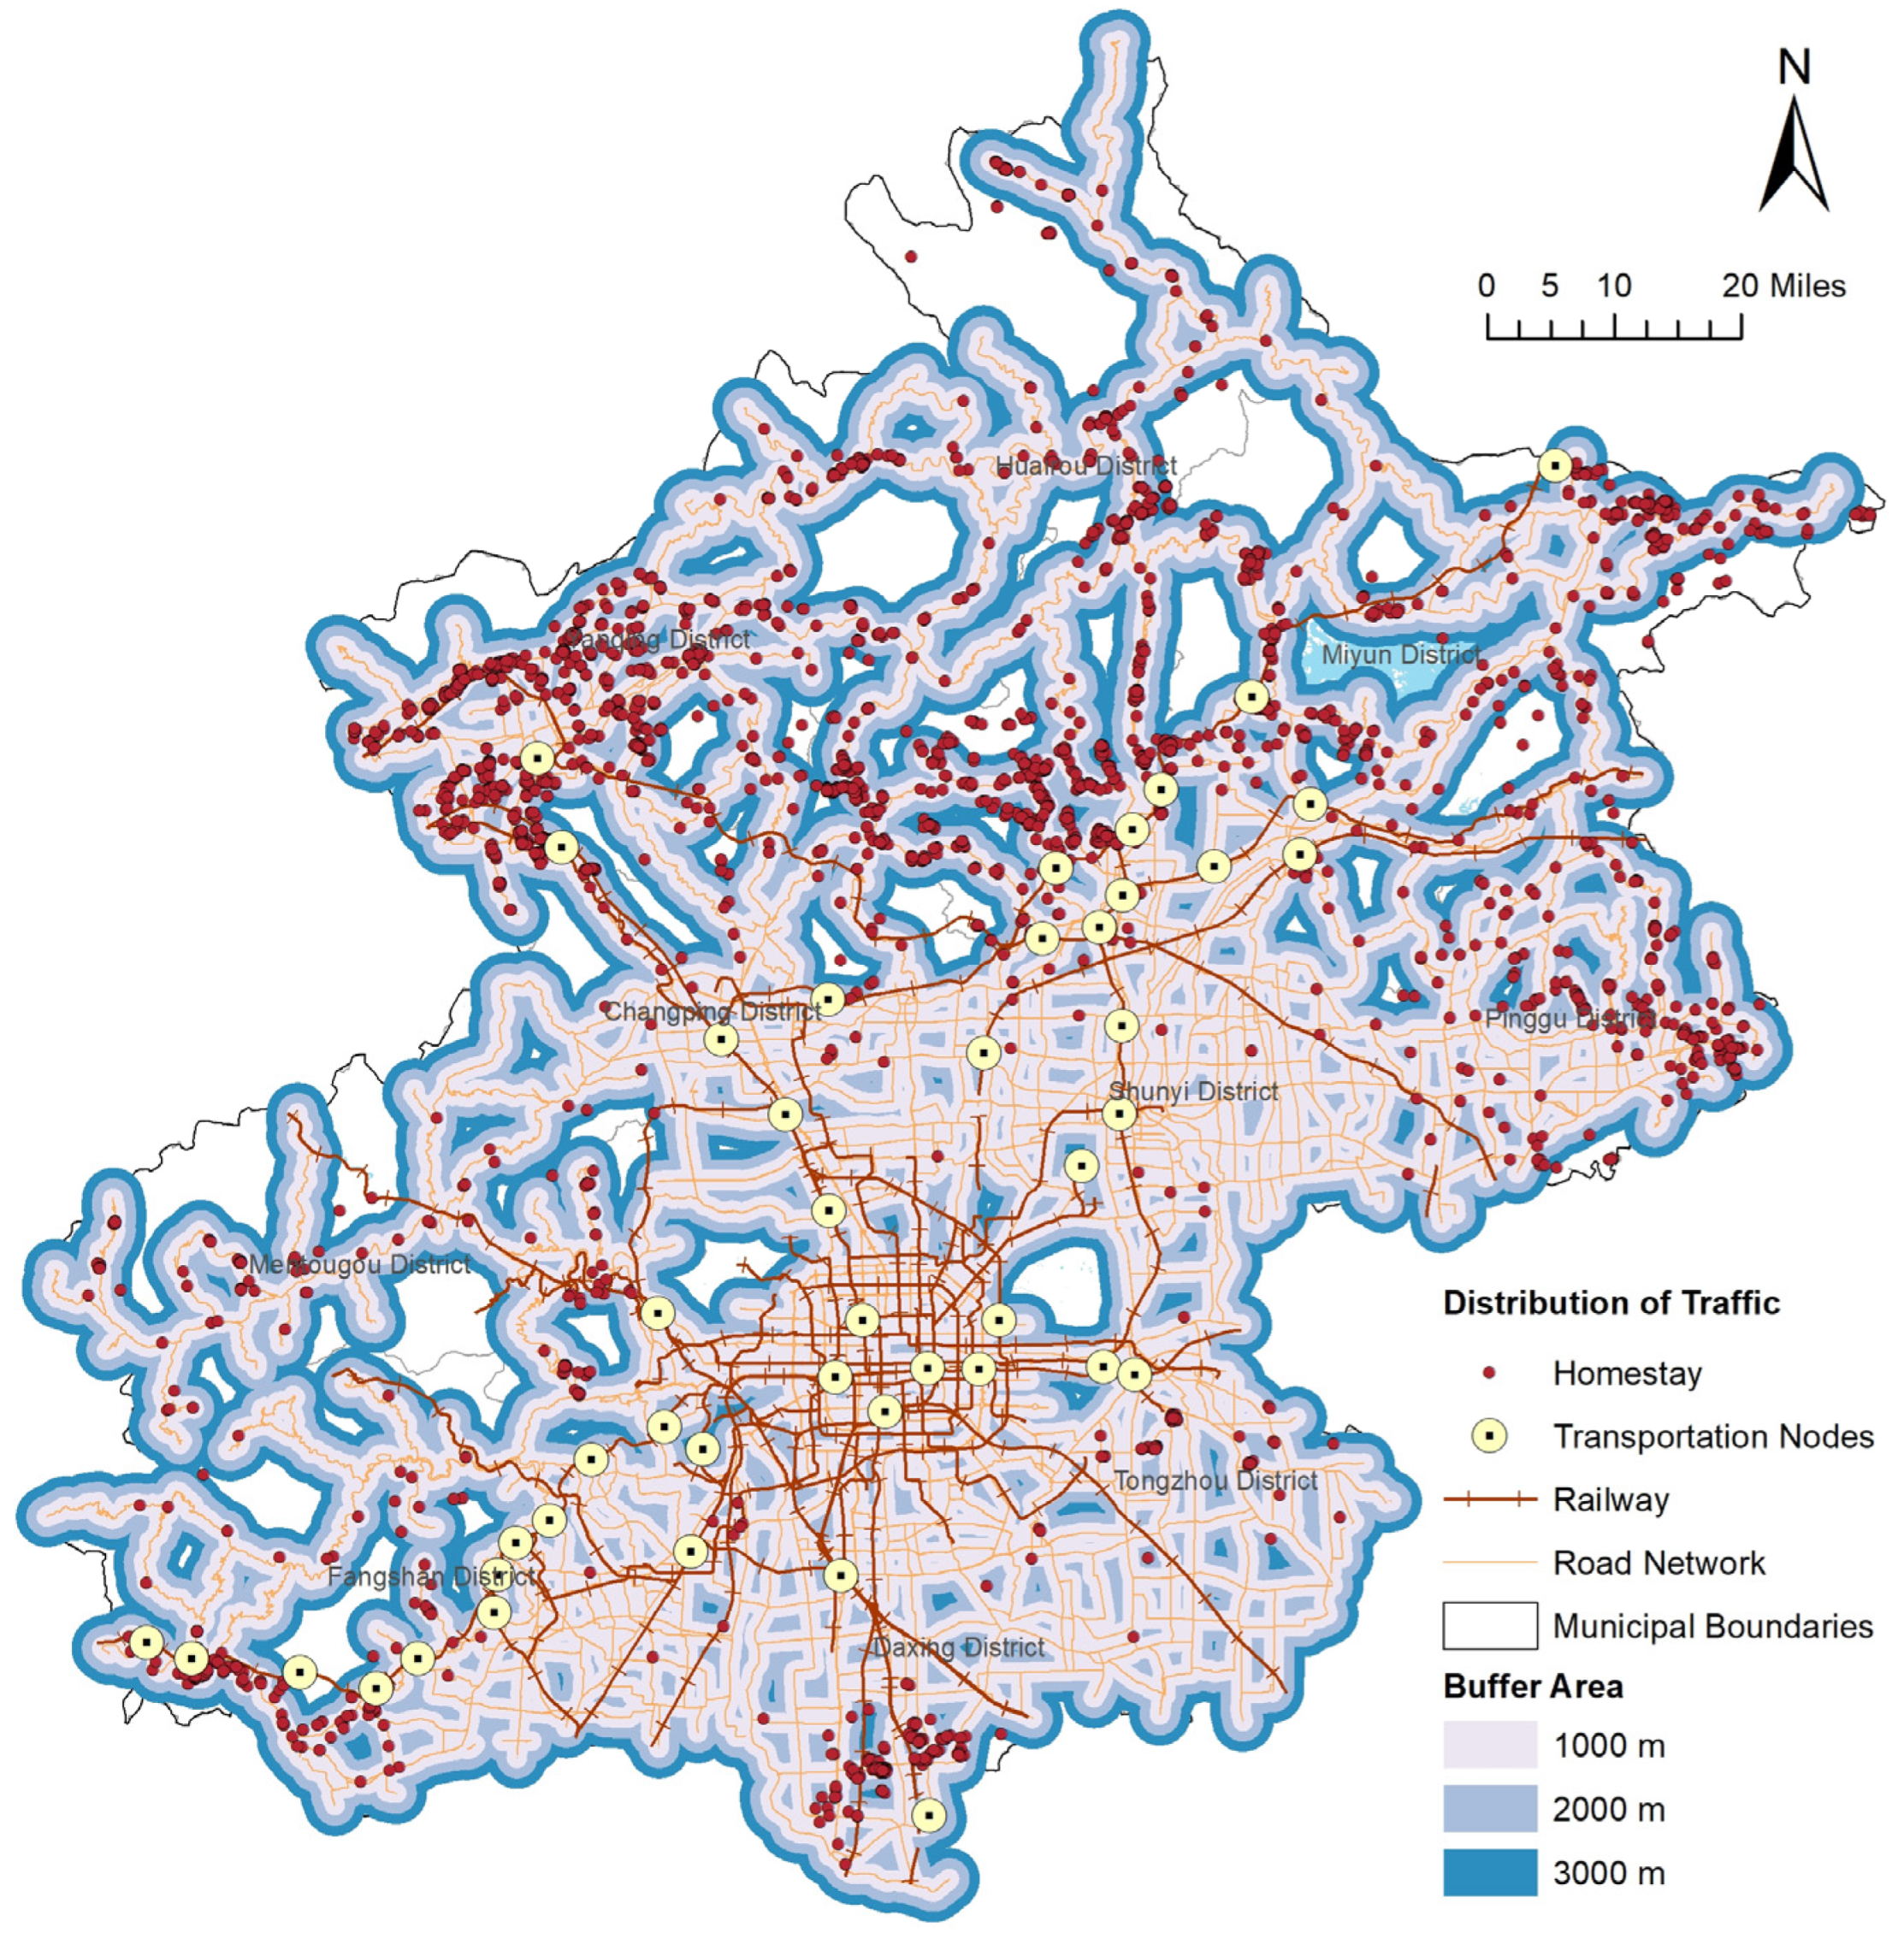
Finally, transport accessibility exerts a profound influence on the spatial distribution of Beijing’s rural homestays, necessitating an analysis across two dimensions: urban tourist source areas and transportation infrastructure (major arterial roads and key nodes). The distance–urban proximity relationship exhibits a bimodal distribution pattern (
Figure 8), with primary clustering (1004 units) peaking at 15 km from urban centers—a one-hour drivetime threshold that balances urban accessibility and scenic appeal. A secondary resurgence occurs at 40–50 km (peak: 398 units at 50 km), though the homestay density at this range remains below the 25 km levels (430 units). Major arterial roads and transportation nodes demonstrate significant agglomeration effects (
Figure 9), with 80% of homestays concentrated within 1 km buffer zones (
Table 6).
3.2. Comparative Study of Concentration Zone Grading
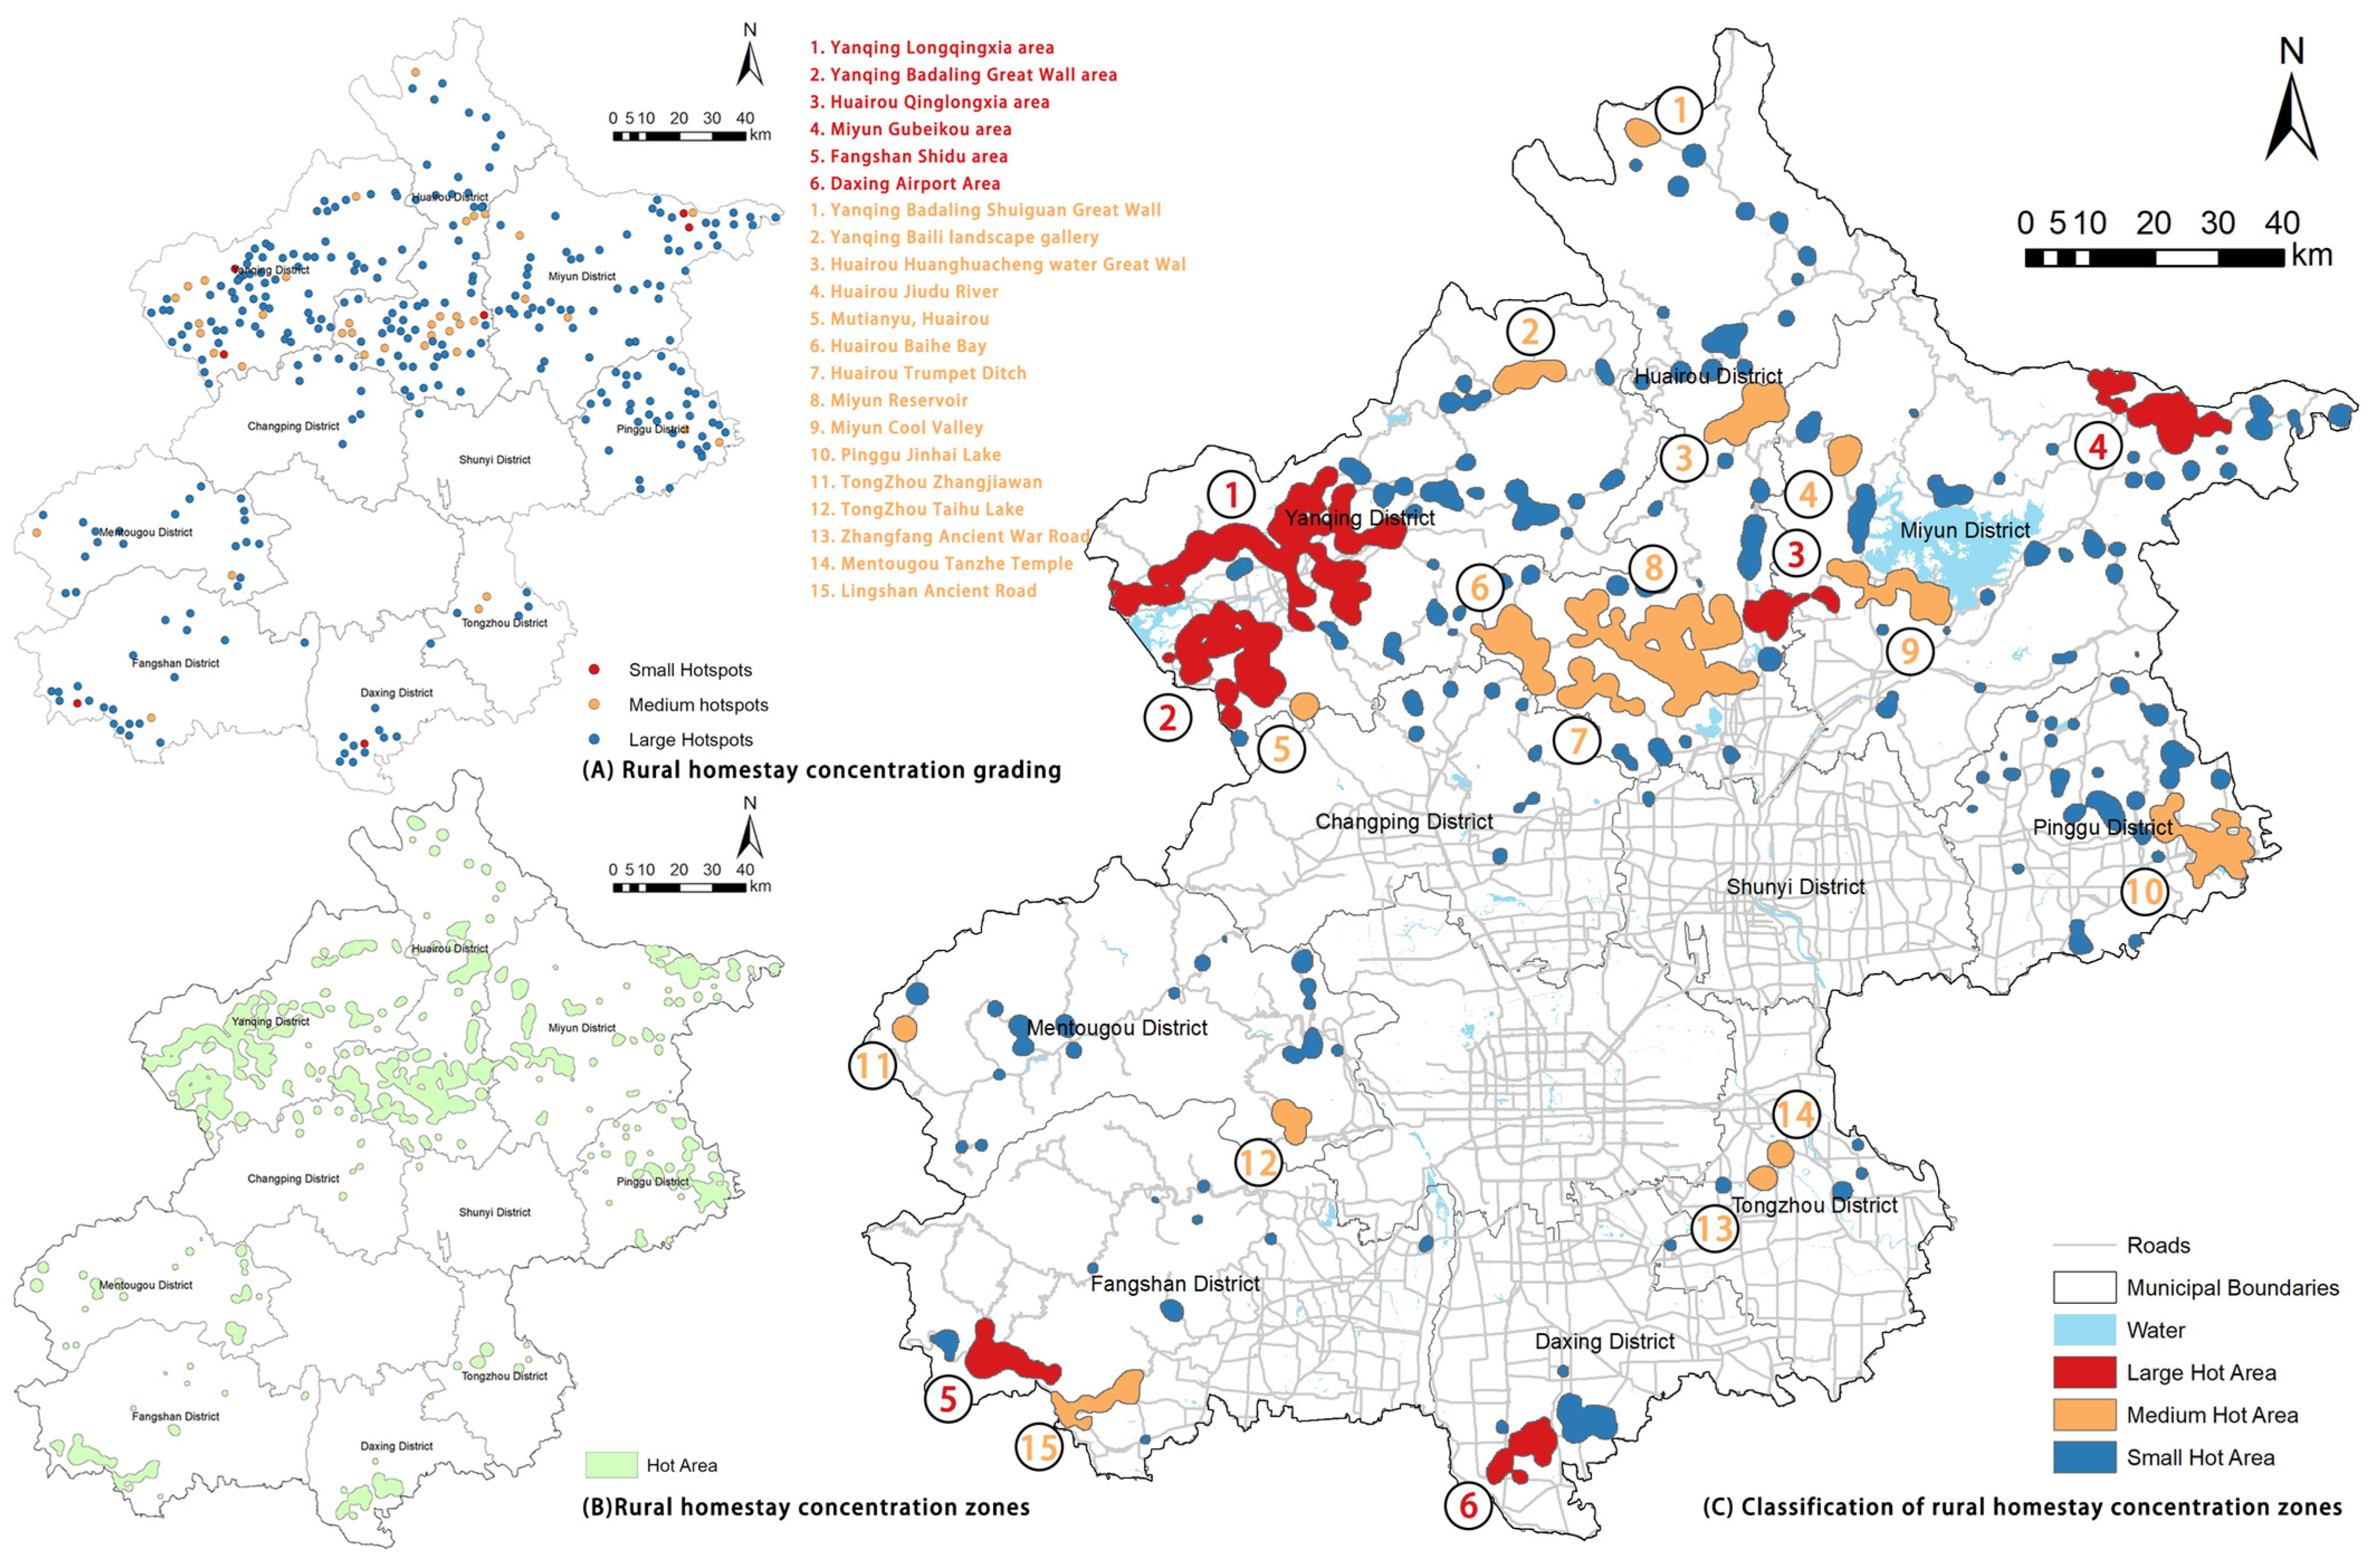
To further investigate the agglomeration characteristics of Beijing’s rural homestay distribution, this study employs a Hotspot Analysis with hierarchical clustering based on the agglomeration intensity. The analytical findings reveal that adjusting the spatial threshold of the concentration zone detection model to a 1000–2000 m range optimally captures small-scale clustering patterns in kernel density surfaces, effectively reflecting localized density attributes. Consequently, a 1000 m observational scale was selected for area-level kernel density mapping, identifying 160 distinct concentration zones containing 3581 homestays (93% of the total inventory). Statistical validation confirms significant clustering patterns, with a Hotspot Analysis index of 2.37 achieving a 95% confidence level.
The kernel density surface is classified into three agglomeration tiers based on peak density variations (
Table 7): high-intensity (17.4 units/km
2), medium-intensity (4.83 units/km
2), and low-intensity (0.95 units/km
2) concentration zones. The spatial analysis reveals distinct regional patterns, with clustered high- and medium-intensity zones in northern Beijing anchored along the Great Wall scenic corridor, contrasting with fragmented distributions in southern regions. Yanqing and Huairou districts concentrate nearly two-thirds of medium-intensity zones and half of high-intensity zones, whereas central districts like Changping and Shunyi exhibit negligible clustering and lack major concentration zones—highlighting pronounced spatial heterogeneity and localized agglomeration dynamics.
Integration with
Figure 10 demonstrates strong alignment between arterial road orientations and the spatial configurations of both individual high–medium-intensity zones and clustered low-intensity zones, with rural homestays displaying marked linear clustering along transportation corridors. Specific regions exhibit core–periphery configurations. Multi-concentration zone convergence emerges in locales where proximate tourism resource clusters generate synergistic interactions.
3.2.1. Advantageous Analysis of High-Concentration Zones
Six high-intensity agglomeration zones constitute core rural homestay clusters, demonstrating integrated advantages through strategic geographical positioning, abundant tourism resources, and efficient transportation networks. As evidenced in
Table 7, these zones share comparable total areas (500 km
2) across three density tiers, yet exhibit stark density differentials—high-intensity zones concentrate 40% of homestays spatially, five zones predominantly cluster along Beijing’s administrative boundaries, while Zone 3 (Qinglongxia Cluster) occupies a central position driven by policy-induced agglomeration. Proximity between Zones 1 and 2 stems from geographical adjacency and shared tourism development priorities.
The Badaling Great Wall Homestay Cluster (Zone 2;
Table 8) exemplifies comprehensive advantages through its strategic adjacency to the Great Wall’s most iconic eastern section and Beijing’s largest western waterbody. Superior multimodal connectivity via highways and railways complements its preservation of Ming–Qing vernacular architecture through the adaptive reuse of traditional structures. Zone 4 demonstrates corporate-led development models, where foreign capital entities systematize local tourism assets into chain-operated, enterprise-scale clusters. Zone 5 derives distinction from the UNESCO World Geopark designation, leveraging exceptional geological endowments to anchor its tourism appeal. The Daxing Airport Zone (Zone 6) functions as Beijing’s southern aerial gateway, capitalizing on strategic transportation infrastructure.
3.2.2. Comparison of the Advantages and Disadvantages in the Medium- and High-Concentration Zones
The 15 medium-intensity concentration zones generally lack rail transit accessibility and demonstrate singular dominant resource characteristics compared to high-intensity clusters (
Table 9). Classified into three typologies based on agglomeration drivers—historical–cultural (Type 1), natural–environmental (Type 2), and landscape–recreational (Type 3)—these zones exhibit localized multi-concentration zones clustering through shared cultural–scenic synergies.
(1) Five historical–cultural zones capitalize on Great Wall heritage and Zen Buddhist foundations to attract niche tourist segments seeking immersive cultural experiences. This cultural magnetism induces demand-driven homestay agglomeration along cultural corridors through adaptive spatial configurations. (2) Natural–environmental zones possess distinctive landscape and ecological value, yet exhibit lower agglomeration intensities compared to high-intensity clusters. Contributing factors include peripheral urban locations with limited transportation accessibility and underdeveloped environmental resources that constrain tourism infrastructure maturation. (3) Landscape–recreational zones emerge from accommodation demand spillover due to capacity limitations at Beijing’s Global Resort hotels. Homestays consequently concentrate in peripheral villages adjacent to the Film/Tourism Cultural Base and Tongzhou District’s Zhangjiawan village (Zone 11) and Taihu village (Zone 12) areas, forming demand-responsive clusters around major entertainment hubs.
3.2.3. Characterization of the Distribution of Low-Concentration Zones
There are a total of 139 low-intensity concentration zones exhibiting geographically dispersed patterns with localized clusters comprising several to a dozen rural homestays concentrated within single or adjacent villages, demonstrating minimal agglomeration intensity. The majority cluster peripherally around large and medium-intensity concentration zones or along arterial roads accessing these zones, particularly in valley and riparian areas. The remainder occupy isolated spatial positions, relying solely on singular high-quality scenic sites or traditional villages as cultural–landscape anchors.
3.3. Quantitative Grading of Impact Detection for Each Indicator
To analyze the spatial distribution of rural homestays in Beijing, a 1000 m × 1000 m fishnet grid was constructed, within which agglomeration effects are most pronounced. At this scale, the Geodetector method was applied to evaluate selected indicators (
Table 10). The analytical results demonstrate that, at both municipal and district levels (excluding Changping and Shunyi districts), all factors achieve statistical significance with
p-values passing 95% confidence tests. Calculated q-values quantitatively assess influence magnitudes, revealing that transportation accessibility exerts the most significant positive influence on homestay agglomeration in rural contexts, followed by natural environmental factors, which surpass tourism resources in impact. Socioeconomic indicators show minimal spatial influence. Notably, factors demonstrating strong influences yet marked discrepancies with the observed spatial patterns—particularly socioeconomic parameters exhibiting weaker comprehensive impacts and substantial urban–rural divergences—are analyzed through integrated analytical frameworks to reconcile methodological differences.
Proximity to transportation nodes (X8) emerges as the most influential sub-indicator, with its strong aggregation effect significantly attracting rural homestay clustering despite their widespread distribution. Vegetation coverage (X3) ranks second in influence. To meet tourists’ demand for premium natural experiences, most homestays preferentially cluster in high-coverage zones. Scenic attraction (X4) follows as the third determinant, demonstrating strong agglomeration effects on rural homestays. Average slope (X2) exhibits the lowest q-value, followed by arterial road network density (X7), indicating their relatively minor influences on the spatial distribution of rural homestays. Socioeconomic factors exhibit a comparatively limited influence on the spatial distribution of rural homestays, with weak spatial coupling observed between their distribution patterns and regional economic levels.
The low factor values obtained through single-factor detection across Beijing’s municipal territory indicate inherent complexity in the spatial distribution of rural homestays (
Table 11). To further investigate regional determinants, this study applies a Geodetector analysis to ten administrative districts, identifying two distinct types of divergence patterns between municipal-scale and district-scale influence mechanisms.
The first pattern reveals that certain influencing factors exhibit limited impact at the municipal level but demonstrate significantly heightened effects at the district level. For instance, the density of key tourist villages in the Huairou, Yanqing, Miyun, and Mentougou districts shows a pronounced increase in its influence on the spatial distribution of rural homestays.
The second pattern indicates that some determinants that are dominant at the municipal level but exhibit diminished impacts at the district level. In the Huairou, Yanqing, Miyun, Pinggu, and Fangshan districts, the influences of population size and per capita GDP in the tertiary sector on the rural homestay distribution have declined markedly. In Tongzhou district, the effects of vegetation coverage and scenic attraction on homestay spatial patterns are substantially reduced, while the impacts of transportation node proximity and arterial road network density become significantly pronounced.
3.4. Independent Effects of Factors Influencing Each Concentration Zone
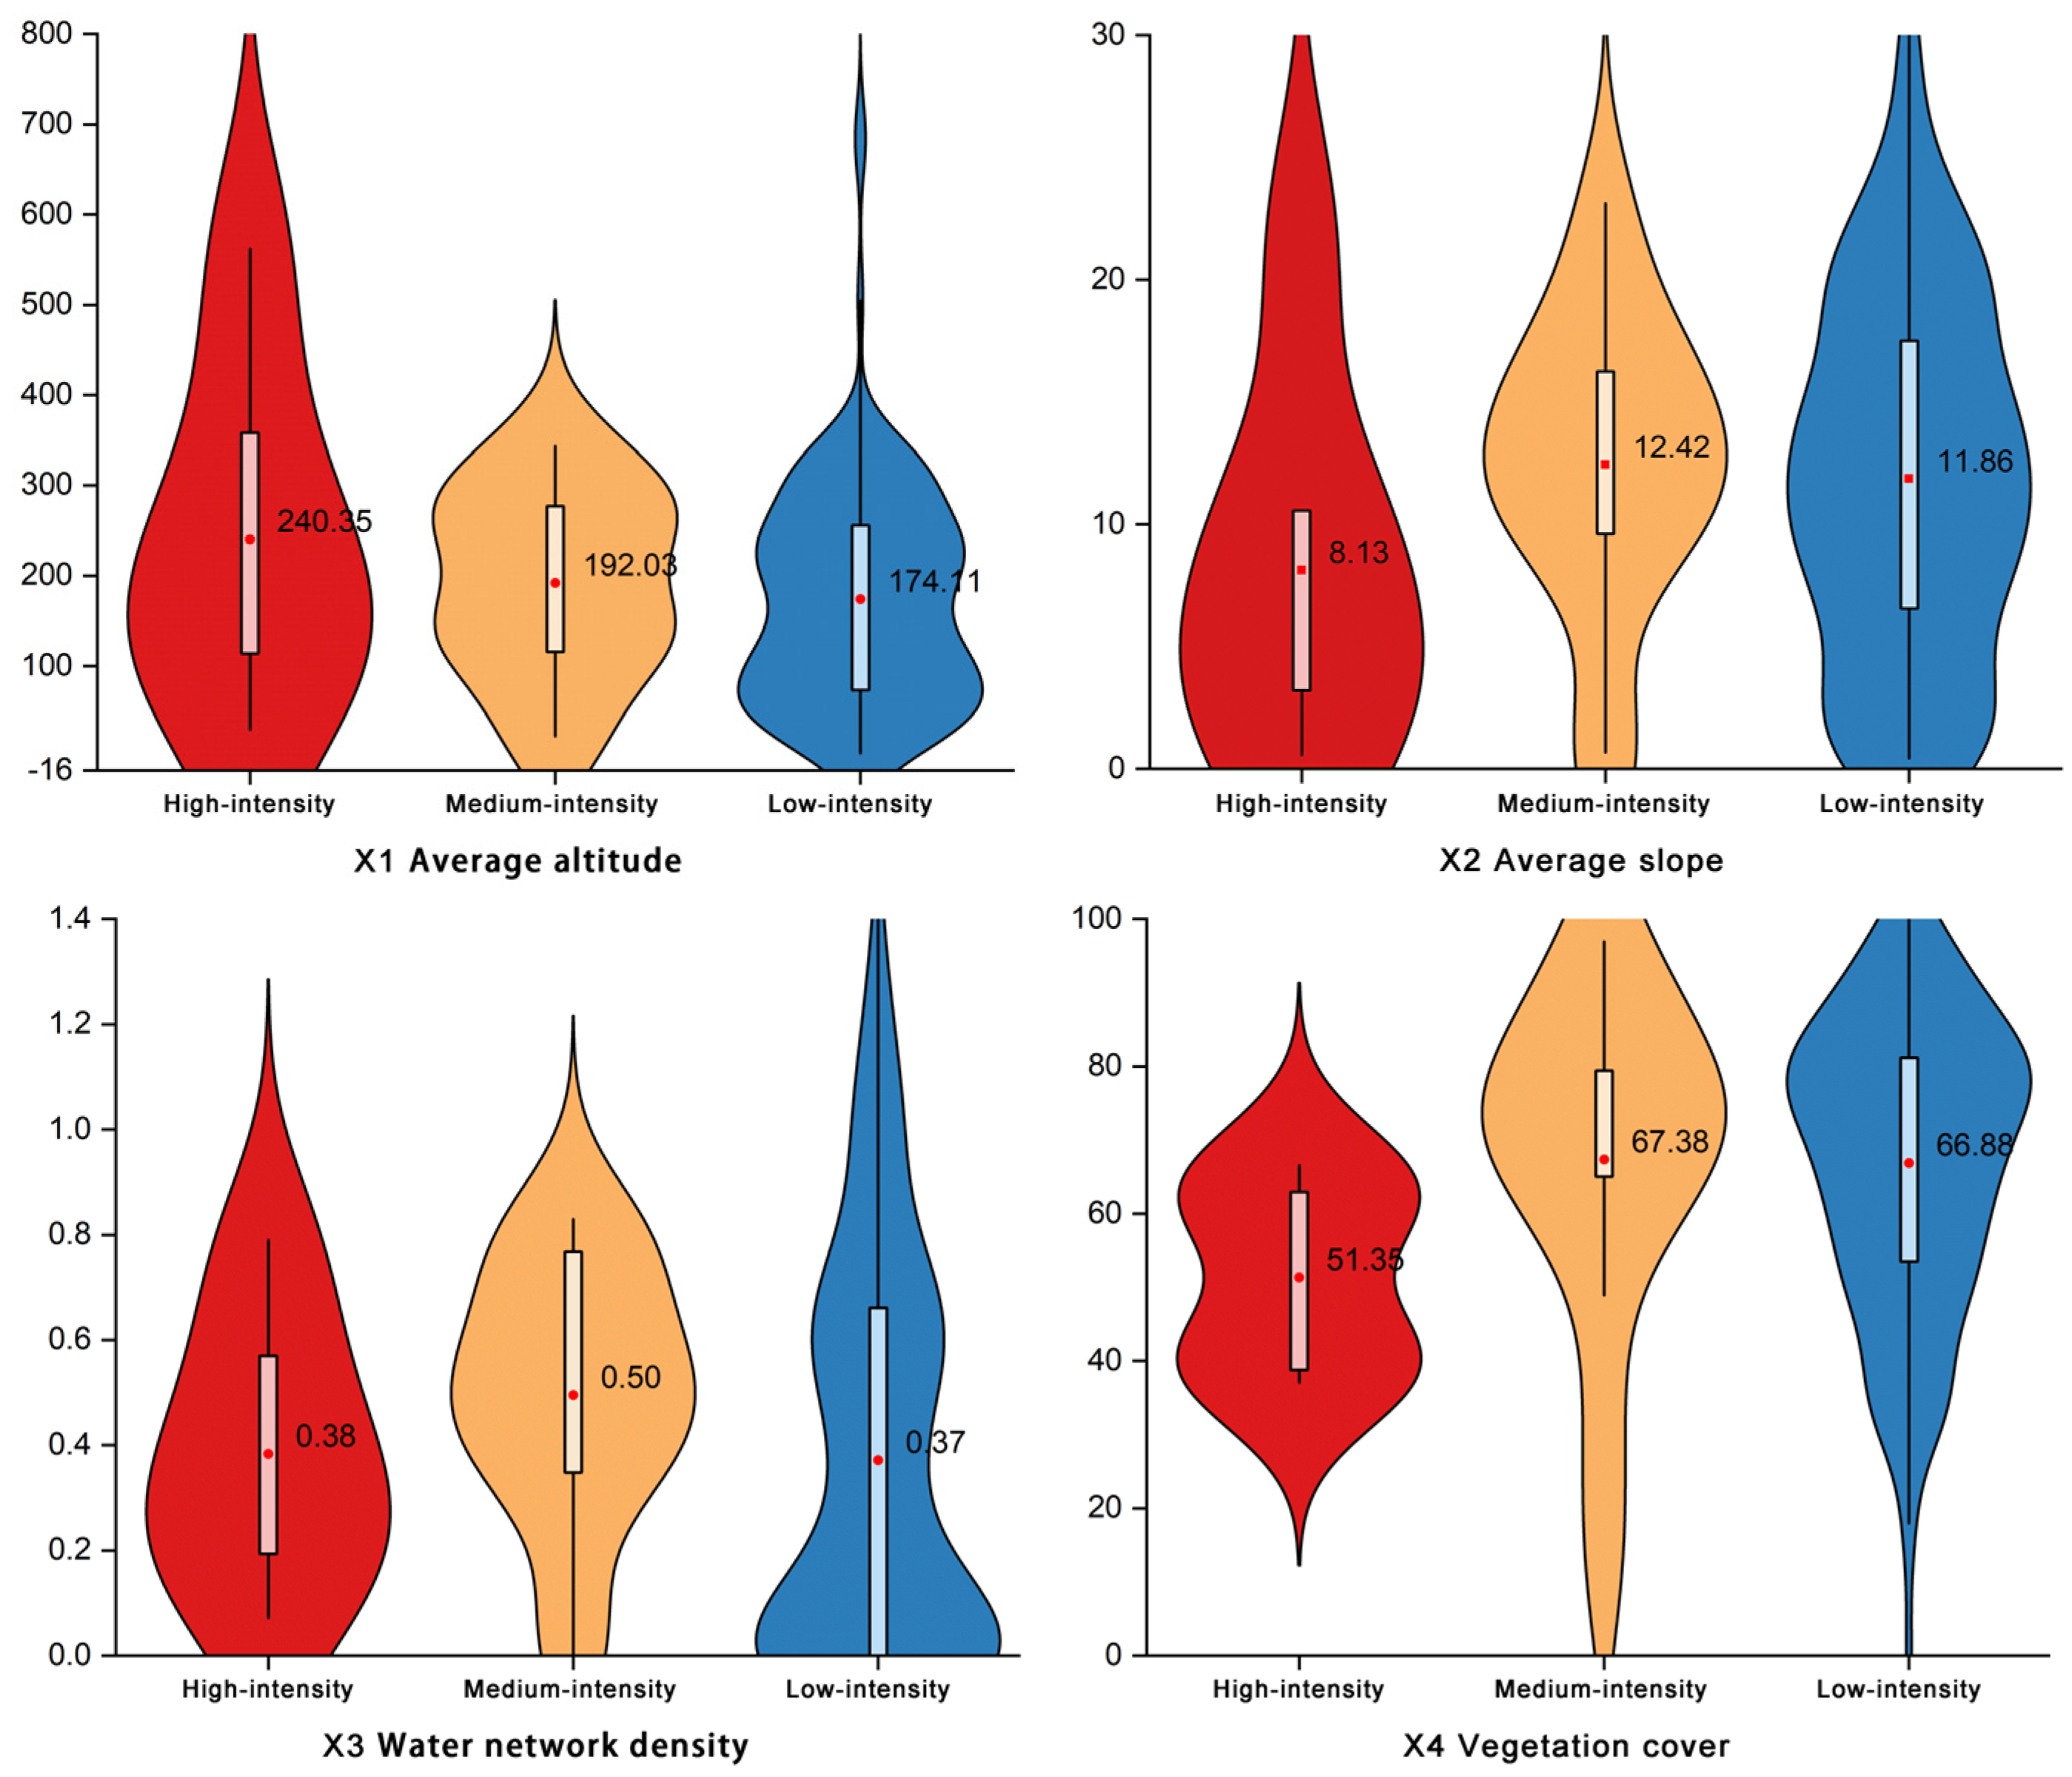
To elucidate interrelationships between concentration zone typologies and influencing factors, this study employs violin plots that integrate the kernel density estimates with box–whisker diagram features. The width of the violin plots corresponds to the concentration zone distribution density at specific locations, where a greater width indicates a higher concentration zone density. The box components (25–75%) delineate interquartile ranges, while the whiskers (10–90%) represent data dispersion ranges.
3.4.1. Natural Environment: Advantages of the Gradient of Natural Patterns in Shallow Mountainous Areas
Average elevation exhibits a weak negative correlation with concentration zones, while average slope, water network density, and vegetation coverage demonstrate n-shaped nonlinear trends. The elevation analysis (
Figure 11 [X1]) confirms that all types exceed Beijing’s urban elevation by over 150 m, establishing mountainous terrain as a foundational control over homestay agglomeration. Over 80% of rural homestays concentrate in shallow mountainous zones, with elevation gradients progressively decreasing from high- to low-intensity clusters. In terms of average slope (
Figure 10 [X2]), the three concentration zone categories exhibit overall comparable values. However, high concentration zones predominantly cluster in gentle slope areas, medium-scale concentration zones cluster in slope zones, while small-scale concentration zones display a relatively uniform distribution across various slope gradients. Beijing’s inherent water scarcity results in generally low water network densities across all types (
Figure 11 [X3]). Medium-intensity zones (0.5 km/km
2) surpass others in this metric. The vegetation coverage analysis (
Figure 11 [X4]) reveals that all types exceed 50%. Medium- (67.38%) and low-intensity (66.88%) clusters significantly outperform high-intensity zones (51.35%), with over half concentrated in high-coverage areas (>75%).
3.4.2. Tourism Resources: Advantages at the Top of the Hyperthermia Zone
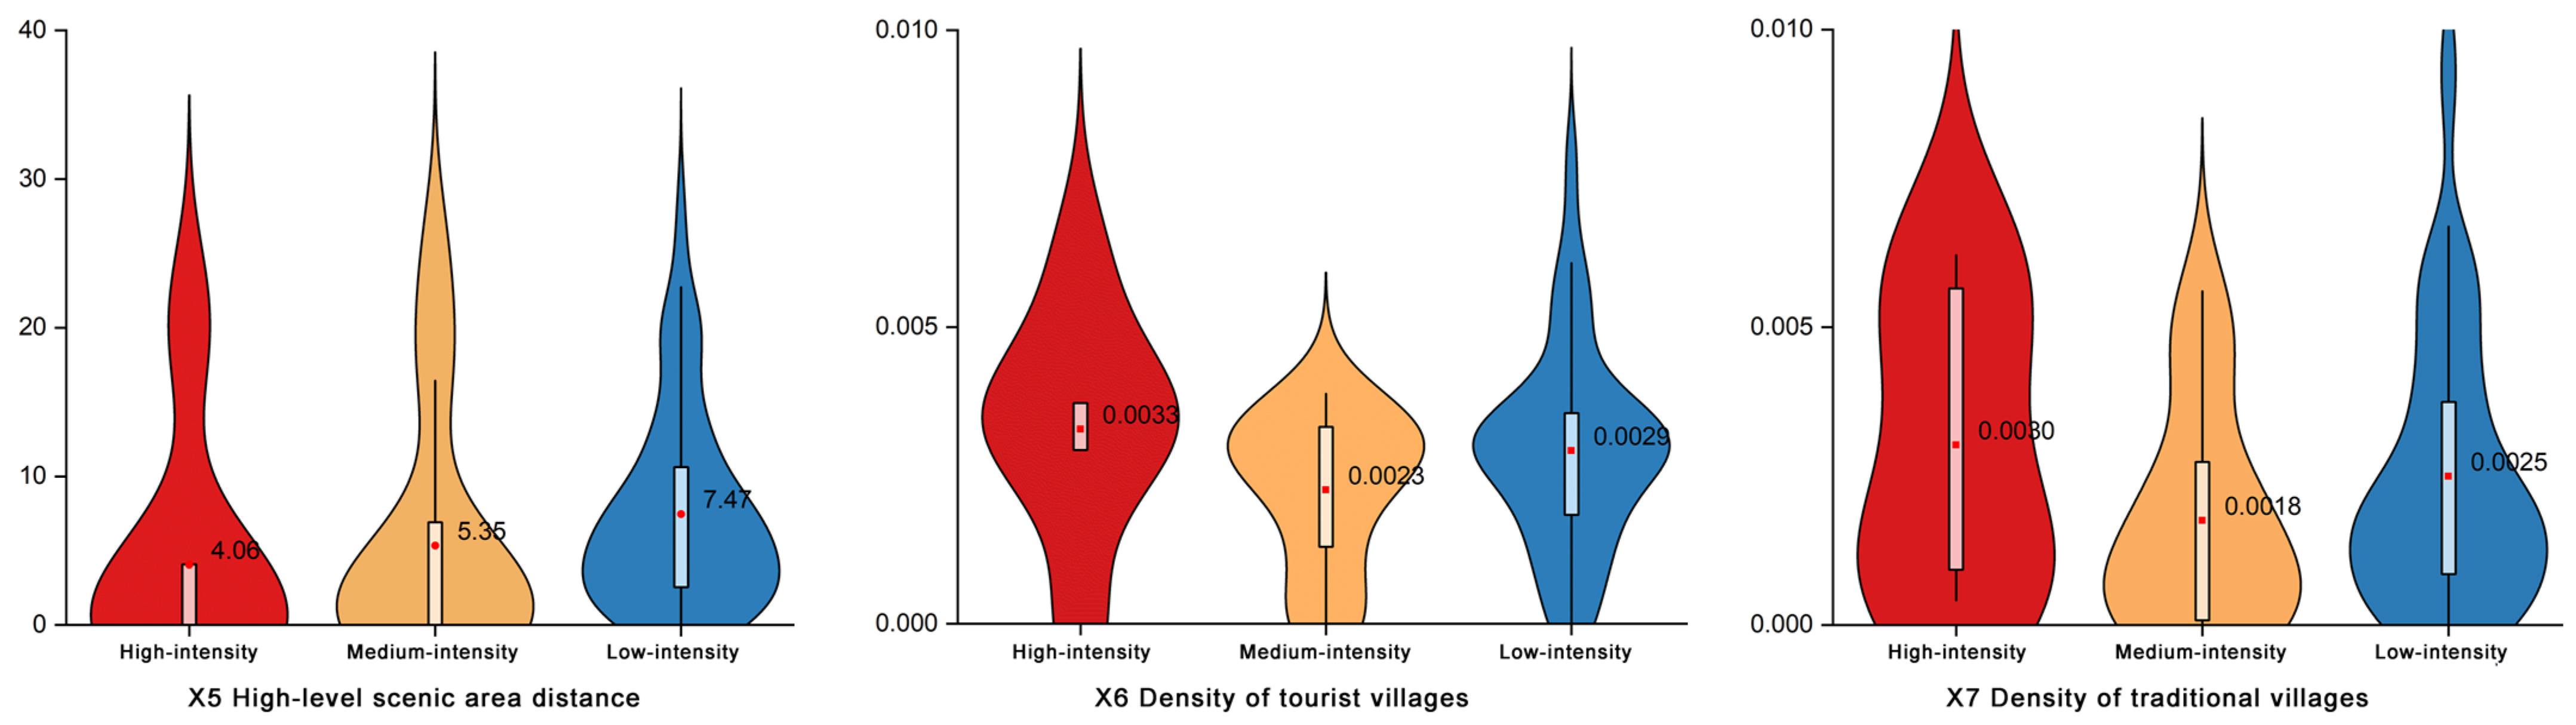
Proximity to high-tier scenic areas exhibits a negative correlation with the concentration zones, while the densities of tourist villages and traditional villages demonstrate N-shaped nonlinear relationships with the agglomeration magnitude. Overall, high-intensity clusters exhibit the lowest mean values for tourism-related influencing factors, concentrating closest to tourism resources (4.0 km from scenic cores and 4.6 km from traditional villages), whereas medium- and low-intensity zones show weaker spatial coupling. The spatial analysis of high-tier scenic attraction proximity (
Figure 11 [X4]) reveals that all hotspot categories cluster near attractions, with high-intensity zones having the shortest median distance (4.0 km). For the tourist village density (
Figure 12 [X6]), all hotspot types range between 0.002 and 0.003/km
2, yet high-intensity clusters display tighter boxplots, pronounced concentration trends, and the highest mean values. In terms of the traditional village density (
Figure 12 [X7]), high-intensity zones show marked agglomeration around culturally significant and heritage-rich villages. Conversely, both tourist and traditional village resources exert minimal influences on medium-intensity zones, highlighting their peripheral dependency and developmental constraints.
3.4.3. Transportation Access: Strong Magnetic Attraction Effect of Rail Transit Nodes
The three concentration types exhibit comparable mean arterial road network densities while demonstrating a significant negative correlation between the transportation node proximity and agglomeration scale. The spatial analysis reveals clustered road network densities across all types, averaging 0.65 km/km
2 (
Figure 13 [X8]). This structural homogeneity reflects Beijing’s well-developed rural road infrastructure characterized by high comprehensive accessibility [
39]. Critical spatial divergences emerge in nodal accessibility: high-intensity zones average 1.07 km from transportation nodes, contrasting sharply with medium-intensity (15.28 km) and low-intensity clusters (19.51 km) (
Figure 13 [X9]). The elongated interquartile range in medium-intensity zones suggests adaptive nodal interaction flexibility.
3.4.4. Social-Economics: External Factors Dominate, Local Passive Adaptation
The three concentration types exhibit comparable urbanization intensity levels, with high-intensity clusters demonstrating a higher per capita GDP. Among socioeconomic factors, only population size shows a significant positive correlation with the agglomeration scale. High-intensity zones host substantially larger permanent resident populations compared to medium- and low-intensity clusters (28,946;
Figure 14 [X10]). The extended interquartile range in high-intensity population data reflects heterogeneous service infrastructure demands across clusters dominated by different factors. Nighttime light intensity analysis (
Figure 14 [X11]) measures all types at approximately 20% of Beijing’s urban core levels. Beijing’s scenic area nighttime closure policy fosters diurnal tourist–nocturnal resident spatiotemporal complementarity, creating closed-loop consumption patterns that reinforce peri-attraction clustering. The per capita GDP in the tertiary sector (
Figure 14 [X12]) shows that high-concentration zones (4357 RMB/person) exceed medium- (3058) and low-concentration zones (2873).
4. Discussion
4.1. Dual-Level Spatial Configuration Analysis
With the accelerated urbanization and tourism development in Beijing, the rural homestay industry has undergone rapid expansion. Overall, the spatial distribution of rural homestays exhibits a distinct “northern agglomeration and southern dispersion” pattern, which aligns with the northwest–high, southeast–low topographical configuration, indicating strong influences of the terrain and elevation. Contiguous high-density clusters are densely distributed in the northern exurban regions, likely attributable to their superior natural landscapes and abundant tourism resources—a characteristic distinct from mountain or coastal resort cities. In peri-urban zones such as the Daxing and Fangshan districts, isolated high-density patches emerge in kernel density maps, reflecting potential unique tourism resource endowments. In contrast, Shunyi district, home to the Capital International Airport with its early-stage development and mature hotel industry, shows a limited inventory of rural homestays. Temporally, the analysis integrated with Butler’s Tourism Area Life Cycle model reveals that the spatial distribution of rural homestays has been shaped by shifting dominant attractors across periods, with evolving influencing factors leading to a gradual stabilization after minor fluctuations.
This study investigates the spatial distribution of rural homestays in Beijing through three primary dimensions: vertical spatial characteristics, tourism resource attractiveness, and transportation accessibility. In terms of the vertical spatial distribution, rural homestays exhibit a strong correlation with Beijing’s diverse topography, revealing distinct elevation preferences in shallow and deep mountainous areas. Shallow mountainous zones facilitate daily operational efficiency for homestays, while deep mountainous areas offer superior natural resource conditions, collectively driving agglomerative patterns. Regarding tourism resources, high-level scenic attractions and tourist villages significantly attract homestay clustering, contrasting sharply with urban homestays (e.g., Airbnb) in location-driven mechanisms [
20]. However, traditional villages display highly varied agglomeration degrees due to uneven development levels. In historic–cultural cities, traditional streets and residences serve as key attractions, presenting a pivotal opportunity for future rural homestay development in Beijing. A 5 km radius around scenic spots represents an optimal accessibility threshold for tourist convenience, directly influencing accommodation choices through homestay quantity and accessibility. Yet, homestay agglomeration demonstrates non-linear relationships with attraction hierarchy, as the development intensity of scenic areas also shapes spatial clustering. Notably, a minority of high-tier attractions concentrate numerous homestays, highlighting the “head effects” of dominant scenic spots and their robust attraction to rural homestay agglomeration—a finding that underscores the stronger motivational drivers of premium attractions for tourists, extending prior research [
28]. In transportation, major arterial roads and key nodes significantly promote homestay clustering, reflecting a linear concentration pattern along corridors and emphasizing the dominant role of accessibility. Suburban railway stations, critical hubs connecting urban and rural tourism areas, foster peri-station homestay agglomeration, despite inefficient last-mile connectivity. In contrast, airports—strategically located in distant rural regions—primarily serve inbound or transit passengers who lack access to central hotels during layovers, creating unique opportunities for rapid homestay proliferation around airports. Longitudinal comparisons reveal that within a one-hour driving range, urban accessibility and scenic attraction appeal reach equilibrium; however, tourists exhibit tolerance for longer travel times to high-quality attractions, driven by their compelling appeal.
The Hotspot Analysis reveals that certain individual high- and medium-intensity zones, along with multiple low-intensity clusters, exhibit high spatial overlap with road orientations, indicating pronounced homestay agglomeration along transportation corridors. In some regions, high- and medium-intensity zones align with core–periphery dynamics, underscoring the catalytic role of core areas in driving spatial clustering. Localized convergence of two or three concentration zones is observed, attributable to proximity between tourism resource clusters at a micro-scale, albeit constrained by geographical and resource limitations. High-intensity zones demonstrate apex advantages, leveraging multifaceted synergies and unique characteristics to attract homestays and form distinct agglomerations—consistent with prior research. Medium-intensity zones display clustered distributions around shared cultural or scenic resources, achieving certain economies of scale; however, topographic barriers and heritage preservation policies impede contiguous development. These zones predominantly consist of small-scale boutique homestays (both professionally managed and independent), expanding haphazardly along terrain contours and roads due to absent unified planning frameworks. Low-intensity zones exhibit dispersed patterns, either peripherally attached to large–medium-concentration zones or linearly distributed along major roads. Relying solely on isolated high-quality attractions or traditional villages, these clusters lack supplementary support factors, hindering their evolution into higher-intensity agglomerations.
4.2. Four-Dimensional Influencing Factor Analysis
A comprehensive analysis of influencing factors at the municipal level in Beijing reveals that proximity to transportation nodes exerts the most significant impact on rural homestay agglomeration, while the arterial road network density demonstrates a minimal influence. This highlights that in well-connected rural regions, nodal accessibility—rather than mere road density—plays a dominant role in shaping spatial clustering, as road density alone proves insufficient to drive distribution patterns. Vegetation coverage ranks second in importance, underscoring the strong attraction of natural ecological conditions—sharply contrasting with urban environments—on homestay spatial allocation. Scenic attractions follow as the third determinant, potentially influenced by dual mechanisms: first, spatial policy constraints direct over 50% of homestays to cluster within a 5 km radius of attractions, reflecting regulatory impacts on distribution; second, the rapid development of emerging scenic areas in recent years, still in their growth phase, temporarily diminishes measurable quantitative effects. Average slope and arterial road network density exhibit the weakest impacts, indicating their universal yet foundational roles in shaping homestay distribution across Beijing. These findings further reveal that diversified transportation modes and landscape resources outweigh road infrastructure in driving cluster effects, and the preference for shallow mountainous areas reliant on expressway access—rather than pure network density—collectively define Beijing’s rural homestay spatial logic. Socioeconomic factors exhibit comparatively limited influence, demonstrating that in megacity hinterlands, rural homestay distribution prioritizes tourism experience quality over a high population density or economic vitality—a stark contrast to urban built-up areas. This pattern directly correlates with the sector’s heavy reliance on exogenous capital inflows, resulting in weak spatial coupling between the homestay distribution and regional endogenous economic levels.
Further investigation into influencing factors across Beijing’s ten districts reveals that individual factors’ impacts are relatively muted at the municipal level, underscoring the complexity of rural homestay spatial distribution. This complexity necessitates categorizing spatial heterogeneity into two distinct patterns. First, certain determinants exhibit a limited influence municipally but show significantly heightened effects at the district level. For instance, the density of key tourist villages demonstrates pronounced agglomeration effects in districts with abundant tourism resources, where established tourist villages outperform newly developed ones in attracting homestays. However, the scarcity of tourist villages in most districts constrains their aggregate impacts on homestay clustering. Second, some factors that are dominant at the municipal level exhibit a diminished district-level influence. Declining effects of the population size and tertiary sector GDP per capita in multiple districts highlight that large–medium homestay clusters rely more on natural environmental conditions and transportation accessibility than socioeconomic factors. In Tongzhou district, the influence of scenic attractions on the homestay distribution is substantially reduced, while the proximity to transportation nodes and arterial road network density emerge as dominant drivers—a pattern that reflects the high accessibility demands of emerging sub-center developments near megacities, fundamentally reshaping agglomeration characteristics. Compared to global cases, the developmental trajectories of tourism zones in Beijing are shaped by synergistic interactions among core advantages, general strengths, and constraints, collectively driving regionally differentiated outcomes.
By delineating the impacts of various factors on homestay clusters across agglomeration scales, this study reveals distinct patterns. In natural environments, shallow mountainous areas exhibit pronounced gradient advantages. The three concentration zone categories show comparable mean elevations, yet significant divergences in water network density and vegetation coverage, further underscoring mountains’ strong attraction to rural homestay agglomeration. Shallow mountainous zones serve as core spatial anchors for clustered development, while water resources alone prove insufficient to sustain high-intensity agglomeration, highlighting their supplementary role. The broader dispersion in low-intensity zones reflects the adaptive utilization of limited aquatic resources. The rural homestay distribution inversely mirrors urban patterns, evidencing ecological self-selection through vegetative barriers—a trend concentrated in ecologically advantaged areas. Vegetation coverage differences validate green ecological capacity constraints: high-intensity zones’ infrastructure expansion consumes vegetated land, while three-tiered natural resource gradients (elevational, hydrological, and vegetational) drive spatial differentiation through hierarchical equilibrium mechanisms, necessitating development scales that balance environmental carrying capacities.
Regarding tourism resources, high-intensity zones demonstrate apex advantages. Proximity to high-level attractions and key tourist villages shows a weak negative correlations with the concentration scale, reflecting Beijing’s abundant scenic resources’ capacity to support high homestay agglomeration. Traditional villages, however, exhibit marked spatial heterogeneity. High-intensity clusters concentrate near attraction cores, while medium- and low-intensity zones gradually diffuse toward peripheries, forming outward-expanding patterns. Tourist villages’ economic viability promotes homestay clustering, with low-intensity zones relying heavily on adjacent villages. Isolated traditional villages struggle to sustain further agglomeration, as low-intensity clusters predominantly occupy remote traditional settlements.
In transportation accessibility, rail transit nodes exert strong magnetic effects. While the arterial road density is comparable across concentration categories, the proximity to transportation nodes shows a significant negative correlation with the agglomeration scale. The minimal association between the road density and concentration magnitude reflects Beijing’s well-developed rural road networks, whereas nodal accessibility emerges as a critical driver of high-intensity clustering. Rail transit disproportionately influences rural homestay agglomeration compared to urban contexts, with medium-intensity zones demonstrating flexible node interactions. This contrast underscores rural clusters’ reliance on rapid rail access for external tourist inflows, contrasting with the limited advantages from road infrastructure alone.
Socioeconomically, external factors dominate, with local conditions passively adapting. Population disparities highlight labor availability and service industry extensions as critical enablers of agglomeration, while scale-driven development depends on external tourism economies. Nighttime light data reveal constrained peripheral infrastructure growth, exposing coexisting endogenous urbanization lag and exogenous capital-driven expansion. The tertiary sector GDP underscores external consumption’s role in clustering, as rural concentration zones absorb spillover demand from urban tourists, despite local economic limitations. These patterns starkly contrast with urban built-up areas, where homestay distribution prioritizes experiential quality over population density or economic vitality [
33], which is directly tied to Beijing’s reliance on exogenous capital inflows.
Furthermore, beyond the identified influencing factors, urban planning configurations significantly shape rural homestay development trajectories, underscoring the necessity of city-specific investigations. Additionally, future research must account for policy implementation dynamics—such as cultural heritage preservation policies and environmental protection regulations—that may alter homestay agglomeration patterns. These contextual nuances differentiate this study from Airbnb-focused research in regions like the United States, where market-driven mechanisms and regulatory frameworks diverge markedly from Beijing’s policy-anchored, resource-constrained rural contexts [
1].
5. Conclusions
This study investigates the spatial distribution characteristics and influencing factors of rural homestays in Beijing through the integrated application of the Nearest Neighbor Index, Kernel Density Estimation, Standard Deviational Ellipse Analysis, Hotspot Analysis, and Geodetector methodologies. Three key conclusions emerge regarding their spatiotemporal patterns. First, the spatiotemporal configuration of Beijing’s rural homestays is shaped by multifactorial interactions, with significant variations in spatial agglomeration–dispersion dynamics across scales. Second, while the overall spatial distribution exhibits a dispersed pattern, pronounced clustering occurs in exurban shallow mountainous areas. Third, the spatial configuration demonstrates heterogeneous “northern agglomeration versus southern dispersion” characteristics. Regions abundant in tourism resources, such as the Yanqing and Huairou districts, exhibit higher kernel density values that closely align with low-altitude, gentle-slope terrain features. Temporally, the sector displays cyclical “expansion–contraction” fluctuations, with the spatial orientation shifting from northeast to southwest and developmental scope oscillating between expansion and contraction. Despite these fluctuations, the geographical centroid remains anchored within Huairou district, demonstrating stabilization trends over time.
To investigate the influencing mechanisms of various factors on the spatial distribution of rural homestays, this study quantifies the impact intensity of each determinant. The results demonstrate that proximity to transportation nodes and vegetation coverage exert the most significant driving effects on homestay agglomeration, while socioeconomic factors exhibit comparatively limited influences. Transportation accessibility serves as the primary driver of rural homestay agglomeration, with over 80% of establishments clustering within 1 km road buffer zones, exhibiting a bimodal distribution relative to regional administrative centers. Homestays predominantly concentrate along arterial roads and near transportation nodes, demonstrating infrastructure-dependent spatial logic. Natural environmental factors rank second in influence, as tourists’ demand for ecological experiences drives homestay concentration in resource-dense areas. Tourism resource attractiveness exerts a substantial impact, with dominant scenic spots demonstrating head effects. Socioeconomic factors show minimal influences, in stark contrast to urban built-up areas.
Furthermore, varying agglomeration scales of rural homestay clusters lead to differentiated impacts of influencing factors. By analyzing the homestay density, this study classifies these clusters into three categories—high-concentration zones, medium-concentration zones, and low-concentration zones—revealing divergent formation mechanisms across scales. The Yanqing and Huairou districts in northern Beijing form high- and medium-intensity clusters anchored by the Great Wall scenic corridor, contrasting with southern regions exhibiting dispersed distributions lacking significant clustering. Arterial road alignments, geographical configurations, and resource endowments collectively shape the concentration zones’ spatial distributions, with high-intensity clusters accounting for 40% of total homestays, demonstrating hierarchical dominance. Six high-intensity clusters along Beijing’s administrative boundaries leverage multifaceted advantages—historical architecture, capital investment, natural landscapes, and transportation hubs—to achieve concentrated development. Fifteen medium-intensity clusters in peripheral areas coalesce around cultural assets, natural scenery, and themed leisure, yet exhibit disordered spatial expansion along terrain contours due to topographic constraints, transportation deficiencies, and planning voids. Low-intensity clusters either peripherally attach to higher-intensity zones or occupy isolated locations with minimal agglomeration.
This study offers a comprehensive perspective for investigating the spatiotemporal distribution patterns and developmental trajectories of rural homestays while providing novel insights into their spatial determinants. However, several limitations warrant acknowledgment. First, the analysis focused on representative rural homestays in Beijing; future studies could replicate this framework across diverse rural regions to test the universality of spatial distribution laws and influencing mechanisms. Second, while this research explores geographic phenomena and socioeconomic interrelationships from a planning-oriented lens, incorporating interdisciplinary theories and methodologies—such as policy evaluation models or cultural anthropology frameworks—could deepen our understanding of rural homestays’ interactions with regional policy frameworks and cultural contexts.


