
Reconstruction of Cropland for the Rikaze Area of China Since the Tubo Dynasty (AD 655)

 ,
,
Abstract
1. Introduction
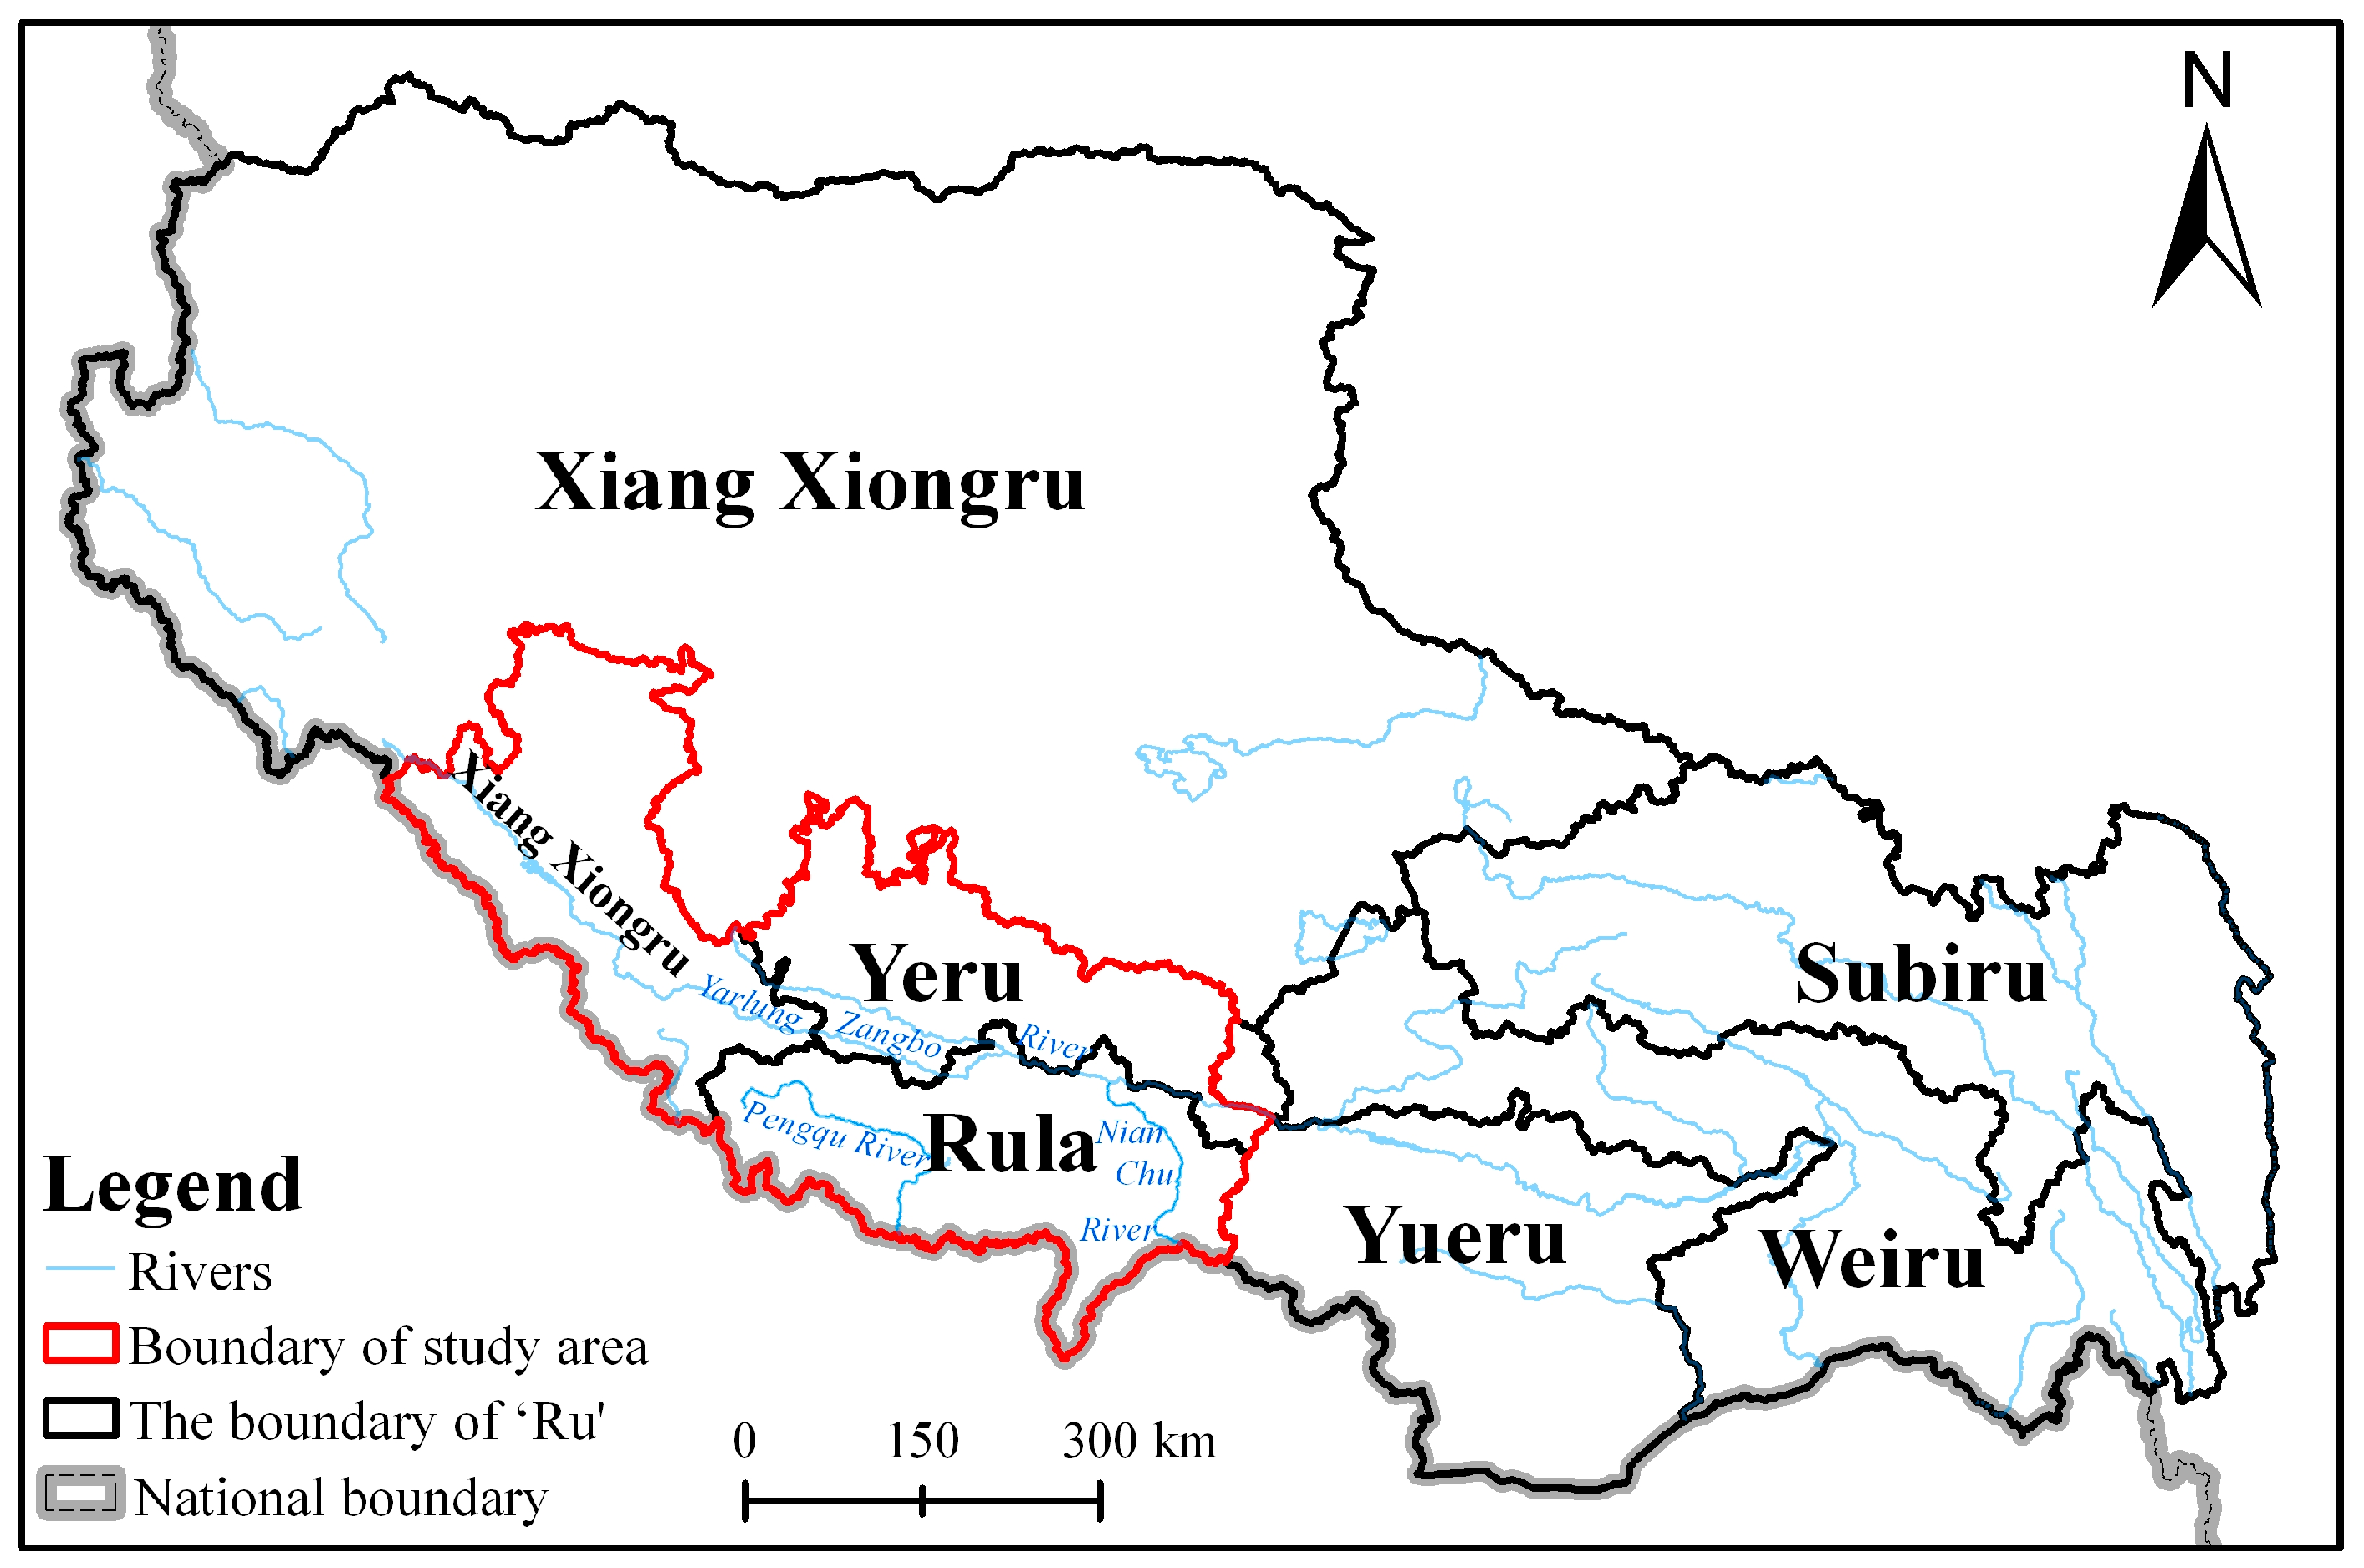
2. Study Area
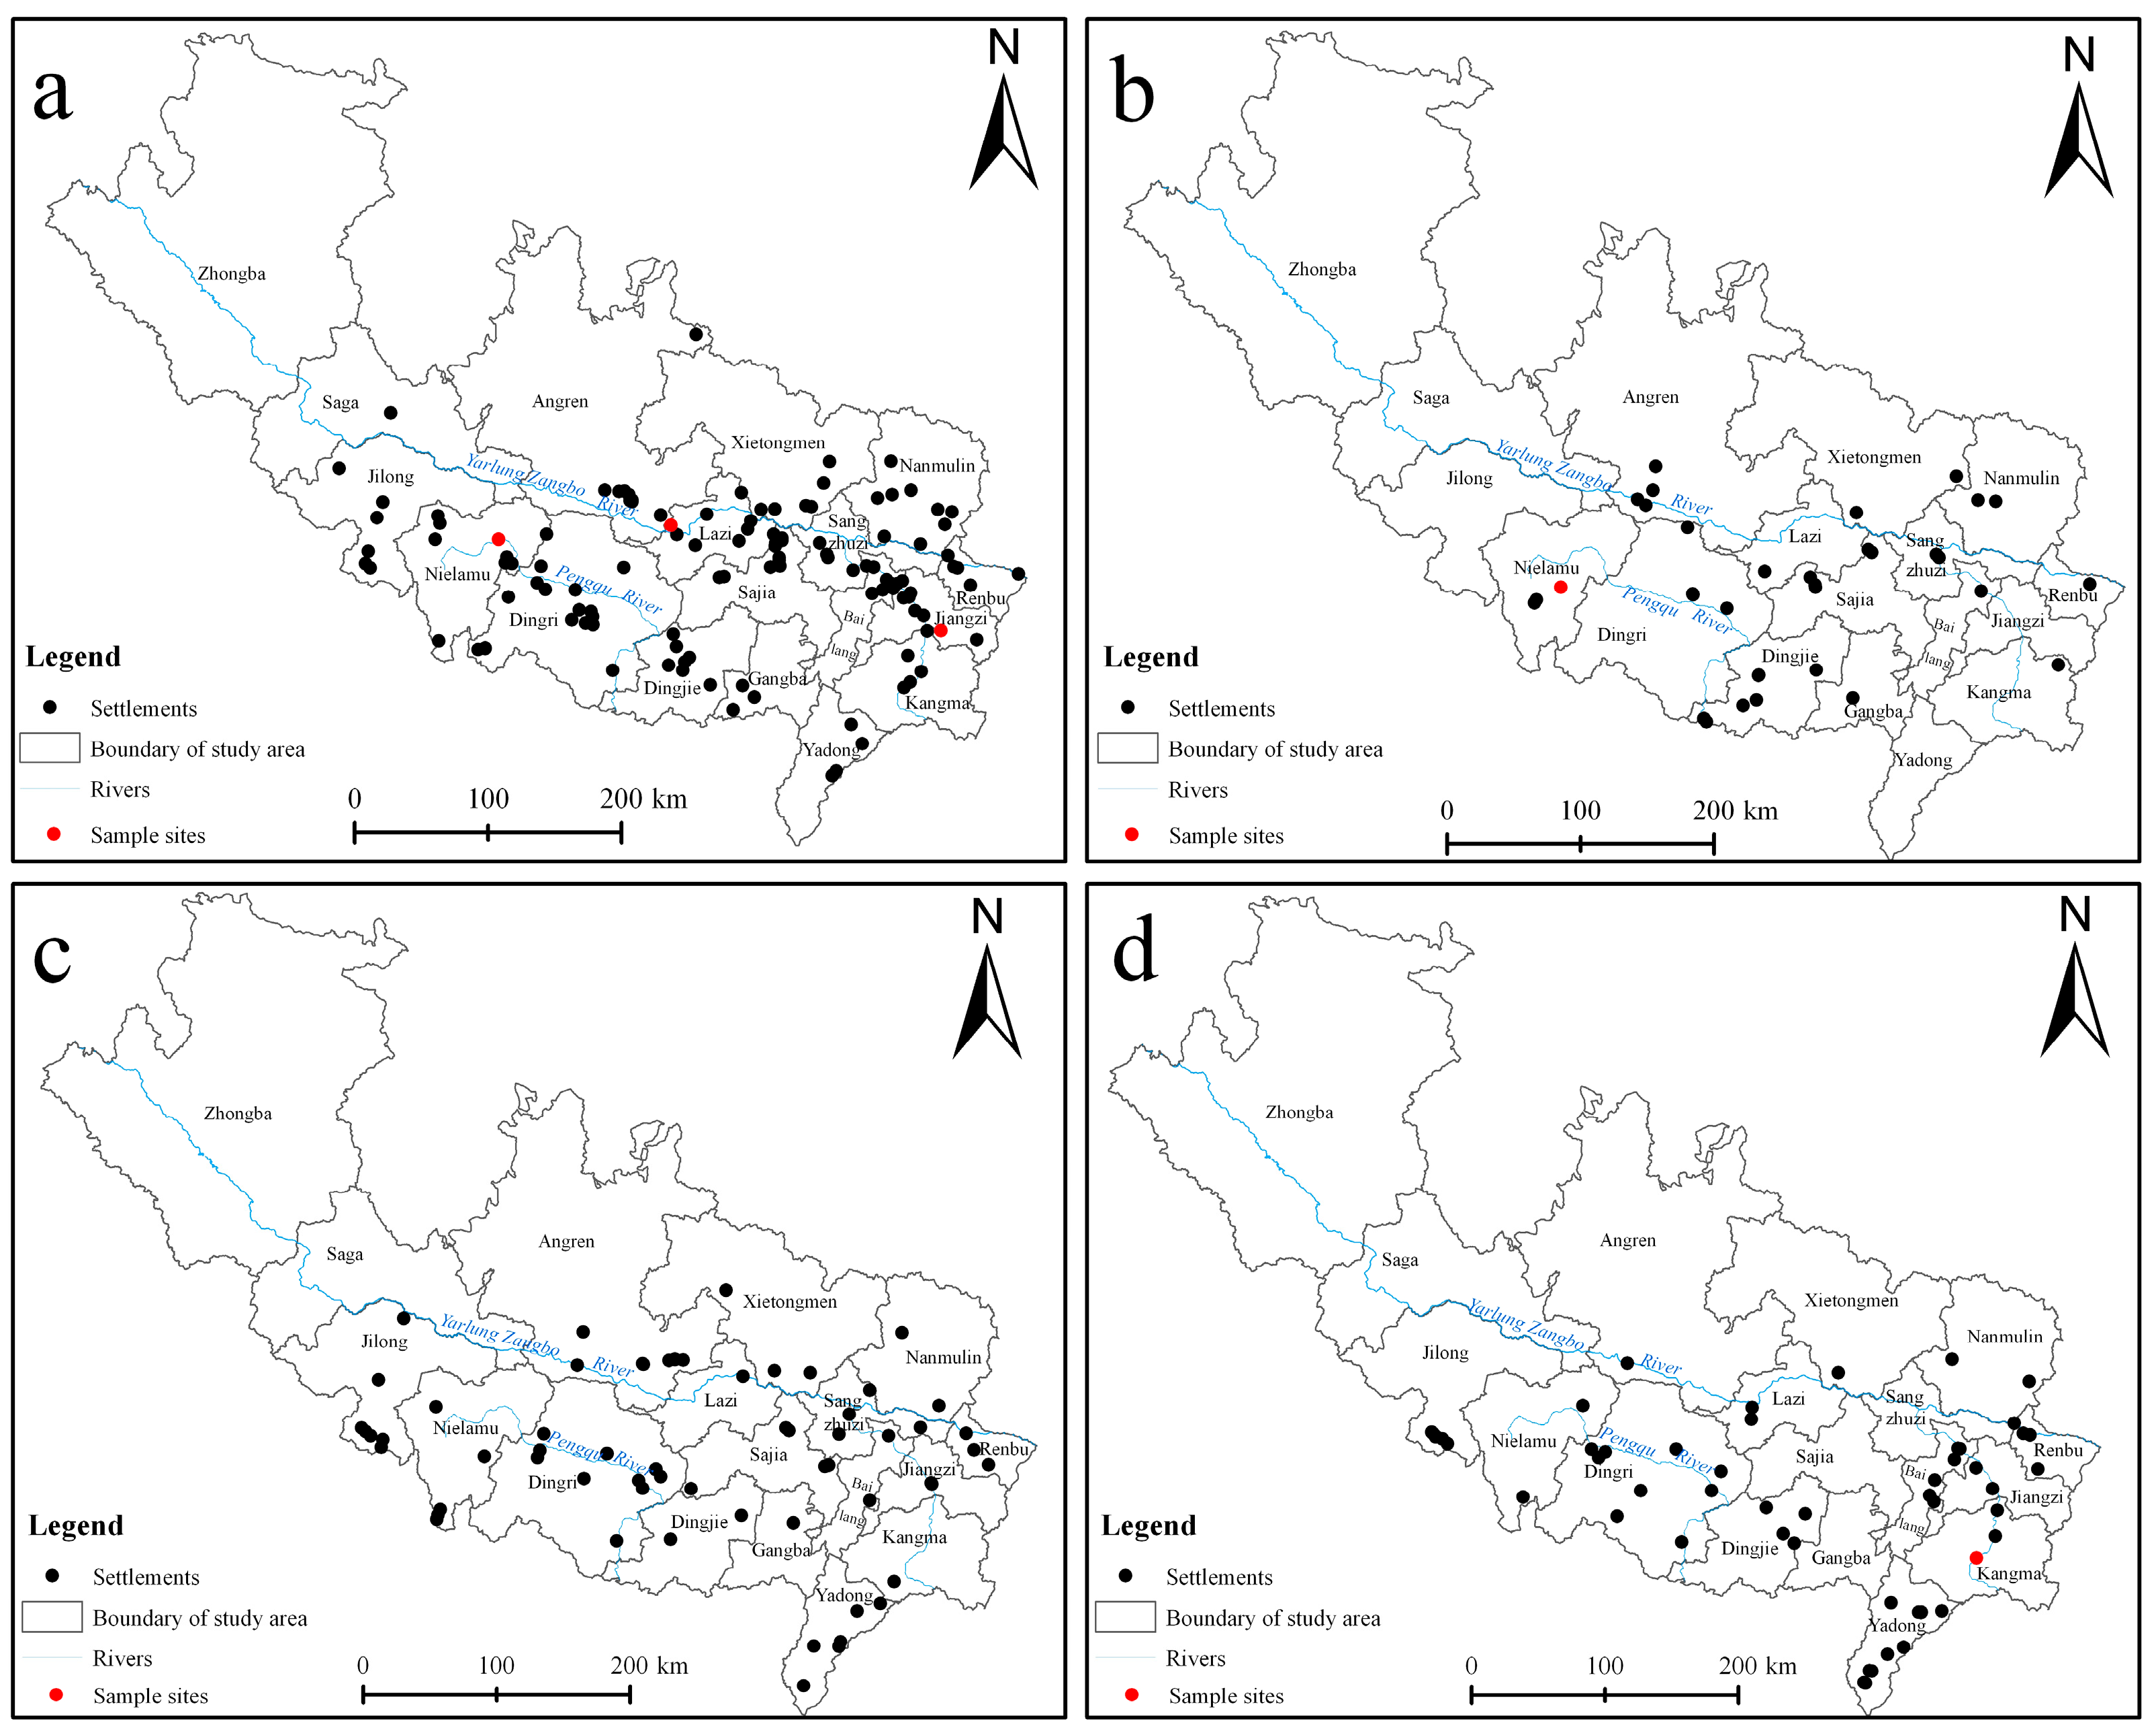
3. Data and Methods
3.1. Estimation of Cropland Area
3.1.1. Tubo Dynasty (AD 655)
3.1.2. Yuan Dynasty (AD 1287)
3.1.3. Ming Dynasty (AD 1368)
3.1.4. Qing Dynasty (AD 1830)
3.2. Gridding Reconstruction Model
3.2.1. Maximum Distribution Extent of Cropland
3.2.2. Selection of Dominant Factors Influencing Cropland Distribution
3.2.3. Construction of Gridding Model Based on Geographical Weighted Regression
4. Results
4.1. Cropland Area in the Tubo, Yuan, Ming, and Qing Dynasties
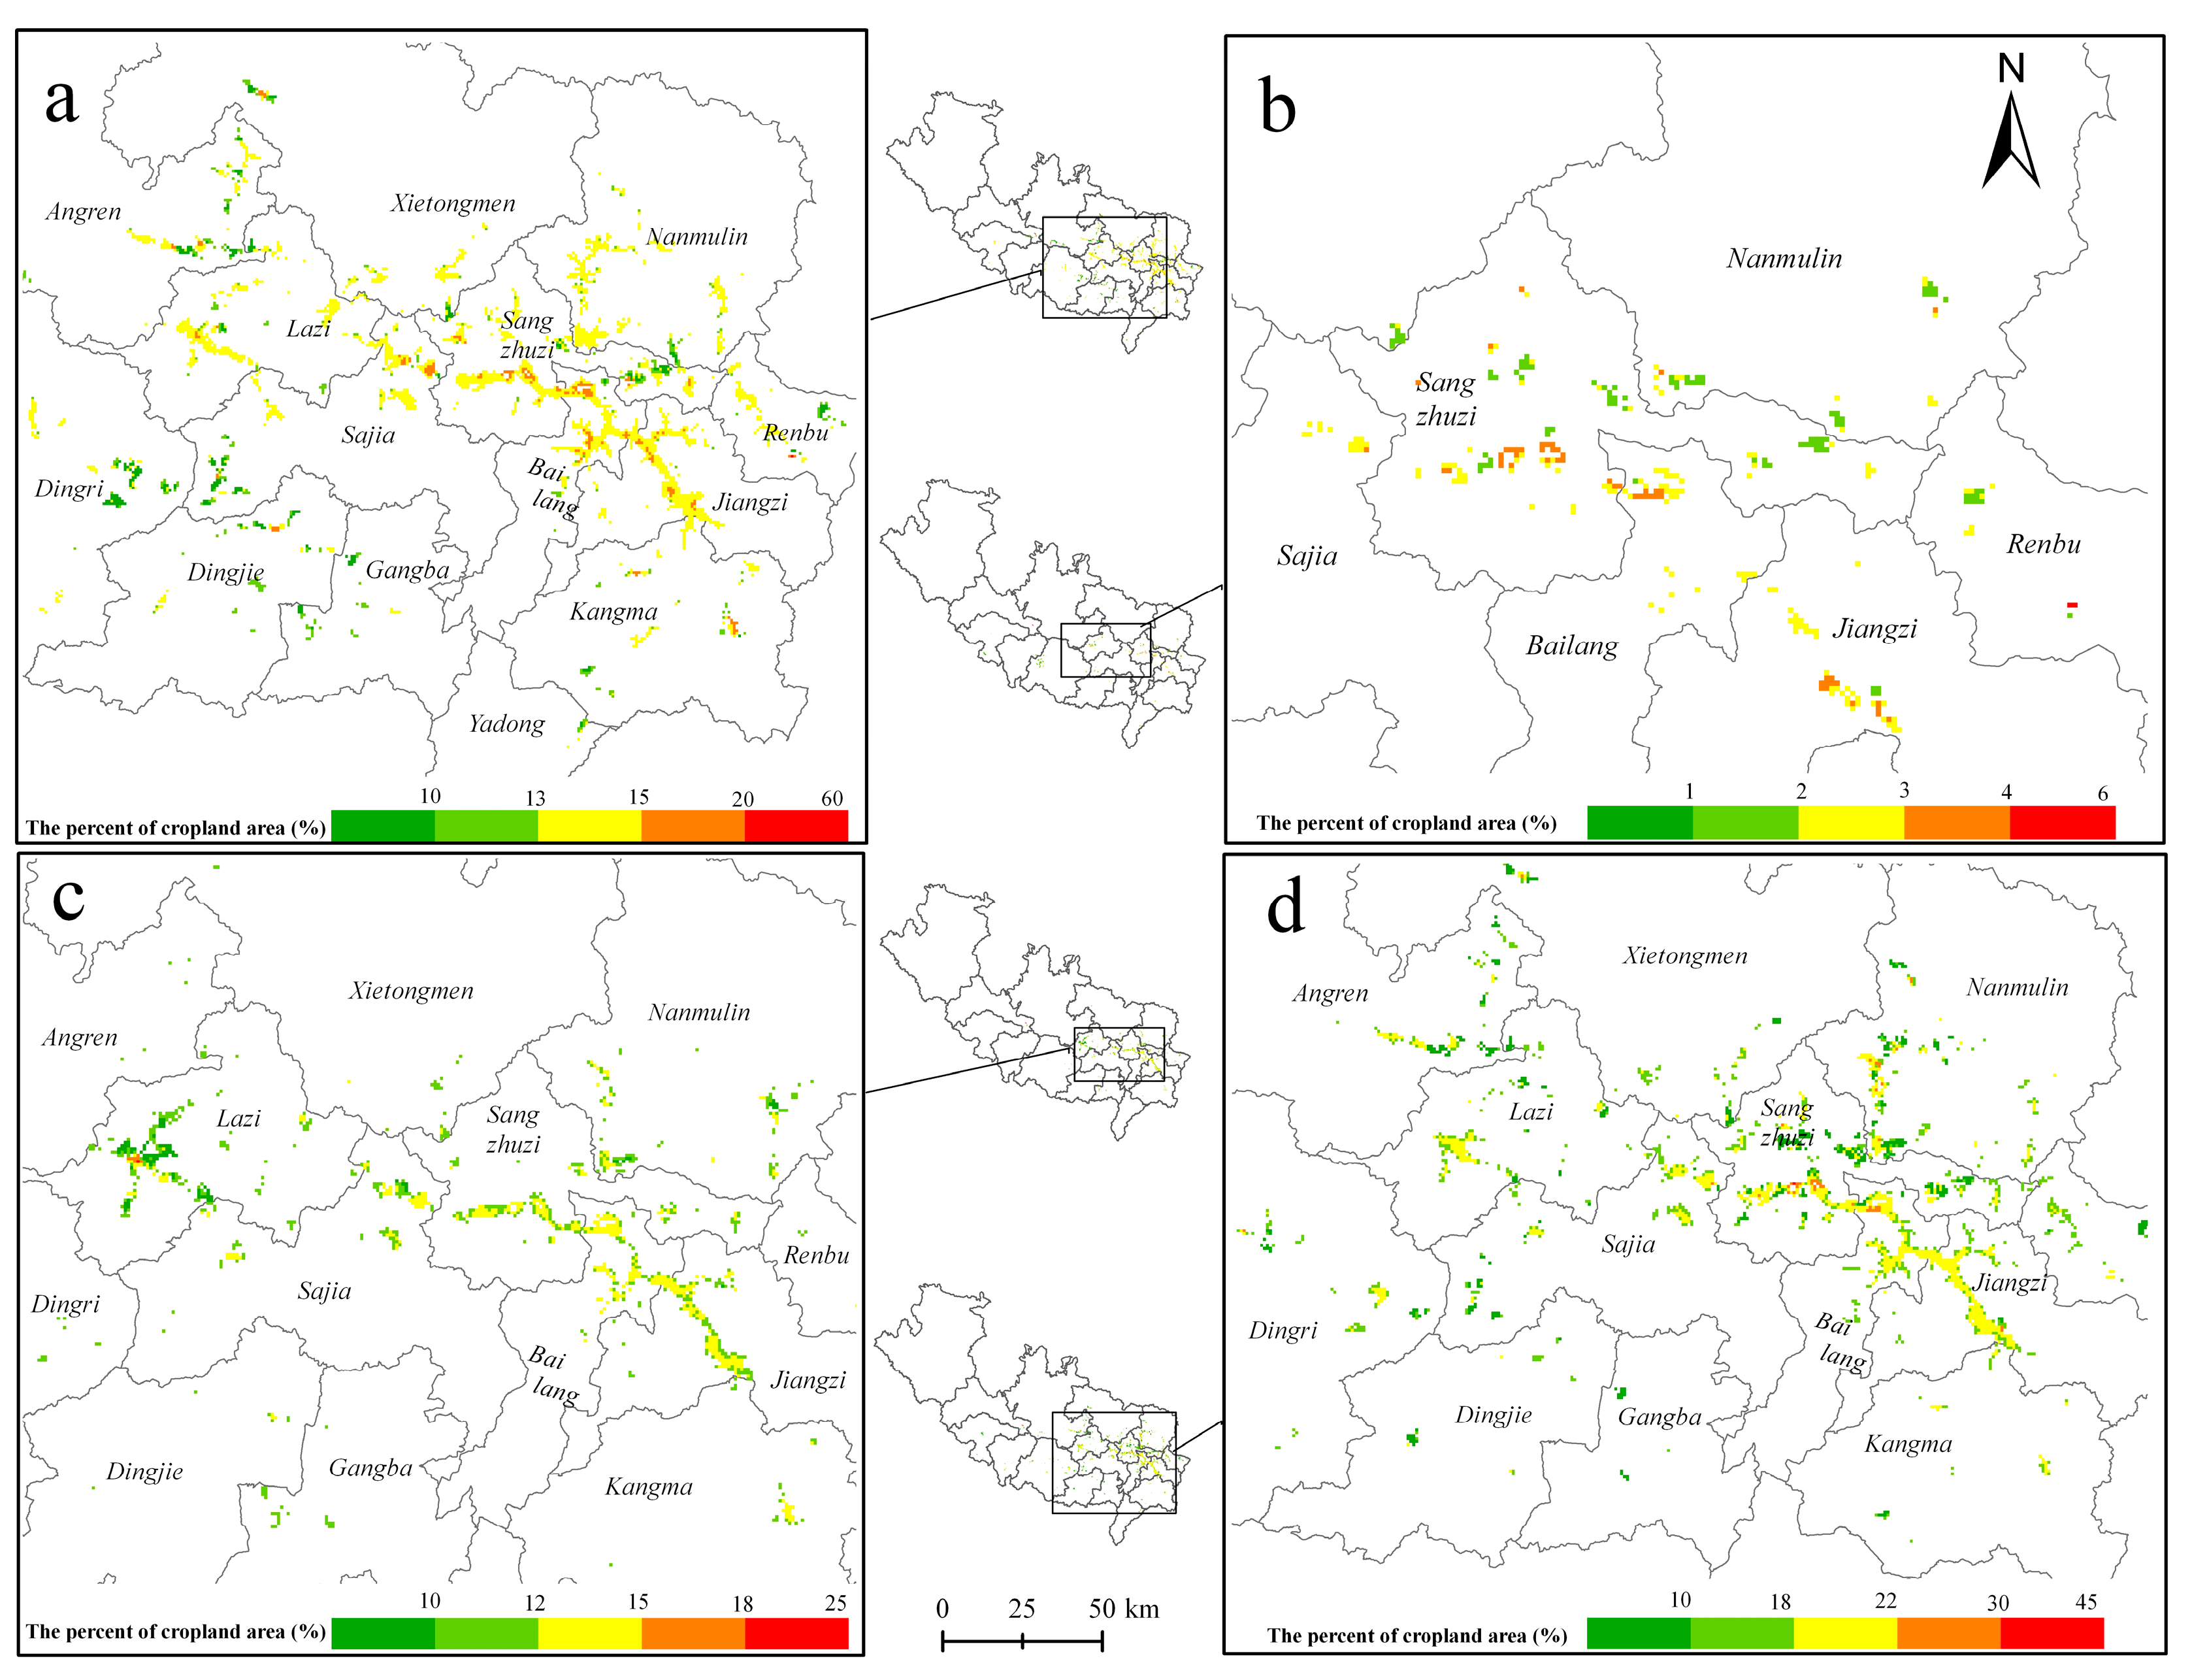
4.2. Spatial Distribution of Cropland in the Tubo, Yuan, Ming, and Qing Dynasties
5. Discussion
5.1. Comparisons with Previous Studies
5.2. Uncertainties and Prospects
5.3. Marginal Characteristics
6. Conclusions
Supplementary Materials
Author Contributions
Funding
Data Availability Statement
Acknowledgments
Conflicts of Interest
References
- Zhao, Q.; Yu, L.; Chen, X. Land system science and its contributions to sustainable development goals: A systematic review. Land Use Policy 2024, 143, 107221. [Google Scholar] [CrossRef]
- Fuchs, R.; Schulp, C.J.E.; Hengeveld, G.M.; Verburg, P.H.; Clevers, J.G.P.W.; Schelhaas, M.-J.; Herold, M. Assessing the influence of historic net and gross land changes on the carbon fluxes of Europe. Glob. Chang. Biol. 2016, 22, 2526–2539. [Google Scholar] [CrossRef] [PubMed]
- Li, S.; Cao, Y.; Liu, J.; Wang, S. Simulating land use change for sustainable land management in China’s coal resource-based cities under different scenarios. Sci. Total Environ. 2024, 916, 170126. [Google Scholar] [CrossRef]
- Robinson, D.T.; Di Vittorio, A.; Alexander, P.; Arneth, A.; Barton, C.M.; Brown, D.G.; Kettner, A.; Lemmen, C.; O’Neill, B.C.; Janssen, M.; et al. Modelling feedbacks between human and natural processes in the land system. Earth Syst. Dynam. 2018, 9, 895–914. [Google Scholar] [CrossRef]
- Goldewijk, K.K. Estimating global land use change over the past 300 years: The HYDE database. Glob. Biogeochem. Cycles 2001, 15, 417–433. [Google Scholar] [CrossRef]
- Klein Goldewijk, K.; Beusen, A.; van Drecht, G.; de Vos, M. The HYDE 3.1 spatially explicit database of human-induced global land-use change over the past 12,000 years. Glob. Ecol. Biogeogr. 2011, 20, 73–86. [Google Scholar] [CrossRef]
- Klein Goldewijk, K.; Beusen, A.; Doelman, J.; Stehfest, E. Anthropogenic land use estimates for the Holocene–HYDE 3.2. Earth Syst. Sci. Data 2017, 9, 927–953. [Google Scholar] [CrossRef]
- Ramankutty, N.; Foley, J.A. Estimating historical changes in global land cover: Croplands from 1700 to 1992. Glob. Biogeochem. Cycles 1999, 13, 997–1027. [Google Scholar] [CrossRef]
- Peng, S.; Ciais, P.; Maignan, F.; Li, W.; Chang, J.; Wang, T.; Yue, C. Sensitivity of land use change emission estimates to historical land use and land cover mapping. Glob. Biogeochem. Cycles 2017, 31, 626–643. [Google Scholar] [CrossRef]
- Fuchs, R.; Prestele, R.; Verburg, P.H. A global assessment of gross and net land change dynamics for current conditions and future scenarios. Earth Syst. Dynam. 2018, 9, 441–458. [Google Scholar] [CrossRef]
- Li, B.; Fang, X.; Ye, Y.; Zhang, X. Accuracy assessment of global historical cropland datasets based on regional reconstructed historical data—A case study in Northeast China. Sci. China Earth Sci. 2010, 53, 1689–1699. [Google Scholar] [CrossRef]
- Li, S.; He, F.; Zhang, X.; Zhou, T. Evaluation of global historical land use scenarios based on regional datasets on the Qinghai-Tibet Area. Sci. Total Environ. 2019, 657, 1615–1628. [Google Scholar] [CrossRef] [PubMed]
- Zhang, X.; He, F.; Li, S. Reconstructed cropland in the mid-eleventh century in the traditional agricultural area of China: Implications of comparisons among datasets. Reg. Environ. Chang. 2013, 13, 969–977. [Google Scholar] [CrossRef]
- Yang, X.; Guo, B.; Jin, X.; Long, Y.; Zhou, Y. Reconstructing spatial distribution of historical cropland in China’s traditional cultivated region: Methods and case study. Chin. Geogr. Sci. 2015, 25, 629–643. [Google Scholar] [CrossRef]
- He, F.; Yang, F.; Zhao, C.; Li, S.; Li, M. Spatially explicit reconstruction of cropland cover for China over the past millennium. Sci. China Earth Sci. 2023, 66, 111–128. [Google Scholar] [CrossRef]
- Li, S.; He, F.; Zhang, X. A spatially explicit reconstruction of cropland cover in China from 1661 to 1996. Reg. Environ. Chang. 2016, 16, 417–428. [Google Scholar] [CrossRef]
- Ye, Y.; Wei, X.; Li, F.; Fang, X. Reconstruction of cropland cover changes in the Shandong Province over the past 300 years. Sci. Rep. 2015, 5, 13642. [Google Scholar] [CrossRef]
- Ye, Y.; Li, J.; Fang, X.; Zhang, D.; Zhao, Z.; Wu, Z.; Lu, Y.; Li, B. Reconstruction of cropland change in European countries using integrated multisource data since AD 1800. Boreas 2023, 52, 60–77. [Google Scholar] [CrossRef]
- Li, J.; Ye, Y.; Fang, X.; Zhang, D.; Wu, Z. Spatially explicit reconstruction of cropland cover in Europe from AD 1800 to 2000. Sci. China Earth Sci. 2024, 67, 2953–2971. [Google Scholar] [CrossRef]
- Zhao, Z.; Fang, X.; Ye, Y.; Zhang, C.; Zhang, D. Reconstruction of cropland area in the European part of Tsarist Russia from 1696 to 1914 based on historical documents. J. Geogr. Sci. 2020, 30, 1307–1324. [Google Scholar] [CrossRef]
- Li, S.; He, F.; Liu, X.; Hua, L. Historical land use reconstruction for South Asia: Current understanding, challenges, and solutions. Earth-Sci. Rev. 2023, 238, 104350. [Google Scholar] [CrossRef]
- Liu, X.; Li, S.; He, F.; Hua, L. Reconstruction of cropland areas for South Asia from AD 640 to 2016. Reg. Environ. Chang. 2022, 22, 79. [Google Scholar] [CrossRef]
- Liu, X.; Liu, H. The application of ANN-FLUS model in reconstructing historical cropland distribution changes: A case study of Vietnam from 1885 to 2000. J. Nat. Resour. 2024, 39, 1473. [Google Scholar] [CrossRef]
- Yu, Z.; Jin, X.; Miao, L.; Yang, X. A historical reconstruction of cropland in China from 1900 to 2016. Earth Syst. Sci. Data 2021, 13, 3203–3218. [Google Scholar] [CrossRef]
- Long, Y.; Jin, X.; Yang, X.; Zhou, Y. Reconstruction of historical arable land use patterns using constrained cellular automata: A case study of Jiangsu, China. Appl. Geogr. 2014, 52, 67–77. [Google Scholar] [CrossRef]
- Luo, J.; Chen, Q.; Liu, F.; Zhang, Y.; Zhou, Q. Methods for reconstructing historical cropland spatial distribution of the Yellow River—Huangshui River valley in Tibetan Plateau. Prog. Geogr. 2015, 34, 207–216. [Google Scholar]
- Wu, Z.; Liu, F.; Chen, Q.; Zhou, Q.; Yang, D. Reconstruction of cropland spatial patterns in 733 AD in the Yellow River-Huangshui River Valley. Resour. Sci. 2017, 39, 252–262. [Google Scholar]
- Luo, J.; Zhang, Y.; Liu, F.; Chen, Q.; Zhou, Q.; Zhang, H. Reconstruction of cropland spatial patterns for 1726 on Yellow River-Huangshui River Valley in northeast Qinghai-Tibet Plateau. Geogr. Res. 2014, 33, 1285–1296. [Google Scholar]
- Tibet Scientific Investigation Team of Chinese Academy of Sciences. Qomolangma Area Scientific Investigation Report: 1966–1968 Quaternary Geology; Science Press: Beijing, China, 1976. [Google Scholar]
- Shargen, W. The earliest evidence of prehistoric agriculture in the middle and upper reaches of the Yarlung Zangbo River at Kuoxiong Site. Pop. Archaeol. 2022, 7, 61–65. [Google Scholar]
- Yuan, R. Study on the Development Strategy of Modern Agriculture in Xigase Area; Kunming University of Science and Technology: Kunming, China, 2014. [Google Scholar]
- Shigatse District Chronicle Editorial Committee. Beautiful Shigatse; Tibetan Ancient Books Publishing House: Lhasa, China, 2016. [Google Scholar]
- Lhagpa, P.; Chen, Q.; Zhang, Y. General History of Tibet; China Zangxue Press: Beijing, China, 2015. [Google Scholar]
- Xu, Z. Ancient Architecture of Tibet; China Architecture Building Press: Beijing, China, 2015. [Google Scholar]
- Chen, C. Local Economic History of Tibet; Journal of Xizang Minzu University: Xianyang, China, 2009. [Google Scholar]
- Liu, R. Population of China Tibet Volume; China Financial Economic Publishing House: Beijing, China, 1988. [Google Scholar]
- Tan, Q. The Historical Atlas of China; China Cartographic Publishing House: Beijing, China, 1982. [Google Scholar]
- Luo, J. Reconstruction of Historical Human Activity Intensity and Analysis of Its Change Motivation in the Yarlung Zangbo River, Nyang Qu River, and Lhasa River Region; Qinghai Normal University: Xining, China, 2024. [Google Scholar]
- Ma, G.; Bai, X. Discussion on thirteen wanhu in the Wusi-Tibet region in the Yuan Dynasty. Business 2016, 115–117. [Google Scholar]
- Luciano, P. A Study on the History of Tibet in the Yuan Dynasty; Yunnan People’s Publishing House: Yunnan, China, 2002. [Google Scholar]
- Dacang Zongba Banjue Sangbu. History of the Han and Tibetan; The Tibet People’s Publishing House: Lhasa, China, 1434. [Google Scholar]
- Ma, R. Population and Society in Tibet; Tongxin Publishing House: Beijing, China, 1996. [Google Scholar]
- Liu, S. On the Distribution of Population in Ming Dynasty; Zhengzhou University: Zhengzhou, China, 2005. [Google Scholar]
- Wei, Y. The Records of ShengWu; Zhonghua Book Company: Beijing, China, 1984. [Google Scholar]
- Cao, S. The History of Chinese Population; Fudan University Press: Shanghai, China, 2001. [Google Scholar]
- Kelsang, D.; Lobsang, G.; Yishu. An Inventory of the Year of the Iron Tiger; China Zangxue Press: Beijing, China, 1830. [Google Scholar]
- Wang, Y.; Tao, J.; Liu, F.; Zhang, Y.; Chen, Q. Reconstruction of cropland spatial pattern in 1830 in the middle reaches of Yarlung Zangbo River Valley. Geogr. Res. 2015, 34, 2355–2367. [Google Scholar]
- Rikaze District Chronicle Editorial Committee. Annals of Rikaze Region; China Zangxue Press: Beijing, China, 2011. [Google Scholar]
- National Lake Database. National Geographic Information Resources Directory Service System. Available online: https://www.webmap.cn/commres.do?method=result25W (accessed on 8 August 2024).
- NASA. NASA Digital Elevation Model Dataset. Available on the NASA Geographic Data Platform. Available online: https://vertex.daac.asf.alaska.edu/# (accessed on 25 July 2024).
- Geographic Data Platform of Peking University. School of Urban and Environmental Sciences, Peking University. Available online: http://geodata.pku.edu.cn (accessed on 8 August 2024).
- National Cultural Heritage Administration. China Cultural Relics Atlas: Tibetan Autonomous Region; Cultural Relics Publishing House: Beijing, China, 2010. [Google Scholar]
- Wu, Z. Geographical Names of Tibet; China Zangxue Press: Beijing, China, 1996. [Google Scholar]
- Ramsey, C.B.; Dee, M.W.; Rowland, J.M.; Higham, T.F.G.; Harris, S.A.; Brock, F.; Quiles, A.; Wild, E.M.; Marcus, E.S.; Shortland, A.J. Radiocarbon-based chronology for dynastic Egypt. Science 2010, 328, 1554–1557. [Google Scholar] [CrossRef] [PubMed]
- Reimer, P.J.; Austin, W.E.N.; Bard, E.; Bayliss, A.; Blackwell, P.G.; Ramsey, C.B.; Butzin, M.; Cheng, H.; Edwards, R.L.; Friedrich, M. The IntCal20 Northern Hemisphere radiocarbon age calibration curve (0–55 cal kBP). Radiocarbon 2020, 62, 725–757. [Google Scholar] [CrossRef]
- Liu, Y.; Yuan, L. Study on climate factors affecting the yield of highland barley in the Rikaze region of Tibet. Agric. Technol. 2013, 33, 190. [Google Scholar]
- Zhou, L. History of Yuan; Shanghai People’s Publishing House: Shanghai, China, 2019. [Google Scholar]
- Pedro, C. The Land and Politics of Tibet; Tibet Autonomous Region Academy of Social Sciences: Lhasa, China, 1985. [Google Scholar]
- Chen, Q.; Yang, L.E.; Luo, J.; Liu, F.; Zhang, Y.; Zhou, Q.; Guo, R.; Gu, X. The 300 years cropland changes reflecting climate impacts and social resilience at the Yellow River–Huangshui River Valley, China. Environ. Res. Lett. 2021, 16, 65006. [Google Scholar] [CrossRef]
- Li, S.; Wang, Z.; Zhang, Y. Crop cover reconstruction and its effects on sediment retention in the Tibetan Plateau for 1900–2000. J. Geogr. Sci. 2017, 27, 786–800. [Google Scholar] [CrossRef]
- Zhang, S. Research on the Influence of Sui-Tang Warm Period and Its Transition on the Rise and Fall of the Tubo Dynasty; China University of Geosciences: Beijing, China, 2021. [Google Scholar]


| Period | Tubo Dynasty | Yuan Dynasty | Ming Dynasty | Qing Dynasty |
|---|---|---|---|---|
| Population (×104) | 75.90 | 8.60 | 9.00 | 24.40 |
| Cropland area (mu) | 591,927.18 | 18,338.09 | 200,000 | 547,000 |
| Dynasty | Cropland Area | Reclamation Rate Interval/% | ||||
|---|---|---|---|---|---|---|
| Proportion of Cropland Grid/% | Average Rate of Reclamation/% | ≤10 | 10~15 | 15~20 | ≥20 | |
| Tubo | 1.67 | 12.99 | 0.16 | 1.41 | 0.10 | 0.005 |
| Yuan | 0.30 | 2.27 | 0.30 | - | - | - |
| Ming | 0.63 | 11.57 | 0.05 | 0.58 | 0.003 | 0.003 |
| Qing | 1.17 | 17.05 | 0.03 | 0.25 | 0.79 | 0.09 |
Disclaimer/Publisher’s Note: The statements, opinions and data contained in all publications are solely those of the individual author(s) and contributor(s) and not of MDPI and/or the editor(s). MDPI and/or the editor(s) disclaim responsibility for any injury to people or property resulting from any ideas, methods, instructions or products referred to in the content. |
© 2025 by the authors. Licensee MDPI, Basel, Switzerland. This article is an open access article distributed under the terms and conditions of the Creative Commons Attribution (CC BY) license (https://creativecommons.org/licenses/by/4.0/).
Share and Cite
Pan, H.; Chen, Q.; Wu, Z.; Zhi, Z.; Fang, W.; Sun, J.; Shi, Y. Reconstruction of Cropland for the Rikaze Area of China Since the Tubo Dynasty (AD 655). Land 2025, 14, 994. https://doi.org/10.3390/land14050994
Pan H, Chen Q, Wu Z, Zhi Z, Fang W, Sun J, Shi Y. Reconstruction of Cropland for the Rikaze Area of China Since the Tubo Dynasty (AD 655). Land. 2025; 14(5):994. https://doi.org/10.3390/land14050994
Chicago/Turabian StylePan, Hongxia, Qiong Chen, Zhilei Wu, Zemin Zhi, Wenguo Fang, Jiaqian Sun, and Yanan Shi. 2025. "Reconstruction of Cropland for the Rikaze Area of China Since the Tubo Dynasty (AD 655)" Land 14, no. 5: 994. https://doi.org/10.3390/land14050994
APA StylePan, H., Chen, Q., Wu, Z., Zhi, Z., Fang, W., Sun, J., & Shi, Y. (2025). Reconstruction of Cropland for the Rikaze Area of China Since the Tubo Dynasty (AD 655). Land, 14(5), 994. https://doi.org/10.3390/land14050994