Article

Analysis of the Evolution of Non-Agriculturization Arable Land Use Pattern and Its Driving Mechanisms

1
College of Natural Resources and Environment, South China Agricultural University, Guangzhou 510642, China
2
Tangshan Vocational and Technical College, Tangshan 063000, China
3
Yanshan Late-Maturing Peach Technology Innovation Center, Tangshan 063000, China
4
Aerospace Wanyuan Cloud Data Hebei Co., Ltd., Tangshan 063000, China
5
College of Tropical Crops, Hainan University, Haikou 570208, China
*
Author to whom correspondence should be addressed.
Land 2025, 14(5), 968; https://doi.org/10.3390/land14050968 (registering DOI)
Submission received: 7 April 2025 / Revised: 27 April 2025 / Accepted: 29 April 2025 / Published: 30 April 2025

Abstract

:
Arable land is a crucial natural resource for human survival and development, which supports food production, ecological services, and material–energy cycling. It is not only an important production resource for agriculture but also a key guarantee for ensuring food security and sustainable agricultural development. Understanding the current utilization of arable land, exploring the spatial–temporal evolution characteristics, and analyzing the driving mechanisms behind its pattern changes are essential for the rational allocation and sustainable utilization of arable land resources. This study focuses on the utilization of arable land in Guangzhou from 2005 to 2018, employing methods such as statistical analysis and spatial econometrics to provide an in-depth analysis of the spatial–temporal distribution characteristics and driving mechanisms of arable land changes. The results show that from 2005 to 2018, the issue of the conversion of arable land to non-agricultural uses was quite severe in Guangzhou, with the primary form being the conversion of arable land into urban residential construction land. Kernel density analysis revealed that non-agriculturization in Guangzhou exhibited spatial clustering, mainly concentrated in areas with lower elevation. Using standard deviation ellipses and centroid migration analysis, it was found that the center of gravity of non-agriculturization in Guangzhou was generally distributed in a southwest–northeast direction, with a more distinct dispersion compared to the northwest–southeast direction. From 2005 to 2010, the rapid increase in the non-agriculturization rate of arable land in Guangzhou was mainly driven by population density and per capita income, both having a positive impact. From 2010 to 2015, the main driving factor shifted to regional GDP. From 2015 to 2018, regional GDP and the value of the tertiary industry became the main driving factors, but unlike the impact of GDP, the tertiary industry exerted a negative influence on non-agriculturization.

1. Introduction

Arable land is the material basis for human survival and development [1,2], with its core function being to provide food for humanity [3]. Changes in arable land resources directly impact the actual food production capacity, thereby affecting global food security and the sustainable development of agriculture [4]. As the most populous country in the world, China’s arable land faces even more severe challenges. China is undergoing a transformation from “rural China” to “urban China”, and by the end of 2021, the urbanization rate of the resident population reached 64.72%, leading to the conversion of more and more arable land [5]. In the past decade, the total area of arable land in China has decreased by 7.30 × 10⁴ square kilometers, and with the development of urban construction, the occupation of arable land has become increasingly serious, leading to a continuous reduction in arable land. Since 2008, the rapid development of land transfer has caused significant changes in the structure of arable land use, and the issue of the non-agriculturization of arable land began to emerge. With the continuous growth of the population, the rapid development of urbanization and industrialization, and changes in the human demand and consumption structure, the phenomenon of the non-agriculturization of arable land has gradually surfaced and become more severe. On 10 September 2020, the General Office of the State Council of China issued a notice titled “Notice on Resolutely Stopping the non-agriculturization of Arable Land”, which explicitly prohibited the illegal occupation of arable land for purposes such as afforestation, landscape creation, and non-agriculturization construction [6]. The non-agriculturization of arable land [7] refers to the process in which arable land is converted into non-agriculturization production uses, such as construction land [8] or afforestation. This study defines the non-agriculturization of arable land as the process in which land use changes from agricultural use to other types of land use.
The conversion of arable land to non-agricultural uses has, to some extent, facilitated urban expansion and infrastructure development, thereby driving economic growth, urbanization, agricultural restructuring [9], and rural revitalization. However, excessive non-agriculturization not only directly reduces the amount of arable land but also undermines its productive capacity, posing a serious threat to food security. Exploring the trends and causative mechanisms of non-agriculturization is of significant theoretical and practical importance for implementing arable land protection strategies [5], the rational use of arable land resources, and ensuring food security and sustainable agricultural development. Controlling excessive non-agriculturization [10] has become a key challenge in safeguarding food security and agricultural sustainability. Some scholars believe that non-agriculturization mainly occurs in urban industrial areas [11] and metropolitan regions [12], and they have identified the rapid urban development [13,14] and the increase [15] in industrial land as the primary causes of arable land non-agriculturization. Other researchers have explored topics such as the non-agriculturization of arable land [16], the relationship between non-agriculturization and urbanization [17,18,19], and the impact of non-agriculturization on labor structure [20]. Tang Hongqian and others conducted investigations and analyses of the non-agriculturization of agricultural land, finding that the strong demand for economic growth directly promoted local governments’ increased administrative intervention in land requisition [21]. Zhao Yongge examined the mechanisms of rural non-agriculturization and was the first to analyze the driving mechanisms of non-agriculturization using panel data [22]. Subsequently, more scholars have explored the driving mechanisms of arable land non-agriculturization [23,24], the spatial distribution of non-agriculturization and non-agriculturization rates [25,26], and the relationship between non-agriculturization, urbanization, and economic growth [27,28,29]. This study focuses on arable land in the economically developed region of Guangzhou, exploring the spatial–temporal changes in non-agriculturization from 2005 to 2018, as well as the key driving factors of non-agriculturization in different stages. The issue of non-agriculturization not only concerns the balance between the quantity and quality of arable land but also affects the rational allocation of land resources [30], economic development [31,32], and ecological balance protection [33]. Therefore, in-depth research on the non-agriculturization of arable land is of great significance for sustainable agricultural development and food security.

2. Study Area, Data, and Methods
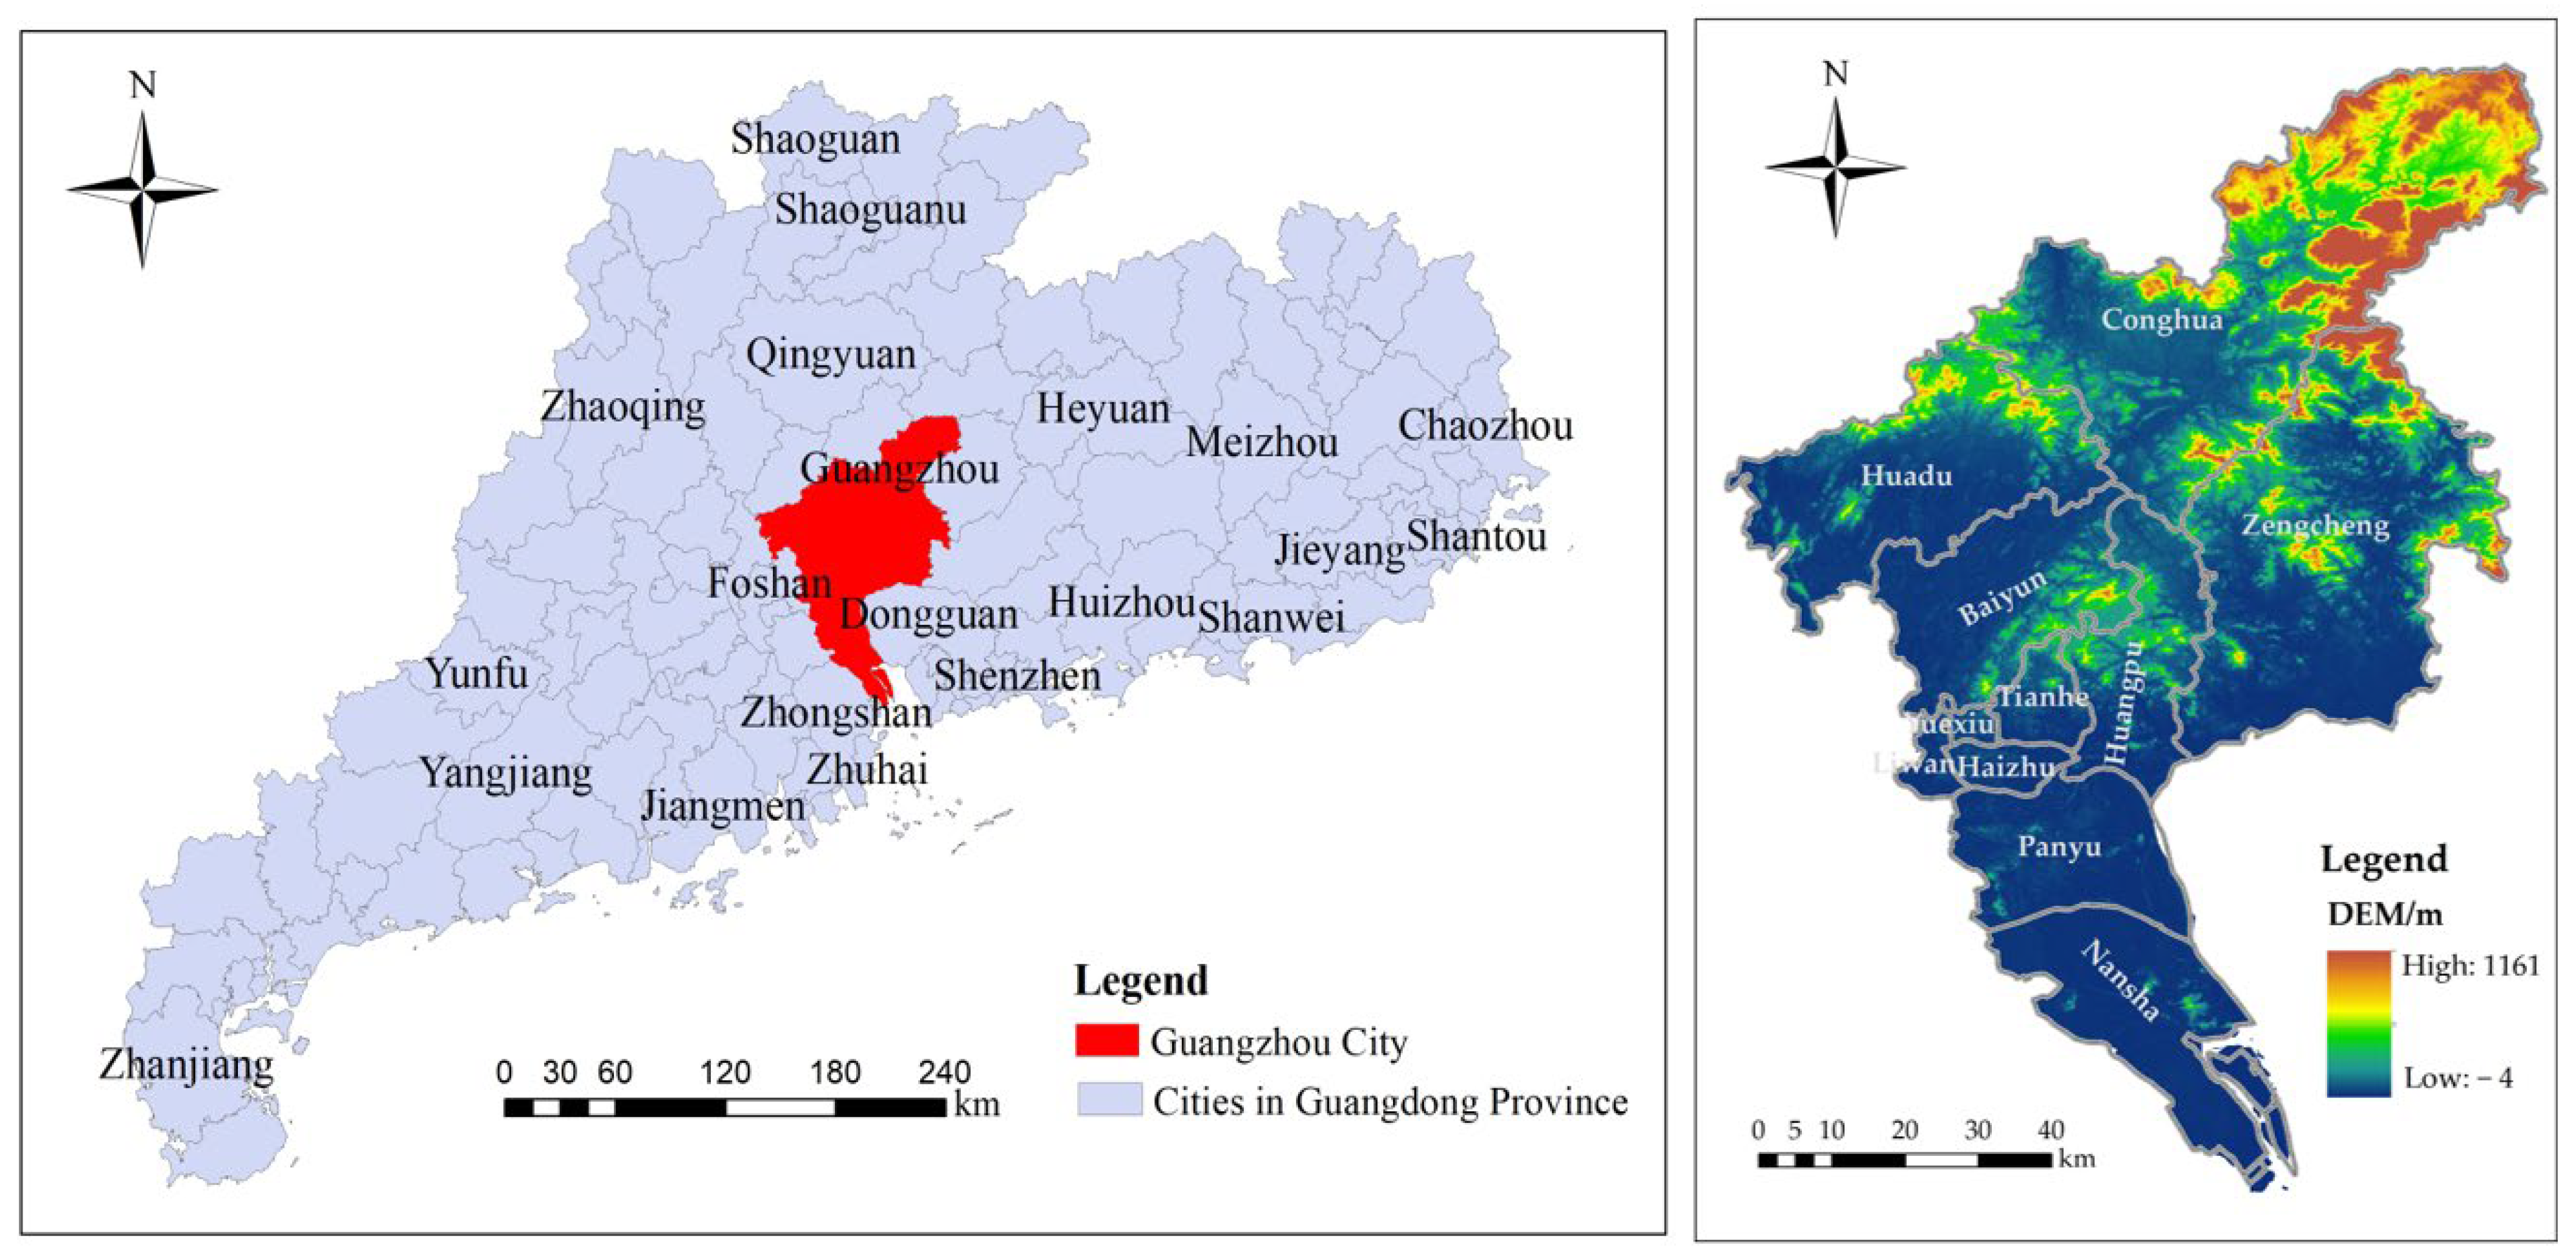
2.1. Study Area

Guangzhou, the capital city of Guangdong Province, is the political, economic, technological, educational, and cultural center of the province, and is recognized as a global first-tier city. Located at 112°57′ to 114°3′ East longitude and 22°26′ to 23°56′ North latitude, the city covers a total area of 7434.4 square kilometers. Guangzhou is divided into 11 districts, including Yuexiu, Haizhu, and Liwan, which account for 4.21% of Guangdong Province’s land area. It features diverse topography and land types, with an overall terrain that slopes from high in the north to low in the south. The northern region is dominated by mountains, while the southern region consists of plains. Guangzhou has a typical South Asian subtropical monsoon climate, with mild temperatures throughout the year, abundant rainfall, ample sunshine, and distinct seasons. The annual average temperature ranges from 19.5 °C to 21.4 °C, with an average annual solar radiation of 443.52 KJ/cm2. The city receives about 1857.2 h of sunlight annually, and the effective accumulated temperature is 6700 °C. The annual average rainfall is approximately 2000 mm, though it is unevenly distributed, with the majority of rainfall occurring between April and June, accounting for 40% to 54% of the annual total. The annual average evaporation is 1250 mm (see Figure 1).

2.2. Data Source and Processing

The land use data for Guangzhou are sourced from GlobelLand30, with a spatial resolution of 30 m. The overall data accuracy is 85.72%, and the Kappa coefficient is 0.82. It includes primary land use types such as arable land, forest land, grassland, shrubland, wetlands, water bodies, tundra, built-up land, bare land, glaciers, and permanent snow. The administrative boundary and elevation data are sourced from the Geospatial Data Cloud, with a resolution of 30 m, and slope data are also derived. Socio-economic data are obtained from the Guangzhou Statistical Yearbook from 2005 to 2018, covering information such as GDP by district, population density, total value of agriculture, forestry, animal husbandry, and fisheries, as well as the total area of cultivated land. Meteorological data (including temperature, precipitation, and sunshine hours) are obtained from the National Meteorological Science Data Center. Using the ANUSPLIN4.36, spatial interpolation is performed to derive the annual average temperature and total annual precipitation data for the years 2005 to 2018.

2.3. Research Method

2.3.1. Non-Agricultural Rate

This study, based on ArcGIS10.8 software, utilizes land use change analysis techniques to determine the area of cultivated land transitioning to other types of land use/land cover (LULC). The study quantifies the extent of arable land conversion to non-agricultural uses by calculating the non-agriculturization rate.
The non-agriculturization rate refers to the proportion of non-agriculturization area relative to the initial cultivated land area. The formula is:
C i = F i S i × 100
In the formula: i represents time period; C i represents the non-agriculturization rate ( ) for a given time period; F i represents the area of non-agricultural land for a given time period; and S i represents the initial cultivated land area for a given time period.

2.3.2. Kernel Density Estimation

Kernel density estimation is an important tool for studying spatial imbalance and is a non-parametric estimation method [34]. It is mainly used for estimating the probability density of random variables, using continuous density curves to describe the distribution pattern of random variables. This allows for reflecting information such as the distribution location, shape, and extent of the variable. Moreover, the kernel density function is less dependent on the model, making it highly robust [35]. Kernel density estimation [36] mainly relies on a moving cell to estimate the density of point or line patterns, which can effectively capture the actual distribution of data. This makes it well suited for characterizing spatial distribution features. By using kernel density estimation, it is possible to understand the aggregation and specific distribution locations of non-agricultural land use in Guangzhou from a spatial perspective.
f x = 1 n h i = 1 n K x x i h
In the formula: n represents the number of data points; h represents the bandwidth; K is the kernel density function; and x x i is the distance from the estimation point to the sample. The selection of bandwidth greatly influences the calculation results. As h increases, the spatial point density changes more smoothly, but this may obscure the structure of the density. Conversely, when h decreases, the changes in estimated point density become abrupt and uneven. Bandwidth values of 1000, 2000, 4000, 6000, 8000, and 10,000 were set for comparison analysis. When the bandwidth is 8000, the density variation of the non-agriculturization of cultivated land in Guangzhou is relatively smooth, and the display effect is better. Therefore, in this study, the bandwidth for kernel density analysis is set to 8000.

2.3.3. Gravity Center Model

Based on the concept of the center of gravity, a model for the migration of the center of gravity of the non-agriculturization of cultivated land in Guangzhou is constructed [37,38,39]. By analyzing data from different periods, it is possible to clearly demonstrate the spatial changes in non-agricultural land use, as well as the specific directions and distances of non-agricultural land use. The calculation formula is as follows:
Formula for the center of gravity migration distance:
d = ( X b X a ) 2 + ( Y b Y a ) 2
where d represents the distance of the center of gravity shift for non-agricultural cultivation of cultivated land; and X a , Y a , X b , Y b are the geographic coordinates of the center of gravity of the non-agricultural level of cultivated land in different research periods.
The formula for the center of gravity migration angle calculation is as follows:
θ = a r c t a n Y b Y a X b X a , Y b Y a X b X a 0 a r c t a n Y b Y a X b X a , Y b Y a X b X a < 0
θ represents the angle parameter of the center of gravity migration of the non-agriculturization level of cultivated land. The meanings of other symbols are the same as in the previous formula.

2.3.4. Standard Deviation Elliptical Model

The standard deviation ellipse model can precisely reveal the diffusion direction and degree of dispersion of the spatial distribution of the non-agriculturization of cultivated land. It has been widely applied in fields such as ecology [38] and geology. The standard deviation ellipse model primarily uses elements such as the center (the center point), the major axis, the minor axis, and the azimuth angle to reveal the spatial distribution characteristics and migration path of the non-agriculturization of cultivated land. In this model, the center of the standard deviation ellipse represents the relative spatial distribution of regional features. The directions of the major and minor axes of the ellipse represent the primary and secondary distribution directions of the dispersed points, respectively. The lengths of the major and minor axes represent the degree of deviation of non-agriculturization in the main and secondary directions from the center of gravity. The ratio of the major to the minor axes is used to describe the spatial distribution pattern, and the azimuth angle indicates the primary trend direction of spatial distribution [40]. Therefore, the directional distribution analysis tool in ArcGIS10.8 software can be used to draw the standard deviation ellipse to analyze the evolution of the spatial and temporal pattern of cultivated land, σ x represents the direction with the most spatial distribution of non-agricultural cultivated land in Guangzhou, where the major axis of the ellipse is located, and σ y represents the direction with the least distribution of the short axis of the ellipse. The average center coordinates, x-axis standard deviation, and y-axis standard deviation are calculated as follows:
X ¯ m = i = 1 n m i x i i = 1 n m i
Y ¯ m = i = 1 n m i y i i = 1 n m i
σ x = i = 1 n m i x ¯ i cos θ m i y ¯ i sin θ i = 1 n m i 2
σ y = i = 1 n m i x ¯ i sin θ m i y ¯ i cos θ i = 1 n m i 2
In Equations (5)–(8), x i and y i represent the coordinates of the features; m i is the weight; i represents each decision unit; X ¯ and Y ¯ are the coordinates of the center point of the standard deviation ellipse; σ x and σ y are the standard deviations along x and y , respectively; and tan θ is the rotation angle of the distribution pattern.

2.3.5. Model Selection and Evaluation

The changes in cultivated land use are the result of years of accumulation and evolution, influenced by multiple factors such as the natural environment and socio-economic development, all acting on the spatio-temporal evolution of cultivated land use in different time periods. Therefore, this study assumes that the driving factors for the changes in cultivated land use are the same, but their impact and intensity vary at different stages. The use of cultivated land is generally the result of the interaction between natural elements induced by human activities, such as slope, soil, etc., and socio-economic development factors [15,41]. Hence, when analyzing the driving factors of cultivated land use, the selection of factors should comprehensively reflect the multiple causes of cultivated land use change [42]. This study aims to explore the influences of socio-economic factors and the land itself on cultivated land use. Based on the literature on changes in cultivated land use [43,44] and the analysis of the driving mechanisms of crop planting structure [45,46], the study considers both natural factors of cultivated land and socio-economic development, revealing the mechanisms of cultivated land use change. Given the accuracy and accessibility of the data, the indicators were selected, as shown in Table 1.
Multiple Linear Stepwise Regression Method: This paper uses stepwise regression analysis to examine the driving factors behind the changes in arable land resource utilization. This method not only tests multicollinearity, but also automatically screens variables, simplifying the modeling process. It can identify variables that significantly impact the results and automatically select the optimal combination of variables. Through significance tests and regression coefficients, the direction and magnitude of each variable’s influence can be assessed. This method has been applied in various fields such as resource environment [47], land resource planning [48], and arable land utilization [49]. The basic model is as follows:
Y 1 = a 1 X 11 + a 2 X 12 + + a i X 1 i + ε 1
Y 2 = b 1 X 21 + b 2 X 22 + + b j X 2 j + ε 2
Y 3 = c 1 X 31 + c 2 X 32 + + c p X 1 p + ε 3
In the equation: Y 1 , Y 2 , Y 3 represent the rates of non-agriculturization for the three periods of 2005–2010, 2010–2015, and 2015–2018, respectively; i , j , p represent the number of factors influencing Y 1 , Y 2 , Y 3 , respectively; X 1 i , X 2 j , X 3 P represent the influencing factors selected by the stepwise regression model of Y 1 , Y 2 , Y 3 , respectively; a i , b j , c p represent the influence coefficients of different factors in each model; and ε 1 , ε 2 , ε 3 represent the random error terms.

3. Results

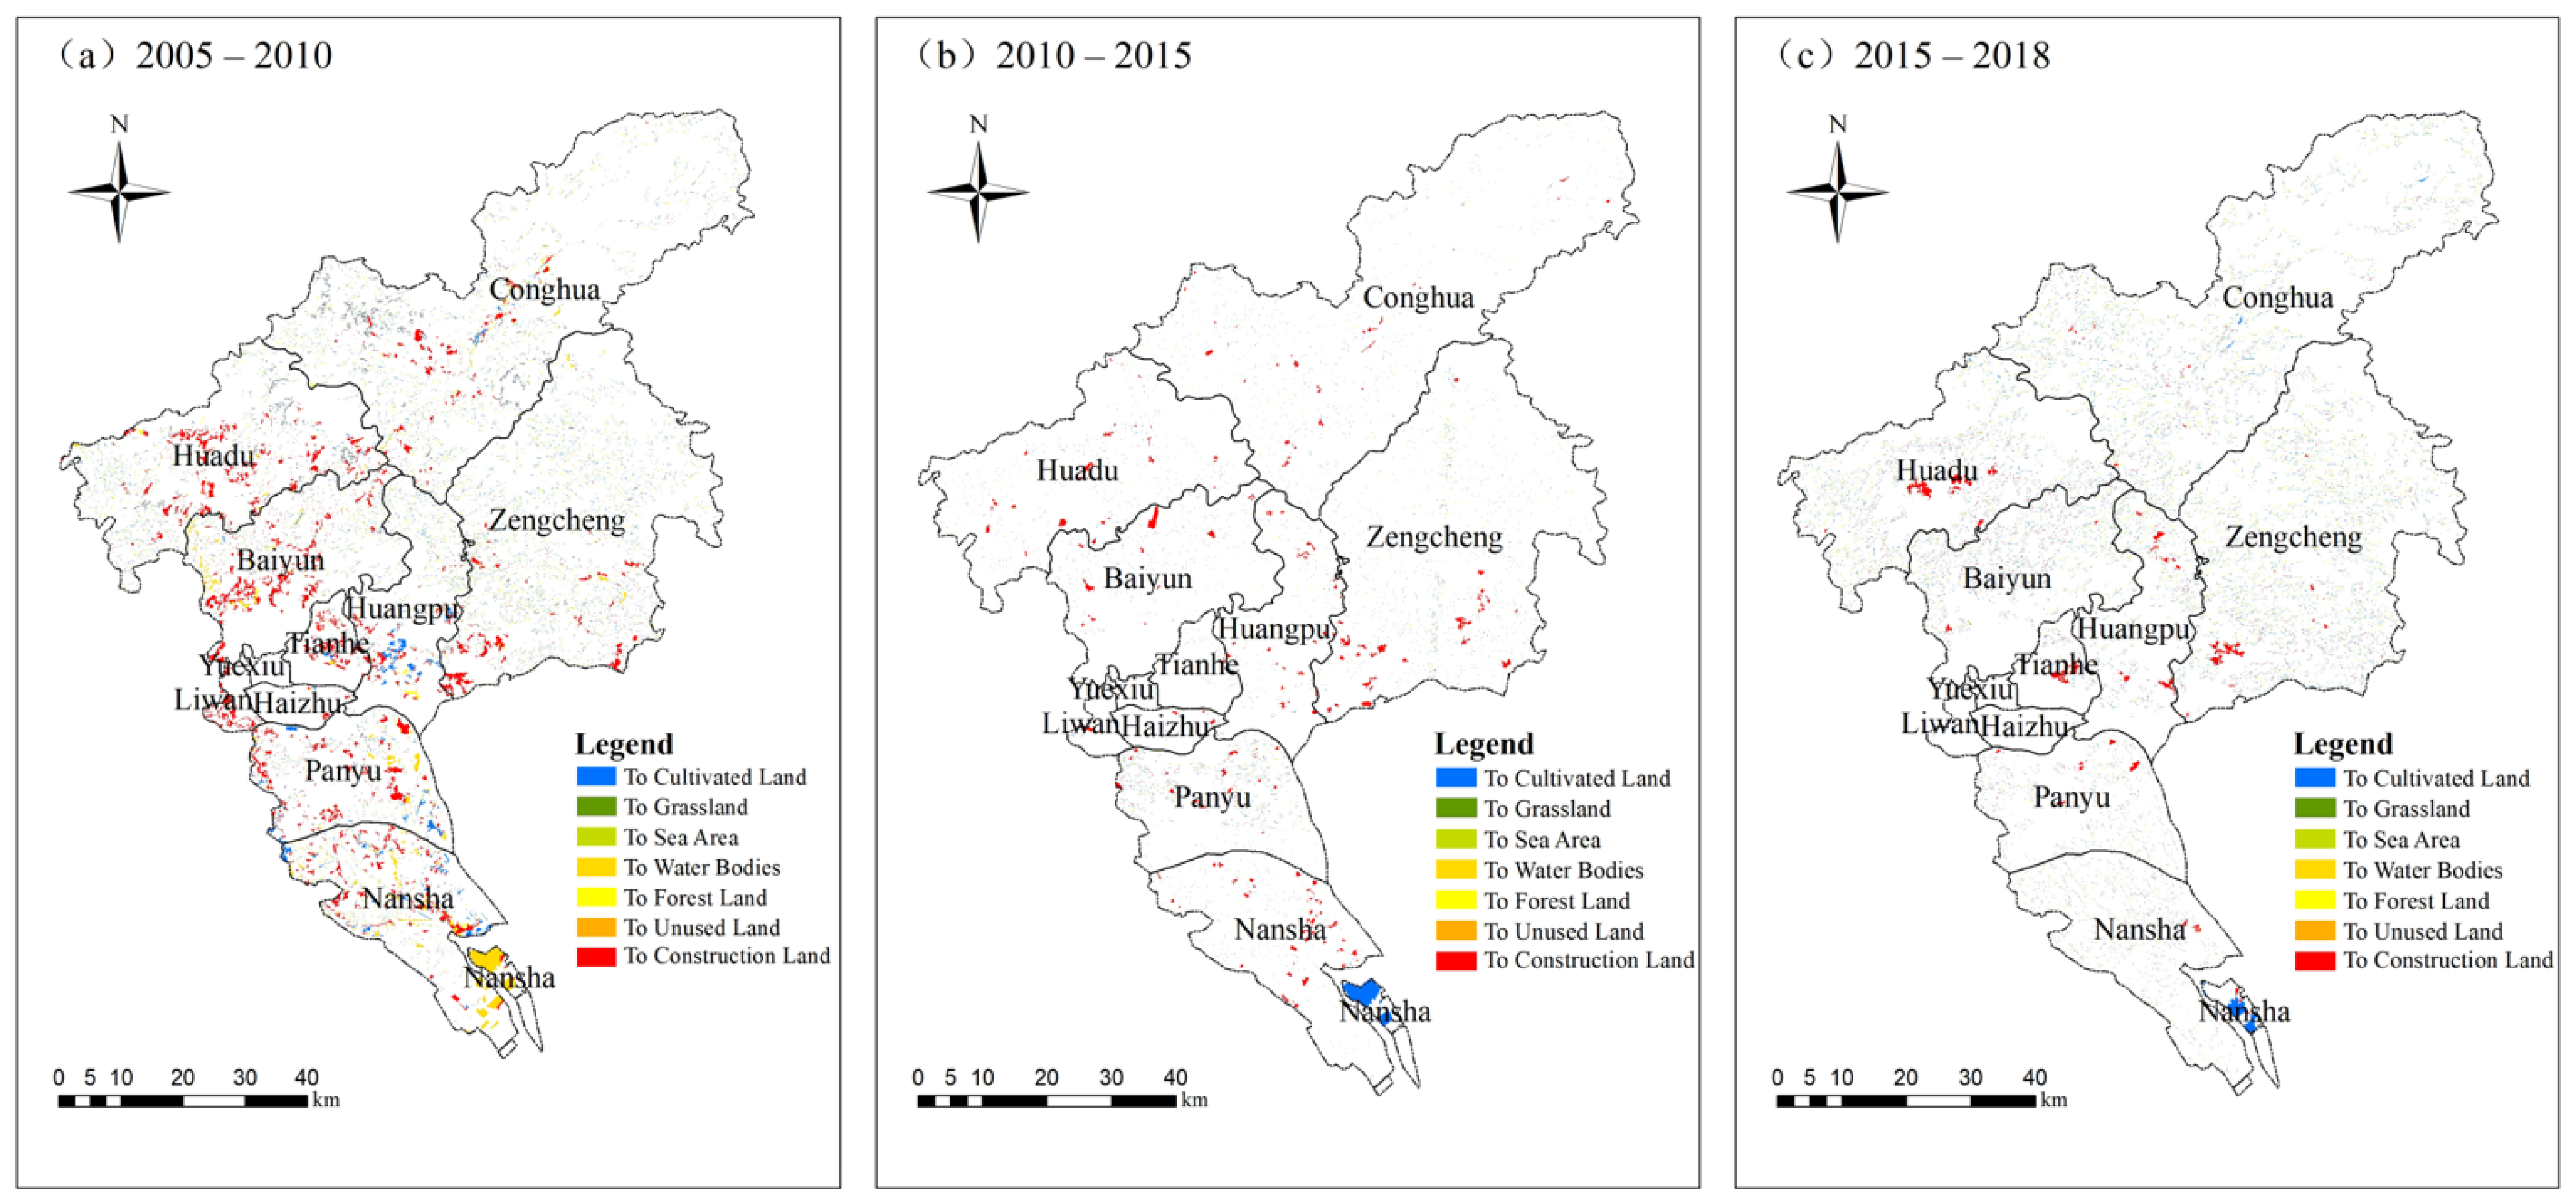
3.1. Analysis of the Change in Non-Agricultural Types of Cultivated Land in Different Stages

We observe that the main type of non-agriculturization of arable land in Guangzhou from 2005 to 2018 was the conversion of arable land into construction land, as shown in Figure 2. Between 2005 and 2010, the degree of non-agriculturization of arable land was relatively severe, mainly concentrated in the central areas of Guangzhou, including Huadu District, Baiyun District, Huangpu District, Yuexiu District, Liwan District, and Panyu District. These areas experienced rapid economic development during this period, with high rates of industrialization and urbanization. In contrast, the degree of non-agriculturization of arable land in the northeastern regions of Conghua District and Zengcheng District was relatively low. Between 2010 and 2015, the non-agriculturization of arable land continued to develop. Unlike the 2005–2010 period, during this phase, the conversion of arable land into construction land was more scattered and distributed more evenly across different districts and counties in Guangzhou. Additionally, during this period, the conversion of other types of land into arable land was mainly concentrated in Nansha District, especially in areas reclaimed from the sea. From 2015 to 2018, the main districts that saw the conversion of arable land into construction land were Zengcheng District, Huadu District, and Tianhe District. After 2010, the government implemented various measures for land protection, which had a certain effect. During this period, changes in arable land were relatively small.
From Table 2, it can be observed that the district with the highest degree of non-agriculturization in Guangzhou is Liwan District, with a rate of 79.40%. Between 2005 and 2010, 793.77 hectares of arable land in Liwan District were converted into construction land. Meanwhile, Panyu District and Haizhu District also had high non-agriculturization rates of 47.19% and 42.97%, respectively. The main type of non-agriculturization in these districts was the conversion of arable land into urban construction land, with areas of 1077.48 hectares and 117.86 hectares, respectively. During the 2005–2010 period, the district with the largest area of non-agriculturization of arable land was Nansha District, with an area of 6914.82 hectares. This was followed by Huadu District and Zengcheng District, with areas of 5016.37 hectares and 5002.40 hectares, respectively. The district with the smallest area of non-agriculturization was Haizhu District, with only 137.61 hectares. However, due to the small amount of arable land in Haizhu District, its non-agriculturization rate was relatively high, with nearly half of its arable land being converted into construction land.
From Table 3, it can be seen that the districts with relatively high non-agriculturization rates in Guangzhou are Haizhu District and Liwan District, with non-agriculturization rates of 41.14% and 33.83%, respectively. Between 2010 and 2015, 134.78 hectares of arable land in Haizhu District were converted into construction land, and 161.83 hectares in Liwan District. Although these two districts had high non-agriculturization rates, the non-agriculturization area was not large due to the smaller amount of arable land in these districts. The other districts in Guangzhou had relatively low non-agriculturization rates during this period, none of which exceeded 10%. Starting in 2010, China implemented various measures to protect arable land and ensure food security. The main type of non-agriculturization in these two districts was the conversion of arable land into urban construction land, with areas of 85.20 hectares and 80.34 hectares, respectively. During the 2010–2015 period, the district with the largest non-agriculturization area was Zengcheng District, with an area of 1743.82 hectares, followed by Nansha District and Conghua District, with areas of 1045.02 hectares and 925.74 hectares, respectively. The district with the smallest non-agriculturization area was Tianhe District, with only 39.13 hectares, and its main type of non-agriculturization was urban residential, industrial, and mining construction land.
From Table 4, it can be observed that the district with the highest degree of non-agriculturization in Guangzhou is Tianhe District, with a rate of 41.10%. Between 2015 and 2018, 553.36 hectares of arable land in Tianhe District were converted into construction land. Next, Huangpu District also had a high non-agriculturization rate of 12.36%, with the main type of non-agriculturization being the conversion of arable land into urban construction land, covering an area of 695.70 hectares. During the 2015–2018 period, the district with the largest area of non-agriculturization of arable land was Zengcheng District, with an area of 3278.68 hectares. This was followed by Conghua District and Huadu District, with areas of 2473.58 hectares and 2335.31 hectares, respectively. The district with the smallest non-agriculturization area was Liwan District, with only 7.97 hectares, and its non-agriculturization rate was 4.60%.

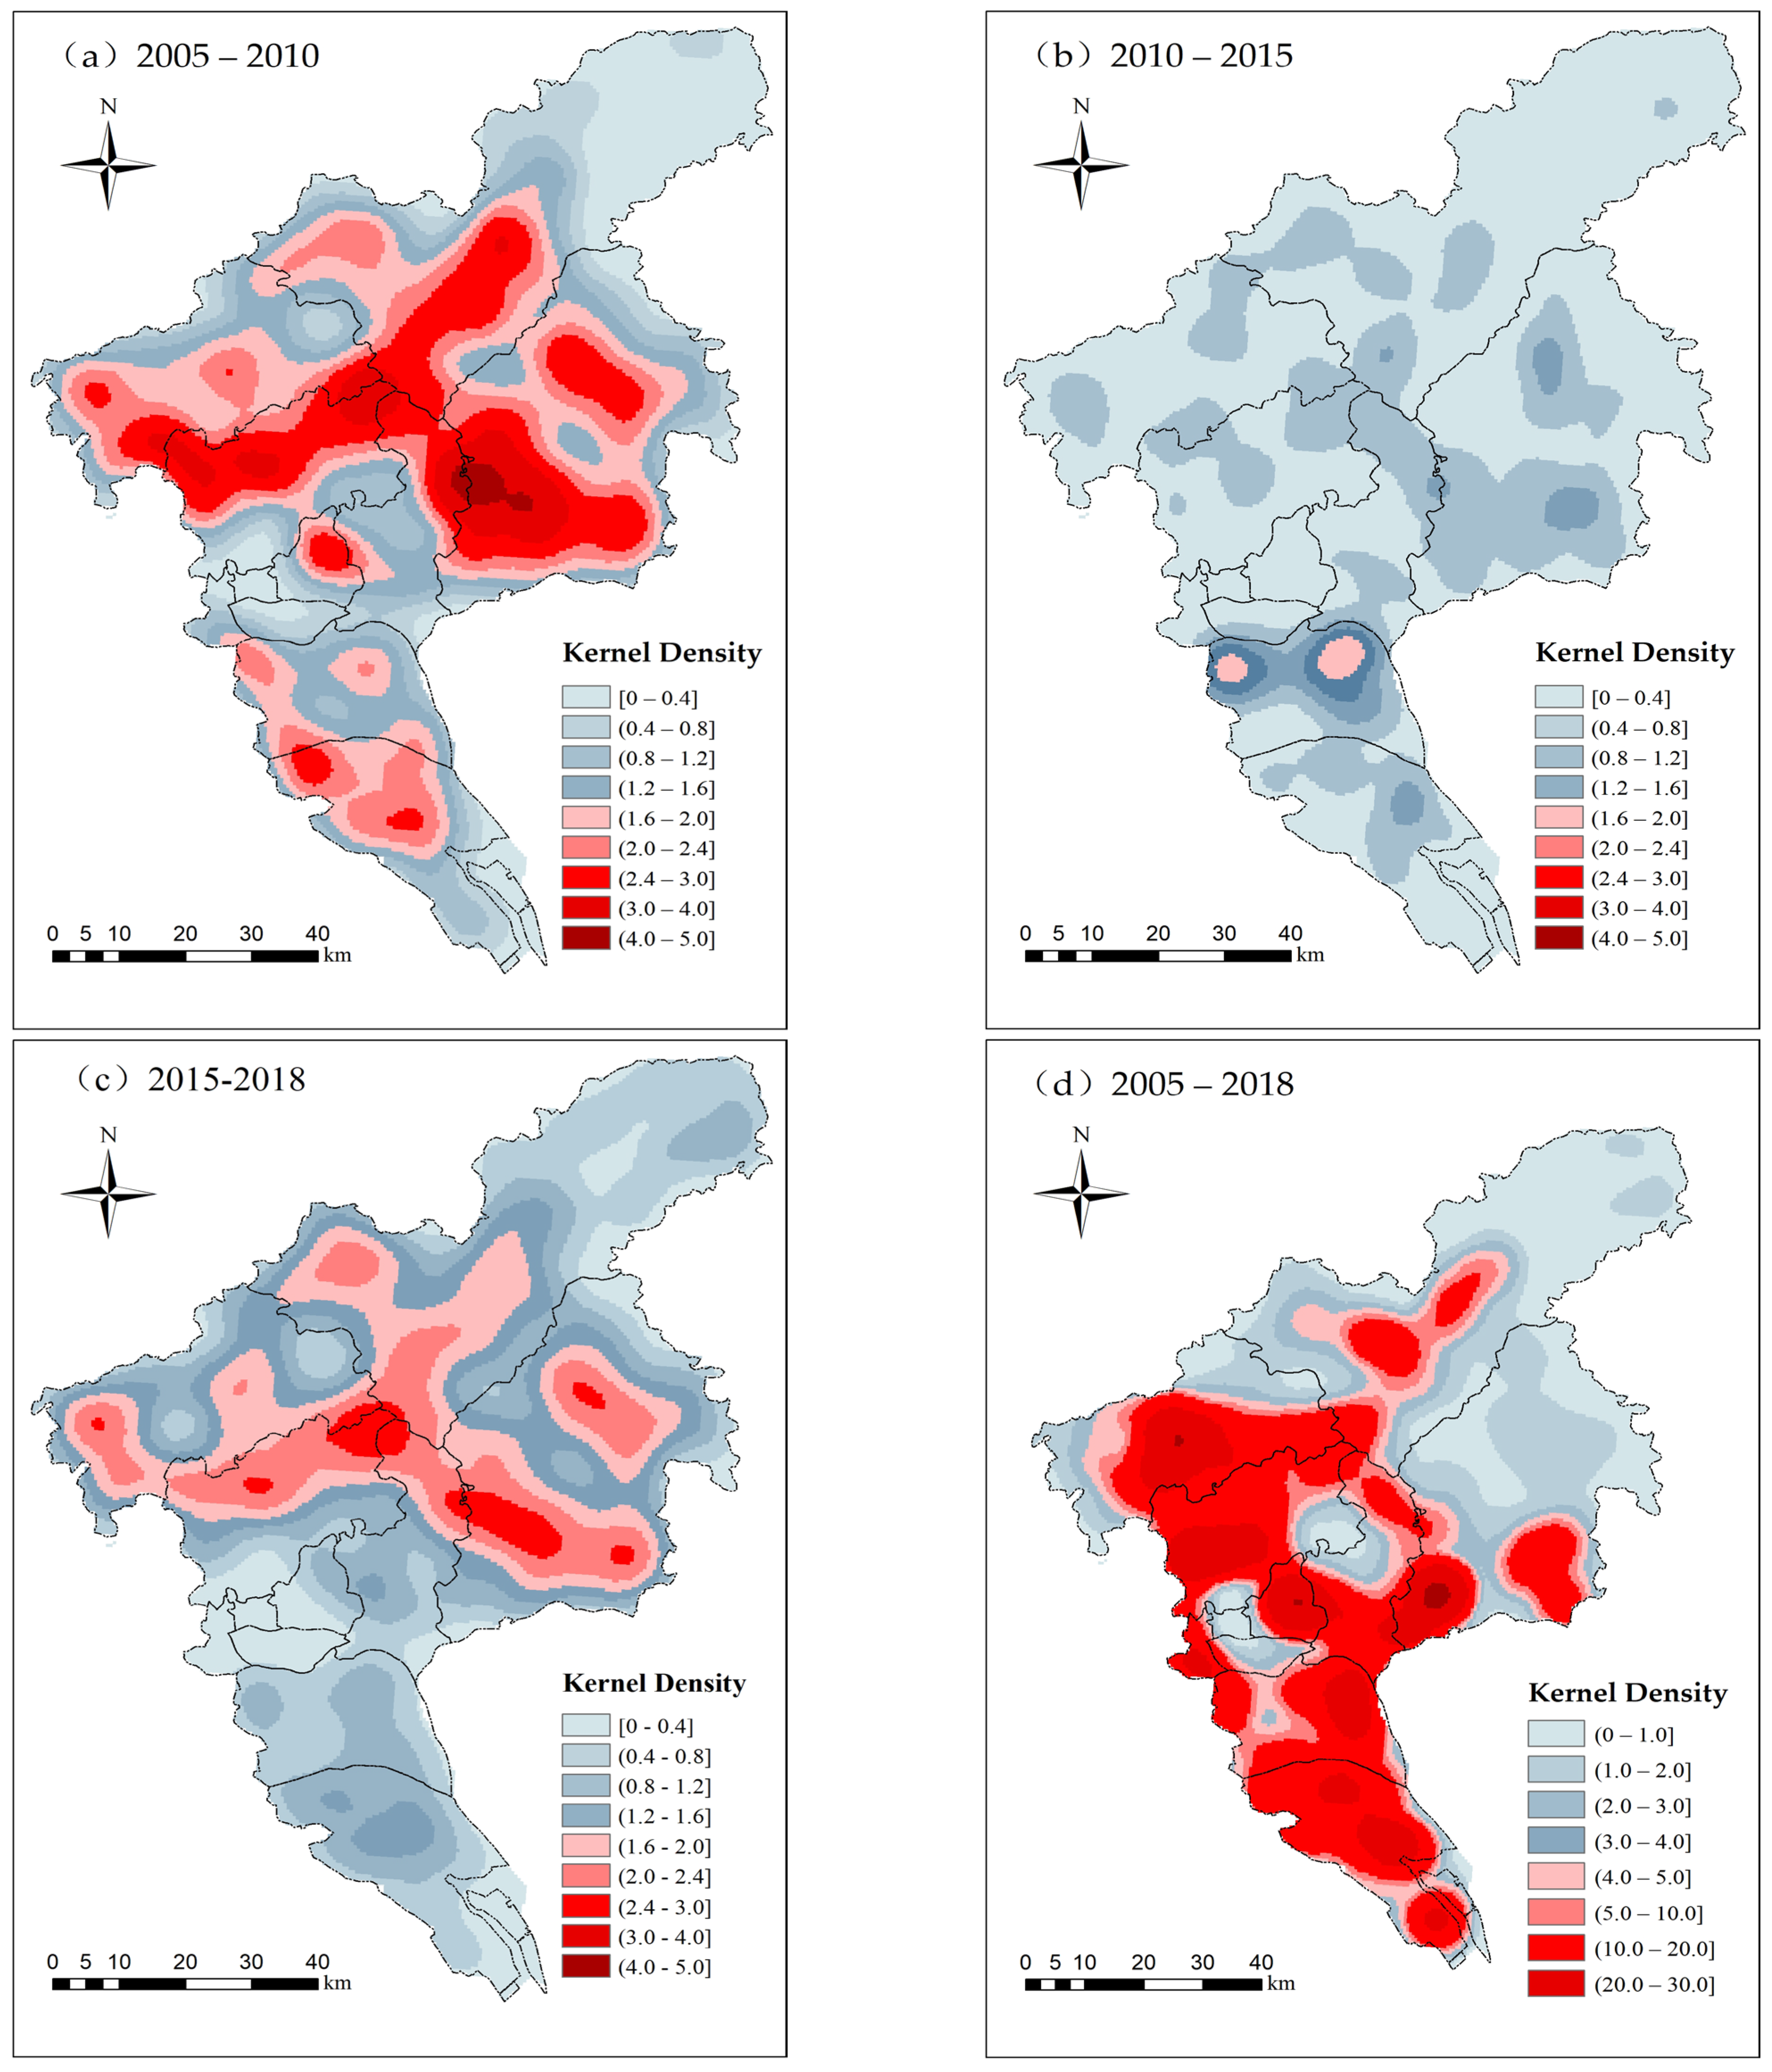
3.2. Kernel Density Analysis of Non-Agriculturization of Arable Land Use

From Figure 3d, it can be seen that the non-agriculturization of arable land exists across all districts in Guangzhou, with the phenomenon mainly concentrated in the central and southern areas. During the urban development of Guangzhou, the central area and the surrounding districts such as Baiyun District, Huangpu District, and Panyu District saw severe non-agriculturization of arable land. The maximum kernel density value is 22.61, located in the southwest of Zengcheng District, close to the central urban area. The non-agriculturization in the northern areas, such as Conghua District and the northern part of Zengcheng District, is relatively low. The non-agriculturization of arable land in Guangzhou developed rapidly between 2005 and 2010, with an average kernel density value of 1.59, indicating the highest severity, as shown in Figure 3a. Areas with a kernel density value greater than 2.4 were mainly distributed in the northern part of Baiyun District, the southwest of Zengcheng District, and the central-southern part of Conghua District. This suggests that during this period, urbanization accelerated in these regions, leading to a large amount of arable land being converted to non-agriculturization uses. In the more peripheral areas farther from the central urban area, the degree of non-agriculturization is weaker, and the general kernel density value is less than 0.4, indicating that non-agriculturization of arable land exhibits spatial clustering. By combining this with the elevation diagram of Guangzhou, it can be seen that the non-agriculturization areas are mainly concentrated in areas with relatively low elevations. From Figure 3b, it can be seen that between 2010 and 2015, the overall degree of non-agriculturization in Guangzhou decreased, with an average kernel density value of 0.36, indicating that the conversion of arable land to non-agriculturization uses was less frequent. The kernel density values throughout Guangzhou were generally below 1.6, with the exception of the northeastern and northwestern areas of Panyu District, where the kernel density exceeded 1.6. From Figure 3c, it can be observed that between 2015 and 2018, the non-agriculturization of arable land in Guangzhou became more severe compared to 2010–2015. The average kernel density value was 1.19. More areas had kernel density values above 1.6, mainly distributed in the northern part of Baiyun District, the southwest of Zengcheng District, the central-southern part of Conghua District, and the southwest and southeast of Huadu District, with the highest value reaching 2.68.

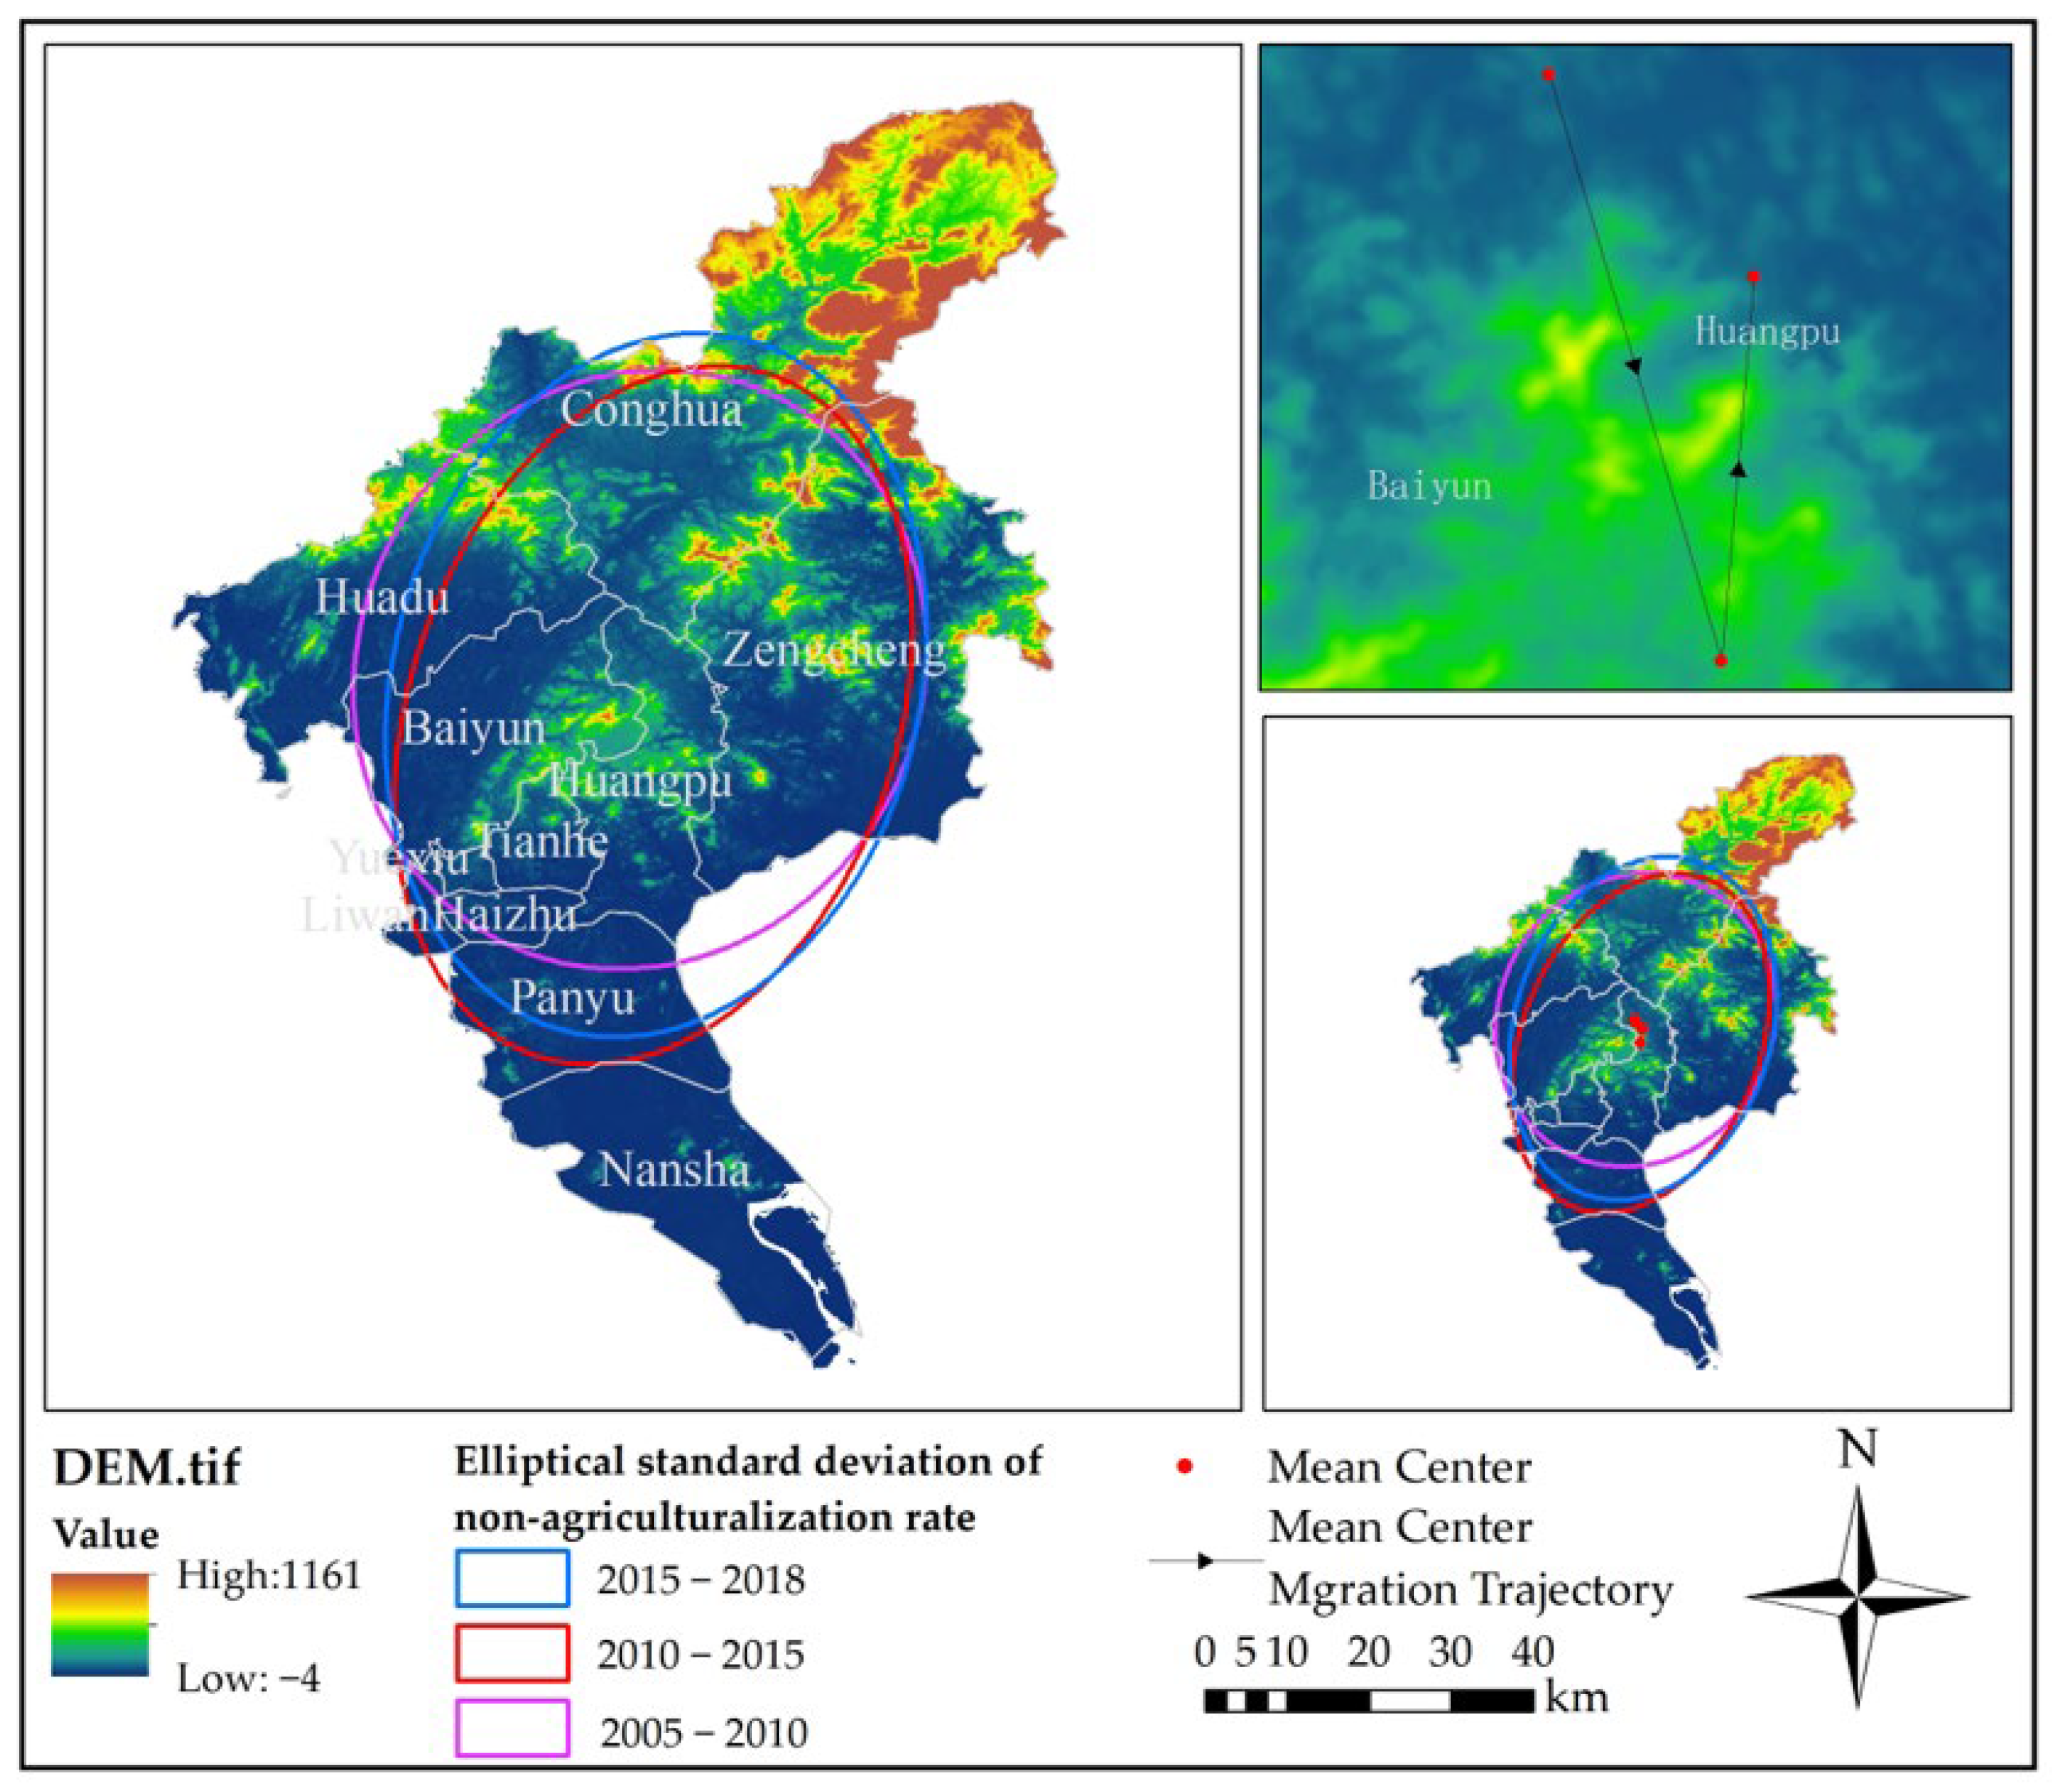
3.3. Migration of Non-Agriculturization Gravity in Guangzhou’s Arable Land Use

To quantitatively analyze the directional trend and clustering of the migration of the non-agriculturization gravity in Guangzhou’s arable land, the first standard deviation ellipse of the non-agriculturization rate for the periods of 2005–2010, 2010–2015, and 2015–2018 was drawn using ArcGIS10.8 software. The results were used to analyze the spatial distribution characteristics of Guangzhou’s non-agriculturization rate of arable land. From the standard deviation ellipses for the three periods, it can be seen that the non-agriculturization of arable land in Guangzhou overall shifted from the northeast direction to the northwest direction. By examining the area generated by the standard deviation ellipse, it is evident that the range of non-agriculturization in Guangzhou’s arable land has been increasing year by year. During the 2015–2018 period, the range of non-agriculturization was the largest.
Figure 4 illustrates the changes in the standard deviation ellipse and centroid parameters of the non-agriculturization rate of arable land in Guangzhou from 2005 to 2018. Based on Table 5, we can conclude that from 2005 to 2010, the rotation angle of the standard deviation ellipse for the non-agriculturization rate of arable land in Guangzhou was 29.18 degrees, or 29 degrees east of north. This indicates that the centroid of non-agriculturization generally followed a southwest–northeast distribution, with a more noticeable dispersion in the southwest–northeast direction compared to the northwest–southeast direction. This means that the fluctuations in the northeast–southwest direction were more pronounced than those in the northwest–southeast direction. The short axis of the ellipse was 3.42 km, and the long axis was 3.72 km, with the long axis approximately 1.1 times the length of the short axis. During this phase, the characteristics of non-agriculturization in Guangzhou were clearly evident.
From 2010 to 2015, the rotation angle of the standard deviation ellipse for the non-agriculturization rate of arable land in Guangzhou was 19.44 degrees, a decrease of 9.74 degrees compared to the 2005–2010 period. This indicates that although the centroid of non-agriculturization still generally followed a southwest–northeast distribution with more noticeable dispersion in the southwest–northeast direction, the non-agriculturization trend expanded towards the northwest compared to the previous period. During this period, the short axis of the standard deviation ellipse was 2.97 km, and the long axis was 4.40 km, with the long axis approximately 1.48 times the length of the short axis. This shows that the characteristics of non-agriculturization in Guangzhou were most evident during this phase.
From 2015 to 2018, the rotation angle of the standard deviation ellipse for the non-agriculturization rate of arable land in Guangzhou was 14.93 degrees, a decrease of 4.51 degrees compared to the 2010–2015 period. This suggests that although the centroid of non-agriculturization still generally followed a southwest–northeast distribution with more noticeable dispersion in the southwest–northeast direction, the non-agriculturization trend continued to expand towards the northwest compared to the previous period. During this phase, the short axis of the ellipse was 3.21 km, and the long axis was 4.37 km, with the long axis approximately 1.36 times the length of the short axis. The characteristics of non-agriculturization in Guangzhou were still quite noticeable during this period.
During the period from 2005 to 2018, the centroid of arable land non-agriculturization in Guangzhou shifted southeastward between the phases of 2005–2010 and 2010–2015, and then shifted directly northward from 2010–2015 to 2015–2018. According to the table of standard deviation ellipses and centroid parameter changes in the non-agriculturization rate, the centroid in the key years fluctuated mainly between 113°30′ E to 113°32′ E and 23°17′ N to 23°21′ N, which geographically corresponds to the border area between Huangpu District and Baiyun District. This indicates that the spatial distribution of arable land non-agriculturization in Guangzhou is influenced by multiple factors and does not follow an entirely balanced development pattern. In terms of the centroid migration trajectory, the centroid moved a distance of 5.81 km in the southeast direction during the 2005–2010 to 2010–2015 period. This suggests that during this stage, the pace of non-agriculturization accelerated significantly in the southeast direction. In the following phase from 2010–2015 to 2015–2018, the centroid shifted 3.67 km northward, indicating a marked acceleration of non-agriculturization in the due north direction, particularly in the Conghua and Zengcheng districts.

3.4. Analysis of Driving Factors of Arable Land Non-Agriculturization

Through stepwise regression analysis, the main factors contributing to the high non-agriculturization rates in Guangzhou across the three periods (2005–2010, 2010–2015, and 2015–2018) were identified. The results are presented in Table 6.
Using stepwise regression, a model was constructed to identify the key factors influencing the non-agriculturization of arable land in Guangzhou during the 2005–2010 period. The main factors identified were population density and the per capita net income of rural residents. The regression coefficient for population density (people/square kilometer) was 0.003, indicating a significant positive relationship between population density and non-agriculturization. The higher the population density, the higher the level of non-agriculturization. The regression coefficient for the per capita annual net income of rural residents was 0.001, indicating a significant positive relationship between income and non-agriculturization. The higher the per capita income, the higher the degree of non-agriculturization. A linear regression model was developed using population density and the per capita net income of rural residents, with the formula: non-agriculturization rate = −6.392 + 0.003 × Population Density + 0.001 × Per Capita Net Income of Rural Residents. Through multicollinearity testing, it was found that the VIF values for all factors were less than 5, indicating no multicollinearity problems. The D-W value was 1.629, close to 2, indicating no autocorrelation and no relationship between the sample data, making the model suitable. The R2 value was 0.871, meaning that population density and per capita net income of rural residents explain 87.1% of the variation in non-agriculturization. The model passed the F-test (F = 26.919, p = 0.000 < 0.05). In the 2010–2015 period, the main factor influencing non-agriculturization in Guangzhou was Gross Domestic Product (GDP). From the table, the R2 value for this stage was 0.895, indicating that GDP explained 89.5% of the variation in non-agriculturization. The model formula was: non-agriculturization rate = 1.172 + 0.000 × GDP. The model passed the F-test (F = 42.491, p = 0.001 < 0.05), confirming its validity. The regression coefficient for GDP was 0.000 (t = 6.519, p = 0.001 < 0.01), indicating a significant positive relationship between GDP and non-agriculturization. From 2015 to 2018, the main factors influencing non-agriculturization in Guangzhou were GDP and the total value of the tertiary industry. The R2 value was 0.927, indicating that these two factors explain 92.7% of the reasons for non-agriculturization. The model passed the F-test (F = 25.437, p = 0.001 < 0.05), with the formula: non-agriculturization = −9.137 + 0.011 × GDP − 0.008 × Tertiary Industry. The regression coefficient for GDP was 0.011 (t = 8.492, p = 0.000 < 0.01), indicating a significant positive relationship between GDP and non-agriculturization. The regression coefficient for the tertiary industry (in ten thousand yuan) was −0.008 (t = −3.294, p = 0.017 < 0.05), indicating a significant negative relationship between the tertiary industry and non-agriculturization.
Between 2005 and 2018, the non-agriculturization of arable land in Guangzhou was primarily due to its conversion into urban residential land. However, urban development is driven by the need to accommodate the rapidly growing population’s demand for housing and urban public facilities. As regional population density increases, there is a growing demand for housing, infrastructure, and public service land, which in turn leads to the occupation of large areas of arable land [50,51]. In 2005, the average population density in Guangzhou was 1010 people per square kilometer, and by 2010, it had increased to 1084 people per square kilometer. In Yuexiu District, the central urban area of Guangzhou, the population density in 2005 and 2010 reached 34,041 and 34,607 people per square kilometer, respectively. As a result, all arable land in Yuexiu District was converted into construction land.
In Figure 5, it can be seen that the spatial distribution of population density follows a central high and peripheral low concentric grading pattern. The population density in districts farther from the central area, such as Zengcheng, Conghua, and Nansha, is relatively low, and their degree of non-agriculturization is also lower. This driving factor has a positive impact on non-agriculturization. The per capita net income of rural residents is another factor influencing non-agriculturization in Guangzhou during this period. As a developed coastal city, Guangzhou has rapidly advanced its agricultural modernization. The conversion of arable land to non-agriculturization uses, such as factory construction and commercial development, has brought more employment opportunities to rural areas, thereby increasing farmers’ incomes. This, in turn, indirectly promoted the non-agriculturization of land. In Figure 5b, it can be seen that farmer income is higher in the central and southern regions, while it is lower in the northern Conghua District. This aligns with previous findings, where Conghua District showed a relatively low level of non-agriculturization.
In 2010, Guangzhou’s GDP was 1.0859 trillion yuan, and by 2015, it had increased to 1.8314 trillion yuan, representing an overall growth rate of 65.3%. During this period, the GDP growth rate in various districts of Guangzhou was relatively high. Except for Panyu, Zengcheng, and Huadu Districts, where the growth rate was below 50%, all other districts had growth rates exceeding 50%. Huangpu District had the highest growth rate, reaching 366.60% (Figure 6). This was due to the merger of Luogang District into Huangpu District in 2014, leading to the establishment of the new Huangpu District, which resulted in the exceptionally high GDP growth rate for this district.
The rapid development of the regional economy has led to the continuous expansion of urban areas, which in turn has resulted in the occupation of farmland in city centers and surrounding areas, converting them into construction land to meet the population influx caused by economic growth. Meanwhile, the rapid increase in GDP has stimulated changes in the industrial structure and consumer patterns, while also driving up land values in surrounding areas. Additionally, some farmland has been polluted and degraded due to urbanization and industrialization, further increasing the rate of farmland conversion to non-agriculturization uses.
As one of China’s economically developed first-tier cities, Guangzhou’s regional GDP reached 2.285935 trillion yuan in 2018, with an increase of 454.52 billion yuan over the past three years. The tertiary sector (services) of Guangzhou surpassed 70% of the GDP for the first time, and continued to grow steadily. By the end of 2018, the added value of the tertiary sector had reached 1.640184 trillion yuan, becoming the main driver of Guangzhou’s economic growth (Figure 7). In regions with highly developed tertiary sectors, the demand for land gradually increases. The construction of commercial office spaces, logistics parks, technology parks, and other commercial facilities has led to the conversion of large amounts of surrounding farmland into construction land. These areas of farmland are typically located in convenient, near-central urban areas, where land conditions are favorable. The loss of this farmland has exacerbated the issue of farmland being diverted to non-agriculturization uses.
At the same time, the rapid growth in GDP and the booming development of the service sector have increased the demand for talent. As individuals engaged in farming compare the earnings from agriculture with the income from employment, many opt to seek higher earnings in other sectors, leading to an increasing trend of non-agriculturization employment among the rural population. This phenomenon, on one hand, increases the demand for construction and public land due to population growth, and on the other hand, leads to farmland being left idle or transferred. Furthermore, the rapid growth of GDP has accelerated urbanization, causing urban boundaries to continuously expand and resulting in surrounding farmland being incorporated into urban construction areas. The economic returns from converting farmland to non-agriculturization uses far exceed those from agricultural purposes, indirectly stimulating landowners to transfer their farmland. Therefore, it is essential to strike a balance between economic development and farmland protection through measures such as optimizing land use planning, improving land utilization efficiency, and strengthening ecological protection, to achieve sustainable economic development.

4. Discussion

4.1. Changes in the Temporal Dynamics of Farmland Conversion to Non-Agriculturization Use

As with previous studies, the non-agricultural use of arable land first occurred in rapidly developing central areas [52,53], and then expanded to surrounding areas [54]. Between 2005 and 2010, the issue of arable land being converted to non-agricultural uses was most severe in Guangzhou, marking a period of rapid development of this issue. The total area of arable land converted to non-agricultural use reached 33,591.50 hectares, with 20,674.74 hectares being converted to construction land, accounting for 61.55% of the total area of non-agriculturization conversion in Guangzhou. The arable land conversion was concentrated in the central areas of Guangzhou, such as Huadu District, Baiyun District, Huangpu District, Yuexiu District, Liwan District, and Panyu District. Rapid economic development and significant population increases were the main drivers of this phenomenon. The rising population density led to increasing demands for housing, infrastructure, and public service land, thereby causing large amounts of farmland to be occupied and the quantity of farmland to decline. Despite policies in China aimed at protecting farmland quantity and implementing a “balance between the amount of occupied and compensated farmland”, the issue of farmland being converted to non-agriculturization use remains.
Between 2010 and 2015, the non-agriculturization conversion of arable land in Guangzhou spread outward from the center. Although the issue persisted, the overall rate of non-agriculturization conversion in various districts showed a downward trend. During this period, the district with the largest area of farmland converted to non-agriculturization use was Zengcheng District, with 1743.82 hectares converted, followed by Nansha District (1045.02 hectares) and Conghua District (925.74 hectares).
Between 2015 and 2018, the district with the highest rate of farmland conversion was Tianhe District, at 41.10%, with 553.36 hectares of farmland being converted into construction land. Huangpu District also had a high rate of farmland conversion, at 12.36%, with 695.70 hectares of farmland being converted. Farmland conversion to non-agriculturization uses has led to a continuous decline in the amount of farmland, directly impacting crop cultivation and threatening national food security. The trend of farmland being diverted from food production between 2005 and 2018 has shown a gradual increase, with the conversion rate following a U-shaped pattern: it decreased initially and then increased.

4.2. Spatial Pattern Changes in Farmland Conversion to Non-Agriculturization Uses

Using kernel density analysis and center of gravity migration methods, the spatial characteristics of farmland conversion to non-agriculturization uses in Guangzhou were investigated. The study found that farmland conversion to non-agriculturization uses exists in all districts of Guangzhou but is mainly concentrated in the central and southern districts. In the urban development process of Guangzhou, farmland conversion to non-agriculturization uses was most severe in the central areas such as Tianhe District, Yuexiu District, Liwan District, and Haizhu District, and surrounding areas like Baiyun District, Huangpu District, and Panyu District. The maximum kernel density value is 22.61, located in the southwestern part of Zengcheng District, near the city center. From the standard deviation ellipse of farmland conversion over three stages, it is evident that the overall farmland conversion in Guangzhou has shifted from the northeast direction to the northwest. The area of the standard deviation ellipse shows that the scope of farmland conversion in Guangzhou has increased year by year, with the largest range of farmland conversion occurring between 2015 and 2018. The concentration of features in each year fluctuated between 113°30′ E–113°32′ E and 23°17′ N–23°21′ N, roughly located at the boundary of Huangpu District and Baiyun District, indicating that the spatial distribution of farmland conversion in Guangzhou is influenced by multiple factors and does not follow an absolute balanced development. In terms of the migration trajectory, from 2005–2010 to 2010–2015, the center of gravity moved 5.81 km in the southeast direction, indicating that the rate of non-agriculturization conversion accelerated in the southeast during this period. In the two stages from 2010–2015 to 2015–2018, the center of gravity shifted 3.67 km in the due north direction, suggesting that the conversion rate in the northern regions, including Conghua District and Zengcheng District, accelerated further. Due to the spatial and temporal resolution limitations of land use data, it is difficult to conduct high-precision and high-resolution spatial analysis, which imposes certain limitations on land use changes at the local scale. In subsequent research, high-resolution remote sensing images can be fully utilized to further explore the spatial changes in cultivated land use from a microscopic perspective.

4.3. Analysis of the Driving Mechanisms of Farmland Conversion to Non-Agriculturization Uses

In the study of the driving mechanisms behind farmland use changes, the selection of driving factors varies depending on the focus of the research. Farmland resource utilization is typically the result of the combined effects of natural elements, such as slope and soil, as well as socio-economic development factors influenced by human activities in the region. Therefore, when analyzing the driving factors of farmland use, it is essential to select factors that can comprehensively reflect the multiple causes of farmland use changes. Many scholars [43,52,55,56] have found that population density is one of the main driving factors behind the issue of non-agricultural land use. This is consistent with the findings of this study that the dominant factor in the non-agricultural use of cultivated land in Guangzhou from 2005 to 2010 was population density. From 2015 to 2018, the impact of the tertiary industry value on the non-agricultural use of cultivated land in Guangzhou was negative. The promotion of the government’s “retreat two and advance three” policy and the upgrading and optimization of the industrial structure driven by the development of the tertiary industry have to some extent slowed down the non-agricultural use of cultivated land. This conclusion is consistent with the research results of Yuan et al. [57]. However, the impact of the tertiary industry on non-agricultural activities has both positive and negative effects, and is closely related to the level of local economic development. Xi et al. found in their study that the tertiary industry has a significant positive impact on non-agricultural activities [53]. The reason for the difference in this study’s results is that Guangzhou’s economic development reached a high level from 2015 to 2018, so the development of the tertiary industry has had a negative impact on non-agricultural activities. This study aims to explore the impact of socio-economic factors and the inherent characteristics of farmland, considering both natural factors and socio-economic development to reveal the mechanisms and interactions behind farmland use changes. In the process of constructing the driving factor indicator system, although a large number of the literature and expert suggestions have been referred to, there is still a certain subjectivity in the selection of driving factors. Thoroughly analyzing the driving factors of farmland utilization, exploring the interrelationships between factors, and establishing a more scientific indicator system for driving factors are beneficial for exploring the fundamental reasons for changes in farmland utilization. With economic development, the land transfer or cultivation of economic crops by business entities to pursue higher profits will influence the utilization of farmland. Future research could analyze changes in farmland use from the perspective of business entities, allowing for a more comprehensive analysis of the reasons behind farmland resource use changes.

5. Conclusions

The research results indicate that among the three stages of the study, the level of non-agricultural land use in Guangzhou was the most severe from 2005 to 2010. Although the government has introduced relevant policies to protect arable land, the pressure of economic growth has led to the ineffective constraint of the policy of balancing occupation and compensation, resulting in a large amount of arable land being converted to non-agricultural use. The primary type of conversion in Guangzhou was farmland being turned into construction land, with the highest conversion rates in Yuexiu District, Liwan District, Tianhe District, and Haizhu District, with conversion rates of 100%, 79.40%, 47.19%, and 42.97%, respectively. During this period, the average kernel density of farmland conversion in Guangzhou was 1.59, indicating a certain degree of spatial concentration, particularly in areas with lower elevations. Using standard deviation ellipses and center of gravity migration analysis, it was found that the center of gravity of farmland conversion in Guangzhou showed a southwest–northeast distribution, with a more obvious scatter pattern compared to the northwest–southeast direction. Through a stage-by-stage analysis of the driving factors behind farmland conversion in Guangzhou, population density and per capita income were identified as the main driving factors during the 2005–2010 period, with both showing a positive relationship with farmland conversion. The increase in population density led to rising demand for urban construction land, which pushed farmland into non-agriculturization use [58]. Meanwhile, the improvement in per capita income accelerated the urbanization process and infrastructure development, further exacerbating the trend of farmland being converted to non-agriculturization uses. Between 2010 and 2015, the primary driving factor behind farmland conversion shifted to regional GDP. As an important indicator of economic development, the growth of GDP promoted industrialization and urbanization, leading to more farmland being converted into construction land to meet development needs. Under the dual pressure of new urbanization and ecological protection, as well as the intensification of farmland protection policies, the pace of non-agricultural land use has slowed down at this stage. Between 2015 and 2018, the main driving factors behind farmland conversion further evolved to regional GDP and the value of the tertiary industry. However, under the combined effect of economic development and industrial policies, the rapid development of the tertiary industry has to some extent slowed down the non-agricultural development of cultivated land. Under the background of the “dual carbon” goal and rural revitalization strategy, implementing intensive land use and optimizing the policy of balancing occupation and compensation is of great significance for farmland protection and sustainable agricultural development.

Author Contributions

Conceptualization, Y.Z., W.W. and Q.W.; methodology, X.M.; software, Y.Z.; validation, Y.Z., W.W., Y.H. and X.M.; formal analysis, Y.Z.; resources, Q.W.; data analysis, Y.Z. and W.W.; writing—original draft preparation, Y.Z. and Y.H.; writing—review and editing, Q.W.; visualization, Y.Z.; supervision, Y.H.; project administration, Y.H.; funding acquisition, Q.W. All authors have read and agreed to the published version of the manuscript.

Funding

This work was supported by the National Key R&D Program of China (2023YFD1900100) “High-resolution Earth Observation System National Science and Technology Major Project (85-Y50G26-9001-22/23; 83-Y50G23-9001-22/23)”; Qinghai Provincial Science and Technology Plan Project (2022-QY-225); Sichuan Provincial Science and Technology Plan Project (2023YFS0371); and Technology Innovation Center of Hebei Provincial Department of Science and Technology “Technology Innovation Center of Late-maturing Peaches in Yanshan, Hebei Province” (Platform Number SJ2023092).

Data Availability Statement

The original contributions presented in this study are included in the article. Further inquiries can be directed to the corresponding author.

Acknowledgments

The authors would like to thank the anonymous reviewers for their valuable comments.

Conflicts of Interest

Author Qiang Wang was employed by the company the Aerospace Wanyuan Cloud Data Hebei Co., Ltd. The remaining authors declare that the research was conducted in the absence of any commercial or financial relationships that could be construed as a potential conflict of interest.

References

  1. Guo, C.; Jin, X.; Yang, X.; Xu, W.; Sun, R.; Zhou, Y. Comprehensive evaluation of newly cultivated land sustainable utilization at project scale: A case study in Guangdong, China. J. Geogr. Sci. 2024, 34, 745–762. [Google Scholar] [CrossRef]
  2. Ma, Y.; Wang, X.; Zhong, C. Spatial and Temporal Differences and Influencing Factors of Eco-Efficiency of Cultivated Land Use in Main Grain-Producing Areas of China. Sustainability 2024, 16, 5734. [Google Scholar] [CrossRef]
  3. Hu, Y.; Yang, H.; Zou, R.; Shi, Z.; Wu, W.; Wu, L.; Wang, L.; Ren, X.; Xie, Y.; Ren, S.; et al. Evolution and prospect of systematic cognition on the cultivated land resources. J. Agric. Resour. Environ. 2021, 38, 937–945. [Google Scholar]
  4. Wu, Z.; Fan, Q.; Li, W.; Zheng, Y. The Spatial–Temporal Evolution and Impact Mechanism of Cultivated Land Use in the Mountainous Areas of Southwest Hubei Province, China. Land 2024, 13, 1946. [Google Scholar] [CrossRef]
  5. Chen, F.; Liu, J.; Chang, Y.; Zhang, Q.; Yu, H.; Zhang, S. Spatial Pattern Differentiation of Non-grain Cultivated Land and Its Driving Factors in China. China Land Sci. 2021, 35, 33–43. [Google Scholar]
  6. General Office of the State Council. The General Office of the State Council issued the Notice on Resolutely stopping the “Non-agricultural” behavior of cultivated land. Agric. Eng. 2020, 10, 3. [Google Scholar]
  7. Yang, Y.; Peng, B.; Lv, M.; Chen, X.; Guo, X. Spatial and temporal changes and driving mechanism of cultivated land conversion in central Yunnan urban agglomeration from 1990 to 2020. J. Soil Water Conserv. 2024, 38, 239–251. [Google Scholar]
  8. Liu, H.; Wang, H.; Jin, Z.; Pan, C. Spatial and temporal evolution characteristics and driving mechanism of cultivated land conversion in Lower Liaohe River Plain. Chin. J. Eco-Agric. 2024, 32, 1420–1431. [Google Scholar]
  9. Su, Y. Study on the Spatial-Temporal Evolution and Control of Non-Grain Production within Cultivated Land. Ph.D. Thesis, Zhejiang University, Hangzhou, China, 2020. [Google Scholar]
  10. Kong, X. To stop the “non-agricultural transformation” of cultivated land, we must enhance the collaborative governance capacity. J. China Party Gov. Cadres Forum 2020, 81–82. [Google Scholar] [CrossRef]
  11. Hiroyoshi, Y. A study on the operational problems of the use district system from the viewpoint of the change of land use: The case of industrial districts in the built up area. J. City Plan. 1983, 18, 85–90. [Google Scholar]
  12. Prasetyolli, B.; Jitsukumasaki, R. Population growth and land use change in tropical urban areas: A case study of jabotabek metropolitan area. Indones. J. Jpn. For. Soc. 1995, 77, 72–74. [Google Scholar]
  13. Walford, R. Land use changes across the century. Teach. Geogr. 2000, 25, 40–41. [Google Scholar]
  14. Leitch, C.; Harbor, J. Impacts of land use change on freshwater runoff into the near-coastal zone, Holetown Watershed, Barbados: Comparisons of long-term to single-storm effects. J. Soil Water Conserv. 1999, 54, 584–592. [Google Scholar] [CrossRef]
  15. Zhang, Q.; Xu, H.; Fu, J.; Yu, P.; Zhang, P. Spatial Analysis of Land Use and Land Cover Changes in Recent 30 Years in Manas River Basin. Procedia Environ. Sci. 2012, 12, 906–916. [Google Scholar]
  16. Peng, P.; Yang, G. Agricultural development and non-agriculturization of land. Nat. Resour. J. 1996, 20, 36–40. [Google Scholar]
  17. Zhang, K. Thoughts on China’s urbanization and urbanization. Urban Probl. J. 1995, 14, 36–38. [Google Scholar]
  18. Lu, M. New trend of development economics: Theoretical research on rural non-agricultural chemistry. Econ. Dyn. J. 1994, 35, 50–53. [Google Scholar]
  19. Liu, J.; Su, B. Empirical analysis of urbanization and rural non-agriculture in Xinjiang. Xinjiang Econ. J. 1994, 13, 12–15. [Google Scholar]
  20. Jiang, C. Dynamic investigation of the differentiation of farmers (farmers) in the process of rural non-agricultural chemical-Take Tianchang City, Anhui Province as an example. Chin. Rural Econ. J. 1995, 11, 50–56. [Google Scholar]
  21. Tang, H.; Guo, X.; Shen, M. Investigation and analysis of the current non-agricultural problems of agricultural land. Issues Agric. Econ. J. 1993, 14, 45–50. [Google Scholar]
  22. Zhao, Y. Comparative study on the mechanism of non-agricultural development in China-Take quantitative analysis in Liaoning and Jiangsu provinces as an example. Urban Plan. J. 1996, 40, 45–49. [Google Scholar]
  23. Long, Z.; Sheng, Z. On the Non-agriculturalization of Farmland in China. Ecol. Econ. J. 2004, 11, 49–51. [Google Scholar]
  24. Liu, Z. Comparative Analysis of Reasons for Rural Non-agriculturalization. Gansu Theory Res. J. 1997, 17, 42–44. [Google Scholar]
  25. Min, J.; Gao, W.; Li, X.; Zhang, A. An Analysis of Dissimilarity in Space of Cultivated Land Conversion in Jianghan Plain. Sci. Technol. Manag. Land Resour. J. 2006, 23, 11–15. [Google Scholar]
  26. Yan, X.; Liu, X. Analysis of rural urbanization characteristics in the Pearl River Delta. Geogr. Land Res. J. 1997, 13, 30–36. [Google Scholar]
  27. Liu, L. Study on the Convergence of Cultivated Land Conversion in Economic Growth. Master’s Thesis, Chinese Academy of Agricultural Sciences, Beijing China, 2007. [Google Scholar]
  28. Yang, R. Association analysis of Chinese urbanization and non-agricultural gray. Reg. Res. Dev. 1998, 17, 18–20. [Google Scholar]
  29. Fan, J.; Tian, M. Relative Analysis and Provincial Differences of China′s Urbanization and Non-agricultural Development. Geogr. Sci. 2003, 23, 641–648. [Google Scholar]
  30. Tan, R.; Qu, F. Spatial allocation efficiency of farmland Coversion and Farmland Resource Loss in China. China Soft Sci. 2006, 21, 49–57. [Google Scholar]
  31. Ren, P.; Wu, T.; Zhou, J. Study on Value Loss Evaluation Model and Compensation Mechanism of Cultivated Land Conversion. Sci. Agric. Sin. 2014, 47, 786–795. [Google Scholar]
  32. Qu, F.; Wu, L. Kuznets curve hypothesis and verification of economic growth and nonagroalization of cultivated land. Resour. Sci. 2004, 28, 61–67. [Google Scholar]
  33. Yang, W.; Liu, D. Estimation Loss of Agroecosystem Service Value in Farmland Conversion land Its Provincial Difference in 2001–2016. Econ. Geogr. 2019, 39, 201–209. [Google Scholar]
  34. Gong, R. Agricultural High-Quality Development and New Urbanization in China: Space-Time Evolution and Interactive Relationship. Ph.D. Thesis, Chongqing University, Chongqing, China, 2022. [Google Scholar]
  35. Zhen, F.; Cao, Y.; Qin, X.; Wang, B. Delineation of an urban agglomeration boundary based on Sina Weibo microblog ’check-in’ data: A case study of the Yangtze River Delta. Cities 2017, 60, 180–191. [Google Scholar] [CrossRef]
  36. Li, H.; Tian, D.; Tan, J. Spatial-temporal Pattern Evolution and Influencing Factors of Cultivated Land Non-agriculturalization in Yanan City. Bull. Soil Water Conserv. 2022, 42, 330–337. [Google Scholar]
  37. Xing, L.; Fang, B. Study on So-temporal Pattern and Coordinated Development of Urbanization and Ecological Environment in Jiangsu Province. J. Nanjing Norm. Univ. (Nat. Sci. Ed.) 2018, 41, 131–137. [Google Scholar]
  38. Li, X.; Wu, Q.; Liu, D. Spatial Distribution and Influential Factor of Agricultural Tourism Destinations in Wuhan Metropolitan Area. Trop. Geogr. 2014, 34, 422–428. [Google Scholar]
  39. Li, X.; Wu, L.; Wu, Q.; Zhang, M. The Space-Temporal Pattern Evolution of China’s National Ecological Demonstration Areas. Econ. Geogr. 2015, 35, 149–156. [Google Scholar]
  40. Liang, Y.; Guan, Y.; Huang, Z.; Jiao, X. Spatial-Temporal Heterogeneity of Coupling and Coordination Between Green Land Use and E-conomic Growth in Beijing-Tianjin-Hebei Area. J. Ecol. Rural Environ. 2020, 36, 1522–1531. [Google Scholar]
  41. Zhang, Y.; Wang, L.; Zhang, H.; Li, X. An Analysis on Land Use Changes and Their Driving Factors in Shule River: An Example From Anxi County. Prog. Geogr. 2003, 22, 170–178. [Google Scholar]
  42. Zhu, Z. Study on the Spatial-Temporal Characteristics, Driving Mechanisms, and Optimization Regulation of Cultivated Land Use Transformation in China’s Main Grain-Producing Areas. Ph.D. Thesis, Northwest A & F University, Yangling, China, 2024. [Google Scholar]
  43. Zhou, F.; Zhou, Y. Analysis of the factors influencing the quantity and quality of cultivated land in Xishan City, Jiangsu Province. China Land Sci. 2001, 15, 7–10. [Google Scholar]
  44. Cao, L.; Lang, Q.; Lei, K.; Wang, D.; Yang, K. Analysis on landscape pattern dynamics and driving force in Yongding River Basin from 1980 to 2020. J. Environ. Eng. Technol. 2023, 13, 143–153. [Google Scholar]
  45. Deng, L.; Yang, Z.; Su, W. Optimization Countermeasures for Crops Planting Structure in Karst Area of Guizhou. Econ. Geogr. 2017, 37, 160–166. [Google Scholar]
  46. Huang, L.; Zhang, J.; Lu, S.; Zhong, L.; Liu, L.; Gong, H.; Chao, L.; Huang, T.; Gan, L. Spatial-temporal Patterns and Driving Factors of Crop Planting Structure in Guangxi. Southwest China J. Agric. Sci. 2021, 34, 1682–1689. [Google Scholar]
  47. Ke, S.; Zhu, X.; Cui, H.; Yu, Y.; Hu, L.; Lu, X.; Gao, T. Impact of China’s overseas farmland investment on host countries’ environmental quality and itstransmission mechanisms. China Popul. Resour. Environ. 2024, 34, 75–84. [Google Scholar]
  48. Li, J.; Qie, R. Spatial Differentiation and Driving Factors of Rural Idle Homestead in Northeast Black Soil Region: A Case Study ofMeihekou City, Jilin Province. T. Nat. Resour. Stud. 2025, 47, 34–38. [Google Scholar]
  49. Wu, N.; Wei, Y.; Li, L.; Yang, H. Spatial distribution of non-grain crops and formation mechanism: Empirical analysis of Ningling County, Henan Province. Prog. Geogr. 2023, 42, 1298–1310. [Google Scholar] [CrossRef]
  50. Huang, Z.; Li, Y.; Mao, X. The current situation and countermeasures of “non-agricultural” and “non-food” cultivated land in China. JAC Forum 2022, 65, 13–21. [Google Scholar]
  51. Jiao, Y.; Xiao, D.; Ma, M. Spatial pattern in residential area and influencing factors in oasis landscape. Acta Ecol. Sin. 2003, 23, 2092–2100. [Google Scholar]
  52. Lu, Q.; Zhu, S.; Xiao, Z.; Zhu, G.; Li, J.; Gui, J.; He, W.; Sun, J. Spatiotemporal Variability and Drivers of Cropland Non-Agricultural Conversion Across Mountainous County Types: Evidence from the Qian-Gui Karst Region, China. Agriculture 2025, 15, 795. [Google Scholar] [CrossRef]
  53. Xijiri; Zhou, R.; Bao, B.; Burenjirigala. Spatiotemporal patterns and drivers of cultivated land conversion in Inner Mongolia Autonomous Region, northern China. J. Arid Land 2024, 16, 1197–1213. [Google Scholar] [CrossRef]
  54. Wu, X.; Zhao, N.; Wang, Y.; Zhang, L.; Wang, W.; Liu, Y. Cropland non-agriculturalization caused by the expansion of built-up areas in China during 1990–2020. Land Use Policy 2024, 146, 107312. [Google Scholar] [CrossRef]
  55. Yan, H.; Chen, H.; Wang, F.; Qiu, L. Dynamics of Cropland Non-Agriculturalization in Shaanxi Province of China and Its Attribution Using a Machine Learning Approach. Land 2025, 14, 190. [Google Scholar] [CrossRef]
  56. Huang, H.; Zhu, H. Analysis on the Cultivated Land Quantity Change and Its Driving Forces in Chengdu Plain. J. Anhui Agric. Sci. 2010, 38, 843–845. [Google Scholar]
  57. Yuan, S.; Yang, L.; Yang, G.; Yao, S. The Spatial Heterogeneity of Socio-economic Driving Factors of Cultivated Land Conversion:A Case Based on STIRPAT and GWR models. Econ. Geogr. 2013, 33, 137–143. [Google Scholar]
  58. Zhang, Z.; Ghazali, S.; Miceikienė, A.; Zejak, D.; Choobchian, S.; Pietrzykowski, M.; Azadi, H. Socio-economic impacts of agricultural land conversion: A meta-analysis. Land Use Policy 2023, 132, 106831. [Google Scholar] [CrossRef]
Figure 1. Overview of the Study Area.
Land 14 00968 g001
Figure 2. Changes in arable land types in Guangzhou from 2005 to 2018.
Land 14 00968 g002
Figure 3. Kernel density analysis of non-agriculturization of arable land use in Guangzhou from 2005 to 2018. (a) Kernel density analysis of non-agriculturization of arable land use in Guangzhou from 2005 to 2010; (b) Kernel density analysis of non-agriculturization of arable land use in Guangzhou from 2010 to 2015.; (c) Kernel density analysis of non-agriculturization of arable land use in Guangzhou from 2015 to 2018.; (d) Kernel density analysis of non-agriculturization of arable land use in Guangzhou from 2005 to 2018.
Land 14 00968 g003
Figure 4. Standard deviation ellipse of non-agriculturization rate of arable land and gravity migration.
Land 14 00968 g004
Figure 5. Graded distribution of driving factors for non-agricultural use of cultivated land from 2005 to 2010.
Land 14 00968 g005
Figure 6. Regional GDP growth rate.
Land 14 00968 g006
Figure 7. Guangzhou GDP and Tertiary Industry Value from 2015 to 2018.
Land 14 00968 g007
Table 1. Driving factors of farmland use change.
Driving FactorsDriver FactorSource of Indicators/
Calculation Method
Index Interpretation
Natural Factors of Cultivated LandArable Land QualityArable land quality dataReflect the natural productivity of arable land
PrecipitationCalculate the regional average based on meteorological station dataReflect the actual utilization of arable land
ElevationCalculate elevation values based on DEM (Digital Elevation Model)Reflect the basic characteristics of the terrain
Per Capita Cultivated Land AreaStatistical data (cultivated land area/population) × 1000Reflect the arable land resource potential for crop cultivation
Socio-economic DevelopmentTotal Agricultural Machinery PowerStatistical dataReflect the degree of mechanization in crop cultivation
Gross Domestic ProductStatistical dataReflect the level of economic development in the region
Per Capita Net Income of Rural ResidentsStatistical dataReflect the per capita net income level of rural residents in the region
Gross Value of the Secondary IndustryStatistical dataReflect the level of industrial development in the regional industrial structure
Gross Value of the Tertiary IndustryStatistical dataReflect the level of service industry development in the regional industrial structure
Population DensityUrban population/total populationReflect the pressure of population on land use
Table 2. Statistical table of non-agriculturization land use in Guangzhou’s districts from 2005 to 2010.
DistrictsGrasslandConstruction LandArable LandForest LandWater AreaUnused LandTotal Arable Land AreaNon-Agriculturization Land AreaNon-Agriculturization Rate
Baiyun 4.873645.8918,821.15402.65813.22 23,687.77 4866.62 20.54
Conghua 150.221947.2747,243.031711.18388.072.0151,441.79 4198.76 8.16
Panyu7.952705.4815,067.4882.00904.10 18,767.02 3699.54 19.71
Haizhu 117.86182.664.0515.70 320.27 137.61 42.97
Huadu 79.373782.2529,244.31525.92625.613.2234,260.68 5016.37 14.64
Huangpu3.001163.487207.74603.1322.35 8999.70 1791.95 19.91
Liwan 793.77210.28 16.50 1020.56 810.28 79.40
Nansha 15.232775.7831,405.59215.543908.27 38,320.42 6914.82 18.04
Tianhe 1077.481290.4668.836.84 2443.61 1153.15 47.19
Zengcheng 15.392665.4945,155.591845.41476.12 50,157.99 5002.40 9.97
Table 3. Statistical table of non-agriculturization land use in Guangzhou’s districts from 2010 to 2015.
DistrictsGrass
Land
Construction LandArable LandForest LandWater AreaUnused LandTotal Arable Land AreaNon-Agriculturization Land AreaNon-Agriculturization Rate
Baiyun 0.45667.5819,346.0344.8237.52 20,096.41750.383.73
Conghua 21.77572.3249,062.05315.4615.650.5449,987.79925.741.85
Panyu9.54634.7316,218.3947.10183.33 17,093.09874.705.12
Haizhu 85.20134.786.752.25 228.9894.2041.14
Huadu 11.79731.2030,515.8275.4551.820.6331,386.70870.882.77
Huangpu0.36538.008524.2471.153.97 9137.73613.496.71
Liwan 80.34161.83 2.42 244.5982.7633.83
Nansha 0.18953.3334,012.6710.0881.43 35,057.691045.022.98
Tianhe 33.731419.724.770.63 1458.8439.132.68
Zengcheng 4.771289.5646,488.04400.0949.40 48,231.861743.823.62
Table 4. Statistical table of non-agriculturization land use in Guangzhou’s districts from 2015 to 2018.
DistrictsGrass
Land
Construction LandArable LandForest LandWater AreaUnused LandTotal Arable Land AreaNon-Agriculturization Land AreaNon-Agriculturization Rate
Baiyun 18.08540.2218,389.94260.40302.42 19,511.071121.135.75
Conghua 166.09539.4946,978.781656.76111.160.0949,452.362473.585.00
Panyu3.96470.8215,961.8145.99174.21 16,656.78694.974.17
Haizhu 5.76140.892.432.43 151.5110.627.01
Huadu 76.391422.1728,403.81482.98348.105.6730,739.122335.317.60
Huangpu3.69695.707561.38348.3618.16 8627.301065.9112.36
Liwan 6.98165.48 1.00 173.457.974.60
Nansha 1.17381.8435,119.0233.92358.20 35,894.14775.122.16
Tianhe 553.36847.6533.104.95 1439.06591.4141.10
Zengcheng 18.711217.9443,795.011782.23259.79 47,073.693278.686.96
Table 5. Changes in the standard deviation ellipse and centroid parameters of non-agriculturization rates.
Standard Deviation EllipseCentroid PositionMigration Distance (km)Long Axis (km)Short Axis (km)Long-to-Short Axis RatioAzimuth (°)Ellipse Area (ha)
2005–2010
non-agriculturization Rate
113°30.12′ E
23°20.557′ N
-3.723.421.1029.184.00
2010–2015
non-agriculturization Rate
113°30.802′ E
23°17.454′ N
5.814.402.971.4819.444.10
2015–2018
non-agriculturization Rate
113°31.167′ E
23°19.424′ N
3.674.373.211.3614.934.40
Table 6. Stepwise regression analysis results of driving factors for arable land non-agriculturization in Guangzhou, 2005–2018.
StageDriver FactorRegression
Coefficient
95% CICollinearity DiagnosticsR2F Value
VIFTolerance
2005–2010Constant−6.392−21.704~8.920--0.871F (2,8) = 26.919
p = 0.000
(−0.818)
Population Density
(Person/km2)
0.003 **0.002~0.0041.0530.95
−7.264
Per Capita Annual Net Income of Rural Residents (Yuan)0.001 *0.000~0.0021.0530.95
−2.635
2010–2015Constant1.1720.267~2.077--0.895F (1,5) = 42.491
p = 0.001
−2.537
Gross Domestic Product (Billion Yuan)0.000 **0.000~0.00011
−6.519
2015–2018Constant−9.137 *−15.624~−2.649--0.927F (3,6) = 25.437
p = 0.001
(−2.760)
Gross Domestic Product (Billion Yuan)0.011 **0.008~0.0131.5940.627
−8.492
Tertiary Industry (Billion Yuan)−0.008 *−0.013~−0.0031.1730.852
(−3.294)
* D-W Value (Durbin–Watson, the difference between residuals and predicted values) = 1.629, p < 0.05 ** p < 0.01 (t-values in parentheses).
Disclaimer/Publisher’s Note: The statements, opinions and data contained in all publications are solely those of the individual author(s) and contributor(s) and not of MDPI and/or the editor(s). MDPI and/or the editor(s) disclaim responsibility for any injury to people or property resulting from any ideas, methods, instructions or products referred to in the content.

