Abstract
Free trade zones are key regions experiencing rapid economic growth, urbanization, and a sharp increase in population density. During the development of free trade zones, these areas undergo drastic transformations in landscape types, large-scale urban construction, heightened resource consumption, and other associated challenges. These factors have led to severe landscape ecological risk (LER). Therefore, conducting comprehensive assessments and implementing effective management strategies for LER is crucial in advancing ecological civilization and ensuring high-quality development. This study takes Hainan Island (HI), China, as a case study and utilizes multi-source data to quantitatively evaluate land use and land cover change (LULCC) and the evolution of the LER in the study area from 2015 to 2023. Additionally, it examines the spatial patterns of LER under three future scenarios projected for 2033: a natural development scenario (NDS), an economic priority scenario (EPS), and an ecological conservation scenario (ECS). Adopting a spatiotemporal dynamic perspective framed by the “historical–present–future” approach, this research constructs a zoning framework for LER management to examine the temporal and spatial processes of risk evolution, its characteristics, future trends, and corresponding management strategies. The results indicate that, over an eight-year period, the area of built-up land expanded by 40.31% (504.85 km2). Specifically, between 2015 and 2018, built-up land increased by 95.85 km2, while, from 2018 to 2023, the growth was significantly larger at 409.00 km2, highlighting the widespread conversion of cropland into built-up land. From 2015 to 2023, the spatial distribution of LER in the study area exhibited a pattern of high-risk peripheries (central mountainous areas) and low-risk central regions (coastal areas). Compared to 2023, projections for 2033 under different scenarios indicate a decline in cropland (by approximately 17.8–19.45%) and grassland (by approximately 24.06–24.22%), alongside an increase in forestland (by approximately 4.5–5.35%) and built-up land (by approximately 23.5–41.35%). Under all three projected scenarios, high-risk areas expand notably, accounting for 4.52% (NDS), 3.33% (ECS), and 5.75% (EPS) of the total area. The LER maintenance area (65.25%) accounts for the largest proportion, primarily distributed in coastal economic development areas and urban–rural transition areas. In contrast, the LER mitigation area (7.57%) has the smallest proportion. Among the driving factors, the GDP (q = 0.1245) and year-end resident population (q = 0.123) were identified as the dominant factors regarding the spatial differentiation of LER. Furthermore, the interaction between economic factors and energy consumption further amplifies LER. This study proposes a policy-driven dynamic risk assessment framework, providing decision-making support and scientific guidance for LER management in tropical islands and the optimization of regional land spatial planning.
1. Introduction
Rapidly urbanizing regions are key drivers of economic growth and social progress. However, population concentration, urban expansion, and high-intensity economic activities have significantly exacerbated resource pressures and ecological risks [1,2], placing greater demands on the construction of regional ecological security barriers. Against the backdrop of increasing global economic integration, China announced the establishment of the Hainan pilot free trade zone (HPFTZ) on 13 April 2018. The HPFTZ has aligned itself with high international trade and economic standards, driving high-intensity resource development, transportation network expansion, and the concentrated growth of modern services and tourism industries. Despite these significant achievements, the regional terrestrial and marine ecosystems of Hainan Island (HI), constrained by limited land resources, are facing multiple ecological pressures. The structure and function of these ecosystems have suffered varying degrees of degradation [3,4]. The increasing complexity of regional ecological conservation and spatial governance necessitates further enhancements in regional ecosystem health. Therefore, a scientific understanding of the mechanisms and spatial differentiation patterns of landscape ecological risk (LER) caused by rapid urbanization under the HPFTZ context, along with an exploration of spatial management strategies for regional LER, is crucial for urban development and ecological protection in this region. This understanding is fundamental in building ecological security barriers and achieving regional sustainable development.
LER refers to the potential adverse consequences arising from the interaction between landscape patterns and ecological processes under natural or human disturbances [5]. LER manifests as changes in landscape structure, declines in ecological functions, and other related effects across different spatial scales (e.g., regions, urban agglomerations) by reflecting alterations in land use types and the extent of human disturbances to ecosystems. This is particularly evident in the spatial expansion and contraction of different landscape types (e.g., cropland, built-up land) and changes in their patterns (e.g., size, shape) [6]. Assessing LER is of great significance in reflecting the status of regional ecological security. It not only allows for a comprehensive evaluation of potential ecological threats and cumulative risks in the urbanization process [7,8,9], but also helps to reveal the status of regional ecological security within the interactions of urban development, human activities, and ecological protection. As a result, LER assessment has become a key methodology in regional ecological risk research.
Current LER research primarily employs methodologies such as the landscape pattern index method [10], entropy method [11], source–sink risk model [12], exposure–response method [13], land use change risk index method [14], and pressure–state–response (P-S-R) model [15] to explore the relationships between ecological processes and spatial distribution patterns [16,17]. These studies are conducted at various spatial scales, including provinces [18], urban agglomerations [19], nature reserves [20], mountainous regions [21], and river basins [22], predominantly focusing on ecologically fragile zones and regions with intensive human activity [23]. For tropical island regions, significant research gaps remain. In particular, there is a notable lack of studies on the spatial heterogeneity of regional LER at the provincial scale, as well as the limited exploration of LER predictions under different future scenarios using the patch-generating land use simulation (PLUS) model. Furthermore, under the HPFTZ context, studies on the spatial variation characteristics and evolutionary mechanisms of LER at the regional scale remain absent. There is an urgent need for further academic exploration and refinement in both theoretical and practical aspects.
The HPFTZ encompasses the entire HI, where ecosystems have been facing numerous environmental challenges in recent years. HI boasts a unique tropical ecosystem, including mangroves, wetlands, and tropical rainforests, which play a crucial role in biodiversity conservation, soil and water retention, and carbon sequestration [24]. After 2025, a comprehensive customs closure will be implemented across HI, along with a liberalized trade facilitation policy and regulatory framework featuring “first-line liberalization, second-line control, and freedom on the island”. These measures are expected to further stimulate regional economic growth, optimize the business environment, facilitate international communication, and advance the development of HI as an international tourism island and economic hub. Additionally, they will create favorable conditions for HI to develop into a global transshipment center for goods and a key industrial cluster for biopharmaceuticals, food processing, new energy, new materials, and high-end equipment manufacturing. However, these efforts have also resulted in excessive resource exploitation, environmental degradation, localized functional decline, and other associated issues [25]. The ecological risk characteristics have become increasingly pronounced, including a reduction in natural landscapes (such as mangroves and wetlands), functional degradation, the rapid expansion of artificial landscapes, the loss of ecosystem multifunctionality, and a decline in biodiversity [26]. Meanwhile, human activities have further exacerbated the ecosystem’s vulnerability, posing significant challenges to key ecological functions such as climate regulation and habitat provision [27]. Despite the rapid economic growth facilitated by the HPFTZ, the ecological pressures have intensified considerably. Currently, research on the LER across HI remains limited. Existing studies primarily focus on urban zones [28], coastal zones [29], watersheds [30], mountainous zones [31], and other spatial scales, but they are limited to individual regions or specific local-scale analyses. As a result, they cannot fully reveal the comprehensive impact of HPFTZ development on the island-wide landscape pattern and LER. Moreover, it is difficult to provide effective decision-making bases for the scientific prediction and optimized management of the LER in the HPFTZ under different development scenarios. Moreover, there is a lack of studies revealing the spatiotemporal variation characteristics, evolutionary mechanisms, and ecological zoning management of LER at the regional scale from a dynamic “historical–present–future” perspective.
Given this context, this study focuses on HI and is based on LULCC data before and after the HPFTZ. By applying the LER assessment model, PLUS model, Geoinformatic Tupu, and optimal parameter-based geographical detector, this research explores the spatiotemporal evolution of the land use structure from 2015 to 2023, reveals the spatiotemporal dynamics and driving mechanisms of the regional LER, and examines the evolution of the LER and its zoning-based management under different future development scenarios. This study aims to provide scientific guidance for the study area’s land use optimization, ecological protection, and sustainable development, with the following specific objectives: (1) to integrate the PLUS model and LER assessment model to investigate the historical evolution, current characteristics, and future trends of the regional LER; (2) to construct a regional dynamic LER management framework based on an integrated “historical–present–future” dynamic perspective, utilizing the PLUS model, LER assessment model, and Geoinformatic Tupu to explore the evolutionary process of the regional LER and its ecological regulation strategies; (3) to apply the optimal parameter-based geographical detector model to explain the characteristics of dynamic changes in the regional LER and its driving mechanisms; and (4) to uncover the regulatory mechanisms of LER and ecological protection under the HPFTZ policy framework.
2. Materials and Methods
2.1. Study Area
As shown in Figure 1, HI is located at the southernmost tip of China (18.80–20.10° N, 108.37–111.03° E), boasting a unique geographical location and significant strategic importance [32]. The island covers a total area of approximately 34,000 km2, making it the second-largest island in China. The central mountainous regions of HI are predominantly composed of yellow–brown loam soils, while the surrounding hills and terraces feature yellow and gray sandy loam soils. With an annual average temperature ranging between 22.5 °C and 25.6 °C, the island experiences a tropical marine climate. The topography of HI is characterized by higher elevations in the center and lower terrains along the periphery. The terrain of HI features a gradual transition from mountainous regions to hills, terraces, and plains. The central region, dominated by the Tropical Rainforest National Park, includes the island’s highest peak, Wuzhi Mountain (1867 m). The island boasts numerous rivers and a well-developed water system. With a forest coverage rate of 62.1%, it serves as a vital reservoir of biodiversity and genetic resources in China [33,34].
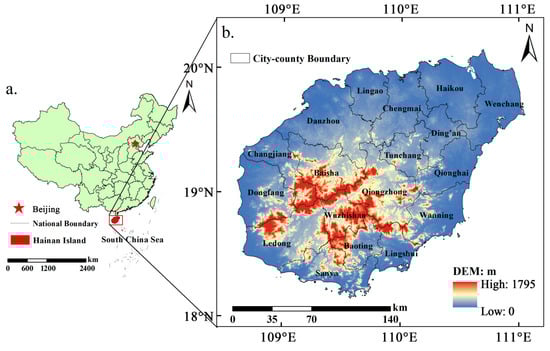
Figure 1.
Location and features of the study area. Notes: (a) China, (b) Hainan Island.
The HPFTZ focuses on the development of tourism, modern services, and high-tech industries. Due to its favorable climate and natural resources, HI has become a globally renowned tourist destination, currently boasting 36 national 4A-level and above scenic spots. As of 2022, HI received 60.04 million tourists, with the total tourism revenue reaching CNY 105.476 billion. With the accelerated development of the HPFTZ, large-scale infrastructure projects, port expansions, industrial park developments, and tourism site constructions have significantly encroached upon forests, wetlands, and farmland. This has led to the substantial conversion of natural ecological land into construction and commercial land [26,35], resulting in notable changes in the regional land use patterns. Notably, in coastal areas and ecologically vulnerable zones, ecosystems such as wetlands, mangroves, and coastal zones have been damaged, leading to the increased fragmentation of ecological landscapes, significant declines in biodiversity, and reduced ecosystem stability [36]. Additionally, overdevelopment has profoundly impacted HI’s ecological balance. Human activities such as urbanization, agricultural production, and marine fisheries have complex and profound effects on the island’s ecosystem structure, landscape connectivity, and ecological functions. Therefore, it is imperative to enhance LER management in these areas, further enforce regional ecological red lines and risk controls, and ensure that HI’s ecological environment is effectively protected during the development of the HPFTZ.
2.2. Data Sources
The primary data used in this study are presented in Table 1 and Figure 2. The LULCC types include cropland, forestland, grassland, water bodies, built-up land, and unused land, totaling six categories. Three temporal nodes were selected to capture the policy and land use dynamics: 2015, 2018, and 2023. Among them, 2018 serves as the critical baseline year, marking the initiation of the HPFTZ policy; 2023 provides the most recent land use data available from the Resource and Environment Science and Data Center (RESDC, Beijing, China); and 2015 was selected in place of the unavailable 2013 RESDC data to ensure the consistency of the data sources and to minimize the potential bias caused by platform discrepancies. Soil erosion degrees were calculated using a soil erosion model [37,38]. To ensure geospatial consistency, all data were rasterized in ArcGIS 10.8 (ESRI Inc., Redlands, CA, USA), resampled to 30 m, and finally converted to the WGS_1984 coordinate system.

Table 1.
Basic information and sources of data.

Figure 2.
Summary of driving factors.
2.3. Methods
Figure 3 illustrates the technical roadmap of this study.
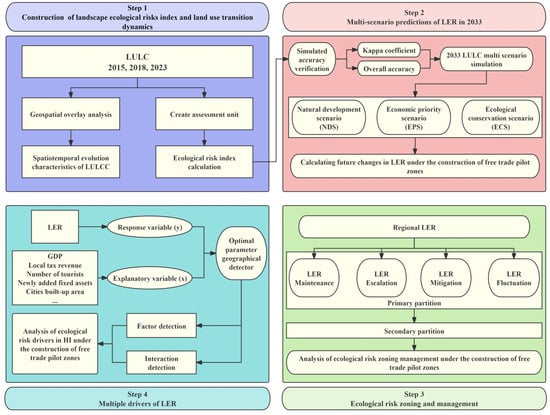
Figure 3.
Technical roadmap of the proposed methodology.
2.3.1. LER Model
- (1)
- LER assessment unit
The optimal size for LER assessment units is generally 2 to 5 times the average patch area [39] and is based on LULCC. Considering the characteristics of the study area and referencing previous research findings [40], this study utilized the fishnet tool in ArcGIS to divide the research area into 2 km × 2 km grid units for LER assessment, resulting in a total of 8923 assessment units. Subsequently, the Fragstats 4.2 software was employed to calculate landscape metrics for each assessment unit.
- (2)
- LER index (LERI) construction
Based on landscape ecology theory, this study constructed an LER assessment model using the landscape disturbance index (Ei), landscape vulnerability index (Fi), and landscape loss index (Ri) [41]. The formula is as follows:
In this formula, ERIk represents the LERI of the k-th evaluation unit, n is the total number of evaluation units, i is the number of landscape types, Aki denotes the area of the i-th landscape type within the k-th evaluation unit, Ak represents the total area of the k-th evaluation unit, and Ri is the landscape loss index.
Ri represents the degree of natural attribute loss for different landscape types when subjected to natural and human disturbances. The calculation formula is
Ei represents the complexity of different ecosystems and their susceptibility to biological disturbances. A higher regional landscape disturbance index indicates a greater level of ecological risk. This index is derived by integrating landscape division, landscape dominance, and landscape fragmentation [42]. The calculation formula is
In the formula, ni represents the number of patches of landscape type i, Wi is the ratio of the number of plots containing the patch to the total number of plots, Si denotes the proportion of patches of type i to the total number of patches, and Qi represents the ratio of the area of patch i to the total plot area. Ar is the total area of the study region. The parameters a, b, and c represent the weighting factors for landscape fragmentation, landscape division, and landscape dominance, respectively, with assigned values of 0.5, 0.3, and 0.2. This reflects the ability of different landscape-represented ecosystems to resist external disturbances and their internal vulnerability. The vulnerability of landscape types in the study area is classified into six levels in the following order: built-up land, forestland, grassland, cropland, water bodies, and unused land. After normalization, the vulnerability index Fi for each landscape type was obtained.
Ordinary kriging analyzes spatial autocorrelation through semivariogram modeling, effectively capturing the spatial variations in data and generating prediction error surfaces, making it particularly suitable for ecological risk data exhibiting strong spatial dependence [43]. With the support of ArcGIS 10.8, the LERI values for each evaluation unit were interpolated using ordinary kriging, generating the spatial distribution of the LERI across the study area. The natural breaks method was then applied to classify the LER into five risk areas: low ecological risk (LERI < 0.0185), low–medium ecological risk (0.0185 ≤ LERI < 0.0235), medium ecological risk (0.0235 ≤ LERI < 0.028), medium–high ecological risk (0.0280 ≤ LERI < 0.032), and high ecological risk (LERI ≥ 0.032).
2.3.2. Future LULCC Under the PLUS Model
The PLUS model, proposed by Liang et al., consists of two core components: the land expansion analysis strategy (LEAS) and a cellular automata (CA) model based on multitype random seeds (CARS) [44]. The LEAS module extracts land expansion areas between two time points and applies a random forest algorithm to identify the driving forces and generate development probabilities for each land use type. The CA module dynamically simulates patch-level land use transitions under probabilistic constraints, integrating stochastic seed generation with a decreasing threshold mechanism. Owing to its high simulation accuracy and ability to capture complex spatial patterns, the PLUS model has been widely applied in land use prediction studies [8,45,46,47]. Drawing upon Hainan Province’s territorial spatial planning, regional economic trends, the 14th Five-Year Plan, and relevant research [48,49], this study employed the PLUS model to simulate land use patterns in 2033 based on LULCC data from 2018 and 2023. This provides a scientific basis for the evaluation of future LER under the ongoing construction of the Hainan Free Trade Port. Referring to the setting of multi-scenario simulation driving factors in previous studies [8,50,51,52], twelve driving factors were selected, encompassing natural environment variables (annual average temperature, annual precipitation, soil type, elevation, slope), socioeconomic indicators (GDP, population density), accessibility metrics (distance to roads, distance to provincial highway, distance to settlements, distance to railway), and the soil erosion status. These factors, along with model parameter settings and land use conversion constraints, were integrated into the PLUS model. To enhance the clarity of the comparative analysis and minimize uncertainties associated with long-term forecasting, this study simulated three land use scenarios for HI in 2033—namely, the natural development scenario (NDS), ecological conservation scenario (ECS), and economic priority scenario (EPS)—to assess the impact of different development strategies on future land use and land cover change (LULCC) in the Hainan Free Trade Port (HPFTZ). The transition probability matrices for each scenario are presented in Table 2. After multiple calibrations, the neighborhood weights for cropland, forestland, grassland, water bodies, built-up land, and unused land were determined to be 0.0106, 0.9998, 0.0322, 0.1699, 0.3976, and 0.0011, respectively, with the weights ranging between 0 and 1.
Table 2.
Probability matrices of land category development under different scenarios.
NDS: It is assumed that future policy adjustments will not directly impact economic development or ecological protection. The model directly simulates the land demand for various land types in the HPFTZ by 2033.
ECS: This scenario imposes restrictions on human economic and social development activities that could disturb the ecological environment. It incorporates policies such as permanent basic farmland protection, ecological redline delineation, and territorial spatial planning, thereby limiting the expansion probability of built-up land.
EPS: This scenario considers key factors in socioeconomic development, particularly the increasing demand for built-up land due to economic expansion. As a result, the probability of forestland being converted into built-up land is increased.
Finally, the LULCC data for 2020 were simulated using the LULCC data from 2010 and 2015 for HI. A comparative analysis between the simulated data and the actual LULCC data yielded overall accuracy of 94.95% and a Kappa coefficient of 0.906. This suggests that, although the PLUS model may exhibit some degree of uncertainty when projecting long-term ecological and land use changes, the results of this study can be considered reasonably robust and provide valuable insights for the understanding of future trends.
2.3.3. Ecological Risk Zoning and Management
To better explore the spatiotemporal dynamic characteristics and evolutionary patterns of regional LER, this study referred to Geoinformatic Tupu [53] and established an LER assessment model from a historical–present–future dynamic perspective [6]. First, the LER levels were reclassified and merged to generate new LER areas, namely new low-risk area I (comprising the low-risk and low–medium-risk areas), new medium-risk area II (corresponding to the medium-risk area), and new high-risk area III (encompassing the high-risk and medium–high-risk areas). Using the overlay analysis tool in ArcGIS 10.8, the newly classified LERs for the three periods (2015, 2023, and 2033) were overlaid to obtain the dynamic evolution map of the LER in the study area. The specific calculation formula is as follows:
In the formula, Y represents the calculated Tupu index, T denotes the LER data from different time periods, L refers to the ecological risk level, and ∆L indicates the change in the ecological risk level. Based on the calculated results, this study classifies the LER areas into four major types (Table 3).
Table 3.
Spatiotemporal perspective-based zoning for LER management and control.
LER Maintenance (I–I–I, etc.): The LER level remains relatively stable across the historical, present, and future periods, showing no significant upward or downward trends in the risk level.
LER Escalation (I–II–III, etc.): The LER level exhibits an upward trend, indicating the gradual intensification of the regional ecological risk.
LER Mitigation (III–II–I, etc.): The LER level demonstrates a declining trend, suggesting a reduction in the regional ecological risk intensity.
LER Fluctuation (III–II–III, etc.): The LER level exhibits a fluctuating trend over time.
To fully capture the evolution and future trends of the regional LER, this study classifies the risk evolution patterns based on different LER evolution maps. By integrating the risk levels, risk types, and past, present, and future risk dynamics, each pattern is further subdivided into specific risk prevention areas to guide targeted management strategies. This approach enhances both the precision and effectiveness of LER management, thereby improving the regional risk response. For T2023 and T2033, if the risk level remains low in both periods, the area is classified as a low-risk stable controllable area. If it remains moderate, it is designated as a medium-risk basically controllable area. A consistently high risk level designates the area as a high-risk seriously uncontrollable area. Additionally, if the risk level in T2023 is higher than that in T2033, the area is categorized as a potential escalation area. Conversely, if the risk level in T2023 is lower than that in T2033, it is classified as a potential mitigation area.
2.3.4. Optimal Parameter Geographical Detector
The geographic detector is a statistical tool used to analyze spatial stratified heterogeneity and identify its underlying driving factors [54]. However, the traditional geographic detector relies on manually defined discretization schemes for continuous variables, which may introduce subjectivity and reduce the analytical accuracy. To address this limitation, the optimal parameter geographic detector (OPGD) improves upon the traditional framework by incorporating multiple discretization strategies to automatically identify the scheme that maximizes the explanatory power (q value). This optimization enhances the objectivity and precision of the spatial analysis, leading to the more reliable identification of spatial differentiation patterns and their influencing mechanisms [55]. In this study, in the context of the construction of the HPFTZ, we selected ten demographic and economic factors from various cities and counties of HI for the year 2023: X1—gross domestic product (GDP); X2—local tax revenue; X3—year-end permanent population; X4—number of tourists; X5—newly added fixed assets; X6—total output value of agriculture, forestry, animal husbandry, and fisheries; X7—retail sales of consumer goods; X8—urban built-up area; X9—per capita grain output; X10—energy consumption per unit of GDP. We applied the optimal parameter geographic detector model using five classification methods—natural breaks, standard deviation, geometrical interval, equal interval, and quantile—to analyze the impacts of these ten independent variables on the dependent variable, the comprehensive LER factor. All types of factor interaction relationships identified by the interaction detector are presented in Table 4. Through optimal detection parameters, we aimed to reveal the spatial heterogeneity of LER and explore the driving factors behind them.
Table 4.
Types of interaction relationships.
The factor detector can assess the impact of each driving factor Xi on the dependent variable LC, measured by the q-statistic, expressed as
In the equation, h represents the stratification of variable Y or factor X, N denotes the total number of units in the study area, and Nh refers to the number of units in the h-th stratum. is the variance in Y across the entire study area, while is the variance in Y within the h-th stratum. The value of q quantifies the impact of each factor Xi on the dependent variable LC, with q ranging from 0 to 1. After a simple transformation, the q-value follows a noncentral F-distribution:
The larger the q-value, the greater the influence of the independent variable Xi on the spatial heterogeneity of the dependent variable Y. When q = 1, it indicates that Xi completely dominates the spatial differentiation of Y. Conversely, when q = 0, it implies that Xi is entirely unrelated and has no effect on the spatial heterogeneity of Y [54].
3. Results
3.1. Spatiotemporal Evolution Analysis and Simulation of Landscape Patterns Before and After HPFTZ Development
3.1.1. Spatiotemporal Evolution Characteristics of LULCC from 2015 to 2023
As shown in Table 5 and Figure 4, the primary landscape types in HI are forestland and cropland, which have a broad distribution and account for a large proportion of the land area. Across all three periods, these two land types together constituted more than 87% of the total area, aligning with the region’s economic and social development characteristics. However, with the advancement of the HPFTZ in 2018, cropland experienced a significant decline. The reduction in cropland expanded from 30.67 km2 between 2015 and 2018 to 975.61 km2 between 2018 and 2023. The average annual loss before and after the establishment of the HPFTZ was 10.22 km2 and 195.12 km2, respectively. The decline in cropland during 2018–2023 was not only greater but also substantially exceeded that of 2015–2018. Additionally, cropland served as the primary source of conversion to built-up land, with the conversion areas reaching 82.71 km2 and 274.35 km2 in the respective periods. This indicates that the development of the HPFTZ has had a substantial impact on cropland reduction. Forestland exhibited a fluctuating pattern, with a slight decrease initially, followed by a significant increase. After the establishment of the HPFTZ, forestland expanded at an average annual rate of 150.23 km2. Cropland was the main contributor to this expansion, with 372.69 km2 converted to forestland between 2015 and 2018 and 919.98 km2 between 2018 and 2023. Against the backdrop of special economic area and international free trade port development, Hainan’s urbanization was accelerated, and its socioeconomic growth intensified, resulting in the large-scale conversion of cropland and forestland into built-up land. Despite localized land use practices (e.g., cultivating forestland), the local government has implemented stringent ecological red line policies, strengthened its ecological conservation efforts, and adhered to environmental remediation mandates. Additionally, reforestation programs have been actively promoted to achieve a rational reduction in the cropland area while ensuring the scientific management and sustainable utilization of forest resources. These measures have played a crucial role in harmonizing urbanization, economic growth, and environmental protection. Built-up land underwent significant changes between 2015 and 2023. Before the establishment of the HPFTZ, built-up land expanded by 95.85 km2, representing a 7.65% increase. The conversion areas from cropland to built-up land and forestland to built-up land were 82.71 km2 and 74.49 km2, respectively. After the establishment of the HPFTZ, built-up land expanded by 409 km2, with an average annual increase of 81.80 km2, marking a 30.33% growth rate. This growth was approximately four times that of 2015–2018, with more intense conversions from cropland and forestland to built-up land. The largest conversion was from cropland to built-up land, totaling 274.35 km2, followed by forestland to built-up land, covering 201.83 km2. Against the backdrop of free trade island development, urbanization has been accelerated, economic growth has surged, and urban areas have expanded rapidly, leading to a sharp increase in the built-up land demand. As a result, portions of cropland and forestland have been encroached upon and converted into built-up land, becoming the primary source for urban expansion. This land use transformation has exhibited signs of inefficiency, particularly in Jiangdong New District, Haikou, and Sanya. Although the central ecological and environmental protection inspectorate has intensified its oversight of Hainan’s ecological environment, and the control of the ecological red line has somewhat curbed the disorderly expansion of construction land, there remain certain irrationalities in the current land use practices. Additionally, given the relatively limited terrestrial space of HI and the increasing demand for construction land, the extent of land development renders the land use situation in certain areas still worrisome. The question of how to coordinate economic development while actively promoting ecological governance and improving the environmental quality represents a major issue for the local government. Water bodies have shown a continuous increasing trend, expanding by 108.42 km2 over eight years, largely due to water resource protection policies and maintenance efforts. Grassland areas initially increased but then significantly decreased, with a total reduction of 138.53 km2. Unused land areas are relatively small and have not changed significantly. Overall, the land resource situation on HI is quite serious, necessitating strengthened ecological protection, the rational optimization of land use patterns, and the promotion of coordinated regional development.
Table 5.
Land use classification statistics of HI in 2015, 2018, and 2023.
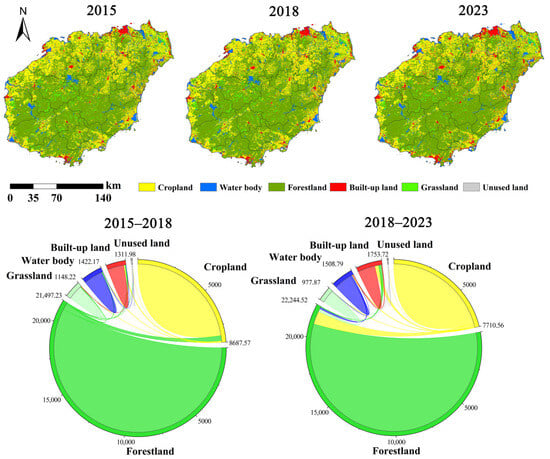
Figure 4.
Land use transition dynamics from 2015 to 2018 to 2023 (unit: km2).
3.1.2. Projection of Future Landscape Patterns Under Different Scenarios
Figure 5 and Table 6 present the simulated landscape patterns and area changes of different landscape types under various scenarios in the study area. Under the NDS, compared to 2023, cropland experienced the most significant decline, decreasing by 1498.89 km2, followed by grassland, which decreased by 235.93 km2. In contrast, forestland and water bodies expanded by 1079.70 km2 and 34.01 km2, respectively. The most pronounced expansion was observed in built-up land, which increased by 35.21%. Under the ECS, ecological space was effectively protected, and the rapid expansion of built-up land was successfully curbed, with its growth slowing to 412.94 km2. Forestland exhibited a substantial increase of 1191.33 km2, slightly surpassing the growth observed under the NDS. Overall, this scenario largely achieved the anticipated ecological conservation objectives. Cropland and grassland decreased by 1372.68 km2 and 236.85 km2, respectively, with cropland exhibiting more pronounced changes. Under this scenario, the restriction on artificial landscape expansion facilitated an increase in ecological land and its effective protection. The expansion of ecological space limited the further spread of human activity areas. Under the EPS, the increase in built-up land was the most significant, reaching 726.62 km2, with a growth rate of 41.35%, making it the highest among the three scenarios. Meanwhile, the expansion of forestland was the smallest, increasing by only 1001.89 km2. The changes in cropland and grassland were similar to those observed under the NDS, with decreases of 1500.16 km2 and 235.29 km2, respectively. These results indicate that, under conditions prioritizing economic development, the expansion intensity of built-up land was significantly higher than in the other scenarios. In summary, under the three primary scenarios—NDS, ECS, and EPS—cropland and grassland experienced a decline, while forestland and built-up land expanded. Although the magnitude of these changes varied, the overall trend remained consistent, with each landscape type exhibiting distinct transformation characteristics.

Figure 5.
Spatial distribution of land use types in HI under different scenarios.
Table 6.
Changes in land use type areas in HI under different scenarios.
From the perspective of spatial patterns, forestland remained primarily concentrated in the central mountainous region, particularly within the Tropical Rainforest National Park, with grassland also predominantly scattered throughout this area. Cropland was mainly distributed along the western coastal area and the central–northern plains. Built-up land was primarily located within the three major economic areas, i.e., the Haikou Economic Area, Sanya Economic Area, and Danzhou–Yangpu Economic Area, exhibiting a distinct spatial expansion trend. Under the NDS, restrictions on cropland occupation may have been intensified, while the encroachment of grassland serves as an indication of ecological degradation. Under the ECS, ecological protection was successfully achieved, although ecological expansion was restricted in some areas. Furthermore, the EPS placed a greater emphasis on economic development, potentially leading to the further expansion of built-up land. These findings provide valuable insights into urban development and ecological conservation efforts in the region in recent years.
3.2. Changes in Landscape Pattern Risk: Past and Future Perspectives
From 2015 to 2023, the LER in the study area was predominantly reflected by low-risk and low–medium-risk areas, accounting for 91.4%, 97.9%, and 94.6% of the total study area, respectively (Figure 6). The spatial distribution exhibited a high-risk periphery and low-risk center pattern. The low-risk areas were primarily located in the central mountainous region of the study area, occupying the core region. This area is dominated by the Tropical Rainforest National Park, with forestland as the main landscape type. Due to stringent ecological protection measures and ecological red line constraints, human disturbances were minimal, ensuring high landscape integrity and a well-structured landscape composition. The proportions of medium–high-risk areas and high-risk areas remained relatively small, gradually expanding to 0.87% and 0.94% from 2015 to 2023, both remaining below 1% of the total study area. The medium–high-risk areas and high-risk areas were primarily concentrated in coastal areas, including Danzhou, Dongfang, Wenchang, and Wanning. The HPFTZ has also accelerated their integration with other cities, fostering rapid growth in initiatives such as Danzhou–Yangpu’s integrated development, the Wenchang international aerospace industry, and Wanning’s modern agricultural industry, aquaculture, and tourism sector. The expansion of built-up land, including international tourism, ports, industrial parks, and other related developments, has placed significant pressure on the already limited terrestrial land resources. As a result, some coastal cities have resorted to land reclamation from the sea and shoreline encroachment for urban expansion. Direct examples include the land reclamation for the Sea Flower Island project in Danzhou, the unauthorized construction of the Moon Island project in Wanning, the land reclamation and development of real estate and hotels on Phoenix Island in Sanya, and the indiscriminate coastal infilling and destruction of mangroves in Chengmai County, all of which have been officially supervised by the Ministry of Ecology and Environment [56]. The medium-risk areas are primarily located in the transitional areas between high-risk and low-risk areas. These areas exhibit a fluctuating trend, with an initial sharp decline followed by subsequent growth. They are mainly distributed in relatively flat cropland areas, with an overall reduction of 1703.23 km2.
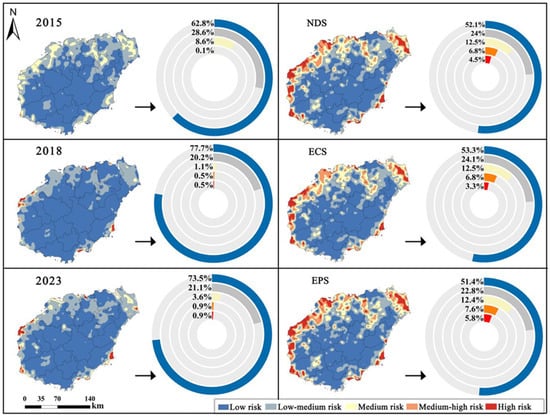
Figure 6.
Spatial distribution characteristics of LER from 2015 to 2033.
Under different scenarios, compared to 2023, the proportion of low-risk areas in the study region has significantly declined. The reduction rates are as follows: a 29.12% decrease under the NDS, a 27.48% decrease under the ECS, and a 30.07% decrease under the EPS. The proportions of all other risk areas exhibited an increasing trend. Specifically, the low–medium-risk area expanded by 13.74%, 14.22%, and 8.06% under the NDS, ECS, and EPS, respectively. The medium-risk area increased by 247.22%, 247.22%, and 244.44%, respectively, while the medium–high-risk area grew by 655.56%, 655.56%, and 744.44%, respectively. The high-risk area experienced the most substantial expansion, rising by 266.67%, 400.00%, and 544.44% across the three scenarios. In all scenarios, the expansion of high-risk areas was primarily concentrated in coastal cities, particularly in the western coastal areas, with the Haikou economic circle and the Danzhou–Yangpu economic circle being the most affected. This trend was mainly driven by the rapid expansion of built-up land, which altered the region’s original landscape structure, leading to a decline in ecological landscape stability, weakened ecological functions, and increased landscape fragmentation. The development of coastal economic areas has further exacerbated the risk of increased medium–high- and high-risk ecological areas. High-risk areas should be strictly regulated to control resource exploitation within their boundaries, and ecological restoration should be undertaken using both natural and artificial methods to mitigate existing environmental damage. These findings underscore the critical importance of balancing ecological conservation and urbanization during regional development.
3.3. LER Management and Zoning
Based on the current risk status and future trends, specific risk management areas were delineated, resulting in a total of 11 risk prevention areas (Figure 7 and Table 7). The LER maintenance area (A) accounts for the largest proportion of the study area, covering 65.25% of the total land. Among these, area A-1 is the largest, occupying 99.87% of the entire LER maintenance area (A), making it the dominant area. Located in the central mountainous region of HI, this area is one of the earliest designated key regulated areas for strict ecological function protection. It is characterized by extensive, contiguous, and highly stable tropical rainforests, serving as a critical area for biodiversity conservation, river source protection, and important water conservation functions. The A-2 and A-3 areas are scattered across transitional areas between urban and rural settlements in the southern region, primarily located at the expansion edges of built-up land. Under the dual influences of human activities and urbanization, these areas contain numerous small landscape patches, leading to increased landscape fragmentation, reduced stability, and heightened landscape vulnerability, resulting in relatively high LER.
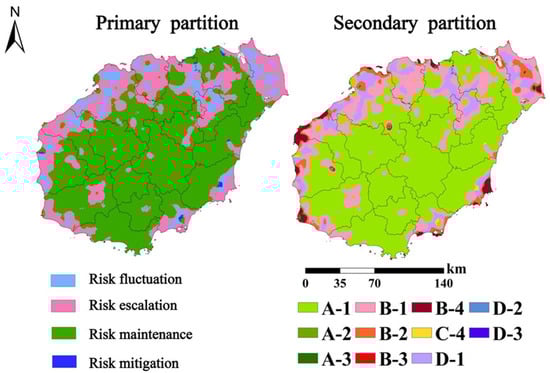
Figure 7.
Spatial distribution of LER zoning from a spatiotemporal perspective.
Table 7.
Spatial–temporal dynamics of LER zoning area.
The LER escalation area (B) accounts for 26.97% of the total area, primarily distributed across the densely populated and agriculturally favorable coastal and plain regions of HI, with built-up land and cropland being the dominant land use types. Among them, area B-1 is the largest, covering 7407.19 km2, while area B-3 is the smallest, comprising only 0.54% of the total area of the escalation area (B). Against the backdrop of HPFTZ development, Hainan Province has taken advantage of its favorable multi-port conditions to introduce three major development plans: the construction of maritime ports, aviation hubs, and cross-border e-commerce logistics and express mail supervision centers. These initiatives have facilitated the decentralization of the development space, leading to the dispersed expansion of coastal cities and rural settlements, as well as an increasingly interwoven mix of production and living spaces. Consequently, the overall ecological risk in these areas has been rising. Notably, area B-4 covers 591.51 km2 and is mainly distributed along the coastal regions of the Chengmai Laocheng economic development area, Wenchang, Wanning, Lingshui, Ledong, Changjiang, and Dongfang. These areas, capitalizing on their port advantages, are strategically focused on the development of heavy industry, modern technology, tropical tourism, and coastal transportation. However, the construction of these ports often involves large-scale land development, water utilization, and infrastructure expansion, leading to the degradation of coastal wetlands, tidal flats, and forests, which in turn disrupts marine ecosystems. This disruption poses risks such as regional species extinction and damage to ecosystem structure and functions. Intense human disturbances have accelerated the transformation of previously low- and medium-risk areas into high-risk areas after the establishment of the HPFTZ, with the likelihood of sustained high-risk conditions for an extended period. This phenomenon is particularly pronounced in coastal areas characterized by a high population density, frequent human activities, abundant natural resources, rapid urbanization, and favorable living conditions.
The LER fluctuation area (C) occupies the smallest proportion of land, accounting for only 0.20%. It is sporadically distributed across Wenchang, the southern part of Haikou, and various coastal counties in the western region, mainly located at the periphery of the LER escalation area (B). This area primarily consists of urban–rural transition areas and agroforestry ecotones. As urbanization progresses, the urban–rural transition areas—among the most dynamic regions in this process—are highly susceptible to external urbanization disturbances, such as the expansion of built-up land and industrial development, which alter the regional landscape structure. As rural landscapes gradually transform into urban landscapes, the shift from low-density to high-intensity land development leads to changes and fluctuations in the LER levels. The agroforestry ecotones are particularly affected by ecological conservation measures such as reforestation and wetland restoration, and adjustments in agricultural policies may further influence LER changes in this region.
The LER mitigation area (D) accounts for 7.57% of the total area, exhibiting a dispersed spatial distribution pattern. Among these, area D-1 is the largest, covering 2588.19 km2, and is primarily embedded within area B-1. This further indicates that, under the current development trajectory, both the overall and localized LER remain difficult to mitigate and are continuously rising. Intensive human activities hinder the transition of medium- and high-risk areas into low-risk areas.
3.4. Macro-Scale Driving Factors
The factor detection results are shown in Figure 8, which shows that all factors passed the significance test (p < 0.01). This indicates that the spatial differentiation of the LER in HI is primarily influenced by multiple factors, including the GDP (X1), year-end resident population (X3), local tax revenue (X2), energy consumption per unit of GDP (X10), urban built-up area (X8), and the output value of farming, forestry, animal husbandry, and fisheries (X6). Among these, X1 exhibited the strongest explanatory power for the spatial differentiation of LER, with a q-value of 0.1245, suggesting that the GDP is the primary controlling factor in the dynamic changes in the regional LER. Additionally, other key explanatory variables, such as X3, X2, X10, X8, and X6, all had q-values exceeding 0.1, further confirming their significance in influencing the spatial differentiation. In contrast, the explanatory power of X9 and X10 for LER was relatively weak, suggesting that fluctuations in tourism and energy consumption had a limited impact on the LER during HPFTZ development. Similarly, the explanatory power of X5 was also low, indicating that investment activities alone were insufficient to significantly affect the LER in HI. Meanwhile, the GDP, year-end resident population, and local tax revenue exhibited the strongest correlations with the spatial distribution of LER, whereas newly added fixed assets, the number of tourists, and retail sales of consumer goods showed weak associations. This indicates that economic factors, such as local economic growth and fiscal revenues, contributed more significantly to variations in the ecological risk in HI than investment, tourism, and consumption activities. Considering the development of the HPFTZ, the LER in HI has increased substantially, particularly in coastal cities and economic development areas. The key economic drivers behind these risk changes include the GDP, year-end resident population, and local tax revenue. These economic and demographic factors play a crucial role in shaping the spatial heterogeneity of the risk distribution.
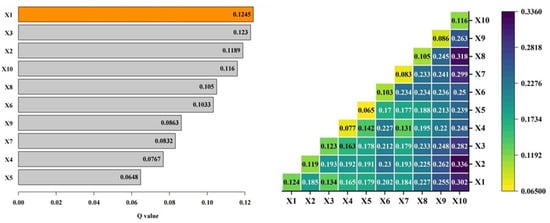
Figure 8.
Detection results regarding driving factors. Note: X1—GDP; X2—local tax revenue; X3—year-end resident population; X4—number of tourists; X5—newly added fixed assets; X6—output value of farming, forestry, animal husbandry, and fisheries; X7—retail sales of consumer goods; X8—city built-up area; X9—per capita food production; X10—energy consumption per unit of GDP.
As shown in Figure 8, the results of the interaction detector indicate that the interactions among selected factors significantly enhance the explanatory power compared to individual factors. The interaction types predominantly follow the patterns of two-factor enhancement and nonlinear enhancement. Among these, the interaction of X10 with other factors exhibits the strongest explanatory power, with the interaction between X10 and X2 exerting the greatest influence, reaching 33.6%. Additionally, the interactions of X10∩X8, X10∩X1, and X10∩X7 also demonstrate high explanatory power, at 31.8%, 30.2%, and 29.9%, respectively. These findings indicate that the energy consumption per unit of GDP is a critical factor influencing the dynamic changes in the LER within the study area. Furthermore, the conflicting relationship between energy consumption for local economic development and local fiscal revenue is a key driver of LER. After interacting with other factors, the explanatory power of X9 significantly increased, reaching 21.3% to 26.2%. The interaction effect of X4∩X7 was the weakest, indicating that, under the development framework of the HPFTZ, the increase in tourist numbers and the retail sales of duty-free goods have a relatively minor impact on LER and are unlikely to cause severe ecological issues. This also suggests that the spatial heterogeneity of the LER in the study area is not driven by a single factor but is primarily the result of interactions among multiple factors (at least two or more).
4. Discussion
4.1. Driving Mechanisms and Regulation Strategies of LER Under HPFTZ Development
This study aimed to explore the profound impact of the HPFTZ policy on LER changes in HI before and after its establishment. The causes and driving factors of LER changes were analyzed from multiple perspectives, including economic development and the acceleration of urbanization. Specifically, under the influence of socioeconomic factors such as the GDP, population density, and urban construction area, the establishment of the HPFTZ has driven infrastructure development, the expansion of urban land, and the growth of urban settlements. The accelerated urbanization process has led to changes in the region’s native landscape structure and the degradation of ecological functions, posing significant challenges to resource and environmental sustainability and exerting immense pressure on ecological conservation. Consequently, it has intensified the regional LER, particularly in economically active coastal areas, where high-intensity human activities (such as port expansion, tourism development, factory construction, and economic trade area delineation) have exacerbated landscape fragmentation, making these regions the primary high-risk areas in HI, rather than the inland agricultural areas. This finding is consistent with the conclusions of Zhang et al., highlighting the close relationship between tropical island ecological risks and regional development strategies [30]. Moreover, the findings of this study align with previous research on land conversion and increasing ecological risks associated with urbanization, demonstrating that urban development is not entirely detrimental to ecological conditions [57]. Additionally, the GDP, population density, and local tax revenue were identified as key factors influencing ecological risks in the study area, consistent with the findings of Yang et al. [22], although some results differ slightly from those of Xu et al. [58]. Promoting green industries and optimizing the population distribution can effectively mitigate these ecological risks. While implementing the ecological red line protection policy within the HPFTZ, the HI government has also intensified its efforts in ecological restoration projects such as reforestation programs, effectively alleviating the ecological risks in certain areas. However, despite the pressures exerted on regional ecological conservation by economic activities and human disturbances, strengthening the enforcement of ecological protection policies and enhancing government regulatory oversight can help to mitigate LER in some areas. A direct example of this is the proactive response of various levels of government in addressing the environmental rectification requirements set forth by China’s Ministry of Ecology and Environment.
Regarding the different scenarios, the ECS demonstrated a relatively high level of effectiveness by reducing the extent of high-risk areas, thereby effectively protecting fragile ecosystems. This is crucial in maintaining the balance of surrounding ecosystems. Therefore, it is recommended that, during the construction of the HPFTZ, the ecological protection policies should be further strengthened, and land use spatial planning should be optimized through policy guidance to ensure landscape connectivity [59]. Based on the findings of this study, the following ecological risk regulation strategies are proposed.
- (1)
- High-risk areas: High-risk seriously uncontrollable areas and LER escalation areas require particular attention. Coastal regions, such as the high-risk seriously uncontrollable area (A-3) and the LER escalation area (B), should be subject to stricter ecological red line controls to limit the unregulated expansion of built-up land. Destructive activities such as land reclamation should be strictly prohibited, and rigorous environmental protection and ecological restoration measures should be implemented. Additionally, strengthening the risk early warning system is essential to promptly detect and address ecological risk events.
- (2)
- Medium-risk areas: Medium-risk areas, including urban–rural transition areas and agroforestry transition areas within HI (e.g., the medium-risk basically controllable area (A-2)), should be subject to the stricter regulation of village and township construction land to prevent its uncontrolled expansion into cropland and forestland. However, it is important to note that cropland, as a fundamental landscape for tropical agricultural security, continued to decline during the study period and across all simulated scenarios without effective mitigation. According to the Hainan Provincial Territorial Spatial Plan, the total amount of cropland should not fall below 4811.67 km2, of which at least 4253.33 km2 must be designated as permanent basic farmland. Additionally, the urban development boundary expansion should be controlled within 1.3 times the 2020 urban construction land scale. Considering the requirements of tropical agricultural security and land use planning, along with ecological protection, land use management, and ecological restoration, this study recommends adopting the “zoning control” strategy proposed by Luo [60]. In medium-risk areas, promoting eco-agriculture and forestry policies, along with implementing ecological restoration projects, can enhance the ecological functions of cropland and forestland. This approach aims to mitigate the impact of cropland fragmentation on ecosystems by converting certain sensitive areas into ecological buffer areas, ultimately enhancing the ecosystem’s stability.
- (3)
- Low-risk areas: In low-risk areas, including the central mountainous region dominated by the Tropical Rainforest National Park and its adjacent areas (e.g., the low-risk stable controllable area (A-1)), ecological protection should be prioritized while also considering regional economic development. An “eco-tourism–community co-management” model should be explored to achieve this balance. Furthermore, promoting low-impact eco-tourism is a crucial approach to fostering economic growth, as it ensures the sustainability of local economic development while providing strong support for the long-term conservation of natural landscapes. Additionally, biodiversity monitoring and habitat planning interventions should be implemented to safeguard regional biodiversity, including sustainable habitat conservation and corridor construction for flagship species such as the Hainan gibbon (Nomascus hainanus).
4.2. Contributions, Limitations, and Prospects
One primary contribution of this study is the integration of a GIS–PLUS–LER framework to examine dynamic changes in LER before and after HPFTZ establishment, while also simulating the spatiotemporal distribution of the LER under different future scenarios. From a temporal perspective, this approach allows the exploration of the historical evolution, current state, and future trends of the regional LER. It not only elucidates the mechanisms driving LER under the HPFTZ’s development in Hainan, but also provides insights for the assessment of LER in other policy-driven tropical island regions, thus addressing a notable research gap. Another key contribution is the integration of the LER–PLUS–Geoinformatic Tupu model to construct a “historical–present–future” framework for the investigation of the spatiotemporal evolution of regional risks associated with HPFTZ development. This dynamic perspective facilitates the delineation of LER zoning and regional ecological regulation strategies, offering scientific support for policymakers seeking to balance economic development with ecological protection. Moreover, this research provides guidance for regional ecological risk management, land use optimization, and environmental conservation in the construction of the HPFTZ, ultimately contributing to the optimization of regional ecological security patterns.
Although this study evaluated LER using a 2 km × 2 km grid unit, which performs well in macro-scale analysis, it may have underestimated certain micro-scale ecological processes, such as changes in small-scale ecological patches and localized environmental impacts. Therefore, future research should employ higher-resolution data, particularly remote sensing imagery with a finer spatial resolution, to enhance the assessment accuracy and better capture subtle regional ecological changes. Additionally, after further exploring the long-term impacts of extreme climate events on the regional LER, it was found that historical records indicate that Super Typhoon Rammasun (ID 1409) and Super Typhoon Yagi (ID 2411) caused significant damage to HI’s wetlands, forest vegetation, and coastal ecosystems. These disturbances have further exacerbated regional ecological security concerns and compromised the stability of ecosystem functions across the island. Future research could consider integrating extreme weather models into LER assessments to further refine the prediction and management of ecological risks on HI. Finally, this study conducted an LER assessment at the island-wide scale, providing crucial macro-level guidance for the construction of the HPFTZ. However, due to the significant differences in ecosystems across various regions of the island (such as between the eastern coastal areas and the central–western mountainous regions), notable variations also exist in the regional ecological characteristics, land use patterns, and economic development levels. Future research could incorporate insights from a broader range of relevant studies and integrate multi-scale assessment methods to refine the evaluation based on regional disparities. This approach aims to provide both theoretical support and practical guidance for the systematic management of the regional LER on the island.
Furthermore, this study did not explicitly address the potential positive impacts of socioeconomic factors on the ecological conditions, as highlighted in recent research indicating that urbanization may indirectly improve coastal vegetation growth by modifying local microclimates [61]. These effects were overlooked due to methodological constraints, which limited the analysis to ecological pressures. Future research could adopt more flexible frameworks to assess both positive and negative anthropogenic influences.
5. Conclusions
This study employs the LERI model, in conjunction with the PLUS model and the optimal parameter-based geographical detector, to examine the spatiotemporal dynamics, evolutionary characteristics, future trends, and driving mechanisms of the regional landscape risk in HI before and after the establishment of the HPFTZ. From a dynamic perspective, it analyzes regional ecological risk zoning and regulatory strategies under the “historical–present–future” framework. The results indicate that, between 2015 and 2023, built-up land and forestland in HI increased by 40.31% (504.85 km2) and 31.91% (688.12 km2), respectively, with cropland being the primary source of this conversion. In the ecological risk management zoning of the study area, high-risk uncontrollable areas have been gradually increasing. Under the ECS scenario, the reduction in cropland and the increase in forestland have, to some extent, curbed the rise in high-level LER, achieving improved ecological conservation outcomes. Low-risk and low–medium-risk areas account for nearly 80% (53.32% and 24.09%, respectively), while medium-high risk and high-risk areas constitute 6.76% and 3.33% of the study area, respectively. However, the regional LER is expected to continue rising. Additionally, coastal economic development areas, such as the Haikou economic circle and the Danzhou–Yangpu economic circle, are considered high-risk regions, with their risk levels continuously increasing. Certain regions within these areas have already transitioned into high-risk uncontrollable areas (B-4). Under the complex and dynamic environment influenced by alternating human activities and ecological protection policies, the LER in urban–rural transition areas exhibits significant fluctuations. Future research should further explore the dynamic equilibrium among the ecosystems in these areas and its implications for regional development. Overall, the HPFTZ policy has significantly accelerated urbanization and boosted regional economic growth in HI, while concurrently intensifying the LER in coastal cities and economic development areas.
In the process of constructing the HPFTZ, striking a balance between economic development and ecological protection remains a complex yet critical challenge. However, based on the findings of the ECS scenario, the study of LER and its potential driving factors under the HPFTZ development context in HI provides valuable practical insights. Firstly, future policies should emphasize balancing economic growth with ecological conservation, particularly by strengthening ecological protection and land use control in ecologically sensitive areas. In these regions, stricter land development regulations should be implemented, alongside enhanced ecological restoration efforts. By effectively limiting the uncontrolled expansion of built-up land, it is possible to ensure both regional economic growth and environmental sustainability. Secondly, policymakers are advised to integrate ecological protection goals with economic growth strategies while considering the zoning characteristics. For LER escalation and LER fluctuation areas, a dual-track strategy of ecological red line regulation and ecological restoration should be implemented to restrict high-intensity development and restore landscape connectivity. In LER maintenance areas, existing conservation policies should be upheld while exploring eco-tourism and community co-management models to reconcile the conflict between conservation and development. Finally, further research should be conducted on the interactions between different policies to enhance the scientific precision and refinement of regional ecological governance. Considering the realities of HI and other tropical islands, this study provides both theoretical support and practical guidance for the promotion of regional sustainable development.
Author Contributions
Conceptualization, Y.M. and M.M.; methodology, Y.M. and M.M.; software, Y.M., M.M., S.M. and Z.X.; validation, Y.C. and Y.W.; formal analysis, Y.M. and S.M.; investigation, Z.X., Y.C., J.X. and Y.W.; resources, W.G., M.M. and L.W.; data curation, W.G., L.W. and T.L.; writing—original draft preparation, Y.M. and M.M.; writing—review and editing, W.G., L.W. and M.M.; visualization, J.X., Y.M., W.G. and M.M.; supervision, W.G. and M.M.; project administration, W.G.; funding acquisition, W.G. All authors have read and agreed to the published version of the manuscript.
Funding
This research was funded by the National Natural Science Foundation of China (No. 32360386), the Hainan Provincial Natural Science Foundation of China (No. 322MS023) and the Intelligent Forestry Key Laboratory of Haikou City (No. 2020–057).
Data Availability Statement
The original contributions presented in this study are included in the article. Further inquiries can be directed to the corresponding authors.
Conflicts of Interest
The authors declare no conflicts of interest.
References
- Guo, A.; Yue, W.; Yang, J.; Li, M.; Xie, P.; He, T.; Zhang, M.; Yu, H. Quantifying the impact of urban ventilation corridors on thermal environment in Chinese megacities. Ecol. Indic. 2023, 156, 111072. [Google Scholar] [CrossRef]
- Ma, Y.; Zhang, S.; Yang, K.; Li, M. Influence of spatiotemporal pattern changes of impervious surface of urban megaregion on thermal environment: A case study of the Guangdong–Hong Kong–Macao Greater Bay Area of China. Ecol. Indic. 2020, 121, 107106. [Google Scholar] [CrossRef]
- Xie, B.; Jones, P.; Dwivedi, R.; Bao, L.; Liang, R. Evaluation, comparison, and unique features of ecological security in southwest China: A case study of Yunnan Province. Ecol. Indic. 2023, 153, 110453. [Google Scholar] [CrossRef]
- Ma, L.; Bo, J.; Li, X.; Fang, F.; Cheng, W. Identifying key landscape pattern indices influencing the ecological security of inland river basin: The middle and lower reaches of Shule River Basin as an example. Sci. Total Environ. 2019, 674, 424–438. [Google Scholar] [CrossRef]
- Peng, J.; Dang, W.; Liu, Y.; Zong, M.; Hu, X. Review on landscape ecological risk assessment. Acta Geogr. Sin. 2015, 70, 664–677. [Google Scholar] [CrossRef]
- Yang, F.; Jin, X.; Liu, J.; Zhang, X.; Song, J.; Li, Q.; Zhou, Y. Assessing landscape ecological risk in rapidly urbanized areas from the perspective of spatiotemporal dynamics. Trans. Chin. Soc. Agric. Eng. 2023, 39, 253–261. [Google Scholar] [CrossRef]
- Wang, X.; Zhu, T.; Jiang, C. Landscape ecological risk based on optimal scale and its tradeoff/synergy with human activities: A case study of the Nanjing metropolitan area, China. Ecol. Indic. 2025, 170, 113040. [Google Scholar] [CrossRef]
- Wei, Y.; Zhou, P.; Zhang, L.; Zhang, Y. Spatio-temporal evolution analysis of land use change and landscape ecological risks in rapidly urbanizing areas based on Multi-Situation simulation—A case study of Chengdu Plain. Ecol. Indic. 2024, 166, 112245. [Google Scholar] [CrossRef]
- Wu, Y.; Qin, F.; Li, L.; Dong, X. Exploring landscape ecological risk with human activity intensity and correlation in the Kuye River Basin. Front. Ecol. Evol. 2024, 12, 1409515. [Google Scholar] [CrossRef]
- Du, L.; Dong, C.; Kang, X.; Qian, X.; Gu, L. Spatiotemporal evolution of land cover changes and landscape ecological risk assessment in the Yellow River Basin, 2015–2020. J. Environ. Manag. 2023, 332, 117149. [Google Scholar] [CrossRef]
- Wang, B.; Yu, F.; Teng, Y.; Cao, G.; Zhao, D.; Zhao, M. A SEEC Model Based on the DPSIR Framework Approach for Watershed Ecological Security Risk Assessment: A Case Study in Northwest China. Water 2022, 14, 106. [Google Scholar] [CrossRef]
- Dong, Y.; Wang, Y.; Zeng, W. Analyzing “Source-Sink” Pattern of NPS Pollution Risks in Upper Reaches of Erhai Lake Basin by Minimum Cumulative Resistance Model. Bull. Soil Water Conserv. 2022, 42, 166–175. [Google Scholar] [CrossRef]
- Xu, X.; Lin, H.; Fu, Z. Probe into the method of regional ecological risk assessment—A case study of wetland in the Yellow River Delta in China. J. Environ. Manag. 2003, 70, 253–262. [Google Scholar] [CrossRef]
- Hayes, E.H.; Landis, W.G. Regional Ecological Risk Assessment of a Near Shore Marine Environment: Cherry Point, WA. Hum. Ecol. Risk Assess. 2010, 10, 299–325. [Google Scholar] [CrossRef]
- Chen, J.; Li, T. Landscape Ecological Risk Analysis for Jingzhou City Based on PSR Model and Projection Pursuit Method. Acta Sci. Nat. Univ. Pekin. 2017, 53, 731–740. [Google Scholar] [CrossRef]
- Lautenbach, S.; Kugel, C.; Lausch, A.; Seppelt, R. Analysis of historic changes in regional ecosystem service provisioning using land use data. Ecol. Indic. 2010, 11, 676–687. [Google Scholar] [CrossRef]
- Rossi, P.; Pecci, A.; Amadio, V.; Rossi, O.; Soliani, L. Coupling indicators of ecological value and ecological sensitivity with indicators of demographic pressure in the demarcation of new areas to be protected: The case of the Oltrepò Pavese and the Ligurian-Emilian Apennine area (Italy). Landsc. Urban Plan. 2007, 85, 12–26. [Google Scholar] [CrossRef]
- Zhang, S.; Jiang, H.; Yu, H.; Feng, X.; Fan, M. Construction of landscape ecological network based on MCR risk assessment Model: A case study of Liaoning Province, China. Ecol. Indic. 2024, 166, 112549. [Google Scholar] [CrossRef]
- Deng, R.; Ding, X.; Wang, J. Landscape Ecological Risk Assessment and Spatial Pattern Evolution Analysis of the Central Yunnan Urban Agglomeration from 1995 to 2020 Based on Land Use/Cover Change. Sustainability 2023, 15, 16641. [Google Scholar] [CrossRef]
- Wang, H.; Liu, X.; Zhao, C.; Chang, Y.; Liu, Y.; Zang, F. Spatial-temporal pattern analysis of landscape ecological risk assessment based on land use/land cover change in Baishuijiang National nature reserve in Gansu Province, China. Ecol. Indic. 2021, 124, 107454. [Google Scholar] [CrossRef]
- Liang, L.; Sun, Y.; Guan, Q.; Pan, N.; Du, Q.; Mi, J.; Shan, Y. Projection of landscape ecological risk and exploration of terrain effects in the Qilian Mountains, China. Land Degrad. Dev. 2023, 34, 4575–4593. [Google Scholar] [CrossRef]
- Yang, N.; Zhang, T.; Li, J.; Feng, P.; Yang, N. Landscape ecological risk assessment and driving factors analysis based on optimal spatial scales in Luan River Basin, China. Ecol. Indic. 2024, 169, 112821. [Google Scholar] [CrossRef]
- Yu, M.; Liu, Y.; Zhang, Y. Multi-scenario Prediction of Future Land Use Change and Landscape Ecological Risk on the Qingzang Plateau. Resour. Environ. Yangtze Basin 2024, 33, 2204–2218. Available online: https://yangtzebasin.whlib.ac.cn/CN/10.11870/cjlyzyyhj202410011 (accessed on 3 March 2025).
- Hou, P.; Zhai, J.; Cao, W.; Yang, M.; Cai, M.; Li, J. Evaluation on ecosystem changes and protection of the national key ecological function zones in mountainous areas of central Hainan Island. Acta Ecol. Sin. 2018, 73, 429–441. [Google Scholar] [CrossRef]
- Zhang, L.; Liao, J.; Yuan, X.; Mu, X.; Song, Q.; Bi, J. Remote Sensing Analysis of Coastline Changes in Hainan Island during 1987–2017. Trop. Geogr. 2020, 40, 659–674. [Google Scholar] [CrossRef]
- Lei, J.; Chen, Z.; Chen, X.; Li, Y.; Wu, T. Spatio-temporal changes of land use and ecosystem services value in Hainan Island from 1980 to 2018. Acta Ecol. Sin. 2020, 40, 4760–4773. [Google Scholar] [CrossRef]
- Wu, W.; Huang, Z.; Sun, Z.; Zhang, J.; Wang, S.; Fang, M.; Yang, H.; Lu, H.; Guo, G.; Liu, W. Simulation and attribution analysis of terrestrial ecosystem carbon storage of Hainan Island from 2015 to 2050. Sci. Total Environ. 2024, 917, 170348. [Google Scholar] [CrossRef] [PubMed]
- Hu, J.; Mao, M.; Gong, W.; Liu, T.; Qiu, X.; Wu, G.; Xie, Y. Ecological Risk Assessment and Simulation of Haikou City Based on PSR-OWA Model. Res. Soil Water Conserv. 2024, 31, 301–314. [Google Scholar] [CrossRef]
- Chen, X.; Xie, G.; Zhang, J. Landscape ecological risk assessment of land use changes in the coastal area of Haikou City in the past 30 years. Acta Ecol. Sin. 2021, 41, 975–986. [Google Scholar] [CrossRef]
- Zhang, L.; Lei, J.; Cheng, Z.; Chen, Y.; Zhou, P. Spatiotemporal evolution characteristics and influencing factors of landscape ecological risks in the three major basins of Hainan Island, China. Acta Ecol. Sin. 2025, 45, 1646–1658. [Google Scholar] [CrossRef]
- Han, N.; Yu, M.; Jia, P. Multi-Scenario Landscape Ecological Risk Simulation for Sustainable Development Goals: A Case Study on the Central Mountainous Area of Hainan Island. Int. J. Environ. Res. Public Health 2022, 19, 4030. [Google Scholar] [CrossRef] [PubMed]
- Xiong, C.; Liang, Y.; Hu, Y.; Ni, X.; Luan, Q. Net Effect and Mechanism Analysis of Hainan International Tourism Island Construction on Urban Construction Land Expansion. China Land Sci. 2022, 36, 59–68. [Google Scholar] [CrossRef]
- Lei, J.; Chen, Y.; Li, L.; Chen, Z.; Chen, X.; Wu, T.; Li, Y. Spatiotemporal change of habitat quality in Hainan Island of China based on changes in land use. Ecol. Indic. 2022, 145, 109707. [Google Scholar] [CrossRef]
- Wu, T.; Chen, Y.; Chen, Z.; Lei, J.; Chen, X.; Li, Y. Analysis on the Spatial Distribution Characteristics of Representative Populations in Tropical Rainforest of Hainan. For. Grassl. Resour. Res. 2023, 5, 133–141. [Google Scholar] [CrossRef]
- Li, S.; Tong, Y.; He, B. Prediction of Tourism Carbon Peak and Carbon Neutrality Based on Multiple Scenarios: A Case Study of Hainan Province. Econ. Geogr. 2023, 43, 230–240. [Google Scholar] [CrossRef]
- Wang, K.; Yan, M.; Zhang, L.; Wang, P.; Chen, W. Evaluation of Land Use Suitability in the Coastal Zone of Hainan Island based on LandUSEM. Remote Sens. Technol. Appl. 2022, 37, 1140–1148. Available online: http://www.rsta.ac.cn/EN/abstract/abstract3571.shtml (accessed on 3 March 2025).
- Tian, P.; Zhao, G.; Mu, X.; Wen, Z.; Wang, F. A modified RUSLE model to estimate sediment yield in the Huangfuchuan watershed. Resour. Sci. 2015, 37, 832–840. Available online: https://www.resci.cn/CN/Y2015/V37/I4/832 (accessed on 3 March 2025).
- Xiao, Q.; Hu, D.; Xiao, Y. Assessing changes in soil conservation ecosystem services and causal factors in the Three Gorges Reservoir region of China. J. Clean. Prod. 2016, 163, S172–S180. [Google Scholar] [CrossRef]
- Du, J.; Wang, Y.; Pan, Y.; Wang, J. Ecological risk assessment and ecological security pattern construction of county-level landscape in plateau valley: A case study in Yongping County, Dali Prefecture, Yunnan Province. Chin. J. Ecol. 2024, 43, 1509–1520. [Google Scholar] [CrossRef]
- Liu, X.; Li, X.; Jiang, D. Landscape pattern identification and ecological risk assessment using land-use change in the Yellow River Basin. Trans. Chin. Soc. Agric. Eng. 2021, 37, 265–274. [Google Scholar] [CrossRef]
- Peng, J.; Zong, M.; Hu, Y.; Liu, Y.; Wu, J. Assessing Landscape Ecological Risk in a Mining City: A Case Study in Liaoyuan City, China. Sustainability 2015, 7, 8312–8334. [Google Scholar] [CrossRef]
- Tian, J.; Shao, S.; Huang, Y.; Yu, M. Towards a Core Set of Landscape Metrics for Land Use: A Case Study from Guangzhou, China. Geomat. Inf. Sci. Wuhan Univ. 2019, 44, 443–450. [Google Scholar] [CrossRef]
- Munyati, C.; Sinthumule, N.I. Comparative suitability of ordinary kriging and Inverse Distance Weighted interpolation for indicating intactness gradients on threatened savannah woodland and forest stands. Environ. Sustain. Indic. 2021, 12, 100151. [Google Scholar] [CrossRef]
- Liang, X.; Guan, Q.; Clarke, K.C.; Liu, S.; Wang, B.; Yao, Y. Understanding the drivers of sustainable land expansion using a patch-generating land use simulation (PLUS) model: A case study in Wuhan, China. Comput. Environ. Urban Syst. 2021, 85, 101569. [Google Scholar] [CrossRef]
- Fan, H.; Si, Q.; Dong, W.; Lu, G.; Liu, X. Land Use Change and Landscape Ecological Risk Prediction in Urumqi under the Shared Socio-Economic Pathways and the Representative Concentration Pathways (SSP-RCP) Scenarios. Sustainability 2023, 15, 14214. [Google Scholar] [CrossRef]
- Wang, Z.; Guo, M.; Zhang, D.; Chen, R.; Xi, C.; Yang, H. Coupling the Calibrated GlobalLand30 Data and Modified PLUS Model for Multi-Scenario Land Use Simulation and Landscape Ecological Risk Assessment. Remote Sens. 2023, 15, 5186. [Google Scholar] [CrossRef]
- Xie, J.; Zhao, J.; Zhang, S.; Sun, Z. Optimal Scale and Scenario Simulation Analysis of Landscape Ecological Risk Assessment in the Shiyang River Basin. Sustainability 2023, 15, 15883. [Google Scholar] [CrossRef]
- Luan, C.; Liu, R.; Zhang, Q.; Sun, J.; Liu, J. Multi-objective land use optimization based on integrated NSGA–II–PLUS model: Comprehensive consideration of economic development and ecosystem services value enhancement. J. Clean. Prod. 2024, 434, 140306. [Google Scholar] [CrossRef]
- Nie, W.; Xu, B.; Yang, F.; Shi, Y.; Liu, B.; Wu, R.; Lin, W.; Pei, H.; Bao, Z. Simulating future land use by coupling ecological security patterns and multiple scenarios. Sci. Total Environ. 2023, 859, 160262. [Google Scholar] [CrossRef]
- Jiao, Z.; Jiang, Y.; He, T.; Lu, Y.; Xu, X. Land use change simulation: Progress, challenges, and prospects. Acta Ecol. Sin. 2022, 42, 5165–5176. [Google Scholar] [CrossRef]
- He, Q.; Zhang, Z.; Zhang, Y.; Sun, T.; Wang, W.; Zhang, Z. Spatiotemporal Evolution and Driving Mechanisms of Ecological Risk in the Yuncheng Salt Lake Wetland, China. Water 2025, 17, 524. [Google Scholar] [CrossRef]
- Meng, R.; Meng, Z.; Li, H.; Cai, J.; Qin, L. Changes in landscape ecological risk in the Beijing-Tianjin Sandstorm source control project area from a spatiotemporal perspective. Ecol. Indic. 2024, 167, 112569. [Google Scholar] [CrossRef]
- Slamet, A.H.H.; Dhandy, R.; Brillyantina, S.; Wulandari, S.A.; Mutmainah, D.N.; Ubaidillah, W. Mapping the Suitability of Milkfish Ponds in Sidoarjo District Using Geographic Information Systems (GIS). IOP Conf. Ser. Earth Environ. Sci. 2024, 1338, 012001. [Google Scholar] [CrossRef]
- Wang, J.; Xu, C. Geodetector: Principle and prospective. Acta Ecol. Sin. 2017, 72, 116–134. [Google Scholar] [CrossRef]
- Yongze, S.; Jinfeng, W.; Yong, G.; Chengdong, X. An optimal parameters-based geographical detector model enhances geographic characteristics of explanatory variables for spatial heterogeneity analysis: Cases with different types of spatial data. GISci. Remote Sens. 2020, 57, 593–610. [Google Scholar] [CrossRef]
- Duan, X.; Gong, W.; Sun, Y.; Liu, T.; Qiu, X.; Zhang, Y. Land Use Change and Its Impact on Temporal and Spatial Evolution of Carbon Storage in Coastal Zone of Hainan Island. Bull. Soil Water Conserv. 2022, 42, 301–311. [Google Scholar] [CrossRef]
- Zhang, Y.; Yang, Z.; Yang, R.; Liu, F.; He, Y.; Cao, L.; Yang, J.; Zhang, J. Ecological risk assessment and response prediction caused by LUCC in the central Yunnan Province. Sci. Rep. 2025, 15, 2416. [Google Scholar] [CrossRef]
- Xu, B.; Peng, Y.; Li, L.; Fu, S.; Feng, Y.; Yu, J. Study on habitat quality and ecological risk in Manas River Basin based on landscape pattern. Res. Soil Water Conserv. 2025, 32, 328–335. [Google Scholar] [CrossRef]
- Mu, H.; Guo, S.; Zhang, X.; Yuan, B.; Xia, Z.; Tang, P.; Zhang, W.; Zhang, P.; Li, X.; Du, P. Moving in the landscape: Omnidirectional connectivity dynamics in China from 1985 to 2020. Environ. Impact Assess. Rev. 2025, 110, 107721. [Google Scholar] [CrossRef]
- Luo, Q.; Liu, F.; Zhu, K. Spatial-temporal evolution and driving forces of landscape ecological risk in the Chishui river basin (Guizhou section). Chin. J. Eco-Agric. 2025, 33, 550–562. Available online: http://kns.cnki.net/kcms/detail/13.1432.s.20250114.1803.001.html (accessed on 3 March 2025).
- Wei, S.; Zhang, H.; Xu, Z.; Lin, G.; Lin, Y.; Liang, X.; Ling, J.; Wee, A.K.S.; Lin, H.; Zhou, Y.; et al. Coastal urbanization may indirectly positively impact growth of mangrove forests. Commun. Earth Environ. 2024, 5, 608. [Google Scholar] [CrossRef]

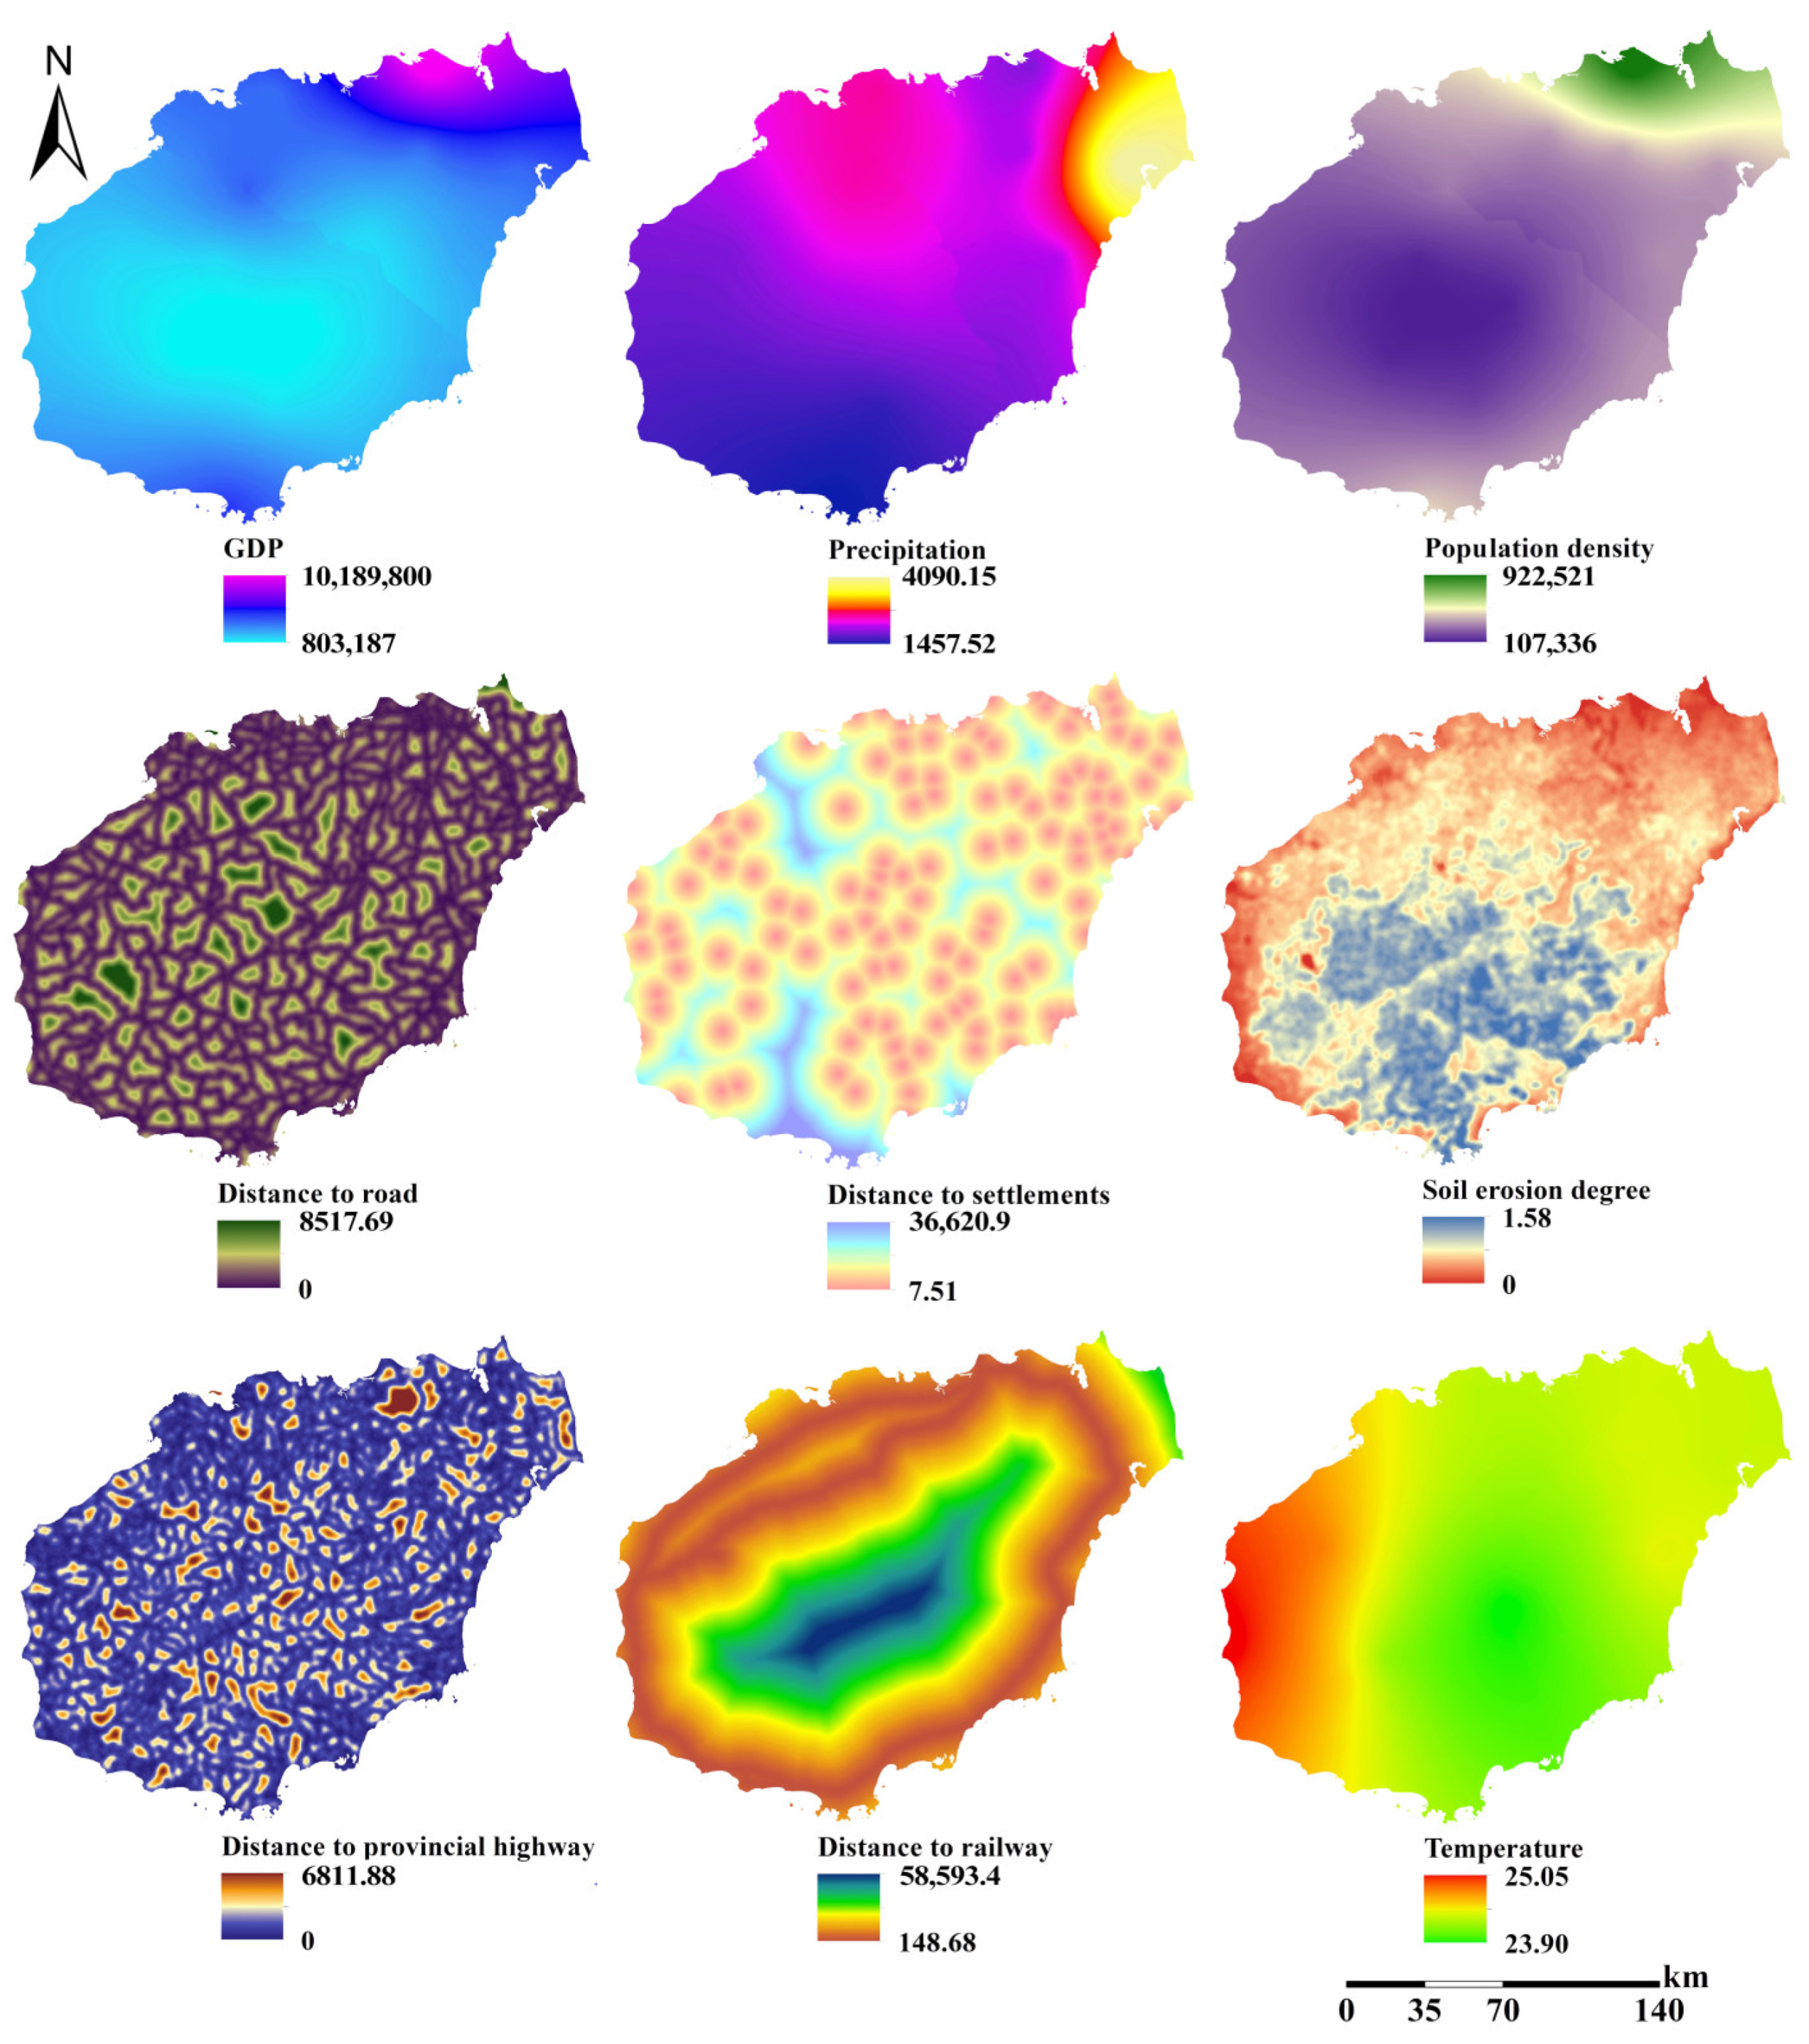
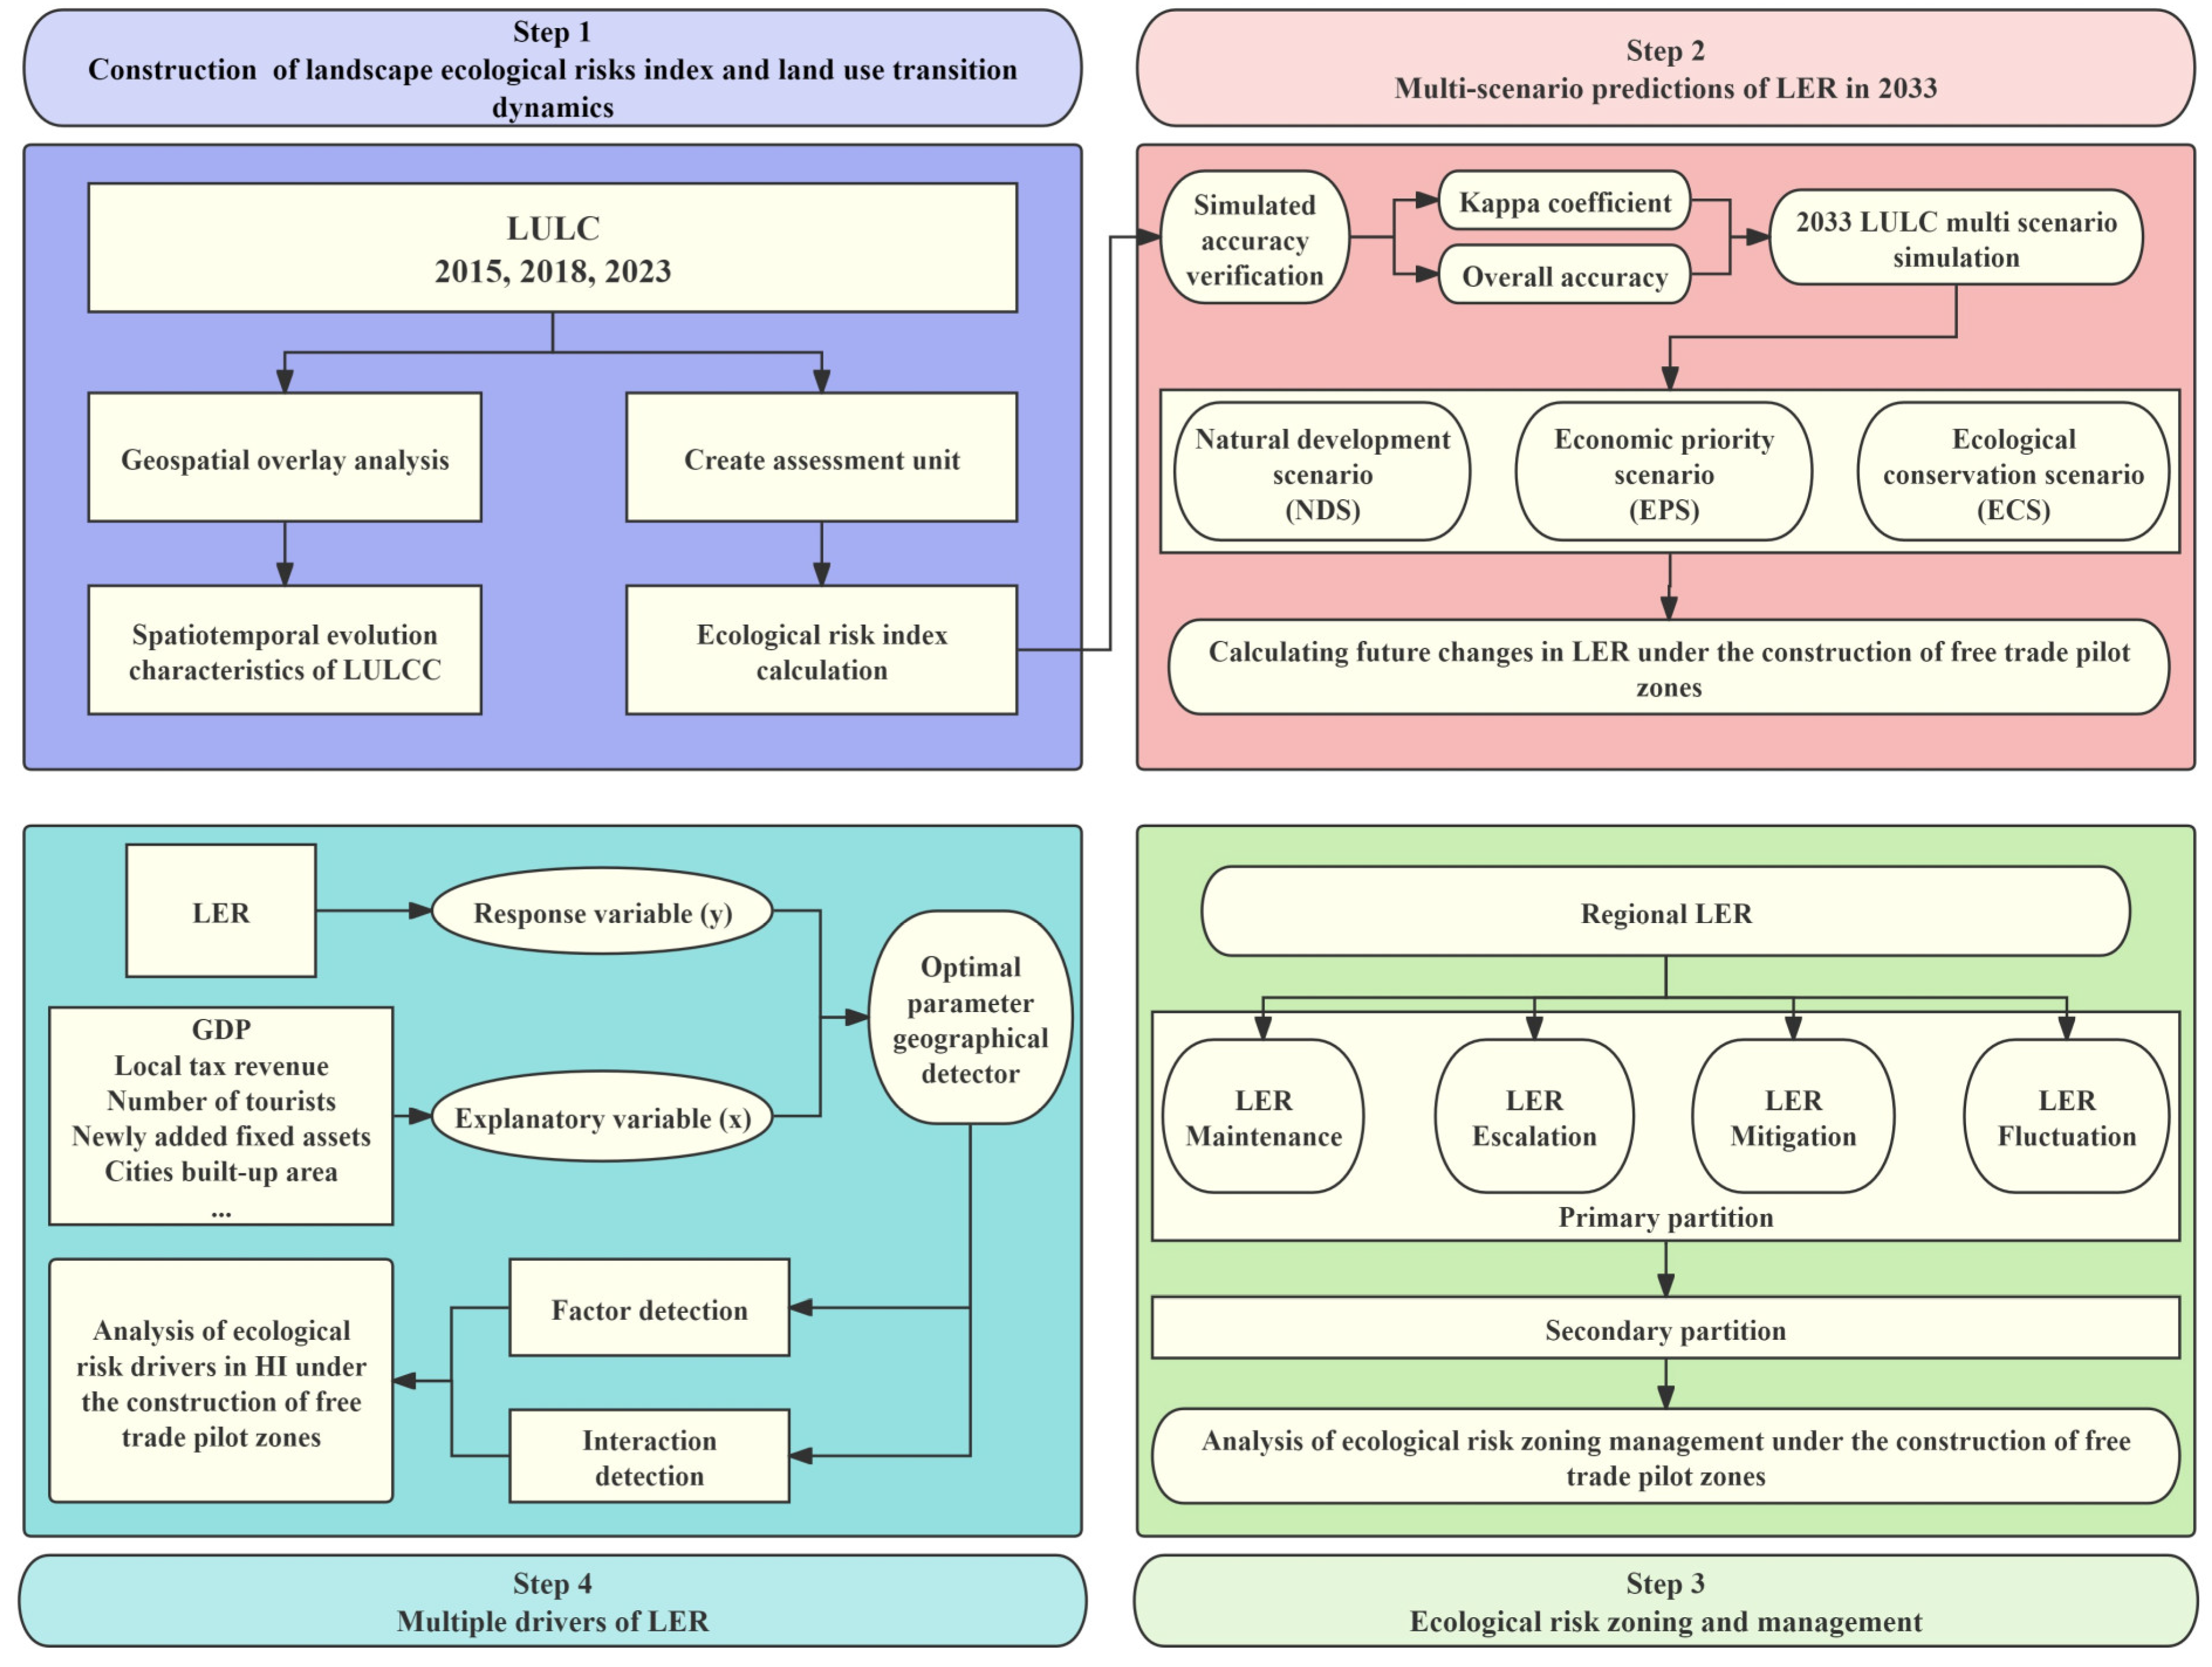

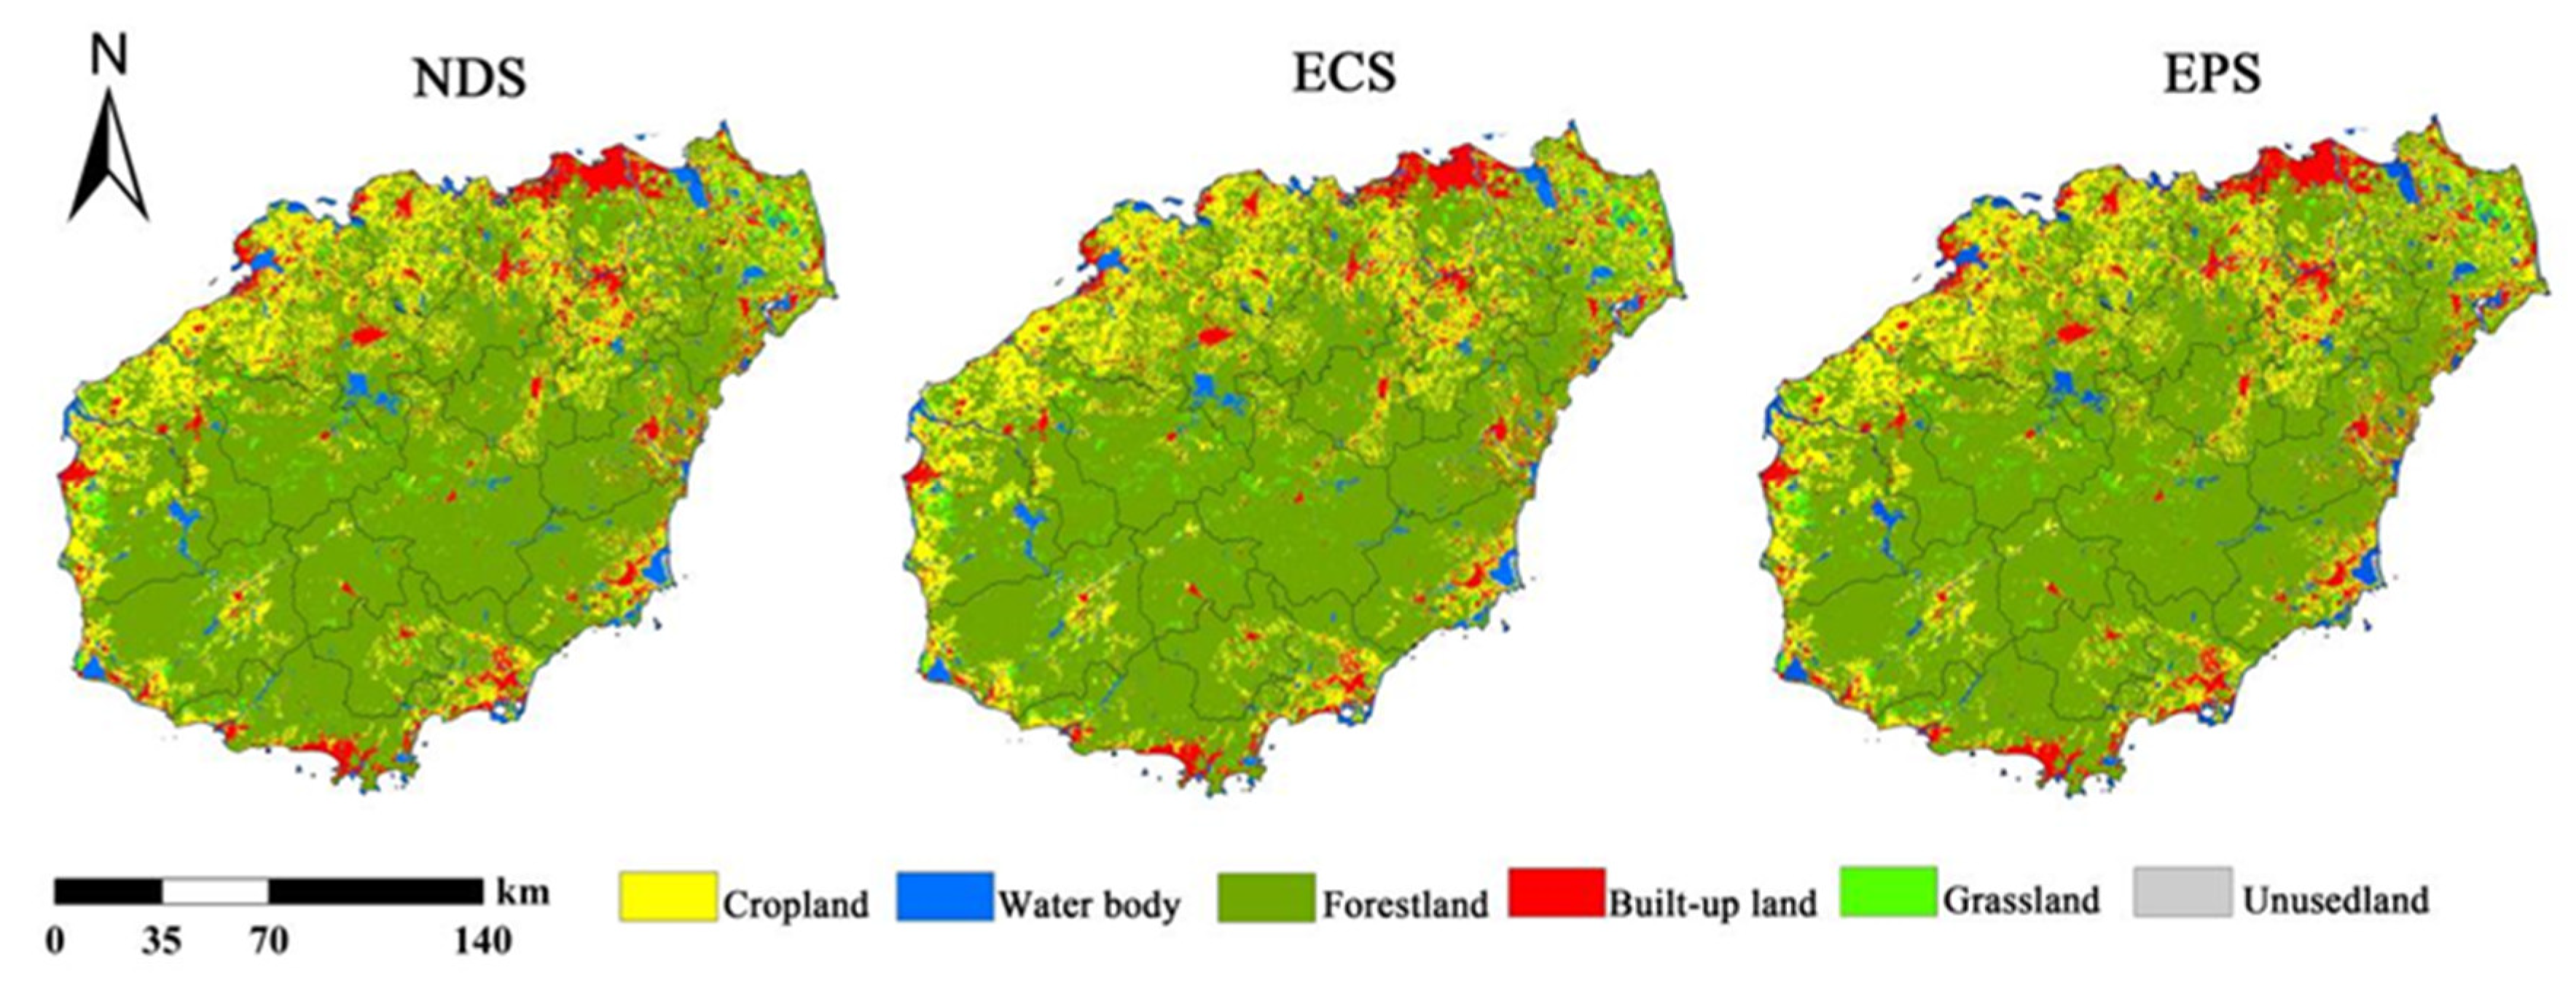


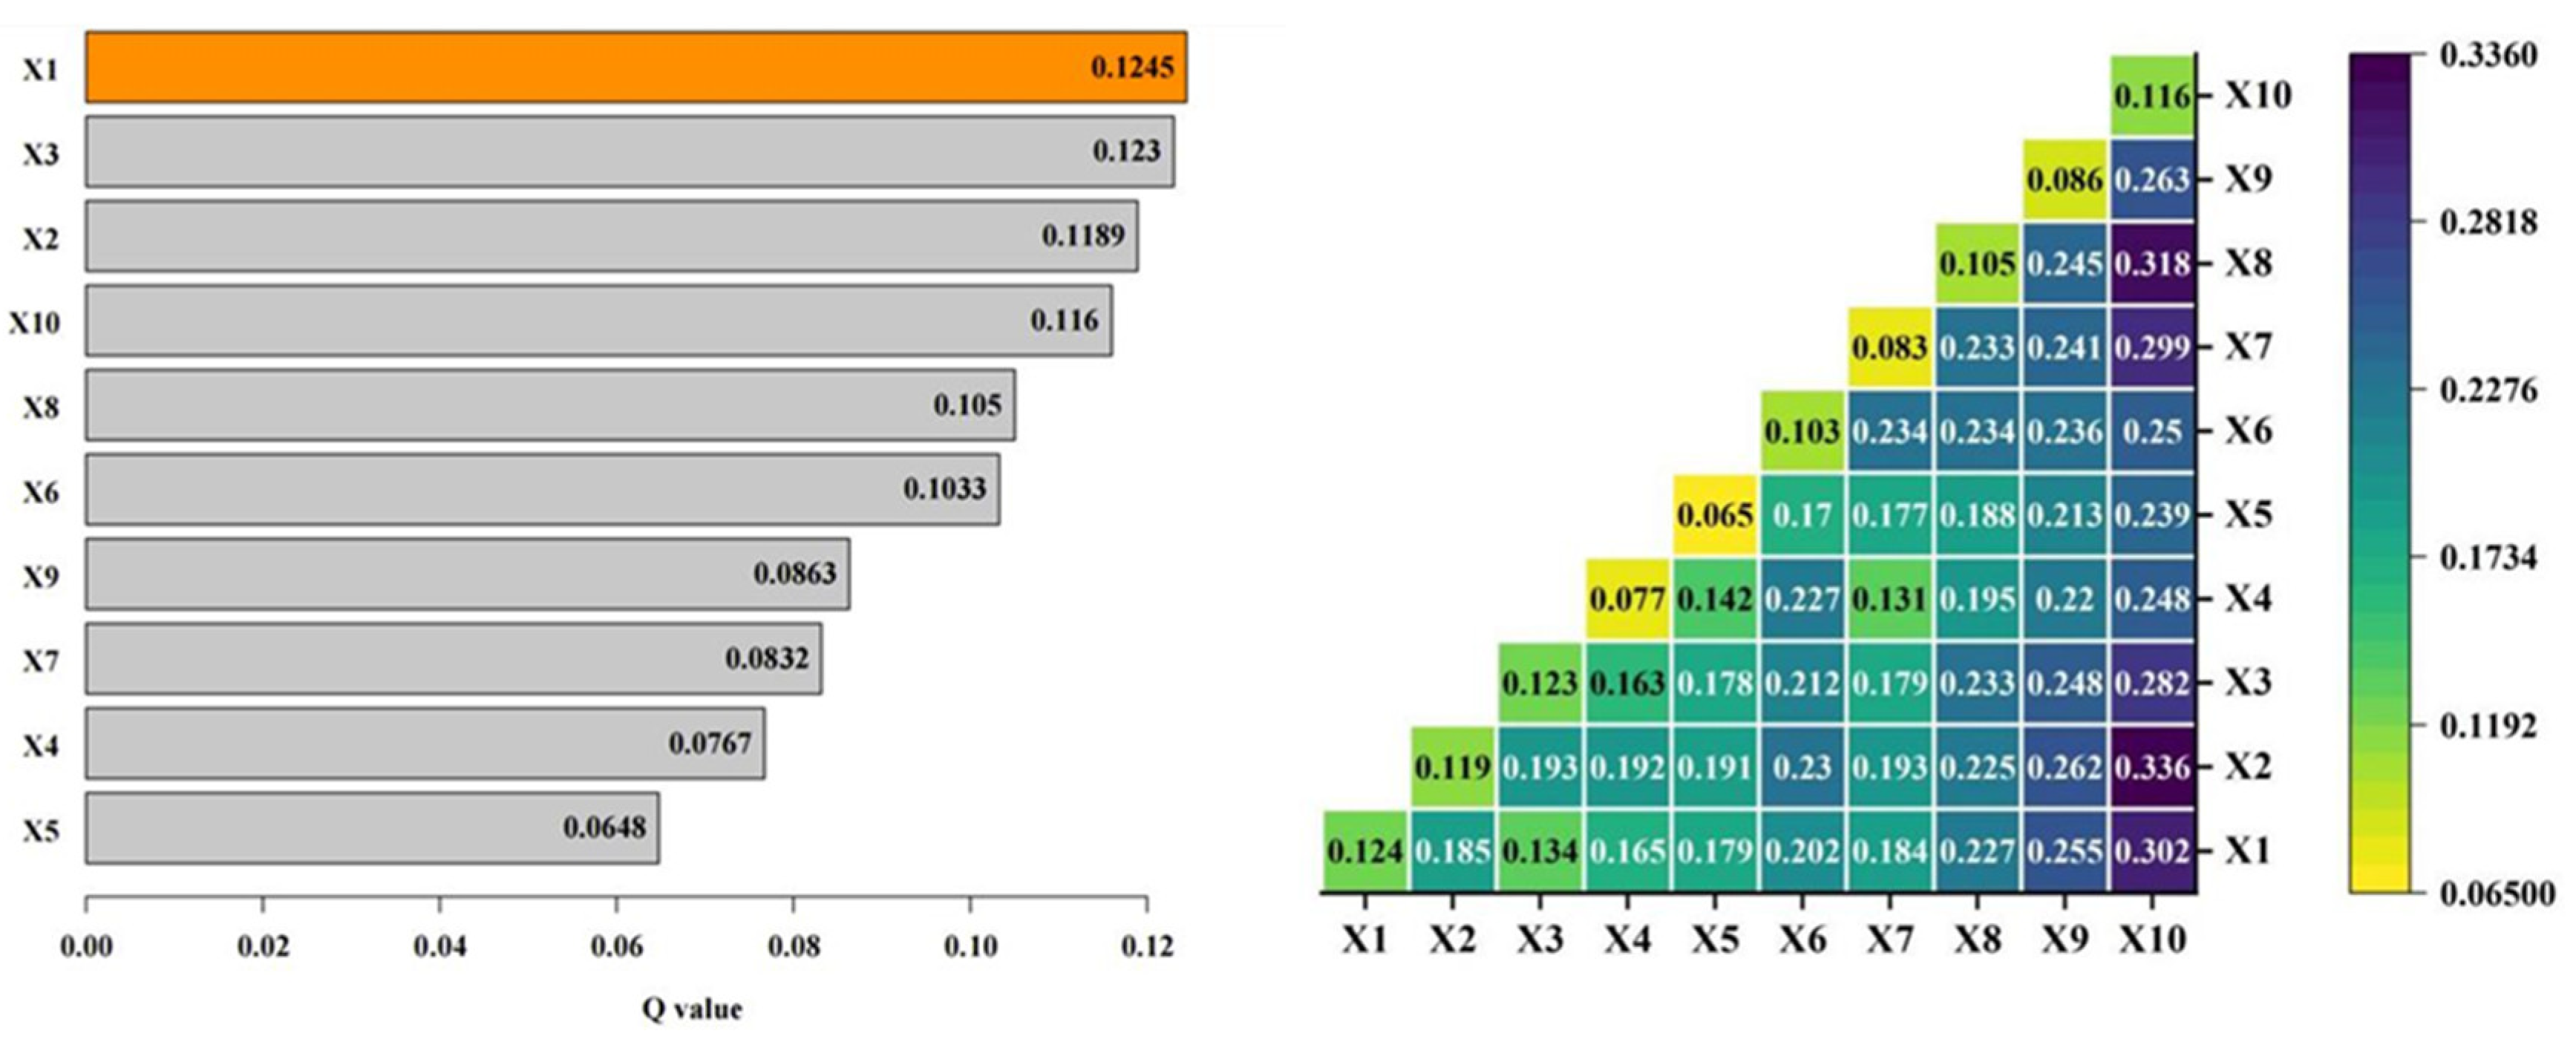
Disclaimer/Publisher’s Note: The statements, opinions and data contained in all publications are solely those of the individual author(s) and contributor(s) and not of MDPI and/or the editor(s). MDPI and/or the editor(s) disclaim responsibility for any injury to people or property resulting from any ideas, methods, instructions or products referred to in the content. |
© 2025 by the authors. Licensee MDPI, Basel, Switzerland. This article is an open access article distributed under the terms and conditions of the Creative Commons Attribution (CC BY) license (https://creativecommons.org/licenses/by/4.0/).