Article

Spatial Differentiation Mechanism of Urban Housing Prices from the Perspective of Amenity: A Case Study of Nanjing

1
School of Architecture and Urban Planning, Nanjing University, Nanjing 210093, China
2
Design School, Xi’an Jiaotong-Liverpool University, Suzhou 215123, China
*
Author to whom correspondence should be addressed.
These authors contributed equally to this work.
Land 2025, 14(5), 1125; https://doi.org/10.3390/land14051125
Submission received: 23 April 2025 / Revised: 18 May 2025 / Accepted: 20 May 2025 / Published: 21 May 2025
(This article belongs to the Special Issue Urban Planning and Housing Market II)

Abstract

:
New economic development trends have brought challenges and transformation directions to China’s urban planning process, in which the relationship between supply and demand of urban housing needs urgent optimisation. Using data on multiple types of facilities and housing price information, this paper analysed spatial differentiation characteristics of housing prices in Nanjing. An evaluation indicator system of human environment quality was established under the amenity connotation based on three dimensions of natural amenity, artificial amenity and social atmosphere amenity, and the Gradient Boosting Decision Tree (GBDT) algorithm was applied to investigate the impact of different amenity factors on housing prices. The findings revealed that amenity factors have a positive impact on housing prices, with artificial amenity as the most influential. Partial amenity factors demonstrated nonlinear relationships with housing prices with obvious threshold effects. Based on these findings, this paper proposed targeted supply and demand optimisation strategies in accordance with the above three dimensions, aiming to offer practical recommendations and guidance for improving the quality of the urban habitat.

1. Introduction

With the end of the era of socialised housing in China, urban housing prices have gradually risen under the influence of factors such as land finance, and the resulting social problems have drawn widespread attention from all sectors of society. In recent years, the urbanisation process in China has gradually entered its latter stage, and the mode of urban development has shifted from extensive “scale expansion” to refined “quality improvement” [1,2]. During this process, the hidden problems in the real estate market have gradually emerged.
Against the backdrop of the era of vigorously promoting the construction of people-oriented cities, optimising the quality of the urban living environment to adapt to the significant changes in the supply and demand relationship in the real estate market, meet the demand for rigid and improved housing, and focus on enhancing the sense of happiness of urban residents has become a key issue in the development of China’s real estate market. As a direct reflection of the supply and demand relationship of urban housing resources, housing prices have become one of the important aspects of research in this field.
In response, some researchers have investigated the factors influencing urban housing prices from various perspectives, such as transportation accessibility [3,4], the quality of the surrounding environment [5,6,7], and the level of supporting infrastructure [8,9], providing valuable insights for clarifying residents’ housing demand and formulating reasonable urban housing policies. However, although a number of researchers have explored the impact of different residential environment qualities on the spatial differentiation of housing prices from a humanism perspective [10], there remains a lack of scientific theoretical guidance on what kind of living environment can be considered as a pleasant physical condition for living and how to balance urban housing prices from the perspective of living environment.
Therefore, this paper proposes the concept of ‘Amenity’ to study housing prices, by using amenity as an evaluation criterion to establish an indicator system for measuring the quality of residential environments in different residential communities. Through utilising machine learning algorithms to assess the nonlinear relationship between different influencing factors and housing prices, this paper further suggests optimisation strategies for urban amenity to balance housing prices, aiming to provide scientific references for upgrading urban living environments, enhancing residents’ daily well-being, and ultimately achieving the overarching goal of humanism urban development.

2. Materials and Methods
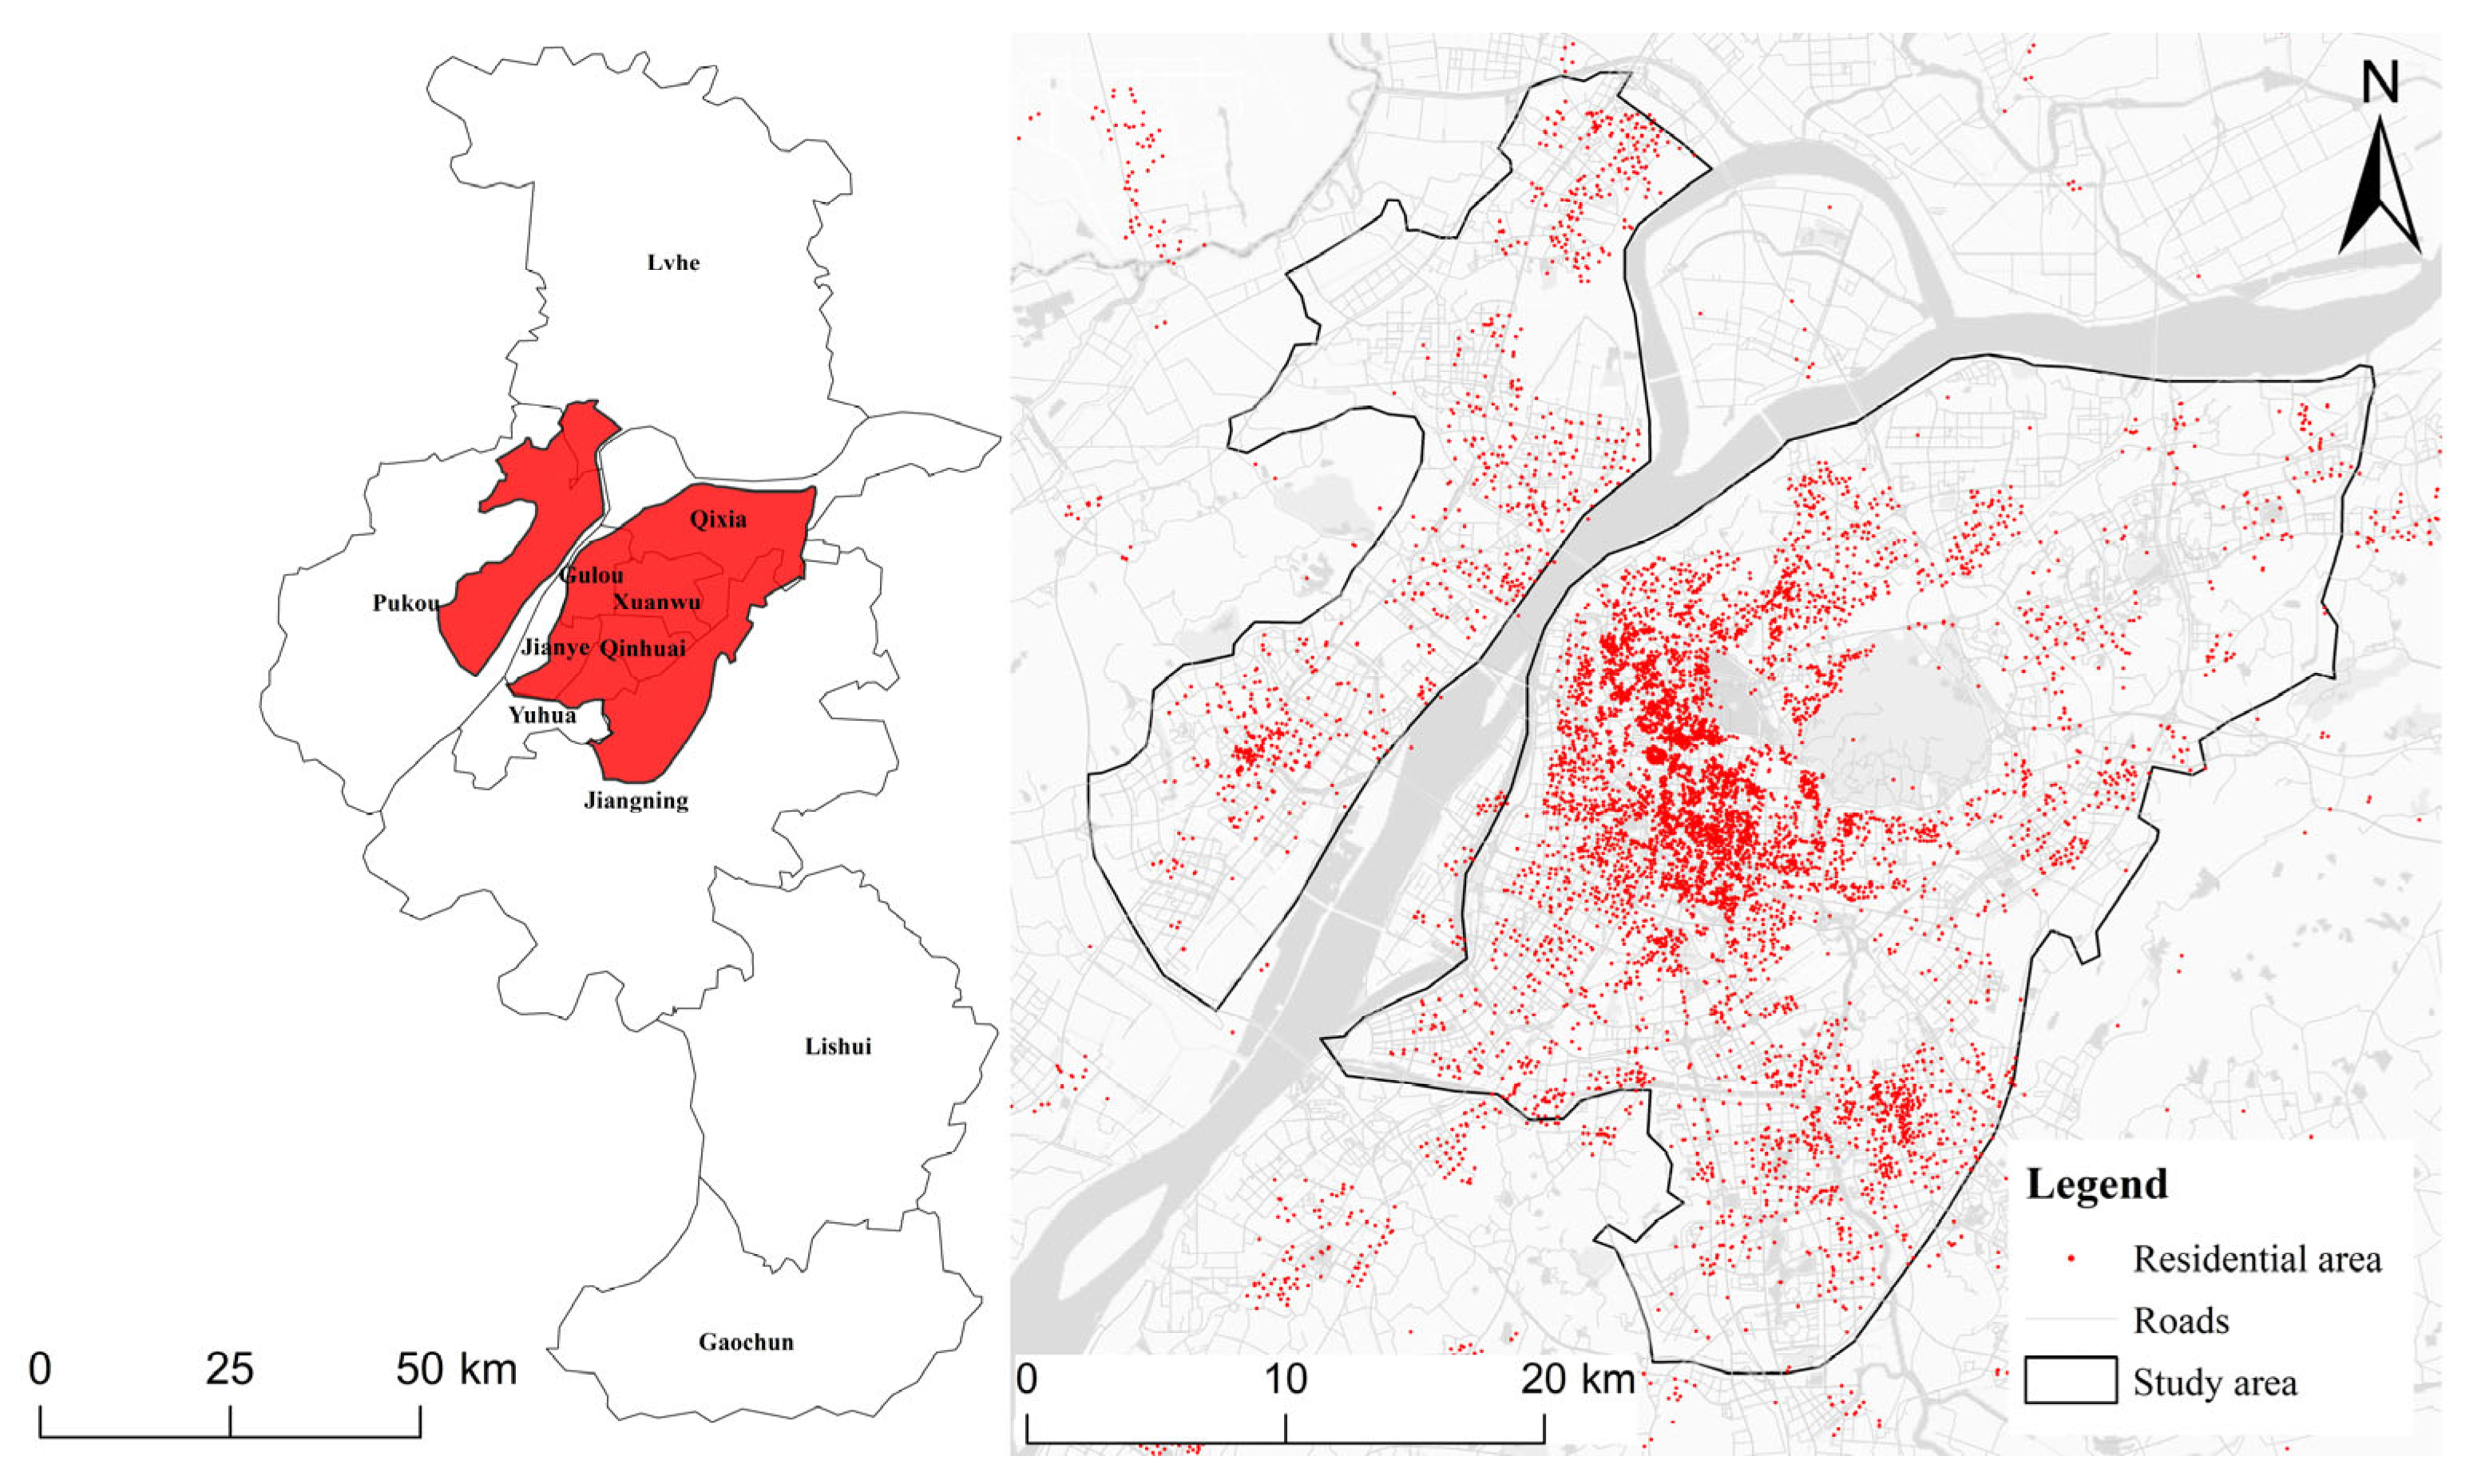
2.1. Study Area

Nanjing is the capital of Jiangsu Province and one of the core cities of the Yangtze River Delta urban agglomeration, with a permanent population of 9.4911 million and an urbanisation rate of 87.01% by the end of 2022. Its urban development model, spatial organisation, and housing price trends are highly representative of China’s megacities. In this paper, the central urban area of Nanjing delineated in the Nanjing Territorial Spatial Planning (2019–2035) is selected as the study area (Figure 1), and 6268 residential communities within the area are taken as the study objects to investigate the influencing factors of housing prices in megacities.

2.2. Data Sources

Drawing on existing studies [11], the data used in this paper cover housing prices, plot ratios, and green space ratios of residential communities in the central area of Nanjing, as well as point-of-interest (POI) data of service facilities and road network data, both of which have been widely used in existing research. Information on residential communities is obtained from real estate transaction websites, and the POI data comprises seven categories: schools, hospitals, parks, dining, shopping, financial services, and tourist attractions, all collected from AutoNavi Maps. Road network data is acquired from the official website of OpenStreetMap.

2.3. Methods

2.3.1. Local Moran’s I

Local Moran’s I is a statistical indicator of spatial correlation obtained by comparing the degree of similarity between a specific location and its nearby locations in spatial data analysis, and it embodies the level of spatial relevance between a location and its surrounding areas [12]. The value of Local Moran’s I ranges from −1 to 1, where positive values indicate a positive spatial correlation, and negative values indicate a negative spatial correlation. This study employs Local Moran’s I to measure the spatial differentiation of housing prices in the central urban area of Nanjing, aiming to identify potential spatial factors influencing housing prices in the region.

2.3.2. Kernel Density Analysis

Kernel density analysis is mainly used to compute the unit density of spatial element measurements of points and lines within a specified neighbourhood range [13], which visually reflects the distribution of discrete measurements in a continuous area. The result presents a smooth surface with a large middle value and a small peripheral value, with the raster value being the unit density, which drops to 0 at the neighbourhood boundary. This study applies kernel density analysis to various service facilities—including shopping, financial, and recreational amenities—to quantitatively assess the level of service provision across different areas of central Nanjing, thereby reflecting the spatial variation in human comfort levels.

2.3.3. Gradient Boosting Decision Tree

Gradient Boosting Decision Tree (GBDT) is an ensemble learning method applicable to big data processing, and performs remarkably in handling both classification and regression tasks [14]. The core concept of this algorithm is to train the decision tree model through step-by-step iteration, and each decision tree is learnt based on the residuals of the previous one. In recent years, machine learning has been extensively applied to examine influencing factors of housing prices [11,15], with GBDT being proven in existing studies as one of the best-performing machine learning algorithms [16]. This paper adopts the GBDT methodology to measure the nonlinear relationship between different influencing factors and housing prices in residential communities and to assess the predominant environmental factors which shape housing prices. Furthermore, it explores the potential mechanisms through which different dimensions of urban amenities influence housing prices.

2.4. Evaluation Indicator System for Urban Amenity

Urban amenity was first introduced by American scholar Ullman in 1954, and it refers to pleasant living conditions [17]. Although the definition of urban amenity has not been unified in academia [18,19], a growing number of scholars have attempted to construct evaluation indicator systems from various dimensions. For instance, Ma et al. developed a comfort evaluation framework for Chinese cities based on five dimensions: natural amenities, culture and business amenities, transportation amenities, health care amenities, and social amenities [20]. Similarly, Zhou et al. assessed urban comfort and its potential relationship with housing prices through three dimensions: infrastructure and environmental amenities, public health and ecological amenities, and cultural–environmental amenities [21]. Drawing on these existing frameworks, this study selects indicators closely related to housing prices and constructs an amenity evaluation system comprising three key dimensions: natural amenity, artificial amenity, and social atmosphere amenity, as detailed below.
(1)
Natural amenity reflects the liveability of the natural environment in the city and serves as a key environmental factor influencing housing prices in cities [5].
(2)
Artificial amenity reflects the level of basic public services in the study area, such as education, health care, shopping, and recreation. It represents the aspect of urban amenity most highly valued by Chinese residents [18].
(3)
Social atmosphere amenity represents the psychological comfort derived from the social and cultural atmosphere of the city, which includes aspects such as social inclusivity and cultural diversity. As the amenity of the social environment is difficult to measure directly, this study uses the presence of universities and research institutions—representing areas with a strong atmosphere of diversity and inclusiveness—as a proxy to reflect the cultural environment of different urban areas [22], thereby assessing social atmosphere amenity.
This study establishes an evaluation criteria system of human environment amenity levels (Table 1) based on amenity theory by using the three dimensions of amenity, which are used to appraise the potential influencing factors of urban housing prices. Measurements of natural amenity include the green space ratio of the residential community and the shortest distance to parks. Artificial amenity is determined by the plot ratio of surrounding buildings, the adequacy level of living facilities and services, and the road traffic conditions. Social atmosphere amenity is assessed by the population size of highly educated people in the residential community, which is measured by the shortest distance from the community to universities or research institutions.
Based on the specific research objectives and content, this study uses the TOPSIS (Technique for Order Preference by Similarity to Ideal Solution) method to determine the weights of each indicator in the evaluation criteria system of human environment amenity level. To objectively assess the overall level of urban amenity, this study employs the TOPSIS (Technique for Order Preference by Similarity to Ideal Solution) method, which is widely used due to its computational simplicity and its ability to effectively avoid biases associated with subjective weighting [23]. The comprehensive urban amenity index is calculated by integrating indicators from the three dimensions of amenity.

3. Spatial Differentiation of Amenity and Housing Prices in Nanjing

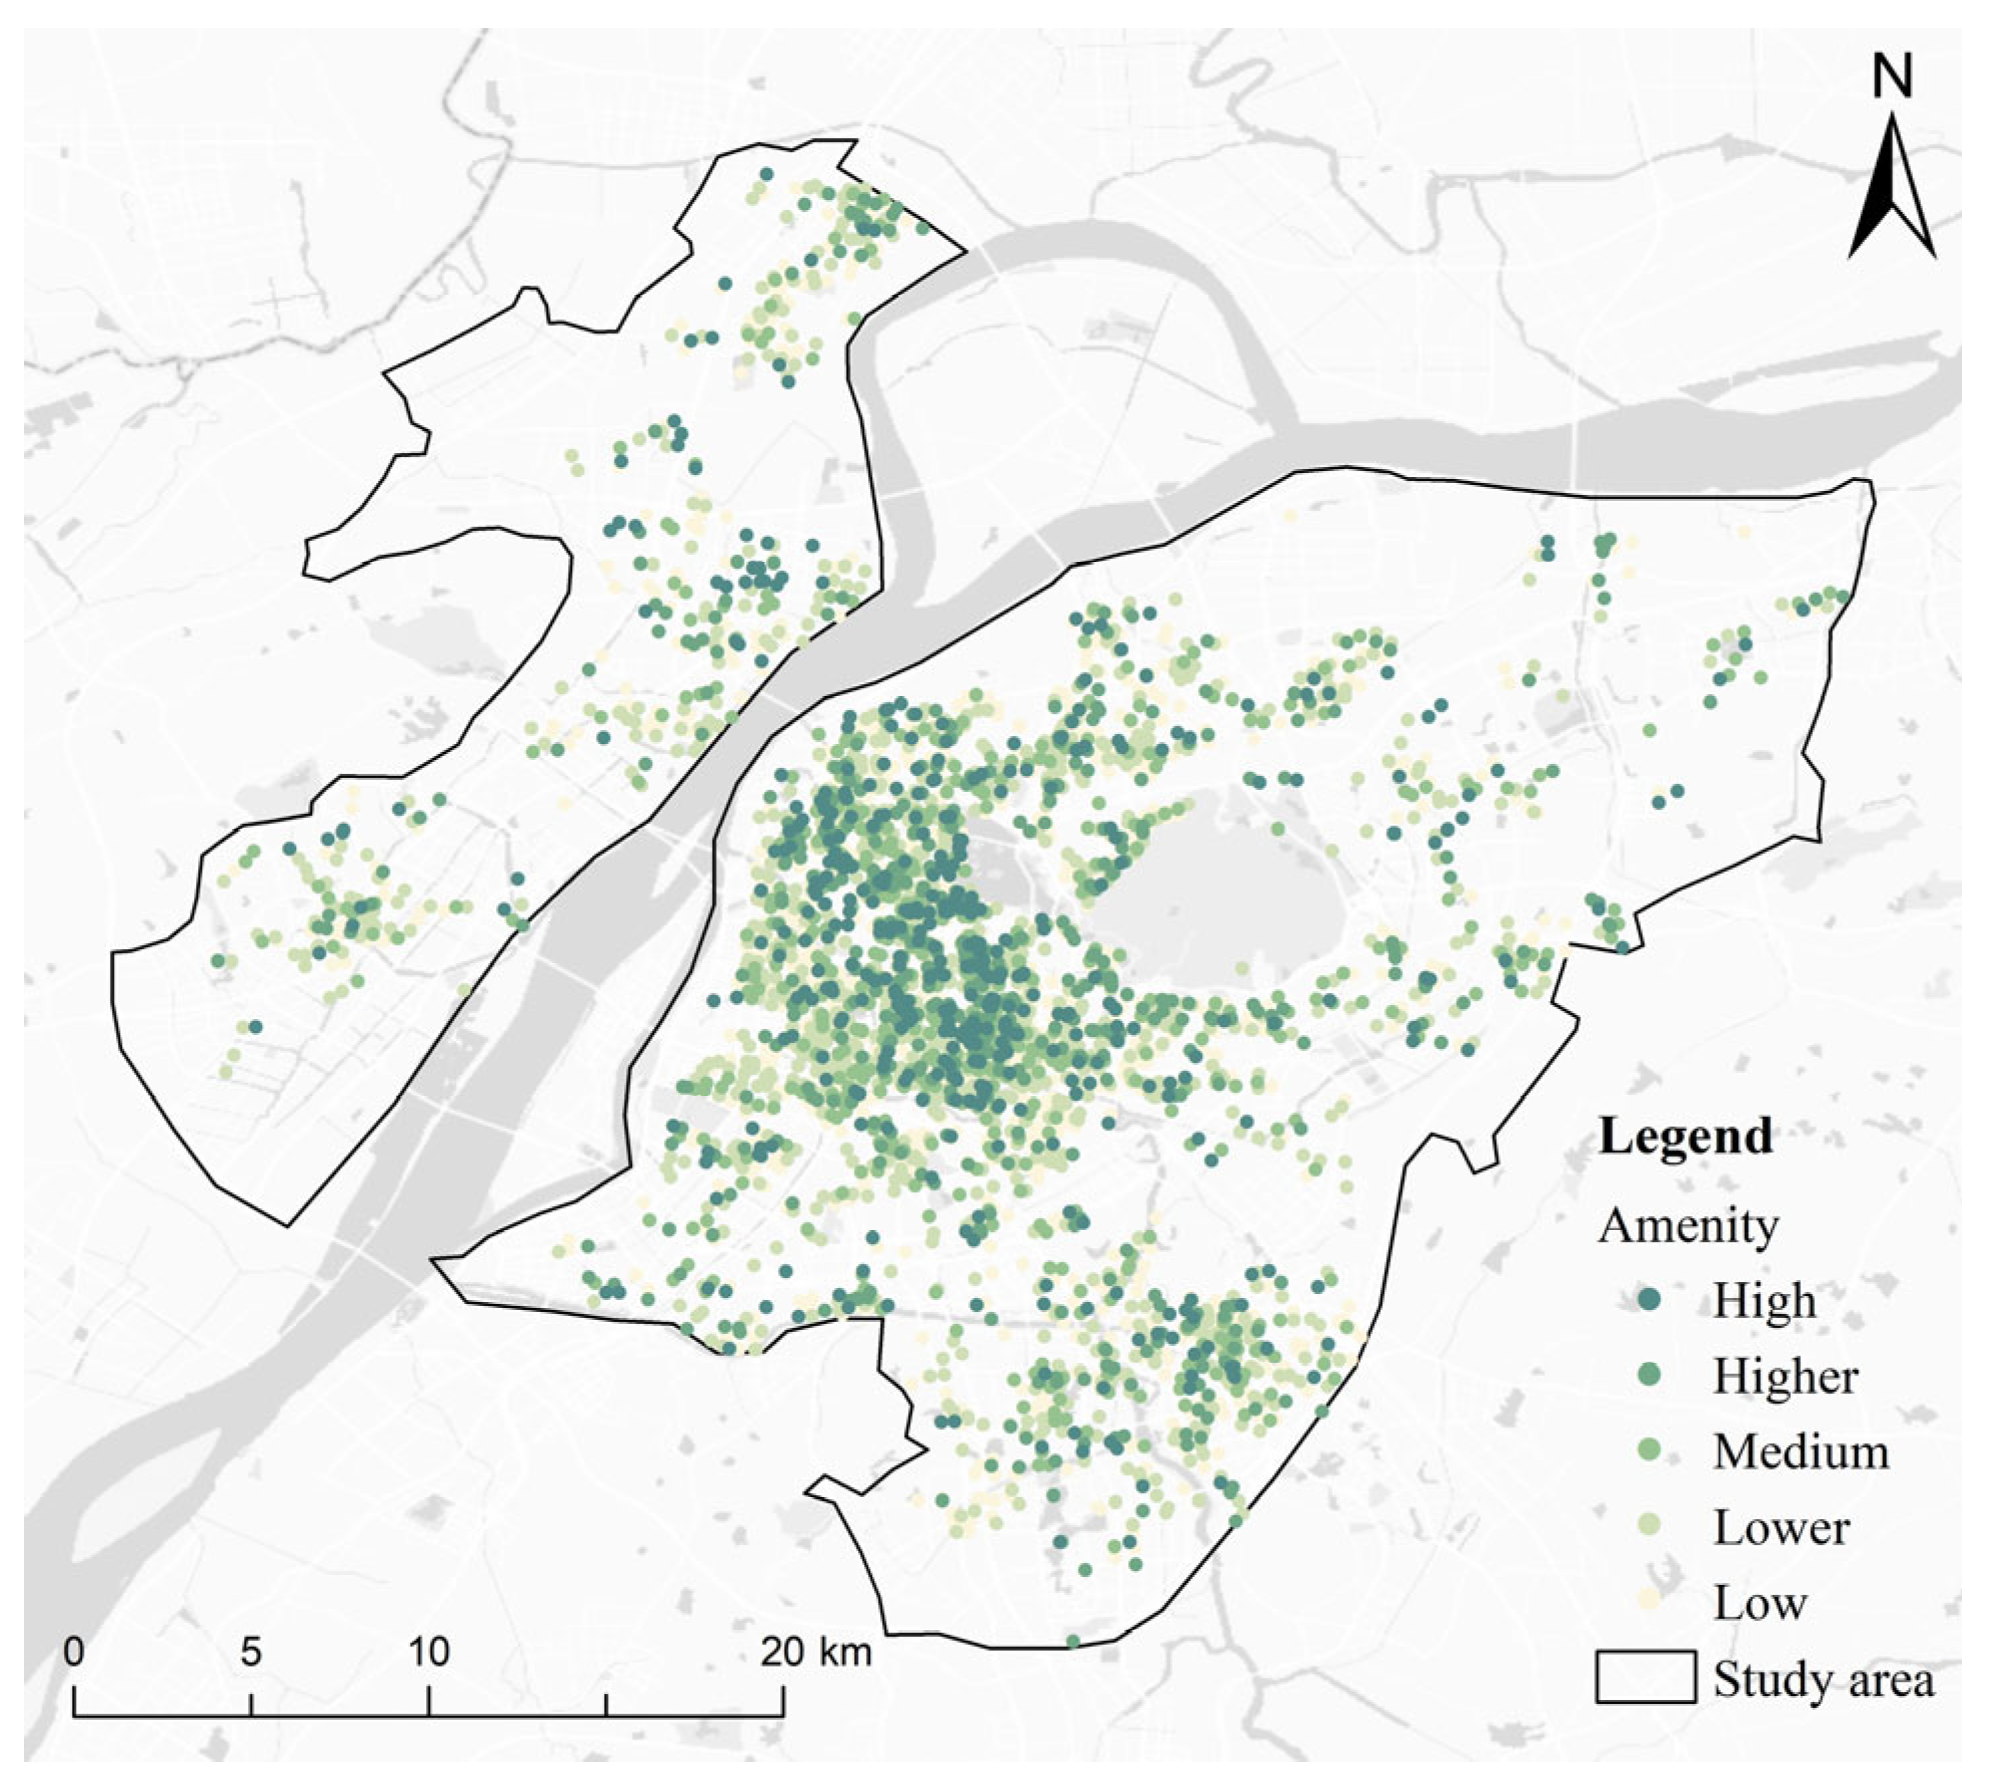
3.1. Evaluation of Human Environment Amenity in Nanjing

Based on the evaluation criteria system and relevant data of human environment amenity, the evaluation results of amenity in the central urban area of Nanjing can be calculated (Figure 2). The amenity spatial distribution in the central urban area of Nanjing presents an overall characteristic of one core and multiple centres. Residential areas with high amenity are concentrated in the central parts of Nanjing, including Gulou, Xuanwu, and Qinhuai districts; the southeastern part of Jiangning District on the outskirts of the central urban area; and the central, southern, and northern regions of Pukou District. The southern part of Qixia District, adjacent to the central urban area, is a secondary centre for amenity. The amenity levels in Jianye and Yuhua districts in the southern part of the central urban area, as well as some areas in the central part of Pukou District, are generally lower.
The possible reasons for this distribution feature are that the infrastructure and public service facilities in the central old urban areas are relatively complete, with more hospitals, primary and secondary schools, and research institutes. The artificial amenity and social atmosphere amenity are generally high, resulting in a generally high level of amenity in residential areas. The peripheral areas of the central urban area are adjacent to ecological spaces, with high natural amenity, thus forming a secondary centre of amenity. The southern areas of Jianye and Yuhua, as well as the central area of Pukou District, are new urban areas for future development. Infrastructure and public service facilities in these areas are relatively lacking, and they are far away from natural spaces, resulting in generally low amenity.

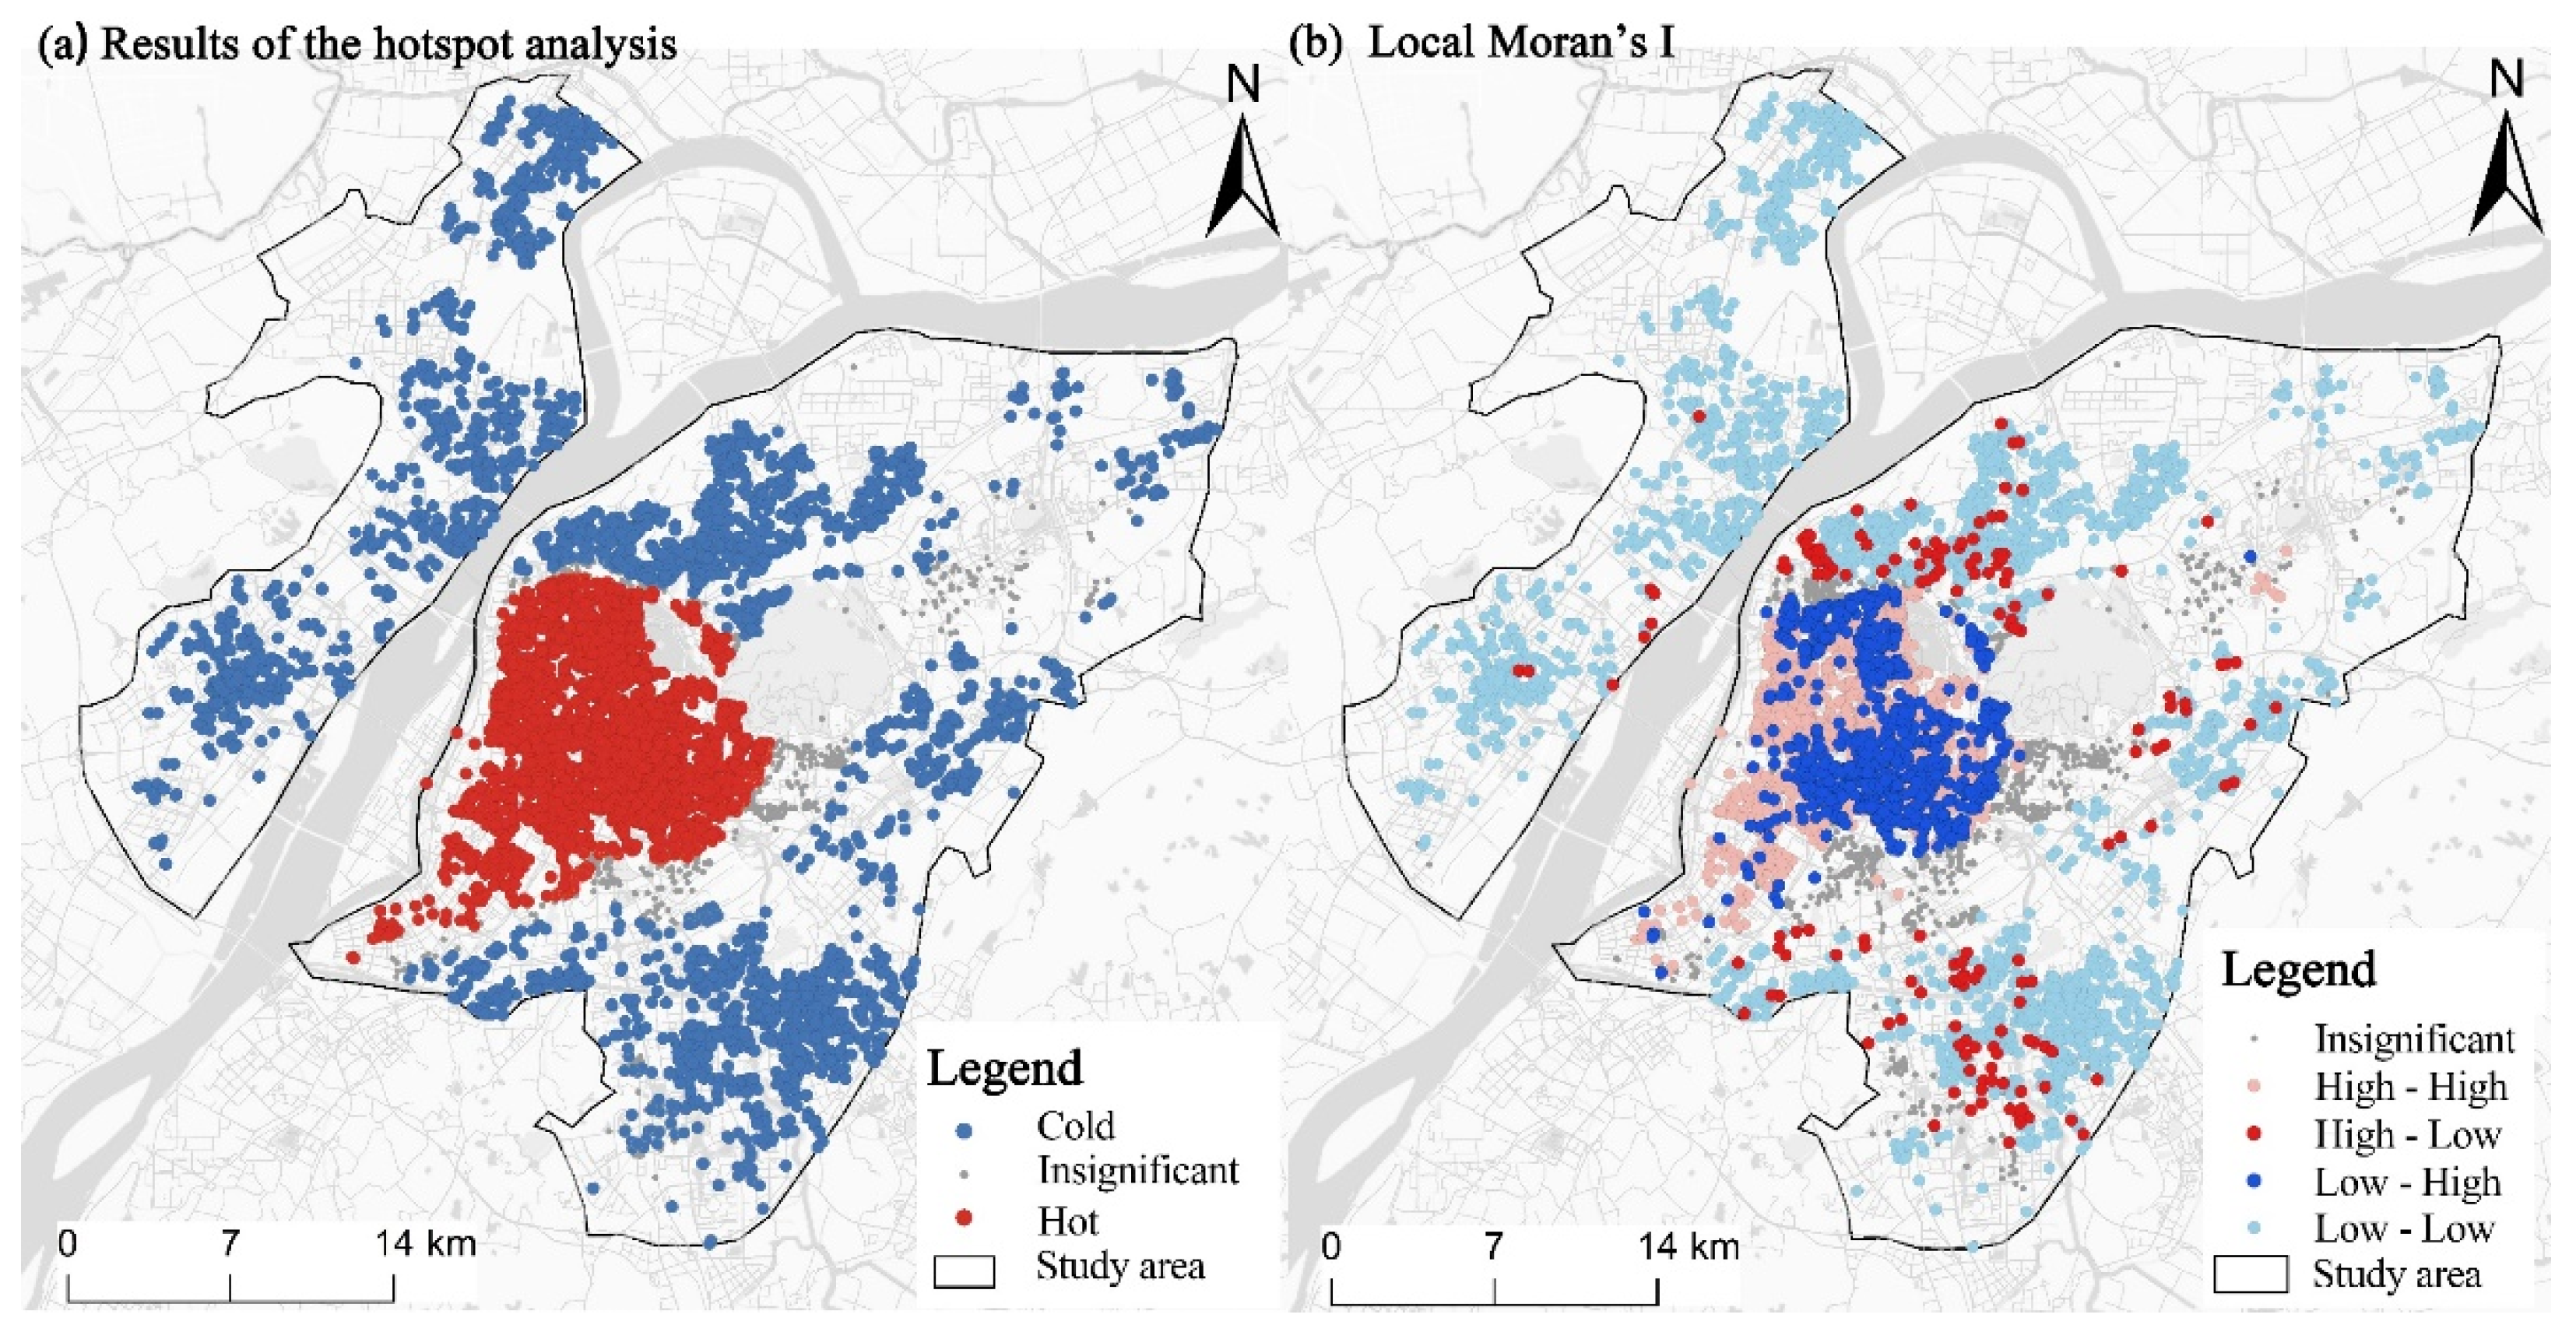
3.2. Spatial Differentiation of Housing Prices in Nanjing

This study adopts cold/hotspot analysis and Local Moran’s I to analyse the spatial distribution characteristics of housing prices in the central area of Nanjing, and the results are as follows (Figure 3). As shown by the results of the cold/hotspot analysis, there are remarkable spatial clustering characteristics of housing prices in central Nanjing, with high-priced residential communities concentrated in Gulou, Xuanwu, Qinhuai, Jianye and Yuhuatai districts in the central area. In general, housing prices in old town areas are relatively high, while those in the peripheral suburbs tend to be lower. According to the results of the Local Moran’s I analysis, housing prices in old towns are also strongly differentiated, with some residential communities showing considerably lower housing prices than the surrounding areas, which indicates the characteristics of a low–high clustering pattern. In contrast, some communities display significantly higher housing prices than their neighbours, despite being further away from the city centre, showing a high–low clustering pattern. This result reveals that although prices in the city centre are generally high, housing prices are not only related to the distance from the city centre, but may also be correlated to a certain extent with the built environment surrounding each community.

4. Spatial Differentiation Mechanism of Urban Housing Prices

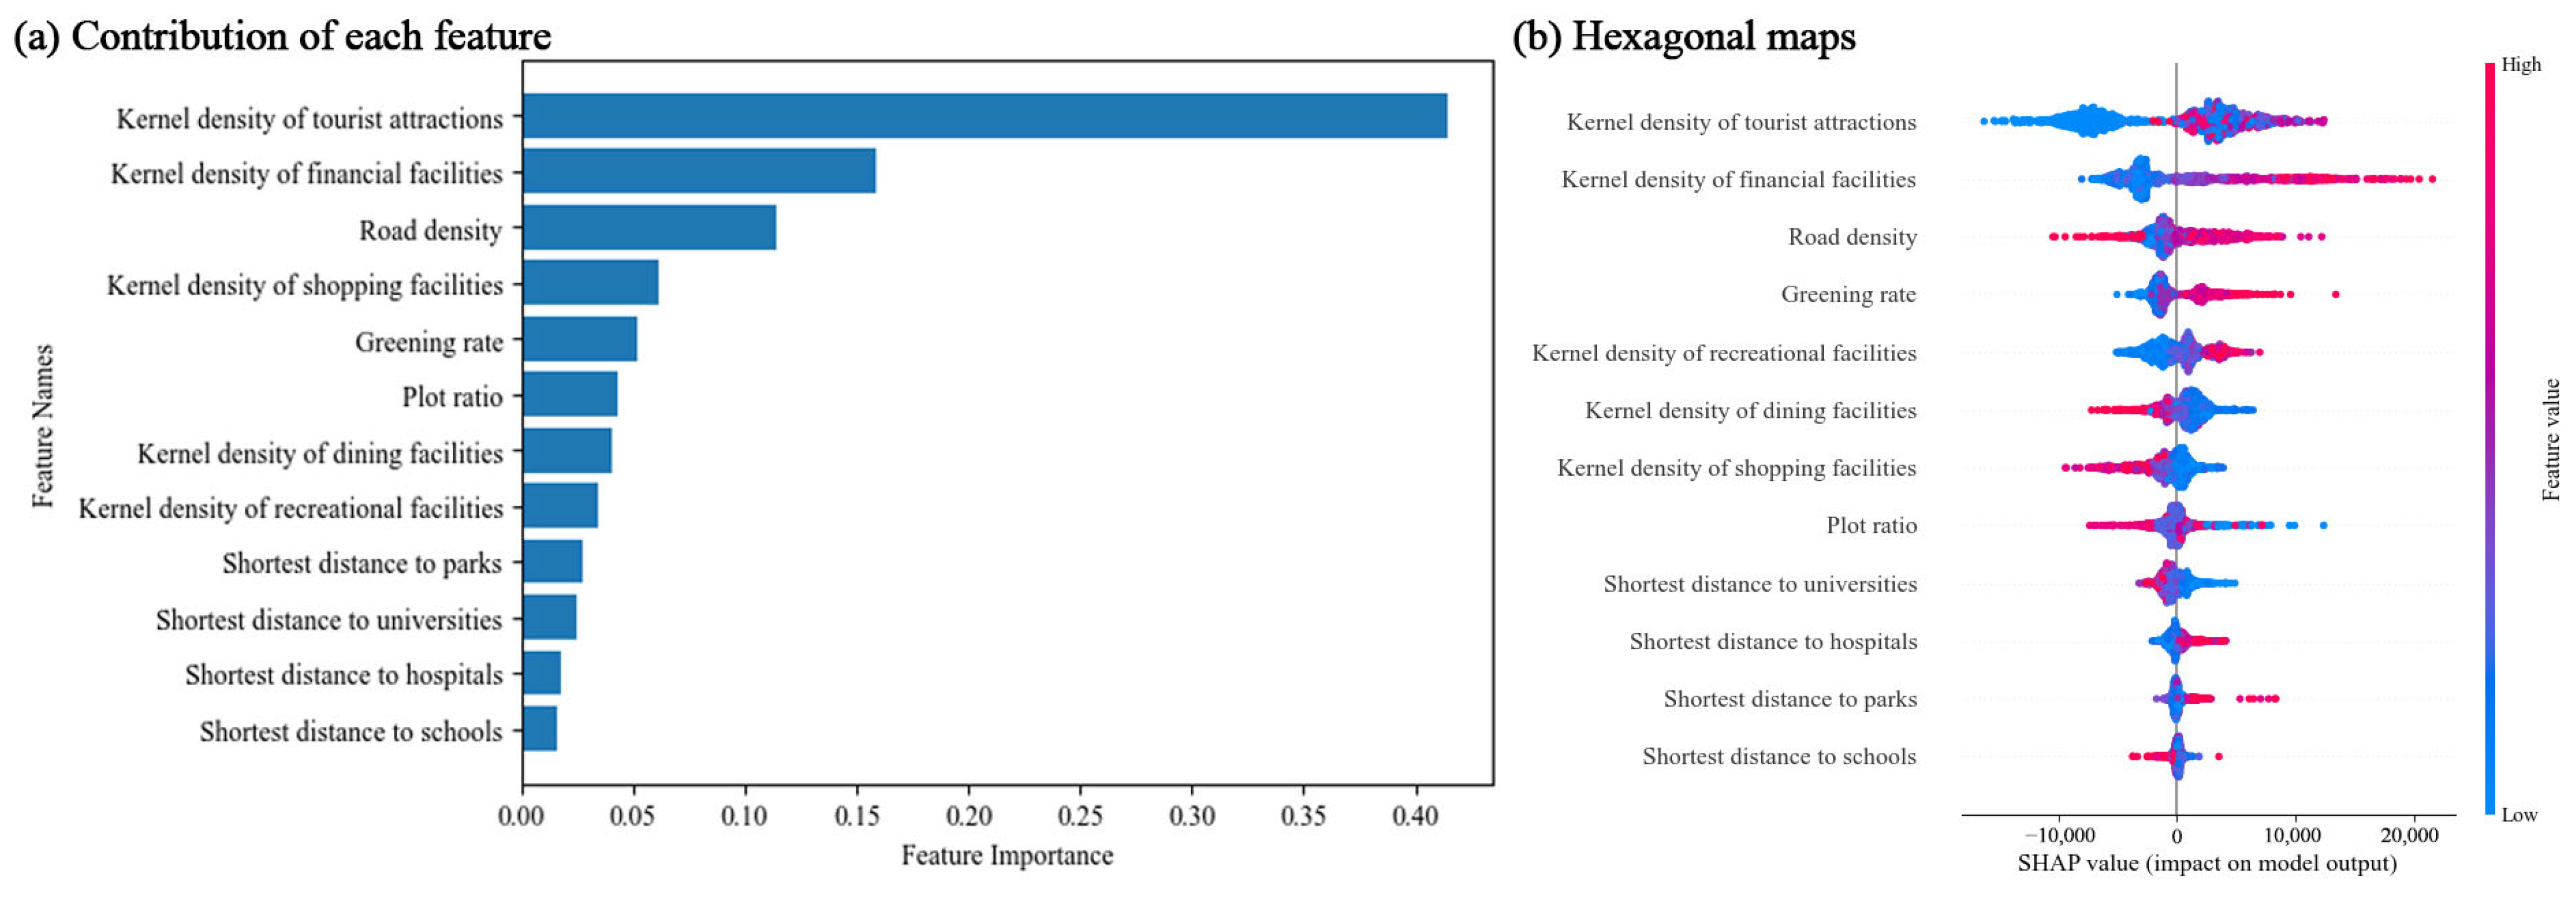
4.1. Housing Price Influencing Factors

This study conducted a regression analysis of housing prices in Nanjing using the GBDT algorithm (Figure 4). This study applies 5-fold cross-validation to systematically optimise the hyperparameters of the GBDT model. To balance model performance and computational efficiency while reducing the risk of overfitting, the model is configured with 100 decision trees, a learning rate of 0.1, and a maximum tree depth of 5. The resulting R2 score of 0.60 indicates that the model exhibits satisfactory predictive performance. The results suggest that among the 12 influencing factors of urban amenity, the most prominent effects on housing prices are found to be the kernel density of tourist attractions, kernel density of financial facilities, and density of road networks. Additionally, the kernel density of dining facilities, the kernel density of shopping facilities, the green space rate and the plot ratio of the community were found to have relatively remarkable impacts on housing prices. However, contrary to the existing research outcomes [24,25], this study found that the shortest distance from the community to primary and secondary schools has a weaker influence on housing prices.
From hexagonal grids of each influencing factor, the following observations can be derived:
(1)
Areas with lower kernel densities of tourist attractions universally show lower housing prices, while areas with higher housing prices have a comparatively smaller number of tourist attractions. This finding suggests that tourist attractions have a notable impact on housing prices, but only partially explain the housing price divergence within a certain region due to the highly heterogeneous spatial distribution of tourist attraction elements.
(2)
The kernel densities of financial facilities, recreational facilities, shopping facilities, and road network density all exhibit a positive correlation with housing prices. This indicates that housing prices are generally higher in areas with better artificial amenity, which suggests that refinement of living service facilities would have an obvious enhancement effect on housing prices.
(3)
The shortest distance to hospitals is negatively correlated with housing prices. This may be due to the fact that medical visits are not a routine requirement for most residents, and that traffic congestion around hospitals is typically high; therefore, most residents do not prefer purchasing their property in a community that is close to a hospital.
(4)
The community green space ratio shows a positive correlation with housing prices, but a negative correlation with the shortest distance to parks. This reflects that residents are more concerned about the natural amenity inside the community and relatively less concerned with the natural landscape conditions outside their community. One plausible explanation for this phenomenon is that communities with a higher density of parks are typically situated in suburban areas. In these locations, the supporting living service facilities are relatively scarce.
(5)
Deviating from the findings of previous studies [26], this study finds that the density of dining facilities is negatively correlated with housing prices. This result may arise from the fact that areas with intensive distribution of dining facilities are mostly old residential communities with high mobility of people and noisy surrounding living environments, which have a certain negative impact on the living environment.
(6)
In addition, the shortest distance to universities or research institutions is negatively correlated with housing prices. This suggests that the amenity of social atmosphere has a positive effect on urban housing prices.
To further investigate the impact of schools (i.e., educational resources) on housing prices, this study examined the nonlinear relationship between the distance from a community to schools and housing prices (Figure 5). When the minimum distance between a community and primary/secondary schools is less than 1500 m, housing prices exhibit a pronounced upward trend as the distance diminishes; however, when the minimum distance is greater than 1700 m, this factor no longer has a meaningful impact on housing prices. This result demonstrates that residents’ preference for housing in school districts is primarily due to the fact that they provide their children with more accessible conditions for commuting to and from school. However, when the shortest distance from the housing to the school is greater than 10 min by walking (i.e., 1500 m), the accessibility provided by housing becomes relatively insubstantial; thus, the distance factor to the school no longer contributes significantly to housing prices.

4.2. Mechanism: How Does Amenity Affect Housing Prices?

From the perspective of market economics, the price of goods directly reflects the demand of consumers for them in the market. In this context, goods that are in short supply in the market are often priced higher, while goods in oversupply are underpriced due to stagnation [27]. After more than thirty years of housing market reformation in China, the main type of housing within cities is commercial housing, which conforms to the attributes and characteristics of goods, so amenity exerts an impact on housing prices through the mechanism of endowing urban housing with diverse demand-related values. This study has analysed the housing prices in the central city of Nanjing through quantitative methods and explored the manner in which different amenity elements affect housing prices:
(1)
At present, due to the uneven spatial distribution of infrastructure and resources such as medical care and education, failing to fully meet the actual needs of residents, housing resources in central areas of Chinese cities tend to be in short supply, while housing resources in peripheral areas are in substantial oversupply.
(2)
Natural amenity, artificial amenity, and social atmosphere amenity all positively influence the actual demand for housing, with artificial amenity being the most influential one. Natural amenity at the micro-scale within residential communities is a major influencing factor on housing demand, but the quality of the natural environment around the community does not have a notable impact on housing demand.
(3)
There is a nonlinear relationship between the shortest distance to schools and housing prices, with a prominent threshold effect. Once the distance is greater than 1500 m, the shortest distance to school no longer affects housing prices. Therefore, urban housing within 1500 m of existing educational resources has a tendency to exceed demand in the market, which correlates closely with the current situation of widespread educational resource constraints in China’s urban centres.
Therefore, amenity first defines the preferences for housing with different elemental conditions, leading to variations in the quantity of housing demanded by residents, which in turn affects the prices of urban housing.

5. Optimisation Strategies for Urban Amenity to Balance Housing Prices

With the gradual replacement of the land economy policy and the progressive deceleration of the ‘growth miracle’ of the rapid urbanisation period, China’s urbanisation has officially entered a new phase [28], with a major directional transformation in the driving mechanism and strategic pattern of its urban development [29]. In this context, rationally adjusting the current inadequate supply and demand relationship of urban housing has become a crucial task in urban planning and construction. With regard to the fundamental pattern of supply and demand derived above and the analysis of its influencing factors, this study proposes the following optimisation strategies from the perspective of urban amenity.

5.1. Enhancing Park City Development to Enhance Urban Natural Amenity

To address the existing contradiction between supply and demand for urban housing, the first priority is to improve the quality of human environments and to build inhabitant-friendly cities. In terms of practical implementation, the new concept of the ‘park city’ should be vigorously promoted and a new paradigm of urban development should be established. The overall improvement of environmental quality will effectively restrain the rise in housing prices as a result of the heterogeneity of living conditions.
(1)
Promoting comprehensive planning and increasing green space resources. The decision-making authorities should lead the formulation of long-term and sustainable park city development plans, enabling a balanced and rational allocation of urban green space resources, so as to guarantee that their recreational functions can cover all areas of the city. Attempts should be made to integrate the creation of park cities into urban master plans and land-use plans to increase land resources for the construction of parks and green spaces, and to flexibly develop elements such as urban forests, wetland parks and street green spaces in accordance with the actual situation, aiming at the provision of more recreational spaces and natural ecological environments.
(2)
Upgrading park facilities and enhancing ecological quality. The existing built environment should be renovated and upgraded by improving the internal service facilities of parks and green spaces, such as walking corridors, open spaces, children’s play facilities, etc. Cultural and recreational elements should be added by organising cultural exhibitions, musical performances and other activities to raise the attractiveness and usage. Additionally, biodiversity should be improved and the ecological function and landscape quality of green spaces should be enhanced.
(3)
Strengthening community participation and introducing social capital. Diversified participation in urban governance should be promoted by carrying out park city publicity and education activities, raising the public’s awareness of the significance of park cities and their participation, as well as encouraging community residents to participate in the construction and management of urban environment. More social capital can be attracted through the public–private partnership (PPP) model, government subsidies, social donations, etc., and enterprises and non-profit organisations should cooperate to collectively push forward the development of park cities.

5.2. Balancing Infrastructure Distribution to Enhance Urban Artificial Amenity

The orderly dispersal of infrastructure should be guided from urban centres to the peripheries, so as to satisfy the basic needs of both urban and rural residents for living services under comprehensive consideration that takes into account the essential direction of urban development. Conflicts should be avoided between supply and demand for housing caused by the unequal distribution of resources through the rational distribution and allocation of infrastructure.
(1)
Optimising transport systems and refining service networks. Establishing an efficient and convenient transport network is crucial to improving the artificial amenity level of the city, by introducing intelligent components into the urban road network system, perfecting the public transport system and road layout, and advocating for green travelling modes. Additionally, promoting even spatial distribution of basic service facilities such as dining, shopping and leisure facilities will strengthen the quality of urban residents’ living environment.
(2)
Establish feedback mechanisms and promote open spaces. A long-term communication and coordination mechanism should be actively established between the public and the government to ensure prompt responses to their concerns and demands. Additionally, the configuration of infrastructure should be improved and optimised by taking residents’ feedback as a guide and guaranteeing their rights to participate in, be informed of, be heard, and supervise the process of urban development. On a neighbourhood scale, diverse open spaces should be introduced to revitalise residents’ recreational activities and living environments.

5.3. Promoting Harmonious Social Values to Enhance Social Atmosphere Amenity

Vigorously promoting and advocating for harmony throughout society and creating a pluralistic and inclusive social atmosphere will improve both the physical and mental health of residents as well as enhance the social cohesion and attractiveness of the city, while balancing the demand for housing in the spatial dimension.
(1)
Promoting community interaction and strengthening public safety. Organising diversified community activities can facilitate daily communication and interaction among residents. Encouraging the establishment of mutual assistance between neighbours, setting up a comprehensive emergency management system, and improving the ability to respond to sudden public security incidents can continuously consolidate the sense of safety and trust among residents in their living environment.
(2)
Enhancing social inclusion and respect for cultural diversity. Strengthening publicity and education activities can raise awareness and understanding of the concepts of equality, respect and inclusion, and advocating for scientific ethics among urban and rural residents. Innovative interactions should be promoted in the context of globalisation, and the harmonious coexistence of multiple cultures in the city should be fostered.

6. Conclusions

This study introduces the concept of ‘Amenity’ to the urban housing research field, applying appropriate analytical methods to clarify the criteria for measuring a high-quality living environment. Afterwards, through using GBDT to analyse the nonlinear relationship between various amenity factors and urban housing prices, the study revealed the specific impact mechanisms of urban amenity on housing prices:
(1)
Natural, artificial and social atmosphere amenities all have impacts on urban housing prices. Among them, the kernel density of tourist attractions, kernel density of financial facilities and road density have the most significant impact.
(2)
The degree of construction and development of infrastructure such as schools, hospitals and businesses (and especially their distance from residential areas) determines the spatial differentiation of housing prices.
(3)
Residents are more concerned about the natural environmental features within their residential community.
Therefore, it is necessary to effectively improve the quality of the living environment and comprehensively enhance urban amenity in order to optimise the distribution of housing prices. In conclusion, only by clarifying the scope of government management and the boundaries of public resource investment [30], correctly handling the relationship between supply and demand in urban housing market, and constructing a human environment that is oriented towards the pursuit of values based on multiple dimensions of amenity can high-quality, high-value and high-efficiency humanistic planning be truly realised.

Author Contributions

Conceptualisation, X.B. and G.F.; methodology, X.B.; software, X.B.; validation, G.F.; formal analysis, X.B.; investigation, G.F.; resources, J.Z.; data curation, X.B.; writing—original draft preparation, G.F. and X.B.; writing—review and editing, T.C.; visualisation, X.B.; supervision, J.Z.; project administration, J.Z.; funding acquisition, J.Z. All authors have read and agreed to the published version of the manuscript.

Funding

This research was funded by the Major Program of the National Fund of Philosophy and Social Science of China (24&ZD148).

Data Availability Statement

Data will be made available on request.

Acknowledgments

We would like to thank the anonymous reviewers for their valuable comments on the manuscript.

Conflicts of Interest

The authors declare no conflicts of interest.

References

  1. Shan, Z.; Huang, Y. An analysisof the Concept, Goals, Contents, Planning Stategies and Misunderstandings of New Urbanization. Urban Plan. Forum 2013, 2, 16–22. [Google Scholar]
  2. Yao, S.; Zhang, P.; Yu, C.; Li, G.; Wang, C. The Theory and Practice of New Urbanization in China. Sci. Geogr. Sin. 2014, 34, 641–647. [Google Scholar]
  3. Feng, C.; Li, W.; Zhao, F. Influence of Rail Transit on Nearby Commodity Housing Prices: A Case Study of Beijing Subway Line Five. Acta Geogr. Sin. 2011, 66, 1055–1062. [Google Scholar]
  4. Gu, Y.; Zheng, S. The Impacts of Rail Transit on Property Values and Land Development Intensity: The Case of No.13 Line in Beijing. Acta Geogr. Sin. 2010, 65, 213–223. [Google Scholar]
  5. Jim, C.Y.; Chen, W.Y. Impacts of urban environmental elements on residential housing prices in Guangzhou (China). Landsc. Urban Plan. 2006, 78, 422–434. [Google Scholar] [CrossRef]
  6. Shin, H.S.; Woo, A. Analyzing the effects of walkable environments on nearby commercial property values based on deep learning approaches. Cities 2024, 144, 104628. [Google Scholar] [CrossRef]
  7. Anelli, D.; Morano, P.; Tajani, F.; Sabatelli, E. Impacts of Urban Decay on the Residential Property Market: An Application to the City of Rome (Italy). In Proceedings of the Computational Science and Its Applications-ICCSA 2024 Workshops, PT VIII, Hanoi, Vietnam, 1–4 July 2024; pp. 36–48. [Google Scholar]
  8. Niu, F.; Liu, W.; Feng, J. Modeling urban housing price: The perspective of household activity demand. Acta Geogr. Sin. 2016, 71, 1731–1740. [Google Scholar] [CrossRef]
  9. Wu, Q.Y.; Edensor, T.; Cheng, J.Q. Beyond Space: Spatial (Re)Production and Middle-Class Remaking Driven by Jiaoyufication in Nanjing City, China. Int. J. Urban Reg. Res. 2018, 42, 1–19. [Google Scholar] [CrossRef]
  10. Song, W.; Ma, Y.; Li, X.; Chen, Y. Housing price growth in different residences in urban Nanjing: Spatiotemporal pattern and social spatial effect. Acta Geogr. Sin. 2018, 73, 1880–1895. [Google Scholar]
  11. Geerts, M.; van den Broucke, S.; De Weerdt, J. A Survey of Methods and Input Data Types for House Price Prediction. ISPRS Int. J. Geo-Inf. 2023, 12, 200. [Google Scholar] [CrossRef]
  12. Zhang, C.S.; Luo, L.; Xu, W.L.; Ledwith, V. Use of local Moran’s I and GIS to identify pollution hotspots of Pb in urban soils of Galway, Ireland. Sci. Total Environ. 2008, 398, 212–221. [Google Scholar] [CrossRef]
  13. Shi, X. Selection of bandwidth type and adjustment side in kernel density estimation over inhomogeneous backgrounds. Int. J. Geogr. Inf. Sci. 2010, 24, 643–660. [Google Scholar] [CrossRef]
  14. Hancock, J.T.; Khoshgoftaar, T.M. CatBoost for big data: An interdisciplinary review. J. Big Data 2020, 7, 94. [Google Scholar] [CrossRef] [PubMed]
  15. Qiu, W.S.; Zhang, Z.Y.; Liu, X.; Li, W.J.; Li, X.J.; Xu, X.; Huang, X.K. Subjective or objective measures of street environment, which are more effective in explaining housing prices? Landsc. Urban Plan. 2022, 221, 104358. [Google Scholar] [CrossRef]
  16. Das, S.S.S.; Ali, M.E.; Li, Y.F.; Kang, Y.B.; Sellis, T. Boosting house price predictions using geo-spatial network embedding. Data Min. Knowl. Discov. 2021, 35, 2221–2250. [Google Scholar] [CrossRef]
  17. Ullman, E.L. Amenities as a Factor in Regional Growth. Geogr. Rev. 1954, 44, 119–132. [Google Scholar] [CrossRef]
  18. Hao, F.; Zhang, J.; Wang, S. A literature review of urban amenity and its research prospects. Prog. Geogr. 2022, 41, 2396–2409. [Google Scholar] [CrossRef]
  19. Wen, T.; Cai, J.; Yang, Z.; Song, T. Review and enlightenment of overseas urban amenity research. Prog. Geogr. 2014, 33, 249–258. [Google Scholar]
  20. Ma, L.; Li, L.; Zhu, H. The construction of urban amenities index in China:An empirical research based on a statistical analysis of 26 Chinese major cities. Acta Geogr. Sin. 2018, 73, 755–770. [Google Scholar]
  21. Zhou, J. Regional Differences of the Impacts of Urban Amenity on House Price and Wages—An Empirical Test Based on Panel Data of China’s Cities from1999 to 2006. J. Financ. Econ. 2009, 35, 80–91. [Google Scholar]
  22. Hudson, T.D.; Rockenbach, A.N. “We Met in a Place that Fostered Exploring”: Campus Environments that Influence Boundary-Crossing Friendships. Innov. High. Educ. 2025, 50, 461–485. [Google Scholar] [CrossRef]
  23. Chen, P.Y. Effects of the entropy weight on TOPSIS. Expert Syst. Appl. 2021, 168, 114186. [Google Scholar] [CrossRef]
  24. Song, Z.; Hua, F.; Liu, S. Research progress and review of capitalization of compulsory educational resources. Prog. Geogr. 2021, 40, 1771–1787. [Google Scholar] [CrossRef]
  25. Wen, H.Z.; Xiao, Y.; Hui, E.C.M.; Zhang, L. Education quality, accessibility, and housing price: Does spatial heterogeneity exist in education capitalization? Habitat Int. 2018, 78, 68–82. [Google Scholar] [CrossRef]
  26. Glaeser, E.; Edward, L.; Kolko, J.; Saiz, A. Consumer city. Natl. Bur. Econ. Res. 2001, 1, 27–50. [Google Scholar] [CrossRef]
  27. Glaeser, E.L.; Gyourko, J.; Saiz, A. Housing supply and housing bubbles. J. Urban Econ. 2008, 64, 198–217. [Google Scholar] [CrossRef]
  28. Zhang, J.; Huang, L. Transition of China’s New Town Development in the Context of Urbanization 2.0. Shanghai Urban Plan. Rev. 2022, 02, 54–58. [Google Scholar]
  29. Brenner, N.; Schmid, C. The ‘Urban Age’ in Question. Int. J. Urban Reg. Res. 2014, 38, 731–755. [Google Scholar] [CrossRef]
  30. Zhang, J.; Li, W.; Zhang, F. Regional Collaburative Governance in China and Key Issues in the New Era. City Plan. Rev. 2024, 48, 4–11. [Google Scholar]
Figure 1. Study area and housing distribution.
Land 14 01125 g001
Figure 2. Evaluation results of human environment amenity in the central area of Nanjing.
Land 14 01125 g002
Figure 3. Spatial differentiation of housing prices in the central urban area of Nanjing: (a) results of the hotspot analysis; (b) Local Moran’s I.
Land 14 01125 g003
Figure 4. GBDT calculation results.
Land 14 01125 g004
Figure 5. The nonlinear relationship between the distance to schools and housing prices.
Land 14 01125 g005
Table 1. Evaluation indicator system for human environment under urban amenity perspective.
DimensionsDimension WeightIndicatorsIndicator Weight
Natural amenity9.53%Greening rate2.26%
Shortest distance to parks7.27%
Artificial amenity80.24%Plot ratio3.68%
Shortest distance to hospitals9.99%
Shortest distance to schools7.31%
Kernel density of dining facilities8.22%
Kernel density of shopping facilities8.89%
Kernel density of financial facilities10.96%
Kernel density of tourist attractions19.97%
Kernel density of recreational facilities9.80%
Road density1.42%
Social atmosphere amenity10.23%Shortest distance to universities or institutions10.23%
Disclaimer/Publisher’s Note: The statements, opinions and data contained in all publications are solely those of the individual author(s) and contributor(s) and not of MDPI and/or the editor(s). MDPI and/or the editor(s) disclaim responsibility for any injury to people or property resulting from any ideas, methods, instructions or products referred to in the content.

