Article

Deformation Monitoring Along Beijing Metro Line 22 Using PS-InSAR Technology

1
School of Earth Sciences, Institute of Disaster Prevention, Langfang 065201, China
2
Hebei Key Laboratory of Seismodynamics, Sanhe 065201, China
3
College of Resources Environment and Tourism, Capital Normal University, Beijing 100048, China
4
Beijing Water Science and Technology Institute, Beijing 100048, China
5
College of Mechanical Engineering, Zhejiang University, Hangzhou 310030, China
*
Author to whom correspondence should be addressed.
Land 2025, 14(5), 1098; https://doi.org/10.3390/land14051098
Submission received: 22 March 2025 / Revised: 10 May 2025 / Accepted: 15 May 2025 / Published: 18 May 2025
(This article belongs to the Special Issue Assessing Land Subsidence Using Remote Sensing Data)

Abstract

:
The construction of subways exacerbates the non-uniformity of surface deformation, which in turn poses a potential threat to the safe construction and stable operation of urban rail transit systems. Beijing, the city with the most extensive subway network in China, has long been affected by land subsidence. Utilizing data from Envisat ASAR, Radarsat-2, and Sentinel-1 satellites, this study employs PS-InSAR technology to monitor and analyze land subsidence within a 2 km buffer zone along Beijing Metro Line 22 over a span of 20 years (from January 2004 to November 2024). The results indicate that land subsidence at Guanzhuang Station and Yanjiao Station along Metro Line 22 is particularly pronounced, forming two distinct subsidence zones. After 2016, the overall rate of subsidence along the subway line began to stabilize, with noticeable ground rebound emerging around 2020. This study further reveals a strong correlation between land subsidence and confined groundwater levels, while geological structures and building construction also exert a significant influence on subsidence development. These findings provide a crucial scientific foundation for the formulation of effective prevention and mitigation strategies for land subsidence along urban rail transit lines.

1. Introduction

Land subsidence is a phenomenon characterized by a continuous decrease in the elevation of the earth’s surface over a specific period, occurring in many regions worldwide. In China, large-scale land subsidence was first documented in the 1920s, with the North China Plain being one of the most severely affected regions [1,2]. Due to its complex geological conditions, significant fluctuations in groundwater levels, and the presence of densely distributed fault zones, the Beijing Plain has become one of the most severely affected regions by land subsidence in the North China Plain [3,4,5]. Currently, land subsidence in the Beijing Plain exhibits a spatial pattern characterized by more severe subsidence in the eastern and southern regions, followed by the northern region, while the western region experiences relatively less subsidence [6,7].
Non-uniform land subsidence can compromise the safe operation of subway lines and significantly impact engineering structures, track laying, and equipment installation during subway construction. It may lead to structural cracks, water leakage, track bed collapse, and heaving in existing subway infrastructure [8,9]. Conversely, large-scale underground engineering projects can induce land subsidence, posing risks to the safety of surrounding buildings. During subway construction, activities such as tunnel excavation can alter rock formations and disturb soil structures, leading to surface subsidence and deformation. Additionally, subway construction involves foundation pit engineering, where excessive groundwater drawdown due to construction dewatering can exacerbate land subsidence in both the excavation area and its vicinity. Therefore, monitoring land subsidence along subway lines and analyzing its evolution characteristics is crucial for ensuring construction safety and mitigating associated risks [10,11]. The issue of land subsidence in the Beijing Plain remains significant. Although water diversion projects, such as the South-to-North Water Transfer Project, and water conservation measures in the Beijing–Tianjin–Hebei region have mitigated the subsidence rate to some extent, the rapid expansion of subway construction has introduced new challenges to the region [12,13]. Beijing’s subway system is currently undergoing a peak construction period, with many projects located in areas affected by land subsidence. The development and utilization of underground space along subway lines during both construction and operation exert a significant influence on rock formations and soil. This impact interacts with the existing land subsidence issues in the Beijing Plain, further increasing subsidence risks and making the relationship between subway construction and land subsidence increasingly intricate and interdependent [14,15,16].
Subways extend linearly across urban environments, whereas traditional deformation monitoring methods are costly and sparsely distributed. As a result, subway subsidence observation data along subway lines are spatially discrete, making it difficult to comprehensively capture the continuous spatio-temporal evolution of subsidence. Synthetic Aperture Radar Interferometry (InSAR), as an advanced space-to-ground measurement method, has the advantages of high spatio-temporal resolution, wide monitoring range, and long monitoring time series [8], which makes up for the deficiencies of traditional monitoring methods. Multi-temporal InSAR, such as Permanent Scatterer PS-InSAR [4,17], Small Baseline Subset (SBAS-InSAR) [2,18,19,20], Stanford Method for Persistent Scatterers (StaMPS) [21], Temporary Coherent Point (TCP-InSAR) [22], and Quasi-PS (QPS-InSAR) [23], has been widely used for millimeter-level accurate land subsidence monitoring along subway lines.
Heleno et al. utilized PS-InSAR technology with ERS-1/2 and Envisat ASAR data to monitor and analyze land subsidence along subway lines in Lisbon, Portugal, revealing a maximum subsidence of 13 mm [24]. Wang et al. employed Interferometric Point Target Analysis (IPTA) technology using Envisat ASAR and PALSAR data to monitor land subsidence along Guangzhou Metro Lines 2, 3, and 6. The results indicated that subsidence during the tunnel excavation stage exceeded 8 mm [25]. Chen et al. utilized Radarsat-2 data combined with PS-InSAR and entropy methods to analyze subsidence rate differences and entropy values in various buffer zones at Huangqu and Changying Stations of Beijing Metro Line 6, as well as subsidence variations during construction and operation, revealing that subway-induced subsidence has a specific influence range [26]. Duan et al., using Envisat ASAR, TerraSAR-X, and leveling monitoring data, proposed the MMTI-TSF (Multisensor MTI Time-series Fusion) method to obtain nearly 15 years of land subsidence information along Beijing subway lines, revealing a relatively high stability risk for Beijing Metro Line 6 [27]. Based on TerraSAR-X data, PS-InSAR technology was used to monitor land subsidence along subway lines in the Beijing Plain, revealing that non-uniform land subsidence in the area is associated with underground soil excavation, and the construction of Metro Lines 6 and 7 resulted in rapid non-linear subsidence.
This paper employs PS-InSAR technology to conduct long-term monitoring of land subsidence along Beijing Metro Line 22, revealing the spatio-temporal characteristics of subsidence along the subway line and performing a relevant factor analysis, thus providing a theoretical foundation for the prevention and control of land subsidence in these areas.

2. Study Area and Datasets
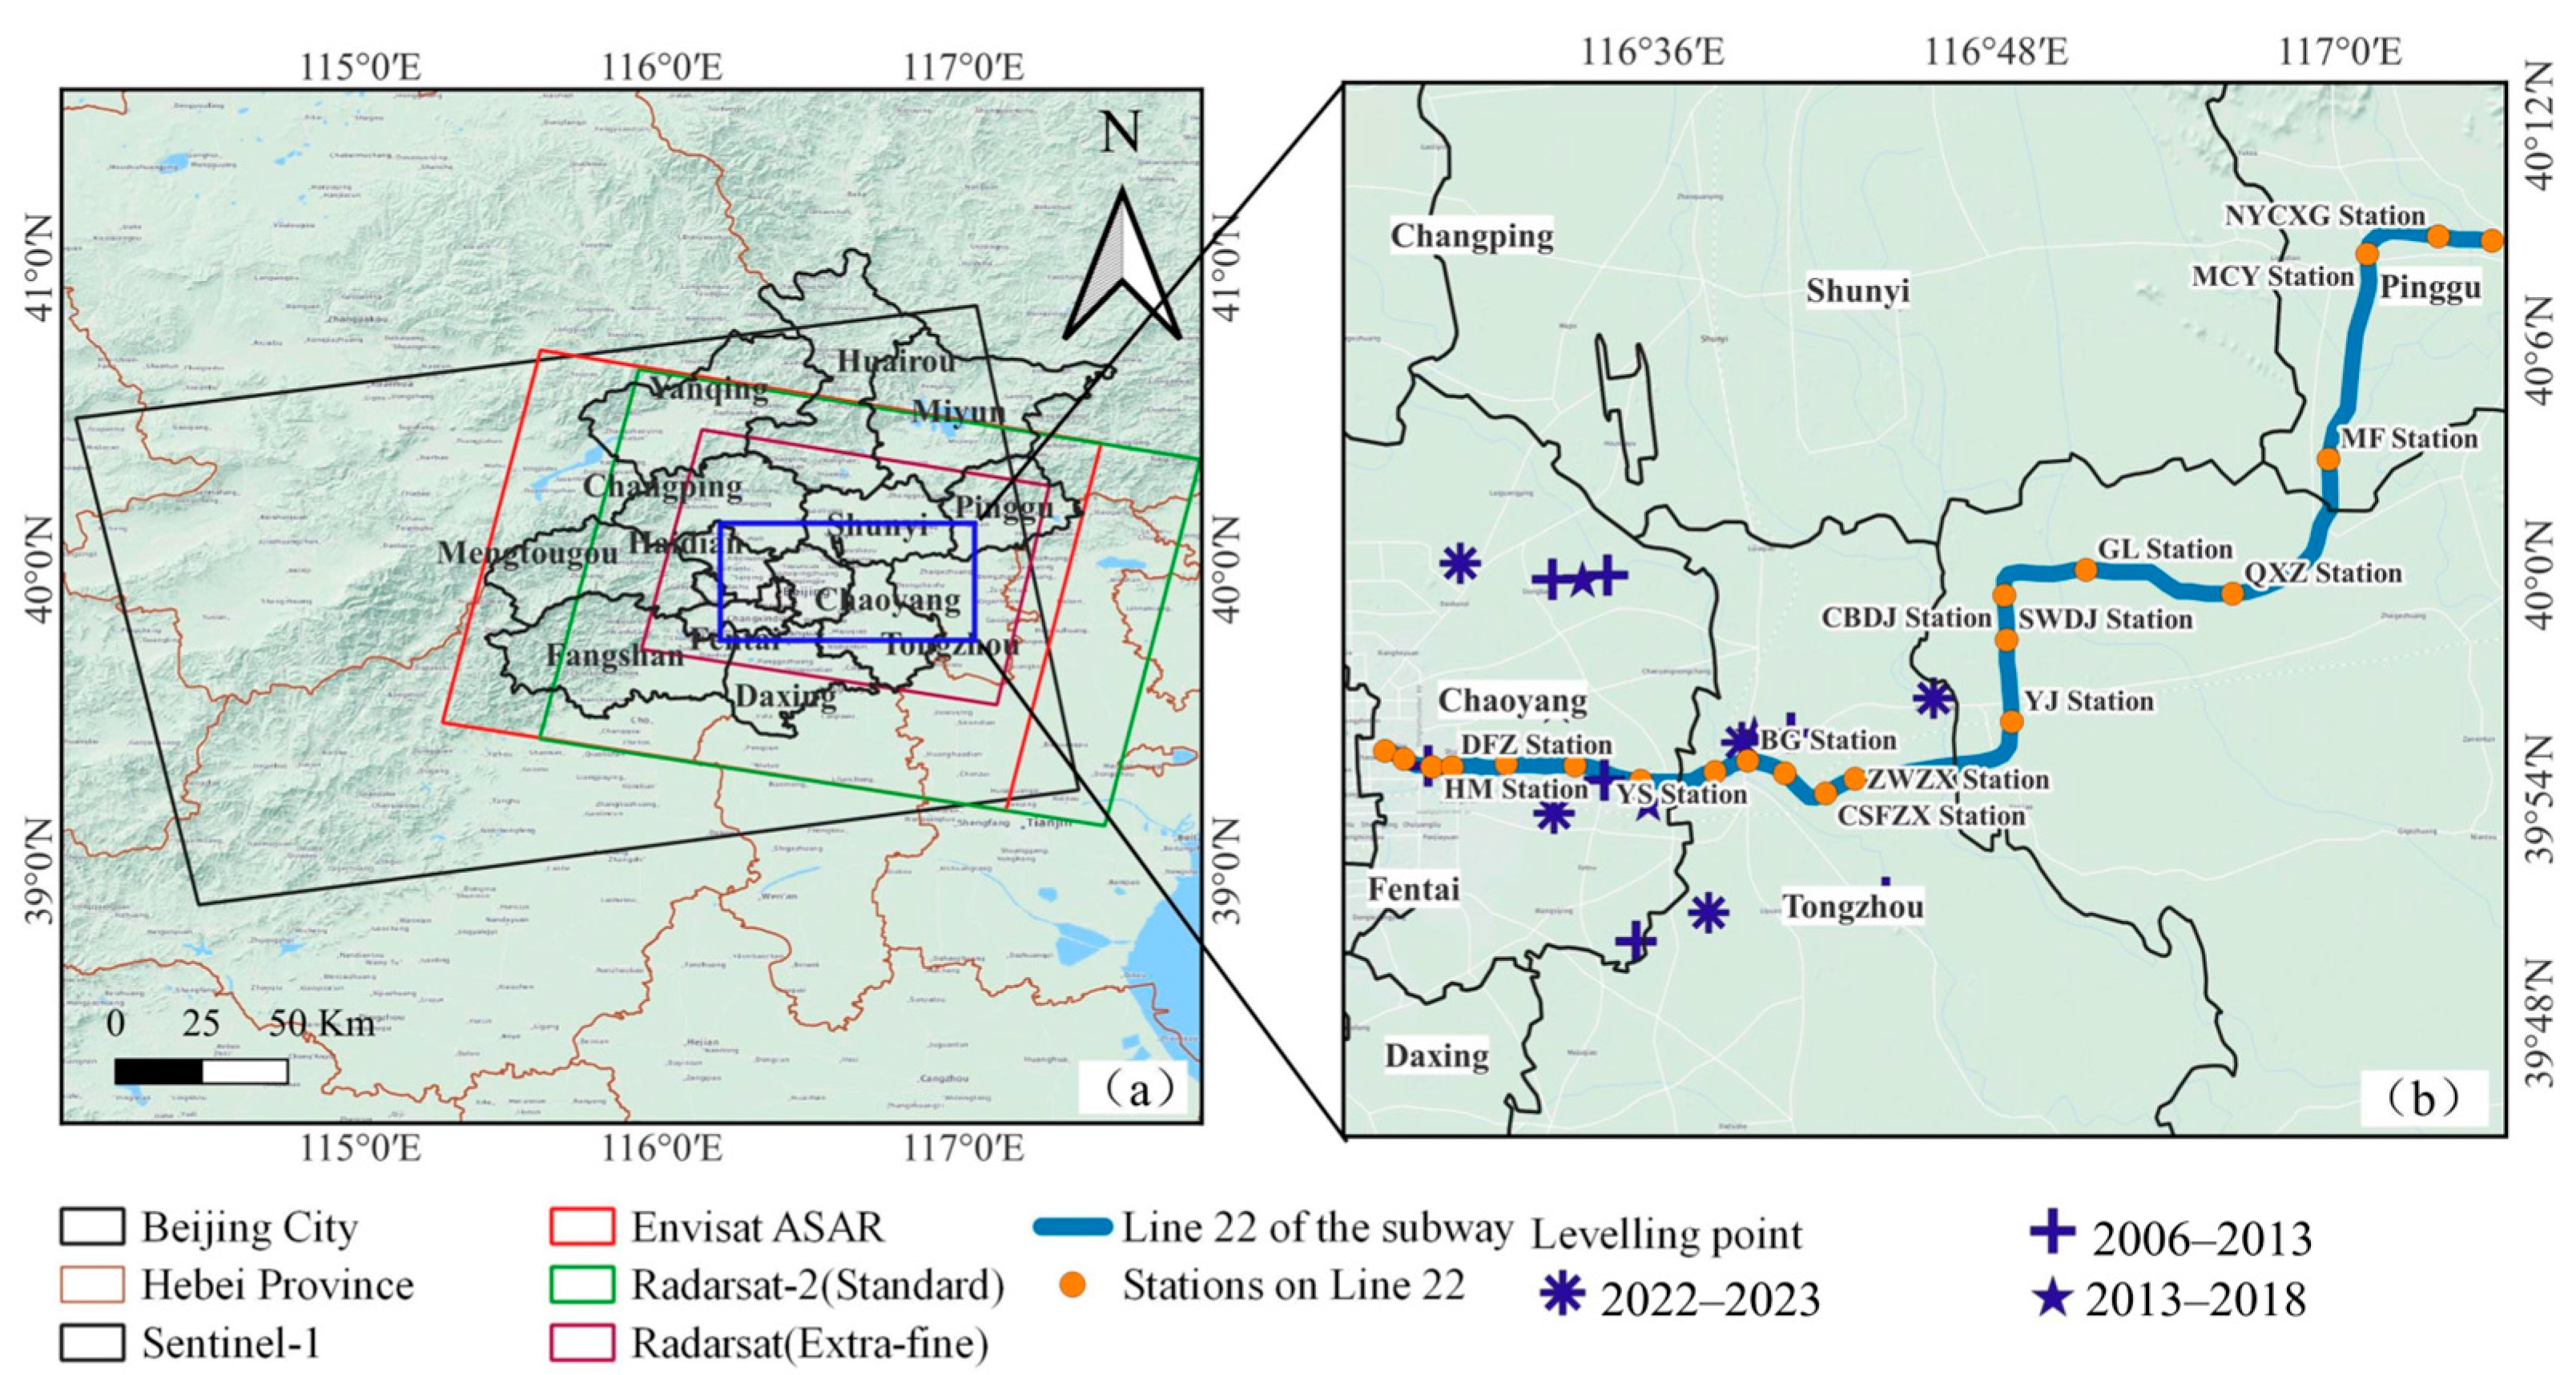
2.1. Study Area

The Beijing Plain is located in the northern part of the North China Plain (Figure 1a). The terrain is high in the northwest and low in the southeast, with an average slope of 1‰, and it is a typical piedmont alluvial plain. This paper selects the area along the Beijing Metro Line 22 located in the middle and eastern part of the Beijing Plain as the research object (Figure 1b). The subway line runs across Chaoyang District, Tongzhou District, and Pinggu District of Beijing, as well as Sanhe City of Hebei Province. Beijing Metro Line 22 has a total of 22 stations, among which there are 19 underground stations and 3 elevated stations (located from Qixinzhuang to Machangying). The total length of the line is about 82 km, of which the underground line is about 55 km and the elevated line is about 27 km. The geological conditions along the corridor demonstrate significant regional heterogeneity. The geological conditions along the corridor demonstrate significant regional heterogeneity. The stratigraphy predominantly consists of Quaternary unconsolidated sediments, lithologically characterized by alternating clay and medium-fine sand interbeds. Groundwater resources are primarily stored within Quaternary aquifers at depths of up to 300 m. Regional tectonic stability in Chaoyang and Tongzhou districts is generally favorable, with localized development of buried faults or structural weak zones. In contrast, the Sanhe City (Hebei Province) and Pinggu District (Beijing) segments are situated within the transitional zone between the Yanshan Fault-Fold Belt and the North China Plain Depression Zone, exhibiting relatively enhanced tectonic activity [28].

2.2. Datasets

This study utilizes Envisat ASAR, Radarsat-2, and Sentinel-1A data to monitor land subsidence along Beijing Metro Line 22 from 2004 to November 2024. The dataset includes 51 Envisat ASAR (Image mode, 30 m resolution) scenes, 37 Radarsat-2 (Standard mode, 30 m resolution) scenes, 43 Radarsat-2 (Extra-fine mode, 5 m resolution) scenes, and 60 Sentinel-1 images. The coverage of these images is illustrated in Figure 1, with specific parameters provided in Table 1.
During the InSAR data processing, SRTM-DEM data with a spatial resolution of 30 m, which are publicly available from NASA (http://srtm.csi.cgiar.org/srtmdata/ accessed on 1 May 2024), are used to eliminate the influence of topographic effects. Precise orbit data released by ESA (https://sentinels.copernicus.eu/ accessed on 1 May 2024) are adopted for orbit correction. Hydrological data are obtained from the Beijing Hydrological General Station.

3. Methodology

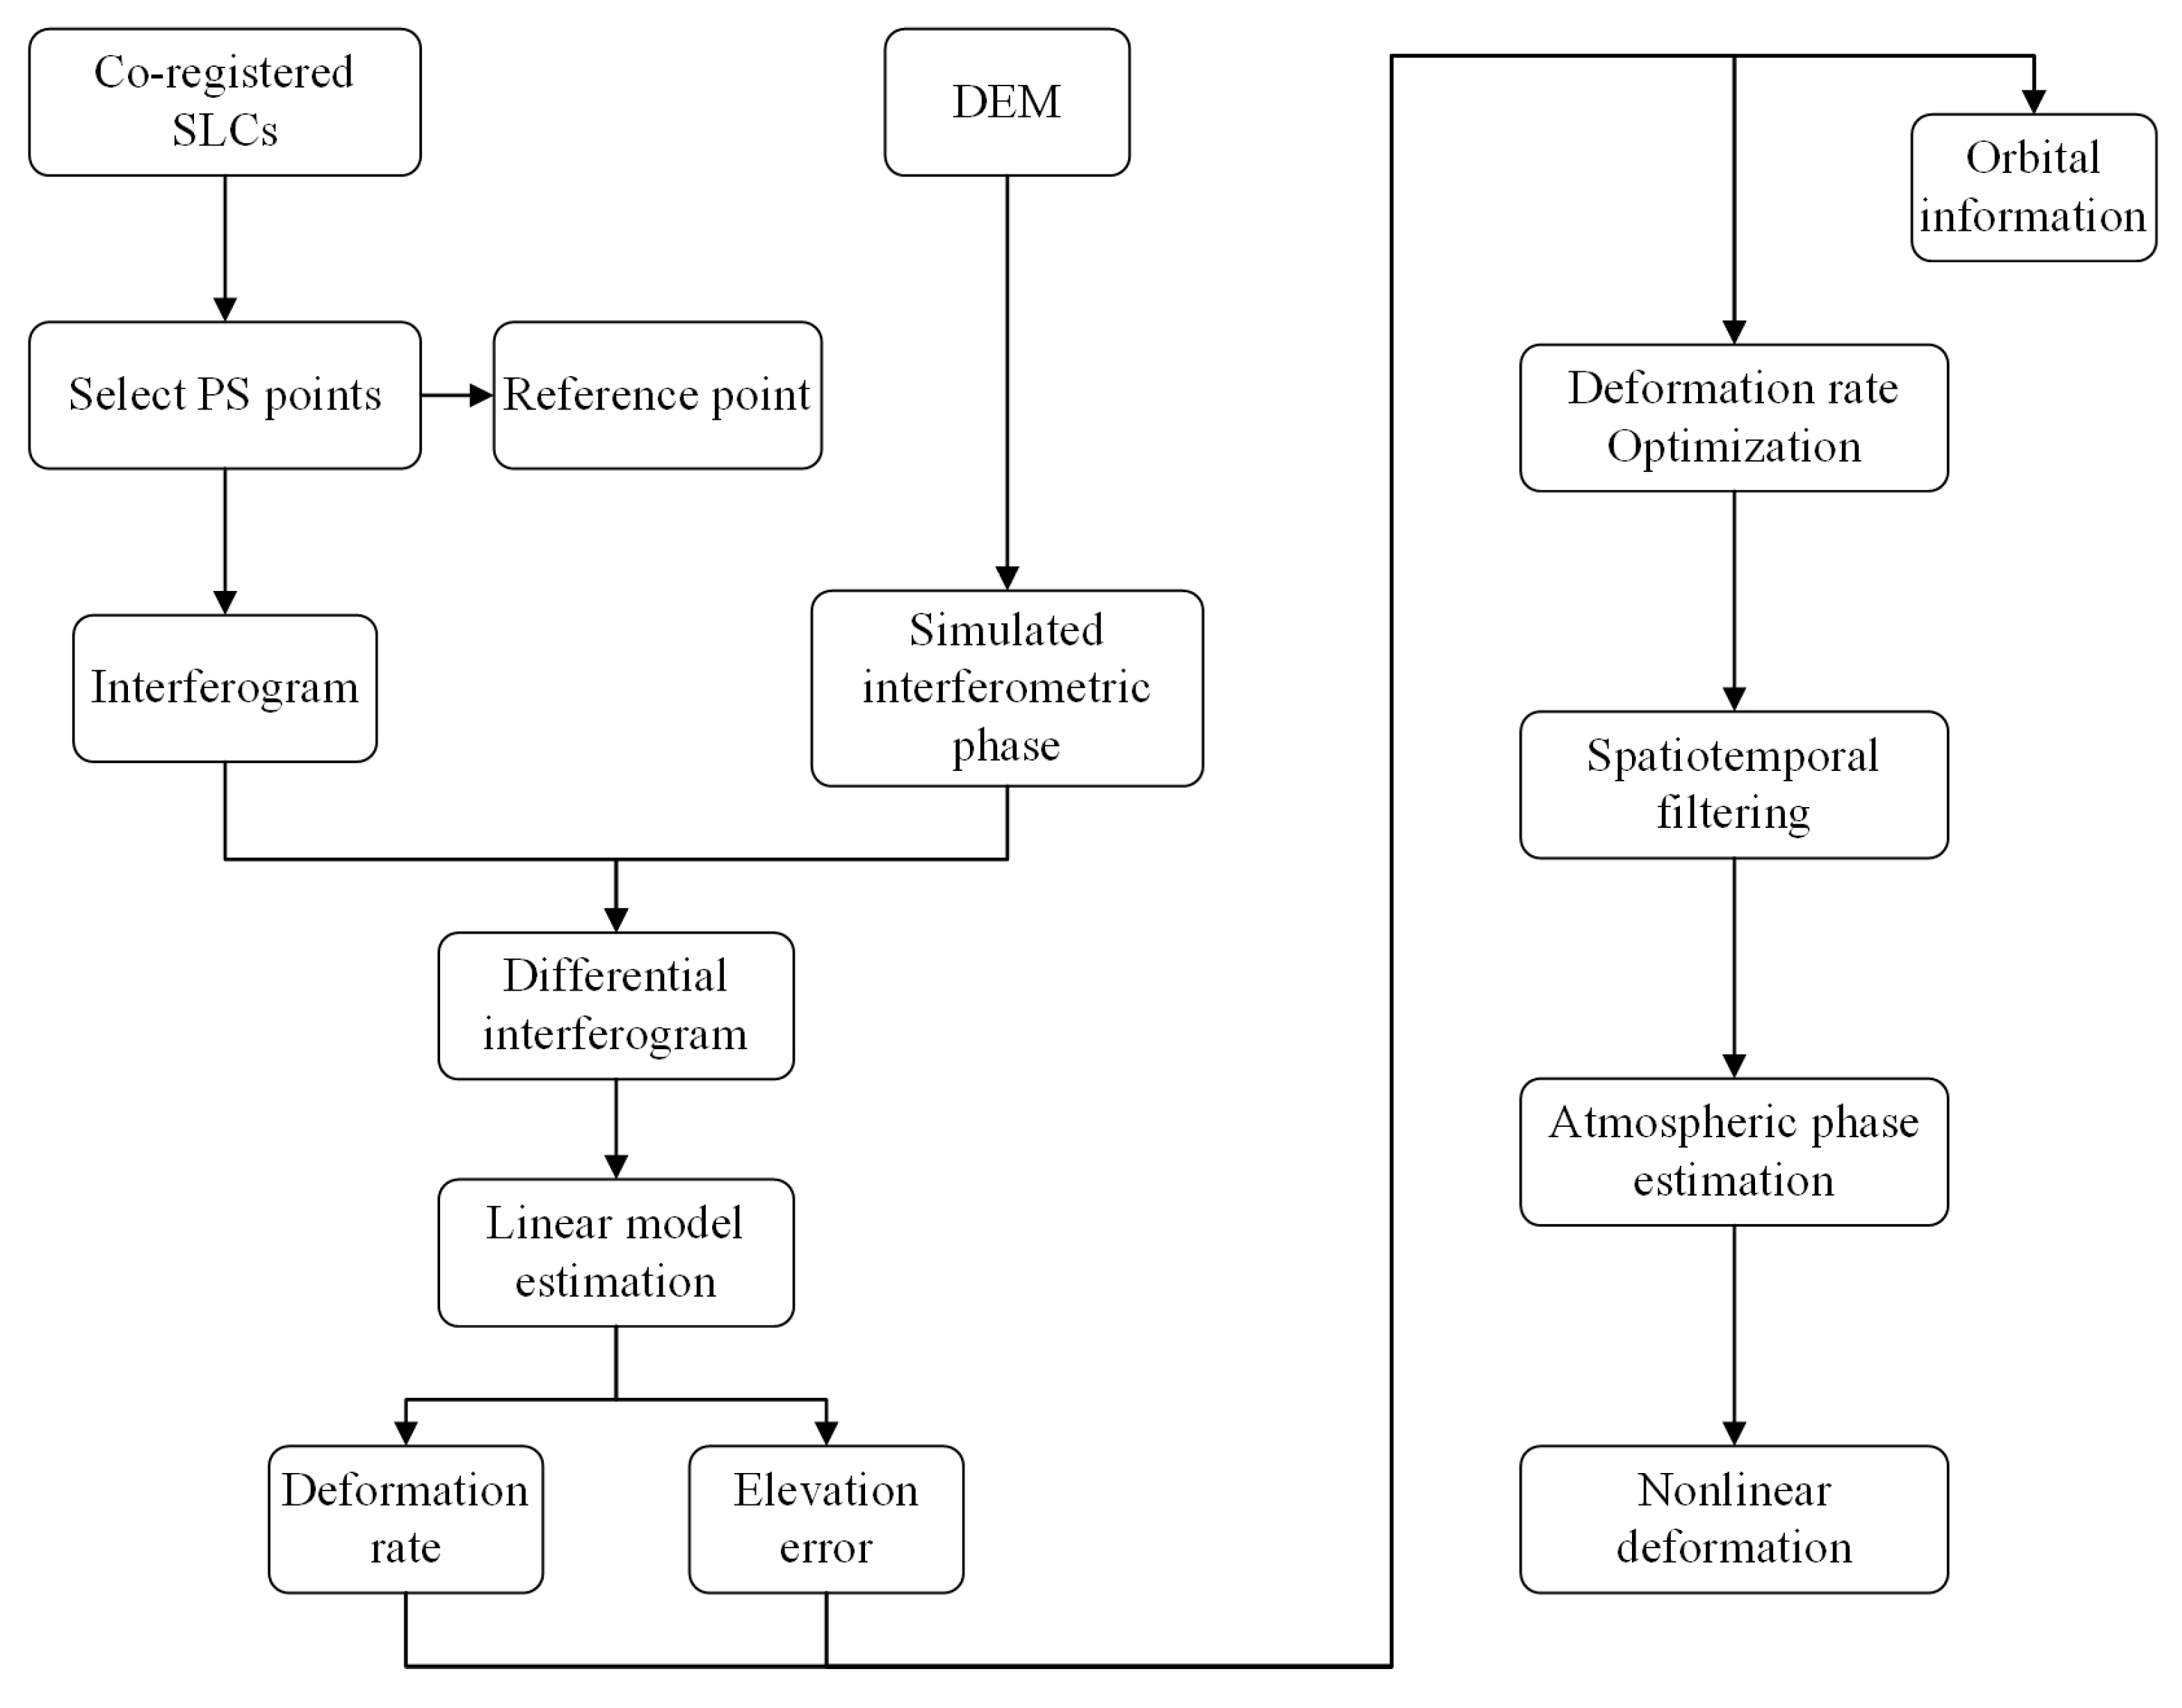
3.1. PS-InSAR Method

In this study, GAMMA/IPTA software (GAMMA 2017) is used to process Envisat ASAR, Radarsat-2 (Standard and Extra-fine mode), and Sentinel-1 data using the PS-InSAR method. In this study, a non-linear deformation model is adopted (Figure 2) [29].
φ d i f f = w r a p ( 4 π λ T Δ v + 4 π λ B R sin θ Δ h + φ n l + Δ φ b a s e _ e r r o r + Δ φ a t m + Δ φ n o i s e )
φ d i f f   is the differential interferometric phase, λ is the wavelength, T is the temporal baseline, Δ v is the Linear Deformation Rate, B   is the Perpendicular Baseline, R is the slant range, θ is the incident angle, Δ h is the residual height, φ n l is the Non-linear Deformation Phase, Δ φ b a s e _ e r r o r is the Baseline Error-Induced Phase, Δ φ a t m is the atmospheric phase, and Δ φ n o i s e is the noise.
Take the process of handling Sentinel-1 data dataset as an example. First, select the master image based on the spatio-temporal baseline distribution and Doppler centroid frequency difference, then co-register all slave images to the master image coordinate system to generate interferometric pairs. Subsequently, high-coherence permanent scatterers (PS points) are extracted using the amplitude dispersion index method (threshold < 0.3). Combined with an external digital elevation model (DEM), the topographic and flat-earth phases are simulated, and differential interferometric processing is performed to eliminate terrain and reference surface effects, resulting in differential interferograms. On this basis, a linear deformation model is constructed to estimate the deformation phase and residual elevation components (PS points with a correlation threshold ≥ 0.75 are retained), while precise orbital data are introduced to optimize baseline parameters. The minimum cost flow algorithm is further employed to complete phase unwrapping, and cascaded filtering (spatial low-pass filtering and temporal high-pass filtering) is applied to separate atmospheric delay phases and suppress atmospheric noise. Finally, linear and non-linear deformation components are integrated to generate line-of-sight (LOS) deformation time series. The results are geocoded into the WGS-84 coordinate system to output vertical deformation rate maps and time series results [30].
d v = d L O S c o s θ
where d v is the vertical displacement (mm), d L O S is the line-of-sight (LOS) displacement (mm), and θ is the incidence angle. The coordinates of the reference point during InSAR deformation calculation are 119°39′24″ E and 29°9’14″ N.

3.2. Timing Result Stitching Method

The SAR images used in this study consist of three data types (Table 1) with time intervals between them, necessitating the fusion of PS-InSAR processing results in a time series. Using the monitoring results from Envisat ASAR as a reference, the nearest-neighbor method is applied to identify corresponding points in the Radarsat-2 and Sentinel-1 datasets [3]. The deformation occurring during the time intervals is then calculated, and the deformation amounts monitored in the four stages are accumulated with those of the two time intervals. This process ultimately yields a long-term deformation sequence spanning from 2004 to 2024.

3.3. PDL Method

This study employs the Polynomial Distributed Lag (PDL) model to calculate the lag period of seasonal deformation responses to groundwater level fluctuations [31]. The PDL model assumes a maximum lag order k and a polynomial order p. The formulation of the PDL model [32] is expressed as
Y t = α + i = 0 k β i X t i + ϵ t
Y t represents the deformation of time t; α is the intercept term, representing the reference deformation value when all lag terms are zero; X t i is the value of the independent variable during the lag period i; β i is the regression coefficient with a lag of period i; ϵ t is the random error term. Specifically, the lag coefficient β i is constrained as a polynomial function of the lag order i. Among them, a 0 , a 1 , , a p is the coefficient of the polynomial.
β i = a 0 + a 1 i + a 2 i 2 + + a p i p

4. Results

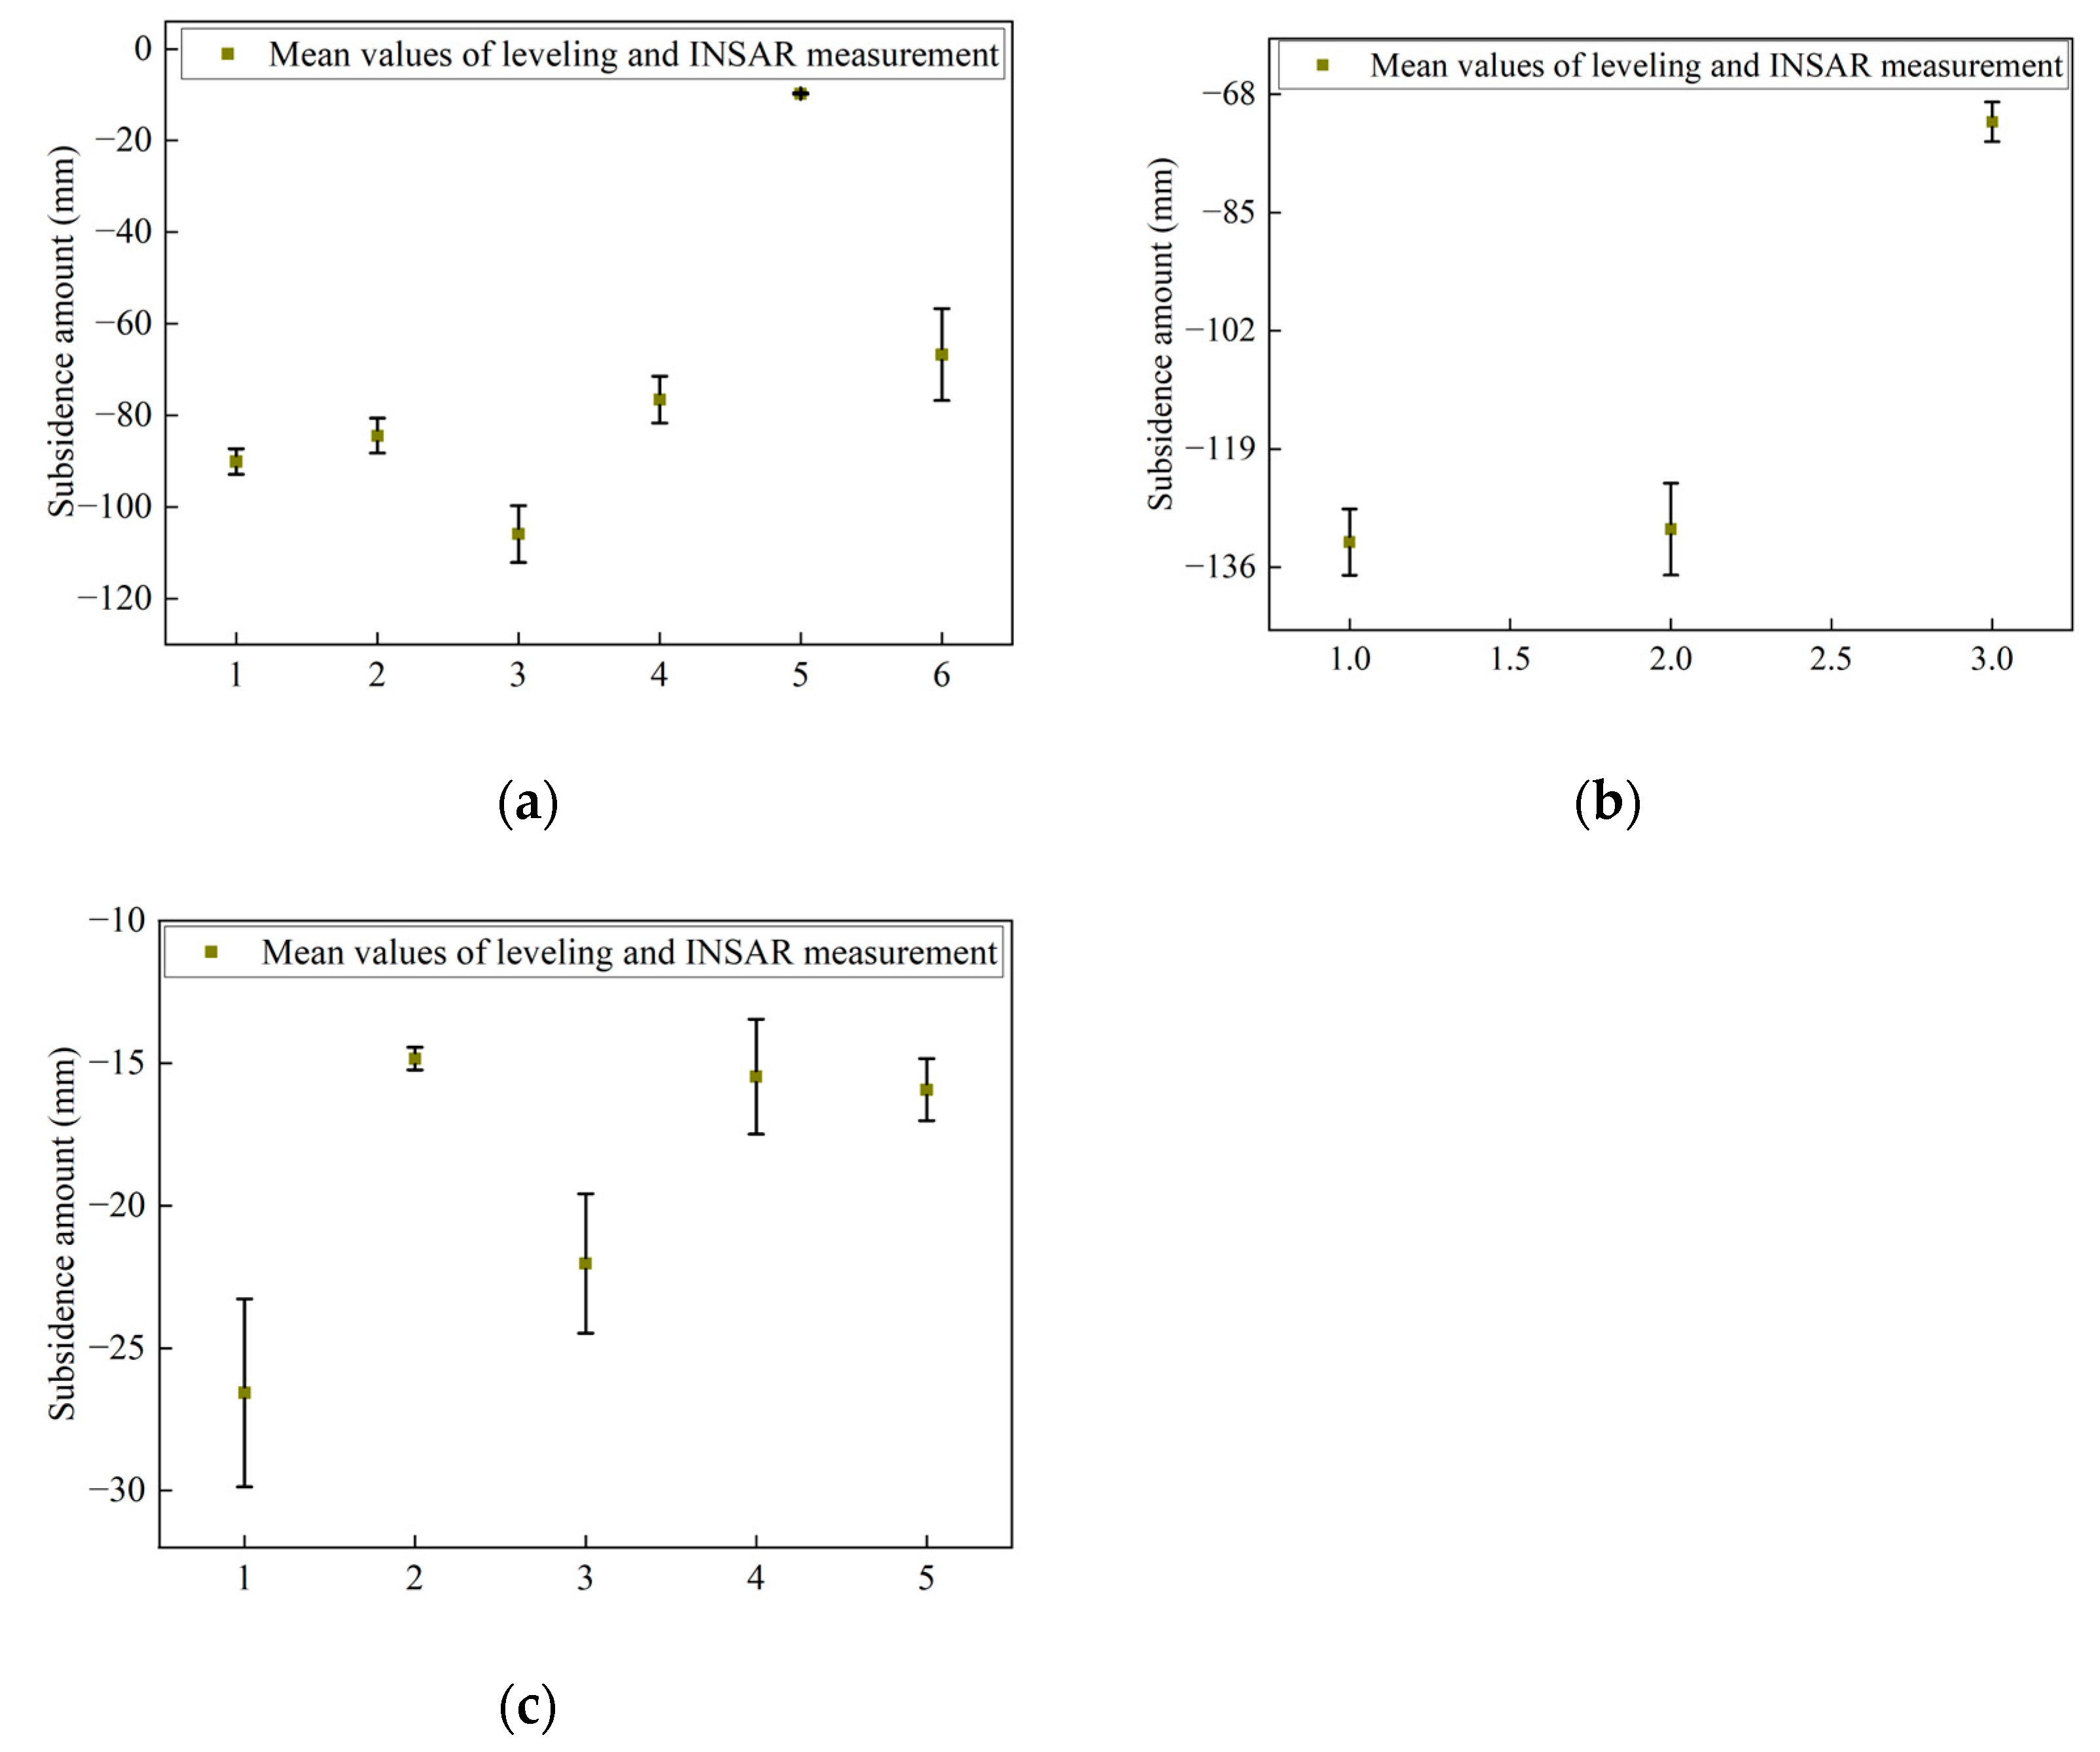
4.1. PS-InSAR and Verification Results

The PS-InSAR monitoring results are presented in Figure 3, illustrating significant spatial variations in land subsidence across the eastern Beijing Plain. Multiple subsidence funnels are interconnected, exhibiting pronounced unevenness. Four major subsidence funnel areas of varying sizes have been identified within the study area, located near A (Xicun, Chaoyang District), B (Dongliu Village, Chaoyang District), C (Xituo Village, Tongzhou District), and D (Yanjiao Town, Sanhe City). The subsidence areas exhibit a funnel-shaped morphology, with Beijing Subway Line 22 running along the edges of these four subsidence funnels.
To validate the accuracy of PS-InSAR, this study selected five leveling points from 2006 to 2013, three from 2013 to 2018, and five from 2022 to 2023. The leveling data were compared with the average PS-InSAR monitoring results within a 100 m buffer zone around each point. As shown in Figure 4, the maximum root means square errors (RMSEs) obtained were 10.04 mm, 6.61 mm, and 3.29 mm, respectively, with corresponding linear regression correlation coefficients of 0.98, 0.94, and 0.95. These results demonstrate that the PS-InSAR monitoring outcomes are highly accurate and meet the required precision standards.

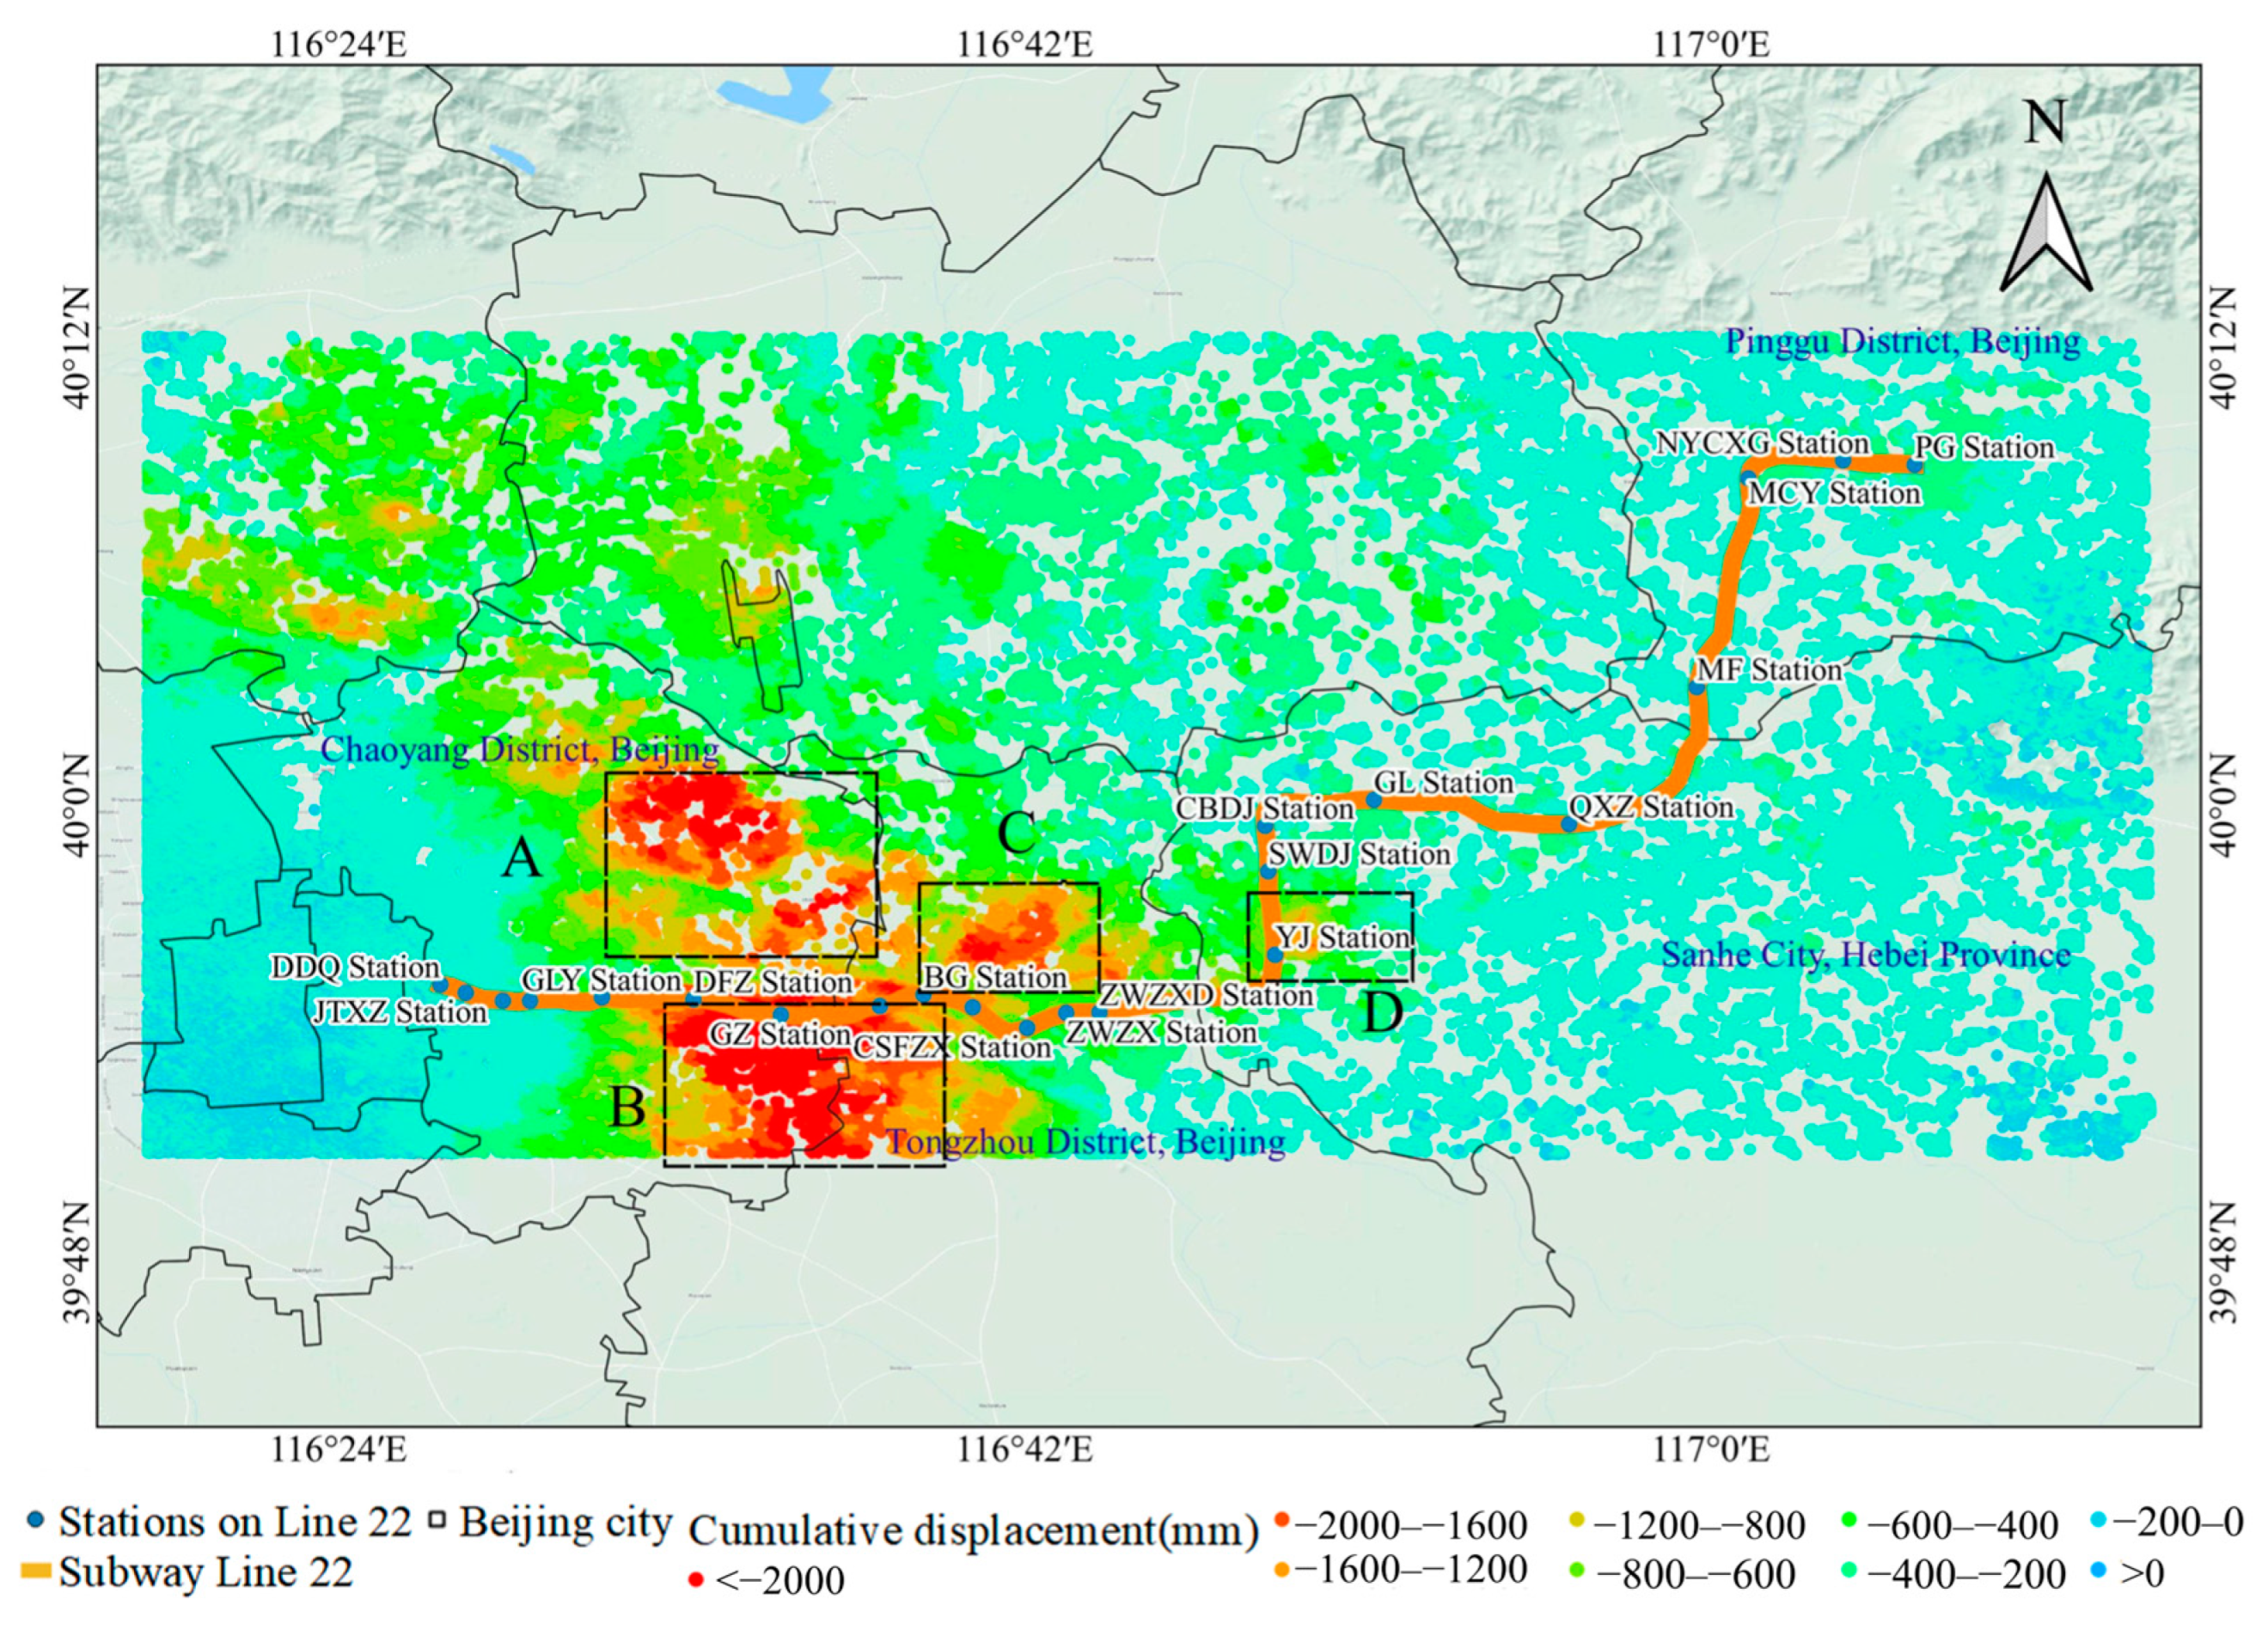
4.2. Spatial Distribution Characteristics of Land Subsidence in Areas Along the Subway Line

Relevant research indicates that the influence range of land subsidence on areas along the subway line is less than 2 km [21,25,26]. In this study, a 2 km buffer zone on each side of Beijing Subway Line 22 was selected to analyze the spatio-temporal distribution characteristics of land subsidence. A total of 74,192 PS points were identified along the subway line. As shown in Figure 5 and Figure 6, significant spatial differences in land subsidence are observed. The sections from Ganluyuan (GLY) Station to Beiguan (BG) Station (Guanzhuang section) and from Yanjiao (YJ) Station to Shenwei Avenue (SWDJ) Station (Yanjiao section) exhibit relatively severe subsidence. The maximum cumulative subsidence along the Guanzhuang section reaches 2457 mm, located southwest of Guanzhuang (GZ) Station, while the maximum cumulative subsidence along the Yanjiao section is 1371 mm, located northeast of YJStation.
Land subsidence along Subway Line 22 began in 2004, with a significant spatial expansion and a trend of continuous intensification. The Guanzhuang section exhibits the fastest subsidence development, with the subsidence funnel initially centered around (GZ) Station and continuously expanding. In contrast, subsidence in the Yanjiao section is more concentrated, with the subsidence center near the southeast of (YJ) Station. While the subsidence development trend in the Yanjiao section is similar to that of the Guanzhuangsection, it began 2–3 years later, and the spatial expansion of the subsidence funnel is notably smaller. After 2016, the expansion of subsidence along Subway Line 22 gradually slowed. By around 2020, a noticeable ground rebound phenomenon emerged, particularly along the section from Machangying (MCY) Station to Pinggu (PG) Station.

5. Analysis

5.1. Changes in Groundwater Level

Due to the limited availability of underground water level monitoring data within the buffer zone along the subway line, this study analyzes groundwater data collected from January 2018 to December 2021. Table 2 presents the details of the groundwater monitoring stations.
Figure 7 shows that the trends in subsidence changes identified in this study closely align with groundwater level fluctuations. By analyzing the inflection points of both curves, we observe that when the groundwater level trend shifts, the land subsidence trend soon follows a similar pattern. Numerous previous studies have demonstrated that both groundwater and land subsidence exhibit seasonal fluctuation characteristics, with land subsidence typically lagging behind groundwater level variations by a certain period [33,34,35].
To further examine the correlation between groundwater levels and land subsidence, this study applies the PDL model to assess their relationship. The model adopts the current-period (t) land subsidence deformation as the response variable, while incorporating both current and historical confined groundwater level data (t-n) to construct predictive variable sets. The optimal lag period and association strength are determined through the maximum correlation coefficient criterion [36,37,38]. Considering annual cyclical characteristics, this research adopts an annual modeling strategy: establishing 50 m buffer zones centered on monitoring wells to screen ground subsidence monitoring points with significant seasonal features, followed by annual parameter fitting to achieve quantitative analysis of groundwater level variation-subsidence response. Notably, the temporal fitting gap period derived from the model output corresponds to the actual time lag between land subsidence and groundwater level changes. The results indicate a strong correlation between the PDL fitting values and the subsidence amounts. As shown in Figure 7, The segmented fitting determination coefficients for the three monitoring points range from 0.67 to 0.97, with lag periods predominantly ranging from 2 to 4 months. These findings clearly demonstrate that land subsidence is directly influenced by changes in groundwater levels. The evolutionary process of land subsidence is fundamentally a spatial–temporal representation of subsurface soil compression, where the degree of compression development is mechanistically controlled by effective stress variations resulting from groundwater fluctuations [35,38]. Based on the effective stress principle [39] a dynamic equilibrium exists between the effective stress borne by the soil skeleton and pore water pressure: groundwater level decline reduces pore water pressure, generating incremental effective stress that drives particle rearrangement and compressive deformation, ultimately triggering land subsidence [11,40]. Conversely, groundwater recovery restores pore water pressure to weaken effective stress, thereby suppressing subsidence trends or inducing rebound. Notably, soil deformation exhibits significant hysteresis relative to groundwater fluctuations [34]. This time-lag characteristic originates from soil rheological properties—during aquifer depletion, soil compression develops non-instantaneously, with its progression rate controlled by permeability, compression modulus, and other parameters, demonstrating non-linear relationships with both the rate and magnitude of water level decline. More complex is the rebound response during water level recovery, which not only manifests prolonged hysteresis but also yields smaller rebound magnitudes compared to historical subsidence. This disparity primarily stems from irreversible plastic deformation and structural reorganization of soil particles during prolonged compression [41]. A rise in groundwater level gradually reduces the rate of change in subsidence along the subway line, and regional differences in groundwater recovery rates play a key role in controlling the subsidence distribution pattern along the subway line.

5.2. Distribution of Fault Zones

The area along Subway Line 22 is characterized by several active high-angle faults, including the Shunyi-Liangxiang Fault, Nanyuan-Tongxian Fault, Nankou-Sunhe Fault, and Xiadian Fault, accompanied by several subsidiary fractures [13]. These faults can disrupt the sedimentation process, causing variations in the thickness of Quaternary sedimentary layers. These differences in layer thickness create favorable geological conditions that can lead to uneven land subsidence [42,43,44]. Moreover, certain fault zones may constrain horizontal homogeneous seepage and migration of groundwater, thereby exacerbating differential surface rebound across fault boundaries [42,43,44].
Considering the long time span of cumulative subsidence from 2004 to November 2024, which reduces the focus on recent land subsidence trends, this study analyzes the subsidence data from 2020 to November 2024 to capture the more recent characteristics of subsidence. As shown in Figure 8, the subsidence situation along the subway line has improved significantly in the past four years. The large subsidence funnels have shrunk considerably and dispersed into multiple smaller subsidence areas, with most of these areas located near the fault zones. Notably, the Xiadian Fault (I) and subsidiary Fault II in the SWDJ Station-Chaobai Avenue (CBDJ) Station segment exhibit particularly prominent control over surface deformation.
For quantitative analysis of surface responses to fault activity, 100 m buffer zones were established along fault strikes. Bivariate boxplot statistical method (Figure 8b,c) reveals deformation disparities across fault boundaries. The results demonstrate that the Xiadian Fault (I) displays antithetic deformation patterns, with predominant uplift in its western block (hanging wall, median 5–10 mm) versus subsidence in the eastern block (footwall, median −10–0 mm). Subsidiary Fault II shows 80 mm greater subsidence center values in its western block compared to the eastern counterpart. These observations confirm that strongly active fault zones exert significant control over differential subsidence along the metro corridor.

5.3. Subway Construction

During subway construction, the excavation of underground soil can lead to rapid ground displacement around the subway in a short period. This uneven and non-linear land subsidence often results in more severe hazards, impacting both the surrounding environment and infrastructure [9,45,46]. Therefore, analyzing the time-series displacement changes during the subway construction process is crucial to understanding and mitigating potential risks associated with land subsidence.
A 150 m buffer zone is established along the subway line to explore the impact of subway construction on land subsidence and better understand the spatial extent of its effects [46,47]. A total of 5117 monitoring points are located within the 150 m buffer zone. As shown in Figure 9, during the period from 2017 to 2020, before subway construction, the number of PS monitoring points with a deformation rate greater than 0 mm/year increased from 887 to 2561, with the proportion of the total rising from 17.31% to 50.04%, demonstrating a significant trend of surface rebound overall.
After 2020, with the start of construction on all sections of Line 22, the ground rebound trend of most monitoring points stabilized or shifted back to continuous subsidence in the following periods. By the end of 2023, the number of PS monitoring points with a deformation rate greater than 0 mm/year decreased to 1753, representing 34.23% of the total, down from 50.04% before construction in 2020. Simultaneously, the percentage points of PS monitoring points with a deformation rate less than 0 mm/year, particularly those with a subsidence rate ranging from 0 to 20 mm/year, increased significantly. Between 2020 and 2023, this group’s proportion of the total rose by 15.74%, indicating a pronounced subsidence trend overall.
Since the full-line construction of the subway, the number of ground-rebound monitoring points within the buffer zone has significantly decreased, while the number of land-subsidence points has increased notably. Among these, the largest number of monitoring points fall within the subsidence rate range of 0 to 40 mm/year. This clearly indicates that subway construction can exacerbate land subsidence and affect ground-subsidence rebound. However, the spatial distribution of land subsidence does not show a strong correlation with the distribution of subway lines, and its overall contribution to land subsidence is smaller than that of groundwater levels and fault zones.

5.4. Changes in Urban Construction

As shown in Figure 7a, against the backdrop of the positive impact of water diversion projects, such as the South-to-North Water Diversion Project, on land subsidence in the Beijing Plain, the land subsidence situation along the subway line has significantly improved from 2020 to November 2024. A large-scale surface uplift area is present along the Pinggu (located from QXZ Sation to PG Sation) section of the subway, with the maximum uplift reaching 68.12 mm, located on the southeast side of the Agricultural Innovation Port (NYCXG) Station. The distribution of subsidence funnels along the Guanzhuang section shows a noticeable scattered trend. In contrast, land subsidence along the Yanjiao section remains relatively significant (Figure 10). The maximum subsidence in the past four years is 294 mm, located near the power plant, about 300 m southeast of YJ Station. Affected by this subsidence funnel, there is a significant difference in subsidence between the east and west sides of the subway line from YJ Station to SWDJ Station. The Yanjiao Metro Section is situated within the Economic and Technological Development Zone. Although urban construction in this area continues to advance, the primary driver of land subsidence is not horizontal spatial expansion—the horizontal urban sprawl in Yanjiao has stabilized in recent years (Figure 5). Field investigations and optical remote sensing analyses reveal that urban spatial development now predominantly manifests through vertical extension (high-rise construction) and progressive increases in building cluster density within specific zones (Figure 10 and Figure 11). This shift in development patterns has directly resulted in distinct ground deformation characteristics around YJ Station: compared to other sections along the metro line, the significantly higher density of high-rise construction activities in this area has created differentiated ground rebound effects [48,49,50]. According to the principle of effective stress [39], high-rise building complexes continuously diminish the rebound potential of soil by reducing the recovery capacity of pore water pressure, thereby inducing sustained ground deformation. Furthermore, the load intensity of high-density buildings can trigger secondary consolidation effects, which in turn drive the continuous development of ground subsidence [48]. This phenomenon indicates that the expansion of vertical urban construction has become a key driving factor affecting the surface deformation along the Yanjiao Metro Section.

6. Conclusions

This study thoroughly analyzes the spatio-temporal subsidence characteristics and the genetic mechanisms behind the differential distribution of subsidence and rebound within the 2 km buffer zone along Beijing Subway Line 22. From 2004 to November 2024, two areas along the subway line experienced severe land subsidence, with significant spatio-temporal differences. The maximum cumulative subsidence along the Guanzhuang section, which experienced subsidence earlier, reached 2457 mm in the southwest area of GZ Station. The maximum cumulative subsidence along the Yanjiao, which subsided later, reached 1371 mm in the northeast area of YJ Station. After 2016, the rate of cumulative subsidence along the subway line gradually slowed. By around 2020, most areas along the line showed a clear trend of land subsidence rebound.
The significant spatio-temporal differentiation characteristics of surface deformation along Beijing Subway Line 22 result from the spatio-temporal coupling of confined hydrodynamic conditions, geological structural features, and the intensity of human activities. The recovery of the water level in the confined aquifer dominates the transformation of the overall deformation trend via the pore elastic effect. This recovery-induced increase in pore water pressure prompts most areas to exhibit a trend of deceleration or rebound in settlement. The notable regional rebound observed in the Pinggu section and the contraction of the settlement funnel in the Guanzhuang section jointly confirm the buffering and regulating role of groundwater system restoration on ground settlement. However, the amplitude of rebound is constrained by the geological conditions of the low-permeability clay layer. Under the synergistic influence of the hydraulic barrier effect of fault zones and variations in the sedimentary thickness of the Quaternary system, tectonic activity zones form continuous deformation anomaly regions. Notably, the Xiadian fault zone near stations QXZ and MF is representative. Its residual deformation characteristics confirm the rigid control exerted by the fault tectonic system on the deformation field. The primary mechanism driving continuous settlement in the Yanjiao section of the subway manifests as the spatio-temporal cumulative effect of building loads. High-rise building complexes continuously offset the soil rebound potential energy caused by pore water pressure recovery through the principle of effective stress, leading to localized and regional continuous settlement. The engineering disturbances caused by subway construction contribute to land subsidence, but compared to factors like excessive groundwater extraction, fault distribution, and increased building loads, its impact intensity and scope are relatively minimal.
Moving forward, it is crucial to prioritize subsidence monitoring along the Yanjiao section of the subway during its operation. Additionally, in future subway construction and urban planning, a comprehensive consideration of the mentioned factors is essential to mitigate the risks posed by land subsidence to subway operations.

Author Contributions

Writing—review and editing, F.G. and M.L.; methodology, F.G. and M.L.; software, F.G. and F.W.; resources, X.L., L.G. and K.Z.; data curation, X.L. and J.J.; writing—original draft preparation, F.G. and L.W.; visualization, F.G. and H.L. All authors have read and agreed to the published version of the manuscript.

Funding

This research was funded by the National Natural Science Foundation of China, grant number No. 42271487 and No. 42401088/D010702; the National Innovation and Entrepreneurship Training Program for College Students in 2024, grant number No. 202411775001; the Self-funded Project of Scientific Research and Development Plan of Langfang Science and Technology Bureau in 2023, grant number No. 2023011055; the Science for Earthquake Resilience, grant number No. XH254404A.

Data Availability Statement

The authors do not have permission to share data.

Acknowledgments

Special thanks to Li Junjie of Beijing University of Posts and Telecommunications for teaching the scientific research software used in this paper and cultivating scientific research thinking; we thank the European Space Agency (ESA) for providing the Sentinel-1 datasets under the framework of the Sino-EU Dragon Project (No. 59332). We thank the National Aeronautics and Space Administration (NASA) for providing the SRTM product. We thank the China Institute of Geo-environmental Monitoring for sharing the monitoring data of groundwater wells.

Conflicts of Interest

The authors declare no conflicts of interest.

References

  1. Gong, H.; Pan, Y.; Zheng, L.; Li, X.; Zhu, L.; Zhang, C.; Huang, Z.; Li, Z.; Wang, H.; Zhou, C. Long-term groundwater storage changes and land subsidence development in the North China Plain (1971–2015). Hydrogeol. J. 2018, 26, 1417–1427. [Google Scholar] [CrossRef]
  2. Xu, X.; Zhou, C.; Gong, H.; Chen, B.; Wang, L. Monitoring and Analysis of Land Subsidence in Cangzhou Based on Small Baseline Subsets Interferometric Point Target Analysis Technology. Land 2023, 12, 2114. [Google Scholar] [CrossRef]
  3. Lyu, M.; Li, X.; Ke, Y.; Jiang, J.; Sun, Z.; Zhu, L.; Guo, L.; Xu, Z.; Tang, P.; Gong, H.; et al. Nonlinear Evolutionary Pattern Recognition of Land Subsidence in the Beijing Plain. Remote Sens. 2024, 16, 2829. [Google Scholar] [CrossRef]
  4. Bai, Z.; Wang, Y.; Balz, T. Beijing Land Subsidence Revealed Using PS-InSAR with Long Time Series TerraSAR-X SAR Data. Remote Sens. 2022, 14, 2529. [Google Scholar] [CrossRef]
  5. Cao, Q.; Zhang, Y.; Yang, L.; Chen, J.; Hou, C. Unveiling the driving factors of urban land subsidence in Beijing, China. Sci. Total Environ. 2024, 916, 170134. [Google Scholar] [CrossRef] [PubMed]
  6. Duan, G.; Gong, H.; Chen, B.; Li, X.; Pan, X.; Shi, M.; Zhang, H. Spatiotemporal heterogeneity of land subsidence in Beijing. Sci. Rep. 2022, 12, 15120. [Google Scholar] [CrossRef]
  7. Lai, S.; Lin, J.; Dong, J.; Wu, J.; Huang, X.; Liao, M. Investigating overlapping deformation patterns of the Beijing Plain by independent component analysis of InSAR observations. Int. J. Appl. Earth Obs. Geoinf. 2024, 135, 104279. [Google Scholar] [CrossRef]
  8. Minh, D.H.T.; Hanssen, R.; Rocca, F. Radar Interferometry: 20 Years of Development in Time Series Techniques and Future Perspectives. Remote Sens. 2020, 12, 1364. [Google Scholar] [CrossRef]
  9. Camós, C.; Molins, C. 3D analytical prediction of building damage due to ground subsidence produced by tunneling. Tunn. Undergr. Space Technol. 2015, 50, 424–437. [Google Scholar] [CrossRef]
  10. Yuan, C.; Zhang, M.; Ji, S.; Li, J.; Jin, L. Analysis of factors influencing surface settlement during shield construction of a double-line tunnel in a mudstone area. Sci. Rep. 2022, 12, 22606. [Google Scholar] [CrossRef]
  11. Li, X.; Li, P.; Liu, X.; Sun, L.; Cui, T.; He, K.; Guo, C. Surface subsidence pattern of construction of pipe jacking in water-rich sand layer cross passage measured and numerical simulation analysis. Structures 2024, 60, 105949. [Google Scholar] [CrossRef]
  12. Li, C.; Wang, Y.; Yu, J.; Gong, H.; Li, X.; Yang, X.; Cheng, H.; Li, X.; Shao, K. Estimation of inelastic skeletal storativity based on SAR-derived land subsidence and groundwater variation in Beijing Plain, China. Hydrol. Reg. Stud. 2025, 57, 102161. [Google Scholar] [CrossRef]
  13. Hu, L.; Dai, K.; Xing, C.; Li, Z.; Tomás, R.; Clark, B.; Shi, X.; Chen, M.; Zhang, R.; Qiu, Q.; et al. Land subsidence in Beijing and its relationship with geological faults revealed by Sentinel-1 InSAR observations. Int. J. Appl. Earth Obs. Geoinf. 2018, 82, 101886. [Google Scholar] [CrossRef]
  14. Li, C.; Ding, L.; Guo, Z.; Wang, Z.; Wei, L.; Zheng, Y.; Cui, X.; Wang, J. Spatiotemporal evolution of surface deformation based on MT-InSAR and mechanism analysis along Zhengzhou Metro, China. Tunn. Undergr. Space Technol. 2025, 156, 106182. [Google Scholar] [CrossRef]
  15. Chen, B.; Gong, H.; Li, X.; Lei, K.; Zhu, L.; Gao, M.; Zhou, C. Characterization and causes of land subsidence in Beijing, China. Int. J. Remote Sens. 2016, 38, 808–826. [Google Scholar] [CrossRef]
  16. Wang, S.; Chen, Z.; Zhang, G.; Xu, Z.; Liu, Y.; Yuan, Y. Overview and Analysis of Ground Subsidence along China’s Urban Subway Network Based on Synthetic Aperture Radar Interferometry. Remote Sens. 2024, 16, 1548. [Google Scholar] [CrossRef]
  17. Wu, J.; Hu, F. Monitoring Ground Subsidence Along the Shanghai Maglev Zone Using TerraSAR-X Images. IEEE Geosci. Remote Sens. Lett. 2017, 14, 117–121. [Google Scholar] [CrossRef]
  18. Chen, Y.; Ding, C.; Huang, P.; Yin, B.; Tan, W.; Qi, Y.; Xu, W.; Du, S. Research on Time Series Monitoring of Surface Deformation in Tongliao Urban Area Based on SBAS-PS-DS-InSAR. Sensors 2024, 24, 1169. [Google Scholar] [CrossRef]
  19. Alizadeh, N.; Maghsoudi, Y.; Managhebi, T.; Azadnejad, S. Collapse Hotspot Detection in Urban Area Using Sentinel-1 and TerraSAR-X Dataset with SBAS and PSI Techniques. Land 2024, 13, 2237. [Google Scholar] [CrossRef]
  20. Kalavrezou, I.E.; Melgar, I.C.; Nika, D.; Gatsios, T.; Lalechos, S.; Parcharidis, I. Application of Time Series INSAR (SBAS) Method Using Sentinel-1 for Monitoring Ground Deformation of the Aegina Island (Western Edge of Hellenic Volcanic Arc). Land 2024, 13, 485. [Google Scholar] [CrossRef]
  21. Zhao, S.; Li, P.; Li, H.; Zhang, T.; Wang, B. Monitoring and Comparative Analysis of Hohhot Subway Subsidence Using StaMPS-PS Based on Two DEMS. Remote Sens. 2023, 15, 4011. [Google Scholar] [CrossRef]
  22. Du, Y.; Feng, G.; Liu, L.; Fu, H.; Peng, X.; Wen, D. Understanding Land Subsidence Along the Coastal Areas of Guangdong, China, by Analyzing Multi-Track MTInSAR Data. Remote Sens. 2020, 12, 299. [Google Scholar] [CrossRef]
  23. Perissin, D.; Wang, T. Repeat-Pass SAR Interferometry With Partially Coherent Targets. IEEE Trans. Geosci. Remote Sens. 2012, 50, 271–280. [Google Scholar] [CrossRef]
  24. Heleno, S.I.N.; Oliveira, L.G.S.; Henriques, M.J.; Falcão, A.P.; Lima, J.N.P.; Cooksley, G.; Ferretti, A.; Fonseca, A.M.; Lobo-Ferreira, J.P.; Fonseca, J.F.B.D. Persistent Scatterers Interferometry detects and measures ground subsidence in Lisbon. Remote Sens. Environ. 2011, 115, 2152–2167. [Google Scholar] [CrossRef]
  25. Wang, H.; Feng, G.; Xu, B.; Yu, Y.; Li, Z.; Du, Y.; Zhu, J. Deriving Spatio-Temporal Development of Ground Subsidence Due to Subway Construction and Operation in Delta Regions with PS-InSAR Data: A Case Study in Guangzhou, China. Remote Sens. 2017, 9, 1004. [Google Scholar] [CrossRef]
  26. Chen, W.; Gong, H.; Chen, B.; Liu, K.; Gao, M.; Zhou, C. Spatiotemporal evolution of land subsidence around a subway using InSAR time-series and the entropy method. GIScience Remote Sens. 2017, 54, 78–94. [Google Scholar] [CrossRef]
  27. Duan, L.; Gong, H.; Chen, B.; Zhou, C.; Lei, K.; Gao, M.; Yu, H.; Cao, Q.; Cao, J. An Improved Multi-Sensor MTI Time-Series Fusion Method to Monitor the Subsidence of Beijing Subway Network during the Past 15 Years. Remote Sens. 2020, 12, 2125. [Google Scholar] [CrossRef]
  28. He, F.; Xu, X.; Tian, F.; Liu, Z.; Zhang, Y.; Bai, L.; Cui, Y.; Wang, K.; Niu, W.; Ni, J.; et al. Regional tectono-sedimentary evolution in the northeastern Beijing Sub-plain: Evidence from the Yx02 core chronostratigraphy in the buried Daxing Uplift. Geosci. J. 2024, 28, 145–158. [Google Scholar] [CrossRef]
  29. Ferretti, A.; Prati, C.; Rocca, F. Nonlinear subsidence rate estimation using permanent scatterers in differential SAR interferometry. IEEE Trans. Geosci. Remote Sens. 2000, 38, 2202–2212. [Google Scholar] [CrossRef]
  30. Dai, K.; Shi, X.; Gou, J.; Hu, L.; Chen, M.; Zhao, L.; Dong, X.; Li, Z. Diagnosing Subsidence Geohazard at Beijing Capital International Airport, from High-Resolution SAR Interferometry. Sustainability 2020, 12, 2269. [Google Scholar] [CrossRef]
  31. Lyu, M.; Ke, Y.; Li, X.; Zhu, L.; Guo, L.; Gong, H. Detection of Seasonal Deformation of Highway Overpasses Using the PS-InSAR Technique: A Case Study in Beijing Urban Area. Remote Sens. 2020, 12, 3071. [Google Scholar] [CrossRef]
  32. Atique, Z.; Ahmad, M.H.; Zaman, A. The Supply and Demand for Exports of Pakistan: The Polynomial Distributed Lag Model (PDL) Approach [with Comments]. Pak. Dev. Rev. 2003, 42, 961–972. [Google Scholar]
  33. Xin, Z.; Beibei, C.; Huili, G.; Kunchao, L.; Chaofan, Z.; Zhaozhao, L.; Danni, Z. Inversion of Groundwater Storage Variations Considering Lag Effect in Beijing Plain, from RadarSat-2 with SBAS-InSAR Technology. Remote Sens. 2022, 14, 991. [Google Scholar]
  34. Khorrami, M.; Alizadeh, B.; Tousi, E.G.; Shakerian, M.; Maghsoudi, Y.; Rahgozar, P. How Groundwater Level Fluctuations and Geotechnical Properties Lead to Asymmetric Subsidence: A PSInSAR Analysis of Land Deformation over a Transit Corridor in the Los Angeles Metropolitan Area. Remote Sens. 2019, 11, 377. [Google Scholar] [CrossRef]
  35. Meng, D.; Chen, B.; Gong, H.; Zhang, S.; Ma, R.; Zhou, C.; Lei, K.; Xu, L.; Wang, X. Land subsidence and rebound response to groundwater recovery in the Beijing Plain: A new hydrological perspective. Hydrol. Reg. Stud. 2025, 57, 102127. [Google Scholar] [CrossRef]
  36. Fulki, F.M.; Rizqiyanto, A.A.; ChangWook, L. Integration of InSAR Time-Series Data and GIS to Assess Land Subsidence along Subway Lines in the Seoul Metropolitan Area, South Korea. Remote Sens. 2020, 12, 3505. [Google Scholar]
  37. Cooper, J.P. Two Approaches to Polynomial Distributed Lags Estimation: An Expository Note and Comment. Am. Stat. 2012, 26, 32–35. [Google Scholar] [CrossRef]
  38. Qin, M.; Yang, J.; Bai, Y.; Bai, Y. The Subsidence–Distance Relationship for Land Subsidence Induced by Groundwater Abstraction. Hydrogeol. J. 2024, 33, 1–13. [Google Scholar] [CrossRef]
  39. Gudehus, G. Implications of the principle of effective stress. Acta Geotech. 2020, 16, 1939–1947. [Google Scholar] [CrossRef]
  40. Yu, K.; Wang, L.; Duan, Y.; Zhang, M.; Dong, Y.; Jia, W.; Hu, F. Soil pore characteristics, morphology, and soil hydraulic conductivity following land subsidence caused by extraction of deep confined groundwater in Xi’an, China: Quantitative analysis based on X-ray micro-computed tomography. Soil Tillage Res. 2021, 211, 105018. [Google Scholar] [CrossRef]
  41. He, G.; Zhang, Y.; Li, Y.; Sun, T. Experimental study on ground subsidence caused by pumping and recharging. Bull. Eng. Geol. Environ. 2020, 79, 1163–1183. [Google Scholar] [CrossRef]
  42. Zhang, G. Mechanism of Abnormal Surface Subsidence Induced by Fault Instability. Geotech. Geol. Eng. 2021, 39, 4781–4794. [Google Scholar]
  43. Doglioni, C.; Dagostino, N.; Mariotti, G. Normal Faulting vs. Regional Subsidence and Sedimentation Rate. Mar. Pet. Geol. 1998, 15, 737–750. [Google Scholar] [CrossRef]
  44. Xu, J.; Peng, J.; Deng, Y.; An, H.; Meng, Z.; Wang, Y.; Li, Z. Characteristics, causes and significance of subsurface stress field of Beijing earth fissures group. Geomat. Nat. Hazards Risk 2024, 15, 2287974. [Google Scholar] [CrossRef]
  45. Wu, D.; Deng, T.; Zhao, R.; Wang, Y. THM modeling of ground subsidence induced by excavation of subway tunnel. Comput. Geotech. 2018, 94, 1–11. [Google Scholar] [CrossRef]
  46. Song, Y.; Chen, X.; Zou, B.; Mu, J.; Hu, R.; Cheng, S.; Zhao, S. Monitoring Study of Long-Term Land Subsidence during Subway Operation in High-Density Urban Areas Based on DInSAR-GPS-GIS Technology and Numerical Simulation. Comput. Model. Eng. Sci. 2022, 134, 1021–1039. [Google Scholar] [CrossRef]
  47. Xu, X.; Zhao, D.; Ma, C.; Lian, D. Monitoring Subsidence Deformation of Suzhou Subway Using InSAR Timeseries Analysis. IEEE Access. 2021, 9, 3400–3416. [Google Scholar] [CrossRef]
  48. Yang, Q.; Ke, Y.; Zhang, D.; Chen, B.; Gong, H.; Lv, M.; Zhu, L.; Li, X. Multi-Scale Analysis of the Relationship between Land Subsidence and Buildings: A Case Study in an Eastern Beijing Urban Area Using the PS-InSAR Technique. Remote Sens. 2018, 10, 1006. [Google Scholar] [CrossRef]
  49. Francesca, C.; Deodato, T. Urban Growth and Land Subsidence: Multi-Decadal Investigation Using Human Settlement Data and Satellite InSAR in Morelia. Mexico. Sci. Total Environ. 2021, 811, 152211. [Google Scholar]
  50. Cui, Z.D.; Yang, J.Q.; Yuan, L. Land Subsidence Caused by the Interaction of High-Rise Buildings in Soft Soil Areas. Nat. Hazards 2015, 79, 1199–1217. [Google Scholar] [CrossRef]
Figure 1. Research objects and the coverage of SAR images. (a) The coverage map of SAR images. (b) The location map of subway lines.
Land 14 01098 g001
Figure 2. Procedure of IPTA processing for urban subsidence monitoring.
Land 14 01098 g002
Figure 3. Distribution of cumulative ground deformation along the subway from 2004 to November 2024.
Land 14 01098 g003
Figure 4. Comparison of PS-InSAR monitoring results and leveling monitoring results (a) from 2006 to 2013, (b) from 2013 to 2018, and (c) from 2022 to 2023.
Land 14 01098 g004
Figure 5. Spatial distribution of cumulative subsidence along the subway from 2004 to 2024.
Land 14 01098 g005
Figure 6. Profile of the cumulative ground subsidence along the subway from 2004 to November 2024.
Land 14 01098 g006
Figure 7. Monthly average deformation amount and groundwater trend line from 2018 to 2021 in (a) the Auto Parts City, (b) Gaolou Town, and (c) Dongxiaoying.
Land 14 01098 g007
Figure 8. Land subsidence distribution and cross-fault subsidence contrasts at sites I and II. (a) Distribution map of land subsidence and active fault locations. (b) Subsidence contrast: fault zone sides (Site I). (c) Subsidence contrast: fault zone sides (site II).
Land 14 01098 g008
Figure 9. The frequency statistical chart of PS point velocities along the subway. (a) is the annual percentage within different deformation range intervals, (b) is the number of PS-InSAR monitoring points within different deformation rate intervals.
Land 14 01098 g009
Figure 10. The distribution of land subsidence at YJ Station and the optical image map, I, II, and III are optical image diagrams within the optical image range.
Land 14 01098 g010
Figure 11. Time-series images of recent building construction. (ah) represent different locations, respectively.
Land 14 01098 g011
Table 1. Main information of Envisat ASAR, Radarsat-2, and Sentinel-1A.
SAR SensorEnvisat ASARRadarsat-2 (Standard)Radarsat~2 (Extra-Fine)Sentinel-1
BandCCCC
Wavelength (cm)5.65.65.65.6
PolarizationVVVVVVVV
ascending/descending orbitdescendingdescendingdescendingascending
Incidence Angle22.833.922.539.5
No. images51374360
Date range14 January 2004~
19 September 2010
22 November 2010~
21 October 2016
25 January 2017~
10 January 2020
5 January 2020~
3 November 2024
Table 2. Information on groundwater level monitoring stations.
Unified NumberGeographical LocationMonitoring Depth (m)Aquiferous Medium and Burial Conditions
131082210331Gaolou Village, Gaolou Town, Sanhe City, Hebei Province31.31–34.41Pore phreatic water
110112210004Dongxiaoying, Tongzhou District, Beijing72.00–116.00Pore confined water
110105210003Qingnian Road Auto Parts City, Chaoyang District, Beijing52.00–108.50Pore confined water
Disclaimer/Publisher’s Note: The statements, opinions and data contained in all publications are solely those of the individual author(s) and contributor(s) and not of MDPI and/or the editor(s). MDPI and/or the editor(s) disclaim responsibility for any injury to people or property resulting from any ideas, methods, instructions or products referred to in the content.

