Article

Current Status of Acid Soils Under Different Landform Types in an Expanding Equatorial Agricultural Region

by
Juan David Mahecha-Pulido
1,
Juan Manuel Trujillo-González
1,
Marco Aurelio Torres-Mora
1,
Francisco J. García-Navarro
2 and
Raimundo Jiménez-Ballesta
3,*
1
Instituto de Ciencias Ambientales de la Orinoquia Colombiana ICAOC, Facultad de Ciencias Básicas e, Ingeniería, Universidad de los Llanos, Campus Barcelona, Villavicencio 500001, Colombia
2
High Technical School of Agricultural Engineers of Ciudad Real, University of Castilla-La Mancha, 13071 Ciudad Real, Castilla-La Mancha, Spain
3
Department of Geology and Geochemistry, Autonomous University of Madrid, 28049 Madrid, Madrid, Spain
*
Author to whom correspondence should be addressed.
Land 2025, 14(5), 1073; https://doi.org/10.3390/land14051073
Submission received: 16 April 2025 / Revised: 12 May 2025 / Accepted: 13 May 2025 / Published: 15 May 2025

Abstract

:
This study assesses the current status of selected soil properties of an expanding equatorial agricultural region (Arauca, Colombia) across six landscapes, with the final focus being on evaluating overall soil quality. Field surveys, morphological descriptions, and laboratory analyses of 133 soil profiles were investigated. The landscapes include mountains (25 profiles), foothills (17), hills (11), alluvial plains (43), alluvial plains with dunes (21), and alluvial valleys (16). Soils are classified into six Reference Soil Groups (WRB FAO): Gleysols, Acrisols, Arenosols, Ferralsols, Leptosols, and Cambisols. The findings indicate high acidity, low fertility, and deficient exchangeable bases. Indeed, pH ranges from extremely acid to slightly acid (3.5–6.4), and exchangeable acidity saturation percentage (%SAI) values reach 100% in some areas. Soil textures vary from clay loam to sandy loam and clay. Nutrient contents are ranked in the order Cambisols > Gleysols > Arenosols > Ferralsols > Acrisols > Leptosols. Correlation analysis reveals that clay content positively influences the exchangeable basis percentage, while organic matter (OM) negatively correlates with the nutrients phosphorus, calcium, and magnesium. This study highlights that landscape position influences soil quality, with lower landscape positions having better quality than upper ones. These results provide insights into soil fertility and nutrient availability, which helps to predict suitable plant cultivation areas when increasing areas for agricultural use versus forestry in Arauca. The inclusion or maintenance of diverse tree species is a key element in maintaining the production of organic matter and, consequently, generating better soil quality.

1. Introduction

Soil is the foundation of numerous essential functions, ecosystem services, and socioeconomic activities that are critical to human well-being. These include the production of biomass—such as food, forage, fiber, and bioenergy; the storage, purification, and supply of water; the regulation of greenhouse gas fluxes, including carbon dioxide (CO2), nitrous oxide (N2O), and methane (CH4); physical support for infrastructure; the provision of raw materials for construction; and serving as a biological habitat [1,2,3,4,5]. These services result from complex interactions between soil biological and physicochemical properties, and are influenced by external factors like environmental and anthropogenic dynamics that make them a dynamic system in terms of both space and time [6,7,8]. Consequently, soil serves as the foundation of eco-systems by offering key ecosystem goods and services, such as carbon storage, water regulation, soil fertility, and food production, all of which directly affect human well-being.
Despite their importance, soils in many regions of the world are increasingly threatened by accelerated degradation processes driven by rising food demand, urban expansion, and mining activities. This situation is further exacerbated by inadequate land-use planning, the undervaluation of soil ecosystem services, lack of institutional coordination, and regulatory frameworks that lack a solid scientific foundation [9,10,11,12]. In developing countries, knowledge about soils remains limited due to insufficient financial, technical, and human resources to conduct detailed and systematic studies. This shortage has hindered the generation of up-to-date, high-resolution information needed to understand soil dynamics, plan land use, and develop evidence-based policies. [13,14]. In this context, it is also essential to address the importance of the concept of soil health as an approach that integrates soil with productive systems, water quality, human health, and climate change [15].
Changes in land use and land cover driven by human activities are among the main causes of disruption to key ecological processes in soils, including carbon, nitrogen, and water cycles [16]. In this context, strategic land-use planning based on detailed knowledge of soil physicochemical properties is essential for formulating strategies aimed not only at conservation, but also at restoration and utilization in accordance with the soil’s inherent capacities [17,18]. In this regard, multivariate analyses of soil physicochemical variability serve as a valuable statistical tool to generate scientific knowledge, enhance understanding of soil dynamics, support conservation efforts, and preserve its productive potential [19].
In regions such as Arauca, located in the equatorial Orinoquia of Colombia, recognizing soil functions is essential for maintaining ecosystem health and preserving biological diversity. This becomes particularly critical in light of the region’s economic development, driven by its high agricultural potential and the existing infrastructure for hydrocarbon exploitation [11,20], activities that have caused changes in the original forest and natural savanna cover [21], in soils that are highly vulnerable due to low organic matter content and environmental conditions of precipitation and temperature [22]. Therefore, recognizing the physicochemical characteristics of soils in this region is essential for increasing awareness of their critical role in sustaining human well-being and maintaining ecosystem functionality [5,23]. In regions such as Arauca, where high agricultural potential intersects with sensitive and biodiverse ecosystems, a deeper understanding of soil properties is necessary not only for promoting sustainable land use, but also for informing territorial development [24].
Soil studies specific to the Arauca region have focused on analyzing land needs, potential, and uses, and have been conducted by the Instituto Geográfico Agustín Codazzi (IGAC) through general soil and land zoning studies carried out in 1986 and 2017 [22]. To date, knowledge of the spatio-temporal dynamics of soil development in landscape contexts remains incomplete and fragmented, particularly in this region. Against this backdrop, a semi-detailed soil survey was conducted across six landscapes in Arauca, Colombia, to evaluate soil genesis and to interpret soil–landscape properties with a final focus on the establishment of soil quality for agricultural purposes, as well as to establish approximate criteria for sustainably managing acid soils in humid regions such as Arauca. Therefore, the main purpose was to assess soil quality for forest areas and adjacent agricultural areas. The specific objective was to quantify selected soil physicochemical properties across different landscapes in Arauca, an understudied region in Colombia. Through this detailed analysis, this study seeks to enhance the understanding of soil fertility in these regions, where agricultural practices are rapidly expanding and contribute to establishing sustainable soil resource management.

2. Materials and Methods

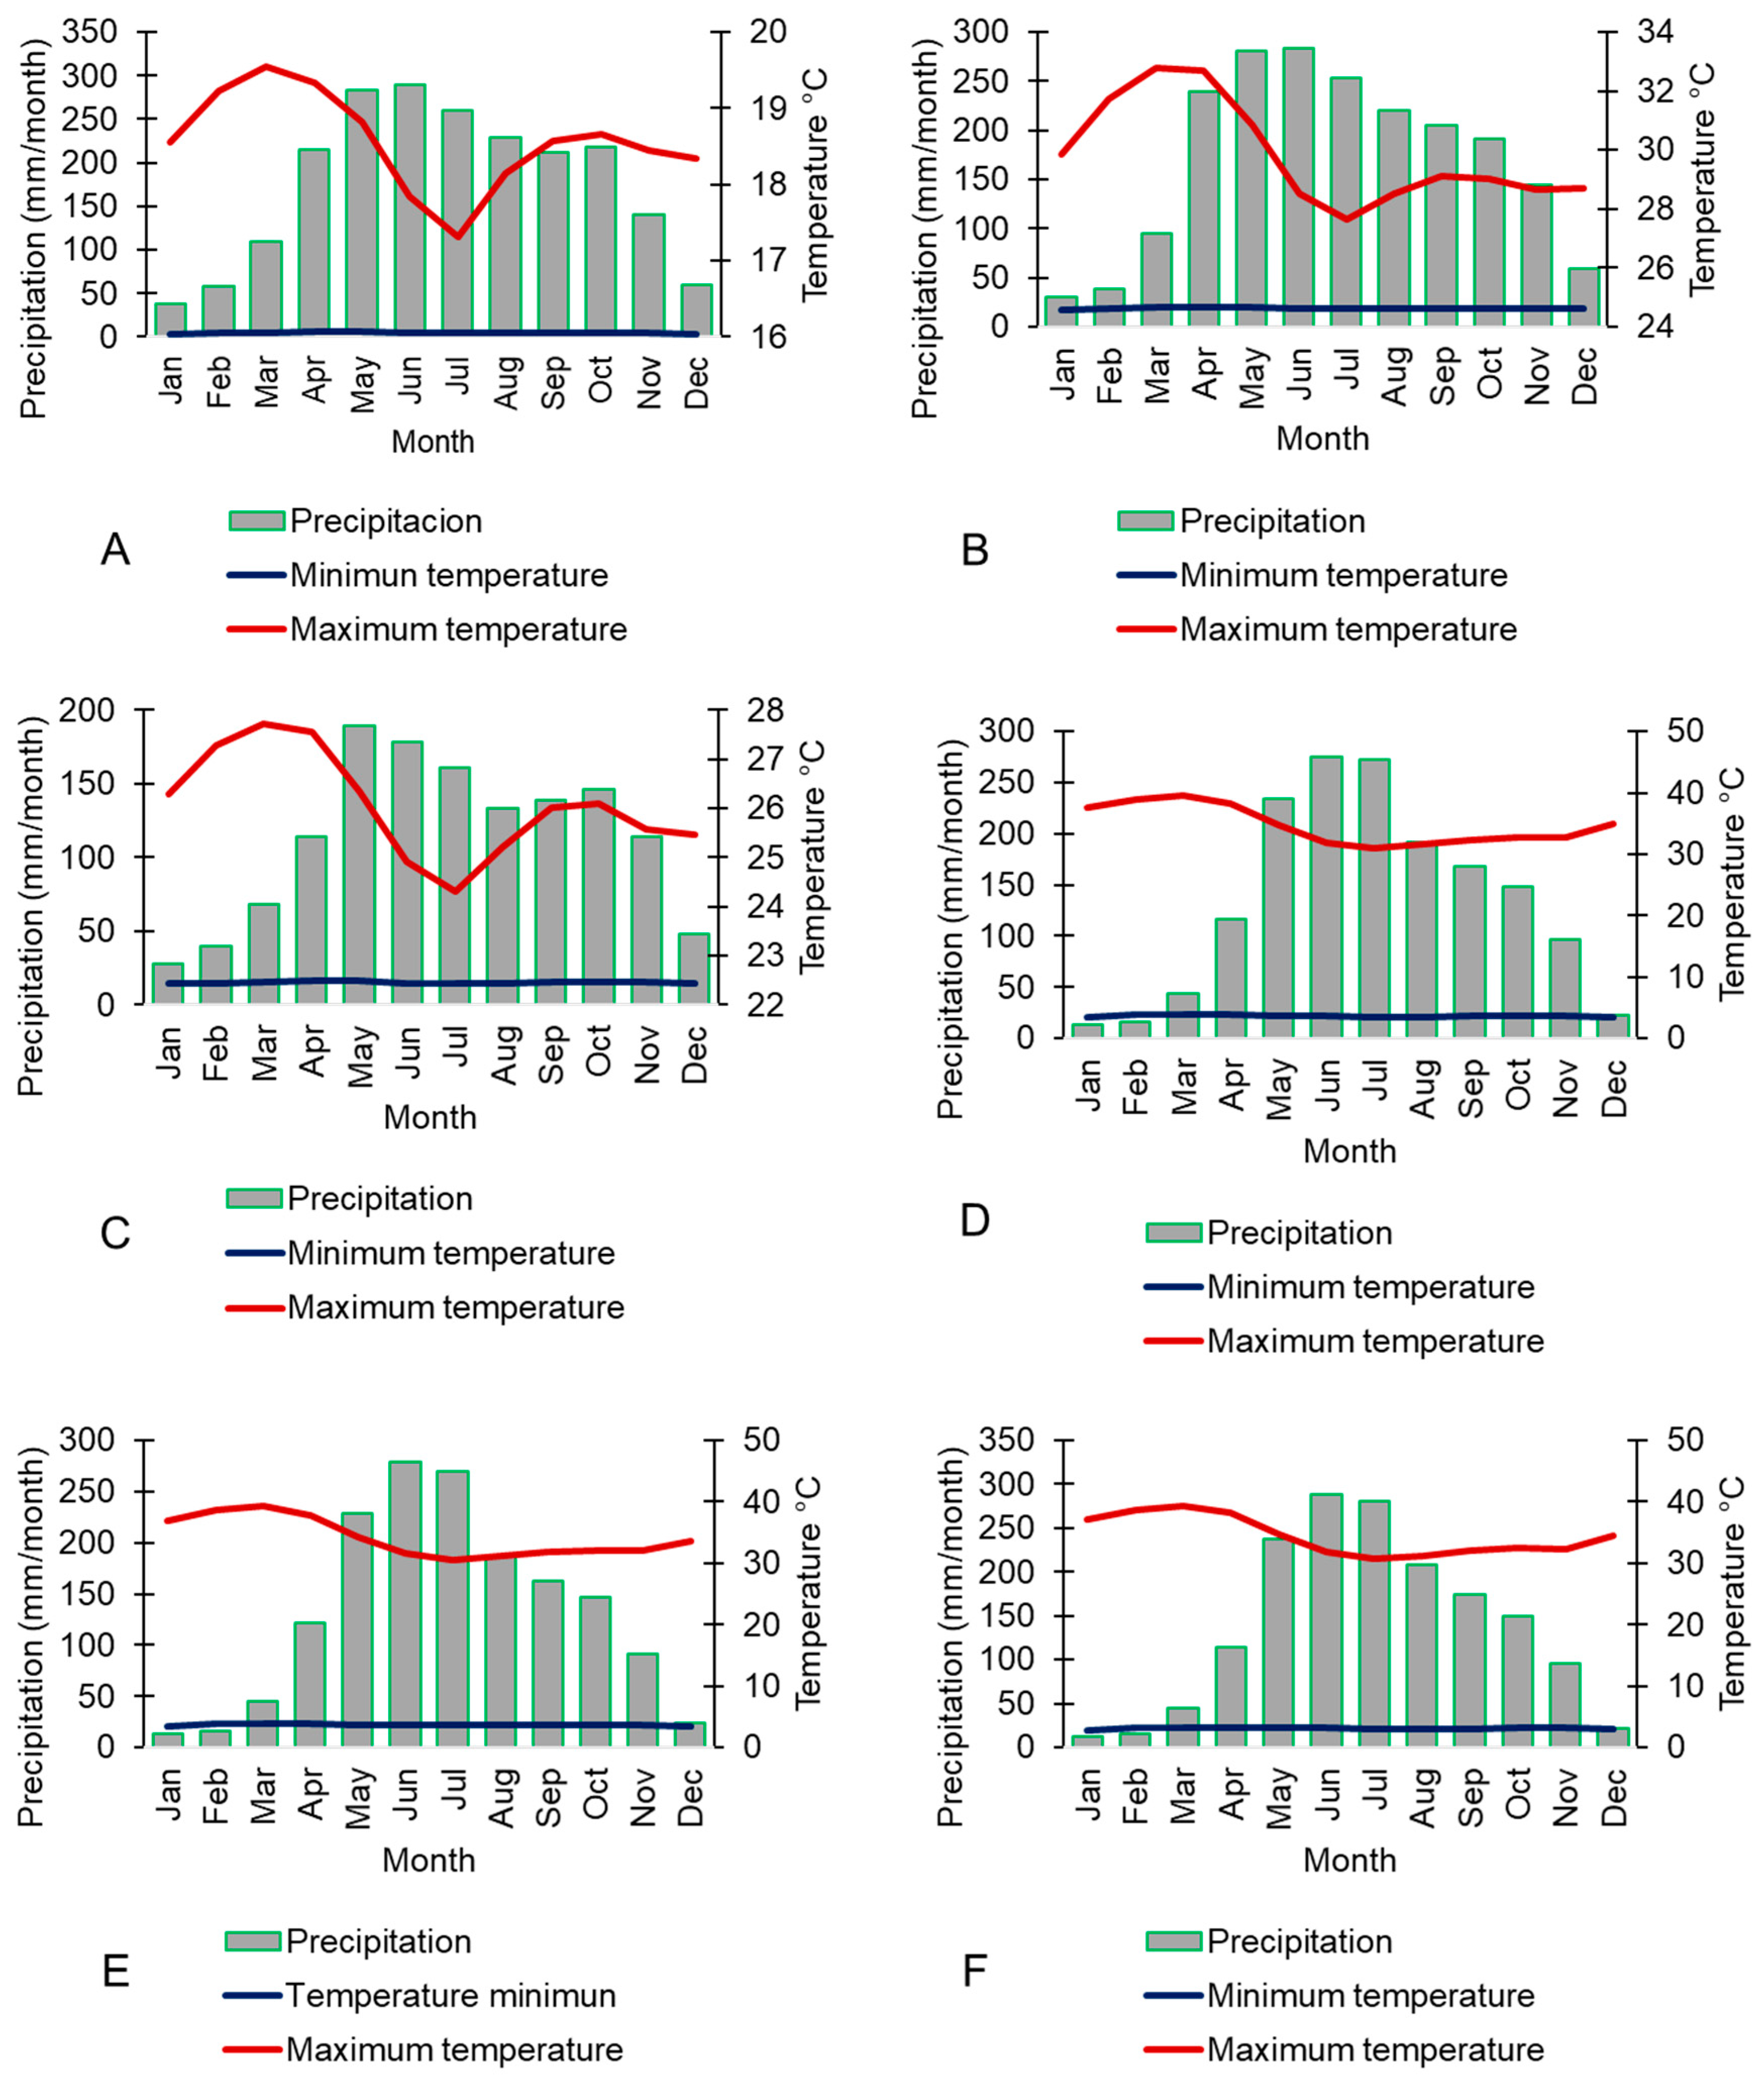
2.1. Description of the Study Site: Vegetation and Climate

The Arauca region is divided into six main physiographic units: mountains, foothills, hills, alluvial valleys, alluvial plains, and alluvial plains with dunes. Stratigraphically, the territory is composed of sedimentary rocks ranging from the Paleozoic to the Neogene, along with recent fluvial and aeolian deposits [25]. This research was conducted in this region, located in eastern Colombia (Figure 1), which covers approximately 2,376,920 hectares, representing 2.1% of the national territory. The soils in this area are also diverse, comprising 64 soil mapping units classified under the following World Reference Base (WRB) soil groups: Cambisols (6403 ha—0.3%), Leptosols (6423 ha—0.3%), Acrisols (232,155 ha—10%), Arenosols (355,907 ha—15%), Ferralsols (715,188 ha—30%), and Gleysols (1,056,010 ha—44%). In the alluvial plains, soils are predominantly of alluvial origin, with variable textures, low natural fertility, and high acidity, particularly in poorly drained areas where plinthic or gleyic horizons are common. In the foothills and hill regions, soils tend to be younger, well drained, with greater effective depth and relatively higher fertility, offering greater agricultural potential. In contrast, mountainous areas are characterized by soils developed over older geological substrates, with steep slopes and high susceptibility to erosion, which significantly limits their agricultural use (Table 1).
In the Arauca region, according to the Holdridge life zone classification, three main vegetation communities are identified: natural savannas with gallery forests found in the alluvial plain and alluvial valley landscapes, heterogeneous and exuberant arboreal vegetation in the foothill and mountain landscapes, and páramo shrubland vegetation located in the upper zone of the mountain landscape [25].
In the Arauca region, the precipitation distribution pattern is monomodal with a rainy season from April to November and a dry period from December to March, conditioned by the movement system of the Intertropical Convergence Zone (ITCZ), directly responsible for the appearance of rain in the region. The average annual precipitation varies between 3000 mm year−1 in the mountainous area and 1500 mm year−1 in flat areas (Figure 2), with May and June being those with the highest precipitation. Average temperatures vary between 4.2 °C in the mountain landscape and 34.1 °C in the alluvial plain landscape. According to the Caldas–Lang climate classification [26], the study area contains the following climates: subnival very humid and pluvial, extremely cold very humid and pluvial, very cold very humid and pluvial, cold very humid and pluvial, temperate very humid and pluvial, warm very humid, warm humid, and warm dry [25].

2.2. Sampling Soils

Various geospatial tools and datasets were used to support this study, including a Digital Elevation Model (DEM), a slope model, a shaded relief model, a geomorphological environment model, and the “general study of soils and land zoning of Arauca” at a 1:100,000 scale [24]. These resources enabled the identification and characterization of land cover types and their spatial distribution across six landscape units.
The methodological workflow comprised five main phases: (1) pre-field analysis, (2) fieldwork, (3) laboratory analysis, (4) soil classification, and (5) definition of soil units. A total of 133 soil profiles were excavated and described following FAO guidelines [27] at representative points within each landscape unit. Horizon-based soil samples were collected from each pedon for subsequent laboratory analysis.
A total of 452 samples were collected and distributed across the following landscape units in the region of Arauca: mountains (n = 25 profiles), foothills (n = 17 profiles), hills (n = 11 profiles), alluvial plains (n = 43 profiles), alluvial plains with dunes (n = 21 profiles), and alluvial valleys (n = 16 profiles). These units were defined based on elevation, geomorphological features, and dominant vegetation, according to the physiographic classification proposed by IGAC. Sampling locations were determined randomly, considering the specific characteristics of the region, georeferenced using a GPS device (Garmin 62SC) and mapped using ArcGIS 10.1 software (Esri, Redlands, CA, USA). Soil profile depths ranged from 0.16 to 1.70 m. The study area and the sampling sites are shown in Figure 1.

2.3. Laboratory Analyses

The soil samples were air-dried at 25–28 °C for approximately 10 days, crushed and sieved through 2.0 mm sieves, and stored in plastic boxes to analyze soil physicochemical parameters. All the analyses were performed for fine earth fractions. Soil suspensions in deionized water (1:1 by volume) and 1 M KCl were analyzed chemically for pH. The percentage of organic matter (OM) in the fine-earth fraction of soil was determined following the dichromate acid oxidation method developed by Walkley and Black [28]. The Kjeldahl method was used to obtain a percentage value for total nitrogen (NT) [29]. Available phosphorus was determined by the Bray II method [30]. Particle size distribution was carried out by dispersion with sodium hexametaphosphate and measured with a hydrometer [31]. The percentages of exchangeable acidity (Al + H) and exchangeable aluminum (Al) were determined by extraction with 1 M KCl. For the determination of the exchangeable bases calcium (Ca), magnesium (Mg) and potassium (K) in the available fraction, 1N ammonium acetate extraction and pH 7 were used [32]. Extracts were analyzed with an atomic absorption spectrophotometer (AAnalyst 400, PerkinElmer Inc. Waltham, MA, USA), and the cation exchange capacity (CEC) was determined by mathematical calculations.

2.4. Geo- and Statistical Analyses

Descriptive statistical analyses, standard deviations, coefficients of variation (CVs), kurtosis, and maximum and minimum values were calculated using Excel® (Microsoft, Redmond, WA, USA). Distribution was performed by the Kruskal–Wallis test (nonparametric test) at a significance level of 0.05 due to the variability observed in the soil data and the lack of homogeneity in sample sizes across the six landscape units. Spearman’s rank correlation coefficient was used to assess the correlations between soil properties in each land use. A hierarchical cluster analysis (HCA) was applied to assess the clusters of soil physicochemical properties. The analysis was based on standardized data to eliminate the effect of scale differences among variables. Data were standardized for this using the z-score. Correlation was applied as a measure of the strength of the relation between variables. The agglomeration method was used to classify variables into related clusters. Finally, a Principal Component Analysis (PCA) was performed for the correlated variables. Calculations were performed with RStudio version 4.1.3 and used with the readxl, corrplot, psych, and factoextra libraries [33]. For the spatial representation of the sampled sites, ArcGIS Pro was employed.
Due to the variability observed in the soil data and the lack of homogeneity in sample sizes across the six landscape units, a non-parametric Kruskal–Wallis test was applied to assess significant differences in selected soil physicochemical properties.

3. Results and Discussion

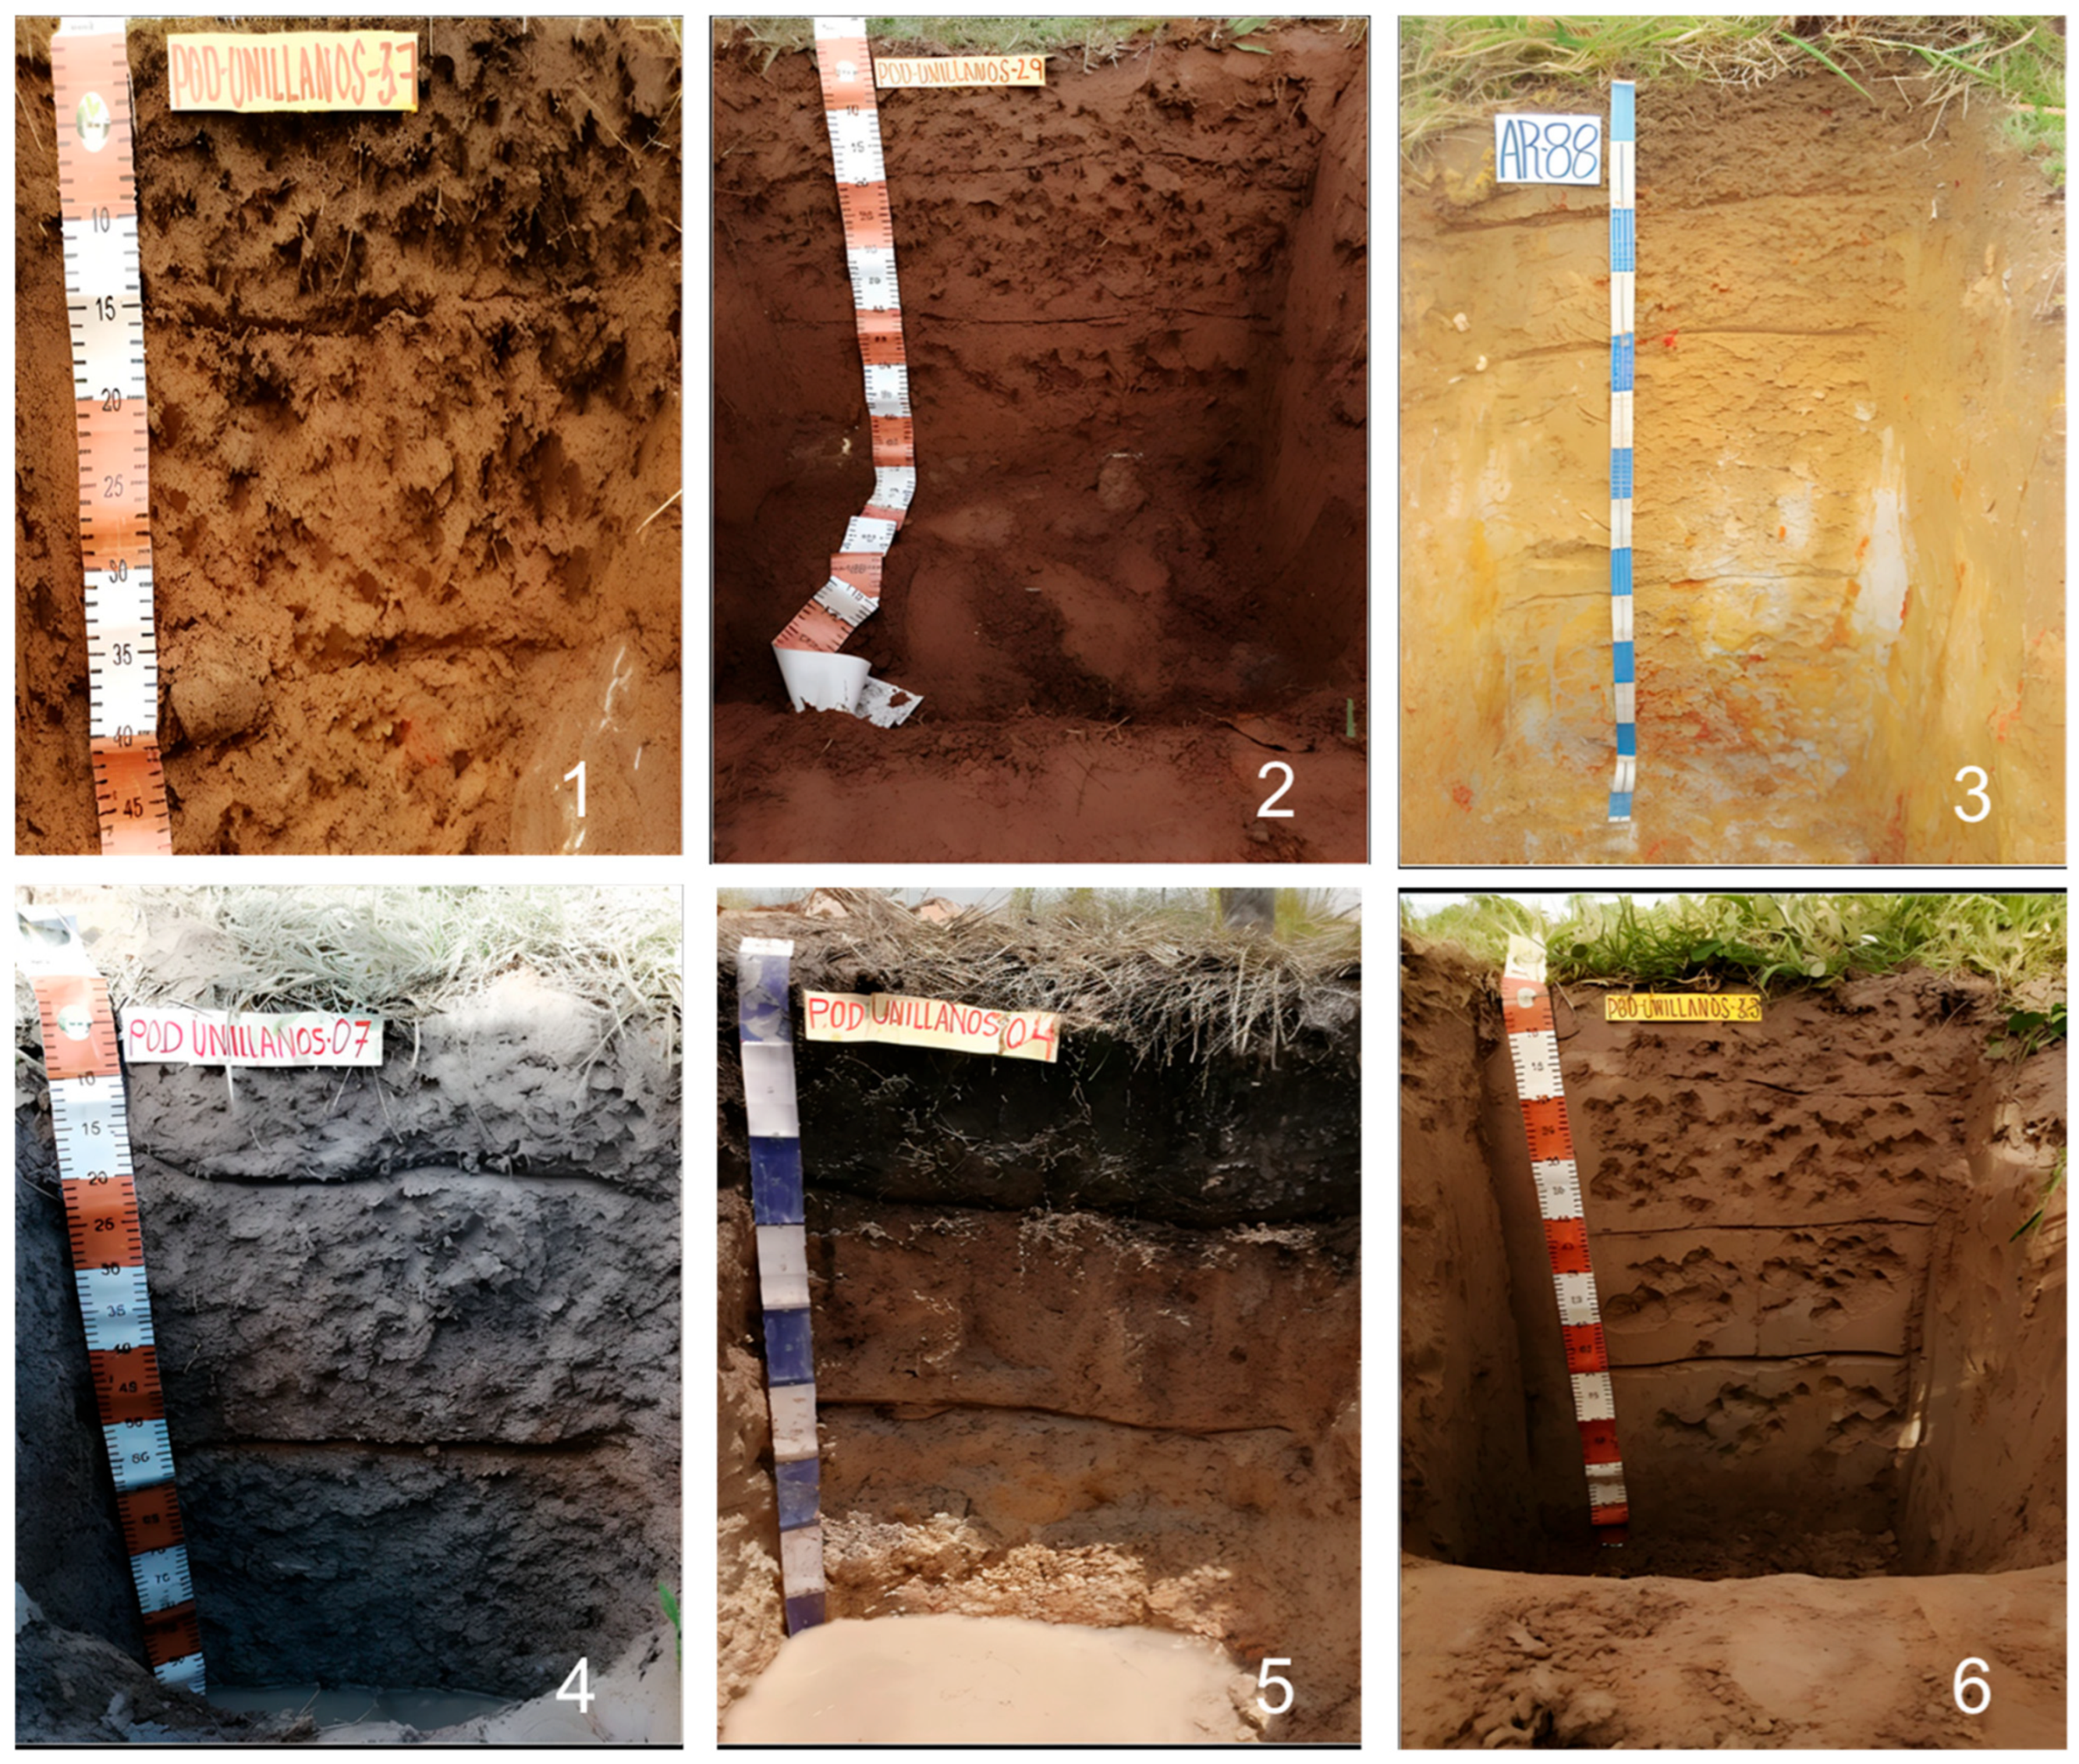
3.1. Soil Macromorphology

Six soil Reference Soil Groups (WRB FAO), namely, Cambisols, Gleysols, Arenosols, Ferralsols, Acrisols, and Leptosols, have been discovered in the Arauca department. The macromorphological analysis of the described and sampled 133 profiles showed that the morphological features of the soil profiles generally show a sequence of the Ah/R, Ah-C-R, A-C, Ah-Bw-C-R, Ap-Bw-C-R, Ap-Bw-C-R, and Ap-Bw-Bo-C horizons. Table 2 includes the general and pedological characteristics of some representative investigated soils, with two per physiographic unit. The most outstanding features of the soil profiles are shown in Figure 3.
The most outstanding features of the soil profiles are shown in Figure 3.
Figure 3. Pictures of the main soil types formed on different physiographic units. Photo (1). Dystric Acrisol (Novic). Slopes of the mountain landscape. Photo (2). Haplic Cambisol (Dystric), located in the foothills landscape. Photo (3). Ferralsol (Acrílico), located in the hilly landscape with a warm humid climate. Photo (4). Plinthic Ferralsol (Dystric), located on the alluvial plain. Photo (5). Histic Gleysol (Dystric), located in the lower sand fields of the alluvial plains with dunes. Photo (6). Gleyic Cambisol (Endogleyic), located in the alluvial valley.
Land 14 01073 g003

3.2. Landscape Characteristics and the Soil Relation

Generally, the relation between the physiography elements of a given area and soils has been widely recognized as being key for soil formation and, therefore, for predicting the nature and distribution pattern of different soils in a landscape. As stated previously, six major physiographic units were identified in Arauca: mountains, foothills, hills, alluvial plains, alluvial plains with dunes, and alluvial valleys. The mountain landscape, which occupies 11.78% of the department, is characterized by slopes that vary between 12% and more than 50% and altitudes that range between 300 and 4700 m above sea level (m.a.s.l.). This landscape presents remarkable climate diversity, from a snowy climate with temperatures below 1.5 °C at altitudes from 4200 to 4700 m.a.s.l. to a very humid warm climate with average annual temperatures of 21–28 °C at altitudes below 1000 m.a.s.l. Geologically, it stands out for its diverse origin and for the geological processes that shape it. Parent materials include quartz sandstones, glacial deposits, mudstones, lutites, and conglomerates. Soils are poorly developed (although appear well developed in some areas), desaturated, acidic, and of low and very low fertility. In some places, they are limited by the proximity of rocky outcrops, which restrict their productive capacity.
The hills landscape is found exclusively in the southwest of the Arauca department and occupies 1.1% of the territory. It is characterized by elevations that vary between 500 and 1000 m.a.s.l. The relief is the main limitation for soil formation due to short and steep slopes that exceed 50%. The climate is warm and humid, with average annual temperatures of 21–28 °C and an average rainfall between 2240 mm and 2580 mm. The soils of this landscape are formed from parent materials, such as tertiary clays and sandstones. These soils are characterized by abundant stoniness and for being well drained. The mineralogies of these soils vary between kaolinitic clays and sands with high percentages of quartz, with the presence of amorphous oxides of iron and aluminum [25].
Alluvial valleys, which occupy 7.76% of the total area, extend along the main drainage axes of the rivers that descend from the mountain landscape and form wide valleys in the piedmont and hill areas, with flat surfaces and slopes of less than 3%. Altitudes vary between 150 and 500 m.a.s.l. This landscape includes the alluvial zones of the Arauca, Cusay, Ele, Banadia, Cravo Norte, Casanare, Tocoragua, Tame, and Cinaruco rivers and several channels. During the rainy season, these areas are prone to flooding and constant changes in water courses, which rejuvenate soils. In flat areas with excess moisture, hydromorphic processes develop by generating gray-colored soils. On terraces, soils are yellow and reddish. Dominant materials include quartz, feldspar, and mica in the sandy fraction and kaolinitic clays in the fine fraction [25].
Alluvial plains represent 46.4% of the department, where altitudes vary between 100 and 200 m.a.s.l. with slopes of less than 3%. The climate is warm and dry with temperatures of 18–28 °C and an annual rainfall of 1600–1800 mm. Soils are formed from fluvio-glacial sediments (clays, sands, and silts) from mountainous areas, and are deposited in a basin of progressive filling. In the upper parts of this landscape, soils are characterized by presenting a moderately coarse granulometry, and they are deep and well drained of yellow and reddish colors due to iron oxidation. In lower sectors, hydromorphic pedogenesis predominates with soils of medium and moderately fine textures, limited by fluctuating water and low permeability, showing gray colors. Iron and aluminum oxides are distributed in most of these soils, and their content increases as profiles deepen.
The alluvial plains with dunes are located in the northeastern end of the Arauca department and represent 25.4% of the study area. Slopes are less than 3%. The materials making up this plain are of Quaternary origin and come from the erosion of both the mountain systems and aeolian processes that affect plains. This landscape has a contrasting relief in high dune areas, where soils are deep with coarse textures along the profile and a quartz content above 90%, which confers them good drainage. On the contrary, in flat areas, soils are superficial, poorly drained, and influenced by a fluctuating water table. In some sectors, soils have intermediate horizons with accumulation of clays, which results from alluvium processes [25].

3.3. Physicochemical Properties: Soil Profiles

The basic statistics associated with the soil physicochemical properties from the Arauca department are organized according to landscape, and are listed in Table 3. The soils of the department show heterogeneity because coefficients of variation (CVs) exceed 30% for most parameters. The CV of soil properties is classified into three categories: low (<15%), moderate (15–35%), and high (>35%) [36]. These variations are associated with changes in the altitude and climate of landscapes [37]. Cambisols were formed on the summit slope and resulted from slow pedogenic processes. Acrisols at the foot of the slope and in the alluvial position showed redoximorphic features. Gleization and clay synthesis formed soil, the upward movement of coarse particles, but sometimes enhanced textural differentiation (with no clear eluviation–illuviation processes). Furthermore, the morphological and physicochemical properties of the studied pedons exhibited various degrees of variation along physiography, with topographic effects.
Soil physicochemical properties exhibit complex spatial heterogeneity in most of the area due to patchy vegetation distribution, especially perennial plants. In the alluvial landscapes, the subsurface horizons tend to exhibit slightly higher clay content compared with the surface horizons, which can be attributed to clay illuviation processes—where fine particles are translocated downward through the soil profile. Meanwhile, the surface enrichment in sand is likely the result of clay eluviation combined with the mechanical action of surface runoff, which removes finer particles such as clay and silt. Additionally, many soil profiles show an irregular vertical distribution of silt content. This non-uniform pattern may be explained by subtle variations or discontinuities in the lithology of the parent materials. Such heterogeneity in sediment deposition or the degree of weathering can produce differences in texture along the profile.
In addition to the soils that have developed from parent materials, which are low in carbonate minerals, soil acidification takes place in Arauca because the mean rainfall exceeds evapotranspiration. Indeed, the low obtained pH values (strong acidity) could be ascribed to heavy rainfall, to the well-drained condition, and to the leaching of a large amount of bases from solum. Therefore, the origin of the acidity of these soils must be sought in their formation from parent materials that are low in carbonate materials and that are influenced directly by tropical climate and covered by tropical rainforest. Soil acidity and associated low nutrient availability are key constraints for crop production in these soils, in such way that the most significant effect from pH in soils is related to nutrient reserve for plants.
Soil carbon is generally considered as an indicator of biological activity as well as in relation to policy issues such as carbon sequestration. The organic carbon ranges from very low to high (1.3–6.5%). The OM content of surface soils is higher than for subsurface soils in most pedons, which is attributed to the large amount of litter and crop residues and to rapid mineralization on surface layers. Some pedons exhibit low organic carbon content, which results from the induced rapid rate of OM oxidation due to high temperature (34.1 °C on average). The level of phosphorus content varies from 3.8 to 36.3 mg/kg−1, which is observed to be critically low in some cases. Potassium appears at moderate concentrations ranging from 0.1 to 0.3 (cmol (+) kg−1) (Table 3).
The obtained CEC values are low, ranging from 1.7 to 6.4 cmol∙(+)∙kg−1. For primarily climatic reasons, the soil environment is highly weatherable, followed by leaching processes that lead to losses in K+, Ca2+, and Mg2+ contents. Consequently, the exchange complex will be desaturated (the sum of the base cations Ca2+, Mg2+, K+, and Na+ relative to the CEC will be low). These values are critically low to medium, which might have serious implications for the overall productivity of these soils because soils with CEC under 5 cmol(+)/kg−1 generally have low clay and OM contents, have worse water-holding capacity, require more frequent lime and fertilizer additions, and are subject to the leaching of NO3−, B, NH4+, K, and most probably Mg. CEC is lower than 15 cmol(+) kg−1, that is, with a low fertility tendency. The values show no optimal cation exchange conditions, which is a bad indicator of fertility. The exchangeable bases appear in the order of Ca2+ > Mg2+ > K+ on the exchange complex and range from 0.2 to 2.6, 0.1 to 1.2 and 0.1 to 0.3 cmol∙kg−1 for Ca, Mg, and K, respectively. This trend denotes that the exchange complex is saturated with Ca2+, followed by Mg2+, Na+, and K+. The exchangeable acidity (%) content is also high and varies from 38.5% to 74.0%, which is probably related to the weathering of the acidic parent material that originates from acid rocks and granitic magnetite complexes but also to the effect of high rain values. High exchangeable acidity exists, which demonstrates the occurrence of exchangeable hydrogen and exchangeable aluminum as either Al3+ or partially neutralized Al-OH compounds such as Al (OH) 3+, and weak organic acid ions on exchangeable bases are low in all the soils of the crop and forest land-use types [38]. This is attributed to relatively low pH. Exchangeable Ca dominates at the exchange sites of the soil colloidal materials of the studied soil. This is followed by Mg, K, and Na ions, and in this order. The K/Mg ratio of the studied soils varies from 0.16:1 to 1:1, which indicates Mg-induced K deficiency using Laekemariam [39] rating.
In addition to the above, with the exception of Gleysols, soils have P contents of around 2 mg kg−1 and, in some cases, greater than 10 mg kg−1 but less than 20 mg kg−1; therefore these acidic soils are characterized by being deficient in these crop nutrients. Toxicities of several trace elements (Mn and B) are even probable, although these have not been determined in this study. Hence, there is a need to take into consideration the addition of fertilizers, especially organic ones [40].

3.4. Physicochemical Properties: Topsoil

These soil types in Arauca are characterized as low in clay content and high in sand fractions (loamy to sandy loam textures). Sand is the dominant fraction of the soil texture with percentages varying between 96.3% and 18.0% in the mountain landscapes with an average value of 62.4%; in foothills, percentages vary between 94.8% and 24.8% with an average value of 69.3%; in hills, between 83.9% and 57.8% with an average value of 72.9%; in alluvial plains, between 87.2% and 4.9% with an average value of 39.1%; alluvial plains with dunes, between 88.0% and 18.7% with an average value of 51.2%; and in alluvial valleys, between 96.8% and 11.3,2% with an average value of 51%. Clays appear at lower percentages with averages of 16.8% (mountains), 12.2% (foothills), 10.7% (hills), 30.4% (alluvial plains), 17.6% (alluvial plains with dunes), and 14.8% (alluvial valleys). Silts have averages of 20.8% (mountains), 18.4% (foothills), 16.4% (hills), 30.5% (alluvial plains), 31.3% (alluvial plains with dunes), and 34.3% (alluvial valleys) (Table 4). The most representative textural classes in the study area are sandy loam, clay loam, and sandy clay loam. These results are consistent with those reported by IGAC [25] and Trujillo-González et al. [41].
Poorly developed and acidic or very strongly acidic (pH from 3.5 to 6.4) predominate in this mountain range owing to steep slopes and high rainfall. It is generally accepted that soil pH influences soil processes and, consequently, affects plant growth and biomass yield. As a soil chemical variable, pH is essential in processes related to the availability of nutritional elements for plants. This is why this parameter is considered a “master soil variable [42].
Contrary to what was pointed out by Chemada et al. [43], it is not observed that the decline in soil fertility is caused by land-use-type changes. Despite the relatively high OM contents in some soils, in the present study, soils have significantly low fertility. According to Eshleman and Hemond, the amount of organic carbon in soil directly affects pH and the redox potential, which, in turn, affect how other chemical species, such as metals, behave.
Conceptually, the different physiographic units of Arauca influence several landscape position-related factors, such as runoff, drainage and soil erosion, and, hence, soil genesis. Depending on soil-forming factors such as relief/topographic factors, different soils have developed over time under distinct ecological conditions.

3.5. Multivariate Analysis

Multivariate analyses are an adequate statistical technique for assessing relations between soil properties [44]. The HCA results appear in Figure 4a. All the analyzed properties were grouped, except for the percentage of sand and available phosphorus. The percentage of clays forms a subgroup with pH and exchangeable bases, which indicates that clay content appears to be also related to soil fertility. The PCA was performed for the first two dimensions (Figure 4b). The first principal component (PC1) explained 33.3% of the total variance, while the second principal component (PC2) explained 17.8%. Together, they accounted for 51.1% of the total variance. Table 5 shows that PC1 was strongly influenced by soil textural and chemical characteristics. Variables like K (0.116), Ca (0.207), Mg (0.214), and CEC (0.190) show strong positive relations, which indicate that clay contents tended to be associated with concentrations of exchangeable bases and CEC [45,46,47]. In contrast, the percentage of sand (−0.197) was inversely related to fertility. PC2 explained 17.8% of the variance, with the largest contribution due to altitude (0.382) and the percentage of OM (0.385), and higher altitude landscapes, such as mountains and foothills, tended to have higher OM contents [48,49]. Finally, PC3 explained 12.04% of the variance, with the largest contribution by pH (0.224), with a relation with elements like K (0.383) and Ca (0.16)1. This suggests that soil acidity is associated with these soils’ low capacity to retain exchangeable bases. The results showed that the first axis presented the highest correlation with the soil physicochemical factors (texture fertility). The second axis presented the highest correlation with environmental conditions (altitude).
In the intertropical zones, precipitation and temperature are the determining agents in soil formation processes because they influence parent material weathering, the formation of horizons and erosion and sedimentation processes, and OM decomposition [44,50]. The soils in the mountainous and humid regions develop in particularly sensitive environments, and it is sometimes difficult to establish whether the chemical weathering of soil development is inhibited by temperature. However, in intertropical regions like Arauca, temperature cannot be the factor to inhibit soil formation, but soil production rates cannot be infinitely high. In this way, the origin of the Arauca soils can be attributed to the integrated effect of soil-forming factors, although climate (high rainfall) is very influential.

4. Discussion

The need to produce food leads to changes in the natural rainforest, which are then converted to agriculture. The natural vegetation patterns of Arauca, as in other parts of the world, have taken decades to hundreds of years to emerge and consolidate, to the extent that land degradation is minimized under stabilizing conditions. This makes ecosystems more resilient to stressors, such as intense rainfall and slope. These soils’ poor fertility makes their agricultural use difficult. Globally speaking, managing acidic soils involves leaving them under natural rainforest cover, especially in tropical areas. This basically entails maintaining soil fertility (even if it is low). However, the need to produce food requires clearing the forest.
The agricultural management strategy can include a proper fertilizer use plan to manage nutrient deficiencies, careful use of machinery to protect the soil, and possibly the application of limestone (or other alkaline material). Soil quality plays a relevant role in agricultural activities, and is of vital importance for ensuring the safety of agricultural products. In regions like the one studied, it is necessary to implement sustainable practices to protect the natural forest, but also to search for naturally suitable soils, despite their acidity, using alternative soil nutrient sources. The spatial variability of soil properties along various landscapes conditions the crop production pattern. These findings provide further evidence about where the best soils should be used by allowing dense plant cover aids in slope stability, soil conservation, and plant establishment in adverse environments. Knowledge on the distribution, degree, extent, and causes of physicochemical soil properties, especially severe soil acidity, in the Arauca department can be used by policy makers, researchers, extension workers, and farmers to improve soil fertility and productivity.
At the global level, inappropriate land-use changes are among the leading causes of soil degradation and declining soil quality. These processes are driven by the loss of vegetation cover, depletion of soil organic matter, reduced fertility, diminished infiltration and water storage capacity, and the weakening of soil resilience and natural regeneration—factors that are essential for maintaining soil functionality and ecosystem services [51]. A common consequence of such degradation is soil acidification, particularly in tropical and subtropical regions, where soils often exhibit pH values below 5.5 for most of the year. Acidic conditions are associated with chemical constraints such as aluminum toxicity and molybdenum deficiency, which limit plant growth and reduce agricultural productivity [52,53]
The main problems of Aruca’s soils stem from their acidity and low nutritional levels, which lead to poor crop growth under agricultural conditions, as acid cation toxicity (Al, Mn, and Fe) and deficiencies of P, Ca, and Mg appear [54]. Thus, as Fageria et al. [55] point out, the availability of essential nutrients becomes limited. To improve soil fertility, in addition to improving soil cover, it is necessary to apply secondary fertilizers if the soil properties are well managed. The base saturation percentage (BSP) is an important chemical property of the soil, with implications both for soil taxonomic classification and as an indicator of soil quality [56]. In the landscapes of the Arauca region, BSP values follow this order: alluvial valley (40.7) > alluvial plain (35.4) > foothills (22.4) > hills (15.6) > mountain (10.4) > alluvial plains with dunes (9.4). This low base saturation is associated with nutrient deficiencies, soil acidification, overall soil degradation, and limitations for plant growth.
Choosing organic matter, particularly those with high N content, e.g., legumes, is essential, according to Michael et al. [57], to manage soil acidity and improve microbial ecology. Finally, these can be corrected by liming, whose final function consists of increasing the pH, alleviating toxicity, and supplementing deficient nutrients.

5. Conclusions

In this study, representative pedons, two on each landscape unit, are described and classified for six different topographical positions, and the soil properties of genetic horizons are analyzed. The results reveal variation in soil morphological and physicochemical properties. Six Reference Soil Groups, namely, Cambisols, Gleysols, Arenosols, Ferralsols, Acrisols, and Leptosols, are identified in the area based on WRB FAO. It refers to soils with high acidity, deficient levels of exchangeable bases, and low fertility. Indeed, the acquired data indicate that the overall pH of the Arauca soils ranged from extremely acidic to slightly acidic (from 3.5 to 6.4), while exchangeable acidity denote acidity-limited soil with values in some areas reaching 74%. In textural terms, they are soils of the clay loam, sandy loam, and clay types. Our results also suggest that total nutrient contents are low to higher in Cambisols > Gleysols > Arenosols> Ferralsols > Acrisols > Leptosols compared with other ranges. The soils on hills show erosive processes that make management practices necessary for conservation purposes. Our findings show that landscape positions and interaction effects of landscape positions and land-use types affect soil physicochemical properties. The best-quality soils are found to occupy a lower landscape position, while conversely less soil quality appears in an upper landscape position. In conclusion, our finding proves that land-use-type change within the same geographic setting can affect the severity of soil acidity due to a rapid organic matter decomposition. In addition, we can conclude that soil quality can be protected and maintained by improving existing land-use practices within both agricultural and forest management areas.
In the humid tropics, the removal of surface litter or organic matter generally results in the depletion of soil fertility in a few years [58]. In this way, the inclusion or maintenance of diverse tree species is a key element in maintaining the production of organic matter and, consequently, generating other positive benefits from the point of view of soil quality. It can be interpreted that the ability of soils to accumulate C is related to some management practices that influence soil C sequestration, particularly the insertion of trees in agricultural systems.

Author Contributions

Conceptualization: J.D.M.-P. and M.A.T.-M.; rainwater sampling and analysis: J.D.M.-P.; data analysis: J.D.M.-P., M.A.T.-M., J.M.T.-G. and R.J.-B.; writing—original draft preparation: J.D.M.-P., M.A.T.-M., J.M.T.-G. and R.J.-B.; writing—review and editing: J.D.M.-P., M.A.T.-M., J.M.T.-G., R.J.-B. and F.J.G.-N. All authors have read and agreed to the published version of the manuscript.

Funding

This research was funded by agreement 532 of 2016 between the University of Llanos and the Gobernación de Arauca.

Data Availability Statement

All the data are contained in the article.

Acknowledgments

The authors are grateful to the University of Llanos for funding this project.

Conflicts of Interest

The authors declare no conflicts of interest.

References

  1. Buol, S.; Southard, R.; Graham, R.; McDaniel, P. Soil Genesis and Classification; John Wiley Sons: Hoboken, NJ, USA, 2011. [Google Scholar]
  2. Bouma, J.; Batjes, N.; Groot, J.R. Exploring land quality effects on world food supply. Geoderma 1998, 86, 43–59. [Google Scholar] [CrossRef]
  3. Burbano-Orjuela, H. El suelo y su relación con los servicios ecosistémicos y la seguridad alimentaria. Rev. De Cienc. Agrícolas 2016, 33, 117–124. [Google Scholar] [CrossRef]
  4. Brevik, E.; Slaughter, L.; Singh, B.; Steffan, J.; Collier, D.; Barnhart, P.; Pereira, P. Soil and human health: Current status and future needs. Air Soil Water Res. 2020, 13, 1178622120934441. [Google Scholar] [CrossRef]
  5. Löbmann, M.T.; Maring, L.; Prokop, G.; Brils, J.; Bender, J.; Bispo, A.; Helming, K. Systems knowledge for sustainable soil and land management. Sci. Total Environ. 2022, 822, 153389. [Google Scholar] [CrossRef]
  6. Brevik, E.; Cerdà, A.; Mataix, J.; Pereg, L.; Quinton, J.; Six, J.; Van Oost, K. The interdisciplinary nature of SOIL. Soil 2015, 1, 117–129. [Google Scholar] [CrossRef]
  7. Gutiérrez, C.; Fernández, C.; Escuer, M.; Campo, R.; Rodríguez, M.; Carbonell, G.; Martín, J. Effect of soil properties, heavy metals and emerging contaminants in the soil nematodes diversity. Environ. Pollut. 2016, 213, 184–194. [Google Scholar] [CrossRef]
  8. Elramady, H.; Brevik, E.; Elsakhawy, T.; Omara, A.; Amer, M.; Abowaly, M.; Prokisch, J. Soil and Humans: A Comparative and A Pictorial Mini-Review. Egypt. J. Soil Sci. 2022, 62, 101–122. [Google Scholar] [CrossRef]
  9. Hartemink, A.; McBratney, A. A soil science renaissance. Geoderma 2008, 148, 123–129. [Google Scholar] [CrossRef]
  10. McBratney, A.; Field, D.; Koch, A. The dimensions of soil security. Geoderma 2014, 213, 203–213. [Google Scholar] [CrossRef]
  11. Unidad de Planificación Rural Agropecuaria (UPRA) Sistema de Información para la Planificación Rural Agropecuaria, S.I.P.R.A. Planificación Nacional. Frontera Agrícola. República De Colombia. 2025. Available online: https://sipra.upra.gov.co/nacional (accessed on 2 March 2025).
  12. Ministerio de Ambiente y Desarrollo Sostenible (MADS). Política para la Gestión Sostenible del Suelo; Grupo de Divulgación de Conocimiento Y Cultura Ambiental—Centro de Documentación: Bogotá, DC, Colombia, 2016; 94p, ISBN 978-958-8901-24-4. Available online: https://archivo.minambiente.gov.co/images/AsuntosambientalesySectorialyUrbana/pdf/suelo/Pol%C3%ADtica_para_la_gesti%C3%B3n_sostenible_del_suelo_FINAL.pdf (accessed on 15 November 2024).
  13. Zinck, J.; Metternicht, G.; Bocco, G.; Del Valle, H. Geopedology: An Integration of Geomorphology and Pedology for Soils and Landscape Studies; Springer International Publishing: Cham, Switzerland, 2016; 556p. [Google Scholar]
  14. Minasny, B.; Akoeb, E.N.; Sabrina, T.; Wadoux, A.; McBratney, A. History and interpetation of early soil and organic matter investigations in Deli, Sumatra, Indonesia. Catena 2020, 195, 104909. [Google Scholar] [CrossRef]
  15. Lehmann, J.; Bossio, D.A.; Kögel-Knabner, I.; Rillig, M.C. The concept and future prospects of soil health. Nat. Rev. Earth Environ. 2020, 1, 544–553. [Google Scholar] [CrossRef]
  16. Ali, D.; Hussain, A.; Begum, F.; Lin, C.; Ali, S.; Ahsan, W.A.; Hussain, A.; Hussain, F. Assessing the impact of land use and land cover changes on soil properties and carbon sequestration in the upper Himalayan Region of Gilgit, Pakistan. Sustain. Chem. One World 2025, 5, 100038. [Google Scholar] [CrossRef]
  17. Briassoulis, H. Combating land degradation and desertification: The land-use planning quandary. Land 2019, 8, 27. [Google Scholar] [CrossRef]
  18. Roy, P.S.; Ramachandran, R.M.; Paul, O.; Thakur, P.K.; Ravan, S.; Behera, M.D.; Sarangi, C.; Kanawade, V.P. Anthropogenic land use and land cover changes—A review on its environmental consequences and climate change. J. Indian Soc. Remote Sens. 2022, 50, 1615–1640. [Google Scholar] [CrossRef]
  19. Oumenskou, H.; El Baghdadi, M.; Barakat, A.; Aquit, M.; Ennaji, W.; Karroum, L.; Aadraoui, M. Multivariate statistical analysis for spatial evaluation of physicochemical properties of agricultural soils from Beni-Amir irrigated perimeter, Tadla plain, Morocco. Geol. Ecol. Landsc. 2019, 3, 83–94. [Google Scholar] [CrossRef]
  20. Departamento Nacional de Planeación (DNP). Visión de Desarrollo Territorial Departamental Visión Arauca 2032: Geoestratégica, Innovadora y Nuestra; Departamento Nacional de Planeación (DNP): Bogotá, Colombia, 2011; ISSN 2256-1854. [Google Scholar]
  21. Trujillo, F.; Anzola, F. (Eds.) Biodiversidad en El Departamento de Arauca. Gobernación de Arauca, Fundación Omacha Y Fundación Ecollano. 2019, Bogotá 384 Páginas (PDF) Vegetación Del Departamento de Arauca. Available online: https://www.researchgate.net/publication/352057426_Vegetacion_del_Departamento_de_Arauca (accessed on 9 May 2025).
  22. Rangel-Ch, J.O.; Celis, V. Suelos del Territorio Sabanas y Humedales de Arauca, Colombia. Colombia Diversidad Biótica XX: Suelos Sabanas y Humedales de Arauca; Universidad Nacional de Colombia: Bogotá, Colombia, 2019; pp. 171–197. [Google Scholar]
  23. Lal, R.; Bouma, J.; Brevik, E.; Dawson, L.; Field, D.J.; Glaser, B.; Hatano, R.; Hartemink, L.E.; Kosaki, T.; Lascelles, B.; et al. Soils and sustainable development goals of the United Nations: An International Union of Soil Sciences perspective. Geoderma Reg. 2021, 25, e00398. [Google Scholar] [CrossRef]
  24. Prüssmann, J.; Rincón, S.; Tavera, H.; Suárez, C. Estructura Ecológica Principal de la Orinoquia Colombiana–Actualización Metodológica Mapa Sulu; Federal Ministry for the Environment Bature Conservation, Building and Nuclear Safety: Cali, Colombia, 2020; p. 88. ISBN 978-958-52986-5-1. [Google Scholar]
  25. Instituto Geografico Agustin Codazzi (IGAC). Estudio General de Suelos y Zonificación de Tierras Arauca: Escala 1,100,000; Instituto Geografico Agustin Codazzi (IGAC): Bogotá, Colombia, 2017. [Google Scholar]
  26. Instituto Geografico Agustin Codazzi (IGAC). Zonificación Climática Para Levantamiento de Suelos; Instituto Geografico Agustin Codazzi (IGAC): Bogotá, Colombia, 2021. [Google Scholar]
  27. FAO. Guidelines for Soil Description, 4th ed.; FAO/UNESCO: Rome, Italy, 2006. [Google Scholar]
  28. Anne, A. Sur le dosage rapid du carbone organique de sols. Ann. Agro 1945, 2, 161–172. [Google Scholar]
  29. Nelson, D.W.; Sommers, L. Total nitrogen analysis of soil and plant tissues. J. Assoc. Off. Anal. Chem. 1980, 63, 770–778. [Google Scholar] [CrossRef]
  30. Bray, R.; Kurtz, L. Determination of Total Organic and Available Forms of Phosphorus in Soils. Soil Sci. 1945, 59, 39–45. [Google Scholar] [CrossRef]
  31. Bouyoucos, G. A recalibration of the hydrometer method for making mechanical analysis of soils. Agron. J. 1951, 43, 434–438. [Google Scholar] [CrossRef]
  32. Thomas, G. Exchangeable cations. In Methods of Soil Analysis Part 2; Page, A.L., Miller, R.H., Keeney, D.R., Eds.; American Society of Agronomy, Soil Science Society of America: Madison, WI, USA, 1982; pp. 159–165. [Google Scholar]
  33. Venables, W.; Smith, D. An Introduction to R; R. Core Team: Auckland, New Zealand, 2022. [Google Scholar]
  34. IUSSWorking Group, W.R.B. World Reference Base for Soil Resources 2014. International Soil Classification System for Naming Soils and Creating Legends for Soil Maps. Update 2015. World Soil Resources Report 106. FAO: Rome, Italy, 2015. [Google Scholar]
  35. Soil Survey Staff. Key to Soil Taxonomy, 12th ed.; USDA-Natural Resources; Conservation Service: Washington DC, USA, 2014. [Google Scholar]
  36. Wilding, L.P. Spatial variability: Its documentation, accommodation and implication to soil survey. In Soil Spatial VariabilityNielsen; Nielsen, D.R., Bouma, J., Eds.; Pudoc: Wagenigen, The Netherlands, 1985; pp. 166–189. [Google Scholar]
  37. Kumar, S.; Suyal, D.; Yadav, A.; Shouche, Y.; Goel, R. Microbial diversity and soil physiochemical characteristic of higher altitude. PLoS ONE 2019, 14, e0213844. [Google Scholar] [CrossRef] [PubMed]
  38. Gebeyaw, T. Assessment of soil fertility variation in different land uses and management practices in maybar watershed, south wollo zone, North Ethiopia. Int. J. Environ. Bioremediat. Biodegrad. 2015, 1, 15–22. [Google Scholar]
  39. Laekemariam, F.; Kibret, K.; Shiferaw, H. Potassium (K)-to-magnesium (Mg) ratio, its spatial variability and implications to potential Mg-induced K deficiency in Nitisols of Southern Ethiopia. Agric. Food Secur. 2018, 7, 1–10. [Google Scholar] [CrossRef]
  40. Michael, P.S. Role of organic fertilizers in the management of nutrient deficiency, acidity, and toxicity in acid soils—A review. J. Glob. Agric. Ecol. 2021, 12, 19–30. [Google Scholar]
  41. Trujillo-González, J.; Mahecha-Pulido, J.; Torres-Mora, M.; Brevik, E.; Keesstra, S.; Jiménez-Ballesta, R. Impact of potentially contaminated river water on agricultural irrigated soils in an equatorial climate. Agriculture 2017, 7, 52. [Google Scholar] [CrossRef]
  42. Neina, D. The role of soil pH in plant nutrition and soil remediation. Appl. Environ. Soil Sci. 2019, 2109, 5794869. [Google Scholar] [CrossRef]
  43. Chemada, M.; Kibret, K.; Fite, T. Influence of different land use types and soil depths on selected soil properties related to soil fertility in warandhab area, Horo guduru wallaga zone, Oromiya, Ethiopia. Int. J. Environ. Sci. Nat. Resour. 2017, 4, 555634. [Google Scholar]
  44. Trujillo, J.; Torres, M.; Ballesta, R.; Brevik, E. Spatial variability of the physicochemical properties of acidic soils along an altitudinal gradient in Colombia. Environ. Earth Sci. 2022, 81, 108. [Google Scholar] [CrossRef]
  45. Bronick, C.; Lal, R. Soil structure and management: A review. Geoderma 2005, 124, 3–22. [Google Scholar] [CrossRef]
  46. Kome, G.; Enang, R.; Tabi, F.; Yerima, B. Influence of clay minerals on some soil fertility attributes: A review. Open J. Soil Sci. 2019, 9, 155–188. [Google Scholar] [CrossRef]
  47. Karbout, N.; Brahim, N.; Mlih, R.; Moussa, M.; Bousnina, H.; Weihermuller, L.; Bol, R. Bentonite clay combined with organic amendments to enhance soil fertility in oasis agrosystem. Arab. J. Geosci. 2021, 14, 1–10. [Google Scholar] [CrossRef]
  48. Dai, W.; Huang, Y. Relation of soil organic matter concentration to climate and altitude in zonal soils of China. Catena 2006, 65, 87–94. [Google Scholar] [CrossRef]
  49. Li, X.; McCarty, G.; Du, L.; Lee, S. Use of topographic models for mapping soil properties and processes. Soil Syst. 2020, 4, 32. [Google Scholar] [CrossRef]
  50. Marín, G.; Rueda, G.; Menjivar, J. Evaluation of physicochemical properties in agricultural soils on the flat and piedmont areas of Valle del Cauca, Colombia with emphasis on degradation. Environ. Earth Sci. 2023, 82, 157. [Google Scholar] [CrossRef]
  51. Khormali, F.; Ajami, M.; Ayoubi, S.; Srinivasarao, C.; Wani, S.P. Role of deforestation and hillslope position on soil quality attributes of loess-derived soils in Golestan province, Iran. Agric. Ecosyst. Environ. 2009, 134, 178–189. [Google Scholar] [CrossRef]
  52. Fernández-Delgado Juárez, M.; Gómez-Brandón, M.; Knapp, A.; Stöhr, D.; Insam, H. Chemical and microbiological properties of alpine forest soils: Effects of pelletized ashes in a short-term trial. For. Ecol. Manag. 2015, 357, 42–49. [Google Scholar] [CrossRef]
  53. Tilman, D.; Cassman, K.G.; Matson, P.A.; Naylor, R.; Polasky, S. Agricultural sustainability and intensive production practices. Nature 2002, 418, 671–677. [Google Scholar] [CrossRef]
  54. Rahman, M.; Lee, S.-H.; Ji, H.; Kabir, A.; Jones, C.; Lee, K.W. Importance of mineral nutrition for mitigating aluminum toxicity in plants on acidic soils: Current status and opportunities. Int. J. Mol. Sci. 2018, 19, 3073. [Google Scholar] [CrossRef]
  55. Fageria, N.; Baligar, V. Ameliorating soil acidity of tropical oxisols by liming for sustainable crop production. Adv. Agron. 2008, 99, 345–399. [Google Scholar]
  56. Rawal, A.; Chakraborty, S.; Li, B.; Lewis, K.; Godoy, M.; Paulette, L.; Weindorf, D.C. Determination of base saturation percentage in agricultural soils via portable X-ray fluorescence spectrometer. Geoderma 2019, 338, 375–382. [Google Scholar] [CrossRef]
  57. Michael, P.S. The importance of sustainable management of acid soils in the humid tropics under climate change and the future research directions. Ecofeminism Clim. Change 2023, 4, 39–50. Available online: https://bit.ly/3FeaE3K (accessed on 12 May 2025). [CrossRef]
  58. Ferreira, S.J.F.; Luizão, F.J.; Miranda, S.Á.F.; Silva, M.D.S.R.D.; Vital, A.R.T. Nutrients in soil solution in an upland forest submitted to selective logging in central Amazonia. Acta Amaz. 2006, 36, 59–68. [Google Scholar] [CrossRef]
Figure 1. Geographic location of the study area and sampling points according to the landscapes.
Land 14 01073 g001
Figure 2. Climatic diagrams of the average precipitation and minimum and maximum temperatures in the six landscapes of the department of Arauca for the period of 1988 to 2021: (A) mountain, (B) foothills, (C) hilly area, (D) alluvial plain, (E) alluvial plains with dunes, and (F) alluvial valley.
Land 14 01073 g002
Figure 4. (a) Dendrogram for hierarchical cluster analysis of given variables and (b) PCA biplot obtained for the physicochemical properties of soil.
Land 14 01073 g004
Table 1. Brief description of the landscapes; units of the Arauca region.
LandscapesArea (ha)Percentage Representation of the RegionAnnual Average Precipitation (mm)Annual Average Temperature (°C)Lithology/SedimentsRelief TypeSlope (%)Altitude (m.s.n.m.)
Alluvial plain1,103,86746.4159931.0Alluvial depositsTerrace<3200 to 500
Alluvial plains with dunes 603,86825.4158330.4Alluvial depositsSand fields<3100 to 200
Mountain279,88411.7211113.4Quartz sandstonesHogbacks and ridges12 to more 75>1500 to 4500
Alluvial valley184,4907.8164330.9Alluvial depositsFloodplains<3150 to 500
Foothill178,3367.5203925.3Fluvio-glacial sedimentsAlluvial fans3 to 25500 to 1000
Hills26,4751.11135922.1Tertiary clays and sandstonesHills and knolls12 to 50500 to 1000
Table 2. General and morphological characteristics of the studied soils (location coordinates, rock factor, topography, drainage, morphology). Soil type according to the IUSS Soil Group [34] and Soil Survey Staff [35].
ProfileLandscapesLocation (Coordinates)Rock FactorTopographyDrainageMorphologySoil Type
IUSS Group/Soil Taxonomy
1Mountain6.1550139 latitude; −72.248375 longitudeSedimentary RockStrongly steepWell-drainedA-RLithic Cambisol
Lithic Udorthents
26.2257222 latitude; −71.982 longitudeArcillolitaSteepWell-drainedAp-Bw-CDystric Acrisol (Dystric, Novic)
Oxic Dystrudepts
3Foothills6.4353056 latitude; −71.8096944 longitudeSilt and clay sedimentsSlightly steepWell-drainedA-Bw-CHaplic Cambisol (Dystric)
Typic Dystrudepts
46.2357389 latitude; −71.9319917 longitudeSilt and clay sedimentsSlightly steepWell-drainedA-CHaplic Arenosol (Dystric)
Typic Udipsamments
5Hills6.3097222 latitude; −71.8218056 longitudeSandy sedimentsSlightly steepPoorly-drainedA-CFluvic Gleysol (Epigleyic)
Typic Fluvaquents
66.3183667 latitude; −71.7843306 longitudeClaystoneSteepWell-drainedAp-Bw-Bo-CHaplic Ferralsol (Dystric)
Typic Hapludox
7Alluvial plain6.5394722 latitude; −71.4946389 longitudeSilt and clay sedimentsFlat or almost flatPoorly-drainedAp-Bw-Bo-CgPlinthic Ferralsol (Dystric)
Plinthic Haplaquox
87.0282194 latitude; −71.3927944 longitudeSilt and clay sedimentsFlat or almost flatPoorly-drainedAp-Bw1-Bw2Eutric Gleysol (Fluvic)
Fluvaquentic Eutrudepts
9Alluvial plains with dunes6.7058056 latitude; −70.3989722 longitudeSilt and clay sedimentsFlat or almost flatPoorly-drainedAp-Bw-Bg1-Bg2Dystric Gleysol (Endogleyic)
Typic Endoaquepts
106.8048889 latitude; −70.46375 longitudeSilt and clay sedimentsFlat or almost flatPoorly-drainedAp-Bg-CgHistic Gleysol (Dystric)
Typic Humaquepts
11Alluvial valley6.9528333 latitude; −71.7748056 longitudeSandy sedimentsFlat or almost flatPoorly-drainedA-Bw1-Bw2-CGleyic Cambisol (Endogleyic)
Aquic Dystrudepts
126.6602222 latitude; −71.5619444 longitudeSilt and clay sedimentsFlat or almost flatPoorly-drainedA-Bg-Cg1-Cg2Fluvic Gleysol (Dystric)
Fluventic Endoaquepts
Table 3. General and pedological characteristics of the representative investigated soils. Soil groups based on the IUSS Working Group WRB [34].
Landscapes(Mountain)(Foothills)(Hills)(Alluvial Plain)(Alluvial Plains with Dunes)(Alluvial Valley)
Profile/MorphologyAcrisolCambisolFerralsolCambisolGleysolGleysol
ApBwCABwCApBwBoCApBw1Bw2ApBwBg1Bg2ABgCg1Cg2
Coordinates GD6.225722 latitude; −71.982 longitude6.4353056 latitude; −71.8096944 longitude6.3183667 latitude; −71.7843306 longitude7.0282194 latitude; −71.3927944 longitude6.7058056 latitude; −70.3989722 longitude6.6602222 latitude; −71.5619444 longitude
Depth (cm)0–1414–3333–500–2020–4242–750–2222–4242–9090–1350–1212–3838–740–1515–4040–7171–1200–1313–2626–6868–110
Sand (%)84.35880.391.281.081.257.853.649.849.514.225.014.944.344.050.342.347.223.099.299
Silt (%)9.724.09.78.811.018.824.124.228.124.259.254.762.844.542.034.538.532.040.00.00.0
Clay (%)6.01810.00.08.00.018.122.222.126.326.620.322.311.213.015.219.220.837.00.81.0
TextureLSSLLSSLSLSSLSCLLSCLZLZLZLLLLLLCLSS
OM (%)2.852.171.021.491.040.331.50.70.20.13.40.50.42.450.780.290.285.341.860.280.28
Organic carbon (%)1.461.120.520.760.530.170.80.350.10.061.80.280.21.260.400.150.142.740.950.140.14
P (mg/kg−1)2.102.075.02.072.072.076.603.71.55.411.47.06.842.9748.202.0727.9778.7586.7666.4074.42
Exchangeable acidity saturation (%)83.6283.8281.3139.1562.3659.4186.294.095.796.60.04.80.021.7969.6878.5382.954.131.10.00.0
pH (water 1:1)4.54.75.05.14.94.94.24.34.34.36.05.55.64.64.74.64.55.44.96.16.0
Al (cmol kg−1)5.825.753.960.741.641.202.03.02.02.80.00.270.00.731.932.453.260.733.160.00.0
Cation Exchange Complex (cmol kg−1)Ca2+0.290.290.290.340.300.290.20.10.00.011.23.43.01.780.340.290.2914.125.040.950.91
Mg2+0.180.180.180.180.180.180.10.010.00.023.01.82.20.540.200.180.182.351.480.410.32
K+0.550.520.320.510.390.230.10.040.00.030.10.050.10.180.180.080.080.490.360.160.14
Na+0.120.120.120.120.120.120.00.020.00.040.10.040.00.120.120.120.120.120.120.120.12
Base saturation (%)7.669.1911.6125.3929.2924.127.04.63.92.883.774.666.733.9420.7412.7412.3671.5844.9350.4645.85
Notes: soil texture: sand (S); loamy sand (LS); sandy loam (SL); silt loam (ZL); sandy clay loam (SCL); clay loam (CL); loam (L). Morphology: mineral layer formed on the ground surface (A), layer formed below layer A with illuvial concentration of clay (B), and layer slightly affected by pedogenic processes and lacking characteristics of other layers (C).
Table 4. Descriptive statistics and analysis of the difference in means of the Kruskal–Wallis test between soils from different landscapes for altitude (m.a.s.l.), organic matter (OM%), available phosphorus (mg/kg−1), pH, aluminum (cmol kg(+)−1), cation exchange capacity (CEC) cmol kg(+)−1, exchangeable bases (Ca2+, Mg2+, K+ (cmol(+) kg−1), and exchangeable aluminum (AlH) cmol(+) kg−1).
LandscapesAltitude (m)Sand (%)Clay (%)Silt (%)pHOM (%)P (mg kg−1)Ca2+Mg2+K+CEC (cmol(+) kg−1)% Exchangeable Acidity SaturationAl (cmol(+) kg−1)% Base Saturation
MountainMe996.462.416.820.84.,34.63.50.40.20.25.170.73.410.4
SD875.319.614.37.30.46.73.20.70.20.25.321.03.410.7
CV%87.831.584.735.28.6146.189.5175.299.087.6103.029.7101.5102.9
Max3400.096.353.332.55.033.415.63.60.90.722.596.215.348.1
Min180.018.02.01.73.70.70.50.00.00.00.334.00.11.2
N2525252525252525252525252525
FoothillsMe337.569.312.218.44.51.46.70.60.30.12.956.31.222.4
SD132.219.98.612.20.40.711.30.70.40.22.721.70.512.3
CV%39.228.870.666.07.846.7168.6119.3144.2122.894.338.644.554.9
Max550.094.830.544.75.12.848.32.11.40.612.094.02.243.4
Min180.024.80.02.13.50.60.40.00.00.00.715.30.43.2
N1717171717171717171717171717
HillsMe421.872.910.716.44.61.310.60.40.10.11.868.41.115.6
SD82.08.13.95.50.30.419.80.50.20.10.722.40.512.1
CV%19.411.136.433.76.733.2186.8119.7157.5105.941.932.740.377.7
Max570.083.918.124.25.12.168.61.60.70.23.694.72.039.3
Min310.057.86.68.04.20.80.00.00.00.00.730.60.52.0
N1111111111111111111111111111
Alluvial plainMe164.039.130.430.54.92.036.32.21.20.25.544.92.435.4
SD53.422.717.017.10.61.471.12.61.40.23.833.84.126.4
CV%32.658.255.955.911.966.5196.0115.8117.080.569.675.3173.174.6
Max390.087.264.273.76.46.3357.011.24.90.714.6100.025.488.9
Min118.04.92.02.84.00.30.00.00.00.00.60.00.01.7
N4343434343434343434343434343
Alluvial plains with dunesMe142.651.217.631.34.52.73.90.20.10.11.974.01.59.4
SD45.521.814.922.00.22.89.50.40.10.11.017.30.98.8
CV%31.942.684.870.24.6101.7240.9159.7111.8103.750.423.460.593.3
Max220.088.054.570.04.911.443.01.80.50.24.396.84.233.9
Min100.018.76.05.24.00.20.00.00.00.00.521.80.41.3
N2121212121212121212121212121
Alluvial valleyMe254.251.014.834.34.81.929.42.61.00.35.736.21.740.7
SD175.923.814.616.90.51.442.13.41.00.24.024.31.323.9
CV%69.246.798.949.29.770.7143.2131.5101.366.370.366.978.258.5
Max622.096.858.469.75.75.3165.014.13.50.617.879.54.6105.5
Min125.011.32.01.24.10.70.00.30.20.01.34.10.210.5
N1616161616161616161616161616
Notes: Mean values (Me), standard deviation (SD), coefficient of variation (CV), maximum (Max), minimum (Min), and number (N).
Table 5. Component coefficient matrix for soil physicochemical properties.
Soil PropertiesComponent
123
Altitude−0.0260.3820.135
Sand (%)−0.1970.0240.368
Clay (%)0.1640.005−0.127
Silt (%)0.128−0.041−0.415
pH0.141−0.1980.224
OM0.0570.3850.043
P0.025−0.1370.308
Ca2+0.207−0.0700.161
Mg2+0.214−0.0510.065
K+0.1160.0500.383
CEC0.1900.1460.126
Al0.0720.286−0.104
Total variance (%)33.3317.8012.03
Cumulative variance (%)33.3351.1463.18
Notes: cation exchange capacity (CEC), organic matter (OM), aluminum (Al), phosphorus (P), potassium (K), calcium (Ca), and magnesium (Mg).
Disclaimer/Publisher’s Note: The statements, opinions and data contained in all publications are solely those of the individual author(s) and contributor(s) and not of MDPI and/or the editor(s). MDPI and/or the editor(s) disclaim responsibility for any injury to people or property resulting from any ideas, methods, instructions or products referred to in the content.

