Review

Multimodal Spatio-Temporal Data Visualization Technologies for Contemporary Urban Landscape Architecture: A Review and Prospect in the Context of Smart Cities

School of Architecture, Southeast University, Nanjing 210096, China
*
Author to whom correspondence should be addressed.
Land 2025, 14(5), 1069; https://doi.org/10.3390/land14051069
Submission received: 9 April 2025 / Revised: 9 May 2025 / Accepted: 13 May 2025 / Published: 15 May 2025
(This article belongs to the Special Issue Geospatial Data for Landscape Change (Second Edition))

Abstract

:
The development of smart cities provides a vital foundation for the intelligent advancement of landscape architecture and engineering technologies, where multimodal spatio-temporal data visualization plays a key role. This study conducts a scoping review to explore the advancements in multimodal spatio-temporal data visualization within landscape architecture and to assess their potential to drive urban intelligence and sustainable development. This review analyzes publication trends, data types, application scenarios, and identifies research challenges and future directions. The results indicate that the complementary integration of basic data and sensing data has established relatively mature technical pathways for clustering, correlation analysis, process simulation, and trend forecasting. Future research should prioritize real-time data presentation, efficient platform integration, intelligent processing and scientific mapping of massive information, and interdisciplinary research and practical applications. This study lays a foundation for the development of intelligent landscape architecture, highlighting promising prospects for technological advancement.

1. Introduction

With the continuous intensification of the global urbanization process, problems arise in urban management and resource allocation. This further intensifies the demand for solutions to balance intensive human activities with environmental sustainability. The concept of a smart city has been put forward, aiming to utilize information and communication technologies (ICTs) to improve the functions of cities and the quality of life of citizens [1,2]. Since IBM officially proposed the vision of a “smart city”, thousands of smart city cases have emerged worldwide. Notable examples include Amsterdam Smart City [3], Smart Dubai [4], Barcelona Digital (Smart) City [5], and Masdar City [6]. These cases, spanning dimensions such as energy transition, digital governance, IoT integration, and zero-carbon urban design, offer diverse paradigms for constructing sustainable landscape environments.
In this context, the rapid development of a new generation of information technologies, such as virtual reality, machine learning, cloud computing, big data, and the Internet of Things, as well as the widespread application of dynamic observation technologies from multiple disciplines like remote sensing imagery, hydrogeology, and information science in the acquisition of landscape architecture information [7], has led to an explosive growth of spatio-temporal data [8]. Multimodal spatio-temporal data refer to datasets collected from multiple sources and modalities, which possess both spatial and temporal attributes simultaneously. These datasets are characterized by high dimensionality, strong dynamic variability, and diverse formats. Compared with traditional static or single-mode datasets, multimodal spatio-temporal data can effectively capture the complexity of the landscape system through synchronous real-time monitoring, historical trends, and multi-scale spatial relationships. In recent years, how to effectively integrate landscape architecture information with potential research value from multimodal spatio-temporal data, accurately describe the dynamic evolution and behavioral processes of the landscape environment, and further achieve scientific and reasonable reasoning and decision-making has become an urgent problem to be solved in the intelligent development process of landscape architecture [9].
Visualization techniques are effective means to extract key information from data and interpret multimodal spatio-temporal data [10]. In the field of landscape architecture, visualization is also an important tool for communicating analytic results, abstracting ideas and design principles, as well as informing and persuading participants [11,12,13]. The evolution of spatio-temporal data visualization exhibits phased characteristics paralleling the development of digital landscape technologies. As a critical subset of geovisualization [14], landscape visualization has progressed through three pivotal phases. Initially rooted in traditional cartography (pre-1980s), static 2D maps and hand-drawn plans dominated the representation of geographic and design data, exemplified by McHarg’s overlay analysis method, which laid the foundation for systematic spatial decision-making. The digital transformation phase (1980s–2000s) emerged with computer-aided design (CAD) and geographic information systems (GISs) [15]. These tools enabled 3D terrain modeling (e.g., digital elevation models) and data-driven spatial analysis, shifting landscape planning from intuitive drafting to precision-oriented workflows. In the intelligent interaction phase (2010s–present), advancements in 3D laser scanning, IoT, and immersive technologies have redefined visualization paradigms [16]. Multimodal data integration (e.g., point clouds, real-time sensor streams) supports participatory design through interactive 3D environments [17].
Contemporary landscape research and planning processes now extensively incorporate multimodal spatio-temporal data technologies, substantially enhancing the scientific rigor and practical value of visualization studies [18]: from model prediction in the investigation and analysis stage [19], to scheme exploration and design optimization in the planning and design stage [20], and to post-construction feedback evaluation [21] as well as intelligent operation and management [22]. These applications have demonstrated innovations in dynamic studies, non-intrusive surveys, and quantitative analyses, exhibiting a comprehensive trend of multimodal spatio-temporal data-assisted design and research.
While the importance of visualizing multimodal spatio-temporal data in landscape architecture has been widely acknowledged, and the literature frequently emphasizes the significance of utilizing such data for research and visualizing its outcomes, most current studies remain focused on the application of specific technologies and methods. There is still a noticeable lack of a comprehensive framework for classifying and evaluating the visualization methods of multimodal spatio-temporal data. A few studies have examined visualization methods at particular stages of research. For example, Nasr-Azadani et al. (2022) reviewed the use and effectiveness of landscape visualization techniques across varying levels of stakeholder engagement [23]. Hollberg et al. (2021) provided a structured overview of the visualization of lifecycle assessment results, concentrating on graphical representations utilized during early and detailed design phases [24]. Eilola et al. (2023) systematically analyzed the application of 3D visualization technologies in participatory urban and landscape planning, evaluating their usability and potential [25]. Miranda et al. (2024) focused on reviewing the active areas of visualization research related to 3D urban data visualization analysis [26]. While these studies compare a range of visualization approaches, they lack a comprehensive evaluation and synthesis of methods tailored to multimodal spatio-temporal data.
However, several critical gaps in the existing literature hinder progress in this area. First, there is no systematic framework for classifying multimodal spatio-temporal data and their corresponding visualization tasks, leaving researchers and practitioners without clear guidance on aligning data characteristics with visualization objectives. Second, while some studies explore the application of visualization techniques, they rarely address the limitations or interdisciplinary challenges that arise when implementing these technologies in landscape architecture. Finally, the absence of consensus on how to map specific data characteristics to suitable visualization tasks restricts the practical application of multimodal spatio-temporal data and undermines the scientific rigor of design decisions.
Based on the above analysis, in order to fill these gaps, this study employs the scoping review method to review the applications of multimodal spatio-temporal data visualization technologies in modern landscapes. Scoping review is an increasingly popular integrative research method [27], which focuses on understanding the scope and nature of the research topic and provides an overview of the relevant research field [28]. It aims to explore the overall context of the relevant literature and map out the conceptual framework, rather than providing definitive answers to specific research questions [29]. In this study, the scoping review is considered appropriate because the objective is to understand the scope and nature of previous studies and explore various visualization application scenarios to grasp the overall context [30].
Specifically, the research defines three areas of investigation:
  • What are the types of multimodal spatio-temporal data in landscape architecture, and how can they be used in corresponding visualization tasks?
  • What are the application scenarios of multimodal spatio-temporal data visualization techniques in landscape architecture?
  • What are the challenges and future directions faced by multimodal spatio-temporal data visualization techniques?

2. Materials and Methods

This study has chosen the scoping literature review method to understand the context and development trends of the visualization research in the field of landscape architecture, where multimodal spatio-temporal data are applied. The field is characterized by diverse applications and interdisciplinary challenges. Specifically, this method focuses on understanding the scope and nature of the research topic and providing an overview of the relevant research field. It can incorporate a wide range of research, methodologies, and data types, thus facilitating the development of a conceptual framework for the visualization of multimodal spatio-temporal data in landscape architecture.
The scoping review methodology was informed by approaches outlined in Arksey and O’Malley [28] and Levac et al. [31]. This approach typically classifies previous research works based on study design or other key characteristics, providing a preliminary assessment of the potential scale and scope of the literature [32]. Scoping reviews are similar to systematic reviews in their systematic, transparent, and replicable approach, but do not aim to be exhaustive and generally exclude formal quality assessments [33].
The scoping review process followed five key stages: (1) identifying the research question, (2) identifying relevant studies, (3) study selection, (4) charting the data, and (5) collating, summarizing, and reporting the results. After determining the research questions guiding this review, we defined a specific search strategy to objectively identify the relevant research projects, including the search keywords and literature sources [31].

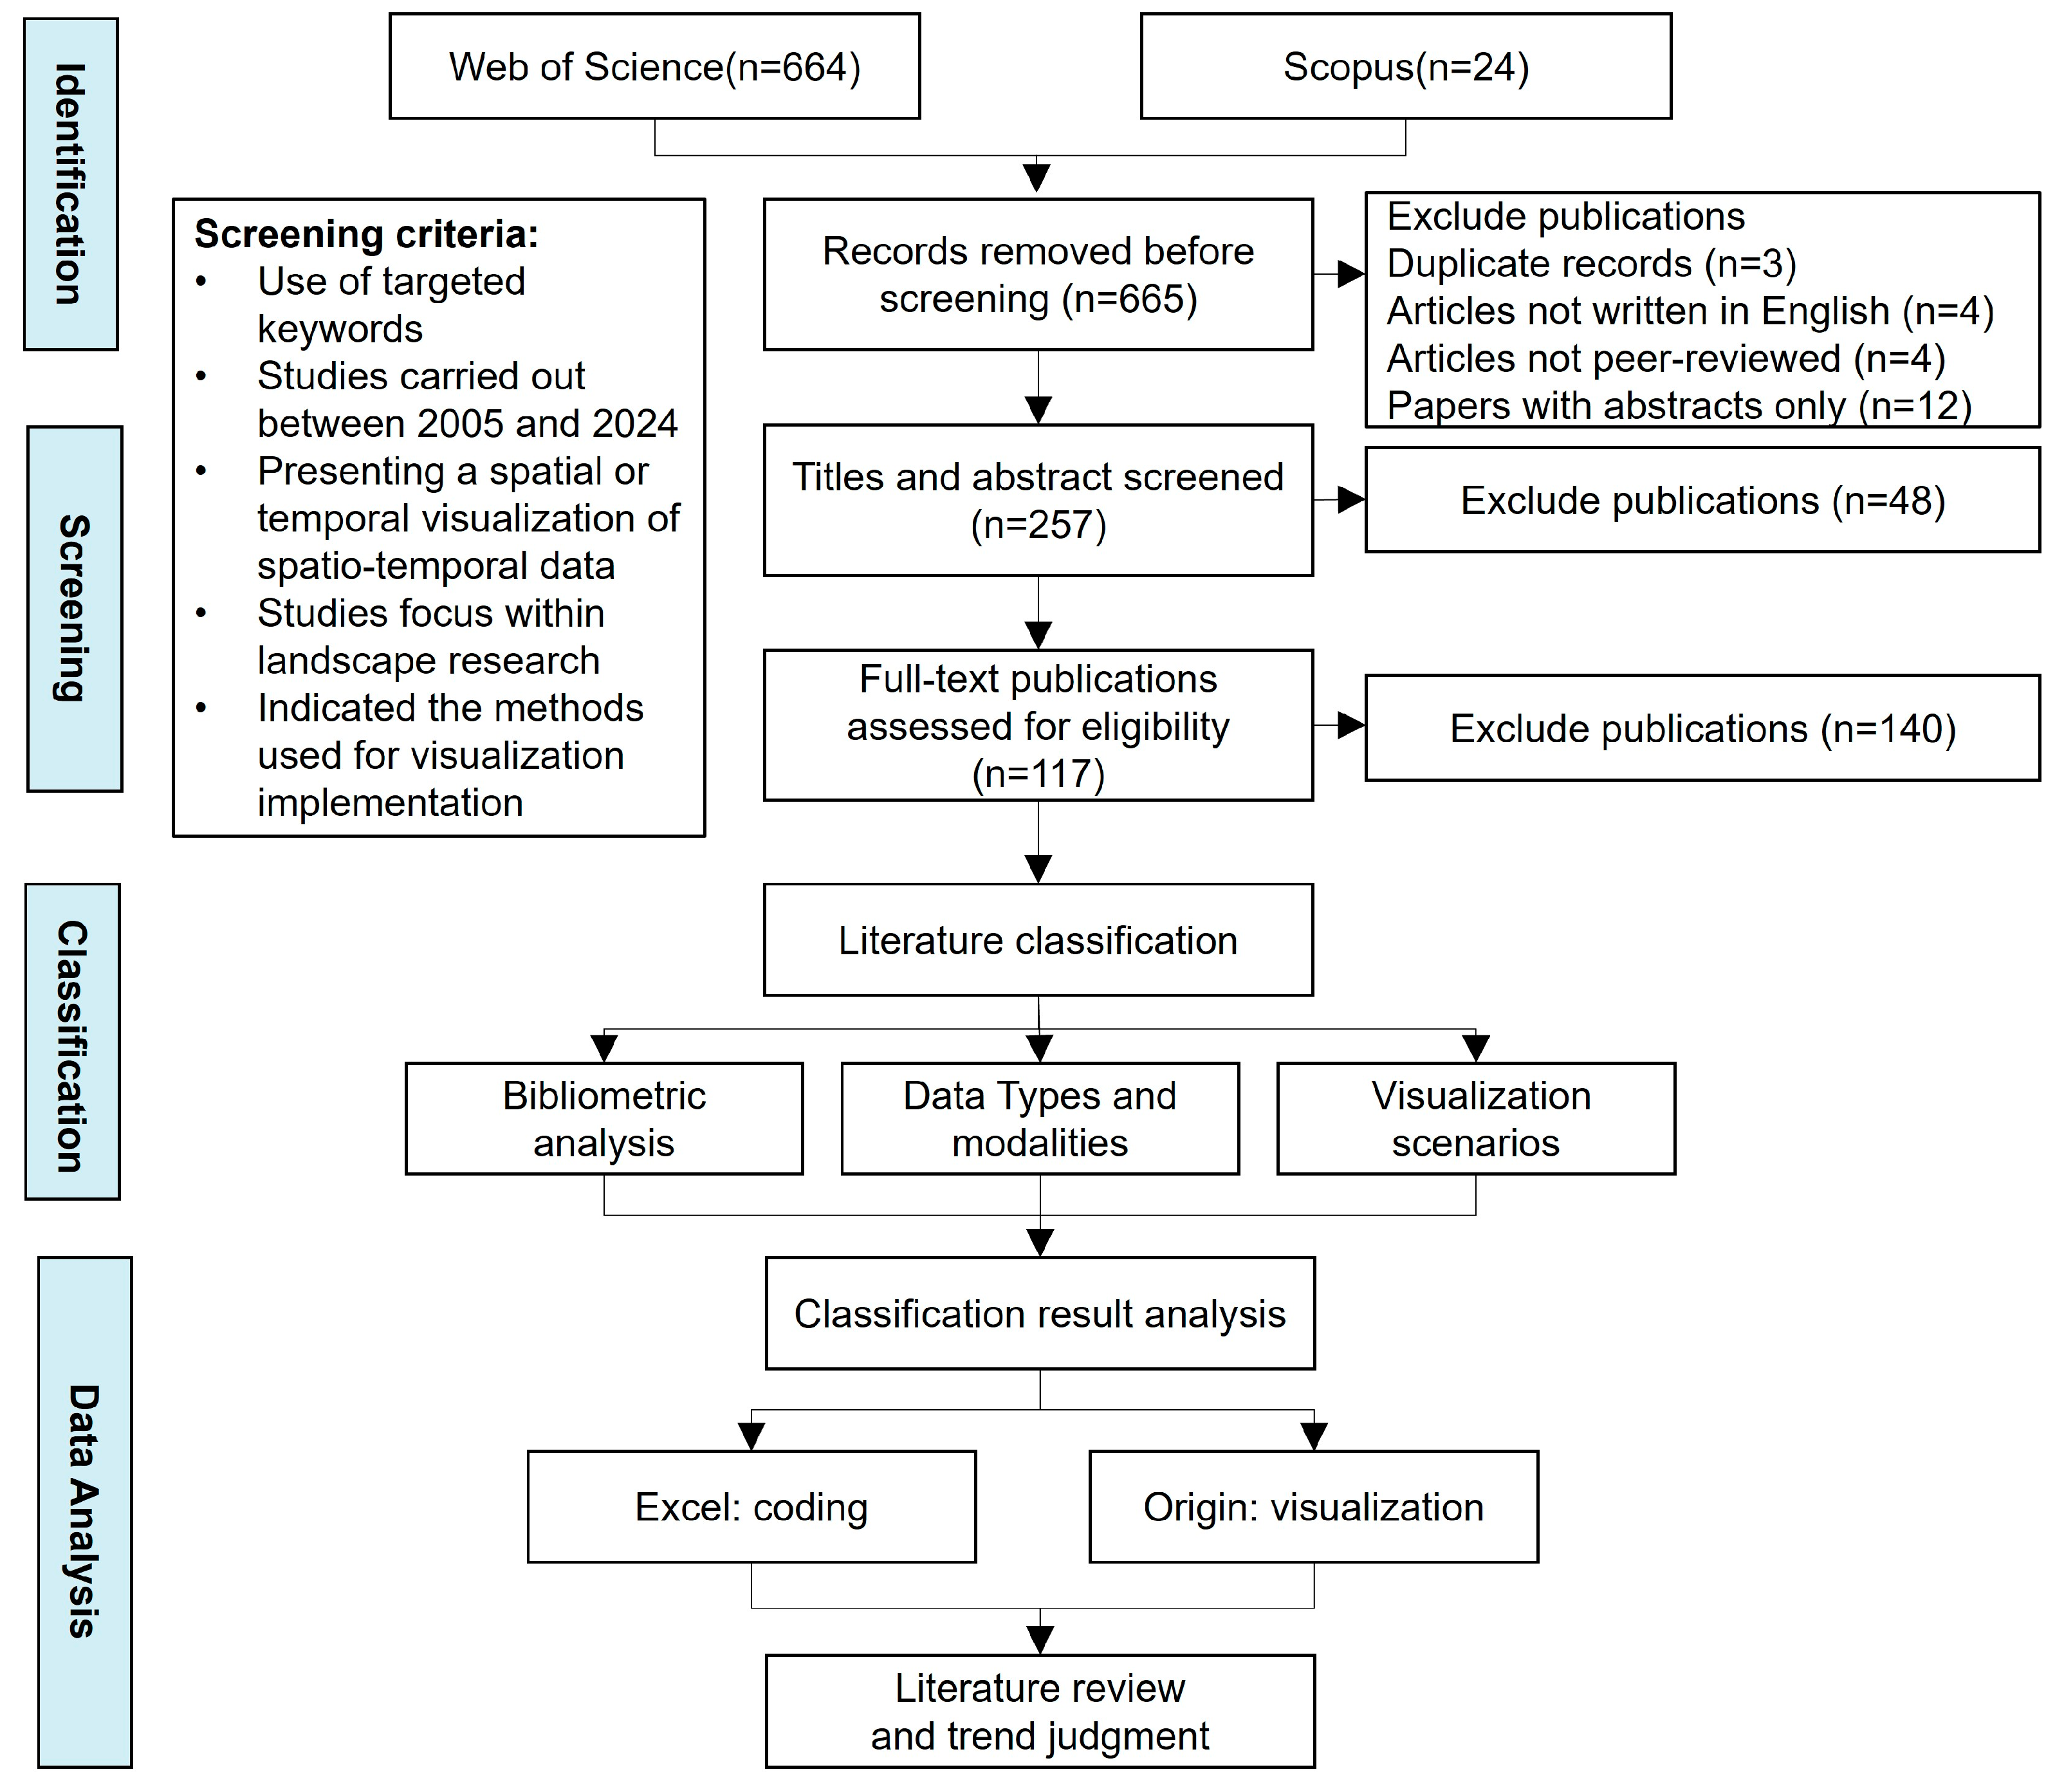
2.1. Data Collecting and Data Selection

This article used the Web of Science (WOS) Core Collection and Scopus databases to retrieve and collect peer-reviewed SCIE and SSCI English articles, which are authoritative and representative sources of citation data. Their extensive coverage ensures the inclusion of influential and mainstream studies, which are critical for capturing the global trends in this research area. A combination of keywords was used to identify the literature. These keywords include “Multimodal spatio-temporal data”, “Visualization”, and “Landscape”, and were combined with the Boolean search term “AND”. In addition, alternative terms from synonyms, related terms, and broad or narrow terms are considered, where “Visualization” can be replaced with “Visual analysis” OR “Mapping”, and “landscape” can be extended to “urban”. The inclusion of “urban” as an extension of “landscape” reflects the evolving scope of landscape architecture, which increasingly addresses urban-scale ecological infrastructure, green space planning, and cross-scale environmental issues. In contemporary research, the term “landscape” often overlaps with “urban” when examining large-scale spatial and ecological systems. This strategy aimed to capture a broader range of studies relevant to the landscape architecture discipline. These synonymous keywords are combined into a search string for cross-matching using the Boolean search term “OR”. Subsequently, keyword combinations and Boolean search terms were employed to identify literature in the abstracts, titles, and keywords of articles published over the past 20 years.
We searched for these keywords in the abstracts, titles, and subject headings of all articles published from 1 January 2005 to 31 December 2024. In total, our search yielded 688 articles, of which 664 records were from the WoS Collection and 24 from Scopus. This period was chosen because geographic information technology became popular in the field of landscape architecture at the beginning of the 21st century. Moreover, between 2008 and 2009, IBM successively put forward the visions of the “Smart Planet” and the “Smart City”, which prompted the research in landscape architecture to start paying attention to the visualization research of multimodal spatio-temporal data.
After acquiring the initial dataset of papers, we first eliminated all duplicates. Then, we conducted a multi-stage screening process for the remaining 272 papers. In the initial phase, we examined the titles, keywords, and abstracts to determine whether a study was relevant to the topic of our analysis; we excluded any article that did not align with the topic or scope of the herein review. Furthermore, considering the syntax we used to search for the articles that related to urban landscape and visualization research led to a large pool of results, we established extra decision rules. We assessed the full text of the preliminarily screened articles, focusing on whether the study used multimodal spatio-temporal data and applied visualization technologies for analysis. We excluded articles solely centered on urban planning or architectural engineering, or those only highlighting visualization technological advancement without landscape-related applications.
The screening was conducted by two reviewers with over five years of research experience in landscape architecture. If both reviewers agreed on the relevance of a paper, it was included; if both agreed it was irrelevant, it was excluded. When there were disagreements about whether to include a work, the four reviewers, including one senior expert with over 20 years of professional experience in landscape architecture, discussed the inclusion criteria and resolved disagreements until an agreement was reached. Consequently, following the screening criteria outlined in Table 1, our final dataset for the bibliometric analysis consisted of 117 papers, including 100 journal articles, 11 conference papers, and six reviews (Figure 1).

2.2. Data Analysis and Synthesis

Following the acquisition of the research literature, we conducted general statistical analysis on the dataset of documents, which encompassed examining publication trends and countries involved. Subsequently, we extracted the following information from those publications, categorizing and coding each record according to its attributes, and all information was organized into Microsoft Excel 2021: (1) general information of studies; (2) data types and modalities; and (3) visualization application scenarios. Finally, the analysis results were visualized by Origin 2025.
Specifically, “general information” includes basic attributes of the publications, such as authors, publication year, journal, title, keywords, and abstract. Based on the data sources, update frequencies, dimensions, and their roles in the visualization tasks of landscape architecture, the data types are classified into three categories: basic spatial data, intelligent perception data, and associated relationship data. Among them, basic spatial data refer to the datasets that are spatially stable and geometrically consistent; intelligent perception data refer to the dynamic real-time datasets collected through environmental sensors or crowdsourcing platforms; associated relationship data represent the spatial, temporal, and semantic relationships among objects, processes, and events. This classification framework demonstrates the complementarity of these data types and their joint importance in addressing the complex visualization challenges in landscape architecture. The number of modalities of data used in each article was also documented.
According to the differences in research tasks and technical characteristics, the classification of visualization application scenarios mainly unfolds in three scenarios: visualization representation methods, visualization analysis methods, and visualization interaction platforms. Each scenario can be further subdivided. For example, spatial distribution, information refinement, multimodal data fusion, clustering, correlation analysis, etc. In some cases, the reviewed articles used multiple visualization analysis methods and were thus classified into hybrid scenarios. These categories reflect the range of tasks supported by the visualization of multimodal spatio-temporal data, from basic data presentation to advanced decision support.

3. Current Research Status

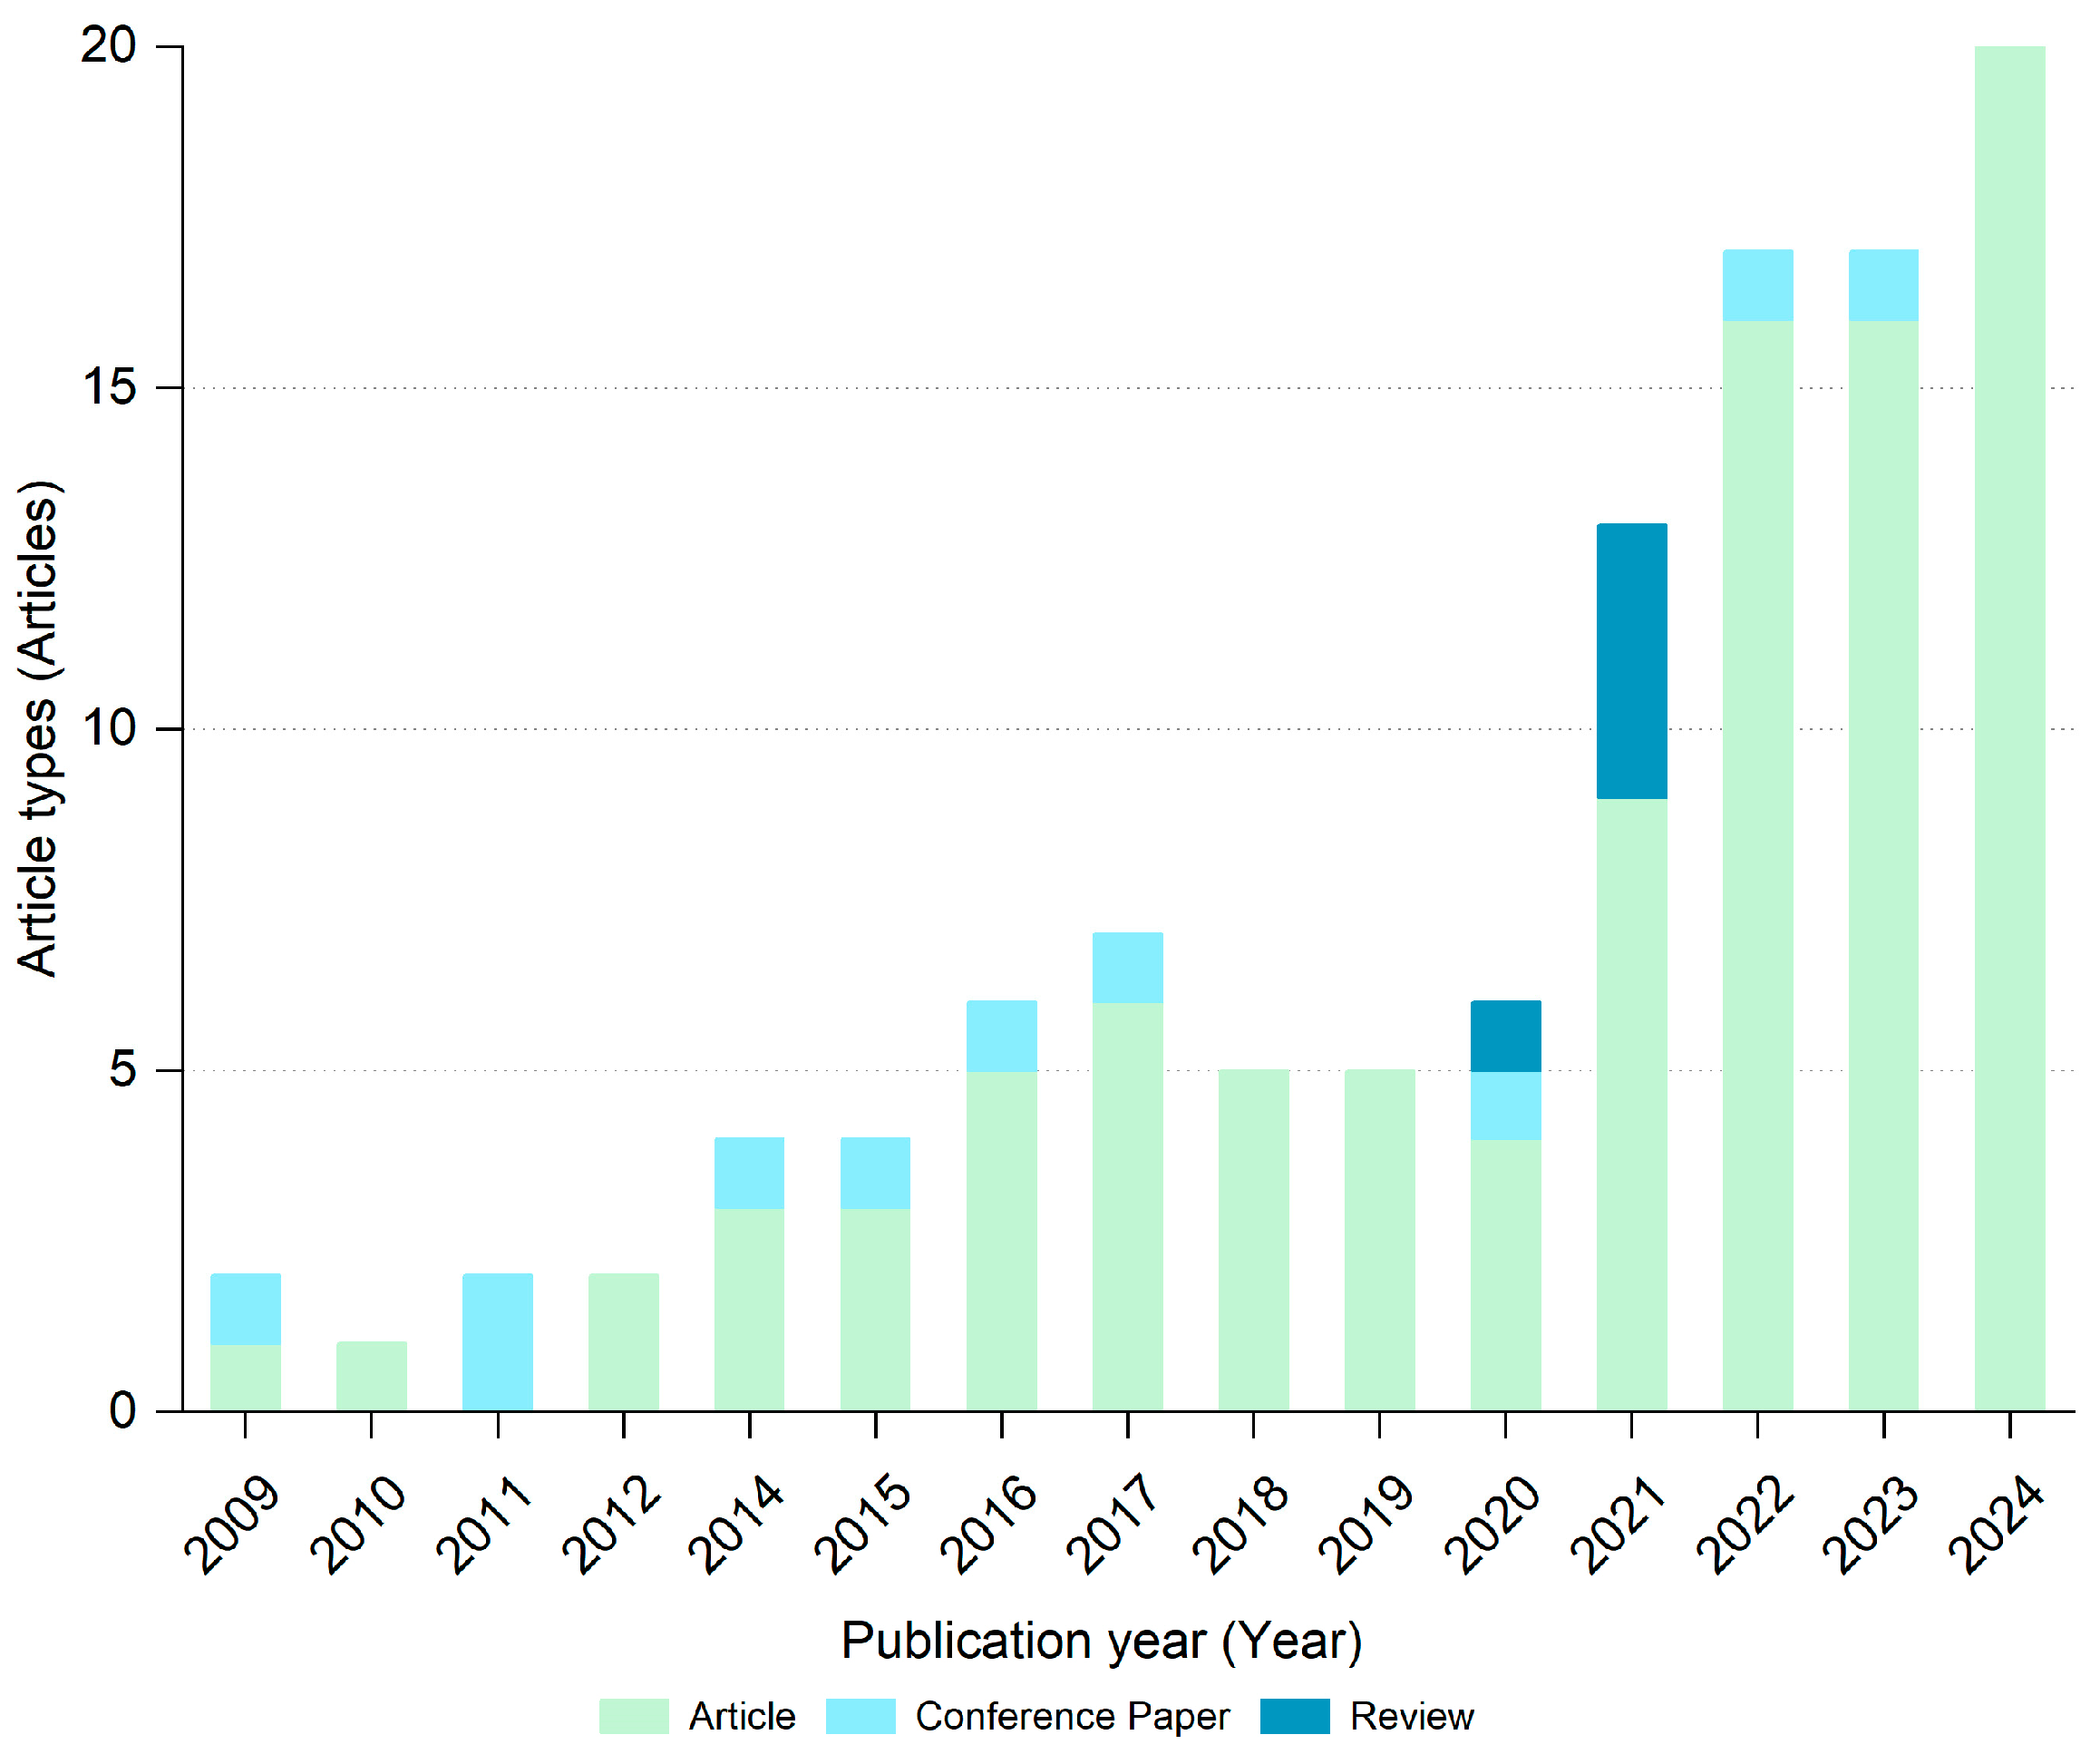
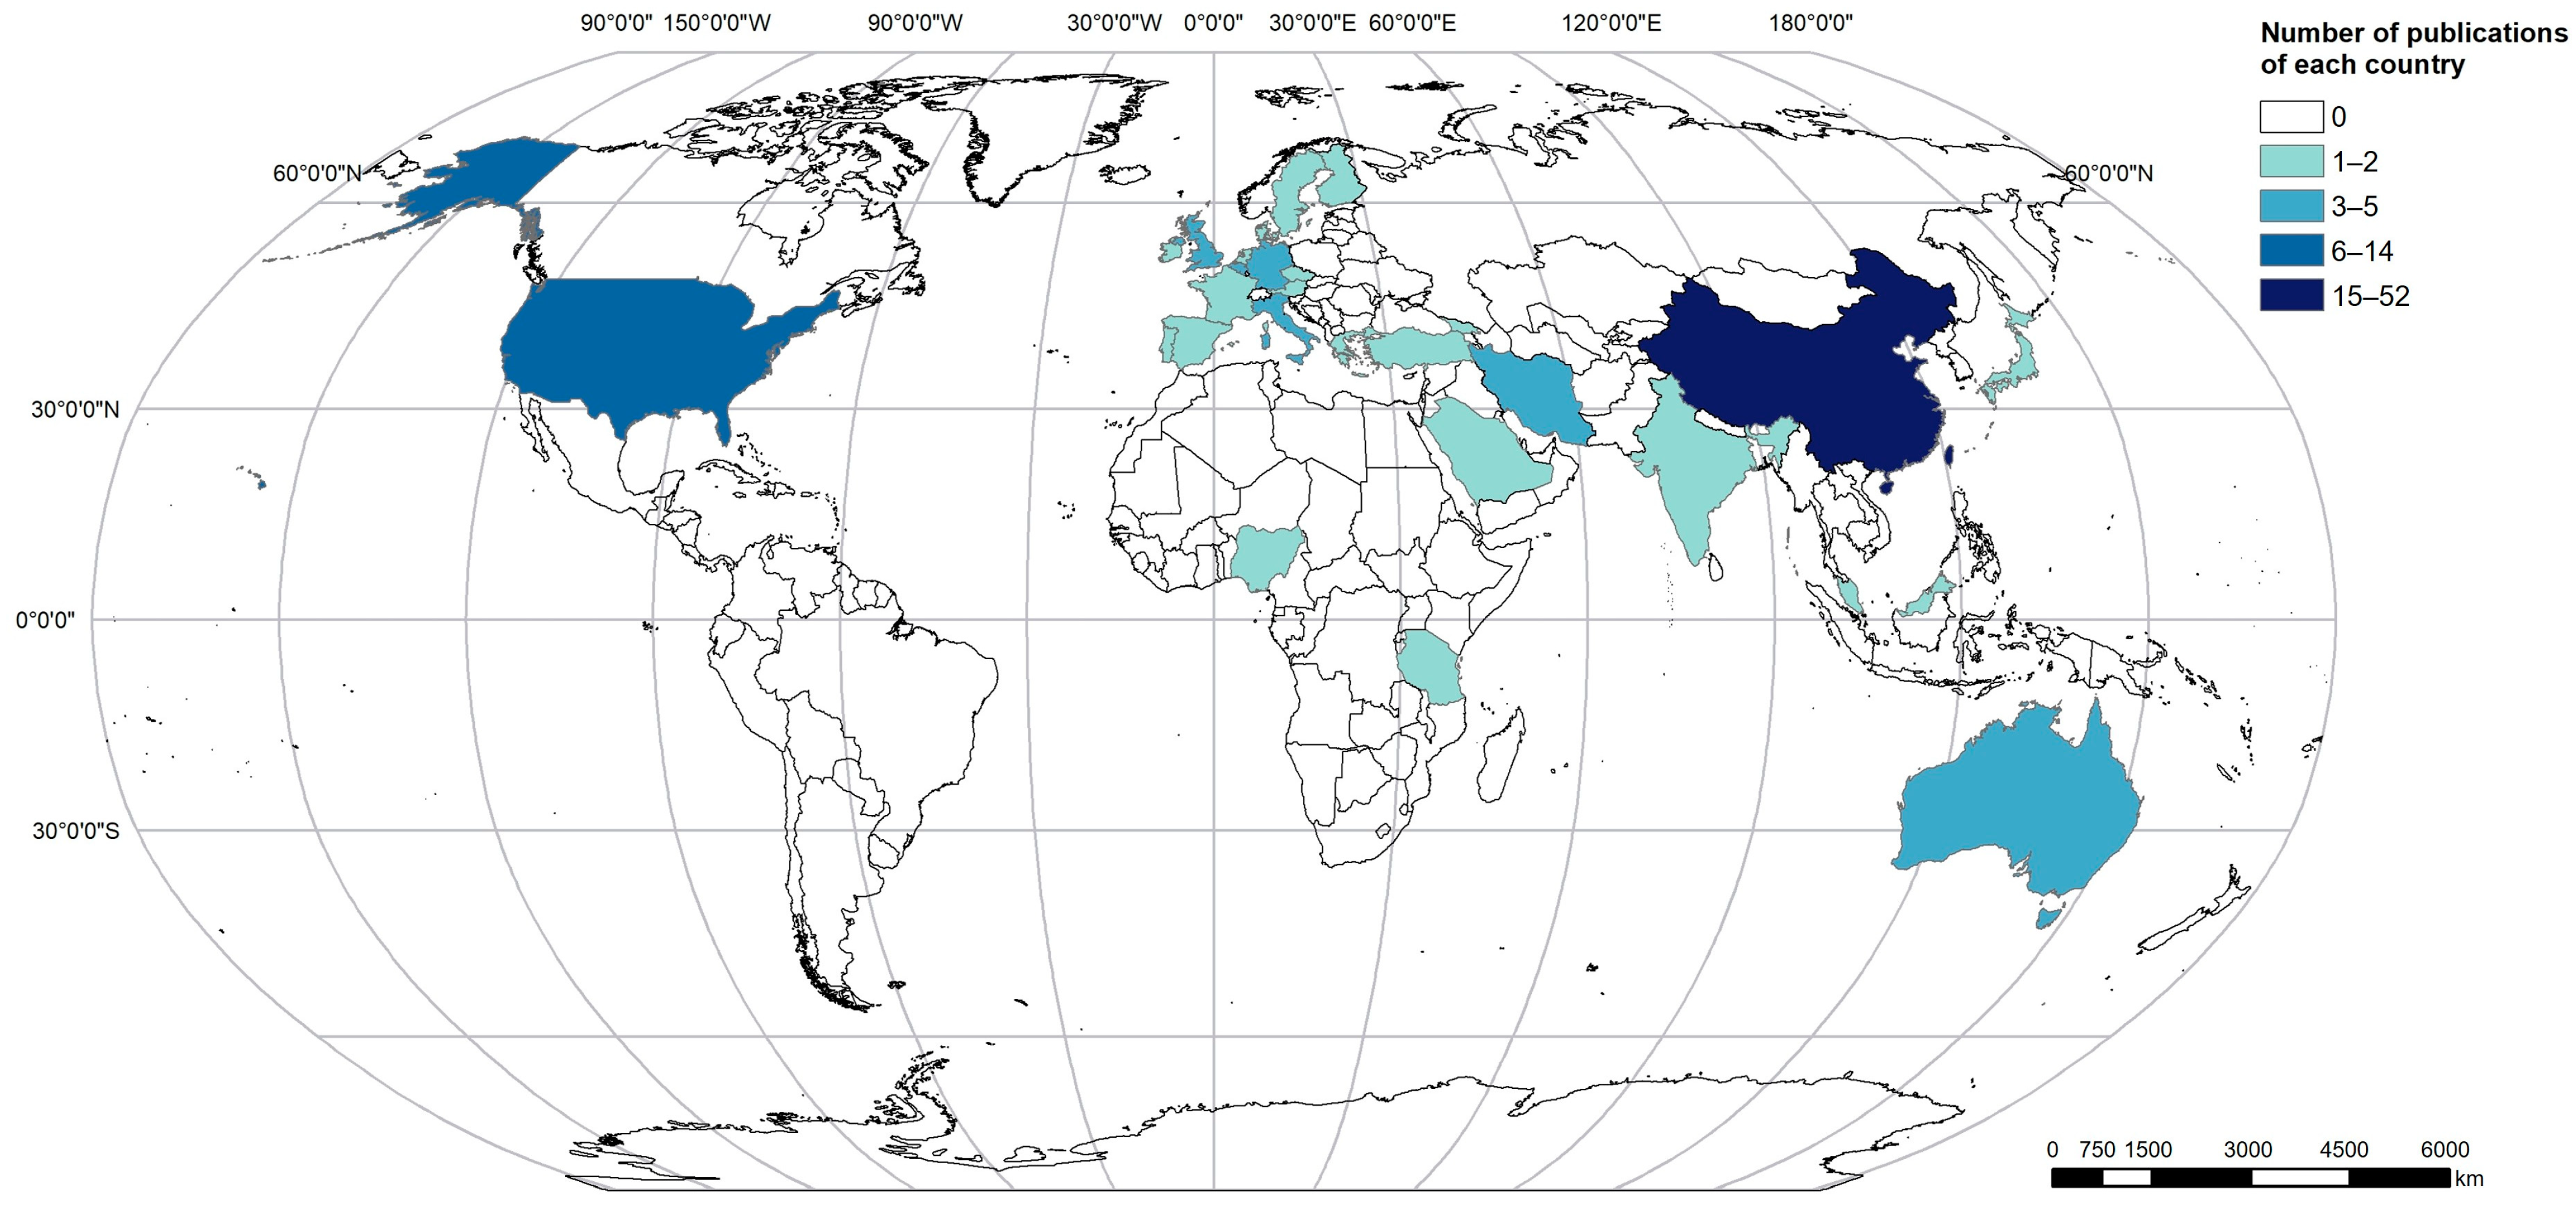
3.1. Bibliometric Analysis

The publication trends over time reflect the changing research interest in this field. As shown in Figure 2, the first eligible publication emerged in 2009, which reflects the lag period of the penetration of technological concepts into the discipline. This delayed onset suggests that the integration of these advanced visualization methods into landscape architecture research gained momentum in the late 2000s. Following this initial emergence, annual publication numbers demonstrated progressive growth, particularly accelerating after 2021, reflecting increasing scholarly interest and technological adoption in this interdisciplinary field.
Between 2009 and 2011, research on multimodal spatio-temporal data visualization in landscape architecture was in its exploratory phase, with findings primarily shared through conference papers. Conferences provided a platform for researchers to quickly gather feedback and engage in interdisciplinary discussions, which facilitated deeper exploration and initial attempts at data integration. During this period, research themes centered on monitoring urban expansion and assessing ecological vulnerability. However, data resolution was relatively low, and the methodologies were dominated by statistical analysis and GIS tools, focusing on traditional spatial analysis techniques such as landscape pattern quantification based on remote sensing imagery and land use classification.
From 2012 to 2019, the field entered a developmental phase for research-oriented publications. The rise of dynamic simulation technologies and the proliferation of open-source data advanced the standardization of spatio-temporal data processing and enabled multi-scale analyses, laying the groundwork for subsequent intelligent research. Key research topics shifted toward spatio-temporal modeling of traffic flow and urban heat island analysis, with machine learning algorithms, such as random forests, introduced to support data classification. During this period, deep learning technologies had not yet achieved widespread application, and traditional machine learning and statistical models remained the dominant tools.
Between 2020 and 2021, scholars began consolidating existing theories, as evidenced by the emergence of six review articles. These reviews systematically explored the potential of deep learning techniques, such as convolutional neural networks (CNNs) and long short-term memory networks (LSTMs), for tasks like target extraction and simulation-based prediction. Research themes increasingly focused on high-resolution data modeling, such as the integration of LiDAR and WorldView imagery. Meanwhile, real-time visualization platforms and disaster simulation tools became prominent, reflecting a shift from static analysis to dynamic and responsive systems.
The number of publications has shown explosive growth since 2021, with a total of 73 articles published in the last four years. Research during this period emphasized the deep integration of multimodal data and the development of digital twin systems. Advances in deep learning technologies supported urban function zoning and dynamic risk perception. Additionally, the introduction of edge computing signaled a transition from post-hoc analysis to real-time interaction and immersive decision-making support.
As shown in Figure 3, the geographical distribution of research institutions highlights that China and the United States are the leading centers of visualization research, reflecting the global influence of their contributions. Europe presents a more decentralized innovation network, with 13 countries, including Italy, Germany, and the United Kingdom, driving research. In contrast, Africa and South America exhibit sparse activity, with limited contributions or areas of research void. Prior to 2014, visualization studies were concentrated in North America and China. By 2016, the popularity of visualization research had grown, with Asia—particularly China—maintaining its leading role, alongside steady advancements in North America and Europe. After 2021, emerging countries such as Saudi Arabia, Nigeria, and Tanzania began to actively participate in this field.

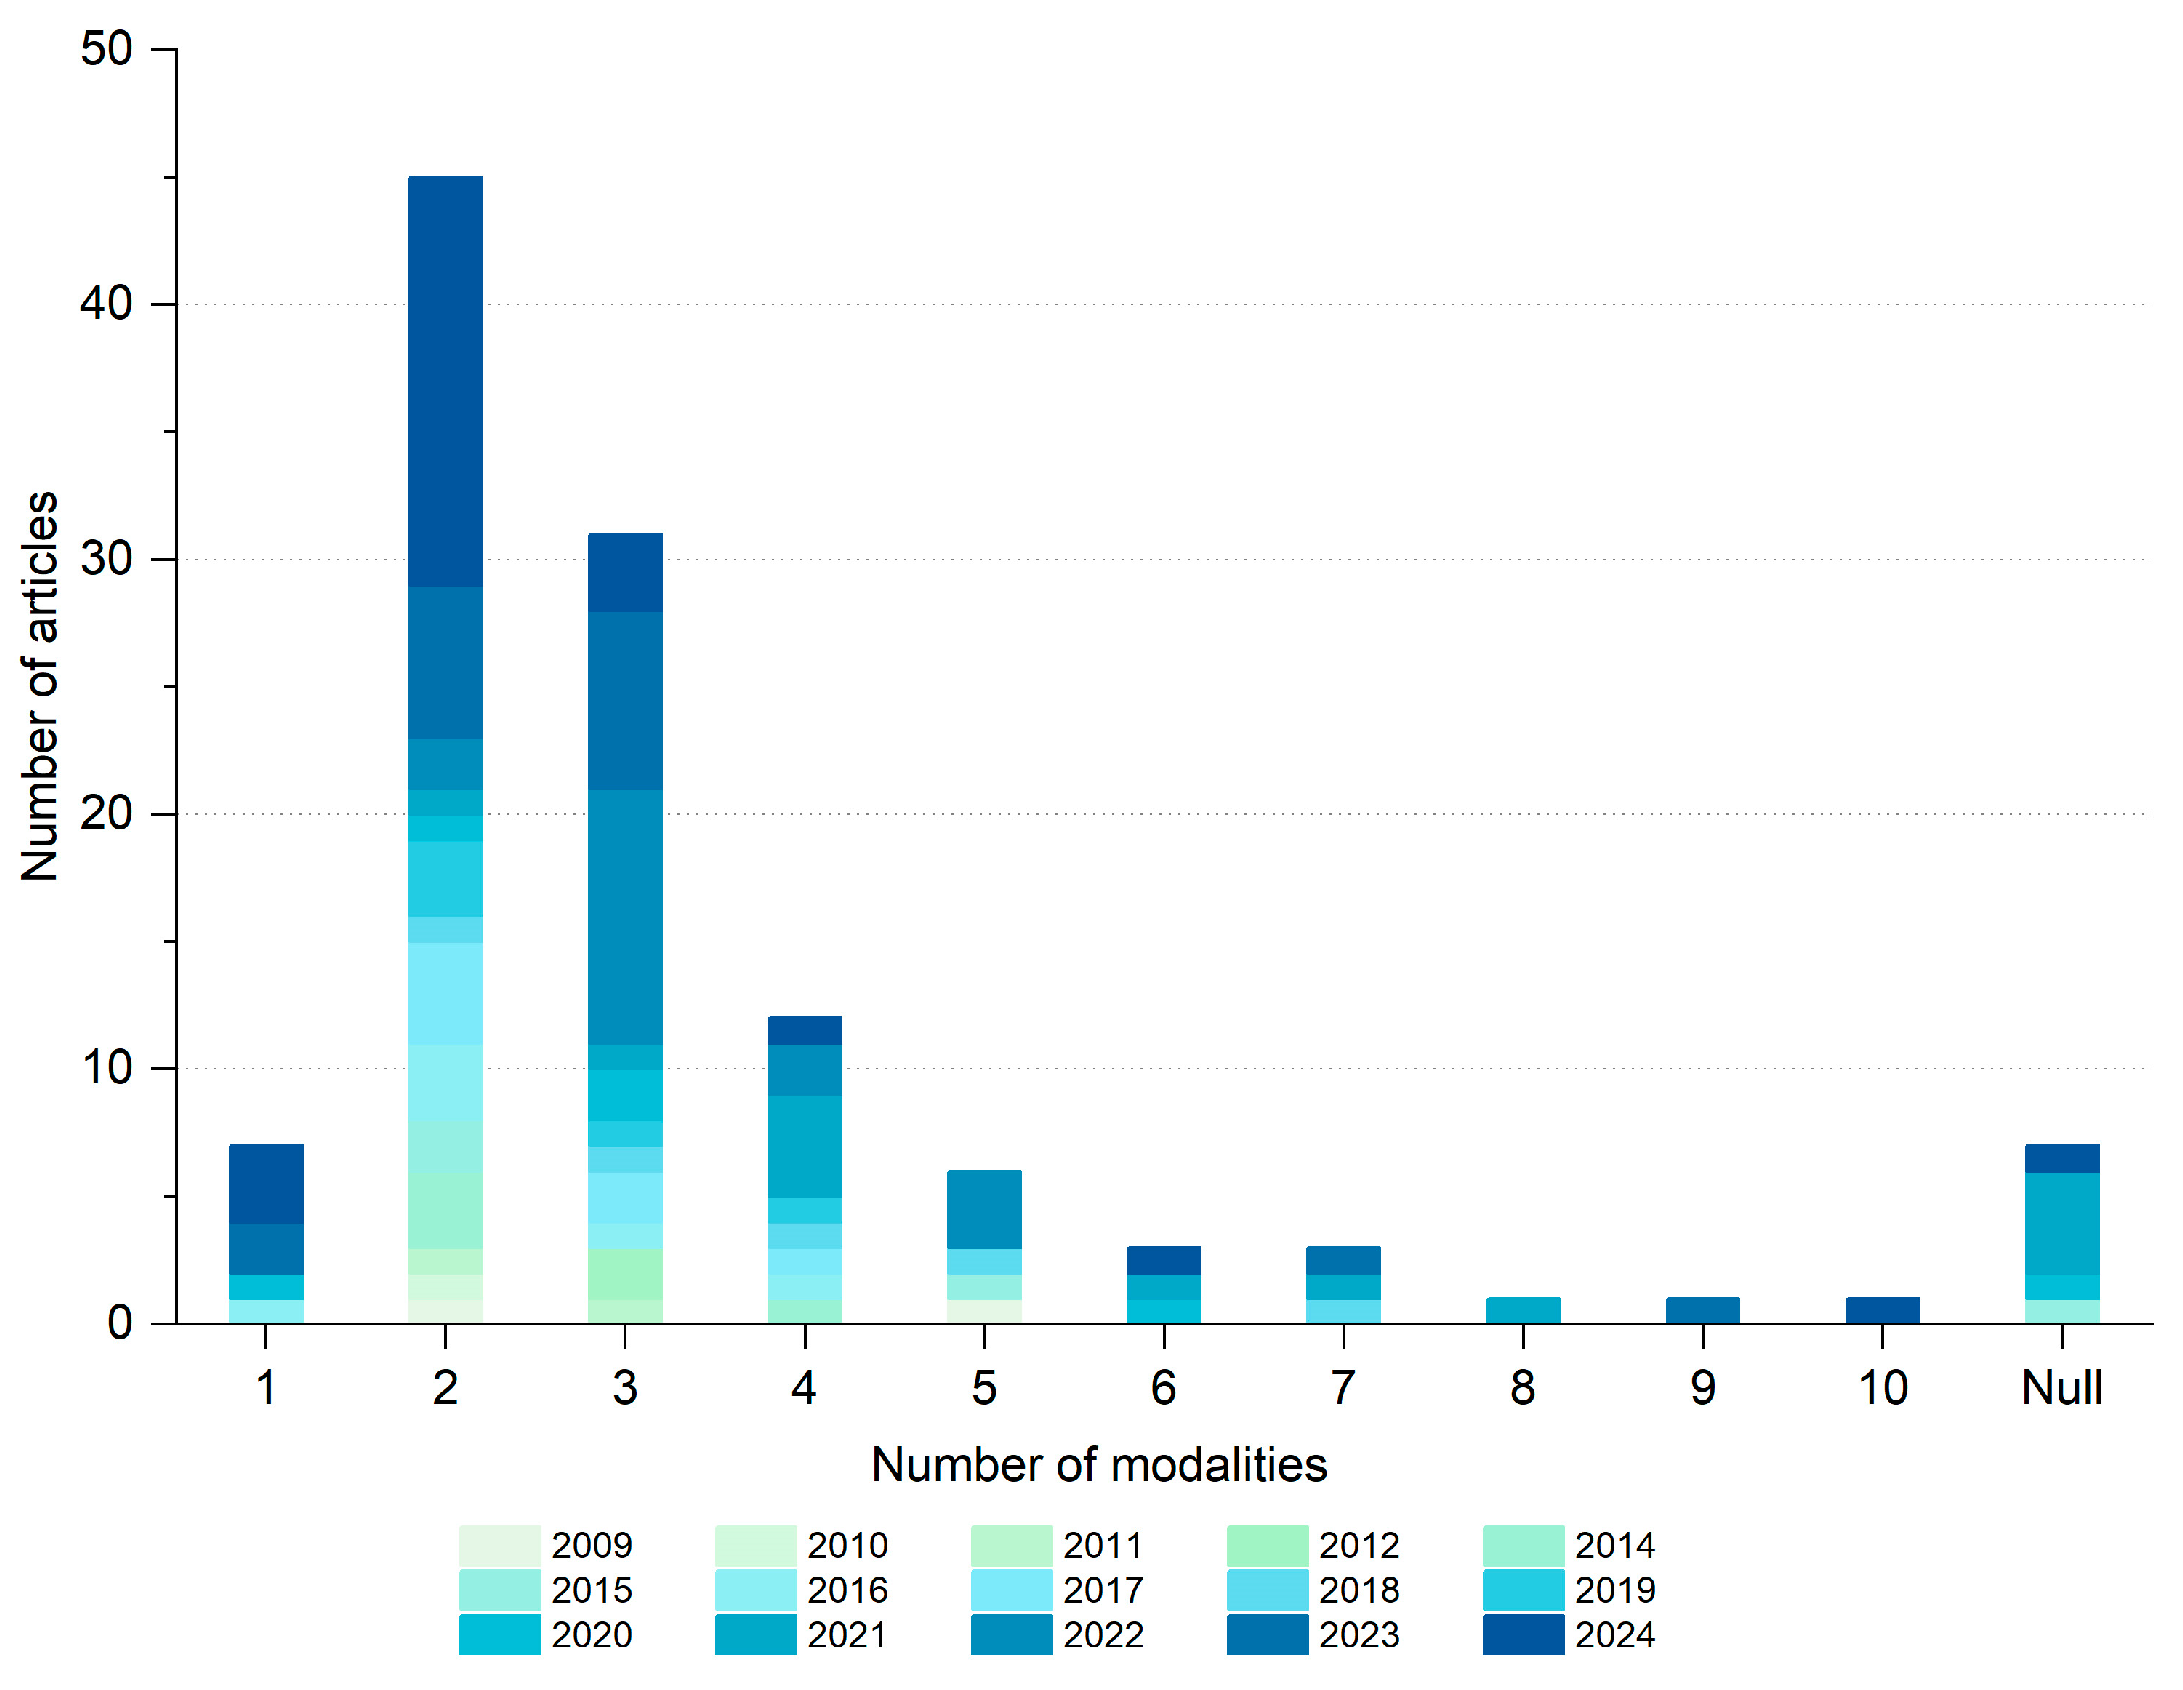
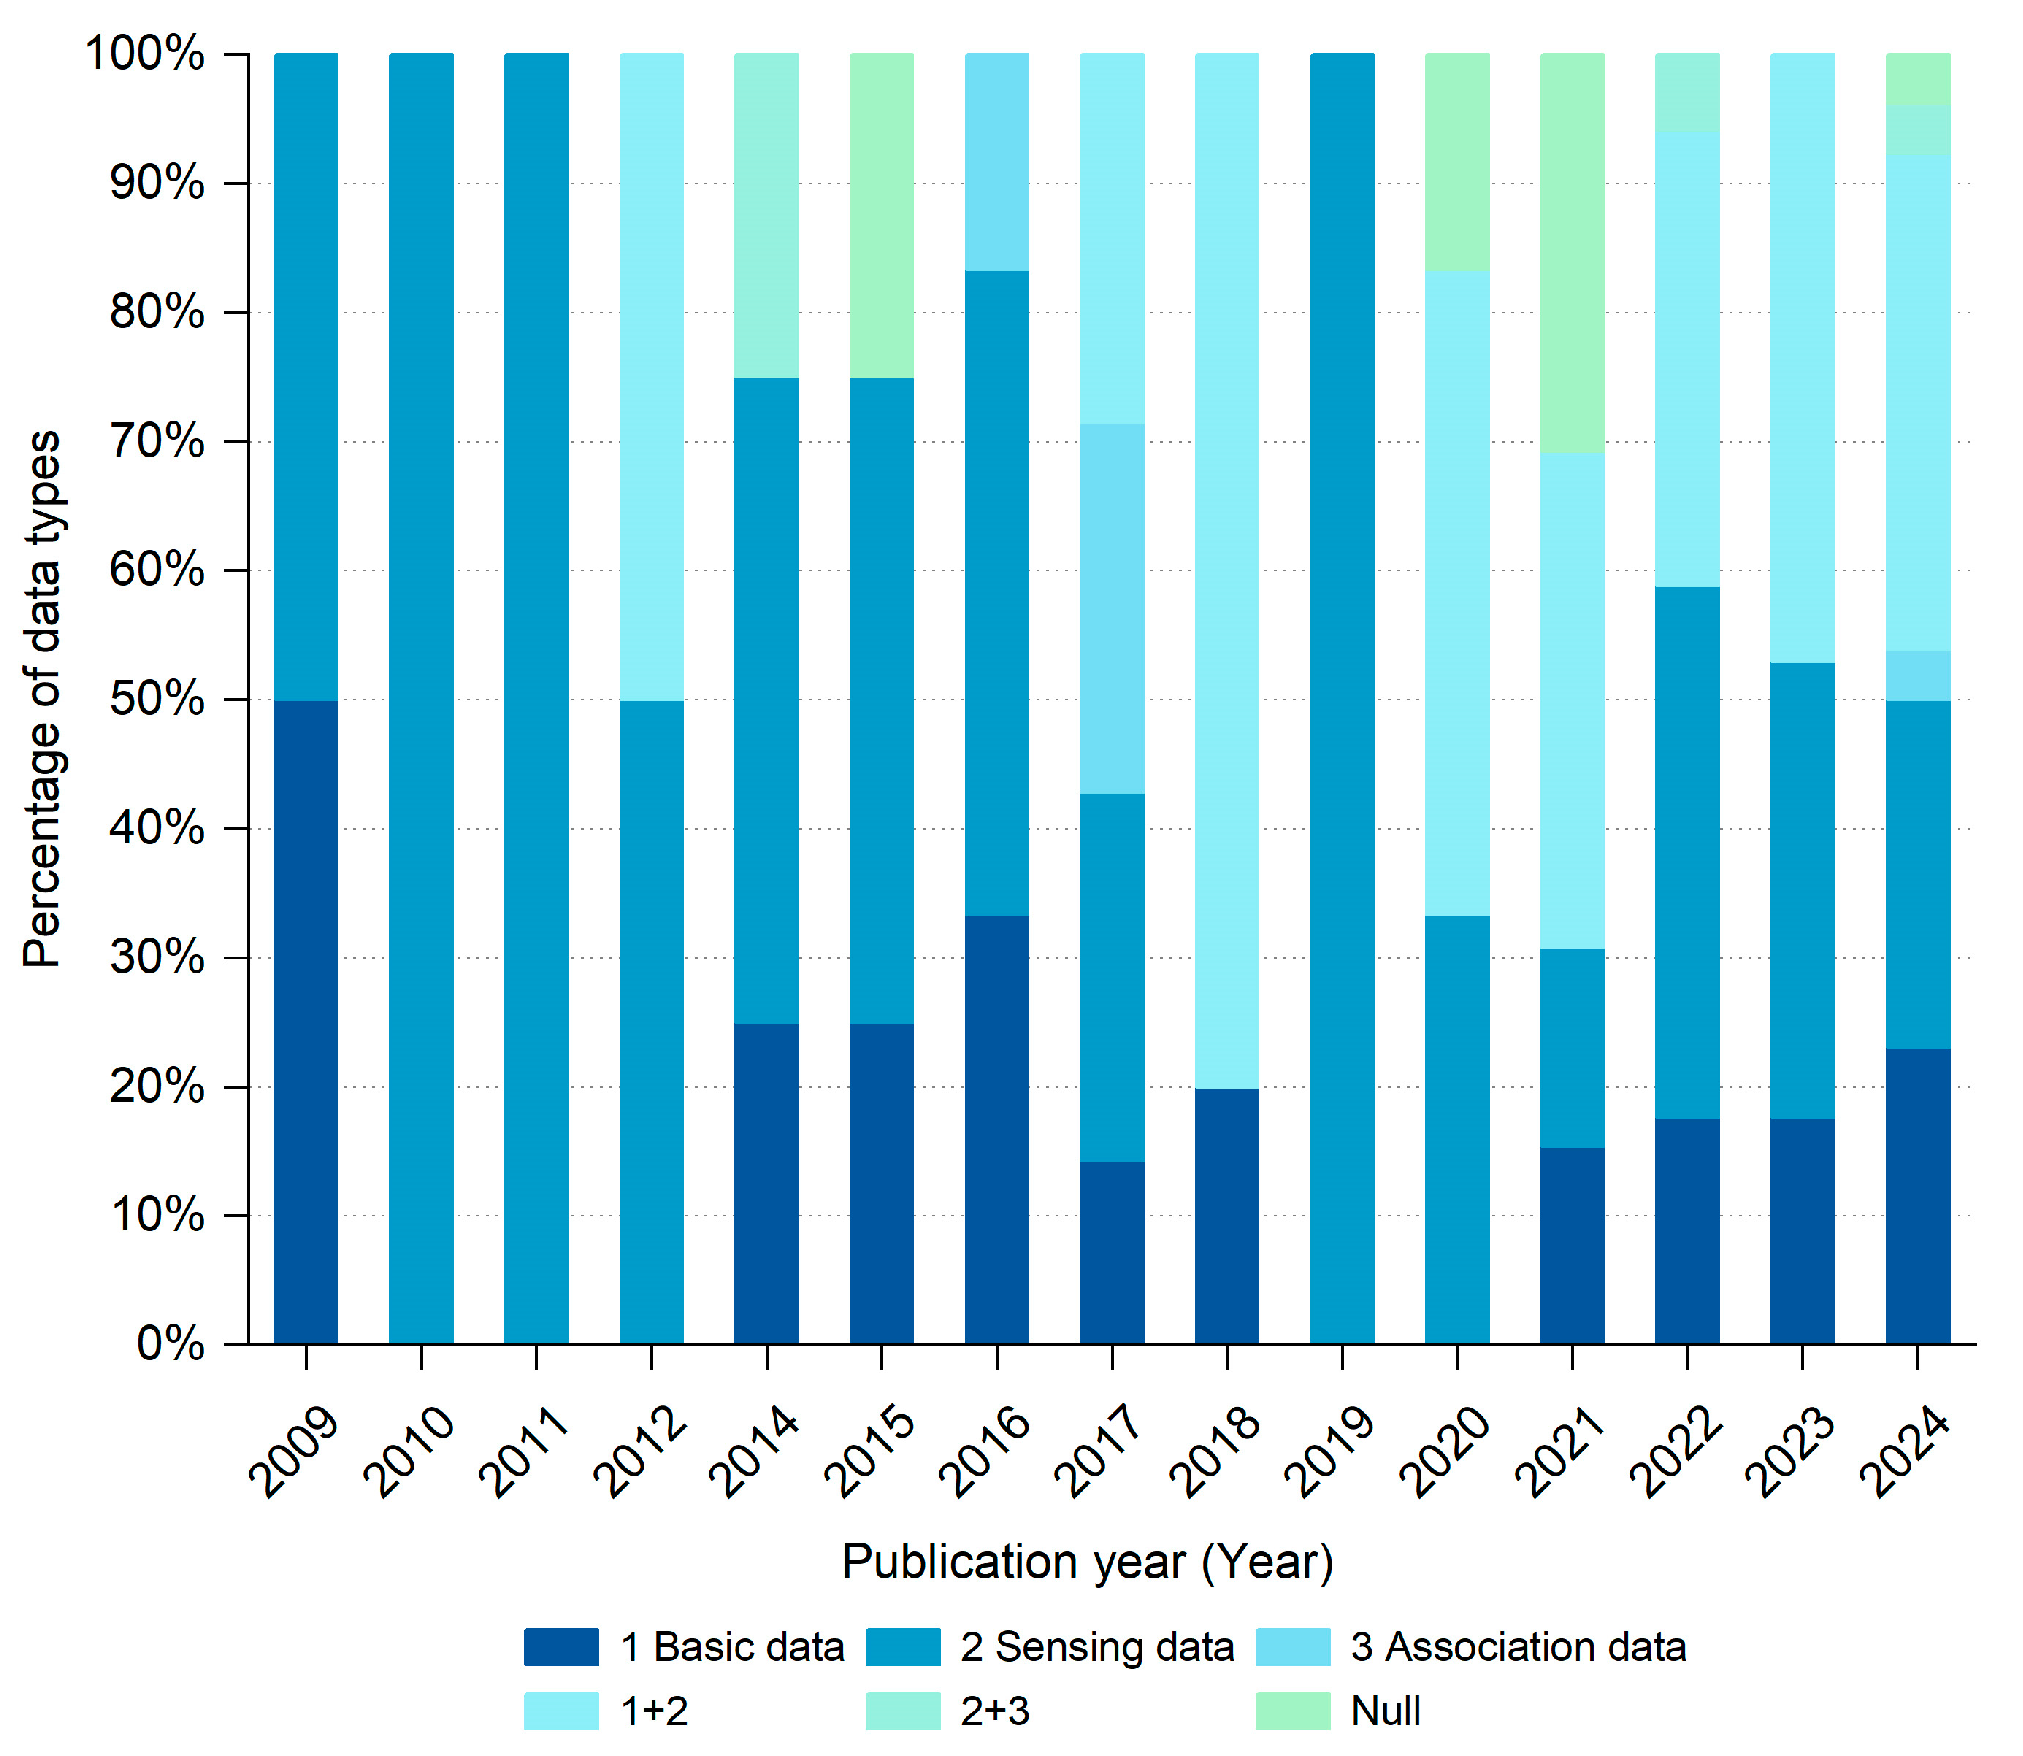
3.2. Data Types and Modalities

Multimodal spatio-temporal data refer to the data collected through different data acquisition methods or description means for a spatio-temporal object [34]. Considering the characteristics of multimodal spatio-temporal data, such as data source, update frequency, and dimensionality [35,36,37], combined with the differentiated needs for data visualization in landscape architecture research, this study categorizes multimodal spatio-temporal data into three types: basic data, sensing data, and association data (Table 2).
Based on the statistics of the data sources and the number of modalities in 117 articles (Figure 4 and Figure 5), 50 studies (55%) utilized a combination of two or three data types. From 2009 to 2011, the data types used were relatively single, while after 2012, studies began to appear using a combination of multiple data types, and the proportions of various spatio-temporal data types in the research have gradually become more balanced.
Basic data are a major data format, which has been reported in 21 studies. Basic data with relatively stable spatial locations and geometric forms are primarily used to depict the actual representation of the physical environment in landscape architecture. The resulting fundamental framework can provide a spatio-temporal reference for subsequent analysis, ensuring the authenticity and completeness of landscape information. Researchers have convenient access to data collected through national surveys, remote sensing, and GIS. These resources have significantly enriched urban knowledge and facilitated urban management. Such urban data collection methods are often described as “top-down” approaches, as they are primarily generated and aggregated by authorities or stakeholders. Research on the visualization of foundational spatio-temporal data mainly focuses on improving the accuracy of feature identification and developing innovative visualization methods. By integrating multiple urban information sources, researchers can visualize geographic and remote sensing data to explore spatio-temporal characteristics in landscape architecture. For instance, they can analyze changes in urban green spaces, monitor the evolution of wetlands, and track dynamic shifts in forest cover.
Despite the abundance of data, top-down spatio-temporal geographic information faces limitations in capturing the complex and dynamic nature of urban spaces. In contrast, sensing data, characterized by real-time, dynamic, and interactive properties, provides a more detailed, bottom-up perspective on urban environments and human activities. This complements foundational spatio-temporal data by offering enhanced granularity. Sensing data typically refer to the dynamic data collected through real-time environmental sensing using sensors, or acquired from Internet platforms through environmental monitoring, voluntary public submissions, task completion, and feedback provision. These data reflect the locations of population activities, residents’ subjective perceptions of site morphology, and the utilization levels of environmental facilities. Among the 117 reviewed papers, 43 studies utilized sensing data in visualization research, contributing to various topics such as urban functional zone identification, traffic flow analysis and prediction, and perceptions and preferences regarding green environments. These studies have provided valuable data support and decision-making tools for urban sustainability and refined management.
Since 2012, studies combining sensing data and basic data have emerged (39 articles). The integration of the two can achieve complementary information. On the one hand, it addresses the lack of temporal dynamics in basic spatial data; on the other hand, the long-term high-precision spatial reference information carried by basic data helps calibrate and locate the sensing data, thereby improving the accuracy of subsequent analysis.
Association data, which represent the spatial, temporal, and semantic associations between spatio-temporal objects, processes, and events, have been used in four studies, with an additional three studies combining it with sensing data. These type of data is usually used to infer the generation mechanism of the landscape environment, discover the intrinsic associations and influencing factors between spatio-temporal data, and provide conditions for the collaborative management and intelligent optimization of landscape scenarios. It is worth noting that association data generally account for a relatively low proportion among the data types used. This may be due to association data often appearing during the analysis process, and its use as initial input data is limited in research. Research on association data applications primarily focuses on developing spatio-temporal topological modeling methods and constructing dynamic response mechanisms. By combining association data with smart sensing data, researchers can uncover complex human–environment interaction mechanisms and support decision-making optimization.
In addition, we found that the number of modalities involved in the articles has been increasing over the years. Early studies often relied on a single data source, such as traditional statistical data and on-site surveys, and had a relatively small number of modalities. However, with the widespread application of emerging technologies such as remote sensing, the IoT, and social media, researchers have been able to acquire more comprehensive and detailed multi-source data, further improving the accuracy and analytical power of the research. Among the reviewed articles, seven had missing values for the number of modalities and data types. This is because some papers focused on building multimodal spatio-temporal data visualization and interaction platforms, rather than collecting specific data, and review papers did not list the details of data types and modalities.

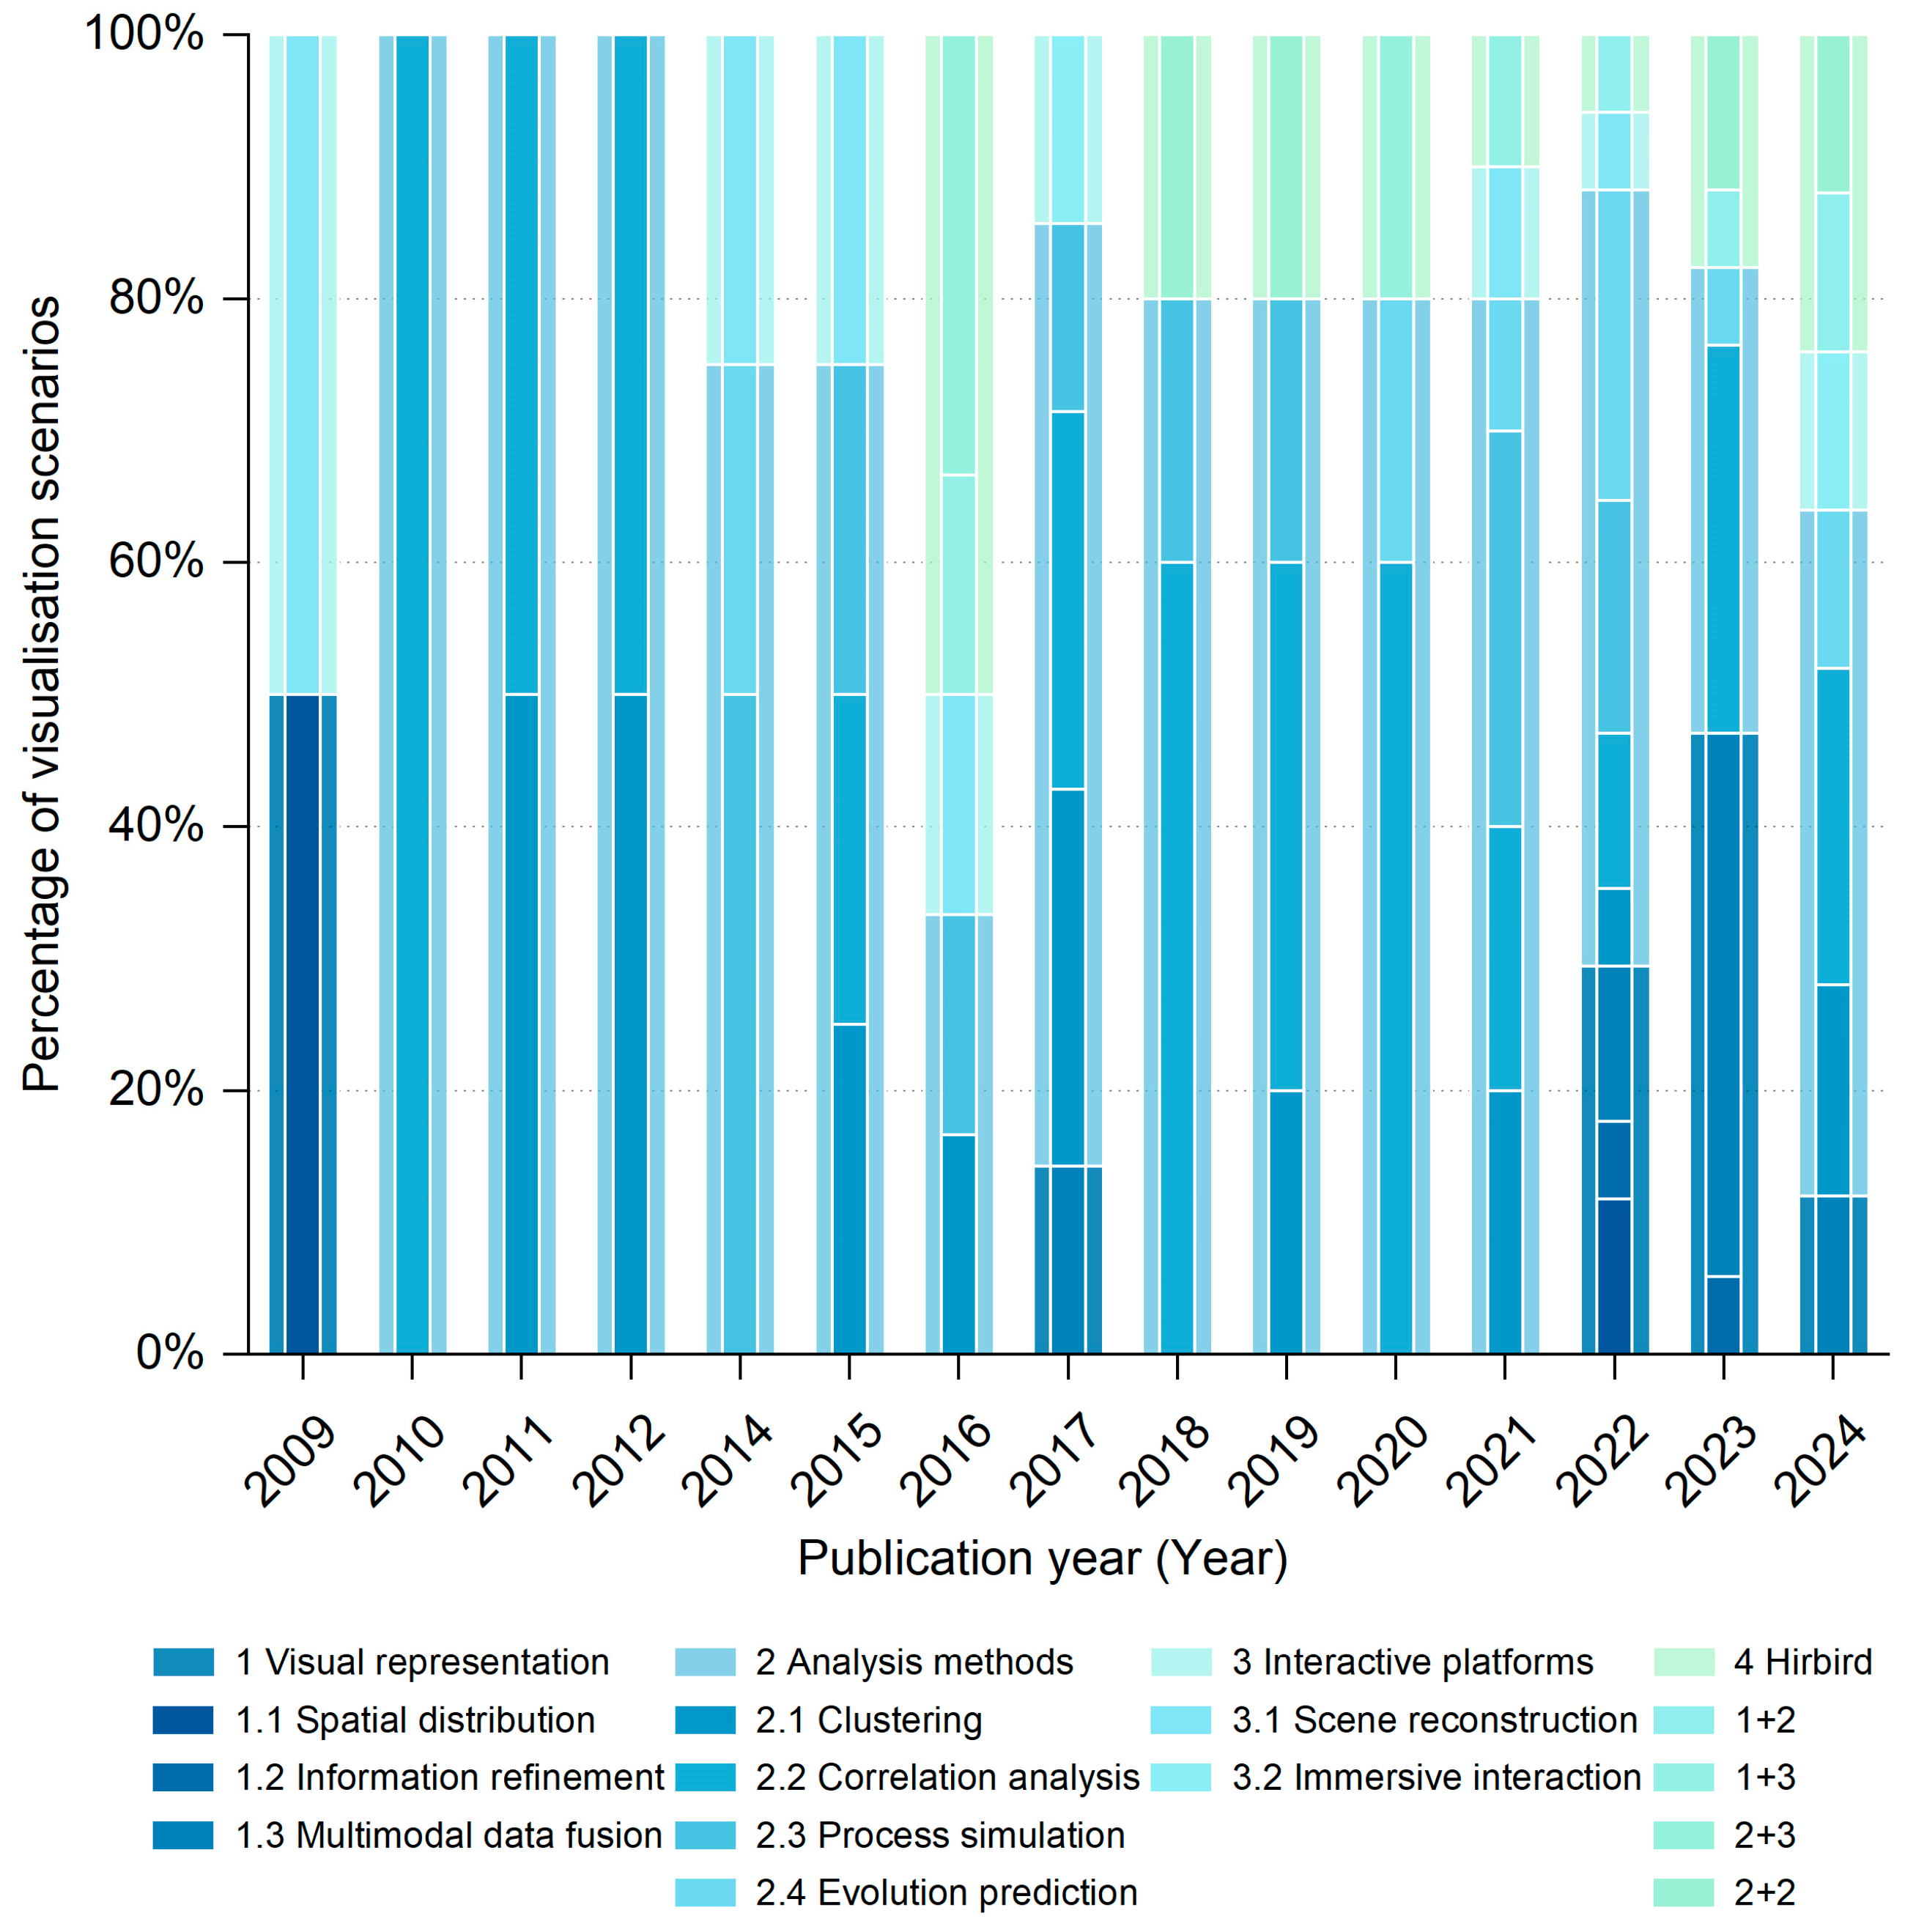
3.3. Visualization Application Scenarios

The evolution of data applications follows a process of “data-information-knowledge-assisted decision-making” [59]. If multimodal spatio-temporal data form the foundation for data mining, then processing the data and using visual mapping to develop cognitive information, followed by leveraging visualization technology to uncover hidden phenomena and patterns, and finally combining prior knowledge to perform scientific and reasonable reasoning and decision-making, can truly realize the maximum potential of the data’s value. This process requires the integration of data analysis and processing, visual representation, and human–computer interaction technologies, and runs through the entire process of contemporary digital landscape research (Figure 6).
Based on the visualization research process and research objectives of multimodal spatio-temporal data in landscape architecture, we categorize the visualization application scenarios into three levels: visual representation, visualization analysis methods, and visualization interactive platforms. These correspond to the three research objectives of visualizing research objects, processes, and research findings. Furthermore, through a cross-analysis of the visualization scenarios, data types, and the number of modalities (Figure 7), it is found that basic data, sensing data, and association data are essentially corresponding to the visualization scenarios, and can meet the various functional requirements of intuitively describing data, inferring rules, analyzing information interaction, and supporting intelligent decision-making. Basic data, such as geospatial information, form the foundation for multimodal visual representation and play a crucial role in spatial distribution visualization and information refinement. Sensing data, on the other hand, are primarily employed in clustering and correlation analyses to uncover hidden patterns. While less commonly utilized, association data serve as an important function in presenting decision-making outcomes, often through interactive platforms. Notably, studies that integrate basic and sensing data dominate the field, offering more comprehensive and nuanced cognitive insights into research subjects. As the number of data modalities increases, the dimensionality of data fusion expands, facilitating a holistic understanding of the complex interrelationships within landscape systems. This integrative approach provides valuable insights into the multifunctionality and interconnected mechanisms of landscape environments.
A review of the visualization scenarios across the literature (Figure 8) reveals that the research is predominantly focused on association mechanism studies, with visualization platform development playing a supporting role. Early researchers were primarily dedicated to constructing visualization platforms, aiming to integrate and visualize spatio-temporal environmental data to provide decision support. After 2010, as the research emphasis shifted from technology-driven to application-driven, visualization analysis methods rapidly emerged and became the dominant research direction, accounting for 58.2% of the literature. Among these, association analysis is the most widely applied visualization analysis method, comprising 41.5% of the visualization analysis literature. This approach leverages machine learning and graph neural networks to uncover complex relational mechanisms, such as those driving urban expansion and traffic flow patterns. In contrast, spatio-temporal clustering analysis has seen a decline in usage, now accounting for only 20%, due to its limited support for dynamic interactions. Since 2014, spatio-temporal process simulation and spatio-temporal evolution prediction have diverged as distinct research directions. The former has seen a decrease in adoption (dropping to 17%) due to its limited model generalization capabilities, while the latter remains stable at 20%, driven by a consistent demand for dynamic forecasting. Since 2016, hybrid scenario studies have gained prominence, combining interactive platforms with analytical methods or integrating multiple models. However, significant challenges remain, particularly in achieving cross-modal dynamic interactions and real-time simulations.
Overall, spatio-temporal data visualization in landscape architecture has found applications in foundational representation methods, single-modality analyses, and static platform development. However, visualization technologies aimed at dynamic responsiveness, complex system understanding, and human-centered interactions are still in their infancy. The research content of each application scenario will be discussed in detail in the next section.

4. Application Scenarios in Landscape Research

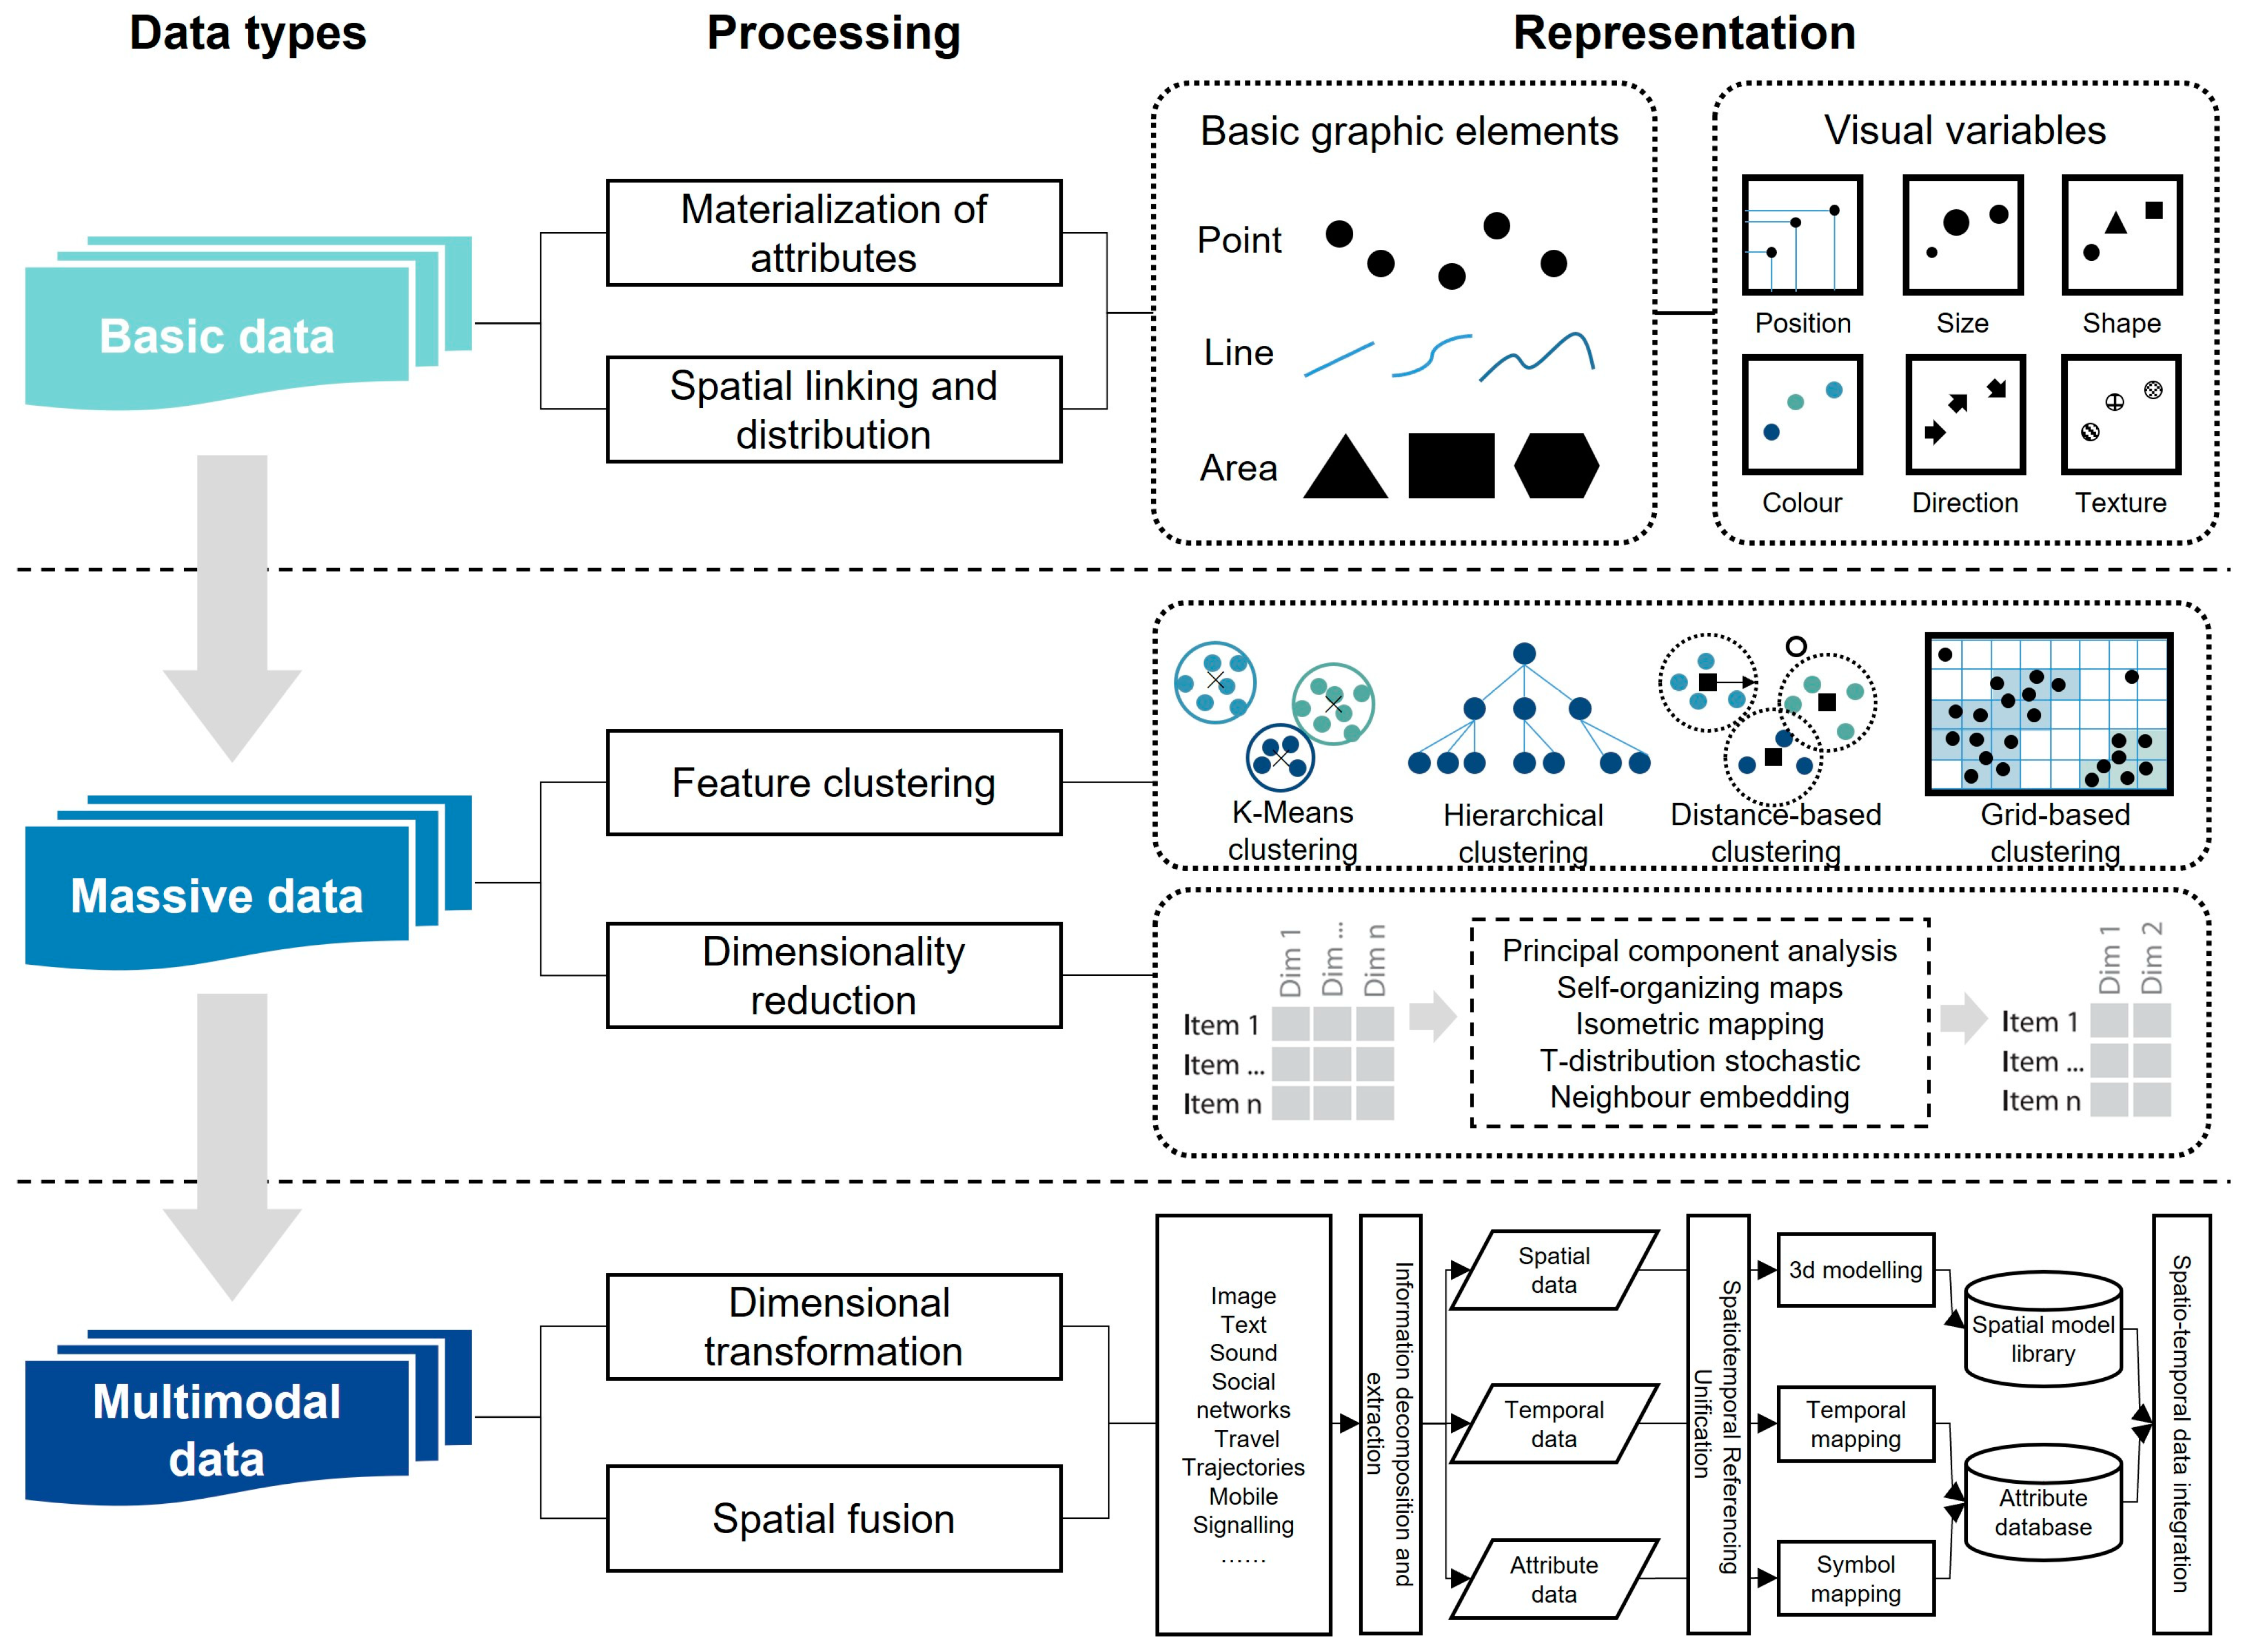
4.1. Visual Representation of Multimodal Data

The visual representation of multimodal spatio-temporal data results from the integration and mapping of graphic elements and visual variables tailored to the specific requirements of the research task. As data sources and modalities have expanded, the methods of representation have evolved from traditional approaches that primarily display geographical distribution and descriptive statistics. Contemporary methods now combine data analysis tasks to facilitate targeted inductive calculations or dimensional transformations on spatio-temporal data, enabling the collaborative display of multi-dimensional information. Figure 9 illustrates the evolving relationship between data complexity and visual representation methods within this application context.

4.1.1. Traditional Spatial Distributions of Spatio-Temporal Data

Visual representation of spatio-temporal data in landscape architecture has traditionally focused on geographic mapping of foundational datasets and descriptive visualization of various parameters. Over time, GIS and remote sensing technologies have been employed to construct basic spatial mapping frameworks. These frameworks primarily transform static or temporal landscape parameters into recognizable spatial symbol systems. Common methods include the use of geographic coordinate systems to present spatial distributions through feature symbols [60], heat maps [61], cluster diagrams [62], or layered overlays [63]. Such approaches excel at revealing spatial heterogeneity by integrating spatial statistical metrics with temporal analysis to capture macro-scale patterns, such as urban expansion and ecological degradation. For instance, Nikolaishvili et al. (2011) utilized GIS to generate thematic maps of anthropogenic landscape changes based on field survey data (1977–2005), multi-scale landscape maps, census, and industrial statistics, providing a methodological framework for quantitative mapping of historical landscape evolution [44]. Similarly, Tateosian et al. (2014) employed spatio-temporal cube visualization combined with high-resolution LiDAR time-series data to analyze and visualize dynamic coastal terrain evolution [41].
While traditional studies provide a solid geographic foundation for multimodal visualization, they face limitations in analyzing dynamic processes and integrating multi-source data. These methods often rely on predefined spatial and temporal granularities, such as fixed administrative boundaries or annual intervals, which restrict their capacity for fine-grained, interactive analysis. Furthermore, traditional symbolic systems struggle to efficiently represent large-scale datasets. Some studies have extended traditional approaches through technical innovations. For example, Zhong et al. (2018) proposed an Object-Based Sample Transfer (OBST) method to reduce cross-year mapping errors in land cover classification by leveraging spatial constraints [64]. Liu et al. (2019) combined spatio-temporal rules with dense Landsat time-series data to enable continuous monitoring of impervious surfaces [65]. These cases collectively demonstrate that while traditional methods remain valuable, their ability to handle large-scale, real-time, and multi-scale data integration requires significant advancements to meet the demands of smart cities.

4.1.2. Information Refinement for Massive Data

In landscape architecture, the visualization of spatio-temporal data presents significant challenges due to the massive and complex attributes of such datasets. High-dimensional, multi-scale spatio-temporal data often result in information overload and reduced cognitive efficiency, necessitating algorithmic optimization and multi-source data integration [66]. To extract meaningful insights from massive datasets, researchers commonly analyze spatial density and clustering patterns. Point clustering methods are widely used to identify major trends in massive data, employing algorithms such as K-Means clustering, hierarchical clustering, distance-based clustering, and grid-based clustering [67,68]. By adjusting parameters like distance thresholds, these algorithms extract and visualize primary clusters, mitigating issues such as visual clutter caused by overlapping data points. For instance, these techniques can effectively reveal clusters of trip origins and destinations [69], identify hotspots of tourism demand [70], and extract major transportation flow lines [71]. However, relying solely on point clustering has limitations, including poor usability for multi-category urban data visualization and the inability to locate data points based on their intrinsic attributes. Interactive capabilities are also often inadequate. To address these challenges, recent studies have proposed enhanced data mining approaches that integrate temporal, spatial, and categorical visibility controls, enabling interactive clustering to improve user comprehension and data localization efficiency [72].
As a complex system, landscape environment data possess additional characteristic features beyond spatio-temporal attributes [73]. Researchers have developed composite indicator systems to describe these intricate spatial relationships. However, due to the limitations of human perception, it is challenging to quickly and efficiently discern relationships within data exceeding three dimensions [74]. Thus, there is a pressing need to represent high-dimensional spatio-temporal data in lower-dimensional spaces. One effective method involves selecting sub-dimensions with high information entropy and employing coordinated multi-view visualizations, such as scatter plots, parallel coordinates, pixel-oriented displays, radial graphs, and radar charts [75,76]. Another approach involves high-dimensional data projection, which reduces the number of variables by applying dimensionality reduction and clustering techniques within defined spatio-temporal observation ranges. Combined with visual mapping, this method generates region boundaries with clear morphological significance and spatio-temporal responsiveness, facilitating the exploration of geographic variations [77]. It should be noted that dimensionality reduction techniques like PCA do have limitations. For example, they may lead to loss of some original information and increase the complexity of data interpretation, which may affect the accuracy and reliability of the results to some extent.

4.1.3. Multimodal Data Fusion in the New Data Environment

Multimodal data fusion has overcome traditional spatio-temporal visualization limitations through heterogeneous data integration and cross-modal analysis. Current research focuses on three key areas: spatialized multimodal mapping, semantic coupling, and dynamic interaction.
For spatialized mapping, researchers have created unified geographic frameworks that integrate unstructured data (e.g., social media text, street view images) with structured entities (e.g., road networks, building footprints), establishing their topological relationships [78,79]. These approaches enable multidimensional visualization of attribute data. For instance, Srivastava et al. developed a deep learning-based multimodal CNN integrating street view images with satellite data [80]. This approach enhances urban land use classification accuracy through spatial alignment and complementary feature extraction, enabling cross-modal spatial-semantic coordination that supports multi-scale urban system representation from individual buildings to city-wide analysis.
In dynamic interaction research, the spatio-temporal heterogeneity of multimodal data presents novel fusion challenges. Recent studies integrate temporal patterns with spatial configurations. Crivellari and Resch (2022) analyzed taxi trajectory data and POI spatio-temporal correlations to uncover coupling mechanisms between urban functional zones and population mobility dynamics [81]. Similarly, Song et al. (2023) combined fixed monitoring station data with mobile sensor inputs, employing multi-level spatio-temporal cascade models to estimate grid-level air pollution distribution [82]. This exemplifies how multi-source data can complement spatio-temporal resolution limitations. However, existing methods face challenges such as data sparsity and cross-modal conflicts. For instance, Zhang et al. (2019) highlighted that cross-modal alignment errors between LiDAR and photogrammetry data can lead to false positives in building change detection [83]. Wong et al. (2021) identified spectral-textural conflicts between optical and radar data in land cover classification [84].
It is worth noting that while multimodal data fusion significantly reduces the time and resource demands associated with traditional data collection methods, its effectiveness is highly dependent on data quality and validation mechanisms. One of the major difficulties in addressing these data quality biases lies in the fact that it is almost impossible to obtain a dataset that is completely free of biases, especially for user-generated data. For instance, the social demographic biases of the main contributors to social media and crowdsourcing data may lead to limitations in the data when it comes to reflecting the needs and preferences of different population groups [85]. The possible errors in the geographical tags and timestamps of photos or texts may affect the accuracy of the identification of urban functional areas [86]. In addition, urban areas with more frequent human activities tend to generate more complete spatio-temporal perception data, which also reflects the situation of data biases from the side [87]. For example, Gillespie et al. (2024) leveraged social media images and satellite data to train deep learning models for real-time monitoring of vegetation distribution [88]. However, its reliance on crowdsourced data introduces labeling biases, necessitating pre-validation or even manual data extraction to minimize potential spatial and temporal errors [89]. Despite the aforementioned issues, it is undeniable that sensing data have irreplaceable advantages in reflecting the dynamic changes of cities. To mitigate the impacts brought about by these limitations, people have been advocating for the assessment of the quality and biases of user-generated data [90,91]. Among them, the five quality elements, namely “completeness, positional accuracy, logical consistency, temporal accuracy, and thematic accuracy”, proposed by the ISO 19113 standard [92], have been widely used to evaluate the reliability of user-generated data. In addition, there are some possible solutions, such as integrating different data sources in data mapping [93], performing cross-validation with corresponding data of higher quality, and using proxy indicators to substitute for certain data [94].

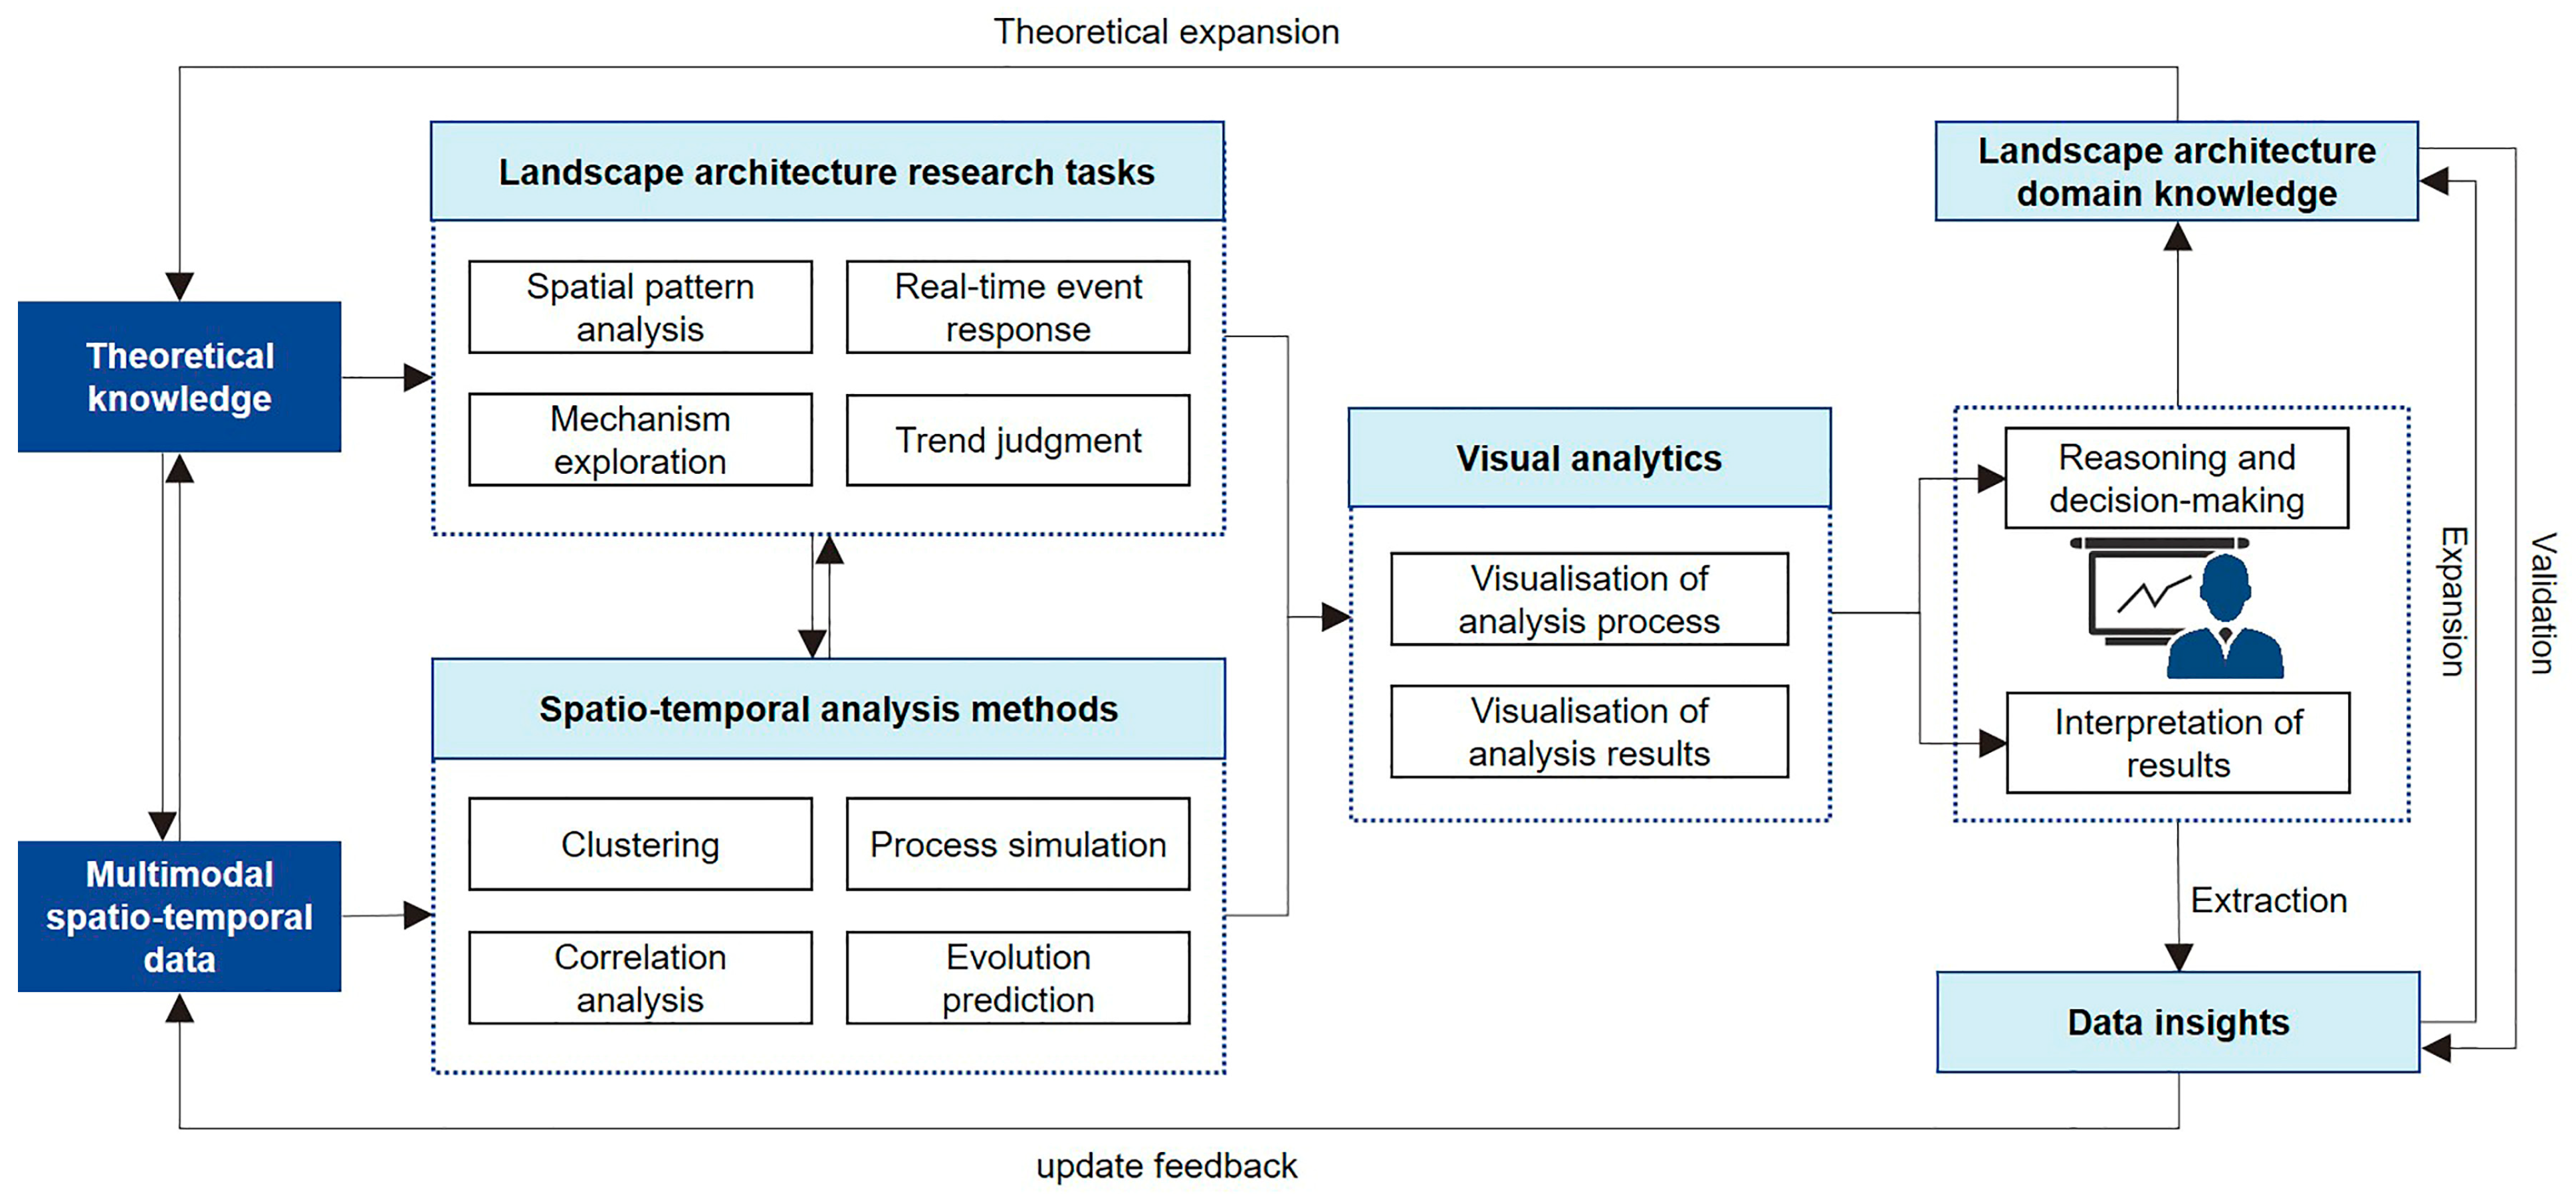
4.2. Visualization Analysis Methods Driven by Research Tasks

As the volume and complexity of data continues to increase, merely visualizing the features of the initial dataset often provides limited insights. It is necessary to align specific research task requirements with the selection of appropriate analysis models and decision-making tools. This approach enables the description and explanation of spatial phenomena, thereby enhancing our understanding of spatial dynamics within the environment and society. Such understanding is essential for conducting virtual scientific predictions and regulatory measures [95]. This research categorizes the core analysis tasks involved in landscape architecture research into four parts: spatial pattern analysis based on clustering, mechanism mining based on correlation analysis, real-time response based on process simulation, and trend judgment based on evolution prediction (Figure 10).

4.2.1. Spatial Pattern Analysis Based on Clustering

The spatial pattern of a landscape environment refers to the arrangement and configuration of landscape elements within a given space, characterized by aggregated, dispersed, and continuous compositional traits. Applying clustering analysis techniques to explore these spatial patterns aims to reveal the agglomeration characteristics of landscape entities or events within the spatio-temporal domain. This understanding facilitates insights into the configuration of landscape facilities, identification of resource hotspots, and monitoring of changes in landscape elements [96]. Clustering analysis can be categorized into two types based on the elements considered: spatio-temporal location clustering and non-spatial thematic attribute-based clustering.
Spatio-temporal clustering seeks to uncover the agglomeration patterns of landscape elements that are both spatially proximate and temporally close. By abstracting spatio-temporal data into spatial point data, analysis methods such as quadrat counting, kernel density estimation, and spatial autocorrelation can be employed. These methods allow for the analysis of aggregated distribution patterns, which can then be visualized through heatmaps, density maps, and scatter plots using geographic information systems (GISs) [97,98]. Non-spatial thematic attribute-based clustering aims to identify the distribution characteristics of landscape elements or phenomena with similar attributes within the spatio-temporal context [99]. In the field of landscape and urban planning, researchers often classify urban morphology and extract morphological outlines to achieve a systematic description and quantitative representation of physical objects by selecting appropriate morphological indices. Clustering algorithms, such as the K-means algorithm and SOM neural networks, are widely used to identify morphological types. These algorithms leverage end-to-end training to automatically capture latent correlations in high-dimensional data and visualize the results in geographic space through color-coded representations [100].
However, the traditional clustering methods that transform dynamic spatio-temporal processes into static time slices face considerable challenges. Researchers have investigated clustering analysis techniques for urban trajectory and point of interest (POI) data, exploring methods that can dynamically detect characteristics of continuously updating spatio-temporal data streams within urban environments. For instance, Chen et al. [101] employed unsupervised clustering methods to classify POI data and extract the dynamic semantics of urban spaces. Tao et al. reconstructed and analyzed the spatio-temporal patterns of passenger travel trajectories using smart card data [97]. By integrating flow graphs and conditional graphs, they generated conditional flow graphs to capture the temporal variations in passenger flow patterns.
It is worth noting that AI-driven clustering methods are not intended to completely replace traditional clustering techniques. Instead, they enhance feature extraction capabilities and introduce flexible dynamic modeling frameworks, thereby reshaping and optimizing the core technological foundations of traditional clustering methods. Such research methods have been widely applied to understand citizen lifestyles, reveal urban development trends, and depict the flow of visitors in real-time, which is crucial for constructing smart command and control systems and implementing effective regulatory measures.

4.2.2. Mechanism Mining Based on Correlation Analysis

The occurrence of environmental issues or social phenomena in the landscape environment is the result of the combination or interaction of many specific mechanisms. Conducting scientific research and planning on such systems requires an understanding of the relationships, change mechanisms, and trends among the internal systems or entities within the spatial domain [101].
Correlation analysis aims to identify the continuous spatio-temporal processes of landscape elements, thereby enhancing our understanding of the interrelationships and interactive characteristics of components within the landscape [56]. Landscape researchers have mainly focused on three aspects. First, incorporating the Time Factor: This involves integrating the temporal dimension into spatial correlation analysis to identify collections of landscape elements that frequently co-occur or appear in succession at nearby spatio-temporal locations [102]. Second, expanding to Topological Space: Researchers define the proximity relationships between geographic entities based on the shortest path distance in topological space, moving beyond traditional Euclidean measurements [98]. Finally, shifting to Local Perspectives: By considering spatial heterogeneity, researchers identify the association patterns of landscape elements within specific regions through regional division or clustering analysis [103].
Regression analysis and correlation analysis are the most commonly used algorithms for exploring the multivariate relationships among data variables. GIS platforms provide multivariate linear regression and network analysis models for analysis. However, these tools are limited to identifying linear relationships. To further explain the complex non-linear relationships between geographic entities, some researchers have turned to construct correlation analysis models using platforms such as R, Python, and SPSS, enabling more precise analysis of spatial correlations. The development of methods and tools such as spatial regression [104], geographically weighted regression [105], spatial Bayesian hierarchical models [106], and geographic detectors [107] has greatly promoted the analysis and utilization of spatio-temporal data with spatial correlations.
In terms of visual representation, heat maps [61], network topology graphs [108], and parallel coordinate [109] plots are primary tools for depicting spatio-temporal relationships. However, most visualization approaches remain confined to two-dimensional static representations, lacking the capacity for dynamic simulation and interactive exploration of high-dimensional spatio-temporal relationships, such as multivariate co-variations and causal chain transmissions.

4.2.3. Real-Time Response Based on Process Simulation

Process simulation can help decision-makers reveal the patterns and trends from a vast amount of information. It plays a crucial role in emergency management, disaster assessment, and risk management decision-making. Current research on the visualization of process simulation can be summarized into two categories: one is to use 3D data models to simulate and analyze spatio-temporal objects based on real events, capturing their evolutionary processes and state changes [110,111]. The other is to visualize the migration process of specific spatio-temporal objects, such as monitoring the changes in vegetation over time [112].
To achieve real-time responses to spatio-temporal objects and events, efficient sensors and information transmission networks are required to enable real-time data acquisition. It primarily relies on space–air–ground sensors and location service technologies. By setting control thresholds, it becomes possible to achieve real-time responses and intelligent control of geographical phenomena [113]. Recent advancements in landscape architecture research emphasize real-time spatio-temporal data acquisition and performance evaluation through integrated monitoring technologies, particularly for ecological quality assessment and predictive analysis. For example, the Senseable City Lab’s “City Scanner” project employs vehicular IoT networks to dynamically map urban microclimates, generating high-resolution environmental quality profiles for road infrastructure [114]. Meanwhile, researchers at Southeast University developed an IoT-based system to monitor rainfall patterns and stormwater runoff metrics, enabling quantitative assessment of multifunctional performance in sustainable drainage projects [115]. Similarly, the University of Bristol’s “Open Bristol” initiative utilizes Wi-Fi-enabled sensors to track critical water quality parameters along urban waterways, with real-time data publicly accessible via an open platform to support adaptive waterfront management [116]. In addition, during the planning and design phases, scholars integrate on-site measurement data with simulation software to extrapolate spatio-temporal processes, thereby aiding design decision-making and spatial optimization. For instance, the storm water management model (SWMM) is used to simulate hydrological processes [117], while individual mobility behavior can be analyzed through spatio-temporal simulation models that examine the flow characteristics of people in specific activity areas [118].
It is worth noting that the achievement of real-time response also depends on the ability to process a large amount of real-time information. This requires a powerful computing platform to enable real-time calculation. The collaborative technology of cloud computing and edge computing provides reliable computing support for real-time response. Cloud computing provides centralized high-performance computing capabilities and is capable of handling tasks such as big data storage at the urban scale, complex model training, and cross-regional data sharing. Edge computing, by deploying lightweight computing devices at terminal nodes, can realize the rapid processing and response to adjacent data, alleviating the data transmission delay and the pressure of centralized computing. In the cloud-edge collaborative mode, the massive real-time data generated by the sensor network is locally calculated through edge nodes. After extracting key features, the data is uploaded to the cloud, thereby achieving a balance between the utilization of computing resources and the response speed [119,120].
It is important to recognize that spatio-temporal process data exhibit complex variations in frequency, granularity, and scale, which can lead to differing spatial semantic characteristics under various environmental conditions [118]. For instance, in high-frequency, fine-granularity, and small-scale analytical environments, studies of individual travel behavior often use perception ranges and lines of sight as analytical units, with behavioral data reflecting characteristics of wayfinding. Conversely, in medium-frequency, medium-granularity, and medium-scale environments, buildings or parcels are typically used as analytical units, and behavioral data are refined into spatial layout features of origins and destinations [121].
Furthermore, the effectiveness of real-time response technologies heavily depends on the coordinated optimization of data frequency, granularity, and scale. While high-frequency, fine-granularity data can capture local heterogeneity, they may compromise computational efficiency [122]. On the other hand, medium- to low-frequency data, such as remote sensing imagery and radar time series, are better suited for projecting trends at regional scales. This highlights the necessity for multi-scale data integration, where the selection of frequency, granularity, and scale aligns with research objectives and environmental conditions, enabling the generation of interpretable and spatio-temporally responsive visual analysis results.

4.2.4. Trend Judgment Based on Evolution Prediction

Evolution prediction involves forecasting unknown system states in both time and space. This process estimates the attributes of unknown elements by reflecting the relationships between spatio-temporal variables through modelling, enabling the identification of distributional characteristics and trends of spatio-temporal events over time. Current research primarily focuses on the construction and optimization of models, which can be categorized into three types: spatio-temporal statistical models, machine learning models, and physics-based models.
Spatio-temporal statistical models, such as geostatistical models and spatio-temporal autoregressive moving average models, can handle spatio-temporal dependencies [123], while geographically and temporally weighted regression models can express spatio-temporal heterogeneities [124]. Meanwhile, AI-based methods, including machine learning and deep learning, have shown superior performance in modelling complex non-linear relationships, with applications in traffic forecasting, video prediction, and air pollution modelling [84,125]. However, AI models often face challenges in interpretability due to their black-box nature, limiting their credibility in decision-making processes where physical mechanisms are required. In contrast, physical models, grounded entirely in physical principles, offer reasonable explanations for predictions but typically fall short of statistical and machine learning models in terms of predictive accuracy. To balance interpretability and predictive performance, researchers are working to integrate artificial intelligence with physical models, leveraging the strengths of both to improve simulation and prediction accuracy [126].
Moreover, the deep integration of multimodal data has further expanded the scope of prediction. For example, Liu et al. combined POI data, road networks, and land use information to construct a spatialized carbon emission model, overcoming the scale limitations of traditional statistical data [127]. Similarly, Wang integrated mobile signaling, remote sensing, and tax data to achieve dynamic and highly accurate population distribution predictions [128]. These cases demonstrate that the synergy of multi-source data not only enhances input features but also uncovers deeper mechanisms of human–environment interactions through cross-modal correlations.
Visualization, as a core output in trend analysis, commonly relies on formats such as heatmaps, time-series plots, and dynamic trajectory maps. These visualizations assist researchers to understand the historical evolution, current characteristics, and development trends of the study subjects. However, existing methods for visualizing spatio-temporal evolution prediction results often lack user-friendliness and do not facilitate automatic data collection, model training, or the provision of understandable prediction results in near real-time. Therefore, in addition to achieving high-precision predictions of spatio-temporal events, it is essential to develop user-friendly interactive systems for spatio-temporal evolution prediction. Such systems would enhance user-centric trend analysis and support intelligent decision-making [126].

4.3. Visualization Interactive Platforms Oriented to Smart Cities

Interactive visualization platforms integrate and communicate built environment data in real-time, serving as essential infrastructure for smart city development. These systems translate complex spatial, temporal, and operational datasets into actionable insights across urban planning, environmental monitoring, and resource management. By enabling real-time interaction between physical and digital urban systems (Figure 11), they support two core technical advancements: scene reconstruction and immersive decision-making interfaces. Innovations in digital twin technology, multimodal AI models, and mixed reality are driving their evolution from static data tools to adaptive systems that enhance collaborative governance and urban resilience.

4.3.1. Scene Reconstruction of Multimodal Spatio-Temporal Data

Since the 1990s, GIS has been the primary tool for spatio-temporal information analysis, witnessing rapid development in data storage, analysis, decision-making, and visual representation [129]. However, the fixed analytical functions of GIS often struggle to meet the growing demand for dynamic interaction with complex multimodal data. As Afzal et al. [103] noted, when dealing with large-scale complex data, the selection of visualization tools is limited, prompting researchers to combine multiple tools and progressively output and visualize data generated at different stages. This fragmented workflow has driven the development of technology-driven platforms aimed at seamless integration and dynamic representation of cross-scale, multimodal data through open interfaces and data fusion [130,131]. For instance, the visualization architecture of multi-window dashboards has been explored, enabling the synchronized presentation of complex information across diverse dimensions and levels using various visualization techniques [24].
In recent years, breakthroughs in computer graphics and computer vision, such as Neural Radiance Fields (NeRF), Non-Photorealistic Rendering (NPR), and volume rendering, have opened new pathways for the refined modeling of dynamic urban scenes. However, in the field of landscape architecture, scene reconstruction still relies primarily on traditional 3D modeling methods, such as Building Information Modeling (BIM) and oblique photogrammetry. The application of emerging technologies remains in an exploratory phase. This gap limits the dynamic simulation of landscape ecological processes, which still depend on manual parameterized modeling, making it challenging to achieve both high fidelity and real-time performance.
Importantly, landscape visualization interaction platforms should extend beyond high-fidelity simulations of external environments. It is suggested to incorporate real-time multi-source data to illustrate ecological processes and dynamic evolution patterns of the landscape environment [132]. This demand has catalyzed the adoption of digital twin technology, whose core concept is to create a virtual mirror of the physical environment, enabling high-precision modeling and real-time monitoring of dynamic evolutionary processes. Under ideal conditions, high-precision modeling of spatio-temporal objects and real-time monitoring of dynamic evolution processes can be achieved through detailed sensing and computation. Researchers can leverage the characteristics and evolutionary trends of spatio-temporal objects to perform parameter optimization, hypothesis testing, and knowledge induction. This allows for the generation of control schemes that address real-world needs, which can then be integrated back into the visualization platforms. Continuous monitoring and evaluation of implementation effects will provide precise support for planning and designing human settlement environments.
Despite its potential, the application of digital twin technology in landscape architecture remains in its early stages [133]. Current research primarily focuses on physical entity modeling [134], with limited attention to ecological process twinning and multi-agent behavioral interactions in complex systems. Some studies have pointed out that accurately incorporating the impacts of social phenomena and human behaviors into predictions still poses challenges [135]. From the perspective of technology development, the application of social sensing data is often accompanied by problems such as large data volume, diverse data formats, and complex scenarios, which increases the complexity of algorithms and computational costs [136]. From the user’s point of view, privacy and data protection are key issues [137]. Many applications include users’ private, confidential, or valuable data. An insecure system may arouse concerns about unauthorized access to private or confidential information, thus reducing users’ willingness to accept digital twin technology [138].
To mitigate these issues, distributed computing can be combined with modular design to optimize the processing efficiency of complex tasks, and lightweight modeling can be adopted to reduce the overall computational cost [139]. Meanwhile, by learning from privacy protection technologies such as Federated Learning, collaborative modeling of multi-source data can be realized without disclosing the original data [140]. Moreover, through data anonymization and the establishment of clear privacy protection policies, user trust can be further enhanced and the application of the technology can be promoted [141]. Future progress requires the integration of real-time environmental sensors, social media data, and mechanistic models to develop digital twin systems that combine high-fidelity simulation with dynamic adaptability. Such systems can support the lifecycle management of landscapes, enabling closed-loop processes from planning and design to implementation monitoring and performance evaluation.

4.3.2. Immersive Interaction for Decision-Making

Understanding complex spatial and temporal datasets has become vital for researchers and policymakers. However, existing tools for visualizing such multidimensional geospatial data are technically challenging and time-consuming, posing obstacles even for experts [142,143]. Immersive interaction technologies offer a promising solution by lowering these barriers and enhancing accessibility. Visualization platforms leveraging such technologies can significantly advance spatio-temporal data analysis, foster broader public engagement in landscape research, and provide planners, analysts, and policymakers with robust data-driven decision support.
In recent years, extended reality (XR) technologies, encompassing virtual reality (VR), augmented reality (AR), and mixed reality (MR), have shown substantial potential for exploring and analyzing complex environments in landscape architecture. Different from the traditional quasi-3D representation, the stereoscopic 3D in XR technology can improve the performance of many visual spatial tasks by mimicking the natural depth perception of human beings [144]. By integrating 3D GIS with game engines such as UE/Unity, high-fidelity scene representation and spatial analysis computations become achievable. VR technology provides immersive simulations of real-world environments [145], while AR technology overlays virtual elements onto physical spaces, creating enhanced “augmented” experiences [146]. MR technology further enables real-time interaction between physical and digital objects within visualization environments [147]. Additionally, AR/VR-based remote collaboration technologies have overcome spatial limitations, facilitating multi-user participation in research, decision-making, and intelligent management processes.
Currently, XR technologies have been applied in landscape architecture for design education [148], landscape perception evaluation [149], and the development of interactive landscape models [150]. Despite their advantages in spatial perception and collaborative efficiency, their integration into design workflows faces several challenges [151]. Many existing tools emphasize visual presentation over the integration of professional analytical models, limiting their utility for advanced decision-making processes. Moreover, technological adaptability varies among stakeholders. For instance, a recent study evaluating urban planners’ use of VR head-mounted displays revealed a preference for traditional 2D maps, with some participants citing motion sickness as a significant barrier to adoption [148]. Additionally, different user groups have distinct visualization needs: while the public favors interactive displays of processed environmental data, researchers and policymakers prioritize process-oriented visualization for environmental analysis, prediction, and decision-making. These challenges highlight a gap between research progress and practical design applications. Addressing this gap requires the development of lightweight engines, adaptive interaction designs, and ethical guidelines to ensure the effective adoption of immersive technologies across diverse user groups. In addition, the implementation of specific technologies poses a technical barrier for traditional landscape architects [152]. There is an urgent need to rely on the collaboration of interdisciplinary teams, such as those from computer science and geographical information science, to promote the popularization of relevant technologies in the field of landscape architecture.

5. Challenges and Future Directions

5.1. Research Challenges

The advent of the Digital Landscape 3.0 era has brought the integration of multimodal spatio-temporal data for dynamic mapping, analysis, and forecasting to the forefront of landscape research. Preliminary workflows have been developed for visualizing such data, enabling foundational studies in analysis and mapping.
Overall, multimodal spatio-temporal data provide rich data support for the intelligent development of landscape architecture, making it possible to conduct dynamic mapping, analysis, and prediction, and enabling a more comprehensive capture of the evolutionary characteristics of the landscape system. The visualization scenarios, on the other hand, bring convenience to the presentation and understanding of data. They help professionals and decision-makers intuitively obtain design-related information, thereby assisting in making scientific decisions. This promotes the progress of landscape architecture towards intelligence, enhancing its effectiveness in dealing with complex environmental issues and meeting human needs, among other aspects. Although significant progress has been made in visualization technology, the application of spatio-temporal data visualization in the field of landscape architecture still faces some challenges, which are specifically reflected in three major aspects: the integration and processing of multimodal spatio-temporal data, task-driven visualization analysis, and the construction of interactive platforms.
  • The integration and processing of data related issues
When faced with multimodal spatio-temporal data, people are committed to improving the readability of large-scale datasets, especially by integrating different data modalities to enhance the accuracy of environmental element identification. For example, remote sensing images are the main data source for observing the spatio-temporal evolution patterns of the landscape environment at a macro scale, while sensors at a micro scale are key tools for measuring the dynamic characteristics of the local environment.
However, multimodal spatio-temporal data across departments, fields, and scales are huge in volume, diverse in types, different in formats, and inconsistent in frequency and scale. There are challenges in the fusion of complex heterogeneous data, real-time presentation, and interactive sharing. Formatting these data in a consistent and timely manner while integrating them from multiple sources to ensure the output of formatted data is a complex task [137].
The effectiveness of multimodal fusion highly depends on the data quality and verification mechanism, and solving the problem of data quality deviation is another challenge. Urban sensing data, especially user-generated data, has deviations in aspects such as sociodemographics, geographical tags, and timestamps. To ensure the collection of meaningful data and thus guarantee the best quality of data input into the algorithm model [141], it is necessary to perform transformation, cleaning, and quality inspection on the data in advance. In addition, issues related to digital privacy and trust also need to be addressed. It is necessary to use appropriate privacy protection technologies and formulate corresponding regulations and privacy policies [153]. Data accessibility limitations are necessary for relevant stakeholders to protect personal data [154].
2.
Task-driven visualization analysis related issues
Task-driven visualization analysis remains the dominant approach in landscape architecture research; however, it is not without its challenges. On the one hand, as the quantity and complexity of data continue to increase, there is an increasingly urgent need for efficient computation and processing of the data. The complexity of the technology, as well as the demanding requirements for fidelity, accuracy, and computation, have also increased the technical costs [155]. The technical collaboration between cloud computing and edge computing is expected to provide computational support for real-time responses.
On the other hand, the theoretical interpretability of the analysis results is also a crucial issue. Combining traditional spatial analysis techniques with AI algorithms can enhance pattern recognition and analytical accuracy. Nonetheless, these applications require substantial prior knowledge. Over-reliance on technical tools without rigorous theoretical frameworks may lead to “data traps,” potentially misguiding design decisions. For instance, a recent study employing causal AI uncovered causal relationships in urban traffic data, providing a powerful tool for data-driven solutions to modern urban challenges [156].
3.
The construction of visual interactive platform-related issues
In terms of representing research processes and outcomes, dynamic visualizations offer opportunities for interactive exploration and design-related data retrieval. However, current studies predominantly utilize 2D heatmaps. While advantageous for intuitive data interpretation, these methods are limited in capturing the complexity and dynamics of landscape systems.
3D visualization techniques partially address this limitation; however, its application in the field of landscape architecture remains contentious. This is particularly evident in quasi-3D representations constructed using single-view depth cues, such as drawings, maps, and information or data visualizations. In such cases, 3D visualization can introduce visual clutter, especially when the 3D elements are redundant for the task [157]. Furthermore, it adds unnecessary cognitive complexity for users interacting with maps or drawings [158]. Stereoscopic 3D based on XR technology can effectively address these issues. Nonetheless, the application scenarios for current high-fidelity rendering technology in landscape architecture still have considerable room for expansion. While these technologies can greatly improve the efficiency of environmental feature collection and the precision of scene reconstruction, their full potential in this field remains underexplored. Significant gaps persist in achieving more realistic, immersive visual outputs and in delivering authentic real-life experiences.
The development of interactive platforms presents a promising research direction. Multiview collaborative analysis can uncover intrinsic relationships in landscape data. Designing advanced visualization types and interfaces can effectively convey complex information to experts, landscape professionals, and decision-makers. As the knowledge base in landscape architecture expands, stakeholders increasingly demand more detailed information. Therefore, visualization options tailored to specific purposes and stakeholder preferences are essential.
The ultimate goal of landscape architecture research is to improve both natural and human environments. However, current visualization applications are primarily used for process explanation rather than direct decision-making support. Simple interfaces dominate in practice, often limited to presenting design outcomes. While immersive experiences are increasingly used to enhance perception assessment accuracy, their adoption in design workflows remains limited. In addition, due to the lack of technical knowledge, skills, and experience, the development of relevant platforms and technologies, as well as their adoption rate in the design workflow, are relatively low [159]. This disconnect underscores the need for integrated, application-oriented visualization approaches. Case studies and application testing are essential to evaluate how visualization can effectively support sustainable environmental design.

5.2. Future Directions

To address these challenges and limitations, we propose four recommendations for future research on visualization techniques for multimodal spatio-temporal data in landscape architecture.
  • Real-time data presentation and dynamic interaction of multimodal data
Future research should focus on optimizing real-time visualization techniques to address challenges such as large-scale datasets, diverse modalities, and high update frequencies. By integrating advanced techniques like NeRF, NPR, and volume rendering, efficient and intuitive visualization can be achieved without compromising model accuracy. Dynamic data fusion algorithms based on neural networks should also be explored to balance detail, real-time performance, and computational cost. In addition, the collaborative utilization of edge computing and distributed computing technologies can significantly enhance the efficiency of data processing and transmission, providing technical support for achieving cross-departmental and cross-disciplinary data sharing and real-time responses.
2.
Efficient integration and customization of visualization platforms
To meet diverse task requirements, cross-platform multimodal data integration frameworks should be developed to enable seamless interaction and multilevel visualization. Digital Twin technology can be leveraged to create platforms that virtually replicate real-world scenarios, offering comprehensive analysis and predictive capabilities. AI and semantic modeling techniques can further standardize data formats and develop intelligent interfaces to enhance interoperability across disciplines and systems. User profiling can provide customized visualization solutions for diverse stakeholders, improving usability and decision-making value.
3.
Intelligent data processing and immersive scene mapping
To handle massive spatio-temporal datasets, advanced deep learning models and automated modeling techniques should be incorporated to enhance anomaly detection and dynamic monitoring with interactive validation. Future research should also explore the deep integration of XR technologies with multimodal data visualization, creating immersive interactive experiences for diverse user groups. In this process, in addition to following the visual variable and semiotic principles proposed by Bertin [160,161], the Gestalt principles [162] and other variables also need to be considered, such as the camera angle, color, the position of the light source in relation to the perception of shadows and time, and the level of realism used for textures [163,164], etc. Moreover, combining the generalization principles of cartography with the adaptive level of detail management in computer graphics can also help improve the visualization effect and user experience of XR displays [158]. By incorporating participatory sensing data and social behavior data, more scientific, dynamic, and intuitive environmental mapping models can be developed to support forward-looking landscape design.
4.
Multidisciplinary collaboration and case-driven practices
The visualization research of multimodal spatio-temporal data necessitates the joint participation of scholars from diverse fields to establish a collaborative innovation research system featuring interdisciplinary integration. For instance, tasks involved in the real-time presentation of multimodal spatio-temporal data and the development of interactive platforms, such as the establishment of 3D spatial models, the cleaning and preprocessing of basic data, calculations, and the visualization of results, demand technical support from disciplines like geographic information science, statistics, and computer science [165]. Moreover, for the theoretical analysis of relevant research findings, it is also essential to collaborate with multiple disciplines, including ecology, humanities, and social sciences, to conduct in-depth analyses of dimensions such as the environmental impact mechanism, sociocultural driving forces, and historical and cultural values [152].
To facilitate effective cooperation, joint research projects, the formation of interdisciplinary teams, and knowledge sharing can serve as specific approaches for the exchange of methods, tools, and case studies. Through academic cooperation among different faculties within research institutions, by giving full play to their respective disciplinary advantages and establishing robust cooperative relationships, the popularization and updating of the visualization analysis techniques for multimodal spatio-temporal data can be expedited. Moreover, case-driven research should also be employed to explore the practical value of visualization technologies in design projects. For example, Digital Twin technology can simulate long-term impacts of urban landscape changes, while AR/VR scenarios can deepen public engagement in design processes. Collaboration between industry and academia is essential to establish technical standards and guidelines tailored to landscape architecture practices.

6. Conclusions

With the rapid advancement of digital technologies, multimodal spatio-temporal data have become a cornerstone of the spatio-temporal information infrastructure in landscape architecture, driving the development of information systems. Visualization technologies, as a key component, provide robust technical support for environmental monitoring, decision analysis, and design representation. This study reviews the progress of multimodal spatio-temporal data visualization in landscape architecture over the past two decades, summarizing application scenarios from three perspectives: visual representation, visualization analysis methods, and visualization interaction platforms based on data types and workflows in digital landscape research.
Existing research indicates the foundational role of spatial data, such as orthophotos and remote sensing imagery, in establishing the geographic framework for landscape studies. Dynamic sensing data complement these datasets by offering detailed perspectives on urban environments and human activities. Over the years, workflows for spatial pattern analysis, mechanism exploration, process modeling, and trend prediction have matured in landscape research. However, challenges remain in integrating complex datasets, achieving real-time visualization and interactive sharing, and addressing cross-sector, cross-disciplinary, and cross-scale data processing issues. The urgent need for interactive platform development reflects the growing demand for detailed, actionable information among stakeholders and emphasizes the importance of enhancing the usability and decision-making relevance of visualization outputs. Furthermore, the gap between research and practical applications, particularly in design workflows, underscores the necessity of adopting more comprehensive, application-oriented visualization approaches. It should be noted that although this study leans towards examining case studies of urban landscapes within the context of smart cities, the discussed multimodal spatio-temporal data visualization techniques also possess great application potential in the landscape visualization of non-urban areas. By adjusting and optimizing these techniques to make them suitable for different environments and requirements, scientific management and sustainable development of landscapes can be achieved across a broader range of fields.
Based on these conclusions, this study proposes several directions for future research. First, efforts should be focused on optimizing real-time data processing and visualization technologies, and leveraging the advancements in fields such as edge computing, distributed systems, and neural rendering to enhance efficiency and interactivity. Second, developing interoperable frameworks for multimodal data integration, combined with user-centered visualization interfaces, will improve accessibility and decision support for diverse stakeholders. Third, expanding the application of XR and Digital Twin technologies in landscape architecture can bridge the gap between research and practice, fostering deeper public engagement and collaborative planning. Finally, long-term studies on the environmental, social, and economic impacts of visualization technologies are needed to guide sustainable and resilient design interventions.
There are limitations to this study. Firstly, although this research focuses on English-language literature to reflect the international mainstream trends, some local characteristic practices in non-English countries may not have been fully investigated. Future research can deepen the analysis of regional technological evolution by incorporating Chinese-language databases. Secondly, while this review provides a comprehensive analysis in the context of landscape architecture, its focus is primarily on domain-specific applications. This narrow scope may limit the generalizability of findings to other fields. Future research could benefit from a more interdisciplinary approach, integrating insights from computer science, geographic information science, ecology, social sciences, and the humanities to provide a holistic understanding of the opportunities and challenges presented by these technologies.
Although the application of multimodal spatio-temporal data visualization technology in landscape architecture is still developing, within the visible scope, the continuous advancement and integration of intelligent technologies will drive the gradual refinement of the spatio-temporal visualization technology system. In this study, we hope to elevate exploratory research on multimodal spatio-temporal data visualization technologies to a more systematic theoretical framework through a common categorization of papers and phased discussions. This effort seeks to provide a guideline for new research opportunities for researchers, domain experts, and practitioners. Ultimately, these advances will provide a foundation for refined environmental analysis, intelligent planning and design, and lifecycle operation and maintenance in landscape architecture.

Author Contributions

Conceptualization, X.H. and Z.L.; methodology, X.H.; software, X.H.; validation, H.C. and B.H.; formal analysis, X.H.; investigation, X.H.; resources, X.H.; data curation, H.C. and B.H.; writing—original draft preparation, X.H.; writing—review and editing, Z.L.; visualization, X.H., H.C. and B.H.; supervision, Z.L.; funding acquisition, Z.L. All authors have read and agreed to the published version of the manuscript.

Funding

This research was funded by National Natural Science Foundation of China, grant number 52278051.

Data Availability Statement

No new data were created or analyzed in this study.

Conflicts of Interest

The authors declare no conflicts of interest.

References

  1. Stratigea, A. The Concept of ‘Smart Cities’. Towards Community Development? Netcom Réseaux Commun. Territ. 2012, 26-3/4, 375–388. [Google Scholar] [CrossRef]
  2. Camero, A.; Alba, E. Smart City and Information Technology: A Review. Cities 2019, 93, 84–94. [Google Scholar] [CrossRef]
  3. Mora, L.; Bolici, R. How to Become a Smart City: Learning from Amsterdam. In Proceedings of the International Conference on Smart and Sustainable Planning for Cities and Regions; Springer International Publishing: Cham, Switzerland, 2015; pp. 251–266. [Google Scholar]
  4. Al-Azzawi, A. Dubai Happiness Agenda: Engineering the Happiest City on Earth. In Smart Cities in the Gulf: Current State, Opportunities, and Challenges; Springer: Singapore, 2018; pp. 195–221. [Google Scholar]
  5. de Hoop, E.; Smith, A.; Boon, W.; Macrorie, R.; Marvin, S.; Raven, R. Smart Urbanism in Barcelona: A Knowledge-Politics Perspective. In The Politics of Urban Sustainability Transitions; Routledge: London, UK, 2018; pp. 33–52. [Google Scholar]
  6. Griffiths, S.; Sovacool, B.K. Rethinking the Future Low-Carbon City: Carbon Neutrality, Green Design, and Sustainability Tensions in the Making of Masdar City. Energy Res. Soc. Sci. 2020, 62, 101368. [Google Scholar] [CrossRef]
  7. Lee, J.-G.; Kang, M. Geospatial Big Data: Challenges and Opportunities. Big Data Res. 2015, 2, 74–81. [Google Scholar] [CrossRef]
  8. Gandomi, A.; Haider, M. Beyond the Hype: Big Data Concepts, Methods, and Analytics. Int. J. Inf. Manag. 2015, 35, 137–144. [Google Scholar] [CrossRef]
  9. Kitchin, R. The Timescape of Smart Cities. Ann. Am. Assoc. Geogr. 2019, 109, 775–790. [Google Scholar] [CrossRef]
  10. Gill, L.; Lange, E.; Morgan, E.; Romano, D. An Analysis of Usage of Different Types of Visualisation Media within a Collaborative Planning Workshop Environment. Environ. Plan. B Plan. Des. 2013, 40, 742–754. [Google Scholar] [CrossRef]
  11. Raaphorst, K.; Duchhart, I.; Van Der Knaap, W.; Roeleveld, G.; Van Den Brink, A. The Semiotics of Landscape Design Communication: Towards a Critical Visual Research Approach in Landscape Architecture. Landsc. Res. 2017, 42, 120–133. [Google Scholar] [CrossRef]
  12. Van Den Brink, A.; Bruns, D. Strategies for Enhancing Landscape Architecture Research. Landsc. Res. 2014, 39, 7–20. [Google Scholar] [CrossRef]
  13. Mertens, E. Visualizing Landscape Architecture: Functions, Concepts, Strategies; DE GRUYTER: Berlin, Germany, 2010; ISBN 978-3-7643-8789-1. [Google Scholar]
  14. Pettit, C.J.; Raymond, C.M.; Bryan, B.A.; Lewis, H. Identifying Strengths and Weaknesses of Landscape Visualisation for Effective Communication of Future Alternatives. Landsc. Urban Plan. 2011, 100, 231–241. [Google Scholar] [CrossRef]
  15. Brückner, I.; Remy, M. BIM Model Landscape_open Spaces: An Approach for Landscape and Environmental Planning in Infrastructure Projects. J. Digit. Landsc. Archit. 2021, 6, 344–352. [Google Scholar]
  16. Jiang, L.; Masullo, M.; Maffei, L.; Meng, F.; Vorländer, M. A Demonstrator Tool of Web-Based Virtual Reality for Participatory Evaluation of Urban Sound Environment. Landsc. Urban Plan. 2018, 170, 276–282. [Google Scholar] [CrossRef]
  17. Sacchelli, S.; Favaro, M. A Virtual-Reality and Soundscape-Based Approach for Assessment and Management of Cultural Ecosystem Services in Urban Forest. Forests 2019, 10, 731. [Google Scholar] [CrossRef]
  18. Wang, Z.; Yu, L.; Yang, L. Rethinking the Application Research of Big Data in Chinese Landscape Architecture: Based on the Analysis of Relevant Literature from 2011 to 2021. Landsc. Archit. Acad. J. 2022, 39, 82–88. [Google Scholar]
  19. Wu, J. The Fourth Paradigm: A Research for the Predictive Model of Livability Based on Machine Learning for Smart City in The Netherlands. Landsc. Archit. 2020, 27, 11–29. [Google Scholar] [CrossRef]
  20. Yang, J.; Xiong, W.; Shen, Y.; Zhu, X. Eight Methods of Landscape Design: Exploration of Landscape Urban Design Based on Digital Information Map—Taking Hangzhou Qiantang River Area as an Example. Chin. Landsc. Archit. 2020, 36, 47–52. [Google Scholar] [CrossRef]
  21. Wang, Z.; Zhao, J.; Peng, Y.; Yue, W. Comparative Evaluation of Guangzhou City Parks: Text Analysis Based on Social Media Data. Landsc. Archit. 2019, 26, 89–94. [Google Scholar] [CrossRef]
  22. Dang, A.; Zhang, D.; Ma, Q.; Li, J. Study on Smart National Park Management and Service in the Big Data Era. J. Hum. Settl. West China 2016, 31, 8–13. [Google Scholar] [CrossRef]
  23. Nasr-Azadani, E.; Wardrop, D.; Brooks, R. Is the Rapid Development of Visualization Techniques Enhancing the Quality of Public Participation in Natural Resource Policy and Management? A Systematic Review. Landsc. Urban Plan. 2022, 228, 104586. [Google Scholar] [CrossRef]
  24. Hollberg, A.; Kiss, B.; Röck, M.; Soust-Verdaguer, B.; Wiberg, A.H.; Lasvaux, S.; Galimshina, A.; Habert, G. Review of Visualising LCA Results in the Design Process of Buildings. Build. Environ. 2021, 190, 107530. [Google Scholar] [CrossRef]
  25. Eilola, S.; Jaalama, K.; Kangassalo, P.; Nummi, P.; Staffans, A.; Fagerholm, N. 3D Visualisations for Communicative Urban and Landscape Planning: What Systematic Mapping of Academic Literature Can Tell Us of Their Potential? Landsc. Urban Plan. 2023, 234, 104716. [Google Scholar] [CrossRef]
  26. Miranda, F.; Ortner, T.; Moreira, G.; Hosseini, M.; Vuckovic, M.; Biljecki, F.; Silva, C.T.; Lage, M.; Ferreira, N. The State of the Art in Visual Analytics for 3D Urban Data. Comput. Graph. Forum 2024, 43, e15112. [Google Scholar] [CrossRef]
  27. Daudt, H.M.; Van Mossel, C.; Scott, S.J. Enhancing the Scoping Study Methodology: A Large, Inter-Professional Team’s Experience with Arksey and O’Malley’s Framework. BMC Med. Res. Methodol. 2013, 13, 48. [Google Scholar] [CrossRef] [PubMed]
  28. Arksey, H.; O’malley, L. Scoping Studies: Towards a Methodological Framework. Int. J. Soc. Res. Methodol. 2005, 8, 19–32. [Google Scholar] [CrossRef]
  29. Peters, M.D.; Godfrey, C.M.; Khalil, H.; McInerney, P.; Parker, D.; Soares, C.B. Guidance for Conducting Systematic Scoping Reviews. JBI Evid. Implement. 2015, 13, 141–146. [Google Scholar] [CrossRef]
  30. Munn, Z.; Peters, M.D.; Stern, C.; Tufanaru, C.; McArthur, A.; Aromataris, E. Systematic Review or Scoping Review? Guidance for Authors When Choosing between a Systematic or Scoping Review Approach. BMC Med. Res. Methodol. 2018, 18, 143. [Google Scholar] [CrossRef]
  31. Levac, D.; Colquhoun, H.; O’Brien, K.K. Scoping Studies: Advancing the Methodology. Implement. Sci. 2010, 5, 69. [Google Scholar] [CrossRef]
  32. Grant, M.J.; Booth, A. A Typology of Reviews: An Analysis of 14 Review Types and Associated Methodologies. Health Inf. Libr. J. 2009, 26, 91–108. [Google Scholar] [CrossRef] [PubMed]
  33. Petticrew, M.; Roberts, H. Systematic Reviews in the Social Sciences: A Practical Guide; Blackwell Publishing: Malden, MA, USA, 2006; ISBN 1-4051-2110-6. [Google Scholar]
  34. Lahat, D.; Adali, T.; Jutten, C. Multimodal Data Fusion: An Overview of Methods, Challenges, and Prospects. Proc. IEEE 2015, 103, 1449–1477. [Google Scholar] [CrossRef]
  35. Laney, D. 3D Data Management: Controlling Data Volume, Velocity and Variety. META Group Research Note, 2001, 6, 1. Available online: https://www.scirp.org/reference/ReferencesPapers?ReferenceID=1611280 (accessed on 8 April 2025).
  36. Chen, H.; Chiang, R.H.; Storey, V.C. Business Intelligence and Analytics: From Big Data to Big Impact. MIS Q. 2012, 36, 1165. [Google Scholar] [CrossRef]
  37. Kitchin, R.; McArdle, G. What Makes Big Data, Big Data? Exploring the Ontological Characteristics of 26 Datasets. Big Data Soc. 2016, 3, 2053951716631130. [Google Scholar] [CrossRef]
  38. Longley, P.A. Geographical Information Systems: Will Developments in Urban Remote Sensing and GIS Lead to ‘Better’ Urban Geography? Prog. Hum. Geogr. 2002, 26, 231–239. [Google Scholar] [CrossRef]
  39. Hu, S.; Wang, L. Automated Urban Land-Use Classification with Remote Sensing. Int. J. Remote Sens. 2013, 34, 790–803. [Google Scholar] [CrossRef]
  40. Nebiker, S.; Bleisch, S.; Christen, M. Rich Point Clouds in Virtual Globes—A New Paradigm in City Modeling? Comput. Environ. Urban Syst. 2010, 34, 508–517. [Google Scholar] [CrossRef]
  41. Tateosian, L.; Mitasova, H.; Thakur, S.; Hardin, E.; Russ, E.; Blundell, B. Visualizations of Coastal Terrain Time Series. Inf. Vis. 2014, 13, 266–282. [Google Scholar] [CrossRef]
  42. McEntee, J.; Agyeman, J. Towards the Development of a GIS Method for Identifying Rural Food Deserts: Geographic Access in Vermont, USA. Appl. Geogr. 2010, 30, 165–176. [Google Scholar] [CrossRef]
  43. Buyantuyev, A.; Wu, J.; Gries, C. Multiscale Analysis of the Urbanization Pattern of the Phoenix Metropolitan Landscape of USA: Time, Space and Thematic Resolution. Landsc. Urban Plan. 2010, 94, 206–217. [Google Scholar] [CrossRef]
  44. Nikolaishvili, D.A.; Elizbarashvili, N.K.; Meladze, G.G. Evaluation of Degree of Landscape’s Anthropogenic Transformation (Landscapes of Georgia). Procedia-Soc. Behav. Sci. 2011, 19, 547–555. [Google Scholar] [CrossRef]
  45. Wu, R.; Wang, J.; Zhang, D.; Wang, S. Identifying Different Types of Urban Land Use Dynamics Using Point-of-Interest (POI) and Random Forest Algorithm: The Case of Huizhou, China. Cities 2021, 114, 103202. [Google Scholar] [CrossRef]
  46. Li, S.; Ma, H.; Yang, D.; Hu, W.; Li, H. The Main Drivers of Wetland Evolution in the Beijing-Tianjin-Hebei Plain. Land 2023, 12, 480. [Google Scholar] [CrossRef]
  47. Chen, Y.; Jing, Q.; Xiao, L.; Ding, Y.; Hu, M.; Che, W.; Lin, H. A Multi-Level Situational Awareness Method with Dynamic Multi-Modal Data Visualization for Air Pollution Monitoring. In Proceedings of the IGARSS 2022-2022 IEEE International Geoscience and Remote Sensing Symposium, IEEE, Kuala Lumpur, Malaysia, 17 July 2022; pp. 489–492. [Google Scholar]
  48. Elvidge, C.D.; Cinzano, P.; Pettit, D.R.; Arvesen, J.; Sutton, P.; Small, C.; Nemani, R.; Longcore, T.; Rich, C.; Safran, J. The Nightsat Mission Concept. Int. J. Remote Sens. 2007, 28, 2645–2670. [Google Scholar] [CrossRef]
  49. Zhang, B.; Zhong, C.; Gao, Q.; Shabrina, Z.; Tu, W. Delineating Urban Functional Zones Using Mobile Phone Data: A Case Study of Cross-Boundary Integration in Shenzhen-Dongguan-Huizhou Area. Comput. Environ. Urban Syst. 2022, 98, 101872. [Google Scholar] [CrossRef]
  50. Alamri, S. Independent Map Enhancement for a Spatial Road Network: Fundamental Applications and Opportunities. ISPRS Int. J. Geo-Inf. 2020, 10, 8. [Google Scholar] [CrossRef]
  51. Crooks, A.; Pfoser, D.; Jenkins, A.; Croitoru, A.; Stefanidis, A.; Smith, D.; Karagiorgou, S.; Efentakis, A.; Lamprianidis, G. Crowdsourcing Urban Form and Function. Int. J. Geogr. Inf. Sci. 2015, 29, 720–741. [Google Scholar] [CrossRef]
  52. Ciuccarelli, P.; Lupi, G.; Simeone, L. Visualizing the Data City: Social Media as a Source of Knowledge for Urban Planning and Management; SpringerBriefs in Applied Sciences and Technology; Springer International Publishing: Cham, Switzerland, 2014; ISBN 978-3-319-02194-2. [Google Scholar]
  53. Theobald, D.M. Topology Revisited: Representing Spatial Relations. Int. J. Geogr. Inf. Sci. 2001, 15, 689–705. [Google Scholar] [CrossRef]
  54. Sang, N.; Gold, C.; Miller, D. The Topological Viewshed: Embedding Topological Pointers into Digital Terrain Models to Improve GIS Capability for Visual Landscape Analysis. Int. J. Digit. Earth 2016, 9, 1185–1205. [Google Scholar] [CrossRef]
  55. Wei, Y.; Liu, H.; Song, W.; Yu, B.; Xiu, C. Normalization of Time Series DMSP-OLS Nighttime Light Images for Urban Growth Analysis with Pseudo Invariant Features. Landsc. Urban Plan. 2014, 128, 1–13. [Google Scholar] [CrossRef]
  56. Mennis, J.; Liu, J.W. Mining Association Rules in Spatio-Temporal Data: An Analysis of Urban Socioeconomic and Land Cover Change. Trans. GIS 2005, 9, 5–17. [Google Scholar] [CrossRef]
  57. Kamel, M.B.; Sayed, T. The Impact of Bike Network Indicators on Bike Kilometers Traveled and Bike Safety: A Network Theory Approach. Environ. Plan. B 2021, 48, 2055–2072. [Google Scholar] [CrossRef]
  58. Beck, B.; Pettit, C.; Winters, M.; Nelson, T.; Vu, H.L.; Nice, K.; Seneviratne, S.; Saberi, M. Association between Network Characteristics and Bicycle Ridership across a Large Metropolitan Region. Int. J. Sustain. Transp. 2024, 18, 344–355. [Google Scholar] [CrossRef]
  59. Masud, L.; Valsecchi, F.; Ciuccarelli, P.; Ricci, D.; Caviglia, G. From Data to Knowledge-Visualizations as Transformation Processes within the Data-Information-Knowledge Continuum. In Proceedings of the 2010 14th International Conference Information Visualisation, IEEE, London, UK, 26–29 July 2010; pp. 445–449. [Google Scholar]
  60. Zeng, W.; Fu, C.-W.; Muller Arisona, S.; Schubiger, S.; Burkhard, R.; Ma, K.-L. Visualizing the Relationship Between Human Mobility and Points of Interest. IEEE Trans. Intell. Transp. Syst. 2017, 18, 2271–2284. [Google Scholar] [CrossRef]
  61. Pan, J. Area Delineation and Spatial-Temporal Dynamics of Urban Heat Island in Lanzhou City, China Using Remote Sensing Imagery. J. Indian Soc. Remote Sens. 2016, 44, 111–127. [Google Scholar] [CrossRef]
  62. De Bie, C.A.J.M.; Nguyen, T.T.H.; Ali, A.; Scarrott, R.; Skidmore, A.K. LaHMa: A Landscape Heterogeneity Mapping Method Using Hyper-Temporal Datasets. Int. J. Geogr. Inf. Sci. 2012, 26, 2177–2192. [Google Scholar] [CrossRef]
  63. Liu, F.; Andrienko, G.; Andrienko, N.; Chen, S.; Janssens, D.; Wets, G.; Theodoridis, Y. Citywide Traffic Analysis Based on the Combination of Visual and Analytic Approaches. J. Geovisualization Spat. Anal. 2020, 4, 15. [Google Scholar] [CrossRef]
  64. Zhong, C.; Wang, C.; Li, H.; Chen, W.; Hou, Y. Mapping Inter-Annual Land Cover Variations Automatically Based on a Novel Sample Transfer Method. Remote Sens. 2018, 10, 1457. [Google Scholar] [CrossRef]
  65. Liu, C.; Zhang, Q.; Luo, H.; Qi, S.; Tao, S.; Xu, H.; Yao, Y. An Efficient Approach to Capture Continuous Impervious Surface Dynamics Using Spatial-Temporal Rules and Dense Landsat Time Series Stacks. Remote Sens. Environ. 2019, 229, 114–132. [Google Scholar] [CrossRef]
  66. Zhang, T.; He, W.; Huang, J.; He, Z.; Li, J. Interactive Visual Analytics of Moving Passenger Flocks Using Massive Smart Card Data. Cartogr. Geogr. Inf. Sci. 2022, 49, 354–369. [Google Scholar] [CrossRef]
  67. Hartigan, J.A.; Wong, M.A. Algorithm AS 136: A K-Means Clustering Algorithm. Appl. Stat. 1979, 28, 100. [Google Scholar] [CrossRef]
  68. Tieskens, K.F.; Schulp, C.J.E.; Levers, C.; Lieskovský, J.; Kuemmerle, T.; Plieninger, T.; Verburg, P.H. Characterizing European Cultural Landscapes: Accounting for Structure, Management Intensity and Value of Agricultural and Forest Landscapes. Land Use Policy 2017, 62, 29–39. [Google Scholar] [CrossRef]
  69. Kieu, L.-M.; Bhaskar, A.; Chung, E. A Modified Density-Based Scanning Algorithm with Noise for Spatial Travel Pattern Analysis from Smart Card AFC Data. Transp. Res. Part C Emerg. Technol. 2015, 58, 193–207. [Google Scholar] [CrossRef]
  70. Yu, C.; He, Z.-C. Analysing the Spatial-Temporal Characteristics of Bus Travel Demand Using the Heat Map. J. Transp. Geogr. 2017, 58, 247–255. [Google Scholar] [CrossRef]
  71. Zhang, T.; Li, Y.; Yang, H.; Cui, C.; Li, J.; Qiao, Q. Identifying Primary Public Transit Corridors Using Multi-Source Big Transit Data. Int. J. Geogr. Inf. Sci. 2020, 34, 1137–1161. [Google Scholar] [CrossRef]
  72. Li, S.; Han, B.; Zhang, X.; Li, T.; Zheng, Y. Interactive visualization method of multi-category urban spatiotemporal big data based on point aggregation. J. Comput. Appl. 2025, 1–9. [Google Scholar] [CrossRef]
  73. Wang, J.; Wu, F.; Guo, J.; Cheng, Y.; Chen, K. Challenges and opportunities of spatio-temporal big data. Sci. Surv. Mapp. 2017, 42, 1–7. [Google Scholar] [CrossRef]
  74. Wang, C.; Tao, J. Graphs in Scientific Visualization: A Survey. Comput. Graph. Forum 2017, 36, 263–287. [Google Scholar] [CrossRef]
  75. Inselberg, A. The Plane with Parallel Coordinates. Vis. Comput. 1985, 1, 69–91. [Google Scholar] [CrossRef]
  76. Itoh, T.; Kumar, A.; Klein, K.; Kim, J. High-Dimensional Data Visualization by Interactive Construction of Low-Dimensional Parallel Coordinate Plots. J. Vis. Lang. Comput. 2017, 43, 1–13. [Google Scholar] [CrossRef]
  77. Yuan, Y.; Tan, F.; Fan, B.; Cheng, Y. Research on the Construction of Full-elements Digital Model of Rural Landscape: A Case Study of Changkou Village in Jiangle County, Fujian Province. Chin. Landsc. Archit. 2023, 39, 50–56. [Google Scholar] [CrossRef]
  78. Fang, Z.; Li, Q.; Zhang, X.; Shaw, S.-L. A GIS Data Model for Landmark-Based Pedestrian Navigation. Int. J. Geogr. Inf. Sci. 2012, 26, 817–838. [Google Scholar] [CrossRef]
  79. Zhou, X.; Zhang, L. Crowdsourcing Functions of the Living City from Twitter and Foursquare Data. Cartogr. Geogr. Inf. Sci. 2016, 43, 393–404. [Google Scholar] [CrossRef]
  80. Srivastava, S.; Vargas-Muñoz, J.E.; Tuia, D. Understanding Urban Landuse from the above and Ground Perspectives: A Deep Learning, Multimodal Solution. Remote Sens. Environ. 2019, 228, 129–143. [Google Scholar] [CrossRef]
  81. Crivellari, A.; Resch, B. Investigating Functional Consistency of Mobility-Related Urban Zones via Motion-Driven Embedding Vectors and Local POI-Type Distributions. Comput. Urban Sci. 2022, 2, 19. [Google Scholar] [CrossRef]
  82. Song, J.; Fan, H.; Gao, M.; Xu, Y.; Ran, M.; Liu, X.; Guo, Y. Toward High-Performance Map-Recovery of Air Pollution Using Machine Learning. ACS EST Eng. 2023, 3, 73–85. [Google Scholar] [CrossRef]
  83. Zhang, Z.; Vosselman, G.; Gerke, M.; Persello, C.; Tuia, D.; Yang, M.Y. Detecting Building Changes between Airborne Laser Scanning and Photogrammetric Data. Remote Sens. 2019, 11, 2417. [Google Scholar] [CrossRef]
  84. Wong, P.-Y.; Su, H.-J.; Lee, H.-Y.; Chen, Y.-C.; Hsiao, Y.-P.; Huang, J.-W.; Teo, T.-A.; Wu, C.-D.; Spengler, J.D. Using Land-Use Machine Learning Models to Estimate Daily NO2 Concentration Variations in Taiwan. J. Clean. Prod. 2021, 317, 128411. [Google Scholar] [CrossRef]
  85. Wu, H.; Li, Y.; Lin, A.; Fan, H.; Fan, K.; Xie, J.; Luo, W. A Review of Crowdsourced Geographic Information for Land-Use and Land-Cover Mapping: Current Progress and Challenges. Int. J. Geogr. Inf. Sci. 2024, 38, 2183–2215. [Google Scholar] [CrossRef]
  86. Zielstra, D.; Hochmair, H.H. Positional Accuracy Analysis of Flickr and Panoramio Images for Selected World Regions. J. Spat. Sci. 2013, 58, 251–273. [Google Scholar] [CrossRef]
  87. Barrington-Leigh, C.; Millard-Ball, A. The World’s User-Generated Road Map Is More than 80% Complete. PLoS ONE 2017, 12, e0180698. [Google Scholar] [CrossRef]
  88. Gillespie, L.E.; Ruffley, M.; Exposito-Alonso, M. Deep Learning Models Map Rapid Plant Species Changes from Citizen Science and Remote Sensing Data. Proc. Natl. Acad. Sci. USA 2024, 121, e2318296121. [Google Scholar] [CrossRef]
  89. Wilkie, S.; Thompson, E.; Cranner, P.; Ginty, K. Attention Restoration Theory as a Framework for Analysis of Tweets about Urban Green Space: A Case Study. Landsc. Res. 2020, 45, 777–788. [Google Scholar] [CrossRef]
  90. Antoniou, V.; Skopeliti, A. Measures and Indicators of VGI quality: An Overview. ISPRS Ann. Photogramm. Remote Sens. Spat. Inf. Sci. 2015, II-3-W5, 345–351. [Google Scholar] [CrossRef]
  91. Senaratne, H.; Mobasheri, A.; Ali, A.L.; Capineri, C.; Haklay, M. A Review of Volunteered Geographic Information Quality Assessment Methods. Int. J. Geogr. Inf. Sci. 2017, 31, 139–167. [Google Scholar] [CrossRef]
  92. ISO 19113: 2002; Geographic Information—Quality Principles; ISO/TC211. International Organization for Standardization: Geneva, Switzerland, 2002.
  93. Chen, D.; Tu, W.; Cao, R.; Zhang, Y.; He, B.; Wang, C.; Shi, T.; Li, Q. A Hierarchical Approach for Fine-Grained Urban Villages Recognition Fusing Remote and Social Sensing Data. Int. J. Appl. Earth Obs. Geoinf. 2022, 106, 102661. [Google Scholar] [CrossRef]
  94. Comber, A.; Mooney, P.; Purves, R.S.; Rocchini, D.; Walz, A. Crowdsourcing: It Matters Who the Crowd Are. The Impacts of between Group Variations in Recording Land Cover. PLoS ONE 2016, 11, e0158329. [Google Scholar] [CrossRef] [PubMed]
  95. Maimon, O.; Rokach, L. (Eds.) Data Mining and Knowledge Discovery Handbook; Springer: New York, NY, USA, 2005; ISBN 978-0-387-24435-8. [Google Scholar]
  96. Tao, S.; Rohde, D.; Corcoran, J. Examining the Spatial–Temporal Dynamics of Bus Passenger Travel Behaviour Using Smart Card Data and the Flow-Comap. J. Transp. Geogr. 2014, 41, 21–36. [Google Scholar] [CrossRef]
  97. Yu, W.; Ai, T.; He, Y.; Shao, S. Spatial Co-Location Pattern Mining of Facility Points-of-Interest Improved by Network Neighborhood and Distance Decay Effects. Int. J. Geogr. Inf. Sci. 2017, 31, 280–296. [Google Scholar] [CrossRef]
  98. Tang, J.; Liu, Q.; Deng, M.; Huang, J.; Cai, J. A Permutation Test for Identifying Significant Clusters in Spatial Dataset. Acta Geod. Cartogr. Sin. 2016, 45, 233–240. [Google Scholar]
  99. Li, Z.; Lu, X.; Shi, J.; Huang, R.; Gao, Y. Quantitative Research of Landscape Texture for Polders in Xuanwu Plain Based on Morphological Index: A Case Study of Yongfeng Polder. Chin. Landsc. Archit. 2023, 39, 41–46. [Google Scholar] [CrossRef]
  100. Chen, Y.; Liu, X.; Li, X.; Liu, X.; Yao, Y.; Hu, G.; Xu, X.; Pei, F. Delineating Urban Functional Areas with Building-Level Social Media Data: A Dynamic Time Warping (DTW) Distance Based k -Medoids Method. Landsc. Urban Plan. 2017, 160, 48–60. [Google Scholar] [CrossRef]
  101. Qin, X.; Zhen, F. Combination Between Big Data and Small Data: New Methods of Urban Studies in The Information Era. Sci. Geogr. Sin. 2017, 37, 321–330. [Google Scholar] [CrossRef]
  102. Cui, C.; Wu, X.; Liu, L.; Zhang, W. The Spatial-Temporal Dynamics of Daily Intercity Mobility in the Yangtze River Delta: An Analysis Using Big Data. Habitat Int. 2020, 106, 102174. [Google Scholar] [CrossRef]
  103. Afzal, S.; Hittawe, M.M.; Ghani, S.; Jamil, T.; Knio, O.; Hadwiger, M.; Hoteit, I. The State of the Art in Visual Analysis Approaches for Ocean and Atmospheric Datasets. Comput. Graph. Forum 2019, 38, 881–907. [Google Scholar] [CrossRef]
  104. Fotheringham, A.S.; Brunsdon, C.; Charlton, M. Quantitative Geography: Perspectives on Spatial Data Analysis; SAGE Publications Ltd.: London, UK, 2000; ISBN 0-7619-5948-3. [Google Scholar]
  105. Haining, R.P. Spatial Data Analysis: Theory and Practice; Cambridge University Press: Cambridge, UK, 2003; ISBN 0-521-77437-3. [Google Scholar]
  106. Wang, J.; Xu, C. Geodetector: Principle and prospective. Acta Geogr. Sin. 2017, 72, 116–134. [Google Scholar] [CrossRef]
  107. Obeso Muñiz, Í. The Spatial Diffusion of Economic Activity in the Oviedo Region (1970–2018). Investig. Geográficas 2019, 72, 189–207. [Google Scholar] [CrossRef]
  108. Liu, Z.; Wang, F.; Xue, P.; Xue, F. Using Multi-Layer Nested Network to Optimise Spatial Structure of Tourism Development between Urban and Rural Areas Based on Population Mobility. Indoor Built Environ. 2022, 31, 1028–1046. [Google Scholar] [CrossRef]
  109. Anselin, L. Spatial Econometrics: Methods and Models; Studies in Operational Regional Science; Springer: Dordrecht, The Netherlands, 1988; Volume 4, ISBN 978-90-481-8311-1. [Google Scholar]
  110. Jin, Z.; Wei, L. From Flood Land to New Urban Area: Water Adaptation History and Visions for Daodi Flood Land in the West of Beijing. Landsc. Archit. Front. 2021, 9, 50. [Google Scholar] [CrossRef]
  111. Novotný, M.; Skaloš, J.; Plieninger, T. Spatial-Temporal Changes in Trees Outside Forests: Case Study from the Czech Republic 1953–2014. Appl. Geogr. 2017, 87, 139–148. [Google Scholar] [CrossRef]
  112. Xie, M.; Dong, Z.; Cheng, Y. A Comprehensive Study of Research Frameworks, Key Technologies and Practice Cases for Sponge City Planning Based on Digital Landscape Architecture: From Hydrological Analysis to Intelligent Monitoring and Control. Chin. Landsc. Archit. 2023, 39, 48–54. [Google Scholar] [CrossRef]
  113. Zeng, Z.; Yuan, X.; Liang, J.; Li, Y. Designing and Implementing an SWMM-Based Web Service Framework to Provide Decision Support for Real-Time Urban Stormwater Management. Environ. Model. Softw. 2021, 135, 104887. [Google Scholar] [CrossRef]
  114. Anjomshoaa, A.; Duarte, F.; Rennings, D.; Matarazzo, T.J.; deSouza, P.; Ratti, C. City Scanner: Building and Scheduling a Mobile Sensing Platform for Smart City Services. IEEE Internet Things J. 2018, 5, 4567–4579. [Google Scholar] [CrossRef]
  115. Cheng, Y.; Xie, M. Being both Opposite and Complementary: Urban Road Sponge System Practice Based on Digital Technology—Taking Nanjing Tianbao Street Ecological Road as the Example. Chin. Landsc. Archit. 2017, 33, 5–13. [Google Scholar]
  116. Chen, Y.; Han, D. Water Quality Monitoring in Smart City: A Pilot Project. Autom. Constr. 2018, 89, 307–316. [Google Scholar] [CrossRef]
  117. Cao, G.; Wang, S.; Hwang, M.; Padmanabhan, A.; Zhang, Z.; Soltani, K. A Scalable Framework for Spatiotemporal Analysis of Location-Based Social Media Data. Comput. Environ. Urban Syst. 2015, 51, 70–82. [Google Scholar] [CrossRef]
  118. Shen, Y. Synergised City: Frequency Synergy in Spatiotemporal Data-Augmented-Design. Shanghai Urban Plan. Rev. 2022, 3, 8–13. [Google Scholar] [CrossRef]
  119. Mahomed, A.S.; Saha, A.K. Unleashing the Potential of 5G for Smart Cities: A Focus on Real-Time Digital Twin Integration. Smart Cities 2025, 8, 70. [Google Scholar] [CrossRef]
  120. Shi, W.; Zhang, A. Introduction to Urban Computing. In Urban Informatics; Shi, W., Goodchild, M.F., Batty, M., Kwan, M.-P., Zhang, A., Eds.; Springer: Singapore, 2021; ISBN 978-981-15-8983-6. [Google Scholar]
  121. Batty, M. Visualizing Aggregate Movement in Cities. Philos. Trans. R. Soc. B Biol. Sci. 2018, 373, 20170236. [Google Scholar] [CrossRef] [PubMed]
  122. Cureau, R.J.; Balocco, C.; Pigliautile, I.; Piselli, C.; Fabiani, C.; Cotana, F.; Carletti, C.; Sciurpi, F.; Pisello, A.L. On Urban Microclimate Spatial-Temporal Dynamics: Evidence from the Integration of Fixed and Wearable Sensing and Mapping Techniques. Environ. Res. 2024, 262, 119795. [Google Scholar] [CrossRef] [PubMed]
  123. Hladík, J.; Snopková, D.; Lichter, M.; Herman, L.; Konečný, M. Spatial-Temporal Analysis of Retail and Services Using Facebook Places Data: A Case Study in Brno, Czech Republic. Ann. GIS 2022, 28, 127–145. [Google Scholar] [CrossRef]
  124. Fotheringham, A.; Rogerson, P.; Fotheringham, A.S. Geographically Weighted Regression. In The SAGE Handbook of Spatial Analysis; SAGE Publications Ltd: London, UK, 2009; pp. 243–254. [Google Scholar]
  125. Iranmanesh, M.; Seyedabrishami, S.; Moridpour, S. Identifying High Crash Risk Segments in Rural Roads Using Ensemble Decision Tree-Based Models. Sci. Rep. 2022, 12, 20024. [Google Scholar] [CrossRef]
  126. Xu, L.; Chen, N.; Chen, Z.; Zhang, C.; Yu, H. Spatiotemporal Forecasting in Earth System Science: Methods, Uncertainties, Predictability and Future Directions. Earth-Sci. Rev. 2021, 222, 103828. [Google Scholar] [CrossRef]
  127. Liu, Z.; Han, L.; Liu, M. High-Resolution Carbon Emission Mapping and Spatial-Temporal Analysis Based on Multi-Source Geographic Data: A Case Study in Xi’an City, China. Environ. Pollut. 2024, 361, 124879. [Google Scholar] [CrossRef] [PubMed]
  128. Wang, S.; Wang, L. A Novel Framework for Mapping Updated Fine-Resolution Populations with Remote Sensing and Mobile Phone Data. J. Remote Sens. 2024, 4, 0227. [Google Scholar] [CrossRef]
  129. Anderson, L.D. Applying Geographic Information Systems to Transportation Planning. Transp. Res. Rec. 1991, 1305, 113–117. [Google Scholar]
  130. Lovelace, R.; Birkin, M.; Cross, P.; Clarke, M. From Big Noise to Big Data: Toward the Verification of Large Data Sets for Understanding Regional Retail Flows. Geogr. Anal. 2016, 48, 59–81. [Google Scholar] [CrossRef]
  131. Loidl, M.; Wallentin, G.; Cyganski, R.; Graser, A.; Scholz, J.; Haslauer, E. GIS and Transport Modeling—Strengthening the Spatial Perspective. ISPRS Int. J. Geo-Inf. 2016, 5, 84. [Google Scholar] [CrossRef]
  132. Cheng, Y.; Fan, B. Digital Landscape Process. Chin. Landsc. Archit. 2023, 39, 6–12. [Google Scholar] [CrossRef]
  133. Liu, W.; Lv, Y.; Wang, Q.; Sun, B.; Han, D. A Systematic Review of the Digital Twin Technology in Buildings, Landscape and Urban Environment from 2018 to 2024. Buildings 2024, 14, 3475. [Google Scholar] [CrossRef]
  134. Tan, F.; Cheng, Y. A Digital Twin Framework for Innovating Rural Ecological Landscape Control. Environ. Sci. Eur. 2024, 36, 59. [Google Scholar] [CrossRef]
  135. Cureton, P.; Dunn, N. Digital Twins of Cities and Evasive Futures. In Shaping Smart for Better Cities; Elsevier: Amsterdam, The Netherlands, 2021; pp. 267–282. [Google Scholar]
  136. Huang, A.; Liu, Y.; Chen, T.; Zhou, Y.; Sun, Q.; Chai, H.; Yang, Q. Starfl: Hybrid Federated Learning Architecture for Smart Urban Computing. ACM Trans. Intell. Syst. Technol. TIST 2021, 12, 1–23. [Google Scholar] [CrossRef]
  137. Jia, M.; Komeily, A.; Wang, Y.; Srinivasan, R.S. Adopting Internet of Things for the Development of Smart Buildings: A Review of Enabling Technologies and Applications. Autom. Constr. 2019, 101, 111–126. [Google Scholar] [CrossRef]
  138. Shahzad, M.; Shafiq, M.T.; Douglas, D.; Kassem, M. Digital Twins in Built Environments: An Investigation of the Characteristics, Applications, and Challenges. Buildings 2022, 12, 120. [Google Scholar] [CrossRef]
  139. He, B.; Guo, R.; Zhang, C.; Ma, D.; Wang, W.; Hong, W.; Chen, Y. A natural scene construction method for digital twin cities. Bull. Surv. Mapp. 2022, 7, 87–92. [Google Scholar] [CrossRef]
  140. Tam, P.; Math, S.; Nam, C.; Kim, S. Adaptive Resource Optimized Edge Federated Learning in Real-Time Image Sensing Classifications. IEEE J. Sel. Top. Appl. Earth Obs. Remote Sens. 2021, 14, 10929–10940. [Google Scholar] [CrossRef]
  141. Fuller, A.; Fan, Z.; Day, C.; Barlow, C. Digital Twin: Enabling Technologies, Challenges and Open Research. IEEE Access 2020, 8, 108952–108971. [Google Scholar] [CrossRef]
  142. Zhu, A.-X.; Zhao, F.-H.; Liang, P.; Qin, C.-Z. Next Generation of GIS: Must Be Easy. Ann. GIS 2021, 27, 71–86. [Google Scholar] [CrossRef]
  143. Vandewalle, R.C.; Barley, W.C.; Padmanabhan, A.; Katz, D.S.; Wang, S. Understanding the Multifaceted Geospatial Software Ecosystem: A Survey Approach. Int. J. Geogr. Inf. Sci. 2021, 35, 2168–2186. [Google Scholar] [CrossRef]
  144. McIntire, J.P.; Havig, P.R.; Geiselman, E.E. Stereoscopic 3D Displays and Human Performance: A Comprehensive Review. Displays 2014, 35, 18–26. [Google Scholar] [CrossRef]
  145. Simpson, M.; Padilla, L.; Keller, K.; Klippel, A. Immersive Storm Surge Flooding: Scale and Risk Perception in Virtual Reality. J. Environ. Psychol. 2022, 80, 101764. [Google Scholar] [CrossRef]
  146. Tomkins, A.; Lange, E. Interactive Landscape Design and Flood Visualisation in Augmented Reality. Multimodal Technol. Interact. 2019, 3, 43. [Google Scholar] [CrossRef]
  147. Barba, E.; Marroquin, R.Z. A Primer on Spatial Scale and Its Application to Mixed Reality. In Proceedings of the 2017 IEEE International Symposium on Mixed and Augmented Reality (ISMAR), IEEE, Nantes, France, 9–13 October 2017; pp. 100–110. [Google Scholar]
  148. Afrooz, A.; Ding, L.; Pettit, C. An Immersive 3D Virtual Environment to Support Collaborative Learning and Teaching. In Computational Urban Planning and Management for Smart Cities; Geertman, S., Zhan, Q., Allan, A., Pettit, C., Eds.; Springer International Publishing: Cham, Switzerland, 2019; pp. 267–282. ISBN 978-3-030-19424-6. [Google Scholar]
  149. Luo, J.; Zhao, T.; Cao, L.; Biljecki, F. Water View Imagery: Perception and Evaluation of Urban Waterscapes Worldwide. Ecol. Indic. 2022, 145, 109615. [Google Scholar] [CrossRef]
  150. Lock, O.; Bednarz, T.; Pettit, C. HoloCity—Exploring the Use of Augmented Reality Cityscapes for Collaborative Understanding of High-Volume Urban Sensor Data. In Proceedings of the 17th ACM SIGGRAPH International Conference on Virtual-Reality Continuum and Its Applications in Industry, Brisbane, Australia, 14–16 November 2019; Association for Computing Machinery: New York, NY, USA, 2019; pp. 1–2. [Google Scholar]
  151. Russo, P.; Lanzilotti, R.; Costabile, M.F.; Pettit, C.J. Towards Satisfying Practitioners in Using Planning Support Systems. Comput. Environ. Urban Syst. 2018, 67, 9–20. [Google Scholar] [CrossRef]
  152. Liang, J.; Li, W.; Li, W.; Long, Y. Application Scenario and Practice Path of Urban Landscape Driven by Digital Technology. Landsc. Archit. 2023, 30, 29–35. [Google Scholar]
  153. Barricelli, B.R.; Casiraghi, E.; Fogli, D. A Survey on Digital Twin: Definitions, Characteristics, Applications, and Design Implications. IEEE Access 2019, 7, 167653–167671. [Google Scholar] [CrossRef]
  154. Ramu, S.P.; Boopalan, P.; Pham, Q.-V.; Maddikunta, P.K.R.; Huynh-The, T.; Alazab, M.; Nguyen, T.T.; Gadekallu, T.R. Federated Learning Enabled Digital Twins for Smart Cities: Concepts, Recent Advances, and Future Directions. Sustain. Cities Soc. 2022, 79, 103663. [Google Scholar] [CrossRef]
  155. Zhan, H.; Hwang, B.-G.; Zhu, H.; Ang, S.H.P. Towards a Sustainable Built Environment Industry in Singapore: Drivers, Barriers, and Strategies in the Adoption of Smart Facilities Management. J. Clean. Prod. 2023, 425, 138726. [Google Scholar] [CrossRef]
  156. Fekete, T.; Mengistu, G.; Wicaksono, H. Leveraging Causal AI to Uncover the Dynamics in Sustainable Urban Transport: A Bike Sharing Time-Series Study. Sustain. Cities Soc. 2025, 122, 106240. [Google Scholar] [CrossRef]
  157. Çöltekin, A.; Lokka, I.; Zahner, M.; Halounova, L. On the Usability and Usefulness of 3D (Geo) Visualizations—A Focus on Virtual Reality Environments. In Proceedings of the International Archives of the Photogrammetry, Remote Sensing and Spatial Information Sciences, Volume XLI-B2, 2016 XXIII ISPRS Congress, Prague, Czech Republic, 12–19 July 2016. [Google Scholar]
  158. Çöltekin, A.; Lochhead, I.; Madden, M.; Christophe, S.; Devaux, A.; Pettit, C.; Lock, O.; Shukla, S.; Herman, L.; Stachoň, Z.; et al. Extended Reality in Spatial Sciences: A Review of Research Challenges and Future Directions. ISPRS Int. J. Geo-Inf. 2020, 9, 439. [Google Scholar] [CrossRef]
  159. Barns, S. Smart Cities and Urban Data Platforms: Designing Interfaces for Smart Governance. City Cult. Soc. 2018, 12, 5–12. [Google Scholar] [CrossRef]
  160. Bertin, J. Semiology of Graphics; University of Wisconsin Press: Madison, WI, USA, 1983; ISBN 0-299-09060-4. [Google Scholar]
  161. Munzner, T. Visualization Analysis and Design; CRC Press: Boca Raton, FL, USA, 2014; ISBN 1-4987-5971-8. [Google Scholar]
  162. Donderi, D.C. Visual Complexity: A Review. Psychol. Bull. 2006, 132, 73. [Google Scholar] [CrossRef]
  163. Rautenbach, V.; Coetzee, S.; Schiewe, J.; Çöltekin, A. An Assessment of Visual Variables for the Cartographic Design of 3D Informal Settlement Models. In Proceedings of the 27th International Cartographic Conference 16th General Assembly, Rio de Janeiro, Brazil, 23–28 August 2015. [Google Scholar]
  164. Sherman, W.R.; Craig, A.B. Understanding Virtual Reality: Interface, Application, and Design; Morgan Kaufmann: Burlington, MA, USA, 2018; ISBN 0-12-801038-X. [Google Scholar]
  165. Qi, Q.; Tao, F.; Hu, T.; Anwer, N.; Liu, A.; Wei, Y.; Wang, L.; Nee, A.Y. Enabling Technologies and Tools for Digital Twin. J. Manuf. Syst. 2021, 58, 3–21. [Google Scholar] [CrossRef]
Figure 1. Research framework.
Land 14 01069 g001
Figure 2. Number of publications on multimodal spatio-temporal data visualization research in landscape architecture from 2009 to 2024.
Land 14 01069 g002
Figure 3. Geographic areas covered by 117 publications.
Land 14 01069 g003
Figure 4. Number of modalities applied to retrieved articles.
Land 14 01069 g004
Figure 5. Proportion of data types applied in the literature retrieved.
Land 14 01069 g005
Figure 6. Research workflow for multimodal spatio-temporal data visualization in landscape architecture.
Land 14 01069 g006
Figure 7. Overall feature relationship diagram of the literature retrieved.
Land 14 01069 g007
Figure 8. Proportion of visualization scenarios applied in the literature retrieved.
Land 14 01069 g008
Figure 9. Evolution of visual representation methods.
Land 14 01069 g009
Figure 10. Visualization analysis pathways driven by landscape architecture research tasks.
Land 14 01069 g010
Figure 11. Architecture of interactive platform for spatio-temporal data visualization in landscape architecture.
Land 14 01069 g011
Table 1. The assessment criteria used to review the selected articles on multimodal spatio-temporal data visualization in landscape research.
Review ItemsAssessment Criteria
KeywordsMultimodal spatio-temporal data
Visualization OR Visual analysis OR Mapping
Landscape OR Urban
Journal and articleJournal’s disciplineArchitecture or Urban Studies or Regional Urban Planning or Environmental Studies or Green Sustainable Science Technology or Geography or Multidisciplinary Sciences
Time span1 January 2005 to 31 December 2024
Document typeJournal article, review, conference paper
Publication languageEnglish
ScreeningExclusion criteriaArticles not written in English
Articles not peer-reviewed
Articles with abstracts only
Articles focused solely on urban planning, architectural engineering, or technical advancements unrelated to landscape architecture
Inclusion criteriaUse of targeted keywords
Studies carried out between 2005 and 2024
Presenting a spatial or temporal visualization of spatio-temporal data
Studies focus within landscape research
Indicated the methods used for visualization implementation
Table 2. Classification of multimodal spatio-temporal data in landscape architecture.
ClassificationData CharacteristicsSubcategoriesSub-SubcategoriesReferences
Basic dataLarge-scale, small changes, slow updates2D spatial dataOrthographic imagery data, crowdsourced geographic data, etc.[38,39]
3D spatial dataDigital terrain data, realistic 3D models, artificial modelling data, etc.[40,41]
Attribute dataLandscape resources, site facilities, socioeconomic data, etc.[42,43]
Abstracted symbolControl boundaries, points/areas of interest, text labels, etc.[44,45]
Sensing dataStrong spatio-temporal sequence, large data scale, fast update speedEnvironmental monitoring/simulation dataMeteorological data, soil data, hydrological data, vegetation data, light data, etc.[46,47,48]
Human behavioral monitoring/simulation dataMobile signaling, trajectory data, activity behavior, etc.[49,50]
Human subjective perception dataSocial media reviews, multimedia acquisition data, etc.[51,52]
Association dataHigh dimensionality, dynamicity, and complexitySpatial relationSpatial coordinates, spatial proximity, spatial topology, etc.[53,54]
Temporal relationTime points, time intervals, time series, etc.[41,55]
Spatio-temporal associationSpatio-temporal locations, spatio-temporal events, spatio-temporal models, etc.[56]
Network associationNetwork topology, network attributes, network dynamics, etc.[57,58]
Disclaimer/Publisher’s Note: The statements, opinions and data contained in all publications are solely those of the individual author(s) and contributor(s) and not of MDPI and/or the editor(s). MDPI and/or the editor(s) disclaim responsibility for any injury to people or property resulting from any ideas, methods, instructions or products referred to in the content.

