Article

Benefits and Trade-Offs from Land Use and Land Cover Changes Under Different Scenarios in the Coastal Delta of Vietnam

by
Nguyen Thi Hong Diep
1,
Nguyen Trong Nguyen
1,
Phan Kieu Diem
1 and
Can Trong Nguyen
2,*
1
College of Environment and Natural Resources, Can Tho University, Can Tho City 94115, Vietnam
2
Environment Centre, Charles University, 16000 Prague, Czech Republic
*
Author to whom correspondence should be addressed.
Land 2025, 14(5), 1063; https://doi.org/10.3390/land14051063
Submission received: 15 April 2025 / Revised: 9 May 2025 / Accepted: 10 May 2025 / Published: 13 May 2025

Abstract

:
Land use and land cover (LULC) in coastal areas is critical in shaping the ecological systems, regional economy, and livelihood of indigenous communities. This study analyzes LULC changes (LULCC) in Soc Trang Province, Vietnam Mekong Delta, from 2010 to 2020 and simulates future LULC for 2030 under four scenarios: natural growth (business as usual, BAU), climate change challenges, profit optimization, and adaptation strategies. Satellite-based LULC maps and geospatial datasets were integrated into a LULC simulation model based on a Markov Chain and Cellular Automata to predict LULC in 2030 under disparate scenarios. Simultaneously, this study also estimates economic values and ecosystem service values as proxies to evaluate benefits and trade-offs between the scenarios. The research findings reveal that the critical LULCC observed during 2010–2020 are transitions from triple rice crops to double rice crops, rice–shrimp to brackish aquaculture, and expansion of perennial plantations. These transitional trends will persist at a modest rate under the BAU scenario in 2030. The climate change challenge scenario will intervene up to 24.2% of the total area, with double rice crops reaching the most extensive area compared to other scenarios, about 106,047 ha. The profit optimization scenario will affect 16.03% of the total area, focusing on aquaculture expansion to the maximum shared proportion of 34% (approximately 57,000 ha). Adaptive solutions will emphasize reducing triple rice crops while expanding double rice crops and reviving rice–shrimp to different extents depending on development pathways. Economic evaluations show a growth trend across scenarios, with maximum returns under profit optimization. Yet, ecosystem service values notably highlight ecological trade-offs, raising concerns about balancing economic benefits and ecological trade-offs in land use planning. The research findings recommend a comprehensive and multitarget approach to land use planning that integrates ecosystem services into initial assessments to balance benefits and trade-offs in coastal areas commonly affected by LULCC. By adopting well-informed and strategic land use plans that minimize ecological and social impacts, local sustainability and resilience to climate change can be significantly enhanced.

1. Introduction

Coastal areas are indispensable for environmental balance and human livelihoods, offering a slew of various natural and economic benefits [1]. They appear as hubs for agriculture and brackish aquaculture, contributing to the economy and food security, which are widely known as provisioning services [2,3,4]. Beyond the economic significance and provisioning services, they can deliver a wide range of ecosystem services (ESS) to support and maintain functions and benefits to the entire region spanning from supporting and regulating benefits to cultural values—such as coastal protection from storms, carbon sequestration, water purification, nursery habitats, and recreational values [5,6,7,8]. Coastal mangroves also act as natural barriers to reduce damage from natural disasters (e.g., storms and typhoons), which are increasingly severe due to climate change.
Yet, these coastal regions are particularly vulnerable to a range of natural and human-induced challenges—such as sea level rise, saltwater intrusion, coastal erosion, extreme weather events, and unsustainable land management practices—which significantly impact land use and land cover (LULC), agriculture production, and local livelihoods [9]. Climate change poses a critical threat and further disrupts the normal cultivation cycles and threatens traditional farming practices [10,11,12,13]. Moreover, human activities exacerbate these vulnerabilities [14]. Massive LULC changes (LULCC) to pursue immediate benefits as well as the overexploitation of resources and overreliance on chemical inputs can lead to soil degradation and pollution, further diminishing the resilience of fragile landscapes [15]. Local communities are largely dependent on these agricultural activities, which form a cornerstone of their livelihoods. Moreover, coastal indigenous communities are frequently composed of ethnic minorities and smallholder farmers, often facing various challenges such as low income, limited education, and limited access to financial and technological resources [16,17,18,19]. Meanwhile, the LULCC in coastal areas are driven by a complex interplay of natural, climatic, and socioeconomic drivers [20]. Addressing LULCC in these regions requires integrated management strategies and long-term insights to balance development needs while enhancing the resilience of communities and ecosystems [21].
Soc Trang is a typical coastal province in the Vietnam Mekong Delta (VMD). Its location intensifies the severity of saline intrusion during the dry season [22]. This province has also undergone complex LULCC over the past years driven by the combined impacts of environmental and economic factors, saline intrusion, drought, markets, and investments [20]. The prominent LULCC processes identified include the continued and persistent expansion of brackish aquaculture, the reduction of triple rice crops encroached on by double rice and rice–shrimp systems, and increased annual crops [23,24,25,26,27]. Although rice–shrimp farming is widely promoted as a sustainable and environmentally friendly practice to adapt to saline intrusion, it has witnessed a decline in popularity in cultivated areas [28,29]. Meanwhile, double rice crops and triple rice crops have interconversions [24]. The current LULCC in Soc Trang Province are relatively complicated due to interconversions and spontaneous shifts mostly from farmers themselves to chase immediate profit values instead of appropriate systematic planning that takes into account the diverse challenges of climate change, saline intrusion, and ensuring sustainability [20,28].
Previous studies on the coastal areas of the VMD focused on specific aspects of past LULCC, a particular land use, and the driving forces of LULCC under current conditions, while there is limited research emphasizing future development perspectives [20,30,31]. Another effort has been made to allocate future land use under the hypothetical condition of the extreme drought in 2015/2016 [29]. Yet, the conditions considered are relatively limited, giving planners closed suggestions about possible options, while diverse development scenarios may better provide multiple angles for future transitions to achieve diverse targets in land use decisions [32,33,34,35]. The existing studies have not considered the benefits and trade-offs in the same assessments of LULCC in land use plans. Therefore, they may lead to less comprehensive decision-making to appropriately balance economic development and environmental sustainability. Meanwhile, economic and ecosystem service (ESS) valuations can effectively highlight ecological trade-offs resulting from future land use and land cover changes (LULCC) by capturing a broader range of services beyond just provisioning goods, thus informing the system’s sustainability [36,37].
This study therefore aimed to predict future LULC in a coastal area of Soc Trang Province (i.e., an area in the Vietnam Mekong Delta with diverse and typical coastal LULC categories) in 2030 by simulating LULCC under five scenarios, which reflect disparate concerns regarding natural growth, climate change, economic returns, and adaptation strategies. More specifically, the past LULCC maps from 2010 to 2020 were analyzed to understand LULCC trajectories. This period was chosen because in recent years, market forces and climate change impacts (e.g., the significant saline intrusion event in the drought 2015/2016) have notably influenced local perspective and transformed farming practices in this coastal area. The historical LULCC were then incorporated with a set of natural and socioeconomic factors to simulate future LULC patterns in 2030 under five separate development scenarios. Finally, we also estimated economic values of agricultural models and ecosystem service values for the entire landscape as quantitative proxies to compare benefits and trade-offs among the scenarios. The research findings illustrate future spatial LULC and the areas affected, along with potential benefits and trade-offs across different development scenarios. These insights are highly relevant for land use planners, policymakers, and stakeholders to develop suitable strategies that promote both economic growth and ecological sustainability.

2. Materials and Methods
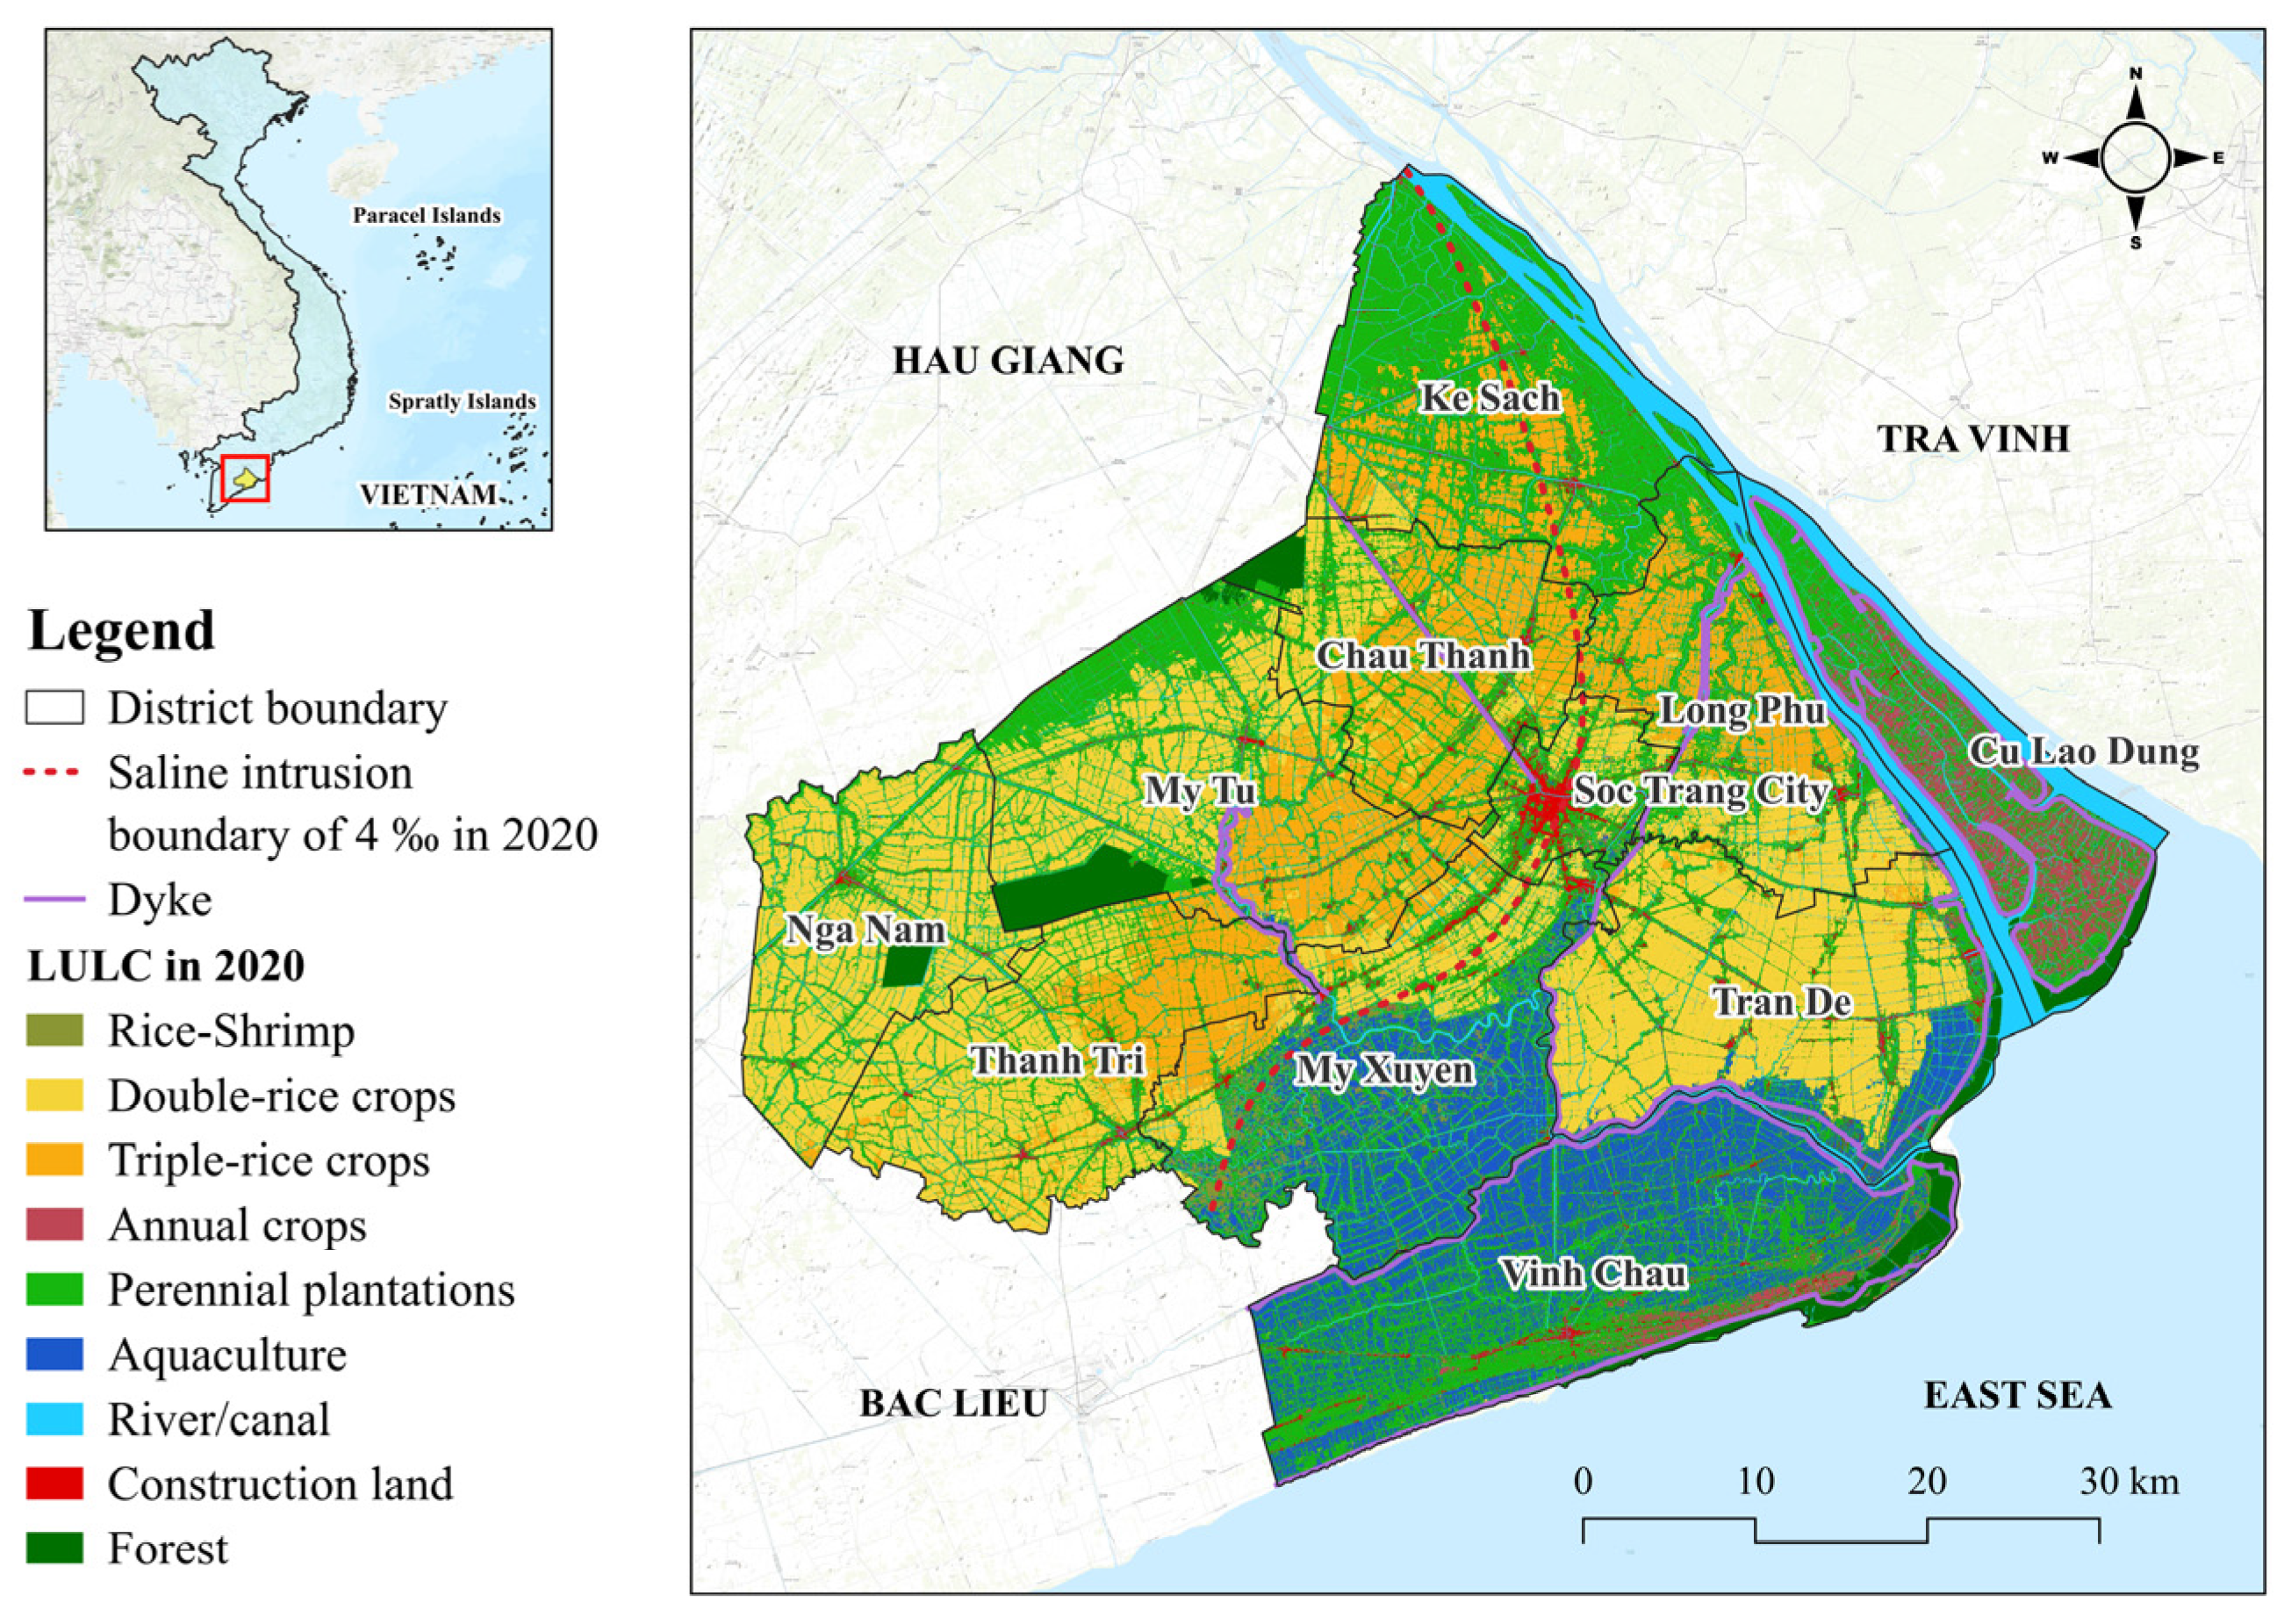
2.1. Study Area

This investigation focuses on Soc Trang Province, spanning 9°12′–9°56′ N and 105°33′–106°23′ E on an area of approximately 3310 km2 (Figure 1). Soc Trang boasts the longest coastline (72 km) among the four eastern provinces of the VMD. It is nourished by the Hau River (a tributary of the Mekong River in Vietnam), which has abundant freshwater resources for waterway transport, aquaculture, and agricultural cultivation.
This is relatively young land formed by alluvial soil encroachment, including flat fluvial deltas interspersed with low-lying areas and sandy soil dunes [38]. The terrain is relatively low compared to the sea level (i.e., about 0.5–1.0 m asl) and gradually decreases from northwest to southeast. The provincial economic structure is mainly based on agriculture, forestry, and aquaculture productions [39]. Rice is the main crop in the agricultural system, along with other fruits, annual crops, and vegetables such as pomelos, longan, rambutans, sugarcane, soybean, onions, and garlic [29]. Brackish aquaculture largely contributes to the economy, with an estimated production of 289,575 tons [40].

2.2. Data Used

2.2.1. Satellite Images and Preprocessing Procedures

The study area lies within a tropical monsoon climate characterized by high year-round cloud cover, making it challenging to obtain high-quality optical images for detailed crop structure monitoring, which requires time series data rather than a single image [40,41]. We acquired Landsat-5 (TM) surface reflectance and MODIS vegetation indices (MOD13Q1 v061) products for LULC interpretation in 2010 because they are the most appropriate data to analyze crop structure at the beginning of the 21st century [42,43,44]. Single Landsat-5 images from 2010 were collected, and we masked out cloud pixels using the quality assessment (QA) band from the CFMASK algorithm. These images were then combined to generate an annual composite image as a basemap for classification, while the Normalized Difference Vegetation Index (NDVI) time series of MODIS critically contributed to crop structure detection. Since 2015, we utilized Sentinel images for LULC classification. The quality scenes of Sentinel-2 were selected to generate monthly composite images before they were used to calculate the NDVI [45]. The Sentinel-2 NDVI time series data were enriched by integrating with Sentinel-1 SAR (Synthetic Aperture Radar) data through a monthly time series of cross-polarized and co-polarized backscatter values (VH and VV, in dB) to classify LULC maps with detailed crop structures.

2.2.2. Data on Driving Forces
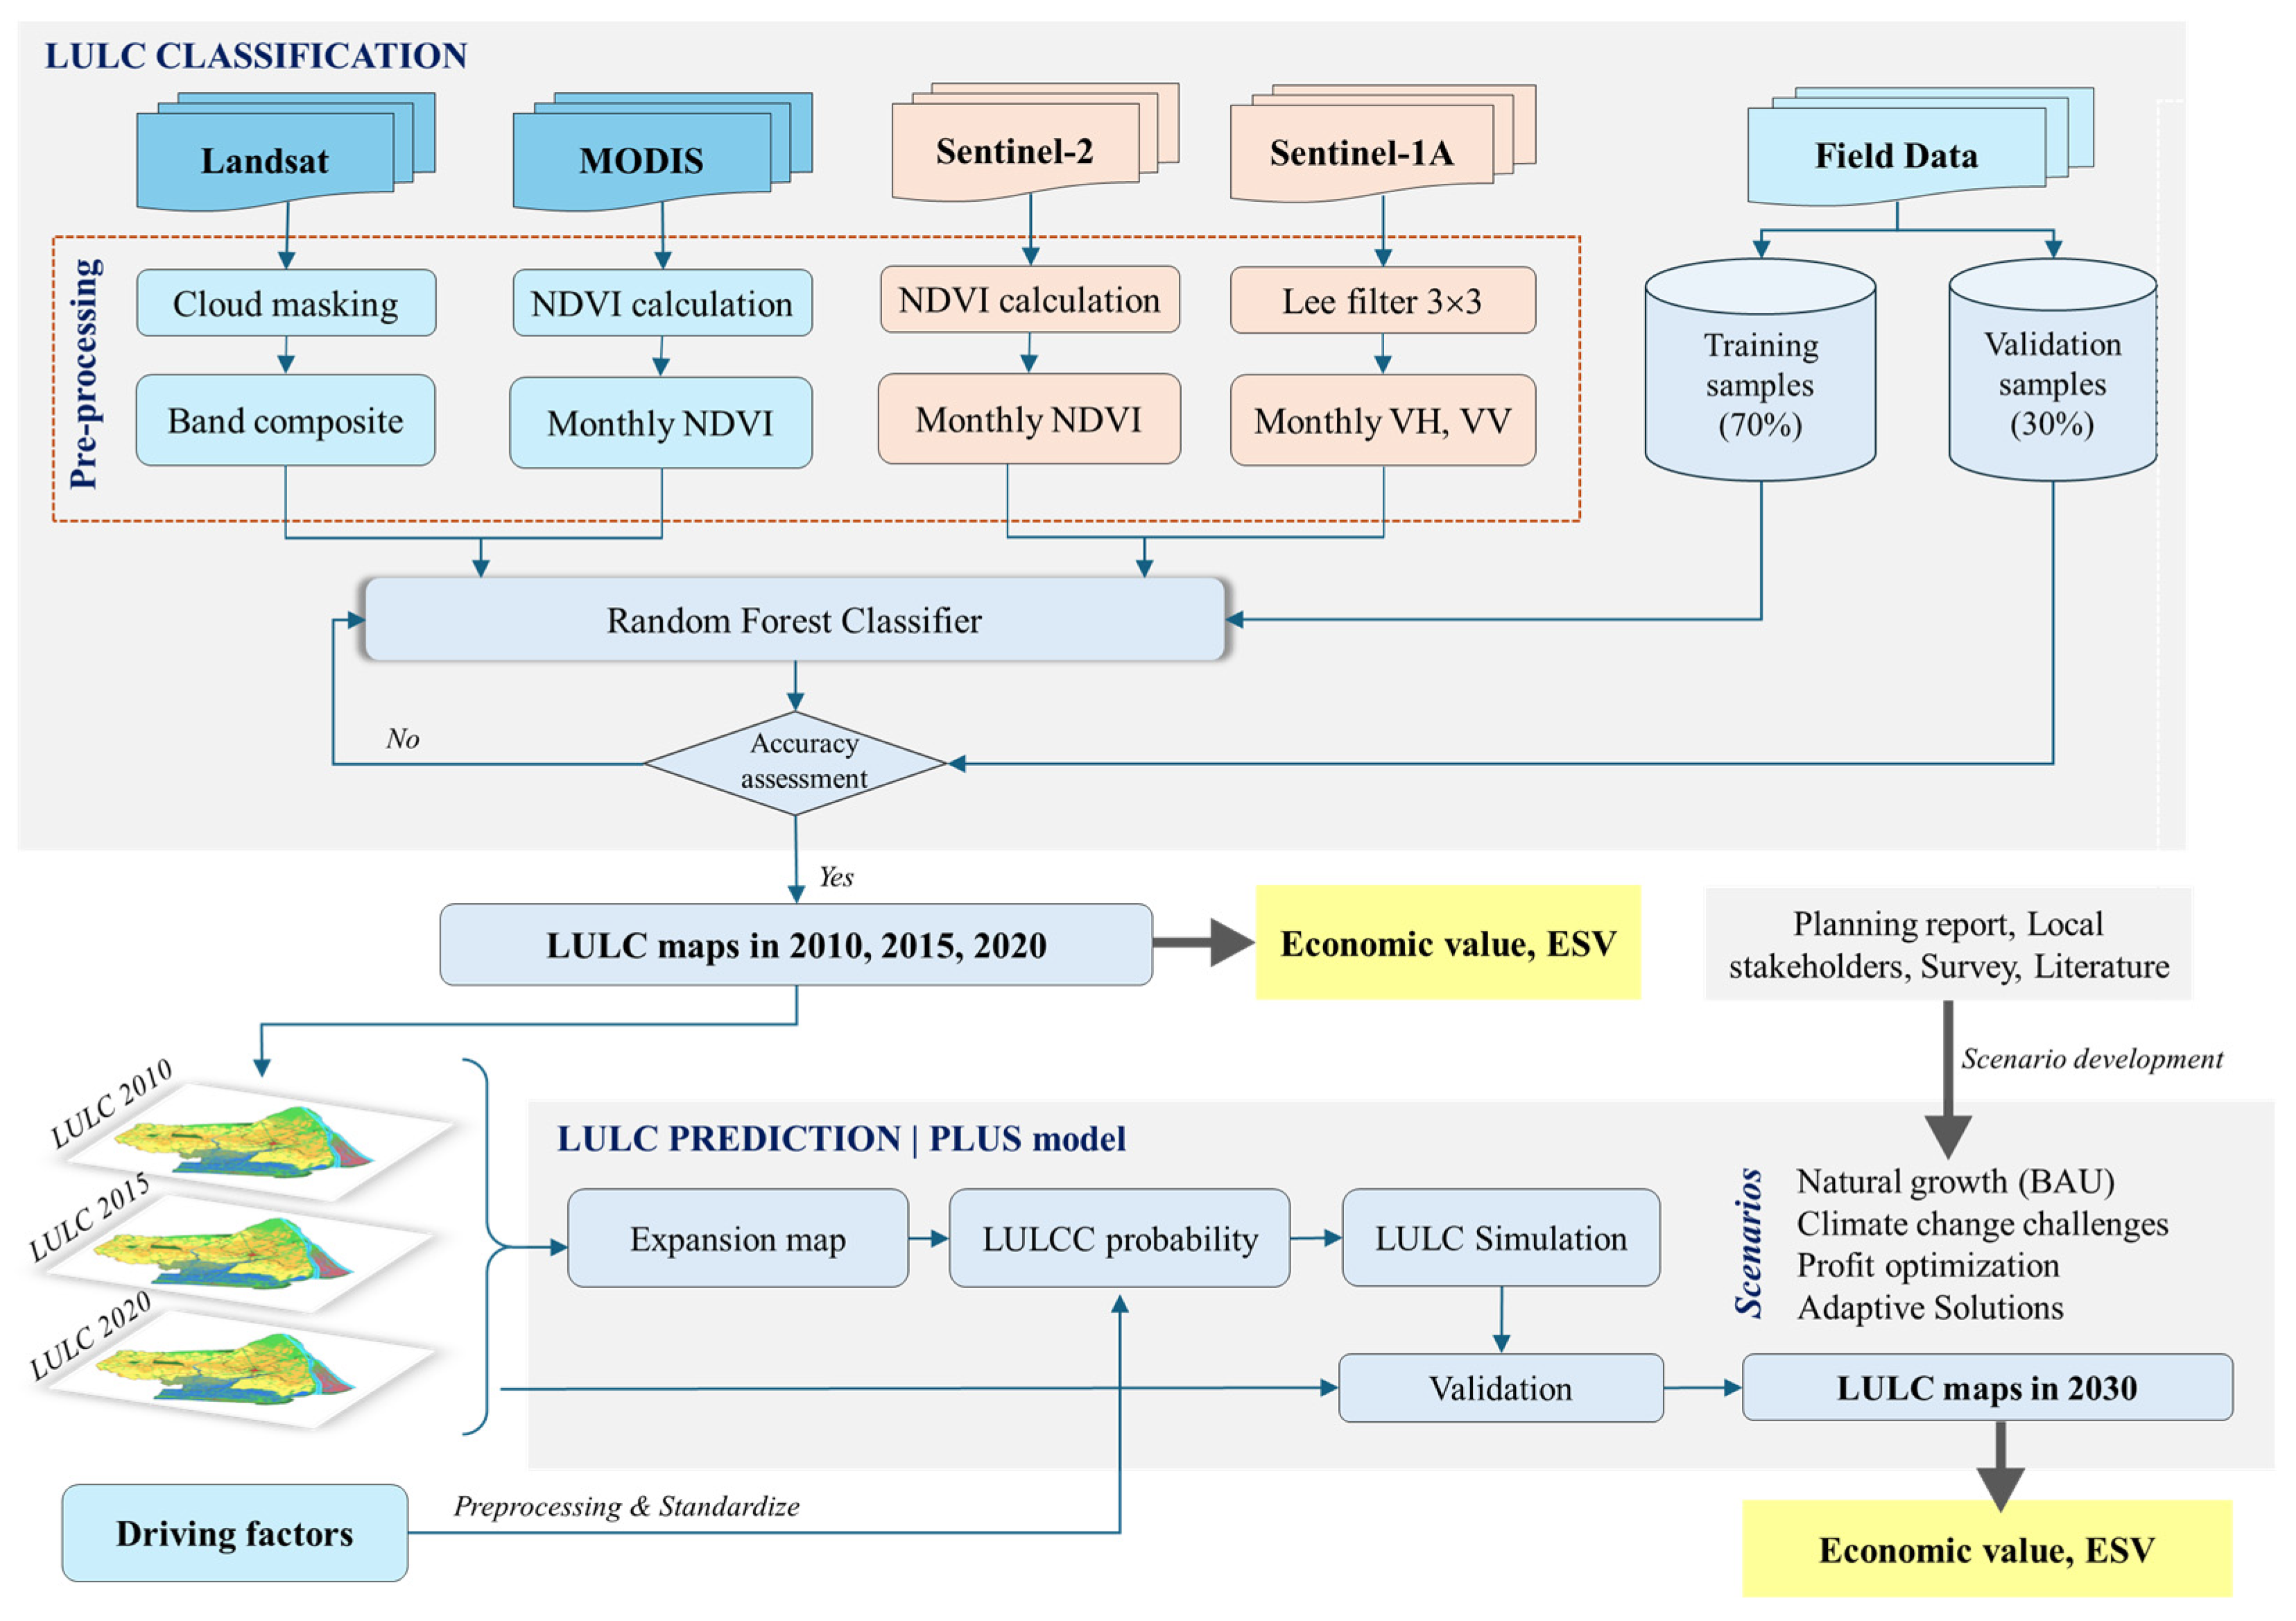
In addition to satellite images, this study acquired numerous supporting factors to characterize LULCC dynamics. A literature review of current studies on LULCC simulation was conducted to identify the key common driving forces that should be included in the simulation, such as population density, soil type, transportation, temperature, precipitation, elevation, slope, and aspect [46,47,48]. Furthermore, other unique factors were also involved in characterizing the LULCC dynamics in a coastal province, including dike systems, distance to the coastline, and salinity distribution. Twelve (12) impact factors were identified and included in the LULCC analysis, which broadly encompassed the natural environment, policy, and socioeconomic variables, including population density, distance to roads, distance to urban areas, annual mean temperature, annual mean precipitation, soil type, elevation, slope, distance to rivers, distance to the coastline, salinity, and distance to dikes (Table 1).
The socioeconomic category consists of population density, distance to urban and administrative centers, and distance to roads. Population density reflects population growth and migrant flows, which are critical elements of LULCC, as population growth normally stimulates land demand for residential and urban development [49]. Transportation systems (road networks) reveal accessibility, land value, and environmental impacts, thereby making the LULCC simulation more accurate by including spatial development patterns. For example, the areas near roads are more likely to experience urbanization and LULCC as they have favorable conditions for the movement and trade of goods [50]. Distance to urban neighbors cannot be neglected in LULCC simulation, especially in monitoring urban expansion [51]. Suburban and peri-urban areas are more likely to urbanize and transform LULC because of the advantages of infrastructure development and economic development opportunities [52,53,54].
The natural environment comprises diverse aspects of climate, physical, and other natural conditions. Annual mean temperature and precipitation are essential climate variables to assess the feasibility of agricultural activities, especially seasonal farming systems like rainfed rice and rice–shrimp rotational farming, which mainly depend on climatic conditions [55]. Distance to rivers significantly influences both human and natural activities, shaping agricultural practices, ecosystems, and vegetation patterns in river basins [56]. It also supports irrigation-dependent farming by supplying essential freshwater resources. Although the VMD has a relatively flat terrain, its components (i.e., elevation and slope) still exert some influence on LULC in the delta by determining the efficiency of natural irrigation, especially in low-lying and tidal-influenced areas [57]. Soil types regulate LULC and agricultural distribution patterns through soil fertility, textures, and composition. Different soil types influence land suitability for various LULC categories, such as agriculture, forest, and even urban settlements, by the characteristics of the depth of acid sulfate soil layer, water retention, and drainage [58,59]. Meanwhile, salinity and distance to shoreline imply negative impacts on LULC distribution and future LULCC of freshwater-based farming and brackish aquaculture [40].
These factors were acquired from different sources and data formats. They were therefore processed to achieve a uniform raster data format with a similar pixel size of 30-meter resolution in the WGS84 zone 48N coordinate system. The raster datasets (e.g., population density, temperature, precipitation, and elevation) were resampled to obtain consistent 30-meter pixel-size data. The slope was estimated using spatial surface analysis based on DEM data. Other elements were acquired in vector format, so they were transformed into raster by an indirect method of shortest (Euclidean) distance to each object (Equation (1)), such as roads, rivers, urban, coastline, and dikes. This data transformation was conducted for all distance-related variables.
d p , q = i = 1 n ( q i p i ) 2
where d(p, q) is the Euclidean distance between points p and q in n-space, and qi and pi are Euclidean vectors, starting from the initial point.
The soil type was collected from a paper map, which was georeferenced and digitized to create digital GIS-format data. The soil-type map describes fourteen (14) soil types and their distribution in Soc Trang. In general, these soil types belong to six major soil groups: human-made raised-bed soil, coastal sandy soil, saline soil, potential acid sulfate soil, active acid sulfate soil, and alluvial soil. About 45.87% of the total area is dominated by low- and moderate-salinity soil. Although soil types can characterize soil properties (i.e., textures, fertility, soil organic carbon, and acid sulfate soil layers), they are qualitative quantities with limited direct utility for numerical quantitative analysis. Thus, we evaluated land suitability for agricultural and other LULC categories to quantify soil properties. More specifically, the soil properties were comprehensively examined through expert opinion and an integrated assessment framework of land suitability proposed by FAO for each LULC class. The land suitability of each soil type on individual LULC was determined at four (04) levels, N (not suitable), S3 (marginally suitable), S2 (moderately suitable), and S1 (highly suitable), which were correspondingly assigned arithmetic values from 1.0 to 4.0. The ultimate value for each land unit was determined as the total land suitability value for all nine LULC categories. For example, the final land suitability assessment indicates that the highest suitability is 28 and the lowest suitability is 9.
This study also included the policy element of localized water-engineering systems (dikes) as a policy-driven factor to limit the negative impacts of tidal floods and saline intrusion on coastal agroecosystems and resource-dependent communities [60].

2.3. Methods

Figure 2 depicts primary remotely sensed datasets, auxiliary data on LULCC driving forces, and other information used for analyses. In general, the key methodology includes two main tasks: (1) LULC mapping using a machine learning-based classifier, and (2) future LULC simulation under diverse scenarios. Beyond these tasks, spatial LULCC analysis and economic and ecosystem service valuation were also included to give further insights and compare benefits and trade-offs between the scenarios. Satellite image preprocessing and LULC classification were performed based on datasets and algorithms on Google Earth Engine (GEE) platform. Spatial analyses and calculations were completed using QGIS 3.40.6 and R-4.4.1.

2.3.1. LULC Map Classification

Applying only a classification framework on different remotely sensed data might not yield the best quality of LULC results. This study proposed two distinct classification frameworks for the two satellite datasets based on empirical investigations. In general, these frameworks use the random forest (RF) classification to classify LULC maps because it is one of the most effective machine learning algorithms in LULC classification [61,62,63]. Nine LULC categories were classified using the proposed frameworks, including annual crops (ACRO), aquaculture (AQUA), construction land (CONS), forest (FOR), double rice crops (DRICE), triple rice crops (TRICE), rice–shrimp (SRICE), perennial plantations and orchards (PLANT), and river/canal (WAT) (Table 2).
The classified LULC maps were evaluated by collating these maps with the independent dataset of 30% of 1195 ground-truth points and the estimated evaluation metrics of overall accuracy and Kappa coefficient. A threshold of higher than 75% is frequently adopted as the lowest confidence level necessary to ensure that all analyses achieve the expected accuracy levels that reflect actual LULCC processes and depict LULC distribution patterns against the field data.
The first classification method was applied to Landsat-5 and MOD13Q1 time series datasets. The multispectral bands (i.e., visible, near-infrared, and shortwave infrared bands) of the annual composite Landsat-5 were interpreted by the supervised RF classifier using the ground-truth points collected in land use inventory maps, Google Earth very-high-resolution images, and field trip campaigns in March 2023 regarding current LULC and during the extreme drought event in the dry season 2015/2016. There were 1195 ground-truth points collected through this integrated method, which were then split into two distinct datasets for modeling training (810 points) and validation (385 points). The tuned RF parameters for LULC classification in Google Earth Engine are number of trees (ntree = 150), variables per split (splitvars = 3), and bag fraction (bagfrac = 0.1) [64,65]. The initial supervised classification using Landsat annual composite distinguished seven primary LULC categories, including forest, river/canal, aquaculture, perennial plantations, annual crops, rice fields, and built-up. Rice fields were further categorized with greater detail using the Kmeans classifier (nclass = 15–20 and niter = 20) on MOD13Q1 NDVI time series to monitor the growth peaks during rice development, thereby helping to identify distinct rice crop farming. For instance, triple rice crops have three growth peaks with NDVI values normally reaching values higher than 0.8. Ultimately, rice fields were classified into triple rice crops, double rice crops, and mono rice crops (or rotational rice–shrimp farming).
The second classification framework was regulated for Sentinel-1A (SAR) and Sentinel-2 datasets (2015 and 2020). Sentinel-2 NDVI and Sentine-1A SAR (VH, VV) have similar pixel sizes. Therefore, they do not need to undergo the two classification steps, which were deployed to reduce the loss of detail on the LULC map because of the low resolution of the MODIS NDVI time series. This method directly combined Sentinel-2 NDVI and Sentinel-1 (VH and VV) into the same time series. It was then classified by RF-supervised classification with a set of parameters (i.e., ntree = 150, splitvars = 3, and bagfrac = 0.1). A combination of both NDVI values and co-polarized backscatter signals (VH and VV) allowed us to distinguish nine LULC categories (Table 2).

2.3.2. Simulation of Future LULC Using Cellular Automata–Markov Chain

A simulation of future LULCC was examined to understand the potential impacts of natural processes and human interventions on LULCC and the environment [14]. This study employed the Patch-generating Land Use Simulation (PLUS) model (https://github.com/HPSCIL/Patch-generating_Land_Use_Simulation_Model, accessed on 8 December 2024), integrating a Markov Chain and Cellular Automata (CA) to predict spatial and temporal dynamics of LULC for the target year of 2030 [66]. It generally embraces three processes: change analysis, transition potential analysis, and change prediction [67]. Firstly, the LULC map in the initial year (2010) was compared to the LULC map in the intermediate year (2015) to identify specific cells that experienced transitions between different LULC categories. The Land Use Expansion Analysis Strategy (LEAS) module utilizes a random forest algorithm (Equation (1)) to explore the correlations between the transition at each cell and twelve potential determinants. LEAS reveals the LULC change mechanisms over time through the contribution of each driving force in the expansion and the change probability maps for each LULC category, characterizing LULCC possibility at each cell for a typical LULC type [68,69]. Subsequently, the CA based on the Multiple Random Seeds (CARS) module incorporates expansion probability maps based on multiclass stochastic seeds to describe the spatial dynamics of LULC expansion. The simulation was obtained by adjusting the adaptive coefficients and model parameters, such as neighborhood size, patch generation threshold, expansion coefficients, and the percentage of seeds to meet land demands in the target year [70]. More explicitly, the previous land expansion maps assign neighborhood weight for each LULC category. It is estimated by the proportion of transitioned cells in the most recent year relative to the total number of cells that experienced changes. Meanwhile, land demand, representing the target number of cells for each LULC category in the target year, is quantified using the Markov chain method (Equation (2)) [71].
P i , k d x = n = 1 M I h n x = d M
where P i , k d x reveals the development probability at location i of land use k; h n x is the prediction type of the decision tree n for vector x; I is the function of decision trees; M is the number of decision trees; and d is the binary transition factor (0/1) which decides land use changes from other land use types to land use k.
D t 2 = D t 1 · A t 2 t 1 a
where Dt1 and Dt2 are land use status at initial time t1 and land use demand at time t2; A represents the matrix of land use changes between t1 and t2; and a stands for the distinction between two years of matrix A.
The LULC change model was verified to ensure that the model is adequately efficient in characterizing LULC change simulation for future predictions in 2030. It compares the simulated and actual LULC maps in 2020 and calculates the Kappa coefficient, which tests the overall consistency between the simulated and modeled maps [71].

2.3.3. Future Development Scenarios

Simulation of LULC changes under diverse scenarios is frequently adopted to investigate how future LULC changes will be shaped by different barriers, institutional efforts, and interventions [32,35,72,73]. To contribute to ensuring Sustainable Development Goals (SDGs) in 2030, this study set up four different scenarios for future LULC simulations.
Scenario 1—Natural growth (business as usual, BAU): It simulates development based on current conditions observed during 2010–2020 without any limitations, barriers, or regulation efforts regarding natural environments and policy orientation.
Scenario 2—Climate change challenges (CCC): This scenario assumes that the impacts of climate change through rising temperature and altering precipitation patterns will significantly affect LULC distribution, especially in coastal areas, with severe impacts on freshwater scarcity for agricultural cultivation [74]. Therefore, it will more likely influence agricultural LULC categories, which are highly prone to changing climatic conditions, such as triple rice crops and annual crops. The simulation under this scenario will be controlled by extreme climate conditions of temperature and precipitation corresponding to the SSP585 scenario, which represents the most extreme climate change trajectory among the Shared Socioeconomic Pathways (SSP) [75]. By adopting SSP585, our scenario assessed the vulnerability of agricultural systems under the most severe plausible climate stressors, which is essential for long-term adaptation strategies.
Scenario 3—Profit optimization (PO): This scenario focuses only on maximizing economic returns from LULC changes without considering negative environmental and social impacts. It helps to realize the “Land use planning for 2030 with a vision towards 2050” from the Provincial People’s Committee of Soc Trang into a LULC map facilitating spatial orientation planning [76]. It aims to develop the economic values of the agricultural sector at an average rate of 5.25% per year, which includes both LULC spatial changes and technology enhancement (e.g., high-tech rice and shrimp) accounting for 3.5% per year [76]. Technological advancements were not involved within the scope of this study, as they do not inherently result in spatial changes. The pure value due to LULCC is therefore estimated to be approximately 1.75% per year. We incorporated the economic values of agricultural models in Soc Trang from our investigation to transform expected economic values to corresponding areas for each LULC category as land demand in 2030.
Scenario 4—Adaptive solutions (ADs): In the ADs scenario, this study considered LULC changes that increase the nature-based adaptation (NbA) abilities of agricultural systems under the severity of climate change impacts. We reviewed and incorporated diverse information from the provincial development orientation toward 2050, insights from local officials through group discussions with stakeholders, and the existing literature to emphasize that rotational rice–shrimp and double rice crops are more resilient to climate change, drought, and saline intrusion than monoculture aquaculture and triple rice crops, respectively [76]. Yet, these orientations remain somewhat ambiguous as there is no estimated land area or specific regions prioritized for such transitions in the current planning reports [76]. We therefore simulated them into subscenarios to compare different growth criteria at 5% per year (moderate transition) and 10% per year (rapid transition) [77,78]. The land demand in 2030 was approximated based on these growth rates for LULC simulations.
The favorable and restricted models were used as constraint factors in the land use matrix to estimate future land use demand for LULC simulation.
The past and future LULC maps were analyzed by estimating the annual growth rate (AGR, %/year) to reflect the average percentage and speed of LULCC (Equation (4)).
A G R = A t A 0 A 0 × T × 100
where A0 and At are areas of land use at the start and the end of the period and T is the number of years within the period.
At the same time, the transitions among LULC types are relatively comprehensive. To highlight the areas most susceptible to LULCC and enable comparison between scenarios, we also generated a LULCC probability map for each scenario. Pixels that undergo any type of LULCC compared to the reference year of 2020, regardless of the specific transition dynamics, are assigned a value of 1. Subsequently, the LULCC probability for each 1 × 1 km area is calculated as the ratio of changed pixels to the total number of pixels within that area.

2.3.4. Quantification of Economic Value and Ecosystem Services

The economic value of agricultural models was adopted to assess the economic effectiveness of LULCC scenarios. These reference values were obtained from our socioeconomic surveys in 2023 (Table 3). The total economic value is estimated by Equation (5) based on economic reference values for each agricultural land use in Table 3 (first value column).
E V = n 1 A n · E C n
where EV (USD) is the total economic value from the whole agricultural system, and An (ha) and ECn (USD/ha/year) are the area and economic reference value of land use k.
The ESS values were also estimated to comprehensively quantify ecological assets and used as trade-off values to consider between the scenarios. They are valued by the benefit transfer method, which estimates total ecosystem service values (ESV) by a function of ESV coefficients in its distribution area (Equation (6) and Table 3). The ESV coefficients from Costanza et al. [79] were widely applied in many studies worldwide; however, they represent general values for global biomes. Applying these values to local estimates can lead to uncertainties at local levels. Therefore, we utilized the Ecosystem Service Valuation Database (ESVD, https://www.esvd.net/esvd, accessed on 27 December 2024) to extract ESV coefficients for our calculations at the local level with more specific LULC categories [80]. This dataset includes the TEEB Valuation Database—a searchable database of 1310 estimates of monetary values. We firstly filtered the ESVD to include case studies and valuations in all countries in Southeast Asia and Asia. The summary returned a dataset of average values over 28 ecozones and 22 individual services, including (1) food, (2) water, (3) raw materials, (4) medicinal resources, (5) ornamental resources, (6) air quality regulation, (7) climate regulation, (8) moderation of extreme events, (9) regulation of water flows, (10) waste treatment, (11) erosion prevention, (12) maintenance of soil fertility, (13) pollination, (14) biological control, (15) maintenance of life cycle, (16) maintenance of genetic diversity, (17) aesthetic information, (18) opportunities for creation and tourism, (19) inspiration for culture, art, and design, (20) spiritual experience, (21) information for cognitive development, and (22) existence bequest values. This dataset aggregates values from existing case studies; therefore, it includes ecosystems that are incomparable against our LULC map and possible outliers. These outliers were carefully considered by collating across services and ecozones. The values of comparable LULC types were directly adopted, such as rice paddies versus triple rice crops. Meanwhile, the ecozones with a similar nature to the considered LULC categories were aggregated to estimate the final values for this specific LULC. For example, the values of the rice–shrimp model were estimated based on rice paddies and aquaculture. Twenty-two (22) individual ecosystem services were grouped into three main clusters for further estimation, including provisioning, regulating and supporting, and cultural services (Table 3).
E S V = A k · V C k
where ESV (2020 USD) is the total ESV of the landscape, and Ak (ha) and VCk (2020 USD/ha/year) are the area and value coefficient of land use k.

3. Results

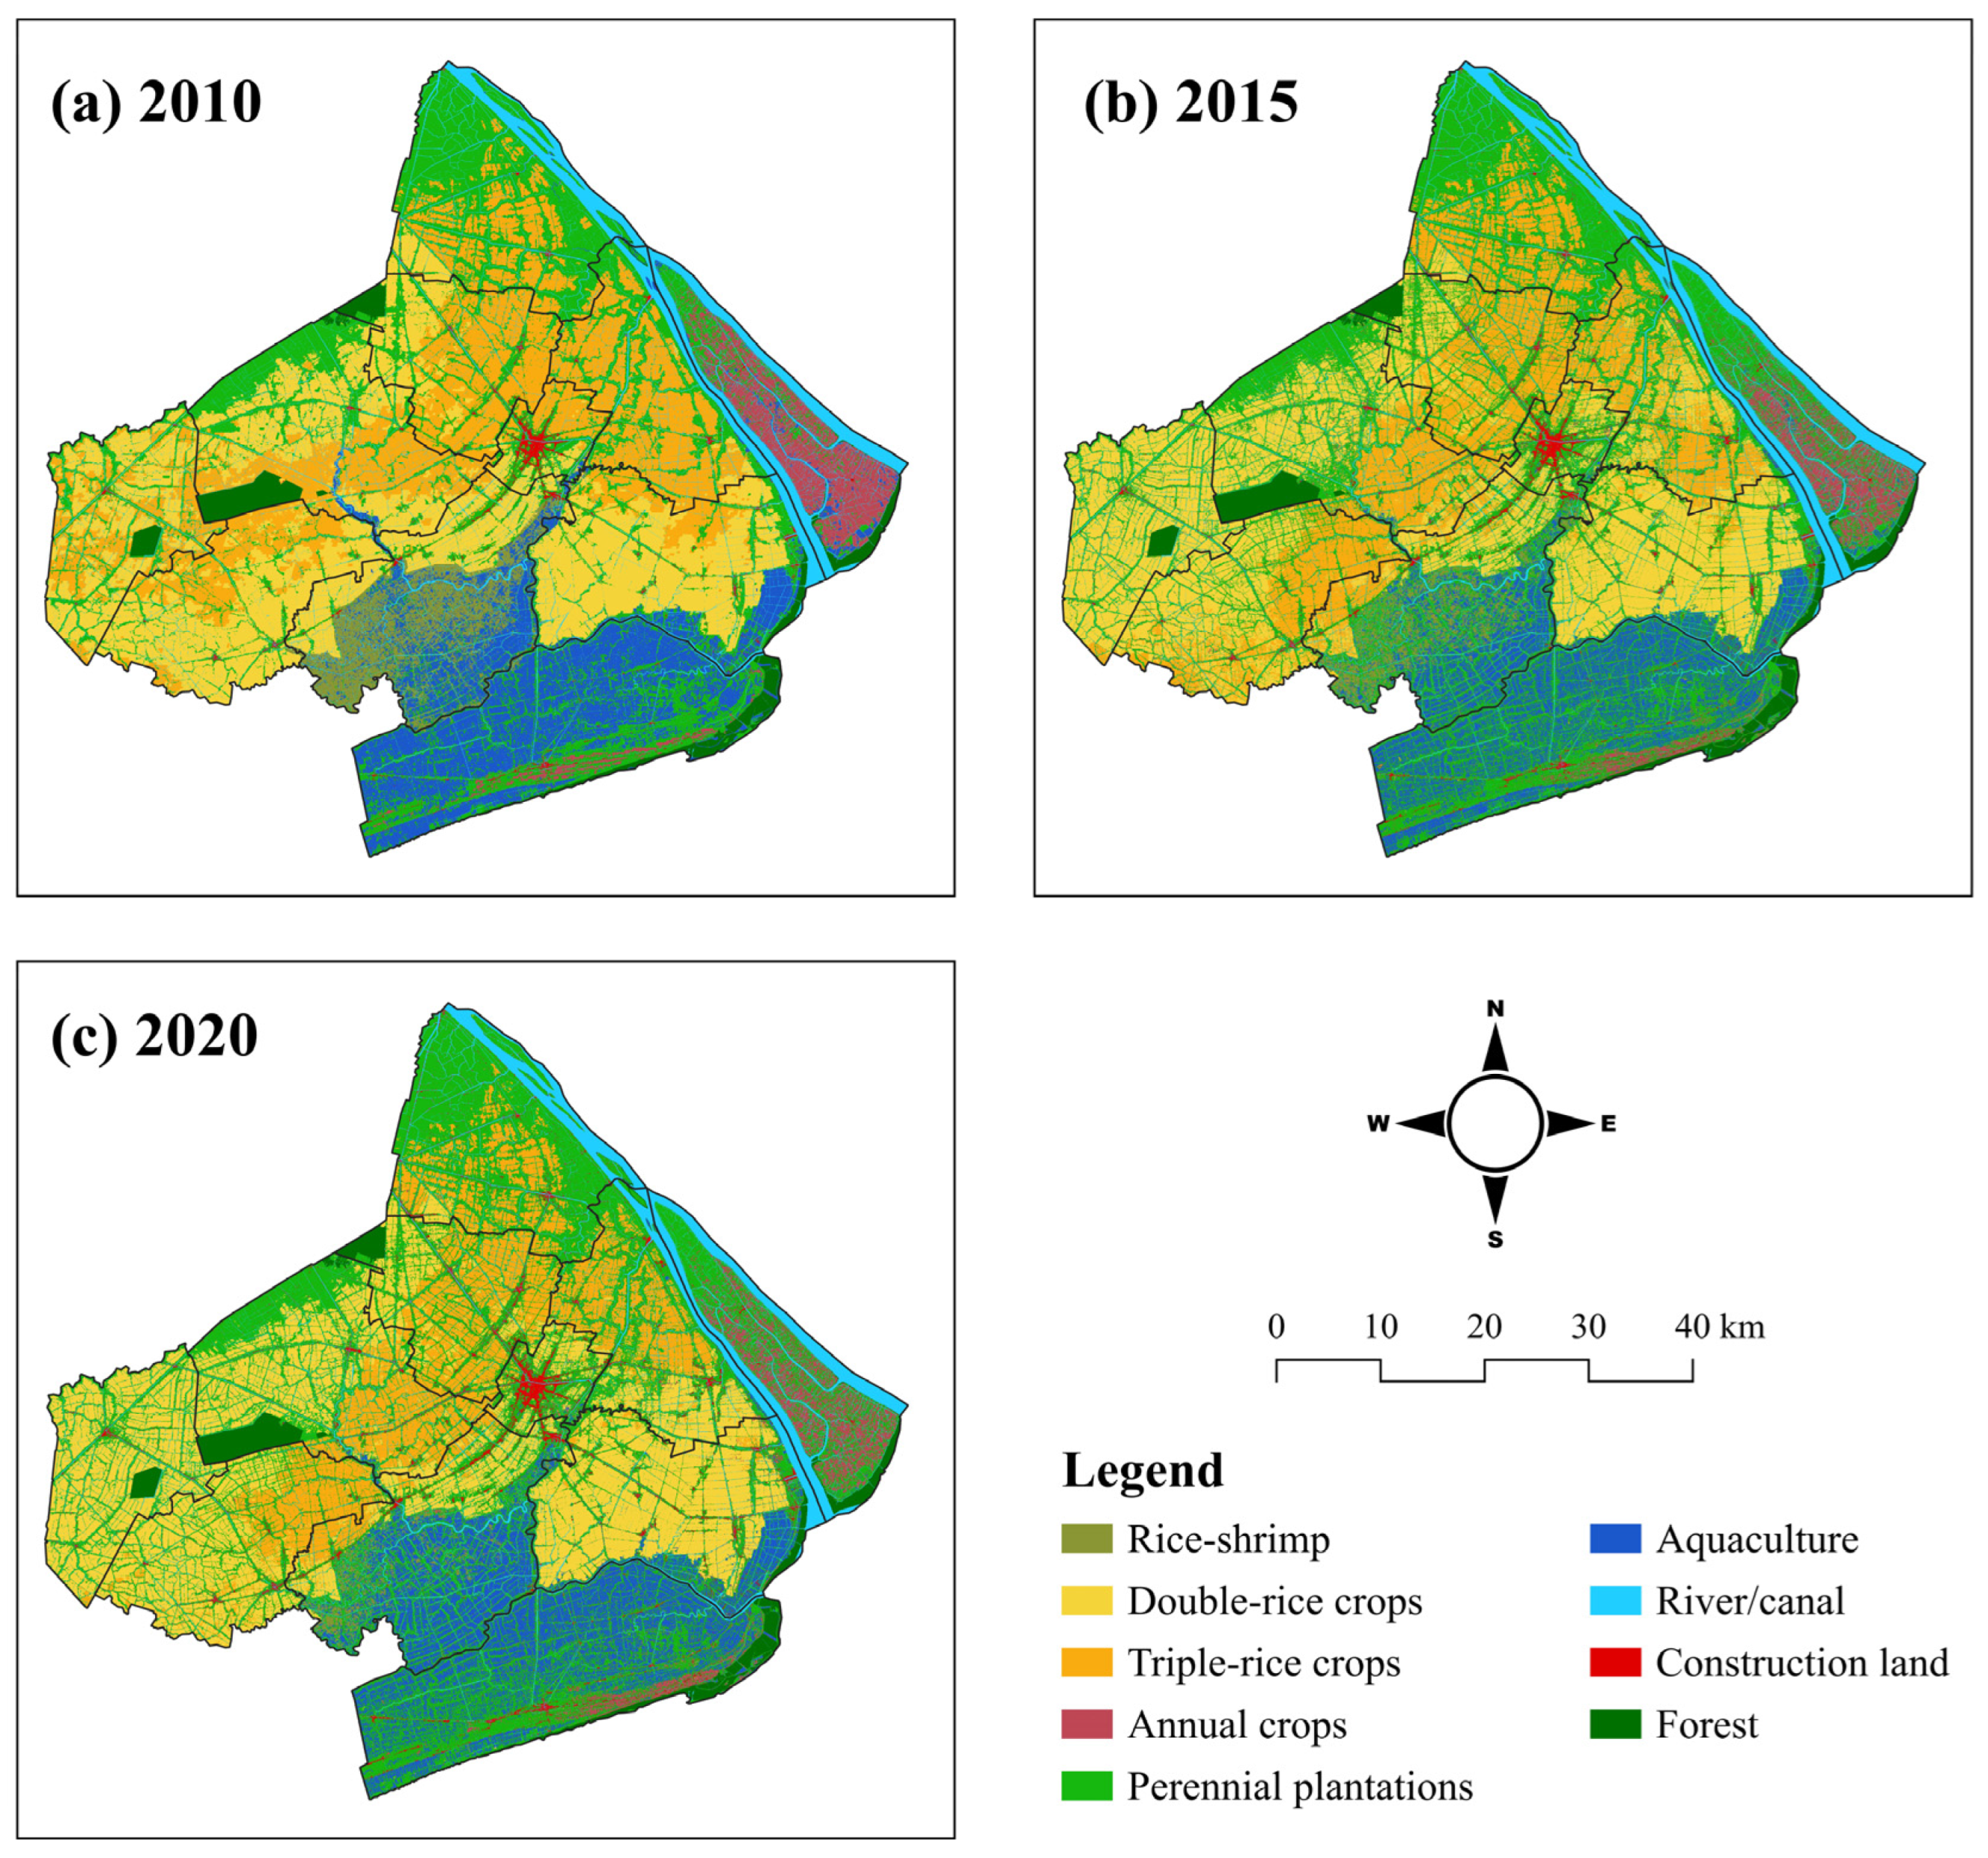
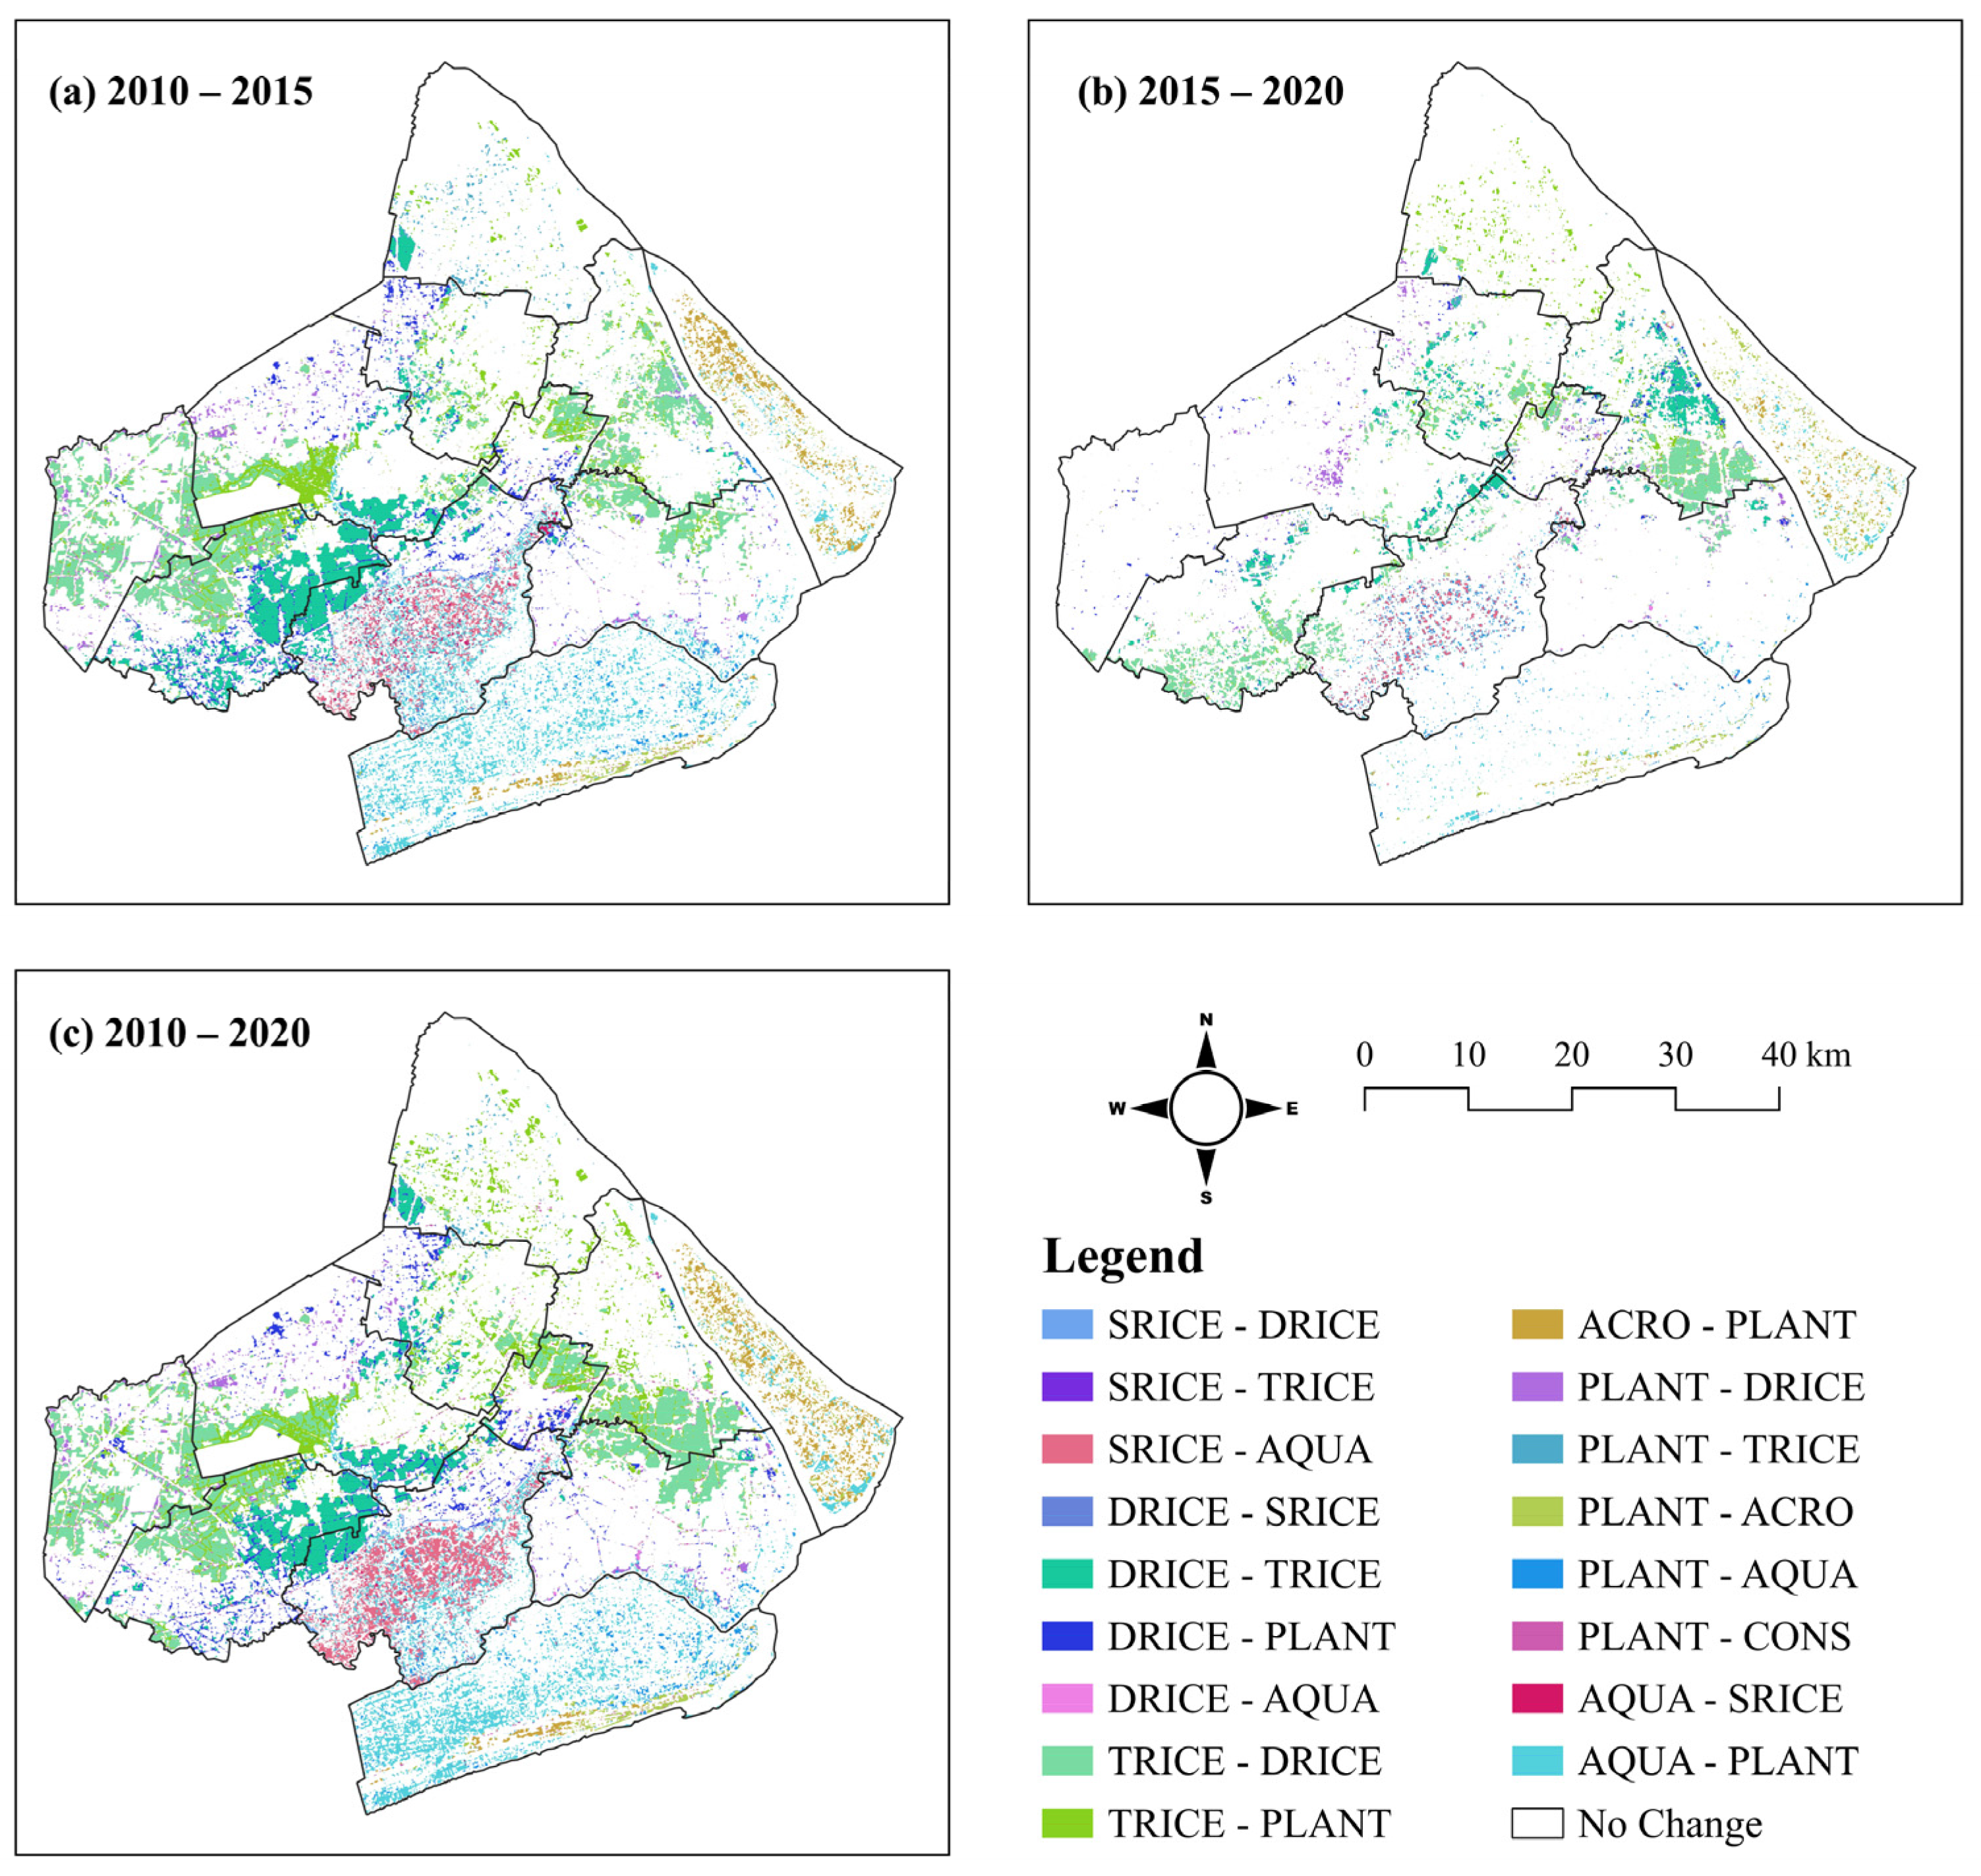
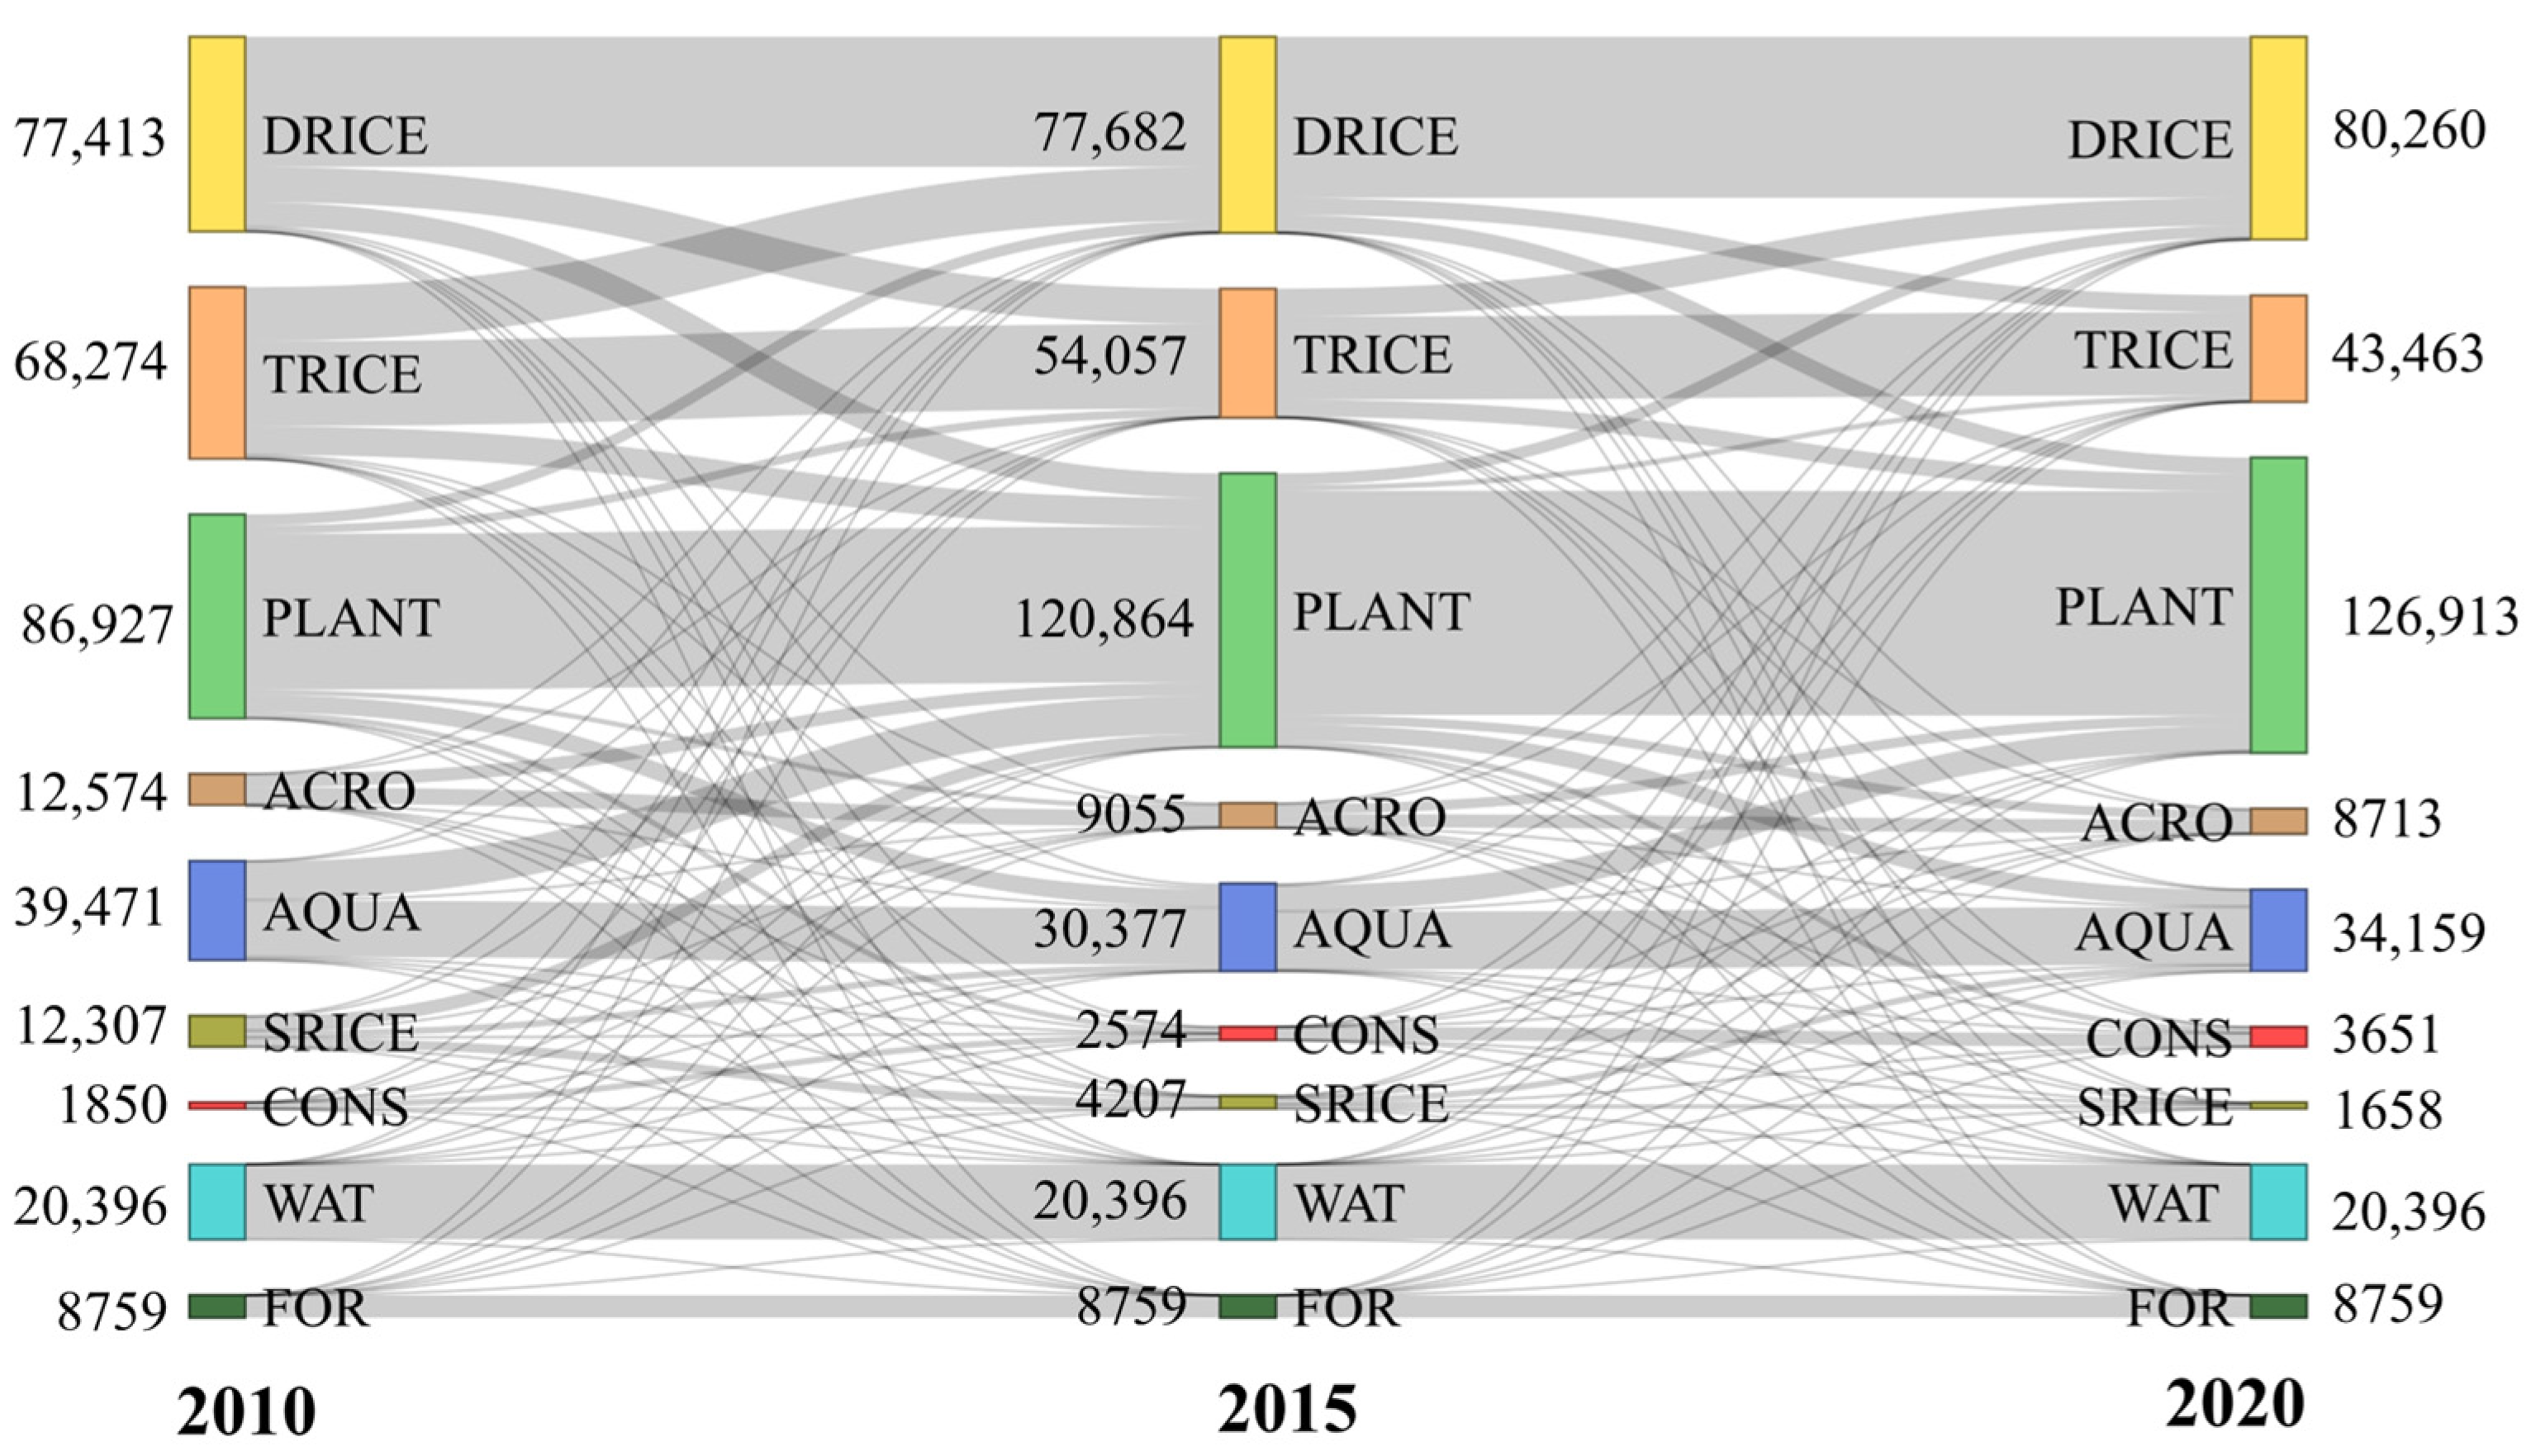
3.1. LULC Patterns and Changes from 2010 to 2020

The classified LULC achieved a high reliability level, indicated by the high overall accuracy values of 86.49%, 92.47%, and 93.77% in 2010, 2015, and 2020, respectively. The Kappa coefficients also indicated high quality, with the lowest value observed in 2010 at approximately 83.55%, highlighting the balanced reliability of the LULC maps for further analyses. The LULC categories with less seasonal variation have better classification performance than seasonal LULC categories such as DRICE, TRICE, and SRICE.
The spatial pattern of LULC distribution in Soc Trang can be divided into four subregions, reflecting the influences of saline intrusion (Figure A2). The northern freshwater subregion is adjacent to the mainstream, with an abundant water supply for freshwater farming systems (TRICE and PLANT). The central subregion is characterized by DRICE because of limited water resources during the dry season. The Cu Lao Dung islet is dominated by PLANT and ACRO on fertile alluvial soil. The coastal subregion includes brackish AQUA in the Vinh Chau District and SRICE farming in My Xuyen District.
Despite the leaps and bounds, the province’s economy still relies on agriculture and rice production (Table 4). The accumulative proportion of rice paddy fields (DRICE and TRICE) accounts for 44.15% and 37.49% of the total LULC system in 2010 and 2020, respectively. The area of DRICE is slightly larger than that of TRICE, which remains relatively stable, whereas the TRICE area exhibited a narrowing tendency, which decreased by 3.63%/year, corresponding to ~2481.1 ha/year. PLANT covers between one-fourth and one-fifth in terms of area and shows a growing trend, increasing from 86,927.8 ha in 2010 to 126,913 ha in 2020 (about +4.6%/year). The AQUA has slightly varied, but it remains stable at about 10% of the total area. It holds the same for ACRO. Its proportion is always approximately 2.64–3.81% despite a slight shrinking trend. Although SRICE is widely accepted as a highly effective farming method in coastal areas, its area has dramatically declined from 12,307.2 ha (2010) to 4207.5 ha (2015) and 1658.7 ha (2020). This is also the most fluctuating LULC, with an average rate of −8.65%/year.
The LULCC is relatively dynamic, as about 32.41% of areas experienced transitions from 2010 to 2020, in which the first period (2010–2015) was more varied than the latter (2015–2020), witnessing only 60,999.3 ha of transitions versus 100,115.6 ha (Figure 3 and Figure 4). Approximately half of the total converted area comes from DRICE and TRICE systems, with TRICE being more frequently converted to alternative systems. More specifically, about 35.66% of the total converted area is occupied by TRICE. Among the destination LULC categories, DRICE and PLANT are the primary conversion targets, comprising 58.73% and 40.23% of the converted area, respectively. Some small areas of DRICE have tended to increase their crops to TRICE (approximately 11,509.3 ha). It has also witnessed a significant area of DRICE replaced by ACRO, about 498 ha, during 2010–2020. Also, a large area of SRICE, mostly in My Xuyen District (4542.2 ha), was lost because of conversion to AQUA.
While the LULCC was detected with interconversion among LULC purposes, the dominant conversions of urban expansion, SRICE loss, shrinking in TRICE, increase in AQUA, and massive transitions to PLANT were consistently observed over the periods in both the short and long terms.

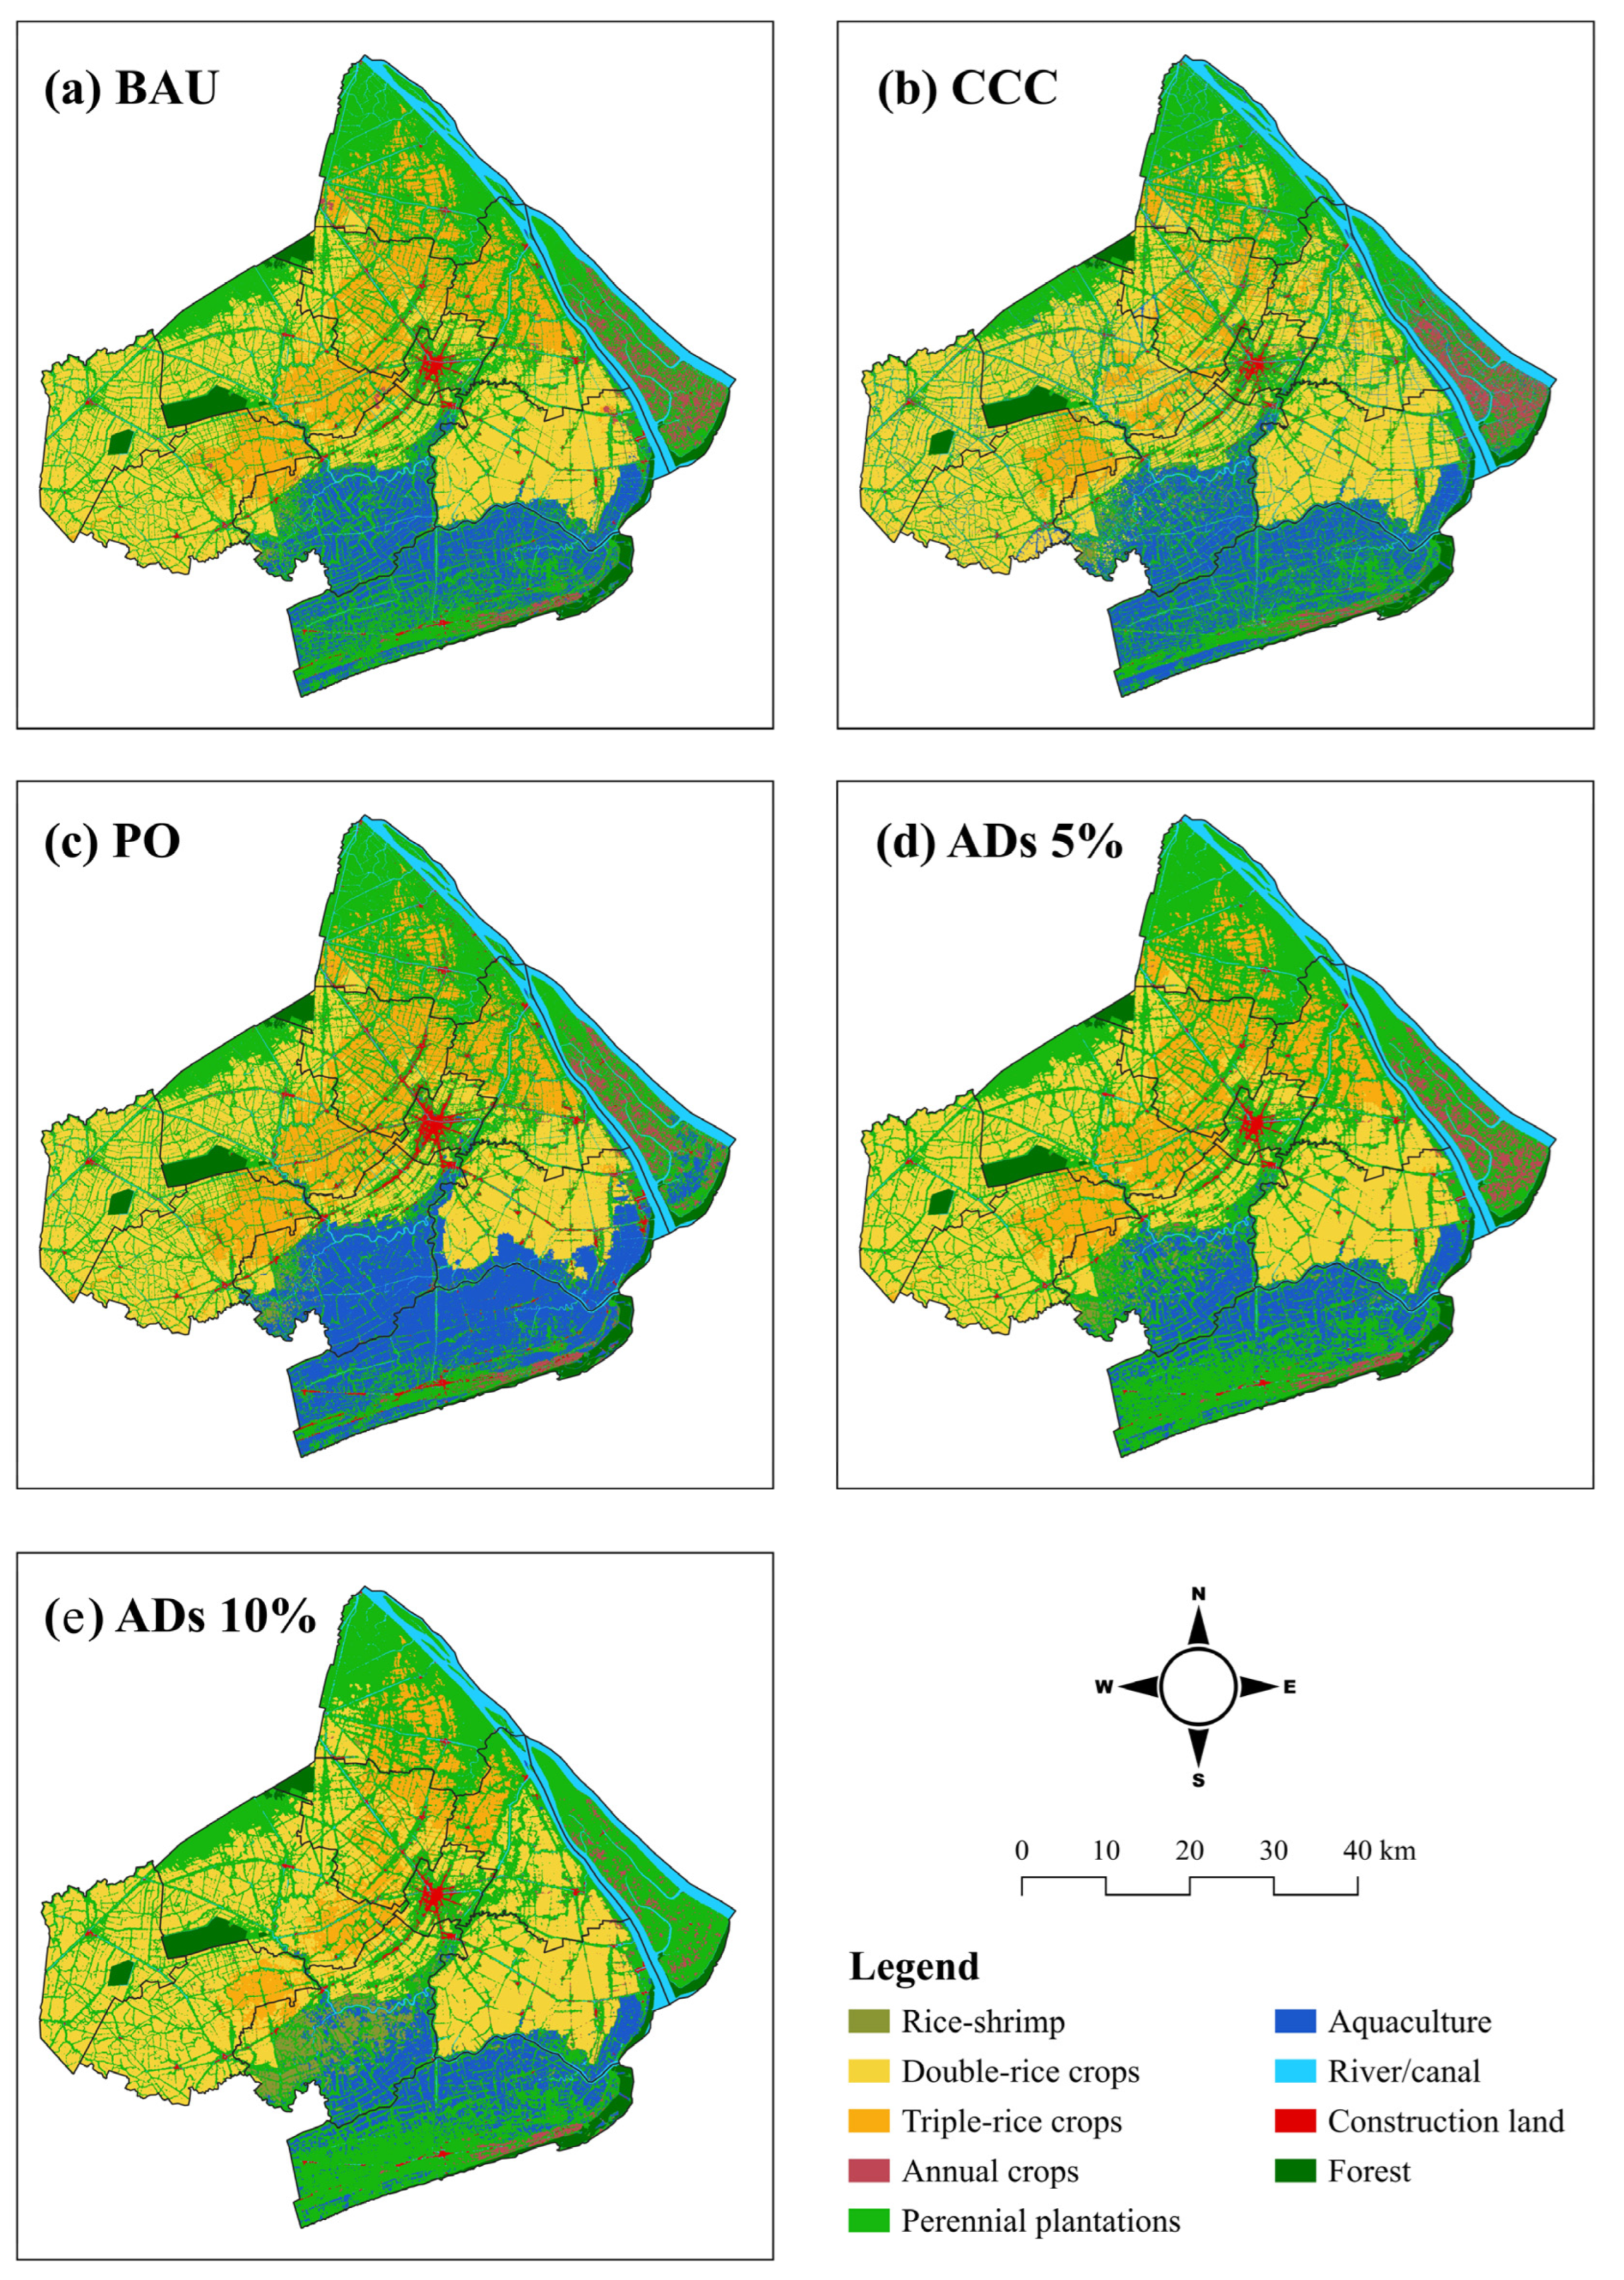
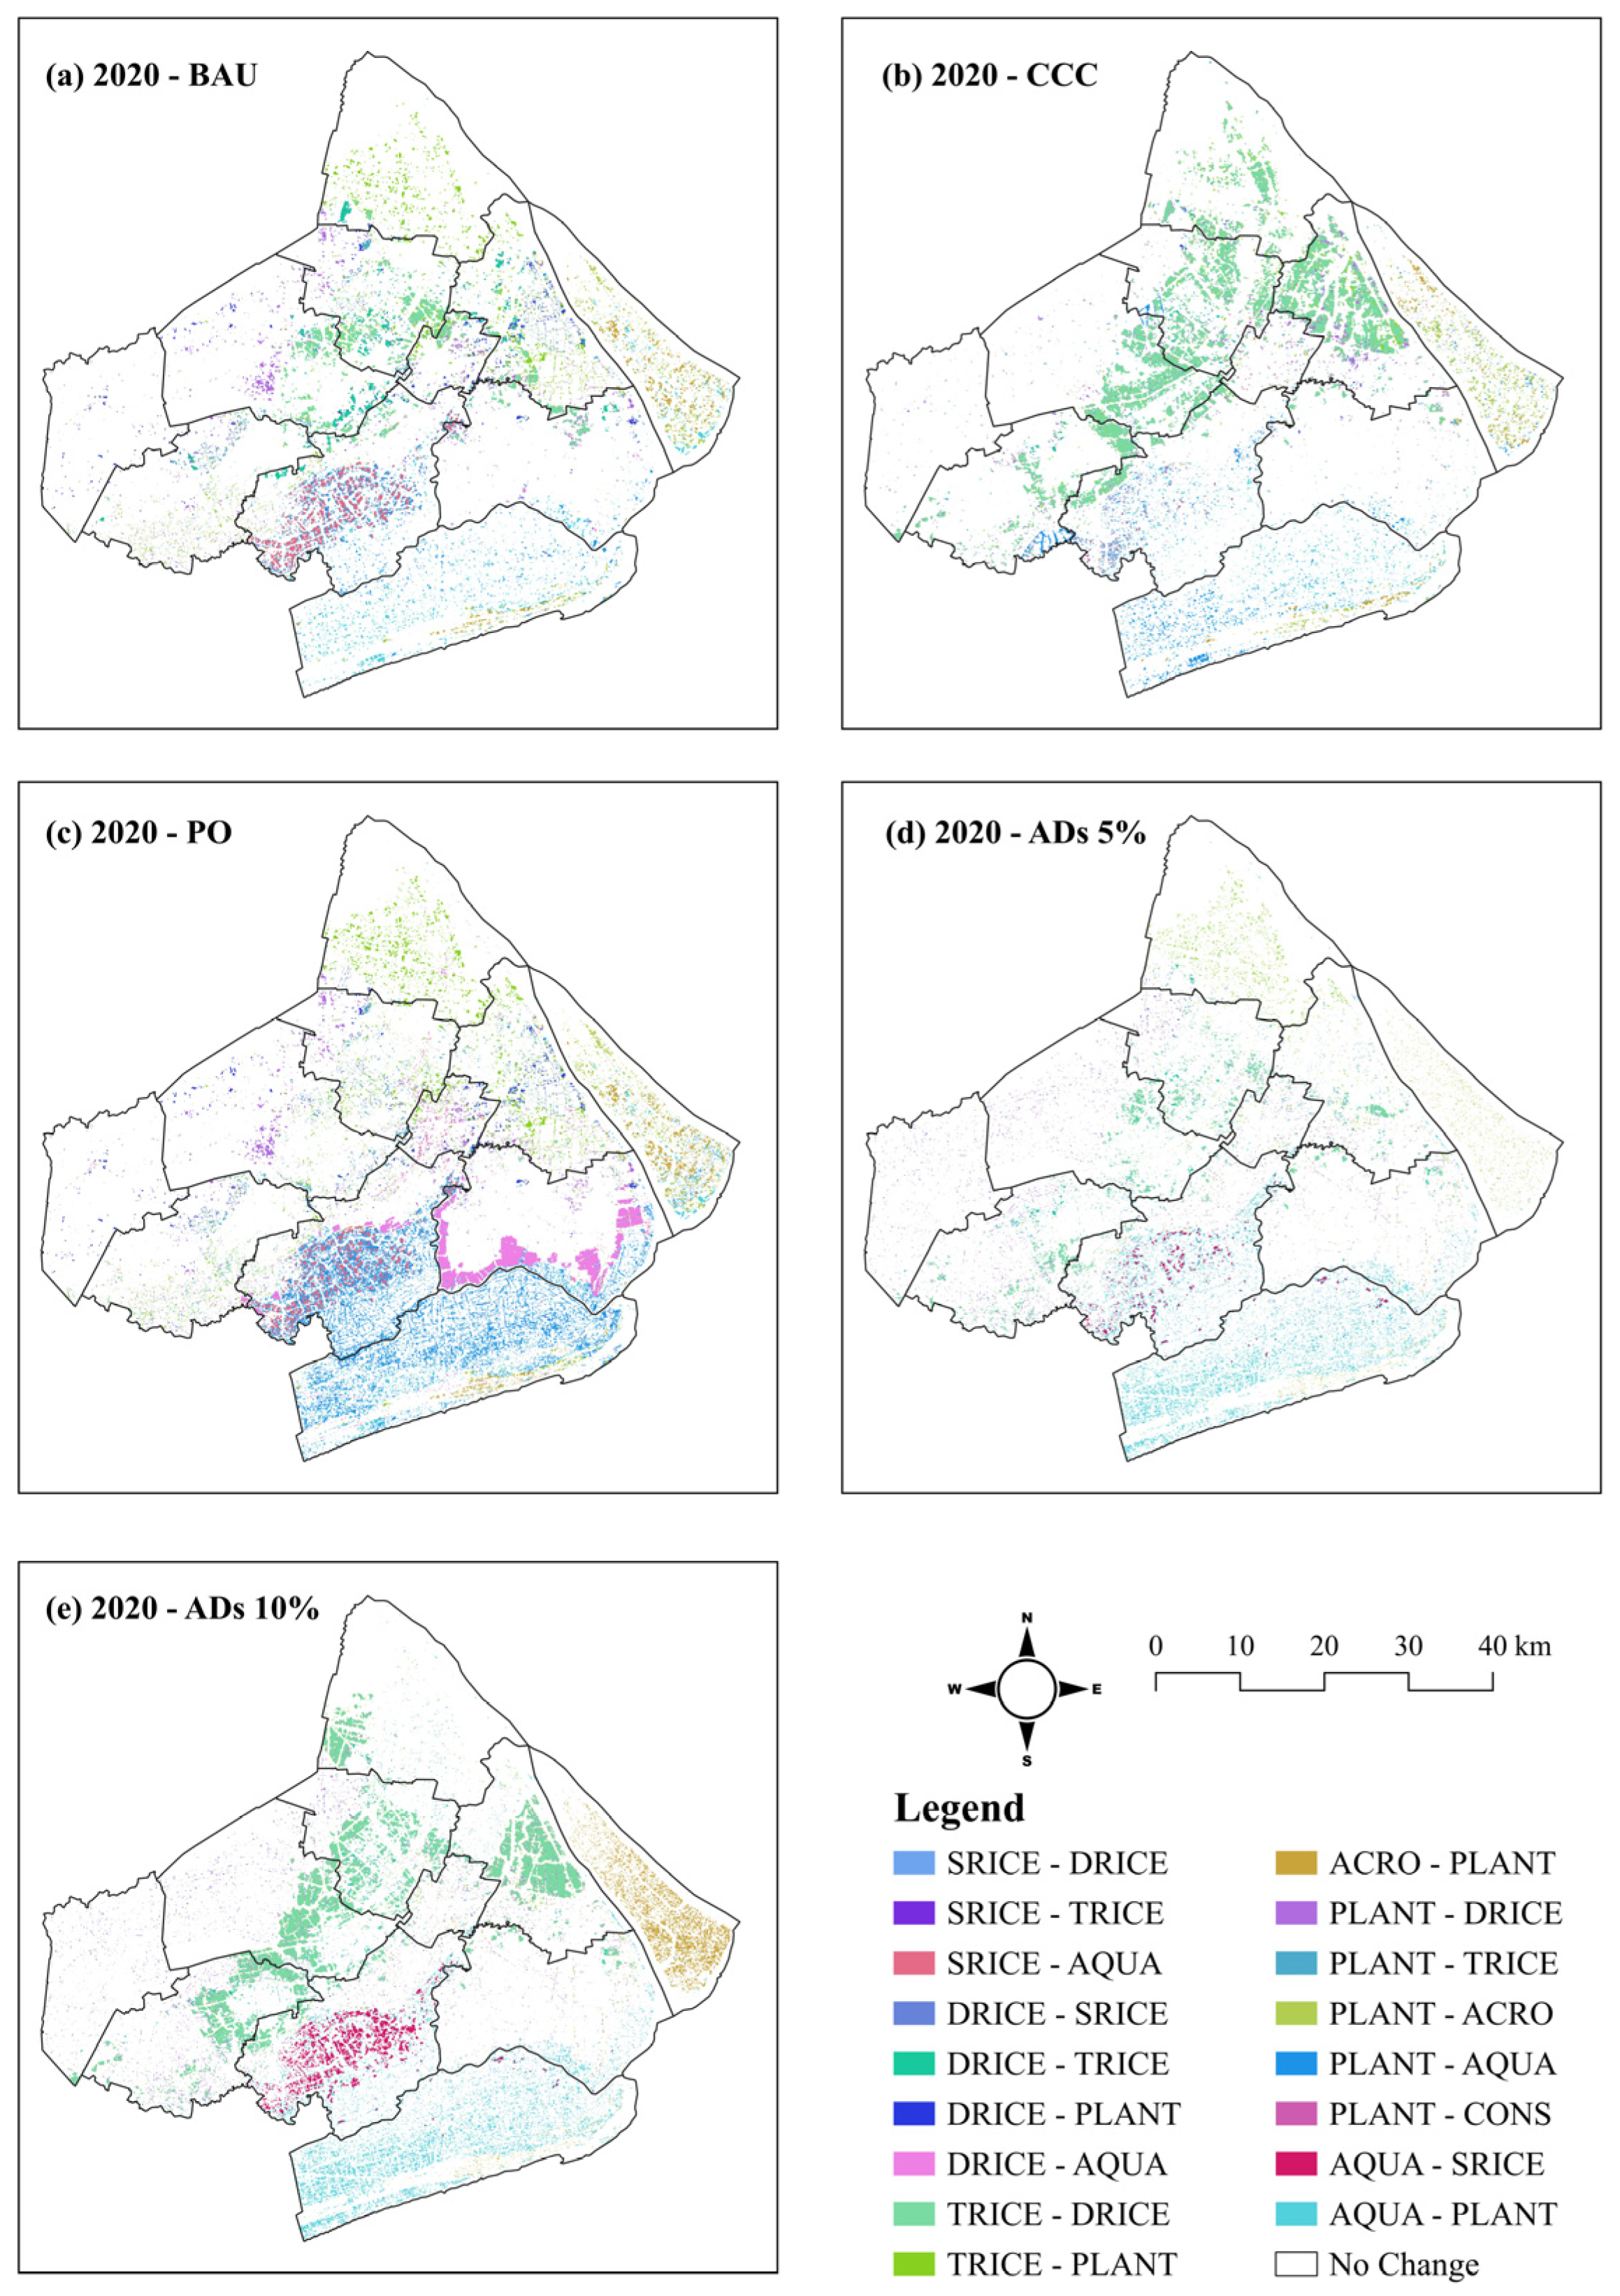
3.2. Future LULC in 2030

The LULC prediction model is composed of twelve variables (Table 1). The most significant contributors are proximity to urban areas, proximity to coastline, temperature, slope, elevation, and precipitation (Table A1). The annual freshwater crops (i.e., PLANT, DRICE, TRICE, and ACRO) are strongly influenced by natural and climate conditions such as temperature, precipitation, slope, elevation, and distance to the coastline. Accessibility to rivers is also an important factor for other annual crops as they are related to water supply. Meanwhile, the spatial simulation of brackish systems (i.e., SRICE and AQUA) is regulated by proximity to rivers and population density, alongside other common natural and climatic factors. Urban expansion is significantly controlled by proximity to former urban areas, elevation, population density, and slope. The fitted model achieves a high confidence level of 86.43%, which is collated with the true LULC map in 2020 for future LULC prediction. The spatial distribution of simulated LULC and LULCC compared to 2020 are shown in Figure A2 and Figure 5, respectively.

3.2.1. Natural Growth (BAU)

In the BAU scenario, extending the current LULCC trends, approximately 26,737 ha (~8.10%) will be affected by the LULCC in 2030 (Figure 5a and Table 5 and Table A2). In terms of converted areas, the most prominent transition will be an enlargement of DRICE by nearly 10,000 ha to reach an area of 90,255.7 ha, corresponding to 37.4% of converted areas and +1.25%/year. The TRICE area of 33,882.2 ha will reflect a reduction of −9581.3 ha, which is a projected annual decline rate of −2.2%/year, which is higher than that of DRICE. ACRO is expected to decrease by 2777.3 ha, resulting in a total area of 5935.7 ha. Although the SRICE converted area will represent only 3.8%, its transition rate is concerning, showing a sharp decline of 60.88% and −6.09%/year. In contrast, about ~1500 ha of each PLANT and AQUA will be added to the current LULC structure to reach 128,455.4 ha and 35,643.2 ha, respectively. It should be noted that the urban development rate under this scenario will be moderate at 0.95%/year.

3.2.2. Climate Change Challenges (CCC)

This scenario indicates that temperature and precipitation dramatically contribute to LULC patterns (Table A1). These extreme impacts will adjust 24.22% of the total area, approximately 79,926.1 ha (Figure 5b, Table 5 and Table A2). Up to 56.4% of the current TRICE and 32.13% of DRICE in 2020 will be affected by climate change challenges, which are relevant to 30.7% and 32.3% of the total converted area. Despite a decrease in SRICE areas, the decline will occur at a relatively low rate (approximately 3.58%/year). Brackish AQUA is projected to surpass 46,062.7 ha, increasing its share to 13.96% in the total LULC structure. Under the limited conditions of climate- and water-related problems, PLANT and ACRO will in turn reduce by 1.16% and 0.24%/year. The urban expansion is roughly estimated at an average rate of 6.19%/year.

3.2.3. Profit Optimization (PO)

To optimize return profits, the LULC patterns will witness a moderate transition in 16.03% of the total area, about 52,884 ha (Figure 5c, Table 5 and Table A2). The transitions of the rice systems (e.g., DRICE, TRICE, and SRICE) will remain at a relatively slow rate compared to the BAU and CCC scenarios. The conversion from TRICE will be limited to −1.05%/year. Despite a decrease in DRICE, it needs only a modest value of −0.49%/year to keep the current cultivation area relatively stable. About 586 ha (35.33%) of SRICE will be mostly converted to AQUA. More specifically, an explosion of AQUA will be consistently observed, which is equivalent to an appropriation of 6.68%/year on SRICE in My Xuyen and other LULC categories in Cu Lao Dung and transition zones between freshwater and brackish water regions in Tran De and My Xuyen districts (Table 5 and Figure 5c). The AQUA area is projected to reach 56.986.6 ha. Urban development will be the most rapid growth compared to other scenarios, equivalent to 9.9%/year.

3.2.4. Adaptive Solutions (ADs)

Freshwater-related farming systems will be limited and transformed to other more adaptive land use purposes in the ADs scenarios. DRICE and PLANT are prioritized instead of TRICE and ACRO to enhance saline and drought resilience (Figure 5d,e). Brackish AQUA holds significant economic value and may initially appear advantageous in saline intrusion. The impacts of climate change may increase this farming’s vulnerability. Therefore, AQUA areas will decrease in the future. Under the moderate transition ADs (5%), it suggests that TRICE will narrow by about 40.13% to approach 26,023.2 ha, while this area will significantly reduce to 15,154.5 ha under the rapid transition scenario (Table 5 and Table A2). On the contrary, DRICE and SRICE will increase accordingly. DRICE accounts for 13.17% of the current agricultural structures, which will dramatically expand to 29.82% and 31.45% in the moderate and rapid transition scenarios, respectively. SRICE will hold the same increasing trend but with a remarkable transition rate, having 2315.8 ha (moderate transition) and 6102.5 ha (rapid transition). The moderate transition will intervene in 13,706.6 ha of AQUA, while the latter will have nearly double effects (Table A2). Similarly, the rapid transition will extensively modify ACRO, approximately 27.77% of the ACRO area, while the impacts of moderate transition seem marginal. Urban development under both subscenarios will be moderate at a level of 6.13 and 6.4%.

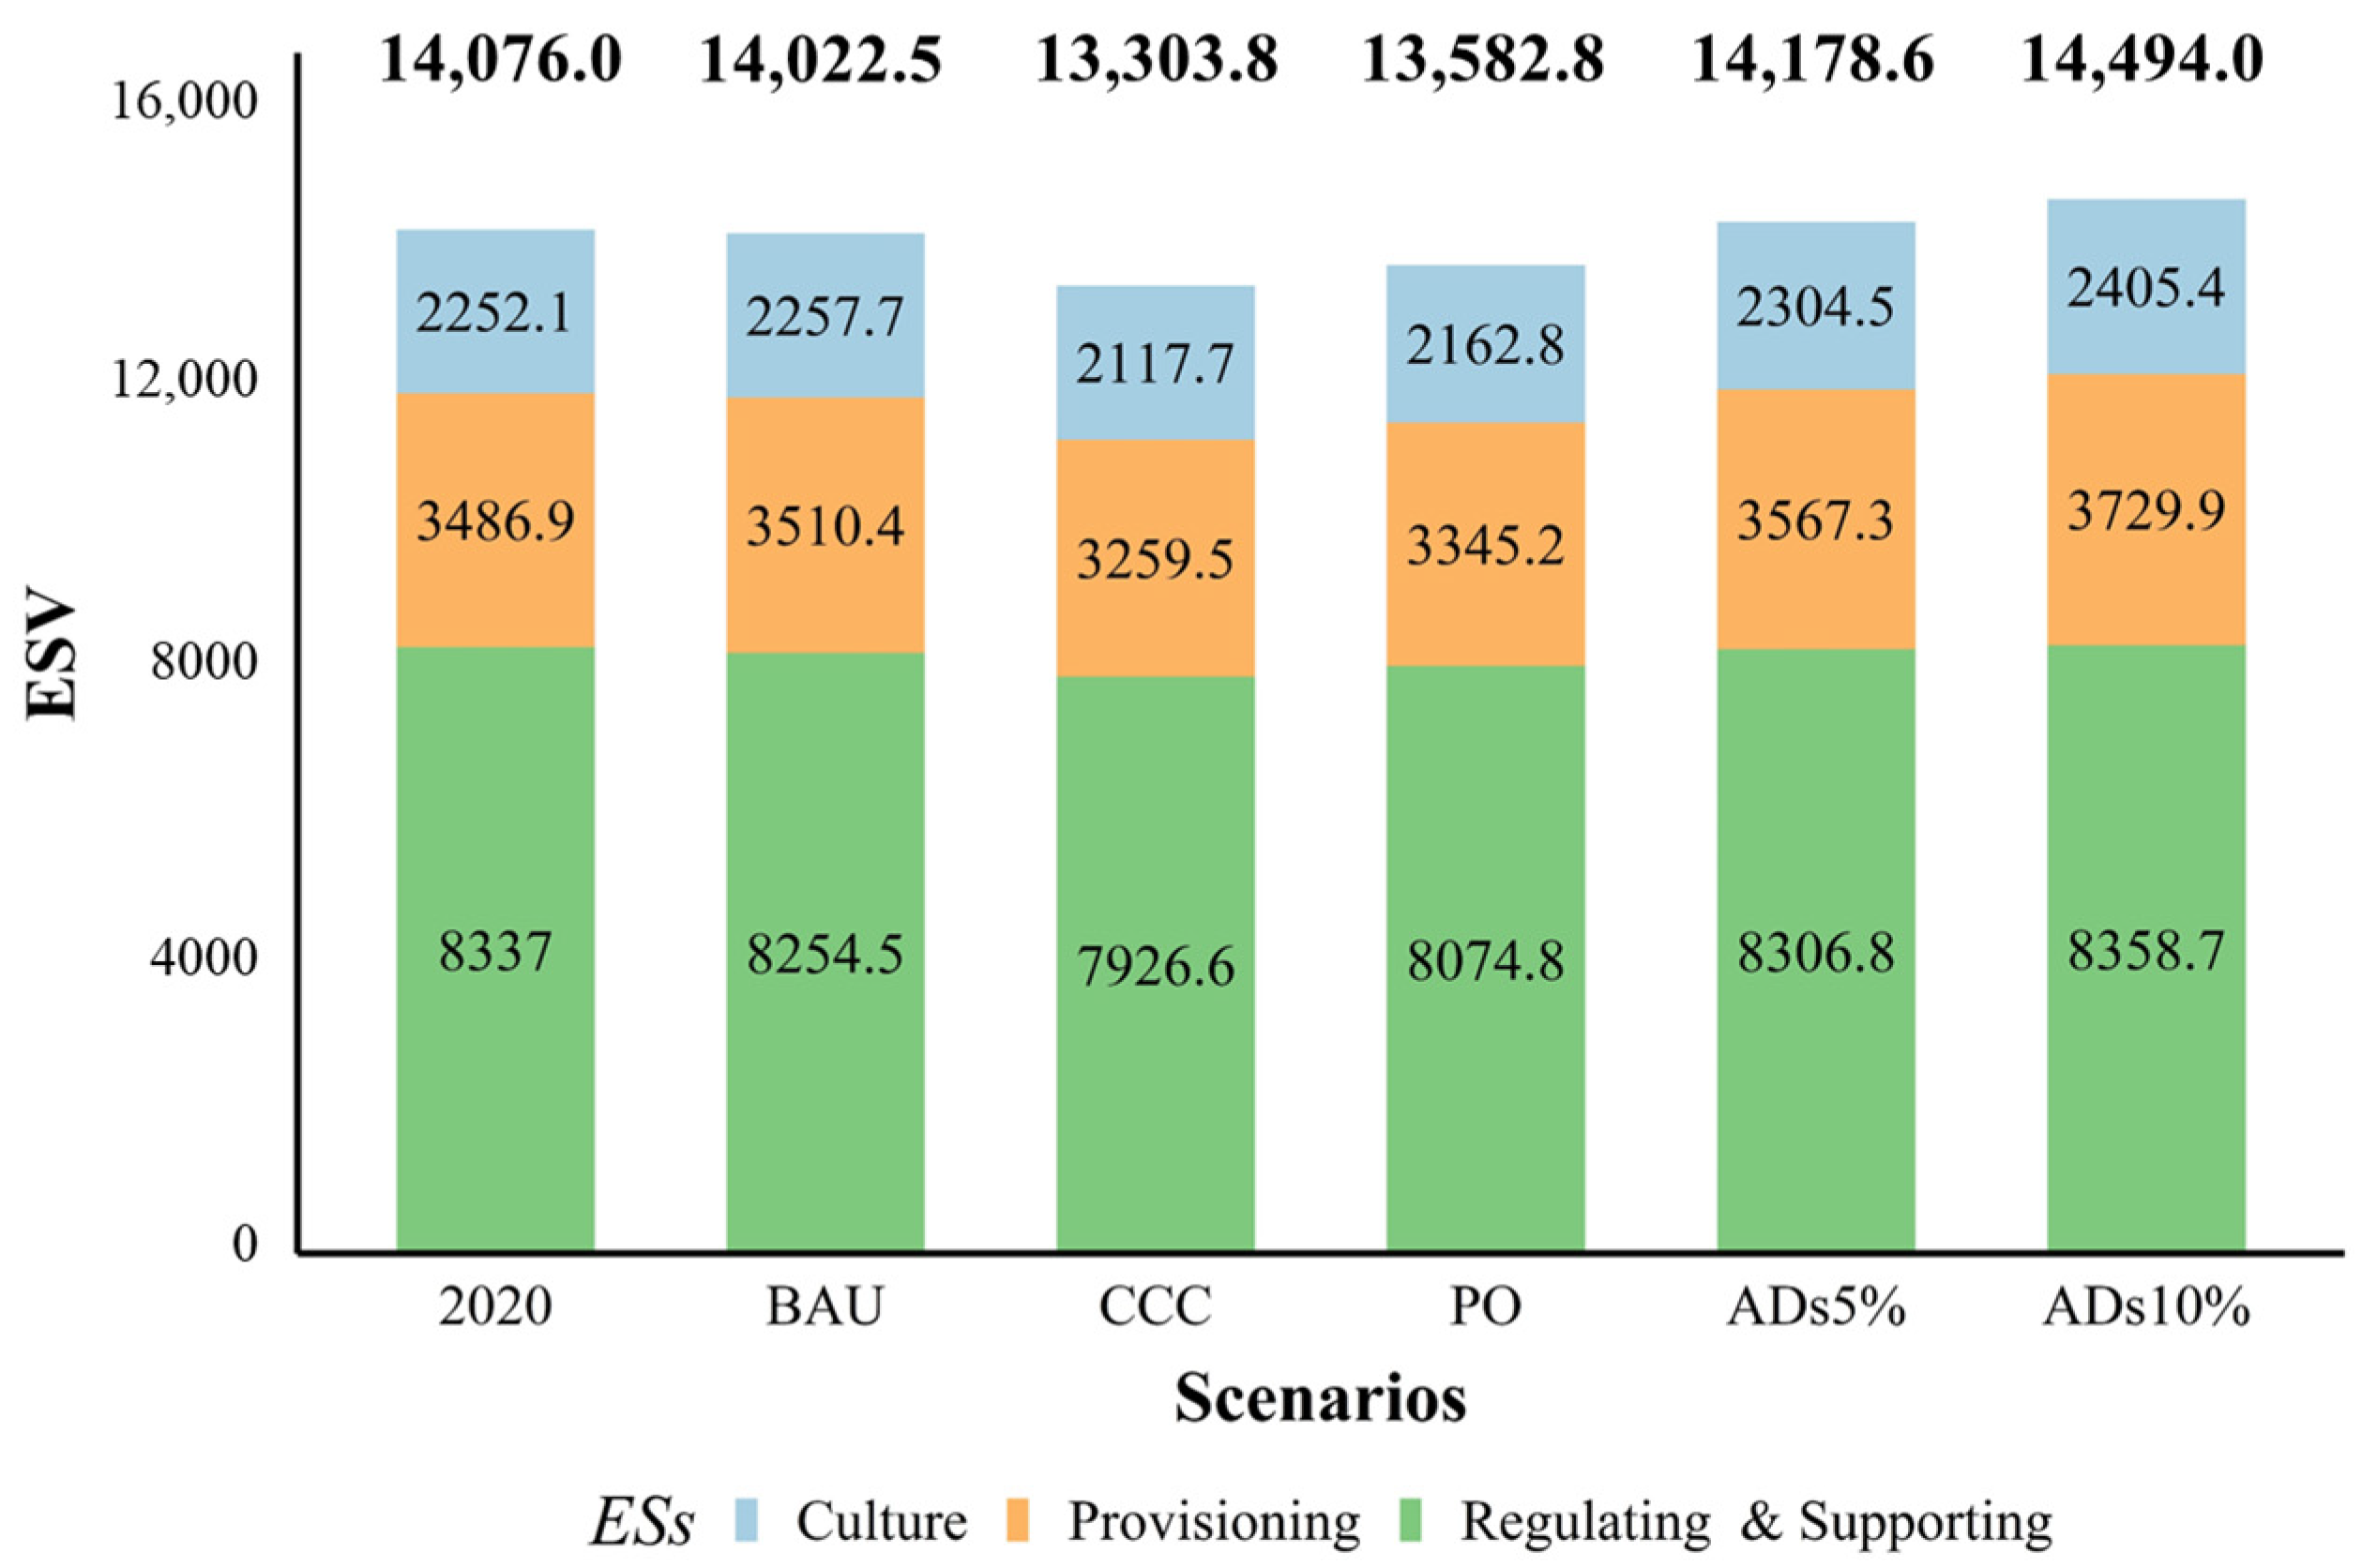
3.3. Changes in Economic and Ecosystem Service Values

The current economic value of agricultural models is estimated based on Equation (4) and reference values in Table 3, which shows a total value of USD 1792 million for the whole agricultural system. It will increase by USD 8.88 million in 2030 under BAU. Despite possible climate change barriers to agricultural production, LULC changes under the scenario to adapt to climate change still deliver a relatively high economic value, which will grow by USD 36.11 million to reach USD 1828.1 million. The highest economic value will apparently benefit from the PO scenario, consolidating the current economy to USD 1923.5 million. The trade-offs of the ADs scenarios are economic contraction by 5.32% and 9.04% compared to the current status under the moderate and rapid transition scenarios.
The estimation of ESV reveals that the current LULC systems potentially delivered USD 14,076 million in 2020 (Figure 6). It is constituted by 59.2% regulating and supporting services, while provisioning and cultural services are related to 24.8% and 16.0%, respectively. BAU will slightly shrink the ecological assets by USD 53.5 million. It will stimulate provisioning and cultural services by increasing by 0.67% and 0.25%, respectively. Yet, the regulating and supporting services will witness a 1.0% decrease in cumulative values. It holds the same for the climate change scenario. The ESV is projected to decline further and stabilize at USD 13,303.8 million—a cumulative decrease of about USD 772.2 million. It reveals a decline across all services, with regulating and supporting services dominating more than half of the total value loss. The PO scenario will also lead to a reduction in all services; however, the decline in ESV is more moderate (approximately 64%) compared to the more severe impact observed in the climate change scenario. The estimated ESV will stabilize at USD 13,582.8 million. On the contrary, the ADs scenarios will improve the total ESV to achieve USD 14,178.6 and USD 14,494.0 million in the moderate and rapid transition scenarios, respectively. Despite improvements in the total ESV observed, the moderate transition cannot enhance regulating and supporting services. In contrast, the rapid transition scenario indicates a more stabilized state for regulating and supporting services, with an increase of USD 21.7 million while significantly enhancing provisioning and cultural services to levels approximately three times higher than those observed in the moderate transition scenario.

4. Discussion

LULC systems in the coastal area of the Vietnam Mekong Delta are relatively dynamics and sensitive to climate changes, human inputs, and even other natural–socioeconomic factors. Our efforts are investigations of historical LULCC to uncover hidden trajectories and support the simulation of possible LULC in the future under diverse scenarios, which represent different development pathways for the province. In addition to economic values, ecosystem service values are also adopted as a more comprehensive proxy to consider among the scenarios and come up with more appropriate development visions.

4.1. Driving Forces of Coastal LULCC

The coastal province of Soc Trang has experienced notable LULC changes from 2010 to 2020, which reflect a shift from traditional intensive agricultural practices towards farming models better adapted to droughts and saline intrusions, such as DRICE, PLANT, and brackish AQUA (Figure 2). The transitions are more prominent in coastal counties than in hinterland units. The “oasis” of Tran De is an exception because the current DRICE benefits from a complete saline prevention sluice system. The natural and climatic conditions and constraints are consistently imprinted in the coastal transitions (Table A2). Temperature and precipitation are among the most significant contributors because they reflect drought conditions and water supply associated with crop yield [81]. Although located next to the river, with its downstream location, this area is frequently affected by freshwater shortages during the dry season, when the flow of the Mekong River is at its lowest point. Therefore, proximity to rivers and dikes significantly explains the LULCC regarding water availability and management manners. Meanwhile, proximity to the coastline strongly regulates spatial patterns of LULC as they are directly linked to salinity conditions. For instance, brackish AQUA embraces SRICE and rice fields in the inland areas. It may be indirect, but the population contributes to LULCC. Ethnic minorities have experience cultivating DRICE, artisanal shrimp, vegetables, and other ACRO on coastal sandy soil. They face higher vulnerability to the unstable market and climate change impacts. Other social and market factors may highly stimulate the transitions in smallholder farmers, but they have not yet been considered in this study.

4.2. Benefits and Trade-Offs from LULC Scenarios

The scenarios were proposed to overcome challenges and achieve specific targets. For example, the CCC scenario is used to deal with future climate constraints, while the PO scenario is to enhance economic returns. The ADs scenarios suggest different pathways to improve resilience. They propose changing the current LULC to more tolerant farming practices. For instance, DRICE is more appropriate to an increasing drought and water scarcity than TRICE, thereby maintaining household livelihoods in the face of diverse emerging challenges. BAU can bring relatively stable economic returns. Integrating climate change resilience and profit optimization systems will promisingly increase the scale of the economy to achieve the maximum value. When land use resilience is prioritized, a significant economic trade-off between economic values and ecosystem service values may arise proportional to the ambition of achieving the goal.
Only 8.1% of the area will experience transitions under BAU in 2030. However, the other scenarios require progressively larger transition areas, ranging from profit optimization to the ADs (moderate transition), climate change, and the ADs (rapid transition) (Table 5 and Table A2). This means that large areas and more farmers will be affected by these transitions. They have to face numerous challenges associated with transitioning, such as new skills and knowledge requirements and initial investments. Meanwhile, the adaptability of local farmers and ethnic minorities could pose critical barriers that should be carefully considered to ensure that such land use plans are implementable in the future.
The climate change scenario will mainly influence inland regions (e.g., My Tu, Chau Thanh, and Long Phu districts). The PO scenario will intervene in the coastal zones of My Xuyen, Tran De, and Cu Lao Dung districts. It holds the same for the ADs (moderate transition), which will likely shift the coastal LULC. Meanwhile, the ADs rapid transition will amplify in coastal and inland areas. Yet, these impacts are likely localized compared to their twin. The coastal and central-inland areas will be frequently affected by all scenarios (Figure 7).
This research gives three aspects to simultaneously consider during land use planning, including affected area, economic returns, and ecosystem service values. The AD (rapid transition) scenario will yield the highest value, but it will affect the most extensive area with the lowest economic returns. In contrast, the PO scenario provides the best economic performance, but it is the worst case for ecological consequence. It means that we always face at least one problem, while it is likely that no single scenario can address all aspects. Therefore, we should combine scenarios to better balance economic growth, maintain ecological sustainability, and minimize affected areas. Land use planners and local governments should thoroughly consider both the regions and indigenous communities likely to be highly impacted under each scenario and the overall composite of all scenarios in future decisions. These findings can offer valuable insights into regions most prone to LULCC, enabling the development of impact assessments and appropriate preparation plans to safeguard livelihoods and enhance adaptability.

4.3. Mainstreaming ESS in Land Use Planning

The economic values provide a relatively optimistic outlook throughout all scenarios except for the ADs scenarios. Economic value only takes direct products into account, while other ecosystem services are ignored. The opposite trend was only revealed through ESS assessments (Section 3.3), when the most economically valuable scenario (PO scenario) faces a degradation of ecological assets. The shrinking was also observed across the scenarios except for the ADs scenarios, especially in regulating and supporting services. Meanwhile, these ESS are critical for the coastal ecosystem that is sensitive and vulnerable to the natural disasters, drought, and saline intrusion experienced in recent years. Inadequate decisions can severely impact the entire system. Therefore, it clearly demonstrates that it is necessary to integrate ESS into the decision-making process to ensure a balance between economic and ecological goals towards sustainable development.
Development scenarios can be achieved by intervening in different regions and LULC units while having potential trade-offs between economic vision and ecological resilience. In practice, we frequently aim for multiple development purposes rather than each individual goal. All scenarios and goals should be carefully considered as part of a comprehensive assessment to accomplish the final suitable development directions. The research findings can assist in spatially describing the current development target proposed by the local authorities. It helps them to have an overview of the areas likely to be affected along with each goal while highlighting that the current proposed economic targets may be ambitious, as they could interfere with a large part of current LULC and communities.

4.4. Research Limitations and Future Research

The research efforts range from historical analyses to future simulations of LULCC in 2030 under the scenarios to provide diverse developmental perspectives. Many works have been conducted by incorporating various data sources and information, from primary to secondary, and local stakeholders to visually depict the provincial planning vision. This work can play a critical role in future planning processes as scientific evidence to consider among the development scenarios. Yet, it does have certain limitations because of the current data sources and assumptions. Firstly, we adopted different LULC classification concepts within the research period to obtain the best results based on the available satellite data. However, they are basically disparate in terms of spectral information and spatial resolution, which may lead to a biased comparison in LULCC analyses. Data fusion can be an option to leverage the strength of each data source for more consistent observations. Secondly, this research mainly stands on some assumptions and simplifications. For example, the adaptive solution scenario is divided into two subscenarios because it is only a development orientation considered recently by the local government. Meanwhile, there is no supporting information on this concern. This scenario, to some extent, is relatively uncertain, and it needs more specific information, particularly in terms of quantitative targets, for it to better be realized. Moreover, a critical part in the profit optimization scenario has been diminished in this study, which is technology upgrades. It even considerably contributes to the total values compared to spatial changes. It is currently beyond the scope of this study. Nonetheless, future research could simultaneously consider spatial, technological, and social aspects to optimize economic returns by locating suitable areas for high-tech investments tailored to specific farming models (e.g., high-tech rice and shrimp).

5. Conclusions

LULCC in Soc Trang Province from 2010 to 2020 occurred across 32.41% of the provincial area. The most highlighted transitions were from TRICE to DRICE, from SRICE to AQUA, and the expansion of PLANT. These transitions are mainly driven by temperature, precipitation, distance to coastline and rivers, and population.
The future LULCC under development scenarios revealed different spatial patterns and dynamics depending on the development targets in 2030 of each scenario. BAU emphasizes modest LULCC patterns. The CCC and PO scenarios indicate better economic returns, but the trade-offs are low ecosystem service values. Meanwhile, the ADs scenarios are the most ecologically friendly development pathways, but the region will have to face economic constraints along with a large affected area compared to other scenarios.
By mainstreaming ecosystem services while taking into account affected areas and economic values, this approach enables policymakers to better weigh the benefits and trade-offs of different development pathways for future land use planning, aiming to balance economic gains with ecological sustainability. This study identifies different areas that may be affected under different scenarios and common areas affected collectively under all scenarios (i.e., mostly the coastal and central-inland areas). These regions require in-depth social and comprehensive studies to better prepare for future LULC changes, aiming to minimize social disruption and promote more sustainable and resilient landscapes in coastal areas.

Author Contributions

N.T.H.D.: Conceptualization, methodology, writing—review and editing, funding acquisition, project administration, supervision; N.T.N.: methodology, data curation, investigation, formal analysis, validation; visualization, writing—review and editing; P.K.D.: conceptualization, methodology, writing—original draft, writing—review and editing; C.T.N.: conceptualization, methodology, formal analysis, visualization, writing—original draft, writing—review and editing. All authors have read and agreed to the published version of the manuscript.

Funding

This research received financial support from the Ministry of Education and Training (MOET) of Vietnam under the project B2023-TCT-09.

Data Availability Statement

Data are contained within the article and corresponding Appendix A.

Acknowledgments

In addition to the funder, we would like to thank the Department of Natural Resources and Environment, Department of Agriculture and Rural Development in Soc Trang Province, and local stakeholders for their valuable information and local agricultural development strategies.

Conflicts of Interest

The authors declare no conflicts of interest.

Appendix A

Table A1. Contribution of driving forces to each LULC type in the simulation model.
Driving ForcesSRICEDRICETRICEACROPLANTAQUAWATCONSFORTotal
Distance to coastline0.0730.0900.1200.1000.1160.1350.0700.0200.4381.162
Elevation0.0980.0900.0900.0740.1130.1260.2400.0600.0800.971
Distance to dikes0.0800.0700.0500.0480.0800.0700.0500.0300.0200.498
Distance to urban centers0.0680.0860.0900.0600.1360.0720.0980.5640.0501.224
Population0.0970.0670.0700.0670.0720.1040.0790.0560.0420.653
Precipitation0.0670.1670.1290.1000.1100.1360.0860.0600.0160.871
Distance to rivers0.0950.0610.0460.0760.0600.0730.0480.0480.0100.516
Distance to roads0.0470.0530.0840.0500.0500.0290.0600.0430.0080.423
Salinity0.0100.0550.0300.1300.0150.0070.0180.0040.0200.289
Slope0.1290.1000.0900.0700.1340.1000.0970.0500.2190.988
Soil type0.0150.0120.0120.0150.0130.0980.0600.0140.0290.268
Temperature0.2180.1420.1700.2000.0850.1300.0900.0290.0501.114
Table A2. Extended table of changed area and proportion in each scenario compared to the current LULC in 2020.
LULCCurrent Area (ha)Converted Area (ha)Proportion of Converted Area (%)
2020BAUCCCPOADs-5%ADs-10%BAUCCCPOADs-5%ADs-10%
SRICE1659−1010−594−58665744443.80.71.11.04.2
DRICE80,261999525,786−389918,13623,53837.432.37.428.722.2
TRICE43,464−9581−24,512−4570−17,440−28,30935.830.78.627.626.7
ACRO8713−2777−211−2319−400−242010.40.34.40.62.3
PLANT126,9131542−14,660−15,06810,51622,6605.818.328.516.721.4
AQUA34,159148411,90422,828−13,707−22,2495.614.943.221.721.0
WAT20,3970000000000
CONS365234722603615223923351.32.86.83.52.2
FOR87600000000000
Total absolute area change (ha)26,73779,92652,88463,094105,954
Figure A1. Historical LULC maps delineated from remote sensing-based data in 2010, 2015, and 2020 in Soc Trang Province.
Land 14 01063 g0a1
Figure A2. Spatial distribution of simulated LULC maps in 2030 in Soc Trang Province under disparate scenarios: (a) business as usual (BAU), (b) climate change challenge, (c) profit optimization, (d) adaptative solution (moderate transition), and (e) adaptative solution (rapid transition).
Land 14 01063 g0a2

References

  1. Lau, J.D.; Hicks, C.C.; Gurney, G.G.; Cinner, J.E. What Matters to Whom and Why? Understanding the Importance of Coastal Ecosystem Services in Developing Coastal Communities. Ecosyst. Serv. 2019, 35, 219–230. [Google Scholar] [CrossRef]
  2. Le, H.M.; Ludwig, M. The Salinization of Agricultural Hubs: Impact of and Adjustment to Intensifying Saltwater Intrusion in the Mekong Delta. In Proceedings of the Beiträge zur Jahrestagung des Vereins für Socialpolitik 2022: Big Data in Economics, Basel, Switzerland, 11–14 September 2022; ZBW—Leibniz Information Centre for Economics: Kiel, Hamburg, 2022. [Google Scholar]
  3. Joffre, O.; Prein, M.; Tung, P.B.V.; Saha, S.B.; Hao, N.V.; Alam, M.J. Evolution of Shrimp Aquaculture Systems in the Coastal Zones of Bangladesh and Vietnam: A Comparison. In Tropical Deltas and Coastal Zones: Food Production, Communities and Environment at the Land and Water Interface; CABI: Wallingford, UK, 2010; pp. 48–63. [Google Scholar]
  4. Thanh, B.N.; Le Van Thuy, T.; Nguyen Anh, M.; Nguyen Nguyen, M.; Nguyen Hieu, T. Drivers of Agricultural Transformation in the Coastal Areas of the Vietnamese Mekong Delta. Environ. Sci. Policy 2021, 122, 49–58. [Google Scholar] [CrossRef]
  5. Mehvar, S.; Filatova, T.; Dastgheib, A.; Steveninck, E.D.R.V.; Ranasinghe, R. Quantifying Economic Value of Coastal Ecosystem Services: A Review. J. Mar. Sci. Eng. 2018, 6, 5. [Google Scholar] [CrossRef]
  6. Rao, N.S.; Ghermandi, A.; Portela, R.; Wang, X. Global Values of Coastal Ecosystem Services: A Spatial Economic Analysis of Shoreline Protection Values. Ecosyst. Serv. 2015, 11, 95–105. [Google Scholar] [CrossRef]
  7. Barbier, E.B.; Hacker, S.D.; Kennedy, C.; Koch, E.W.; Stier, A.C.; Silliman, B.R. The Value of Estuarine and Coastal Ecosystem Services. Ecol. Monogr. 2011, 81, 169–193. [Google Scholar] [CrossRef]
  8. Nguyen, C.T.; Downes, N.K.; Sitthi, A.; Losiri, C. Tourism-Induced Land Use Transformations, Urbanisation, and Habitat Degradation in the Phu Quoc Special Economic Zone. Urban Sci. 2025, 9, 11. [Google Scholar] [CrossRef]
  9. Neumann, B.; Ott, K.; Kenchington, R. Strong Sustainability in Coastal Areas: A Conceptual Interpretation of SDG 14. Sustain. Sci. 2017, 12, 1019–1035. [Google Scholar] [CrossRef]
  10. Hernández-Delgado, E.A. The Emerging Threats of Climate Change on Tropical Coastal Ecosystem Services, Public Health, Local Economies and Livelihood Sustainability of Small Islands: Cumulative Impacts and Synergies. Mar. Pollut. Bull. 2015, 101, 5–28. [Google Scholar] [CrossRef] [PubMed]
  11. Klein, R.J.T.; Nicholls, R.J. Assessment of Coastal Vulnerability to Climate Change. Ambio 1999, 28, 182–187. [Google Scholar]
  12. Diem, P.K.; Diem, N.K.; Nguyen, C.T.; Minh, V.Q. Impacts of Extreme Drought on Rice Planting Calendar in Vietnamese Mekong Delta. Paddy Water Environ. 2024, 22, 139–153. [Google Scholar] [CrossRef]
  13. Pham, T.D.; Nguyen, D.T.H.; Nguyen, C.T. Drought Assessment in Paddy Rice Fields Using Multi-Temporal SAR Data of Sentinel-1: A Case Study in Tra Vinh Province. In Applied Geography and Geoinformatics for Sustainable Development. Springer Geography; Boonpook, W., Lin, Z., Downes, N.K., Truong, Q.C., Eds.; Springer: Cham, Switzerland, 2025; pp. 97–113. [Google Scholar]
  14. Nguyen, C.T.; Kaewthongrach, R.; Channumsin, S.; Chongcheawchamnan, M.; Phan, T.N.; Niammuad, D. A Regional Assessment of Ecological Environment Quality in Thailand Special Economic Zone: Spatial Heterogeneous Influences and Future Prediction. Land Degrad. Dev. 2023, 34, 5770–5787. [Google Scholar] [CrossRef]
  15. Ferrol-Schulte, D.; Wolff, M.; Ferse, S.; Glaser, M. Sustainable Livelihoods Approach in Tropical Coastal and Marine Social-Ecological Systems: A Review. Mar. Policy 2013, 42, 253–258. [Google Scholar] [CrossRef]
  16. Landa, D.E.L.; Bueno, C.V.G. “Climate Change Might Have Caused Our Small Harvest”: Indigenous Vulnerability, Livelihoods, and Environmental Changes in Lowland and High Jungle Indigenous Communities in Peru. J. Environ. Stud. Sci. 2022, 12, 216–231. [Google Scholar] [CrossRef] [PubMed]
  17. Tran, D.D.; Dang, M.M.; Du Duong, B.; Sea, W.; Vo, T.T. Livelihood Vulnerability and Adaptability of Coastal Communities to Extreme Drought and Salinity Intrusion in the Vietnamese Mekong Delta. Int. J. Disaster Risk Reduct. 2021, 57, 102183. [Google Scholar] [CrossRef]
  18. Huq, N.; Hugé, J.; Boon, E.; Gain, A.K. Climate Change Impacts in Agricultural Communities in Rural Areas of Coastal Bangladesh: A Tale of Many Stories. Sustainability 2015, 7, 8438–8460. [Google Scholar] [CrossRef]
  19. Phuong, L.T.H.; Biesbroek, G.R.; Sen, L.T.H.; Wals, A.E.J. Understanding Smallholder Farmers’ Capacity to Respond to Climate Change in a Coastal Community in Central Vietnam. Clim. Dev. 2018, 10, 701–716. [Google Scholar] [CrossRef]
  20. Nguyen, P.C.; Vu, P.T.; Khuong, N.Q.; Minh, H.V.T.; Vo, H.A. Saltwater Intrusion and Agricultural Land Use Change in Nga Nam, Soc Trang, Vietnam. Resources 2024, 13, 18. [Google Scholar] [CrossRef]
  21. Nguyen, M.T.; Renaud, F.G.; Sebesvari, Z. Drivers of Change and Adaptation Pathways of Agricultural Systems Facing Increased Salinity Intrusion in Coastal Areas of the Mekong and Red River Deltas in Vietnam. Environ. Sci. Policy 2019, 92, 331–348. [Google Scholar] [CrossRef]
  22. Nghia, B.P.Q.; Pal, I.; Chollacoop, N.; Nguyen, L.H.; Van Thinh, L.; Tuan, T.M.; Van Tuong, N. Integrated Approach for Drought and Saline Intrusion Severity Assessment on the Coastal Mekong Delta of Vietnam Contextualizing Physical Change to Risk Management and Policy Development. Prog. Disaster Sci. 2024, 23, 100338. [Google Scholar] [CrossRef]
  23. Hong, H.T.C.; Avtar, R.; Fujii, M. Monitoring Changes in Land Use and Distribution of Mangroves in the Southeastern Part of the Mekong River Delta, Vietnam. Trop. Ecol. 2019, 60, 552–565. [Google Scholar] [CrossRef]
  24. Sakamoto, T.; Van Phung, C.; Kotera, A.; Nguyen, K.D.; Yokozawa, M. Analysis of Rapid Expansion of Inland Aquaculture and Triple Rice-Cropping Areas in a Coastal Area of the Vietnamese Mekong Delta Using MODIS Time-Series Imagery. Landsc. Urban Plan. 2009, 92, 34–46. [Google Scholar] [CrossRef]
  25. Kruse, J.; Koch, M.; Khoi, C.M.; Braun, G.; Sebesvari, Z.; Amelung, W. Land Use Change from Permanent Rice to Alternating Rice-Shrimp or Permanent Shrimp in the Coastal Mekong Delta, Vietnam: Changes in the Nutrient Status and Binding Forms. Sci. Total Environ. 2020, 703, 134758. [Google Scholar] [CrossRef] [PubMed]
  26. Tinh, P.H.; MacKenzie, R.A.; Hung, T.D.; Van Vinh, T.; Ha, H.T.; Lam, M.H.; Hanh, N.T.H.; Tung, N.X.; Hai, P.M.; Huyen, B.T. Mangrove Restoration in Vietnamese Mekong Delta during 2015–2020: Achievements and Challenges. Front. Mar. Sci. 2022, 9, 1043943. [Google Scholar] [CrossRef]
  27. Liu, S.; Li, X.; Chen, D.; Duan, Y.; Ji, H.; Zhang, L.; Chai, Q.; Hu, X. Understanding Land Use/Land Cover Dynamics and Impacts of Human Activities in the Mekong Delta over the Last 40 Years. Glob. Ecol. Conserv. 2020, 22, e00991. [Google Scholar] [CrossRef]
  28. Truong, Q.C.; Gaudou, B.; Van Danh, M.; Quang Huynh, N.; Drogoul, A.; Taillandier, P. A Land-Use Change Model to Study Climate Change Adaptation Strategies in the Mekong Delta. In Proceedings of the 2021 RIVF International Conference on Computing and Communication Technologies (RIVF), Hanoi, Vietnam, 19–21 August 2021; pp. 1–6. [Google Scholar] [CrossRef]
  29. Truong, Q.C.; Nguyen, T.H.; Pham, V.T.; Nguyen, T.H. Land-Use Optimization and Allocation for Saltwater Intrusion Regions: A Case Study in Soc Trang Province, Vietnam. Climate 2024, 12, 16. [Google Scholar] [CrossRef]
  30. Diep, N.T.H.; Can, N.T.; Diem, P.K.; My, T. Le Spatial Analysis for the Effects of Land-Use Changes Cause of Salinity Intrusion in Soc Trang Province. Can Tho Univ. J. Sci. 2019, 55, 1–7. [Google Scholar] [CrossRef]
  31. Tri, L.Q.; Guong, V.T.; Vu, P.T.; Binh, N.T.S.; Kiet, N.H.; Chien, V. Van Evaluating the Changes of Soil Properties and Land Use at Three Coastal Districts in Soc Trang Province. Can Tho Univ. J. Sci. 2008, 9, 59–68. [Google Scholar]
  32. Han, H.; Yang, C.; Song, J. Scenario Simulation and the Prediction of Land Use and Land Cover Change in Beijing, China. Sustainability 2015, 7, 4260–4279. [Google Scholar] [CrossRef]
  33. Xiong, N.; Yu, R.; Yan, F.; Wang, J.; Feng, Z. Land Use and Land Cover Changes and Prediction Based on Multi-Scenario Simulation: A Case Study of Qishan County, China. Remote Sens. 2022, 14, 4041. [Google Scholar] [CrossRef]
  34. Loukika, K.N.; Keesara, V.R.; Buri, E.S.; Sridhar, V. Future Prediction of Scenario Based Land Use Land Cover (LU&LC) Using DynaCLUE Model for a River Basin. Ecol. Inform. 2023, 77, 102223. [Google Scholar] [CrossRef]
  35. Liu, X.; Liang, X.; Li, X.; Xu, X.; Ou, J.; Chen, Y.; Li, S.; Wang, S.; Pei, F. A Future Land Use Simulation Model (FLUS) for Simulating Multiple Land Use Scenarios by Coupling Human and Natural Effects. Landsc. Urban Plan. 2017, 168, 94–116. [Google Scholar] [CrossRef]
  36. Athukorala, D.; Murayama, Y.; Bandara, C.M.M.; Lokupitiya, E.; Hewawasam, T.; Gunatilake, J.; Karunaratne, S. Effects of Urban Land Change on Ecosystem Service Values in the Bolgoda Wetland, Sri Lanka. Sustain. Cities Soc. 2024, 101, 105050. [Google Scholar] [CrossRef]
  37. Nguyen, C.T.; Ton-That, L.; Pham, T.D. Land Use, Land Cover Changes and Expansion of Artificial Reservoirs in Eastern Thailand: Implications for Agriculture and Vegetation Drought Reduction. Environ. Monit. Assess. 2024, 196, 1009. [Google Scholar] [CrossRef] [PubMed]
  38. Ngoc, D.M.; Nu, N.T.; Toan, D.M.; Son, B.T. Study on Soft Ground Structure in the Mekong Delta Coastal Province, Viet Nam for Embankment Construction. J. Appl. Sci. Eng. 2021, 24, 307–314. [Google Scholar]
  39. Soc Trang Provincial Party Committee. Soc Trang agricultural imprint in 2024. Available online: https://soctrang.dcs.vn/Default.aspx?sname=tinhuy&sid=4&pageid=469&catid=54386&id=301439&catname=Kinh+t%u1ebf&title=dau-an-nong-nghiep-soc-trang-nam-2024 (accessed on 20 January 2025).
  40. Diep, N.T.H.; Loc, H.H.; Nguyen, C.T.; Park, E.; Tran, T. Spatial-Social Evaluations of Ecosystem Services of Adaptive Aquaculture Models Using SAR and Multivariate Analyses: A Case in the Vietnamese Mekong Delta. Environ. Monit. Assess. 2022, 194, 778. [Google Scholar] [CrossRef] [PubMed]
  41. Diep, N.T.H.; Korsem, T.; Can, N.T.; Phonphan, W.; Minh, V.Q. Determination of Aquaculture Distribution by Using Remote Sensing Technology in Thanh Phu District, Ben Tre Province, Vietnam. Vietnam J. Sci. Technol. Eng. 2019, 61, 35–41. [Google Scholar] [CrossRef]
  42. Gao, F.; Anderson, M.C.; Zhang, X.; Yang, Z.; Alfieri, J.G.; Kustas, W.P.; Mueller, R.; Johnson, D.M.; Prueger, J.H. Toward Mapping Crop Progress at Field Scales through Fusion of Landsat and MODIS Imagery. Remote Sens. Environ. 2017, 188, 9–25. [Google Scholar] [CrossRef]
  43. Li, L.; Zhao, Y.; Fu, Y.; Pan, Y.; Yu, L.; Xin, Q. High Resolution Mapping of Cropping Cycles by Fusion of Landsat and MODIS Data. Remote Sens. 2017, 9, 1232. [Google Scholar] [CrossRef]
  44. Chen, C.F.; Son, N.T.; Chang, L.Y. Monitoring of Rice Cropping Intensity in the Upper Mekong Delta, Vietnam Using Time-Series MODIS Data. Adv. Space Res. 2012, 49, 292–301. [Google Scholar] [CrossRef]
  45. Tucker, C.J. Red and Photographic Infrared Linear Combinations for Monitoring Vegetation. Remote Sens. Environ. 1979, 8, 127–150. [Google Scholar] [CrossRef]
  46. Hyandye, C.; Martz, L.W. A Markovian and Cellular Automata Land-Use Change Predictive Model of the Usangu Catchment. Int. J. Remote Sens. 2017, 38, 64–81. [Google Scholar] [CrossRef]
  47. Gharbia, S.S.; Alfatah, S.A.; Gill, L.; Johnston, P.; Pilla, F. Land Use Scenarios and Projections Simulation Using an Integrated GIS Cellular Automata Algorithms. Model. Earth Syst. Environ. 2016, 2, 151. [Google Scholar] [CrossRef]
  48. Xu, X.; Du, Z.; Zhang, H. Integrating the System Dynamic and Cellular Automata Models to Predict Land Use and Land Cover Change. Int. J. Appl. Earth Obs. Geoinf. 2016, 52, 568–579. [Google Scholar] [CrossRef]
  49. Feng, Y.; Wang, J.; Tong, X.; Shafizadeh-Moghadam, H.; Cai, Z.; Chen, S.; Lei, Z.; Gao, C. Urban Expansion Simulation and Scenario Prediction Using Cellular Automata: Comparison between Individual and Multiple Influencing Factors. Environ. Monit. Assess. 2019, 191, 291. [Google Scholar] [CrossRef]
  50. Xie, L.; Bai, Z.; Yang, B.; Fu, S. Simulation Analysis of Land-Use Pattern Evolution and Valuation of Terrestrial Ecosystem Carbon Storage of Changzhi City, China. Land 2022, 11, 1270. [Google Scholar] [CrossRef]
  51. Mohamed, A.; Worku, H. Simulating Urban Land Use and Cover Dynamics Using Cellular Automata and Markov Chain Approach in Addis Ababa and the Surrounding. Urban Clim. 2020, 31, 100545. [Google Scholar] [CrossRef]
  52. Nguyen, C.T.; Diep, N.T.H.; Iabchoon, S. Direction of Urban Expansion in the Bangkok Metropolitan Area, Thailand under the Impacts of a National Strategy. Vietnam J. Earth Sci. 2021, 43, 380–398. [Google Scholar] [CrossRef]
  53. Hong Diep, N.T.; Nguyen, C.T.; Diem, P.K.; Hoang, N.X.; Kafy, A. Al Assessment on Controlling Factors of Urbanization Possibility in a Newly Developing City of the Vietnamese Mekong Delta Using Logistic Regression Analysis. Phys. Chem. Earth 2022, 126, 103065. [Google Scholar] [CrossRef]
  54. Nguyen, C.T.; Chidthaisong, A.; Limsakul, A.; Varnakovida, P.; Ekkawatpanit, C.; Diem, P.K.; Diep, N.T.H. How Do Disparate Urbanization and Climate Change Imprint on Urban Thermal Variations? A Comparison between Two Dynamic Cities in Southeast Asia. Sustain. Cities Soc. 2022, 82, 103882. [Google Scholar] [CrossRef]
  55. Zhang, S.; Yang, P.; Xia, J.; Wang, W.; Cai, W.; Chen, N.; Hu, S.; Luo, X.; Li, J.; Zhan, C. Land Use/Land Cover Prediction and Analysis of the Middle Reaches of the Yangtze River under Different Scenarios. Sci. Total Environ. 2022, 833, 155238. [Google Scholar] [CrossRef]
  56. dos Santos, W.P.; Acuña-Guzman, S.F.; de Oliveira, P.T.S.; Beniaich, A.; Cardoso, D.P.; Silva, M.L.N.; Curi, N.; Avanzi, J.C. CA-Markov Prediction Modeling for the Assessment of Land Use/Land Cover Change in Two Sub-Basins of the Tocantins-Araguaia River Basin. Environ. Monit. Assess. 2024, 196, 499. [Google Scholar] [CrossRef] [PubMed]
  57. Yamaguchi, T.; Tuan, L.M.; Minamikawa, K.; Yokoyama, S. Assessment of the Relationship between Adoption of a Knowledge-Intensive Water-Saving Technique and Irrigation Conditions in the Mekong Delta of Vietnam. Agric. Water Manag. 2019, 212, 162–171. [Google Scholar] [CrossRef]
  58. Ngoc, N.P.; Van Dang, L.; Van Qui, N.; Hung, N.N. Chemical Processes and Sustainability of Rice-Shrimp Farming on Saline Acid Sulfate Soils in Mekong Delta. Heliyon 2023, 9, e13532. [Google Scholar] [CrossRef]
  59. Minh, L.Q.; Tuong, T.P.; Van Mensvoort, M.E.F.; Bouma, J. Tillage and Water Management for Riceland Productivity in Acid Sulfate Soils of the Mekong Delta, Vietnam. Soil Tillage Res. 1997, 42, 1–14. [Google Scholar] [CrossRef]
  60. Tran, T.A.; Dang, T.D.; Nguyen, T.H.; Pham, V.H.T. Moving towards Sustainable Coastal Adaptation: Analysis of Hydrological Drivers of Saltwater Intrusion in the Vietnamese Mekong Delta. Sci. Total Environ. 2021, 770, 145125. [Google Scholar] [CrossRef] [PubMed]
  61. Phiri, D.; Simwanda, M.; Salekin, S.; Ryirenda, V.R.; Murayama, Y.; Ranagalage, M.; Oktaviani, N.; Kusuma, H.A.; Zhang, T.; Su, J.; et al. Sentinel-2 Data for Land Cover/Use Mapping: A Review. Remote Sens. 2020, 12, 2291. [Google Scholar] [CrossRef]
  62. Talukdar, S.; Singha, P.; Mahato, S.; Pal, S.; Liou, Y.-A.; Rahman, A. Land-Use Land-Cover Classification by Machine Learning Classifiers for Satellite Observations—A Review. Remote Sens. 2020, 12, 1135. [Google Scholar] [CrossRef]
  63. Diem, P.K.; Can, N.T.; Tien, P.D.; Diem, N.K.; Nguyen, N.T.; Hong, T.G.; Vu, P.H. Report on Land Use Analysis for 13 Provinces in Vietnamese Mekong Delta in 2022; Can Tho University: Can Tho, Vietnam, 2024. [Google Scholar]
  64. Mahdianpari, M.; Jafarzadeh, H.; Granger, J.E.; Mohammadimanesh, F.; Brisco, B.; Salehi, B.; Homayouni, S.; Weng, Q. A Large-Scale Change Monitoring of Wetlands Using Time Series Landsat Imagery on Google Earth Engine: A Case Study in Newfoundland. GIScience Remote Sens. 2020, 57, 1102–1124. [Google Scholar] [CrossRef]
  65. Suwanlee, S.R.; Keawsomsee, S.; Pengjunsang, M.; Homtong, N.; Prakobya, A.; Borgogno-Mondino, E.; Sarvia, F.; Som-ard, J. Monitoring Agricultural Land and Land Cover Change from 2001–2021 of the Chi River Basin, Thailand Using Multi-Temporal Landsat Data Based on Google Earth Engine. Remote Sens. 2023, 15, 4339. [Google Scholar] [CrossRef]
  66. Liang, X.; Guan, Q.; Clarke, K.C.; Liu, S.; Wang, B.; Yao, Y. Understanding the Drivers of Sustainable Land Expansion Using a Patch-Generating Land Use Simulation (PLUS) Model: A Case Study in Wuhan, China. Comput. Environ. Urban Syst. 2021, 85, 101569. [Google Scholar] [CrossRef]
  67. Aldileemi, H.; Zhran, M.; El-Mewafi, M. Geospatial Monitoring and Prediction of Land Use/Land Cover (LULC) Dynamics Based on the CA-Markov Simulation Model in Ajdabiya, Libya. Int. J. Geoinformatics 2023, 19, 15–29. [Google Scholar] [CrossRef]
  68. Guo, J.; Chen, J.; Qi, S. Impact of Land Use/Cover Change on Soil Erosion and Future Simulations in Hainan Island, China. Water 2024, 16, 2654. [Google Scholar] [CrossRef]
  69. Li, K.; Wang, X.; Zhao, F.; An, B.; Li, P. Land Use Modeling and Carbon Storage Projections of the Bosten Lake Basin in China from 1990 to 2050 across Multiple Scenarios. Sci. Rep. 2024, 14, 27136. [Google Scholar] [CrossRef]
  70. Liu, X.; Xue, Z.; Liu, J.; Zhao, X.; Fu, Y.; Wang, R.; Luo, X.; Xing, L.; Wang, C.; Zhao, H. Spatio-Temporal Evolution and Multi-Scenario Modeling Based on Terrestrial Carbon Stocks in Xinjiang. Land 2024, 13, 1454. [Google Scholar] [CrossRef]
  71. Gu, H.; Li, J.; Wang, S. Multi-Scenario Simulation of Land Use/Cover Change and Terrestrial Ecosystem Carbon Reserve Response in Liaoning Province, China. Sustainability 2024, 16, 8244. [Google Scholar] [CrossRef]
  72. Zhang, Z.; Li, J. Spatial Suitability and Multi-Scenarios for Land Use: Simulation and Policy Insights from the Production-Living-Ecological Perspective. Land Use Policy 2022, 119, 106219. [Google Scholar] [CrossRef]
  73. Liu, J.; Li, J.; Qin, K.; Zhou, Z.; Yang, X.; Li, T. Changes in Land-Uses and Ecosystem Services under Multi-Scenarios Simulation. Sci. Total Environ. 2017, 586, 522–526. [Google Scholar] [CrossRef]
  74. Wu, S.; Guo, Z.; Askar, A.; Li, X.; Hu, Y.; Li, H.; Saria, A.E. Dynamic Land Cover and Ecosystem Service Changes in Global Coastal Deltas under Future Climate Scenarios. Ocean Coast. Manag. 2024, 258, 107384. [Google Scholar] [CrossRef]
  75. Li, S.; Cao, Y.; Liu, J.; Wang, S. Simulating Land Use Change for Sustainable Land Management in China’s Coal Resource-Based Cities under Different Scenarios. Sci. Total Environ. 2024, 916, 170126. [Google Scholar] [CrossRef]
  76. Soc Trang People’s Committee. Explanatory Report on Soc Trang Provincial Planning for the Period 2021-2030, Vision to 2050; Soc Trang People’s Committee: Soc Trang City, Vietnam, 2022. [Google Scholar]
  77. Dang, H.D. Sustainability of the Rice-Shrimp Farming System in Mekong Delta, Vietnam: A Climate Adaptive Model. J. Econ. Dev. 2020, 22, 21–45. [Google Scholar] [CrossRef]
  78. Deb, P.; Tran, D.A.; Udmale, P.D. Assessment of the Impacts of Climate Change and Brackish Irrigation Water on Rice Productivity and Evaluation of Adaptation Measures in Ca Mau Province, Vietnam. Theor. Appl. Climatol. 2016, 125, 641–656. [Google Scholar] [CrossRef]
  79. Costanza, R.; de Groot, R.; Sutton, P.; van der Ploeg, S.; Anderson, S.J.; Kubiszewski, I.; Farber, S.; Turner, R.K. Changes in the Global Value of Ecosystem Services. Glob. Environ. Change 2014, 26, 152–158. [Google Scholar] [CrossRef]
  80. Van der Ploeg, S.; de Groot, R.S. The TEEB Valuation Database–a Searchable Database of 1310 Estimates of Monetary Values of Ecosystem Services; Foundation for Sustainable Development: Wageningen, The Netherlands, 2010. [Google Scholar]
  81. Lavane, K.; Kumar, P.; Meraj, G.; Han, T.G.; Ngan, L.H.B.; Lien, B.T.B.; Van Ty, T.; Thanh, N.T.; Downes, N.K.; Nam, N.D.G.; et al. Assessing the Effects of Drought on Rice Yields in the Mekong Delta. Climate 2023, 11, 13. [Google Scholar] [CrossRef]
Figure 1. Study area map shows location of Soc Trang Province on the southeastern coast of the Vietnam Mekong Delta and current LULC map in 2020 with dike systems and saline intrusion boundary of 4‰.
Land 14 01063 g001
Figure 2. Methodological framework visualizes primary data sources and their roles in historical LULC mapping, future LULC simulation, and assessments.
Land 14 01063 g002
Figure 3. Spatial distribution of LULCC maps in Soc Trang for each five-year interval and the whole research period from 2010 to 2020.
Land 14 01063 g003
Figure 4. The Sankey plot visualizes the transfer processes of various LULC types from 2010 to 2020. Column height reflects total areas of corresponding LULC types at the time node, while the width of connections indicates the converted areas from original LULC to other types [unit: hectares].
Land 14 01063 g004
Figure 5. Spatial distribution of future predicted LULCC maps in 2030 under different scenarios: (a) BAU, (b) climate change challenges, (c) profit optimization, (d) adaptive solution (moderate transition), and (e) adaptive solution (rapid transition).
Land 14 01063 g005
Figure 6. Ecosystem service values of each service group from different scenarios compared to current LULC situation in 2020. Total ecosystem service values of each scenario are shown at the top of each column. Unit: USD million in 2020.
Land 14 01063 g006
Figure 7. LULCC probability maps highlight susceptible areas to LULCC in 2030 scenarios and combined all scenarios compared to the LULC status in 2020. Map values range from 0 to 1, meaning low to high change probability.
Land 14 01063 g007
Table 1. Potential natural, socioeconomic, and policy factors regulating LULCC.
VariableData DescriptionData Sources
Socioeconomic factors
Population densityA one km resolution raster estimates the number of population distributions. Unit: persons/km2.CIESIN
Distance to roadsRaster represents proximity to the main road network within the study areas. Unit: meter.DNRE
Distance to urban areasRaster of proximity to urban areas and centers extracted from land use maps. Unit: meter.DNRE
Natural conditions
Annual mean temperatureRaster of average monthly temperature with approximate 30 arc-second resolution. Unit: °C.WorldClim
Annual mean precipitationRaster of average monthly precipitation with about 30 arc-second resolution. Unit: °C.WorldClim
Soil typeRaster contains discrete ranking numbers corresponding to soil-type suitability for LULC categories. It is in discrete ranking units.DNRE
ElevationRaster data characterize terrain elevation extracted from DEM data with a pixel size of 30 meters. Unit: meter.WorldClim
SlopeIt describes terrain slopes derived from DEM data at 30-meter resolution. Unit: degrees.Derived from DEM
Distance to riverProximity raster data estimates the shortest distance to rivers, reflecting accessibility to water resources. Unit: meter.DNRE
Distance to coastlineShortest distance from any inland location to the coastal line. Unit: meter.DNRE
SalinityRaster data quantify salinity intrusion zones with corresponding salinity. Unit: grams/liter.SIWR
Policy element
Distance to dikesRaster data transformed from dike vector data to characterize proximity to dike systems. Unit: meter.DARD
Notes: CIESIN = Center for International Earth Science Information Network, Columbia University; DNRE = Department of Natural Resources and Environment; DARD = Department of Agriculture and Rural Development; SIWR = Southern Institute of Water Resources.
Table 2. Description of primary land use and land cover categories in Soc Trang Province.
LULC CategoryDescription
Annual crops (ACRO)Land cultivates crops that complete their life cycle within a single year, such as white radish, onion, sugarcane, maize, and other vegetables.
Aquaculture (AQUA)Controlled water bodies and ponds are mainly distributed in brackish coastal areas, which are used for fishes, semi-intensive and intensive shrimp farming, and brine shrimp (Artemia).
Construction land (CONS)Land occupied by residential areas, buildings, industrial zones, infrastructures, and other urban development purposes.
Forest (FOR)Dense tree growth with natural and semi-natural ecosystems, such as natural reserves, plantation forests (Melaleuca), and mangroves.
Double rice crops (DRICE)Agricultural land partly depends on rainwater, which grows two rice crops sequentially per year.
Triple rice crops (TRICE)Agricultural land cultivates three high-yield and short-growing-period rice crops per year. It often requires intensive irrigation systems.
Rice–shrimp (SRICE)A typical agricultural land use in coastal regions, where the land is alternately used for rice farming during rainy seasons and brackish shrimp farming in dry seasons.
Perennial plantations (PLANT)Land is planted with long-lived crops and harvested over multiple years. It typically means orchards, such as mangosteen, durian, mango, pomelo, orange, tangerine, longan, guava, and star apple.
River/canal (WAT)Natural water bodies (rivers and canals).
Table 3. Estimation coefficients for economics and ESV for LULC categories.
LULC Economic ValueProvisionRegulating and SupportingCultureTotal ESV
(USD/ha/Year)(2020 US Dollars/ha/Year)
SRICE1362.55694.017,262.43254.626,211.0
DRICE3374.22814.016,827.3824.320,465.6
TRICE3813.34221.025,241.01236.430,698.4
ACRO5737.51122.024,717.75779.031,618.7
PLANT6954.520,344.030,464.312,989.663,798.0
AQUA12,311.28574.017,697.55684.931,956.4
WAT-3883.740,882.35835.750,601.7
CONS-1455.511,413.0240.013,108.5
FOR-11,310.034,134.712,989.658,434.3
Table 4. Distribution area, shared proportion, and growth rate of LULC during 2010–2020.
LULCArea (ha)Proportion (%)AGR (%/Year)
2010201520202010201520202010–2020
SRICE12,307.24207.51658.73.731.280.50−8.65
DRICE77,413.377,682.880,260.923.4623.5424.320.37
TRICE68,274.754,057.643,463.520.6916.3813.17−3.63
ACRO12,574.09055.78713.03.812.742.64−3.07
PLANT86,927.8120,864.2126,913.026.3436.6338.464.60
AQUA39,471.730,377.134,159.011.969.2110.35−1.35
WAT20,396.920,396.920,396.96.186.186.18-
CONS1850.82574.73651.50.560.781.119.73
FOR8759.58759.58759.52.652.652.65-
Table 5. Predicted area and estimated annual growth rate in 2030 under different scenarios compared to the current situation.
LULCCurrent Area (ha)Predicted Area in 2030 (ha)AGR (%/Year)
2020BAUCCCPOADs-5%ADs-10%BAUCCCPOADs-5%ADs-10%
SRICE1658.7648.81064.41072.82315.86102.5−6.09−3.58−3.533.9626.79
DRICE80,260.990,255.7106,047.276,361.798,396.4103,799.31.253.21−0.492.262.93
TRICE43,463.533,882.218,951.838,893.826,023.215,154.8−2.20−5.64−1.05−4.01−6.51
ACRO8713.05935.78502.26394.08313.26293.1−3.19−0.24−2.66−0.46−2.78
PLANT126,913.0128,455.4112,253.2111,844.7137,428.7149,572.70.12−1.16−1.190.831.79
AQUA34,159.035,643.246,062.756,986.620,452.311,910.50.433.486.68−4.01−6.51
WAT20,396.920,396.920,396.920,396.920,396.920,396.9-----
CONS3651.53998.65911.17266.05890.15986.70.956.199.906.136.40
FOR8759.58759.58759.58759.58759.58759.5-----
Total absolute area change (ha)26,737.079,926.152,884.463,093.7105,954.0
Note: Total absolute area change considers all the changed areas without considering their trends.
Disclaimer/Publisher’s Note: The statements, opinions and data contained in all publications are solely those of the individual author(s) and contributor(s) and not of MDPI and/or the editor(s). MDPI and/or the editor(s) disclaim responsibility for any injury to people or property resulting from any ideas, methods, instructions or products referred to in the content.

