Article

The Impact of Nature Reserves on the Ecological Network of Urban Agglomerations—A Case Study of the Urban Agglomeration in the Middle Reaches of the Yangtze River

1
Department of Urban and Rural Construction, Hebei Agricultural University, Baoding 071001, China
2
Department of Architecture and Design, Politecnico di Torino, 10129 Turin, Italy
3
International Joint Laboratory on Green and Low-Carbon Urban Renewal, The Ministry of Education, Harbin Institute of Technology, Harbin 150001, China
4
School of Geography Earth and Environmental Sciences, University of Plymouth, Plymouth PL4 8AA, UK
*
Authors to whom correspondence should be addressed.
Land 2025, 14(5), 1054; https://doi.org/10.3390/land14051054
Submission received: 21 March 2025 / Revised: 1 May 2025 / Accepted: 5 May 2025 / Published: 13 May 2025
(This article belongs to the Special Issue The Relationship Between Landscape Sustainability and Urban Ecology)

Abstract

:
The accelerated development of urban agglomerations in China has resulted in the significant regional expansion of infrastructure and urban spaces, which has led to the fragmentation of habitats and the degradation of ecosystem function. Ecological networks have been shown to reconnect isolated habitat patches within urban agglomerations by identifying ecological sources and constructing corridors, which could enhance regional ecological security. Nature reserves, as critical areas for the protection of key species and ecosystems, play a vital role in this process. Investigating the influence of nature reserves on the ecological networks of urban agglomerations helps to integrate regional ecological resources, optimize ecological network structures, and enhance cross-departmental coordination in nature reserve management and ecological environment protection. Using the urban agglomeration in the middle reaches of the Yangtze River as a case study, this research analyzes the impact of nature reserves on the ecological network of urban agglomerations. Initially, ecological source patches are identified using the “Quality-Morphology-Connectivity” evaluation model. Different types of nature reserves are then superimposed to create four distinct source schemes. Subsequently, a resistance surface is constructed through a comprehensive evaluation method to assess ecological barriers. Then, ecological corridors are generated using circuit theory tools. Finally, a comparison of the effectiveness of the four ecological networks is conducted using 12 landscape pattern metrics. The results indicate several key points. Firstly, the inclusion of nature reserves is shown to supplement ecological sources and increase corridor numbers, thereby enhancing the optimization effect of the urban agglomerations’ ecological network threefold. Secondly, the impact of nature reserves on the ecological network is closely related to the spatial scale of patches, and patch scale consistency should be considered to prevent network functionality loss. Thirdly, establishing a cross-departmental and cross-regional collaborative management mechanism is recommended to organically integrate nature reserves with ecological networks. These results provide a data-driven foundation for the optimization of ecological networks in urban agglomerations and inform effective management strategies for nature reserves, to promote the construction of ecological civilization in urban agglomerations.

1. Introduction

For half a century, the rapid urbanization in China has significantly altered regional landscape patterns, leading to the reduction in and isolation of natural habitats [1,2]. Suburban natural areas have become fragmented into biogeographic islands of varying sizes, hindering the migration and gene exchange of local species and exacerbating landscape fragmentation within urban agglomerations [3,4,5]. This issue has attracted increasing attention from scholars around the world, particularly on strategies to improve the connectivity of natural habitats within urban environments [6,7].
One common strategy to improve landscape connectivity is the construction of regional ecological networks [8,9,10]. This approach views natural habitats as ecological sources and aims to create ecological corridors that simulate the migration processes of organisms, thus promoting ecological flows [11]. Most of the research in this field is grounded in theories such as ecology, island biogeography, and landscape ecology [12,13,14]. Over time, this body of work has integrated additional concepts, including the dynamics of source-sink and heterogeneous populations [15,16], culminating in a foundational research paradigm encompassing “ecological source identification, resistance surface modeling, ecological corridor construction, and ecological node analysis” [17,18]. In this paradigm, the identification methods of ecological sources can be divided into two categories: one is directly selected from urban green spaces and nature reserves in the study area [19]; the other is a multi-factor evaluation method based on remote sensing data, and among them, ecosystem services and land cover change have attracted more attention [20,21], and InVEST, MSPA, and graph theory analysis tools have been widely used [22]. The methodological evolution of connectivity pathway design has progressed from the Least-Cost Path (LCP) [23] to advanced analytical frameworks integrating innovations like the Minimum Cumulative Resistance (MCR) method and circuit-theoretic connectivity algorithms, establishing new paradigms for landscape conservation planning [24,25,26].
The identification of ecological sources is crucial for the effective construction of ecological networks [27,28]. The location and size of these sources determine the distribution of ecological corridors and establish the spatial framework of the network [29]. In addition, habitat quality within these ecological sources significantly influences the overall effectiveness of network protection efforts [30]. Therefore, optimizing ecological source schemes has become an essential aspect of improving ecological networks [31]. Research by Williams et al. suggests that the direct selection of ecological sources from existing nature reserves can leverage established management systems and technical services to effectively protect key species [32]. However, this approach often encounters challenges related to the insufficient scale and connectivity of these reserves [33]. In contrast, ecological source identification methods based on remote sensing data can uncover potential ecological sources from natural habitats, thereby expanding protection efforts. Yet, these methods may struggle to address the specific conservation needs of certain species [34]. Recent studies, such as those conducted by Wang Haiyun [35], have sought to merge these two methodologies by incorporating nature reserve patches identified through remote sensing to optimize ecological source schemes [36,37]. Within this integrated framework, analyzing the roles of nature reserves with varying hierarchical classifications and spatial extents in ecological connectivity networks enables the refined identification of priority conservation hubs for biodiversity networks [38,39,40].
Over the past 40 years, the rapid pace of urbanization in China has resulted in significant ecological degradation [41,42,43,44], with evident trends of the shrinking and fragmentation of natural habitats [45,46,47,48]. Research by Chen Wanxu et al. predicts that by 2030, urban agglomerations will continue to expand, placing additional pressure on surrounding natural habitats [49]. Under the 14th Five-Year Plan, China aims to improve its 19 existing urban agglomerations to establish a cohesive national urban landscape over the next decade [50]. Since 2012, China has strategically embedded eco-civilization initiatives into its national governance framework to reconcile socio-economic progress with ecological preservation [51]. A central policy mechanism involves establishing multispecies migration corridors and biodiversity networks, prioritized as critical interventions for maintaining regional ecological integrity [52]. At the regional level, urban agglomerations have emerged as key sites for implementing ecological protection policies [53]. The research on ecological networks in urban agglomerations is rapidly expanding. However, extant studies primarily concentrate on network construction and optimization methods. There is a paucity of research into the mechanisms by which various nature reserves function within these networks. This oversight fails to consider the management differences among different types of ecological sources, making it difficult to integrate with current management systems and guide the practical implementation of ecological networks.
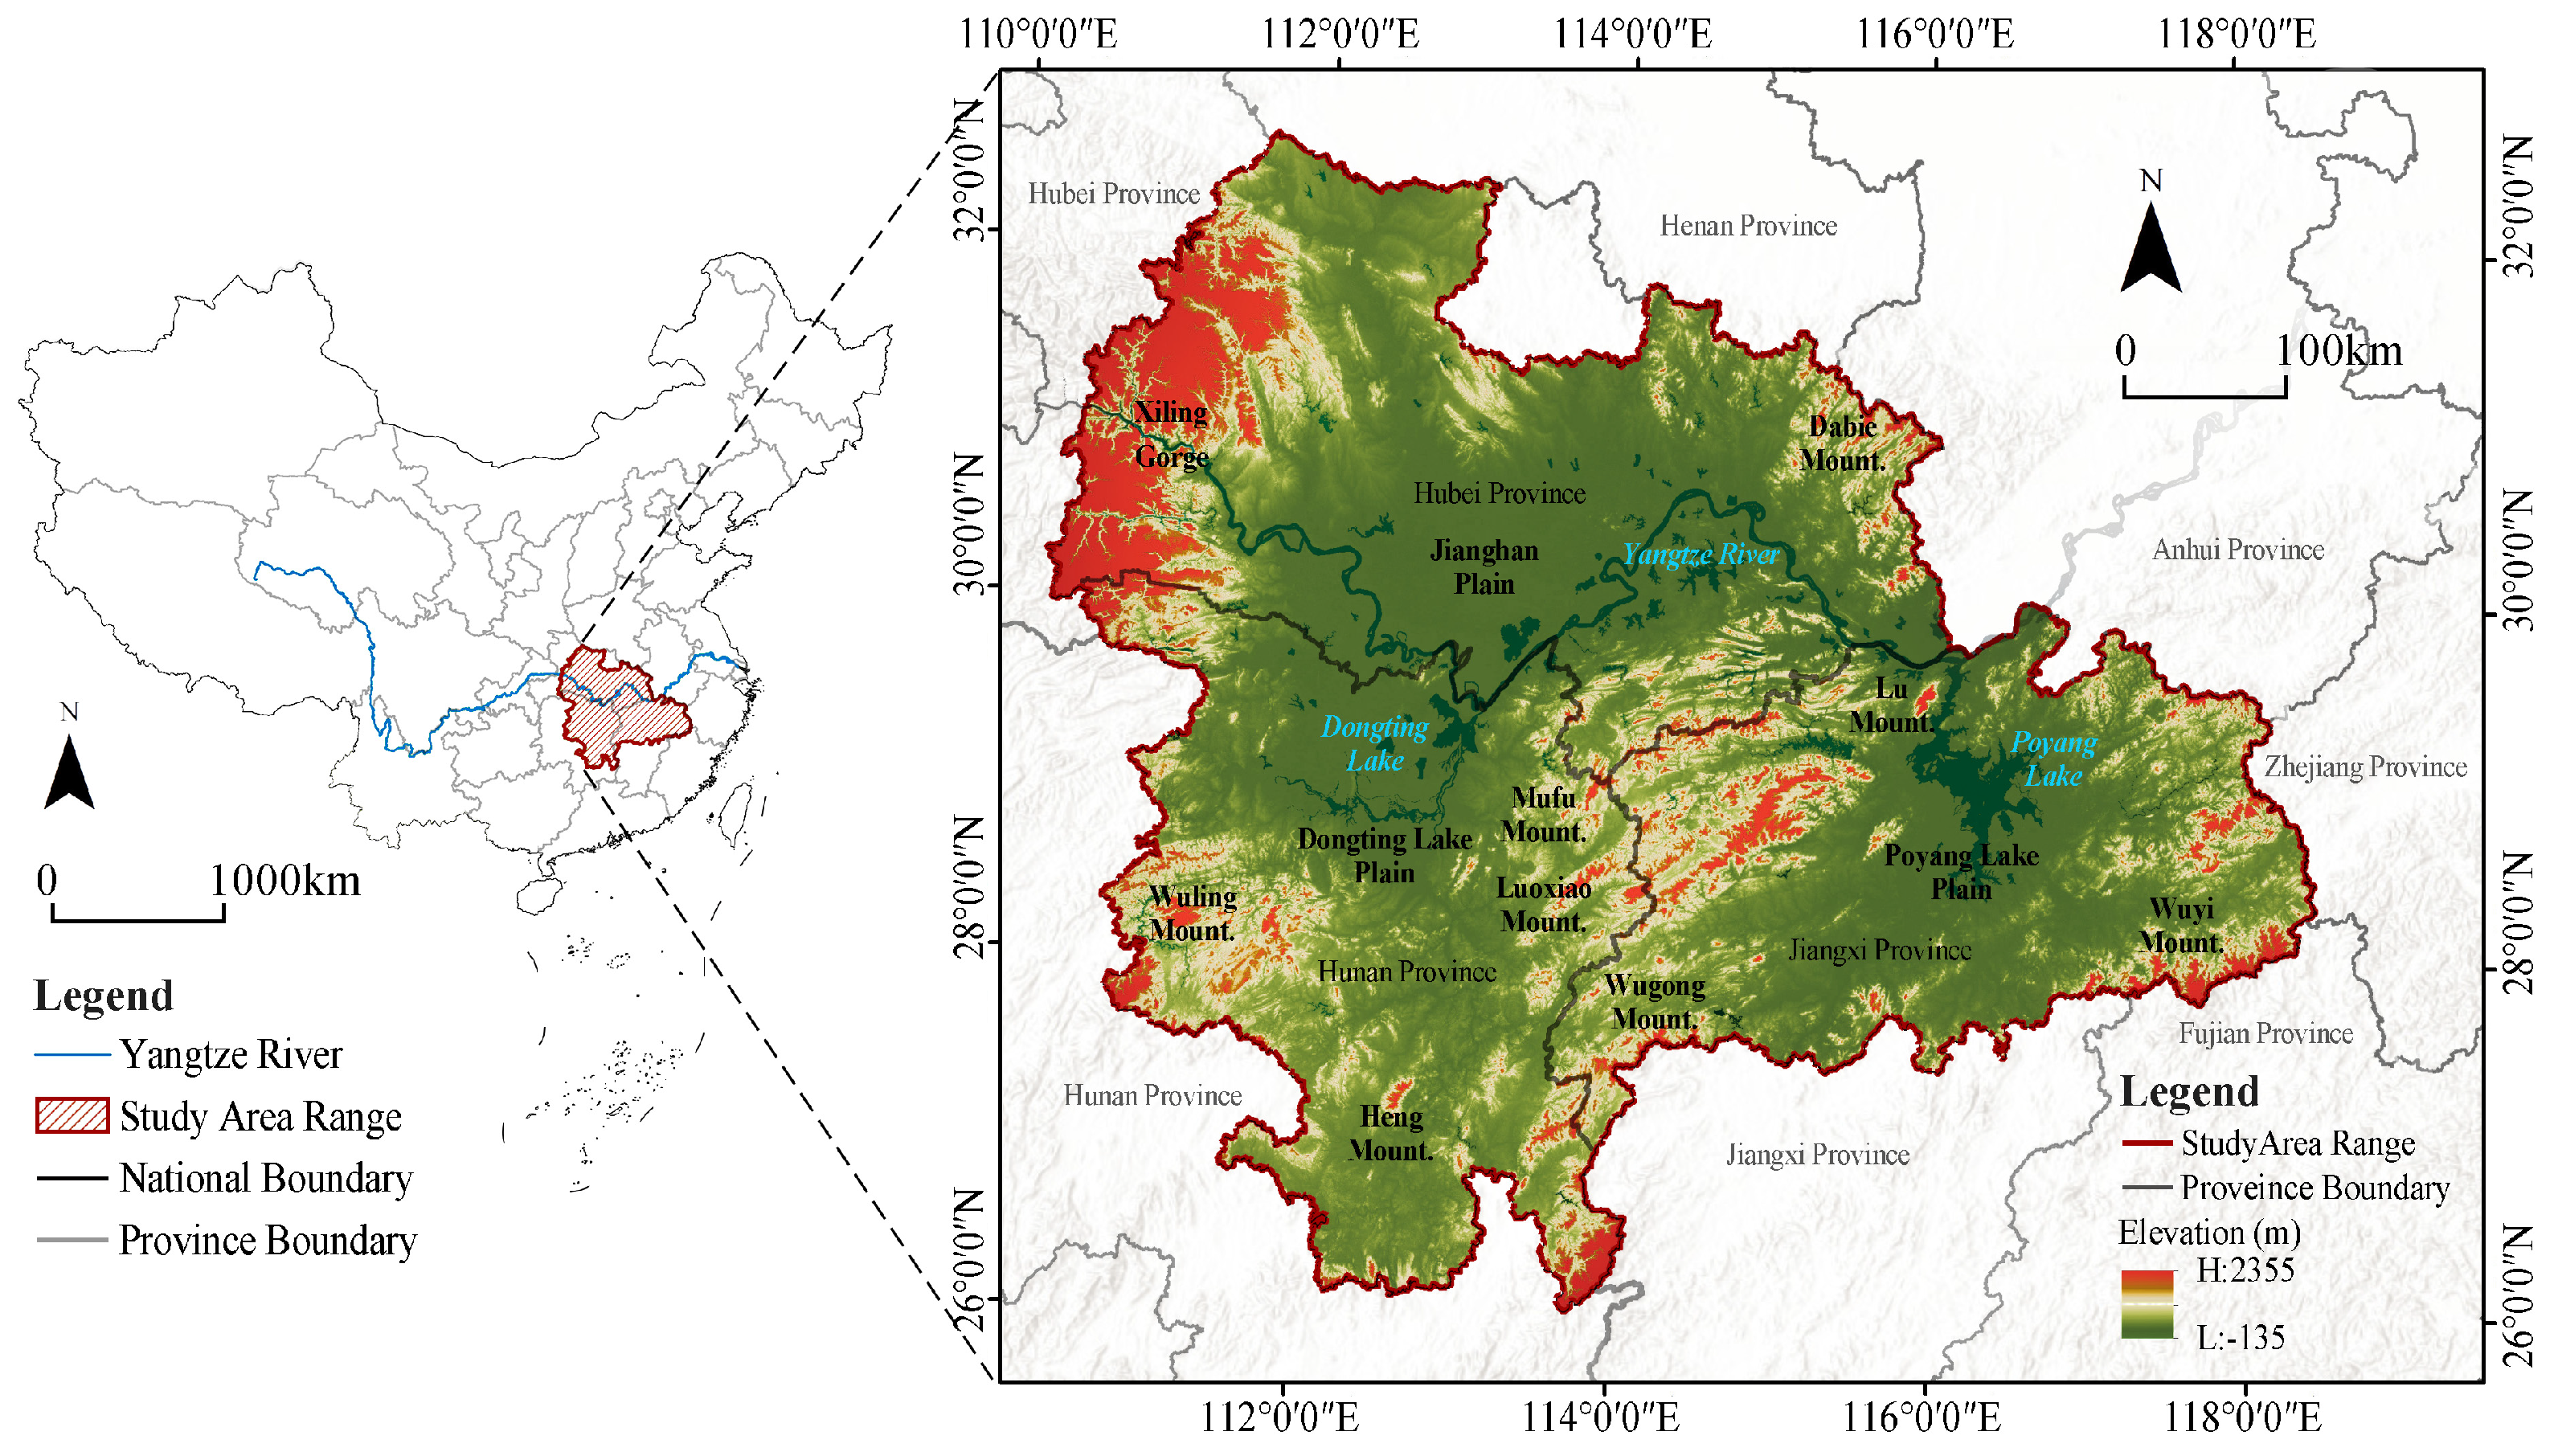
The urban agglomeration in the middle reaches of the Yangtze River1 is located in the ‘key ecological areas of the Yangtze River, Sichuan and Yunnan’ [55], with a high level of socio-economic development. It is also one of the regions with the richest biodiversity in China, and is the hub connecting the important ecological areas in the upper and lower reaches of the Yangtze River [56]. Moreover, as a pivotal area for China’s urbanization development and the “Rise of Central China” strategy, the region’s transportation network is expanding [57], underscoring the importance of its landscape connectivity for the ecological protection of the entire Yangtze River basin [58]. In the urban agglomerations of Wuhan, Chang-Zhu-Tan, and Poyang Lake, the formation of a circular structure serves to separate urban centers from the surrounding mountainous areas. The expansion of agricultural land has had a substantial impact on the area of crucial habitats, including Dongting Lake and Poyang Lake [59]. The ecosystem services of these urban agglomerations are under considerable pressure from human activities, with approximately 280 terrestrial species in the basin facing extinction threats [60]. The construction and optimization of ecological networks have been demonstrated to enhance the ecosystem service capabilities of such agglomerations, improve habitat connectivity, and strengthen regional ecological security. A pivotal challenge confronting ecological networks in this region pertains to the effective integration of diverse nature reserves and wild habitats, with the intention to establish continuous ecological corridors within and beyond urban agglomerations.
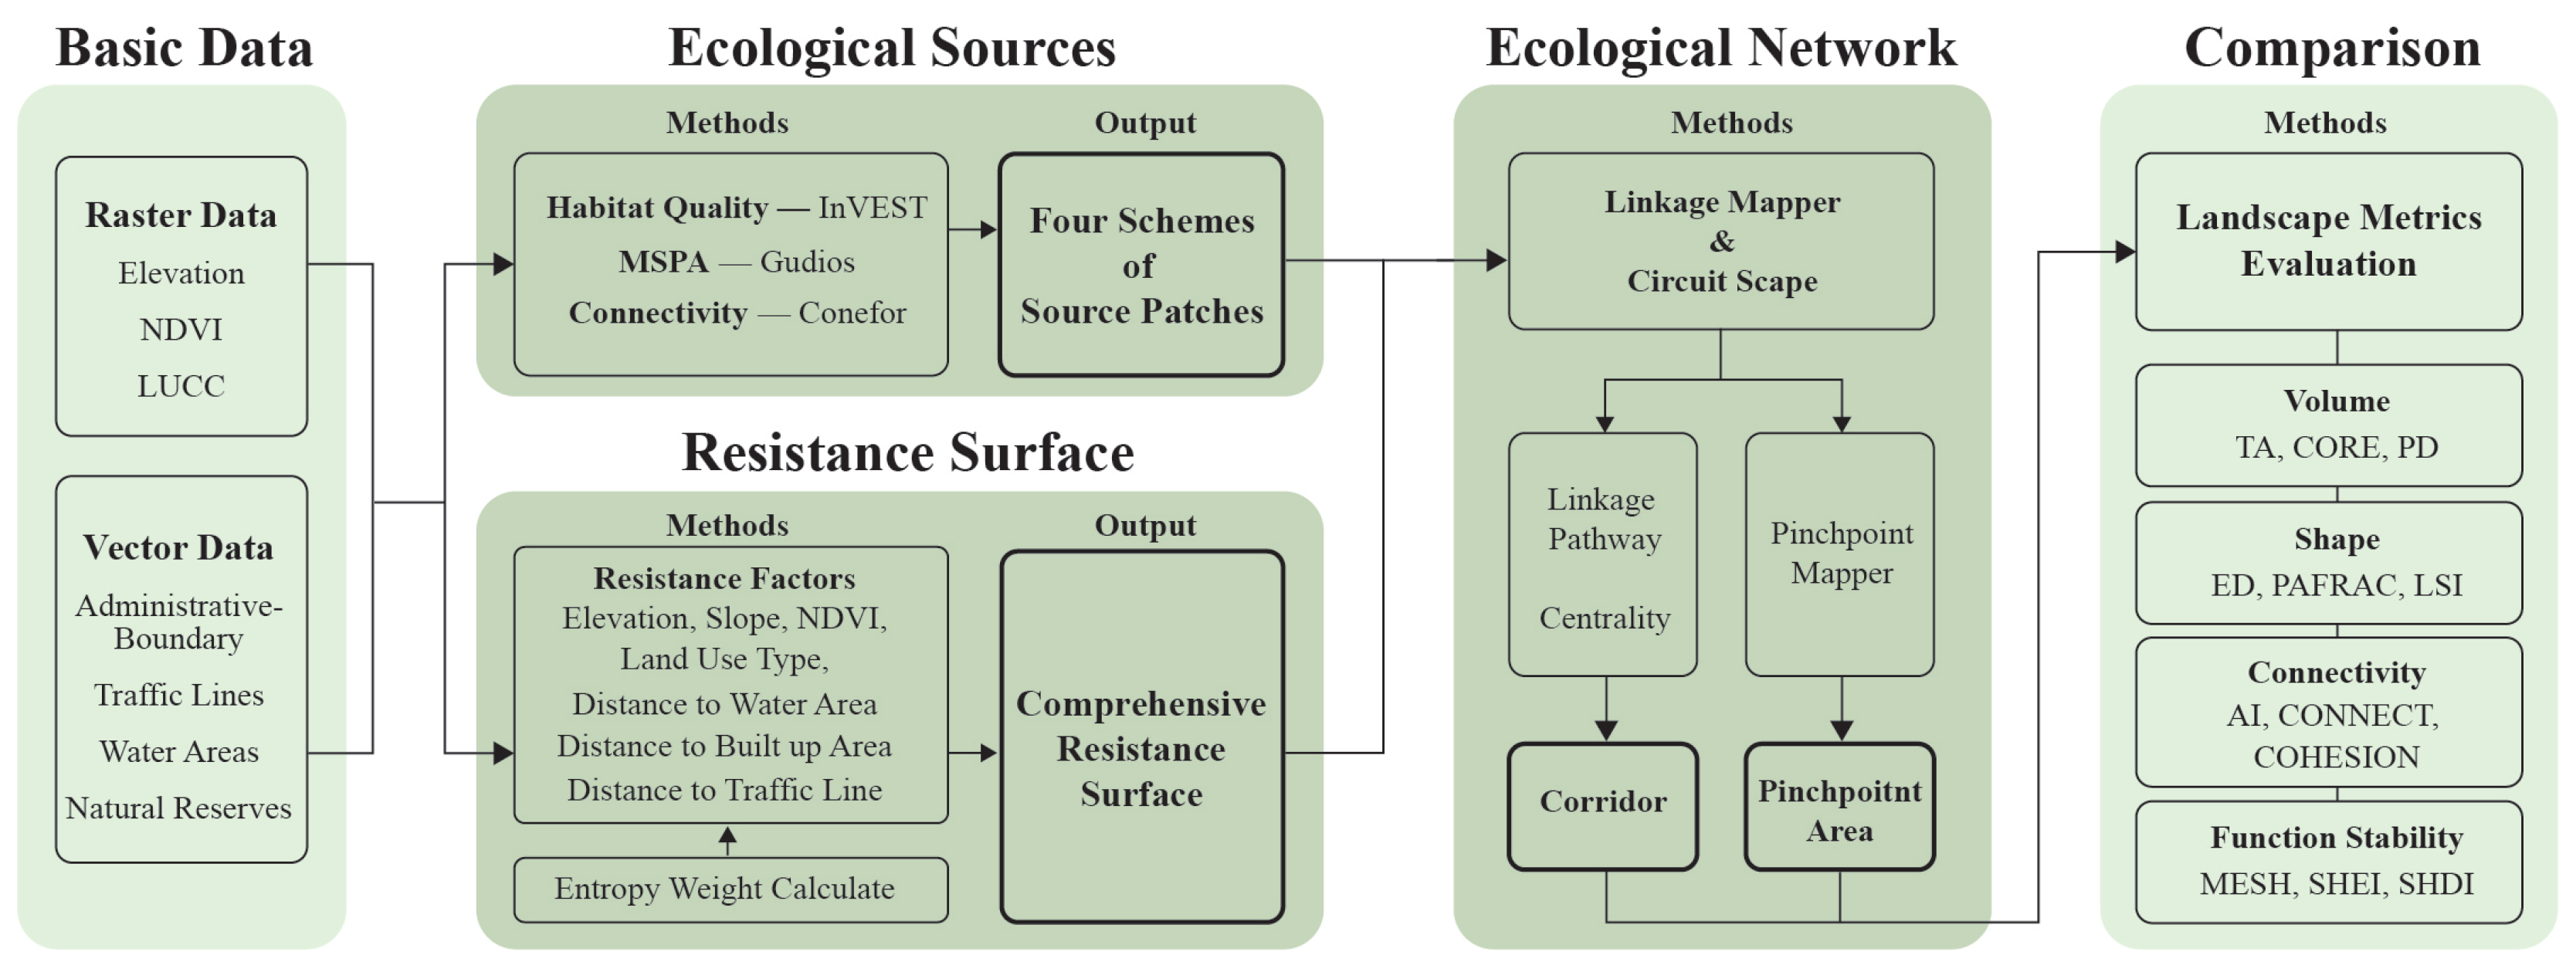
The present study focuses on the urban agglomeration in the middle reaches of the Yangtze River. Using remote sensing imagery and open source data, we identify ecological sources and overlay different types of nature reserves to create four ecological source schemes. A quantitative and comparative analysis is then conducted of the impact of these schemes on the ecological network. The objective of this study is to establish a data foundation and to provide practical guidance for the optimization of urban ecological networks and the management of nature reserves. The study addresses three key issues. Firstly, it compares schemes with and without nature reserves to understand their impact on the structure and function of the urban agglomeration’s ecological network. Secondly, it determines the most effective reserve patch selection method by contrasting different optimization schemes. Thirdly, it proposes management collaboration strategies for integrating nature reserves with urban ecological networks based on reserve management discussions.

2. Methods and Data

2.1. Overview of the Study Area

The MRYR is in the central region of China, encompassing parts of Hubei, Hunan, and Jiangxi provinces. The elevation in the region varies from 20 m to 3105 m, with an annual average precipitation ranging from 700 to 2000 mm. The climate type is subtropical monsoon. The terrain in the urban agglomeration is dominated by mountains and plains. The main plains are the Jianghan Plain, Dongting Lake Plain, and Poyang Lake Plain, and the mountains mainly include Luoxiao Mountains, Mufu Mountains, and Mount Lu in the middle, Mount Wugong and Wuyishan in the east, Xiling Gorge in the northwest, and Wuling Mountains and Mount Heng in the southwest (see Figure 1). Major rivers in this region include the Yangtze, Han River, Xiang River, and Gan River, and major lakes include the Dongting Lake and Poyang Lake. In 2024, within the urban agglomeration, there are approximately 14 nationally protected aquatic wildlife species [61], 98 terrestrial endangered animal species [60], and at least 17 nationally protected bird species [62].
Significant waterways in this area include the Yangtze River, Han River, Xiang River, and Gan River, with major lakes such as Dongting Lake and Poyang Lake serving as critical ecological features. The urban agglomeration contains 46 nature reserves, among which 17 are designated as national nature reserves. These reserves play a vital role in conserving species associated with the middle subtropical broad-leaved forests, wetland ecosystems, and various forest flora and fauna.
For this study, the boundaries of the research area align with the administrative limits of the MRYR, which comprises 31 prefecture-level cities and 2 county-level cities. This region has a permanent population of approximately 130 million [63] and covers an area of about 317,000 square kilometers [54]. Historically, the MRYR has been recognized as a traditional agricultural zone, but it has also evolved into a hub of modern manufacturing. As of 2022, land designated for construction within this urban agglomeration accounted for 4% of the total area, supported by an extensive railway network spanning 10,000 km [54].

2.2. Data Sources

The dataset utilized in this research comprises two distinct formats: raster and vector data. Specifically, raster datasets derived through remote sensing interpretation encompass digital elevation data (DEM), vegetation cover data (NDVI), and land use classification data (LULC). The vector data mainly include patch data of administrative boundaries, traffic lines, water areas, and nature reserves, and the data are obtained from open source websites. A synthesis of the dataset characteristics is compiled in Table 1.
All data are projected and clipped to the study area using ArcGIS Pro 3.0. The NDVI data are converted from monthly to annual data using a process of raster mosaicking. Land use classification encompasses nine distinct categories: agricultural land, forest, shrubland, grassland, water bodies, glaciers, bare rock, built-up areas, and wetlands. It should be noted that glaciers are not present in the study area. The national nature reserve dataset comprises entries such as reserve name, level, area, establishment time, protected species, region, and managing department. Within the designated study area, 46 reserve patches are identified and categorized into five distinct types: forest ecosystems, wetland ecosystems, wildlife, wild plants, and geological relics. Due to the minimal size of the single geological relic reserve, it is excluded from the analysis, resulting in 45 selected reserve patches. The total area encompassed by these reserves is 11,497.69 km2, including 17 national, 7 provincial, and 21 county-level reserves.

2.3. Methods

The methodological framework of this study is centered on the “source areas-resistance surfaces-corridors-nodes” model to summarize the impact of nature reserves on the ecological network of urban agglomerations through comparative analysis (see Figure 2). When selecting ecological sources, land use classification data are used to evaluate habitat quality, landscape morphology, and connectivity levels through the InVEST, MSPA, and CONEFOR tools, respectively. Four source-region schemes are then developed by overlaying different types of nature reserves. For the construction of the ecological resistance surface, seven resistance factors are evaluated individually and then combined through weighted superposition to produce a comprehensive resistance surface. The ecological network is constructed based on both the ecological sources and the resistance surface. Using circuit theory tools, ecological corridors, pinch points, and barrier points are identified; together with the ecological source patches, these elements formed the ecological network. Finally, a network evaluation index system based on landscape pattern indices is developed to compare the scale, shape, connectivity, and functional stability of the four ecological networks. The optimal configuration is identified through a weighted scoring method, and the influence of nature reserves on the ecological network of urban agglomerations is interpreted accordingly.

2.3.1. Screening of Ecological Sources Based on ‘Quality-Morphology-Connectivity’

Ecological source areas serve as critical points for ecological flow within landscapes. The number, size, and spatial distribution of these sources significantly influence the structure of the ecological network. To assess the potential impact of nature reserve grade and size on conservation effectiveness, we develop four ecological source schemes:
Scheme A, which includes no natural reserves;
Scheme B, which includes only national natural reserves;
Scheme C, which includes only the larger area of the natural reserves;
Scheme D, which includes all the natural reserves.
Among them, the source patch of scheme A is screened by the“Quality-Morphology-Connectivity” evaluation model, and the other schemes are formed by superimposing different types of nature reserve patches based on scheme A.
The assessment process involves three key evaluations:
1.
Habitat Quality Assessment: The Quality assessment element is completed through the InVEST’s Habitat Quality assessment module. Based on habitat patches including water systems, forest land, grassland, and the farmland, the threat sources are defined as construction land, highways, and railways. A semi-saturation parameter is taken as 0.42 is used, and habitat suitability is set according to the relevant studies in the same region [65] (see Table 2 and Table 3). These parameters are used for screening high-quality habitat patches.
2.
Morphological Evaluation: Morphological evaluation is conducted using Morphological Spatial Pattern Analysis (MSPA). The land use data are converted into binary raster format in Guidos Toolbox, with forests, grasslands, and water bodies designated as the foreground, and other land types assigned to the background, thereby identifying seven distinct landscape patterns. Core areas, which are typically forests, grasslands, and wetlands, serve as primary habitat patches and are considered to be suitable ecological sources. Loop zones have been demonstrated to facilitate species migration by connecting patches within the same core area ( ). Perforation zones, characterized by their transition from green to non-green landscapes, are surrounded by core areas. Edge zones are defined as the peripheral areas that extend beyond the confines of core patches. Bridge zones, located between core patches, facilitate connectivity and function as potential ecological corridors. The function of branch zones is to establish connections between core patches and other foreground patches, except for islets. Islet zones are defined as small, standalone patches that are insufficient to be designated as core areas. In this study, core patches that intersect with high-quality habitats and that have a surface area of ≥170 km2 are selected as ecological sources for scheme A.
3.
Connectivity Analysis: Connectivity is analyzed using Conefor 2.6. The Integral Index of Connectivity (IIC) and the Probability of Connectivity (PC) are two key graph theory metrics. The IIC is indicative of the overall landscape connectivity through the consideration of topological relationships between patches. In contrast, the PC is indicative of species migration probability over varying distances. Typically, the IIC value stabilizes with increasing distance thresholds, and the minimum distance threshold that stabilizes the IIC value is considered the optimal distance. Preliminary tests indicate IIC stability beyond 600 km. To ascertain the optimal distance, thresholds are tested from 100 km to 600 km in 50 km increments. The nodes and links that are located at this optimal distance subsequently form the basis of the corridor. The source patches are then assigned to one of three importance levels, designated as “very important”, “moderately important”, or “general”, based on their dPC values. The calculation methods for IIC, PC, and dPC are outlined in [66,67]:
IIC = i = 1 n j = 1 n a i a j 1 + n l i j A L 2
PC = i = 1 n j = 1 n a i a j p i j A L 2
In Formulas (1) and (2), both IIC and PC are constrained to a 0–1 normalized scale, where metric values demonstrate a direct proportionality to network connectivity and vice versa; n refers to the totality of patches in the landscape; a i and a j represent the areas of patches i and j, respectively; n l i j represents the number of pathways in the shortest topological distance between patches i and j; A L is the total area of all patches; and p i j refers to the maximum product probability of all paths between patches i and j [68,69].
dPC = P C P C r e m o v e P C 100 %
In Equation (3), dPC represents the importance of a particular patch to landscape connectivity, which is determined by the change in the PC value before and after the removal of the patch. A higher value of dPC indicates that the patch is more important to network connectivity. P C r e m o v e denotes the level of connectivity after the removal of the patch.

2.3.2. Construction of Resistance Surface Based on Comprehensive Evaluation Method

The resistance surface reflects the obstacles encountered by ecological flows as they traverse various landscape elements. In this study, we construct the resistance surface using a comprehensive evaluation method that considers seven resistance factors: elevation, slope, land use and land cover, vegetation coverage, distance to water areas, distance to traffic lines, and distance to the built-up areas. Elevation and slope serve as positive indicators, while vegetation coverage is treated as a negative indicator due to its correlation with habitat quality. The distances to water areas, traffic lines, and built-up areas are also treated as negative indicators due to their hindrance to biological migration. We determine the weights for each factor using the entropy weight method (see Table 4).

2.3.3. Modeling of Ecological Network Grounded in Circuit Theory Principles

Ecological corridors serve as pathways for ecological flow between adjacent source patches, typically characterized by areas of lowest resistance. Ecological pinch points represent critical areas of high ecological flow, while barrier points are zones where migration is obstructed due to natural processes or human activities.
In this study, we identify ecological corridors and pinch points using circuit theory [20]. These terms are defined as follows:
1.
An ecological corridor is a channel for ecological flow between adjacent source patches, which is usually connected by the area with the lowest resistance.
2.
Ecological pinch points are the areas with the largest ecological flow in the landscape and the most important key areas of connectivity in the ecological network.
Circuit theory was originally developed for analyzing electrical circuits. McRae adapted this theory for ecological studies [26], positing that the random walk characteristics of both electrons and organisms can be modeled similarly. The study employed the Linkage Mapper toolbox in ArcGIS in conjunction with the CircuitScape 4.0.7 tool to collectively compute ecological corridors and pinch points. The Centrality Mapper module was utilized to analyze the centrality of ecological corridors. This method regards each source patch as a node, each corridor as a resistance, and distributes the resistance value according to the weighted distance of the minimum cost resistance. The higher the resistance value, the greater the importance of the corridor in maintaining the connectivity of the whole network. The corridors are classified into three categories according to their centrality. The ecological pinch point analysis is a process that involves the calculation of current density within designated corridors. The purpose of this analysis is to reflect the strength of ecological flow in various sections. The Pinch Point Mapper tool is utilized to identify pinch points, with the corridor width set at a threshold of 2 km as informed by the studies of Paul Beier [70] and Adam T. Ford [71].

2.3.4. Evaluation of Ecological Networks Based on Landscape Pattern Metrics

To evaluate the effectiveness of ecological networks, it is essential to consider both the networks themselves and the manner in which they are integrated into the regional landscape. Landscape pattern indices have been shown to effectively reflect the spatial patterns and characteristics of various landscape elements, and can assess the performance of ecological networks [13,18]. The present study considers four dimensions—volume, shape, connectivity, and functional stability—utilizing 12 landscape pattern metrics (see Table 5). The calculation methods for these metrics are outlined in references to evaluate the generated ecological networks. The calculation methods for each metric are detailed in the references [72,73,74].
Volume evaluation is a process that examines the impact of network size on regional landscape patterns. These include total patch area, patch density, and core area size. Shape evaluation is the process of analyzing the influence of patch shapes of ecological sources and corridors on the landscape. This is achieved through edge density, fractal dimension, and landscape shape index. Connectivity evaluation, which is distinct from network construction connectivity analysis, assesses the impact on patch aggregation and inter-patch connectivity within the study area. This is achieved using the aggregation index, landscape connectivity, and cohesion index. The evaluation of functional stability utilizes the effective mesh size, Shannon evenness index, and Shannon diversity index to reflect the network’s contribution to habitat diversity and resilience.
Initially, the independence of these indices is tested using the chi-square test in SPSS 29.0, given the discrete nature of the data. In the subsequent phase of the study, ecological sources and corridors are mapped onto the study area’s land type map. After this, landscape-level calculations are conducted using FRAGSTATS 4.2. In light of the findings, the entropy weight method is employed to calculate the weight of each index. Finally, a weighted sum is performed to derive a comprehensive evaluation score for the four ecological networks, thereby determining the most effective optimization scheme.

3. Results

3.1. Ecological Source Patches

3.1.1. Screening of High-Quality Habitat Patches

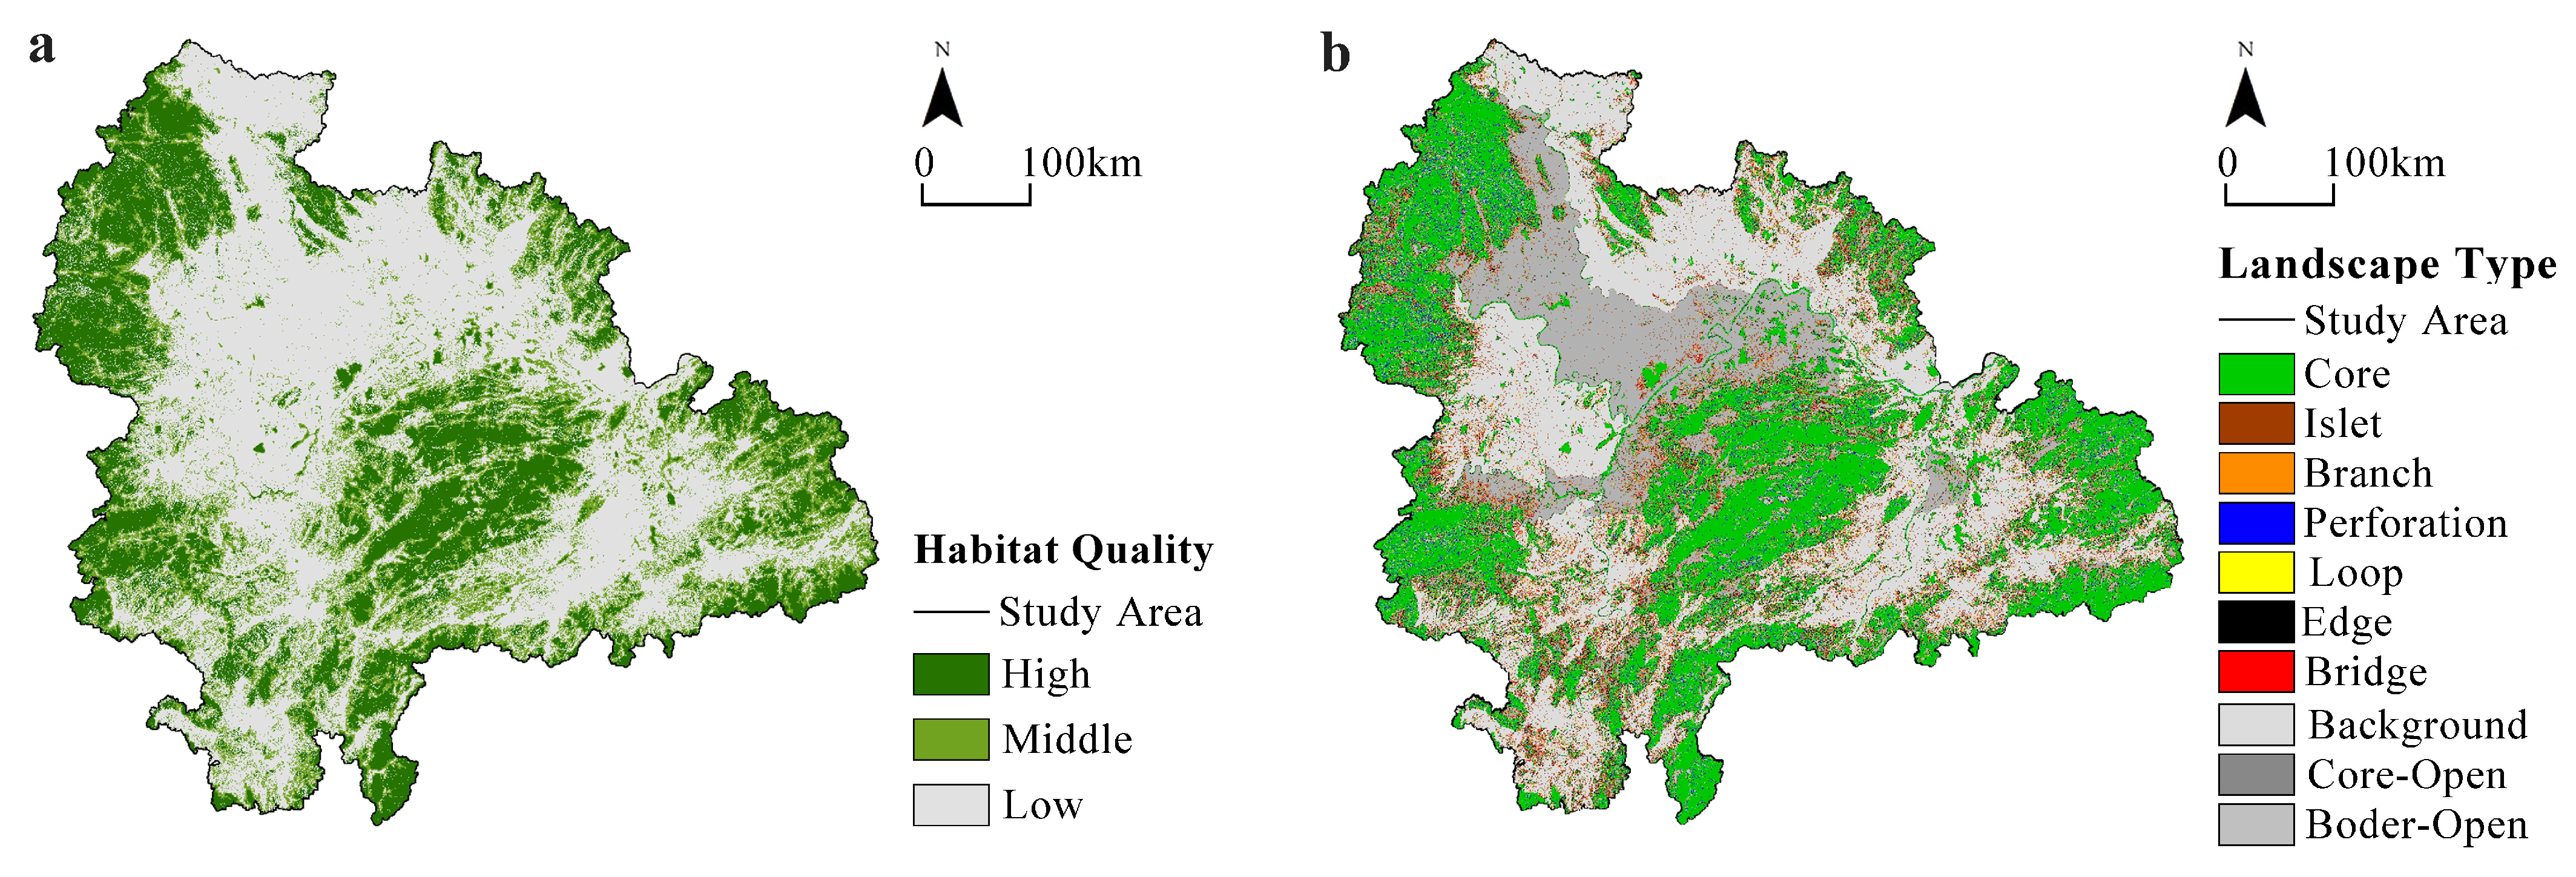
The InVEST Habitat Quality assessment module is employed to evaluate patches of water systems, woodlands, and grasslands. Based on the natural breaks method, habitat quality scores are categorized into three levels: low-quality (0–0.38), medium-quality (0.39–0.72), and high-quality (0.73–1) (see Figure 3a). There are 170,819.2 km2 low-quality patches, 62,015.25 km2 medium-quality patches, and 82,444.89 km2 high-quality patches, accounting for 54.2%, 19.67%, and 26.15% of the total area, respectively. From the spatial distribution, the low-quality patches mainly correspond to the cultivated land and urban and rural construction land in the study area, while the medium-quality patches mainly correspond to the grassland, rivers, lakes, and beaches in the shallow mountains; the high-quality patches mainly correspond to woodlands and grasslands in mountainous areas.

3.1.2. Core Area Patches Screening

Landscape morphological analysis conducted using Guidos Toolbox identifies four types of background patches and seven types of foreground patches (see Figure 3b). The total area of the four background patch types is 161,359.97 km2, accounting for 51.18% of the study area. Among the foreground types, the core area patches are the most extensive, measuring approximately 99,805.79 km2, which is 31.6% of the total area. These “core” patches are predominantly located in mountainous regions and along riverbanks. The edge and perforation areas measure 17,461.18 km2 and 7084.34 km2, respectively, comprising 5.54% and 2.25% of the total area. The bridge areas, which connect core and background patches, cover 9298.78 km2, accounting for 2.95%. The islet and branch patches measure 6695.15 km2 and 8057.18 km2, representing 2.12% and 2.56% of the total area, respectively, while loop areas amount to 5481.21 km2, or 1.74% of the total.
The high-quality habitat patches generated by InVEST are then intersected with the core patches obtained from MSPA. Patches with an intersecting area of at least 170 km2 are selected as ecological sources for scheme A, resulting in a total of 50 patches. In the second scheme, national-level protected areas are incorporated into the first scheme. This process results in 62 source patches being identified, of which eight are classified as independent ecological sources. In the modified version of the scheme C, protected areas with an area of ≥170 km2 are incorporated into the existing scheme A. This modification results in the inclusion of 57 source patches, encompassing six protected areas that were classified as independent sources. In the context of scheme D, all protected areas are included in addition to those encompassed by scheme A. This results in the generation of 82 source patches, of which 33 are found to be protected areas that exist independently (see Figure 4). The results suggest that reliance on quality and morphological assessments alone may result in the under-identification of critical ecological functional zones within the region, such as those around Dongting Lake and Poyang Lake. The incorporation of protected area patches has been demonstrated to facilitate the partial recovery of unrecognized ecological zones. Furthermore, the presence of numerous county-level protected areas, functioning as independent source patches, is shown to effectively mitigate the occurrence of gaps in ecological source identification.

3.1.3. Patch Connectivity Analysis

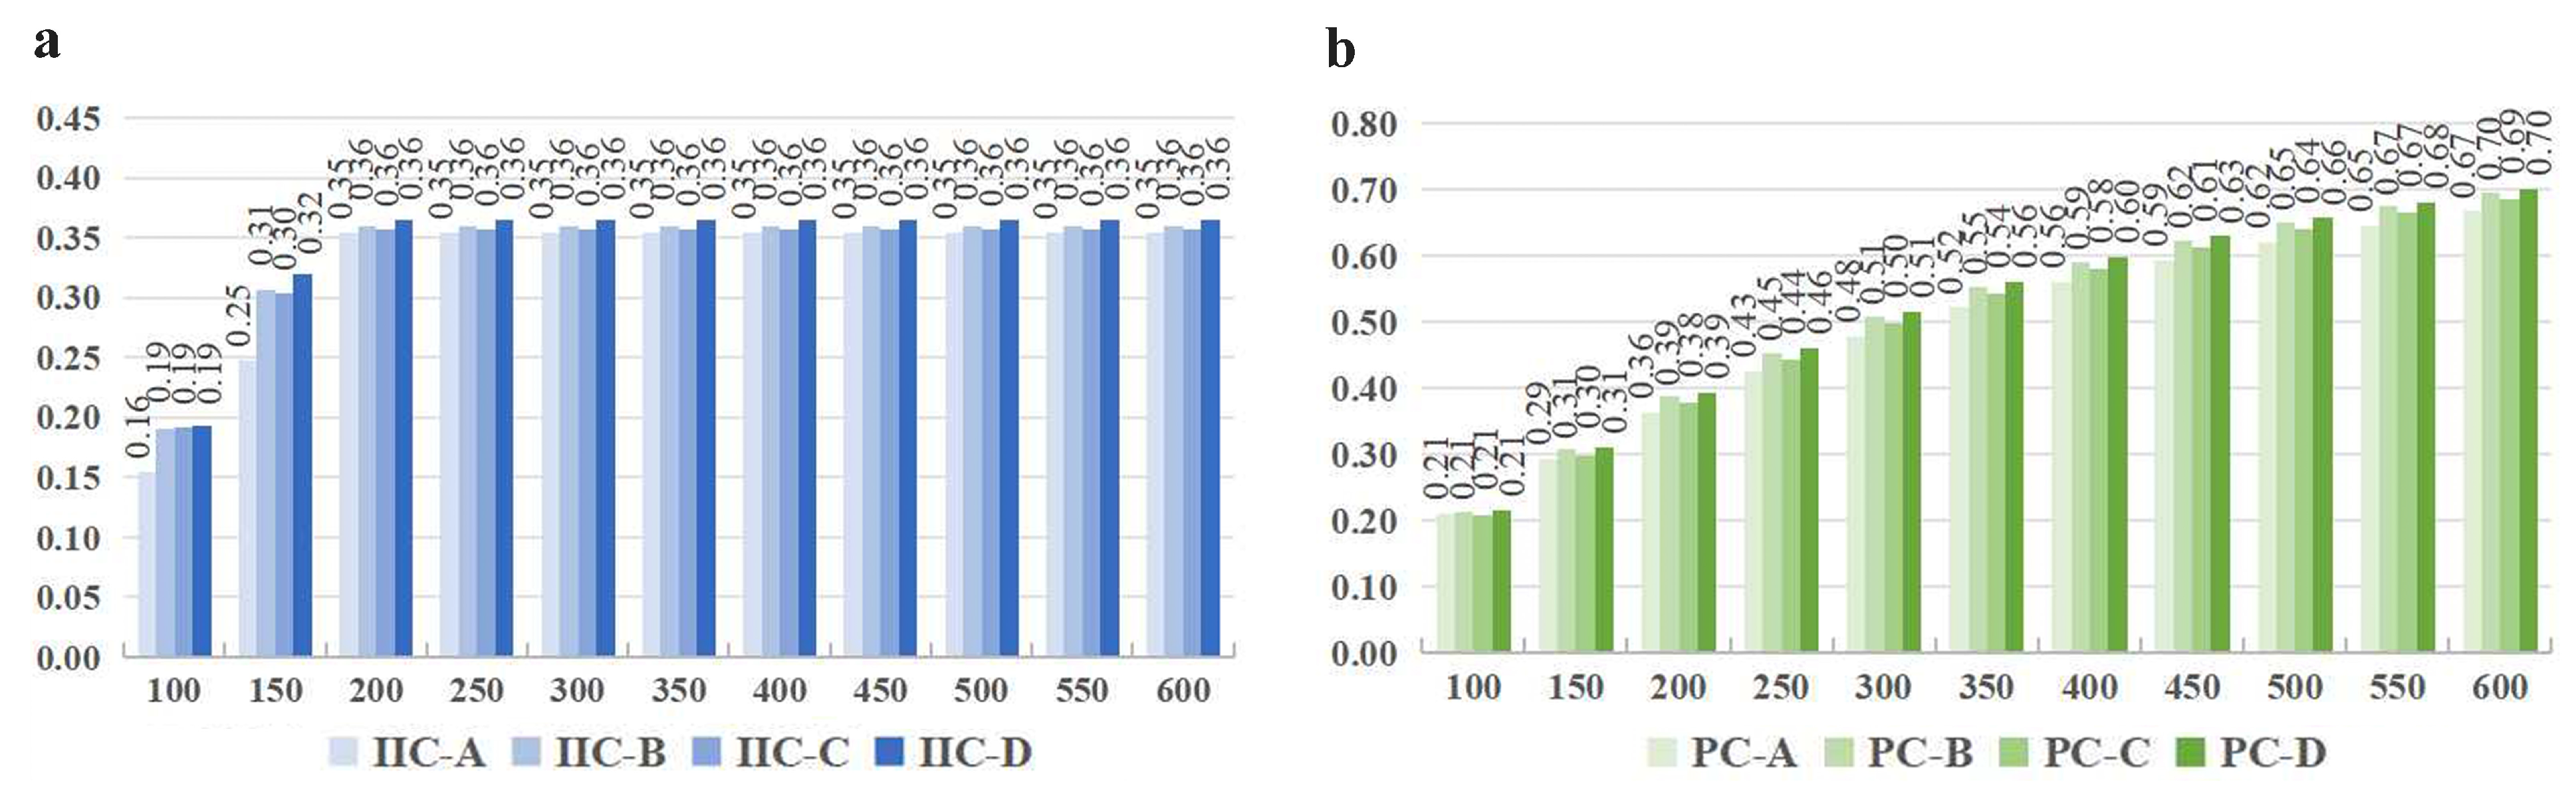
In Conefor 2.6, the AL parameter is set as the total patch area for each scheme, with a “corresponding probability” of 0.5 used to calculate the IIC and PC values at distance thresholds ranging from 100 km to 600 km. Results indicate that PC values increase steadily with distance, while IIC values stabilize after reaching a distance of 200 km (see Figure 5). Consequently, the nodes and connections measured at a distance of 200 km are used as the basis for corridor construction. The dPC values of each scheme are divided into three categories: dPC > 15 for the most important source patches, 15 ≥ dPC > 5 for relatively important source patches, and dPC≤ 5 for general source patches. Comparing the importance of source patches among the four schemes reveals that the inclusion of protected area patches significantly alters the spatial pattern of important patches. The distribution of important source patches is determined by high-level or large protected area patches, while small protected areas could only serve as general ecological source patches.

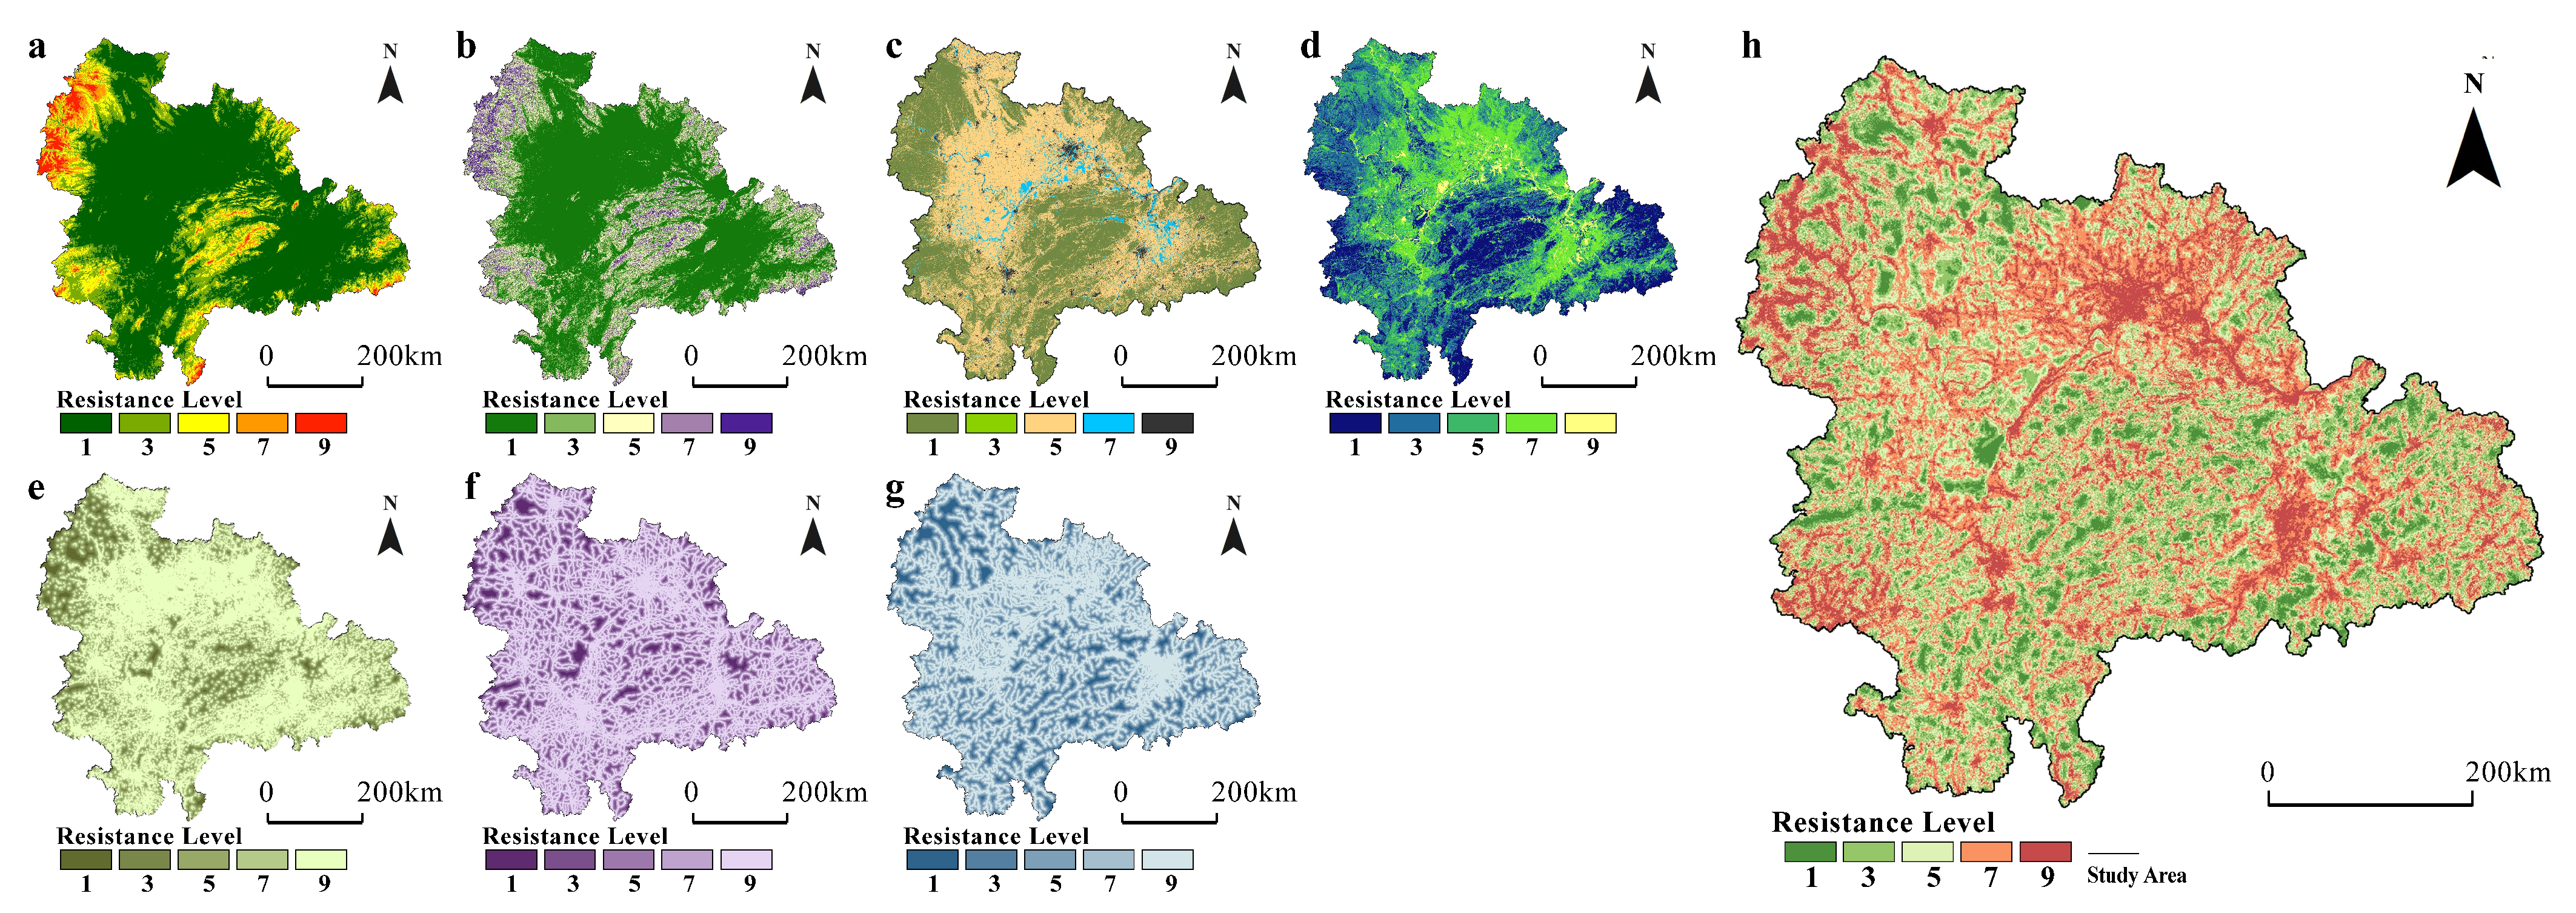
3.2. Comprehensive Resistance Surface

The seven resistance factors are evaluated using ArcGIS, and each factor is reclassified into five resistance levels via the natural breaks method. The evaluation results for elevation (see Figure 6a) and slope (see Figure 6b) indicate that resistance is primarily concentrated in the Luoxiao Mountains, Mufu Mountains, and Mount Lu regions, as well as the mountainous areas surrounding the Xiling Gorge, Wuling Mountains, and Wuyi Mountains, with minimal resistance observed in the plains. Conversely, the land use and land cover analysis reveal that resistance is lower in mountainous regions and higher in plains due to human activities (see Figure 6c). The resistance distribution for the vegetation cover factor (see Figure 6d) is inversely correlated with NDVI values, indicating that densely forested mountainous areas experience lower resistance compared to plains with significant human activity.
Resistance related to distance from built-up areas (see Figure 6e) and traffic lines (see Figure 6f) exhibits an urban-mountain polarization trend. The distance to water areas (see Figure 6g) reveals high resistance concentrations in the plains, while mountainous regions maintain relatively low resistance. The comprehensive resistance surface is generated through the weighted superposition of these seven factors (see Figure 6h), highlighting the influences of elevation, built-up areas, and traffic lines. The distribution characteristics of high-resistance values are oriented by elevation and human activity, while low-resistance areas are primarily located along the banks of the Yangtze, Han, Xiang, and Xin Rivers, as well as around Dongting Lake and Poyang Lake.

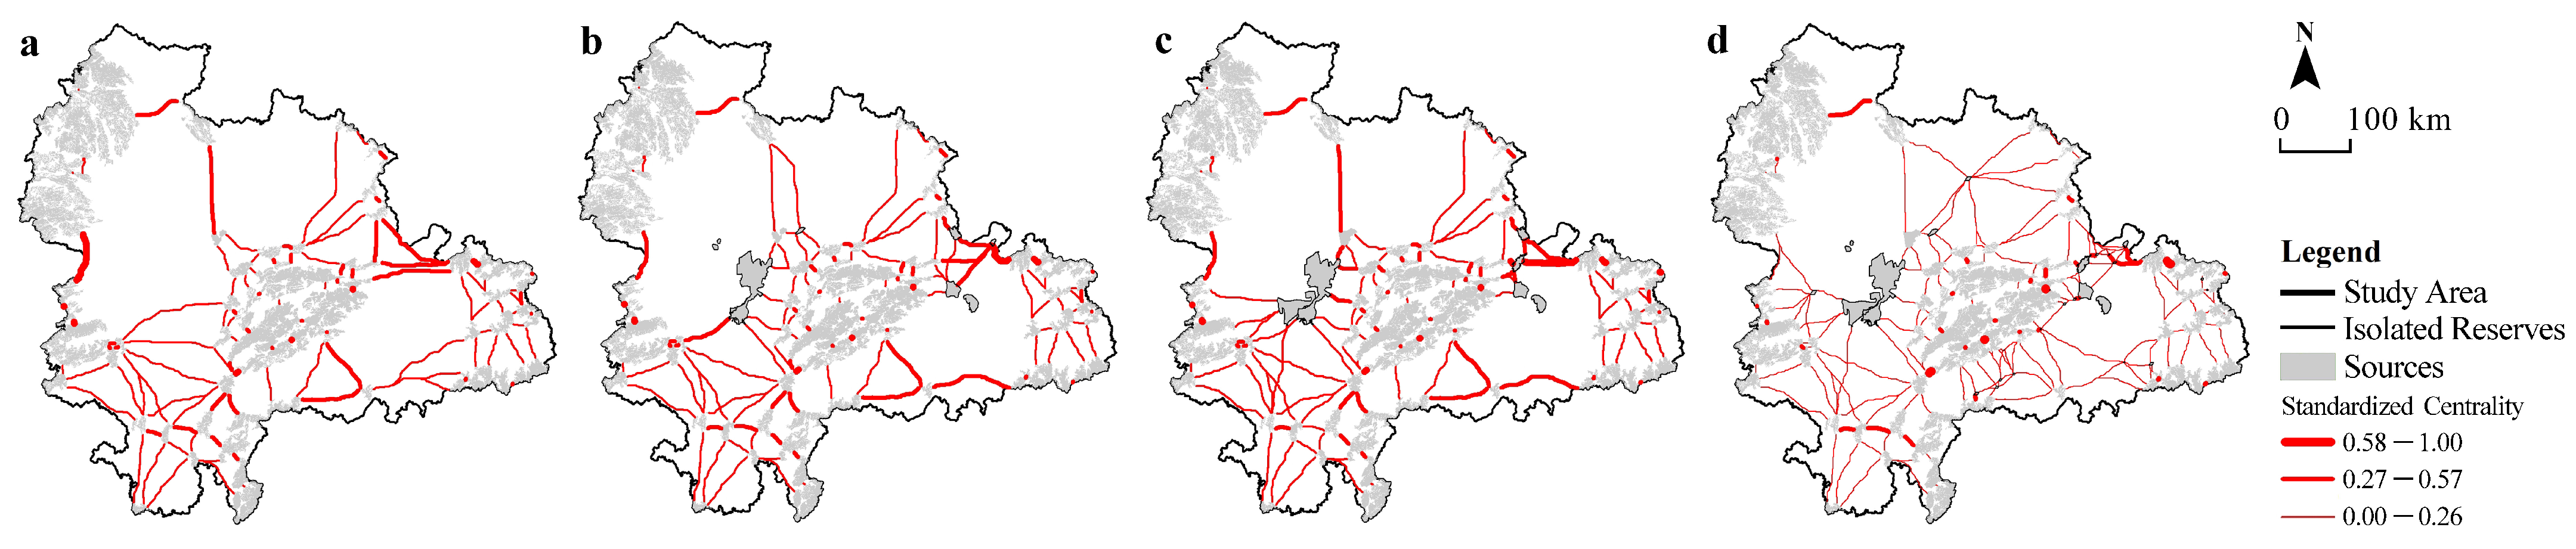
3.3. Ecological Corridors

Using the Linkage Pathways module in ArcGIS, ecological source patches, resistance surface grids, and connectivity data from Conefor are integrated to calculate ecological corridors for the four schemes, setting the distance threshold at 200 km (see Figure 7). To assess corridor importance, the current centrality of the corridors was analyzed using Centrality Mapper, with the results normalized and classified into three levels. An analysis of the attribute data for corridors across the different schemes indicates that, as the size of the source patches increases, the total number of corridors gradually rises; however, the importance of these corridors does not necessarily improve correspondingly (see Table 6). Of the four schemes under consideration, scheme A demonstrates the lowest levels across all corridor indicators. In scheme B, which incorporates a greater number of source patches than scheme C, the number of corridors produced is equivalent to that of scheme C. A notable observation is that scheme C, despite utilizing a smaller number of source patches, results in the generation of corridors that exhibited a higher level of quality. While scheme D yields the highest number of corridors, these arepredominantly of lower importance levels, and the number of high-grade corridors is even less than that of scheme A, where no protected areas are incorporated. This finding indicates that the incorporation of all protected areas primarily results in an augmentation of the spatial coverage of the ecological network, without necessarily ensuring an enhancement in its overall integrity or quality.
In terms of spatial distribution, ecological corridors are primarily concentrated in the Yangtze River, Han River, and Xiang River basins, as well as around Dongting Lake and Poyang Lake. There are relatively fewer corridors in the eastern Jianghan Plain and the southwestern Poyang Lake Plain. The overall spatial pattern of the ecological network is focused along a northeast-southwest axis, with dense corridor distribution along the Wuling Mountains–Dongting Lake–Mufu Mountains–Luoxiao Mountains–Poyang Lake–Dabie Mountains corridor. High-grade ecological corridors are predominantly located in peripheral mountainous areas of the urban cluster, characterized by lower corridor density; conversely, areas with dense corridor networks mainly consist of medium-grade and low-grade corridors. Among the four schemes, scheme D exhibits the most comprehensive corridor coverage and the highest network density.

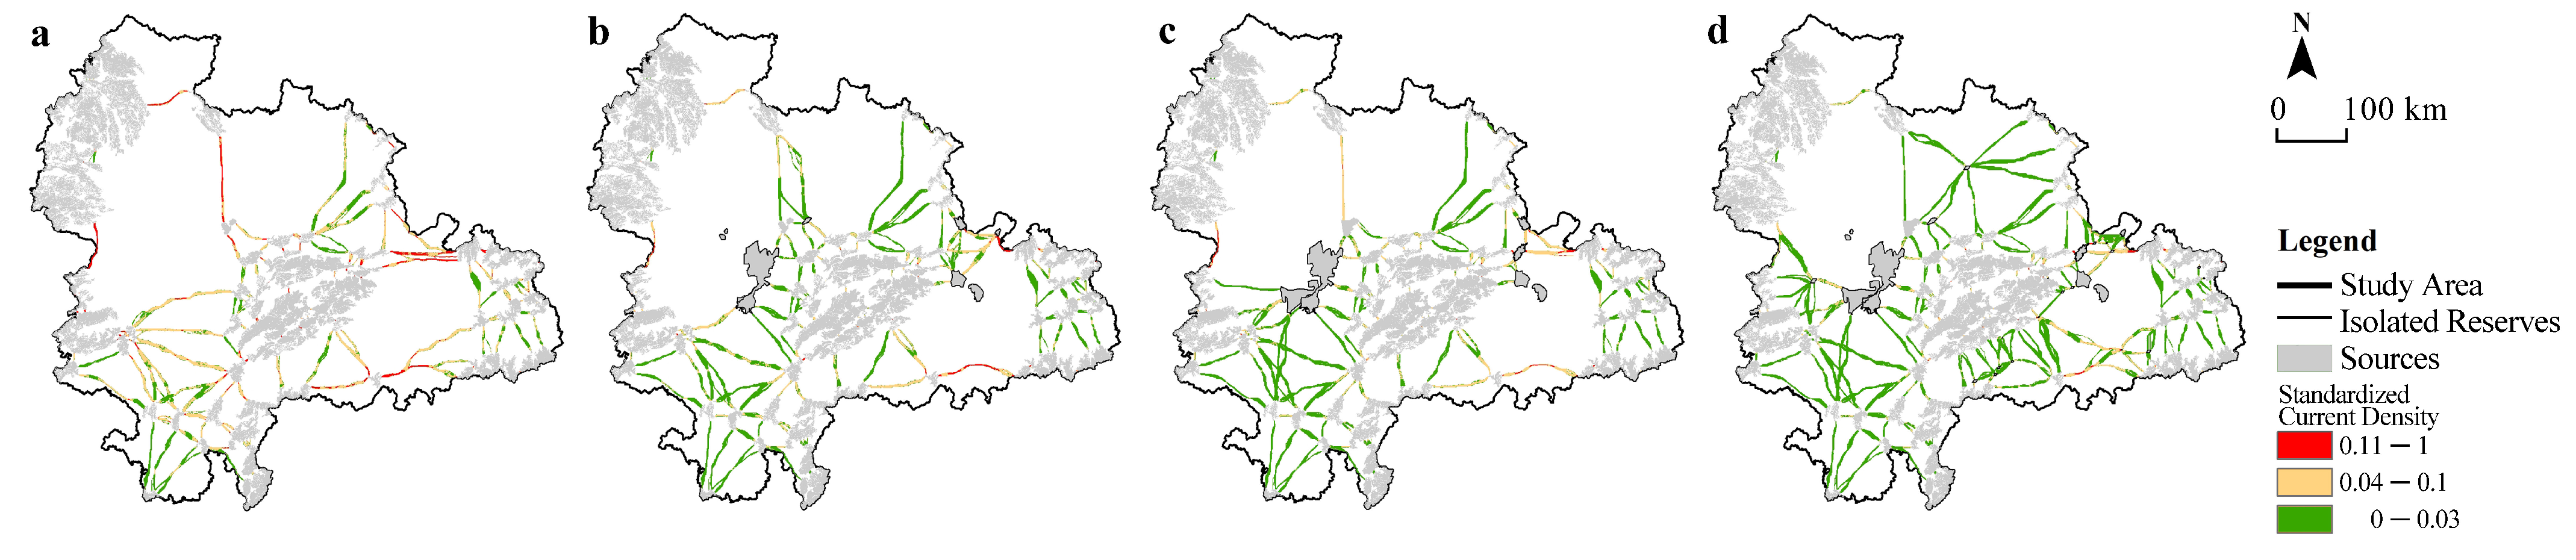
3.4. Ecological Pinch Points

The Pinch Point Mapper module is utilized to calculate the current density between source patches, with a corridor width threshold of 2 km established based on pertinent literature [70,71]. The resulting current density values are then subjected to a process of normalization and categorization into three distinct levels, utilizing the Jenks natural breaks classification method. This classification ranges from low to high levels of current density. As the quantile differences among the schemes are found to be less than 1%, a uniform quantile cutoff of 0.26 and 0.57 is adopted for level division, with values exceeding 0.57 designated as ecological pinch points (see Figure 8).
In the context of the four schemes under consideration, scheme A comprises 35 pinch points, thus encompassing an area of 517.44 km2; scheme B involves 18 pinch points, with a cumulative area of 113.75 km2; scheme C encompassed 21 pinch points, resulting in a total area of 39.06 km2; and scheme D consists of 22 pinch points, covering an area of 32 km2. The incorporation of protected area patches does not result in an escalation in the number or extent of ecological pinch points; instead, a downward trend is observed. Furthermore, as the extent of protected areas increases, the area of ecological pinch points decreases. The observed increase in corridor numbers with more protected areas suggests that the reduction in pinch points may be attributed to the dispersal effect brought about by the proliferation of corridors. This finding indicates that the network’s vulnerability is reduced, and the pathways for population migration become more diverse.
In terms of spatial distribution, ecological pinch points predominantly occur along medium- and high-grade corridors. Across the four schemes, the Dabie Mountains, Wuyi Mountains, and Wuling Mountains are the regions with the highest concentration of pinch points. These areas are critical habitats for key wildlife species such as the South China tiger and clouded leopard. On a local scale, the addition of protected areas directly influences the positioning of ecological pinch points by altering corridor configurations, whereas, from a broader perspective, certain vital ecological zones consistently exhibit high current densities and thus require focused conservation efforts.

3.5. Evaluation of the Four Ecological Networks

A total of 12 landscape pattern metrics are selected within FRAGSTATS to evaluate the constructed ecological network from four perspectives. The results are summarized in Table 7. The measured metrics are standardized, grouped, and aggregated through weighted summation to derive the evaluation scores for each scheme.
In terms of volume assessment, ecological networks that incorporate protected areas, owing to the increased number of source patches and corridors, exhibit a significantly larger scale impact on regional landscape patterns. Compared to scheme A, the other schemes show an 86% increase in total patch area, a 22–23% increase in core area, and a 48% reduction in the density of negative indicators (patch density). This indicates that adding protected area patches markedly optimizes the ecological network in terms of landscape volume.
Shape evaluation reflects the influence of different network designs on patch shape and landscape structure. These indices are predominantly negative metrics; lower scores indicate less fragmented landscapes. The results demonstrate that, relative to scheme A, schemes with protected areas reduce edge density by 46–52% and decrease landscape shape indices by 27–34%. However, changes in fractal dimension are minimal: schemes B and D show decreases of 2–3‰, while scheme C exhibits a slight increase of 1‰. Given the minor magnitude of these variations and their low weighting, they do not significantly affect the overall optimization outcome. The inclusion of protected areas effectively reduces the complexity of landscape shape, thereby potentially slowing fragmentation.
Connectivity assessment aims to evaluate how different schemes influence patch aggregation and inter-patch connectivity within the study area. The results indicate a 14–16% improvement in patch aggregation. However, other metrics show variable trends: schemes B and C experience increases in connectivity and patch linkage, whereas scheme D exhibits declines in both, with scores even falling below scheme A. After weighted summation, scheme B’s connectivity level matches that of scheme A, with minor improvements observed in the other two schemes. This suggests that larger protected patches have a greater role in enhancing network connectivity, whereas an excess of smaller protected patches may weaken overall connectivity.
Functional stability assessment reflects the contribution of the ecological network to habitat diversity and resilience. The results show that networks containing protected areas increase the effective grid by 14–16%, but Shannon’s diversity index decreases by 1–8%. Variations in the Shannon diversity index reveal that schemes B and D achieve approximately a 3% increase, whereas scheme C experiences an 8% decline. This indicates that incorporating protected areas can effectively enhance landscape stability but may lead to localized biodiversity losses. Since the effective grid index carries a substantially higher weight compared to the other indices, the overall scores favor networks with protected areas.
The comprehensive evaluation score is obtained through the weighted integration of all indices (see Table 8). The results demonstrate that ecological networks with protected areas significantly outperform those without in optimizing regional landscape patterns. However, increasing the number of protected patches does not necessarily translate into better outcomes; for example, scheme D, which includes the most protected patches, shows less improvement in volume and stability compared to other schemes. Additionally, selecting only national-level protected areas does not guarantee the best results; for instance, scheme B exhibits no gains in connectivity and ranks lower overall than scheme C. Scheme C, which achieves significant improvements across volume, shape, connectivity, and stability, attains the highest comprehensive score. These findings suggest that when adding protected patches, greater emphasis should be placed on patch size. It is advisable to ensure that the minimal protected area of added patches is not smaller than that of the original source patches, thereby maintaining consistency in spatial scale and promoting effective network optimization.

4. Discussion

4.1. The Influence of Spatial Scale on the Integration Effectiveness of Nature Reserves Within Urban Agglomeration Ecological Networks

As a critical strategy for conserving key species and ecosystems, nature reserves are widely implemented globally. It is generally recognized that integrating nature reserves with ecological networks can effectively expand ecological connectivity and enhance ecosystem services. However, the specific manifestations of such optimization, the degree of improvement, and the criteria for selecting reserve patches to achieve optimal outcomes remain insufficiently demonstrated.
In this study, we first generated an initial ecological source scheme based on habitat quality analysis and spatial pattern analysis of landscape morphology. Subsequently, three different source schemes were developed: one including only national-level protected areas, another including protected areas with an area larger than 170 km2, and a third incorporating all protected areas. For each scheme, corresponding ecological networks were constructed, and their attributes and performance were evaluated.
The results indicate that integrating protected areas into the urban agglomeration ecological network significantly improves the network’s coverage, corridor quantity, and overall functional efficacy, aligning with the general expectations. However, the optimization effects are not necessarily proportional to the protected area level or total area. Among the three schemes, Scheme C—characterized by relatively consistent spatial scales among patches—achieved the overall best optimization performance. This suggests that the impact of nature reserves on the ecological network is closely linked to spatial scale, and that excessive disparity in patch sizes may hinder the desired enhancement.
From a landscape ecology perspective, patches of differing spatial scales serve distinct functions within ecological networks. Large protected patches primarily act as core sources, providing habitats for multiple species and connecting major regional corridors. Conversely, small protected patches play a crucial role in local connectivity and can serve as stepping stones for species migration. Given the scale-dependent nature of ecological processes, excessive heterogeneity in patch size can weaken network connectivity and stability. Therefore, when integrating nature reserves into regional ecological networks, it is essential to consider the consistency of patch spatial scales to ensure the overall functional integrity and effectiveness of the ecological network.

4.2. The Urgent Need for Improvement in Habitat Quality Within Nature Reserves

The influence of nature reserves on regional ecological networks is closely linked not only to spatial scale but also to their intrinsic habitat quality. If a protected area faces ongoing habitat degradation, its capacity to positively contribute to the broader ecological network is severely limited. In the present study, the two major ecological regions—Dongting Lake and Poyang Lake—originally served as vital wetland habitats along the middle Yangtze River, supporting rare species such as finless porpoises, black storks, and Père David’s deer. However, from 1982 to 2018, extensive activities such as lake enclosure for agriculture and net cage aquaculture led to substantial reductions in water surface area and a significant decline in ecosystem service functions [75]. After evaluation using InVEST and MSPA, only tiny patches remained within these regions, and only when combined with protected areas could their sizes meet the requirements for ecological sources within the urban agglomeration.
The situation of Dongting Lake and Poyang Lake is not unique. Currently, the habitat quality within China’s protected areas faces a dual threat of fragmentation and functional decline. Intense human activities remain the primary cause of habitat degradation in many protected zones. For instance, in the Qinling Mountains panda habitat, traditional disturbances such as logging and hunting have been largely eliminated due to relocation and conservation campaigns. Nevertheless, new threats have emerged from urban development activities, including energy extraction, mining, and forest tourism, which have introduced new pressures within protected areas [76]. Habitat degradation within protected zones not only adversely affects the resident species but may also create weak links in the regional ecological network, thereby undermining its overall functionality. Consequently, improving habitat quality within protected areas is crucial for optimizing ecological networks in urban agglomerations. This effort should not be hindered by administrative boundaries or isolated management systems; rather, integrated strategies are essential to ensure the resilience and effectiveness of the regional ecological network.
The influence of nature reserve grade manifests primarily in the quantity of high-level sources and corridors. Incorporating national reserves is sufficient to identify the most critical sources and corridors within the urban agglomeration; however, the protective benefits associated with higher-grade reserves are less evident in the overall network structure. The location of reserves predominantly affects the local positioning of corridors, pinch points, and barrier points. While small-scale reserves can influence local network patterns due to their proximity, they do not significantly alter the broader spatial structure established by larger sources and high-grade corridors. Therefore, integrating larger nature reserves into the ecological source areas is crucial for optimizing the ecological network, reinforcing the notion that the area attribute of nature reserves plays a vital role in enhancing the connectivity and effectiveness of urban agglomeration ecological networks.

4.3. Establishing Cross-Regional and Cross-Departmental Collaborative Management Mechanisms for Nature Reserves and Ecological Networks

The effective coordination between nature reserves and ecological networks necessitates the development of cross-regional and cross-sectoral collaboration mechanisms. Currently, the management systems of nature reserves are significantly influenced by administrative compartmentalization. Different types of reserves often fall under various government departments such as forestry, agriculture, environmental protection, and natural resources, which pose substantial challenges for interdepartmental and intergovernmental coordination. To facilitate the effective integration of nature reserves within ecological networks, it is recommended to establish dedicated ecological network management and coordination agencies that can unify resources and data across departments, develop standardized planning frameworks, and implement cohesive management strategies. Additionally, establishing ecological compensation mechanisms can help align the interests of protected areas and surrounding communities, thereby reducing human disturbances to the ecological network.
In 2022, the Kunming-Montreal Global Biodiversity Framework adopted at COP15 set the 30 × 30 biodiversity conservation target, aiming to protect at least 30% of the Earth’s land and sea areas by 2030. For China, this implies that the area of various protected regions must increase by approximately 60% over the next decade, highlighting ongoing conflicts between development and conservation. As Isaac Eckert’s research indicates, achieving the 30 × 30 goal requires not only expanding protected area coverage but also establishing cross-regional conservation cooperation mechanisms [77]. Integrating protected areas with regional ecological networks can enhance connectivity and improve overall network efficacy. The implementation of regional ecological conservation strategies thus fundamentally relies on establishing and strengthening cross-regional and cross-sectoral management collaboration mechanisms.

4.4. Limitations and Future Directions

This study has several limitations that warrant consideration. First, due to the constraints of the experimental equipment, the accuracy of the raster data employed was uniformly adjusted to a resolution of 250 m. While this resolution reflects the overall ecological resistance distribution within the study area, it may not adequately capture finer landscape details, which could influence the ecological network’s effectiveness.
Second, the construction of ecological networks encompasses multiple dimensions, including functional, structural, and integrative orientations [78]. This study primarily focused on enhancing landscape connectivity from a structural perspective, emphasizing the structural implications of nature reserves on ecological networks. Future research should delve deeper into the functional aspects of ecological networks to provide a more holistic understanding of their dynamics.
Lastly, this study is limited to the MRYR as a case study, and the results may not be universally applicable. Further experimental validation is needed to assess whether the observed effects of nature reserves on ecological networks are consistent across other urban agglomerations. Expanding this research to include diverse geographic and ecological contexts will enhance our understanding of the role of nature reserves in urban ecological networks.
Additionally, this study also identifies the broader environmental benefits of ecological networks, particularly in mitigating urban heat island (UHI) effects. Increasing the size of ecological corridors and green infrastructure provides a crucial cooling function by facilitating air flow, increasing evapotranspiration, and reducing surface temperatures.
Future research will consider utilizing remote sensing thermal data to understand temperature variations across different ecological corridors and source patches, and biodiversity indicators (e.g., bird, mammal, or amphibian migration patterns) [79] will be used to refine ecological corridors. In addition, more emphasis will be placed on the research of collaborative management strategies [80] in ecological environment management to address the challenges of cross-regional planning and conflicts among stakeholders, which will contribute to the continuous optimization of the ecological network.

5. Conclusions

The synergistic development of nature reserves and urban agglomeration ecological networks enhances landscape connectivity within urban clusters, representing a vital strategy to mitigate ecological pressures resulting from rapid urbanization. This study focuses on the middle Yangtze River urban agglomeration, employing a “Quality-Morphology-Connectivity” evaluation approach to design four ecological source schemes. Using circuit theory tools, corresponding ecological networks were constructed, and their performance was compared through a landscape index evaluation system to analyze the influence of nature reserves on the regional ecological network. The key findings are as follows:
(1) The inclusion of nature reserves can supplement ecological sources, increase corridor quantity, and enhance the ecological network’s positive impacts on regional landscape structure and function. For example, scheme C demonstrated significant improvements across size, morphology, connectivity, and functional stability, achieving the highest overall score. This indicates that the rational integration of protected patches effectively improves network connectivity and stability, providing broader space for species migration and gene flow.
(2) The impact of nature reserves on the urban agglomeration’s ecological network is closely related to the spatial scale of patches. The study found that schemes with more consistent patch sizes, such as scheme C, yielded optimal optimization results. This underscores the importance of considering spatial scale uniformity when constructing ecological networks, as excessive disparities in patch size may impair network function.
(3) Establishing cross-sectoral and cross-scale collaborative management mechanisms is critical for organically integrating nature reserves with ecological networks. Current management systems are hindered by administrative compartmentalization, with different types of reserves managed by multiple departments, complicating interdepartmental coordination. To address this, it is recommended to establish interdepartmental ecological network management and coordination agencies that can unify resources and data, and develop standardized planning and management strategies. Furthermore, aligning efforts with the 30 × 30 biodiversity conservation target, along with international cooperation and funding, can enhance protected area capacities and improve network connectivity.
In summary, this research provides a scientific basis for constructing ecological networks within urban agglomerations, emphasizing the importance of incorporating nature reserves into regional ecological planning. The findings offer valuable insights for ecological protection planning and protected area management, especially regarding optimized spatial layout, enhanced network functions, and promoting cross-regional collaboration. Future studies should further explore the interaction mechanisms between nature reserves and ecological networks across different scales and regions, aiming to contribute to global ecological conservation and sustainable development efforts.

Author Contributions

Conceptualization, W.L. and X.L.; methodology, W.L.; software, W.L.; validation, W.L., X.L., A.J. and J.M.; formal analysis, W.L.; investigation, W.L., X.L., A.J. and J.M.; resources, W.L.; data curation, W.L.; writing—original draft preparation, W.L. and X.L.; writing—review and editing, X.L. and J.M.; visualization, W.L.; supervision, X.L. and A.J.; project administration, X.L. All authors have read and agreed to the published version of the manuscript.

Funding

This research received no external funding.

Data Availability Statement

The data presented in this study are available upon request from the corresponding author.

Conflicts of Interest

The authors declare no conflict of interest.

Notes

1
The middle reaches of the Yangtze River Urban Agglomeration is located in the central region of China, spanning Hubei, Hunan, and Jiangxi provinces [54]. It is a super large urban agglomeration formed by the Wuhan urban agglomeration, the Greater Changsha Metropolitan Region ring, and the Poyang Lake urban agglomeration. The construction of the urban agglomeration was approved by the State Council in March 2015.
2
The setting of the semi-saturation parameter is as follows: According to the InVEST User Manual, in the habitat quality analysis, the semi-saturation parameter should initially be set to 0.5 for an initial calculation. This yields two results: “Habitat Quality Evaluation” and “Habitat Degradation Evaluation”. The rational value of the semi-saturation parameter is then determined as half of the maximum score obtained from the “Habitat Degradation Evaluation”. In this experiment, the maximum score for the habitat degradation evaluation was 0.83, and thus, half of this value, approximately 0.4, was adopted as the semi-saturation parameter.

References

  1. Seto, K.C.; Fragkias, M.; Gueneralp, B.; Reilly, M.K. A Meta-Analysis of Global Urban Land Expansion. PLoS ONE 2011, 6, 0023777. [Google Scholar] [CrossRef] [PubMed]
  2. Zou, L.L.; Wang, J.Y.; Bai, M.D. Assessing spatial-temporal heterogeneity of China’s landscape fragmentation in 1980–2020. Ecol. Indic. 2022, 136, 108654. [Google Scholar] [CrossRef]
  3. Foltête, J.C.; Girardet, X.; Clauzel, C. A methodological framework for the use of landscape graphs in land-use planning. Landsc. Urban Plan. 2014, 124, 140–150. [Google Scholar] [CrossRef]
  4. McKinney, M.L. Urbanization as a major cause of biotic homogenization. Biol. Conserv. 2006, 127, 247–260. [Google Scholar] [CrossRef]
  5. Mckinney, M.L. Effects of urbanization on species richness: A review of plants and animals. Urban Ecosyst. 2008, 11, 161–176. [Google Scholar] [CrossRef]
  6. Hou, W.; Liu, J.L.; Walz, U. Optimization of green infrastructure networks in the perspectives of enhancing structural connectivity and multifunctionality in an urban megaregion. J. Environ. Manag. 2023, 348, 13. [Google Scholar] [CrossRef]
  7. Shen, Z.; Wu, W.; Tian, S.Q.; Wang, J. A multi-scale analysis framework of different methods used in establishing ecological networks. Landsc. Urban Plan. 2022, 228, 16. [Google Scholar] [CrossRef]
  8. Taylor, P.D.; Fahrig, L.; Henein, K.; Merriam, G. Connectivity is a vital element of landscape structure. Oikos 1993, 68, 571–573. [Google Scholar] [CrossRef]
  9. Taylor, P.D.; Fahrig, L.; With, K.A. Landscape Connectivity: A Return to the Basics; Cambridge University Press: Cambridge, UK, 2006. [Google Scholar] [CrossRef]
  10. Modica, G.; Praticò, S.; Laudari, L.; Ledda, A.; Di Fazio, S.; De Montis, A. Implementation of multispecies ecological networks at the regional scale: Analysis and multi-temporal assessment. J. Environ. Manag. 2021, 289, 18. [Google Scholar] [CrossRef]
  11. Mossman, H.L.; Panter, C.J.; Dolman, P.M. Modelling biodiversity distribution in agricultural landscapes to support ecological network planning. Landsc. Urban Plan. 2015, 141, 59–67. [Google Scholar] [CrossRef]
  12. Harris, L.D. The fragmented forest: Island biogeography theory and the preservation of biotic diversity. J. Wildl. Manag. 1986, 50, 176. [Google Scholar] [CrossRef]
  13. Forman, R.T.T. Some general principles of landscape and regional ecology. Landsc. Ecol. 1995, 10, 133–142. [Google Scholar] [CrossRef]
  14. Wu, J. Landscape Ecology—Concepts and Theories. Chin. J. Ecol. 2000, 19, 11. [Google Scholar]
  15. Ding, C.L.; Jie, F.B.; Wu, Z.W. Source-sink landscape theory and its ecological significance. Acta Ecol. Sin. 2006, 3, 131–136. [Google Scholar]
  16. Yin, H.; Kong, F.; Qi, Y.; Wang, H.; Qin, Z. Developing and optimizing ecological networks in urban agglomeration of Hunan Province, China. Acta Ecol. Sin. 2011, 31, 2863–2874. [Google Scholar]
  17. Yu, K.J. Landscape ecological security patterns in biological conservation. Acta Ecol. Sin. 1999, 19, 8–15. [Google Scholar]
  18. Li, Q.Q.; Jin, X.B.; Zhang, X.L.; Han, B.; Li, H.B.; Zhou, Y.K. Comparison and evaluation of the ecological network construction method based on principles of landscape ecology. Acta Ecol. Sin. 2023, 43, 1461–1473. [Google Scholar]
  19. Kong, F.H.; Yin, H.W. Developing green space ecological networks in Jinan city. Acta Ecol. Sin. 2008, 28, 1711–1719. [Google Scholar]
  20. Zhang, W.; Fan, Y.; Wang, B. Ecological Network Construction Based on Ecosystem Services and Landscape Pattern Indices in the Tabu River Basin. Land 2024, 13, 2209. [Google Scholar] [CrossRef]
  21. Huang, M.; Gong, D.; Zhang, L.; Lin, H.; Chen, Y.; Zhu, D.; Xiao, C.; Altan, O. Spatiotemporal dynamics and forecasting of ecological security pattern under the consideration of protecting habitat: A case study of the Poyang Lake ecoregion. Int. J. Digit. Earth 2024, 17, 2376277. [Google Scholar] [CrossRef]
  22. Shuai, N.; Hu, Y.; Chen, J.; Liu, X.; Bai, Y. Does ecological network affect the construction land spatial development intensity?—An empirical study based on the main urban area of Jinan, China. Ecol. Inform. 2024, 81, 102609. [Google Scholar] [CrossRef]
  23. Kong, F.H.; Yin, H.W.; Nakagoshi, N.; Zong, Y.G. Urban green space network development for biodiversity conservation: Identification based on graph theory and gravity modeling. Landsc. Urban Plan. 2010, 95, 16–27. [Google Scholar] [CrossRef]
  24. Xu, D.; Peng, J.; Jiang, H.; Dong, J.; Liu, M.; Chen, Y.; Wu, J.; Meersmans, J. Incorporating barriers restoration and stepping stones establishment to enhance the connectivity of watershed ecological security patterns. Appl. Geogr. 2024, 170, 103347. [Google Scholar] [CrossRef]
  25. Shi, J.; Shi, P.; Wang, Z.; Wan, Y.; Cheng, F.; Wang, L.R. Ecological network optimization of Jiuquan City, Gansu, China based on complex network theory and circulated model. Chin. J. Appl. Ecol. 2024, 35, 237–246. [Google Scholar] [CrossRef]
  26. McRae, B.H.; Beier, P. Circuit theory predicts gene flow in plant and animal populations. Proc. Natl. Acad. Sci. USA 2007, 104, 19885–19890. [Google Scholar] [CrossRef]
  27. Liu, X.; Zhang, Z.; Li, M.; Fu, Y.; Hui, Y. Ecological source identification based on the PSR model framework and structural features: A case study in Tianjin, China. Arab. J. Geosci. 2022, 15, 853. [Google Scholar] [CrossRef]
  28. Li, J.; Liang, L.; Chao, Y.; Wang, X.; Qiu, M.; Luo, P.; Zhu, Y. Construction of the ecological security pattern of Mu Us sandy land on the basis of the “Source-Resistance—Corridor” theory. Ecol. Indic. 2025, 171, 113162. [Google Scholar] [CrossRef]
  29. Shen, J.; Zhu, W.; Peng, Z.; Wang, Y. Improving landscape ecological network connectivity in urbanizing areas from dual dimensions of structure and function. Ecol. Model. 2023, 482, 110380. [Google Scholar] [CrossRef]
  30. Dong, X.; Wang, F.; Fu, M. Research progress and prospects for constructing ecological security pattern based on ecological network. Ecol. Indic. 2024, 168, 112800. [Google Scholar] [CrossRef]
  31. Wu, X.; Pan, J.; Zhu, X. Optimizing the ecological source area identification method and building ecological corridor using a genetic algorithm: A case study in Weihe River Basin, NW China. Ecol. Inform. 2024, 80, 102519. [Google Scholar] [CrossRef]
  32. Williams, D.R.; Rondinini, C.; Tilman, D. Global protected areas seem insufficient to safeguard half of the world’s mammals from human-induced extinction. Proc. Natl. Acad. Sci. USA 2022, 119, e2200118119. [Google Scholar] [CrossRef] [PubMed]
  33. Guo, W.Y.; Serra-Diaz, J.M.; Schrodt, F.; Eiserhardt, W.L.; Maitner, B.S.; Merow, C.; Violle, C.; Anand, M.; Belluau, M.; Bruun, H.H.; et al. High exposure of global tree diversity to human pressure. Proc. Natl. Acad. Sci. USA 2022, 119, e2026733119. [Google Scholar] [CrossRef] [PubMed]
  34. Hou, W.; Zhai, L.; Walz, U. Identification of spatial conservation and restoration priorities for ecological networks planning in a highly urbanized region: A case study in Beijing-Tianjin-Hebei, China. Ecol. Eng. 2023, 187, 106859. [Google Scholar] [CrossRef]
  35. Wang, H.-y.; Kuang, Y.-q.; Wen, X.c.; Song, Z.c.; Liu, D.h. Ecological network construction and corridor optimization in Guangdong-Hong Kong-Macao Greater Bay Area. China Environ. Sci. 2022, 42, 2289–2298. [Google Scholar] [CrossRef]
  36. Huang, J.; Huang, J.; Chen, C. Construction of ecological network with protected areas as the main region in Guangzhou City, China. Chin. J. Appl. Ecol. 2024, 35, 247–254. [Google Scholar] [CrossRef]
  37. Zhang, M.; Li, J.; Wang, L.; Xu, B.; Nie, W. The impact of connectivity in natural protected areas on the resilience of urban ecological networks: A research framework based on hierarchical disturbance scenario simulation. Ecol. Indic. 2024, 164, 112144. [Google Scholar] [CrossRef]
  38. Zhong, C.; Chen, J.; Yang, H.; Jin, T.; Zhang, Z.; Hu, Z.; Wu, K. Assessment of conservation effectiveness in nature reserves of four provinces in western China based on kernel Normalized Difference Vegetation Index data. Acta Ecol. Sin. 2025, 45, 1199–1209. [Google Scholar] [CrossRef]
  39. Jian, Y.Z. Driving factors in the spatial distribution of China’s natural reserves. China Popul. Resour. Environ. 2022, 32, 144–155. [Google Scholar]
  40. Feng, C.; Luo, J.; Liu, F.; Zhou, Y.; Zhang, L.; Du, J.; Wang, W. Evaluation of Management Status of National Nature Reserves in the Yangtze. Res. Environ. Sci. 2020, 33, 709–717. [Google Scholar] [CrossRef]
  41. Kong, W.; Shen, W.; Yu, C.; Niu, L.; Zhou, H.; Zhang, Z.; Guo, S. The neglected cost: Ecosystem services loss due to urban expansion in China from a triple-coupling perspective. Environ. Impact Assess. Rev. 2025, 112, 107827. [Google Scholar] [CrossRef]
  42. Li, P.; Li, T. Spatiotemporal analysis of ecosystem services and the impact of new-type urbanization: A case study of Chengdu, China. Ecol. Indic. 2025, 171, 113191. [Google Scholar] [CrossRef]
  43. Guan, Q.; Chen, J.; Guan, C.; Li, H.; Zhou, X.; Meng, T. The responses of ecosystem services in coastal cities to urbanization in 30 years: A case study of Qingdao City, China. Ocean. Coast. Manag. 2024, 258, 107415. [Google Scholar] [CrossRef]
  44. Nie, Y.; Zhang, X.; Yang, Y.; Liu, Z.; He, C.; Chen, X.; Lu, T. Assessing the impacts of historical and future land-use/cover change on habitat quality in the urbanizing Lhasa River Basin on the Tibetan Plateau. Ecol. Indic. 2023, 148, 110147. [Google Scholar] [CrossRef]
  45. Xu, J.; Ling, Y.; Sun, Y.; Jiang, Y.; Shen, R.; Wang, Y. How do different processes of habitat fragmentation affect habitat quality?—Evidence from China. Ecol. Indic. 2024, 160, 111880. [Google Scholar] [CrossRef]
  46. Qin, X.; Yang, Q.; Wang, L. The evolution of habitat quality and its response to land use change in the coastal China, 1985–2020. Sci. Total. Environ. 2024, 952, 175930. [Google Scholar] [CrossRef]
  47. Liu, C.; Liu, D.; Li, P.; Li, X.; Liu, Z.; Zhao, Y. Assessment of occupation of natural habitat by urban expansion and its impact on crucial ecosystem services in China’s coastal zone. Ecol. Indic. 2023, 154, 110682. [Google Scholar] [CrossRef]
  48. Ke, X.; van Vliet, J.; Zhou, T.; Verburg, P.H.; Zheng, W.; Liu, X. Direct and indirect loss of natural habitat due to built-up area expansion: A model-based analysis for the city of Wuhan, China. Land Use Policy 2018, 74, 231–239. [Google Scholar] [CrossRef]
  49. Chen, W.; Wang, G.; Gu, T.; Fang, C.; Pan, S.; Zeng, J.; Wu, J. Simulating the impact of urban expansion on ecosystem services in Chinese urban agglomerations: A multi-scenario perspective. Environ. Impact Assess. Rev. 2023, 103, 107275. [Google Scholar] [CrossRef]
  50. National Development and Reform Commission, People’s Republic of China. The Outline of the 14th Five-Year Plan for National Economic and Social Development and Long-Range Objectives Through the Year 2035 of the People’s Republic of China. 2021. Available online: https://www.gov.cn/xinwen/2021-03/13/content_5592681.htm (accessed on 23 April 2025).
  51. Liaoning Provincial Committee of the Communist Party of China Higher Education Working Committee. Report of Hu Jintao to the 18th National Congress of the Communist Party of China. 2012. Available online: http://lngxdj.neu.edu.cn/2016/0630/c1990a25202/pagem.htm (accessed on 23 April 2025).
  52. The Communist Party of China. Xi Jinping: Secure a Decisive Victory in Building a Moderately Prosperous Society in All Respects and Strive for the Great Success of Socialism with Chinese Characteristics in the New Era—Report to the 19th National Congress of the Communist Party of China. 2017. Available online: https://www.gov.cn/zhuanti/2017-10/27/content_5234876.htm (accessed on 23 April 2025).
  53. Gu, S.Z.; Hu, Y.J.; Zhou, H. Ecological Civilization Construction: Scientific Connotation and Basic Paths. Resour. Sci. 2013, 35, 2–13. [Google Scholar]
  54. National Development and Reform Commission of People’s Republic of China Development Plan for Urban Agglomeration in the Middle Reaches of the Yangtze River. 2015. Available online: https://www.ndrc.gov.cn/xxgk/zcfb/tz/201504/t20150416_963800_ext.html (accessed on 23 April 2025).
  55. Ministry of Natural Resources of the People’s Republic of China China’s Land Ecological Basic Zoning. 2023. Available online: https://www.gov.cn/lianbo/bumen/202306/content_6887305.htm (accessed on 23 April 2025).
  56. Liang, J.; He, X.; Zeng, G.; Zhong, M.; Gao, X.; Li, X.; Li, X.; Wu, H.; Feng, C.; Xing, W.; et al. Integrating priority areas and ecological corridors into national network for conservation planning in China. Sci. Total. Environ. 2018, 626, 22–29. [Google Scholar] [CrossRef]
  57. Liu, H.; Li, X.M.; Gong, Y.L. Analysis on the evolution of the urban network of the urban agglomeration in the middle reaches of the Yangtze River and its influencing factors: From the perspective of multi factor flow. World Reg. Stud. 2024, 33, 100–115. [Google Scholar]
  58. Peng, Q.; Yang, R.; Cao, Y.; Wang, F.; Hou, S.; Tseng, T.H.; Wang, X.; Wang, P.; Zhao, Z.; Yu, L.; et al. One-third of lands face high conflict risk between biodiversity conservation and human activities in China. J. Environ. Manag. 2021, 299, 113449. [Google Scholar] [CrossRef] [PubMed]
  59. Luo, Q.; Zhou, J.; Li, Z.; Yu, B. Spatial differences of ecosystem services and their driving factors: A comparation analysis among three urban agglomerations in China’s Yangtze River Economic Belt. Sci. Total. Environ. 2020, 725, 138452. [Google Scholar] [CrossRef]
  60. Ma, K.; Chen, Y.; Tang, X.; Wang, Y. Research on spatial optimization of protected areas based on threatened species protection in the middle Yangtze River Basin. Geogr. Res. 2023, 42, 3115–3129. [Google Scholar]
  61. Ministry of Agriculture and Rural Affairs of the People’s Republic of China. The Bulletin on the Status of Aquatic Biological Resources and Habitats in the Yangtze River Basin (2023) Was Released: The Overall Recovery of Aquatic Biological Resources Is Good, and the Ban on Fishing in the Yangtze River Has Achieved Good Results. 2024. Available online: http://www.cjyzbgs.moa.gov.cn/ztzl/202408/t20240812_6460621.htm (accessed on 23 April 2025).
  62. Fu, Y.; Mao, B.; Fang, X.; Shen, M.; Pan, P.; Xiao, Y. Investigation and Diversity Analysis of Avian Resources in Huanggang Section of the Mainstream Yangtze River. Res. Environ. Sci. 2025, 38, 68–77. [Google Scholar] [CrossRef]
  63. National Development and Reform Commission, PRC. The Implementation Plan of the 14th Five-Year Plan for the Development of Urban Agglomerations in the Middle Reaches of the Yangtze River. 2022. Available online: https://www.ndrc.gov.cn/xxgk/zcfb/tz/202203/t20220315_1319307.html (accessed on 23 April 2025).
  64. Yang, J.; Huang, X. The 30 m annual land cover dataset and its dynamics in China from 1990 to 2019. Earth Syst. Sci. Data. 2021, 13, 3907–3925. [Google Scholar] [CrossRef]
  65. Wang, H. Construction of Ecological Network in Changsha Urban Area Based on InVEST-MSPA-Circuit Theory Model. Master’s Thesis, Central South University of Forestry and Technology, Hunan, China, 2023. [Google Scholar] [CrossRef]
  66. Pascual-Hortal, L.; Saura, S. Comparison and development of new graph-based landscape connectivity indices: Towards the priorization of habitat patches and corridors for conservation. Landsc. Ecol. 2006, 21, 959–967. [Google Scholar] [CrossRef]
  67. Saura, S.; Pascual-Hortal, L. A new habitat availability index to integrate connectivity in landscape conservation planning: Comparison with existing indices and application to a case study. Landsc. Urban Plan. 2007, 83, 91–103. [Google Scholar] [CrossRef]
  68. Zhang, J.; Jiang, F.; Cai, Z.; Dai, Y.; Liu, D.; Song, P.; Hou, Y.S.; Gao, H.; Zhang, T. Resistance-Based Connectivity Model to Construct Corridors of the Przewalski’s Gazelle (Procapra Przewalskii) in Fragmented Landscape. Sustainability 2021, 13, 1656. [Google Scholar] [CrossRef]
  69. Zhang, L.; Wan, Y.W.; Sun, Y.Y.; He, G.Y.; Lei, X.Q.; Wei, X.J.; Jin, G. Optimizing ecological security patterns in a megacity by enhancing urban-rural connectivity: Insights from Wuhan, China. Appl. Geogr. 2025, 176. [Google Scholar] [CrossRef]
  70. Beier, P. A rule of thumb for widths of conservation corridors. Conserv. Biol. 2019, 33, 976–978. [Google Scholar] [CrossRef] [PubMed]
  71. Ford, A.T.; Sunter, E.J.; Fauvelle, C.; Bradshaw, J.L.; Ford, B.; Hutchen, J.; Phillipow, N.; Teichman, K.J. Effective corridor width: Linking the spatial ecology of wildlife with land use policy. Eur. J. Wildl. Res. 2020, 66, 69. [Google Scholar] [CrossRef]
  72. Li, D.K.; Ding, S.Y.; Liang, G.; Zhao, Q.; Tang, Q.; Kong, L. Landscape heterogeneity of mountainous and hilly area in the western Henan Province based on moving window method. Acta Ecol. Sin. 2014, 34, 3414–3424. [Google Scholar]
  73. Liu, Y.N.; Kong, L.Q.; Xiao, Y.; Zheng, H. Relationships between landscape pattern and ecosystem water purification service in the Yangtze River Basin. Acta Ecol. Sin. 2019, 39, 844–852. [Google Scholar]
  74. Sun, C.; Yan, X.; Zhong, J. Evaluation of the landscape patterns vulnerability and analysis of spatial correlation patterns in the lower reaches of Liaohe River Plain. Acta Ecol. Sin. 2014, 34, 247–257. [Google Scholar]
  75. Yang, L.; Deng, M.; Wang, J.; Que, H. Spatial-temporal evolution of land use and ecological risk in Dongting Lake Basin during 1980–2018. Acta Ecol. Sin. 2021, 41, 3929–3939. [Google Scholar]
  76. Nan, X.; Wang, R.; Zhang, X. The Status Quo and Conservation Management Planning of Giant Panda (Ailuropoda melanoleuca) Population and Habitat in Qinling Mountains, Shaanxi Province. Chin. J. Wildl. 2021, 42, 663–674. [Google Scholar] [CrossRef]
  77. Eckert, I.; Brown, A.; Caron, D.; Riva, F.; Pollock, L.J. 30 × 30 biodiversity gains rely on national coordination. Nat. Commun. 2023, 14, 7113. [Google Scholar] [CrossRef]
  78. Xia, S.; Xue, Z.; Dong, S.; Wu, H.; Yu, X.; Hao, Z. Identification and scoring of conservation gaps in wetlands of China’s coastal provinces: Implications for extending protected areas. J. Environ. Manag. 2024, 358, 120865. [Google Scholar] [CrossRef]
  79. Zhang, W.; Liu, G.Y.; Gonella, F.; Xu, L.Y.; Yang, Z.F. Research on collaborative management and optimization of ecological risks in urban agglomeration. J. Clean. Prod. 2022, 372, 14. [Google Scholar] [CrossRef]
  80. Ge, Y.Y.; Zhang, M.D.; Xu, C.; Xin, B.Y. Constructing Urban Agglomeration Ecological Networks to Reflect Biodiversity and Conservation Objectives. Ecosyst. Health Sustain. 2024, 10, 13. [Google Scholar] [CrossRef]
Figure 1. Location map of the study area. (Latitudes 26°2′34.98″ to 32°38′14.73″ N, longitudes 110°15′2.69″ to 118°28′55.71″ E).
Land 14 01054 g001
Figure 2. Framework of this study.
Land 14 01054 g002
Figure 3. Screening of ecological source. (a) Analysis of habitat quality through InVEST. (b) Analysis of morphology through MSPA.
Land 14 01054 g003
Figure 4. Four schemes of ecological sources. (a) Source patches of scheme A. (b) Source patches of scheme B. (c) Source patches of scheme C. (d) Source patches of scheme D.
Land 14 01054 g004
Figure 5. Connectivity test of ecological sources. (a) The IIC values of the four schemes; (b) The PC values of the four schemes.
Land 14 01054 g005
Figure 6. Construction of comprehensive resistance surface. (a) Elevation. (b) Slope. (c) Land use and land cover. (d) Vegetation cover. (e) Distance to built-up areas. (f) Distance to traffic lines. (g) Distance to water areas. (h) The comprehensive resistance surface.
Land 14 01054 g006
Figure 7. Ecological corridors of the four schemes. (a) Corridors of scheme A. (b) Corridors of scheme B. (c) Corridors of scheme C. (d) Corridors of scheme D.
Land 14 01054 g007
Figure 8. Pinch point areas of the four schemes. (a) Pinch areas of scheme A. (b) Pinch areas of scheme B. (c) Pinch areas of scheme C. (d) Pinch areas of scheme D.
Land 14 01054 g008
Table 1. List of research data.
DataData TypeData ContentData TimeData AccuracyData Sources
DEMRasterGDEM v3 30 Resolution elevation data.October 202230 mGeospatial Data Cloud (https://www.gscloud.cn, accessed on 23 April 2025)
NDVIRasterMODIST Monthly data of satellite NDVI(MOD13Q1061).January to December 2022250 mEARTHDATA (https://search.earthdata.nasa.gov, accessed on 23 April 2025)
LULCRasterChina Land Cover Dataset [64].January to December 202230 mGoogle Earth Engine (https://code.earthengine.google.com/, accessed on 23 April 2025)
Administrative BoundaryVectorMunicipal and county administrative region data of Hubei, Hunan, and Jiangxi provinces.October 2024-Baidu Maps (https://map.baidu.com, accessed on 23 April 2025)
Traffic LineVectorData of railway, expressway, expressway, trunk road, secondary trunk road, and urban branch route.October 2024-Baidu Maps (https://map.baidu.com, accessed on 23 April 2025)
Water AreaVectorData of rivers, canals, lakes, and reservoir surface.October 2024-Baidu Maps (https://map.baidu.com, accessed on 23 April 2025)
Nature ReserveVectorNational, provincial, and county-level nature reserve patch data.October 2024-Baidu Maps (https://map.baidu.com, accessed on 23 April 2025)
Table 2. Threat source factors.
Threat TypeWeightMaximum Threat DistanceAttenuation Type
Cultivated Land0.31 kmLinear
Railroad0.54 kmExponential
Road0.53 kmExponential
Rural Settlements0.76 kmExponential
Urban Area110 kmExponential
Table 3. Sensitivity factors.
NameHabitatCultivatedRailroadRoadRural SettlementsUrban Area
Farmland0.300.50.50.60.7
Forest10.50.70.60.60.8
Shrub0.80.450.60.60.60.6
Grass0.60.40.50.50.40.7
Water10.750.750.750.751
Barren000000
Built000000
Wetland0.50.40.50.30.41
Table 4. Resistance indicators and resistance level.
FactorsFactor TypeFactor ClassificationResistance LevelWeight
Elevation+−104–144.38 m10.15
144.38–373.65 m3
373.65–708 m5
708–1156.99 m7
1156.99–2332 m9
Slope+0°–4°10.18
4°–10.01°3
10.01°–17.02°5
17.02°–5.78°7
25.78°–63.83°9
Land Use and Land CoverWoodland, sparse woodland, shrub land, grassland10.11
Naked rock, bare land3
Paddy fields, dry fields5
Rivers, lakes, beaches, pits and reservoirs7
Urban land, rural residential areas, industry and transportation9
Vegetation Cover0.64–110.11
0.51–0.643
0.36–0.515
0.14–0.367
0–0.149
Distance to Water Areas9–25 km10.14
5.77–9 km3
3.43–5.77 km5
1.47–3.43 km7
0–1.47 km9
Distance to Traffic Lines8–19.41 km10.15
4.8–8 km3
2.74–4.8 km5
1.14–2.74 km7
0–1.14 km9
Distance to Built-up Areas9.15–23.82 km10.16
5.32–9.15 km3
2.9–5.32 km5
1.2–2.9 km7
0–1.2 km9
“+” means positive factors, “−” means negative factors.
Table 5. Metrics selected to evaluate ecological networks.
GroupsMetricsTypeDescription
VolumeTA+The total patch area, which is the sum of the areas of all patches within a landscape.
CORE+The core area of a patch refers to the area within the patch that is not affected by edge effects.
PDPatch density is an indicator of landscape complexity.
ShapeEDEdge density, which represents the length of edges between heterogeneous landscape patches per unit area within a landscape.
PAFRACThe fractal dimension, which refers to the non-integer dimension of the irregular geometric shape of a landscape.
LSIThe landscape shape index, which is used to describe the shape characteristics of a landscape or patch.
ConnectivityAI+Landscape aggregation reflects the degree of concentration of patches of the same type within a landscape.
CONNECT+Landscape connectivity, which reflects the proportion of spatial connections between patches within a specific distance threshold.
COHESION+Patch cohesion is a measure that describes the degree of partial aggregation within patches in a landscape.
Functional StabilitySHEI+The Shannon Evenness Index, which describes the uniformity of relative species abundance in an ecosystem.
SHDI+The Shannon diversity index, used to compare species diversity across different habitats or at different time points within the same habitat.
MESH+The effective mesh size, which indicates the equivalent grid size of the remaining continuous habitat after landscape fragmentation.
“+” means positive factors, “−” means negative factors.
Table 6. Amount and length of ecological corridors.
SchemeCorridor AmountLevel 1 CorridorLevel 2 CorridorLevel 3 CorridorCorridors Total LengthLongest CorridorShortest CorridorCorridor Length MedianCorridor Length Average
A103738584586.99 km184.95 km0.35 km21.09 km44.53 km
B115740684589.15 km184.95 km0.35 km24.67 km39.91 km
C115942644608.49 km184.96 km0.35 km20.95 km40.07 km
D1774281457105.93 km151.94 km0.35 km27.03 km40.15 km
Table 7. Landscape metrics calculated by FRAGSTATS.
GroupsWeight-GMetricsWeight-MScheme AScheme BScheme CScheme D
Volume0.5245TA0.04911230,554,293.7558,845,712.5058,845,712.5058,845,712.50
CORE0.393226320,611.417,533,046.947,822,474.497,491,505.26
PD0.0821170.610.330.310.32
Shape0.1085ED0.08484818.439.918.639.67
PAFRAC0.0000021.581.581.581.57
LSI0.023693261.63191.00172.30186.52
Connectivity0.0037AI0.00286476.9187.6488.8687.94
CONNECT0.0008670.600.600.640.60
COHESION0.00000399.2099.2799.5899.09
Functional0.3632SHEI0.000090.640.630.600.64
Stability SHDI0.0018881.421.451.301.47
MESH0.360442485,434.447,620,133.478,101,104.447,545,200.25
Table 8. Ecological networks evaluation.
SchemesVolumeShapeConnectivityFunctional StabilityFinal Score
Scheme A0.04500.04090.00090.00810.0310
Scheme B0.15880.02350.00090.11640.1281
Scheme C0.16310.02120.00100.12360.1327
Scheme D0.15770.02290.00100.11520.1270
Disclaimer/Publisher’s Note: The statements, opinions and data contained in all publications are solely those of the individual author(s) and contributor(s) and not of MDPI and/or the editor(s). MDPI and/or the editor(s) disclaim responsibility for any injury to people or property resulting from any ideas, methods, instructions or products referred to in the content.

