
Land Target Detection Algorithm in Remote Sensing Images Based on Deep Learning


Abstract
1. Introduction
- (1)
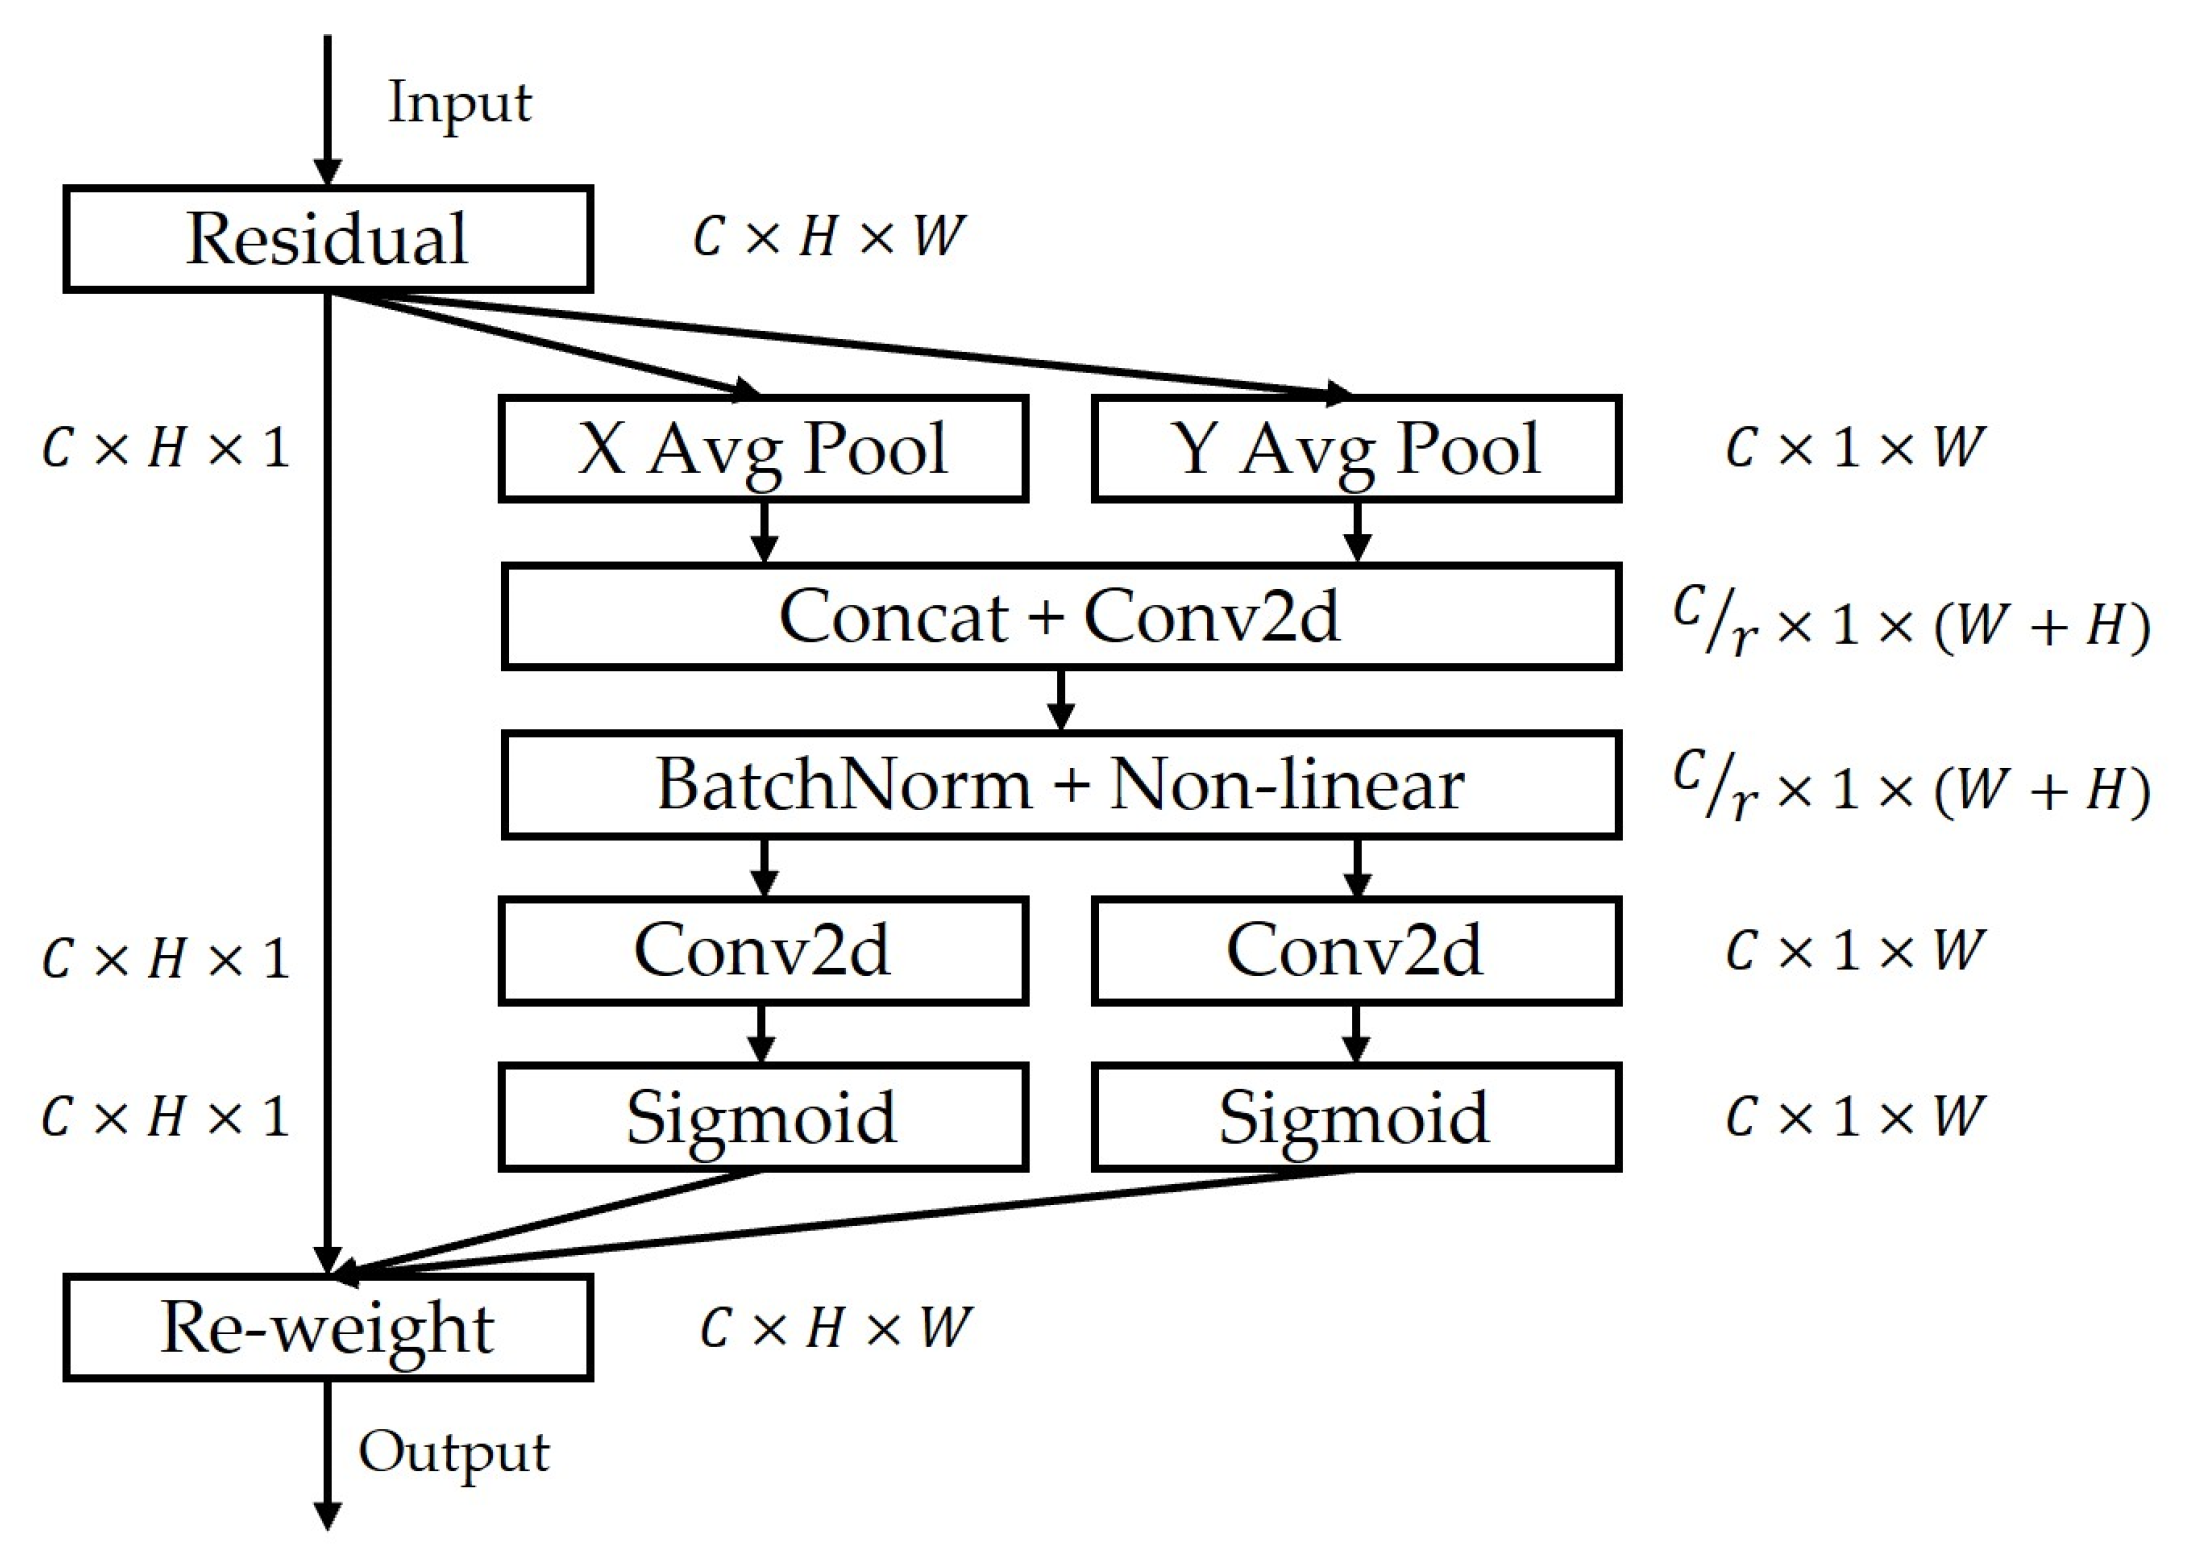
- The YOLOv5s framework was enhanced by integrating a coordinate attention mechanism, enabling more effective extraction of key features from remote sensing images characterized by intricate backgrounds.
- (2)
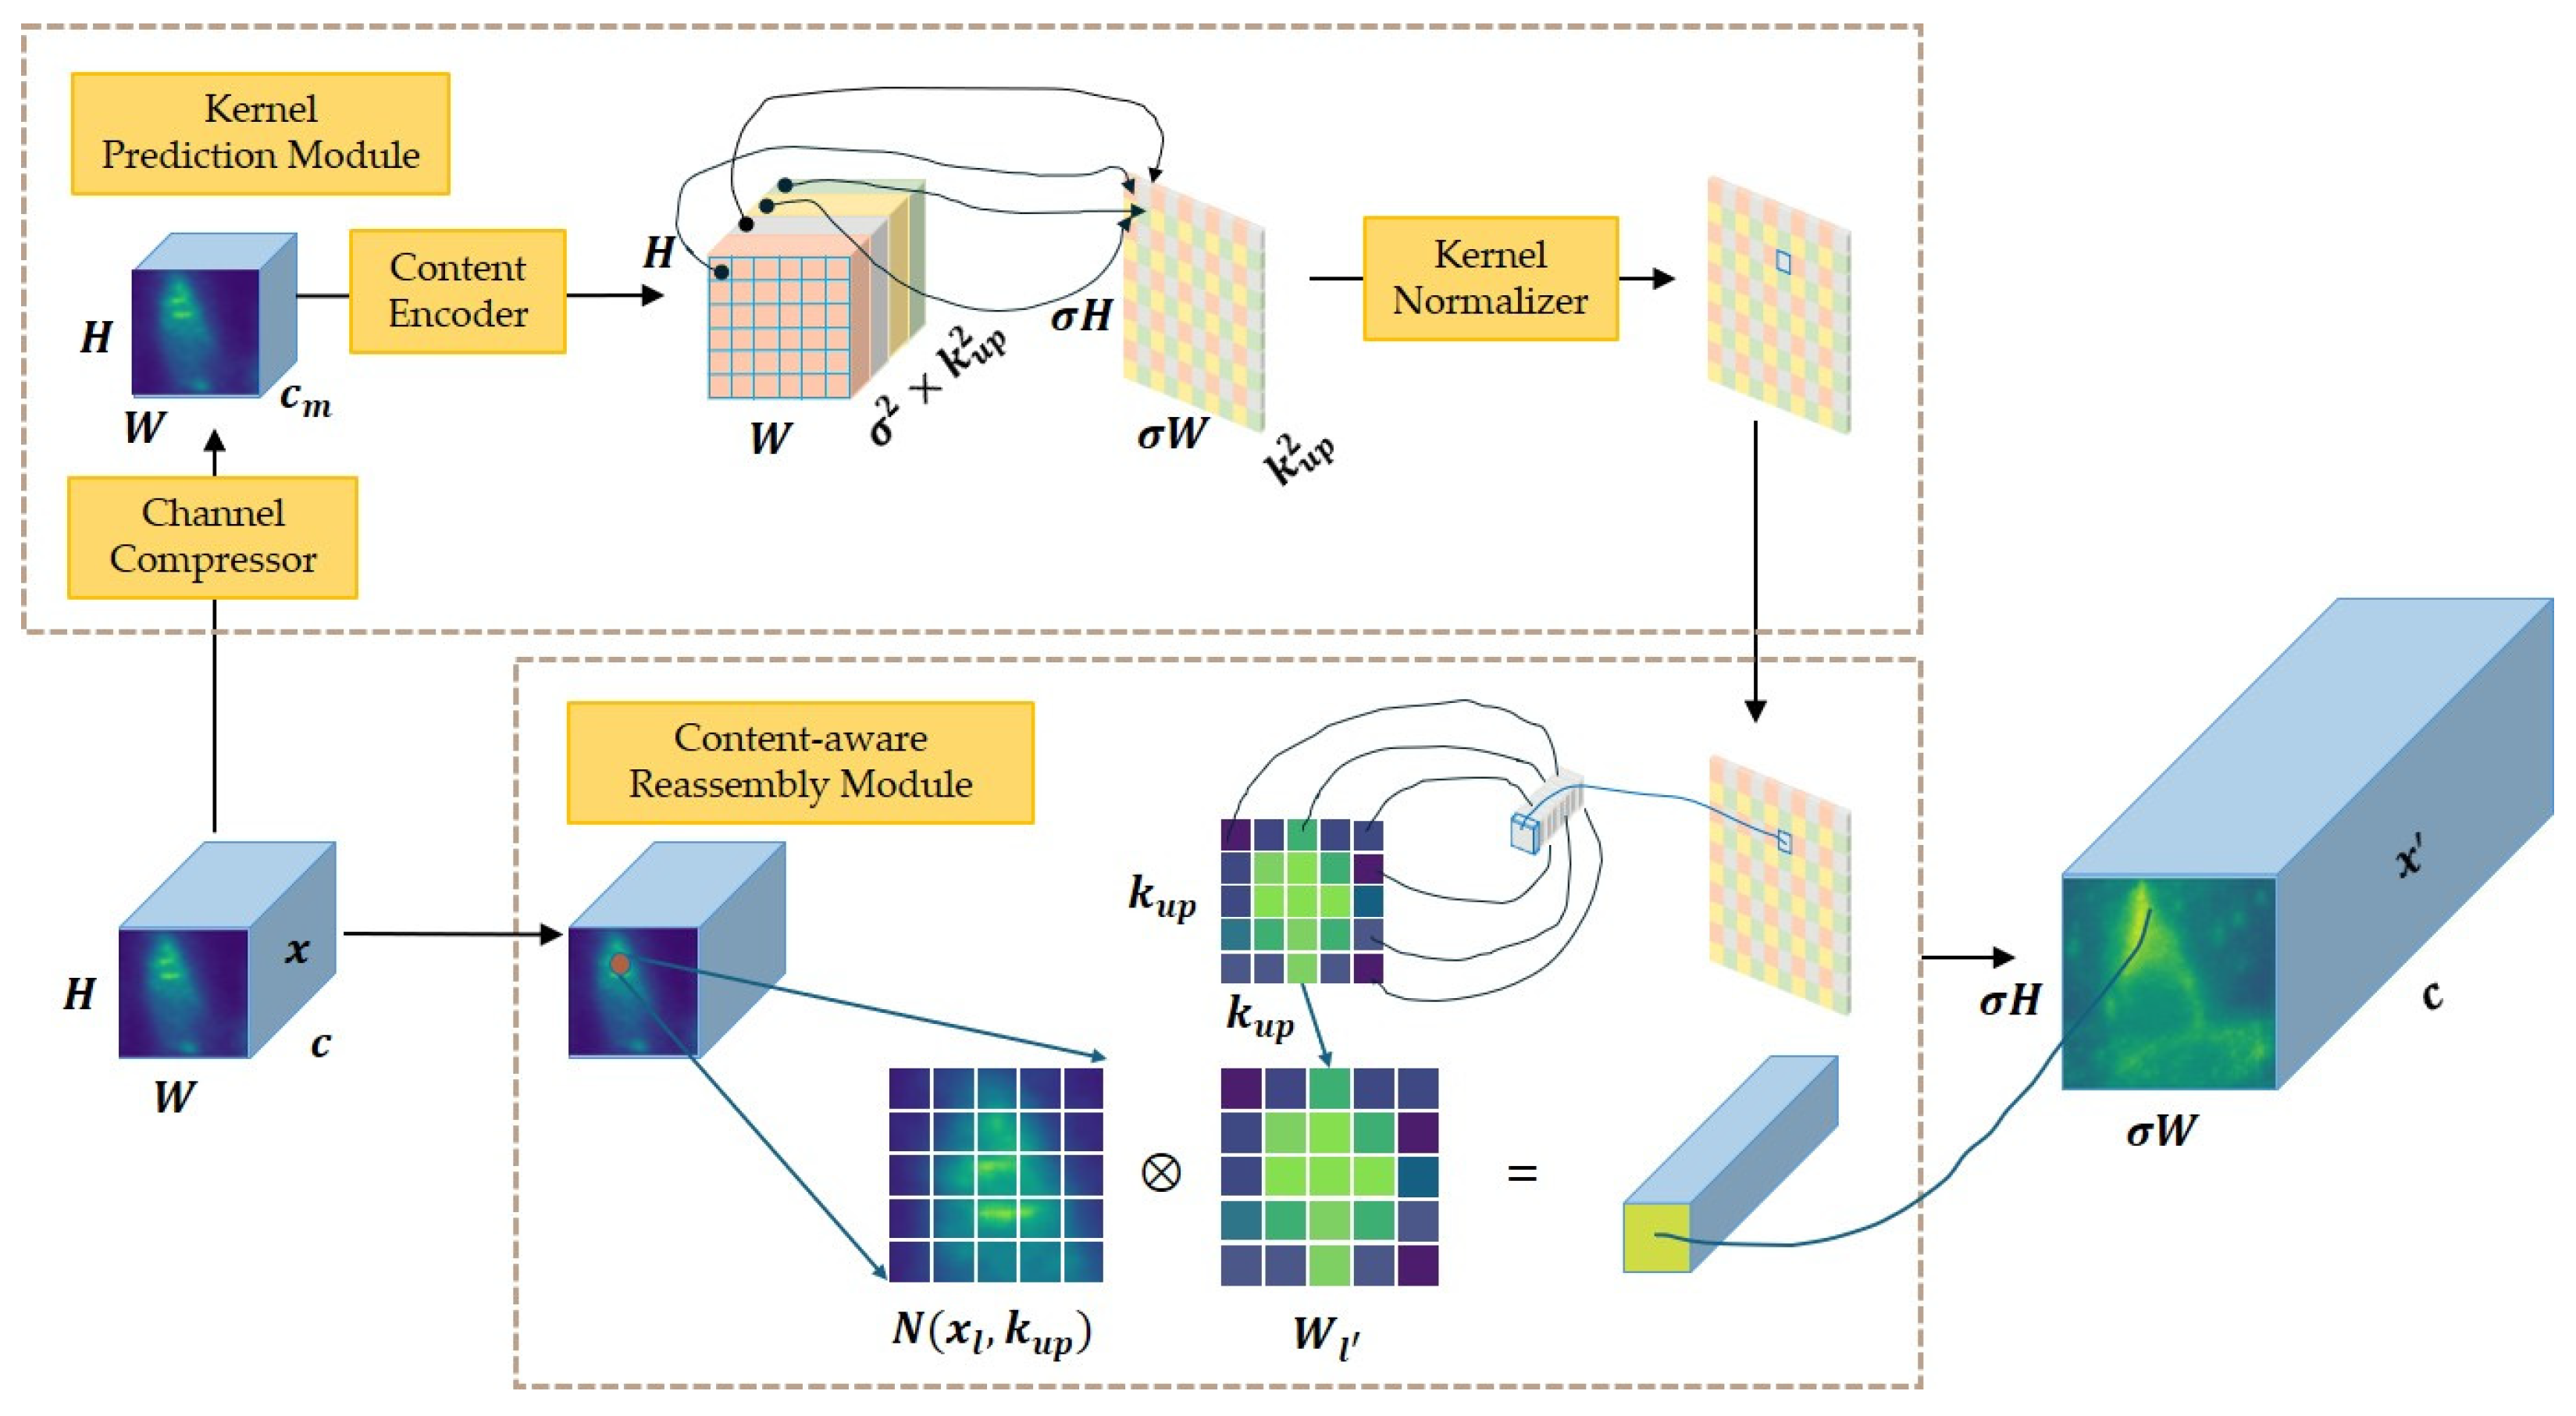
- To refine the quality of features, the original nearest-neighbor interpolation was replaced with CARAFE, a lightweight and versatile upsampling operator, significantly improving reconstruction quality.
- (3)
- The conventional CIoU Loss function for bounding box regression was substituted with Shape-IoU, mitigating the impact of varying bounding box dimensions and geometries on the regression accuracy.
- (4)
- For real-time performance optimization, the model was lightweighted by using depthwise separable convolution.
2. Materials and Methods
2.1. YOLOv5 Detection Algorithm
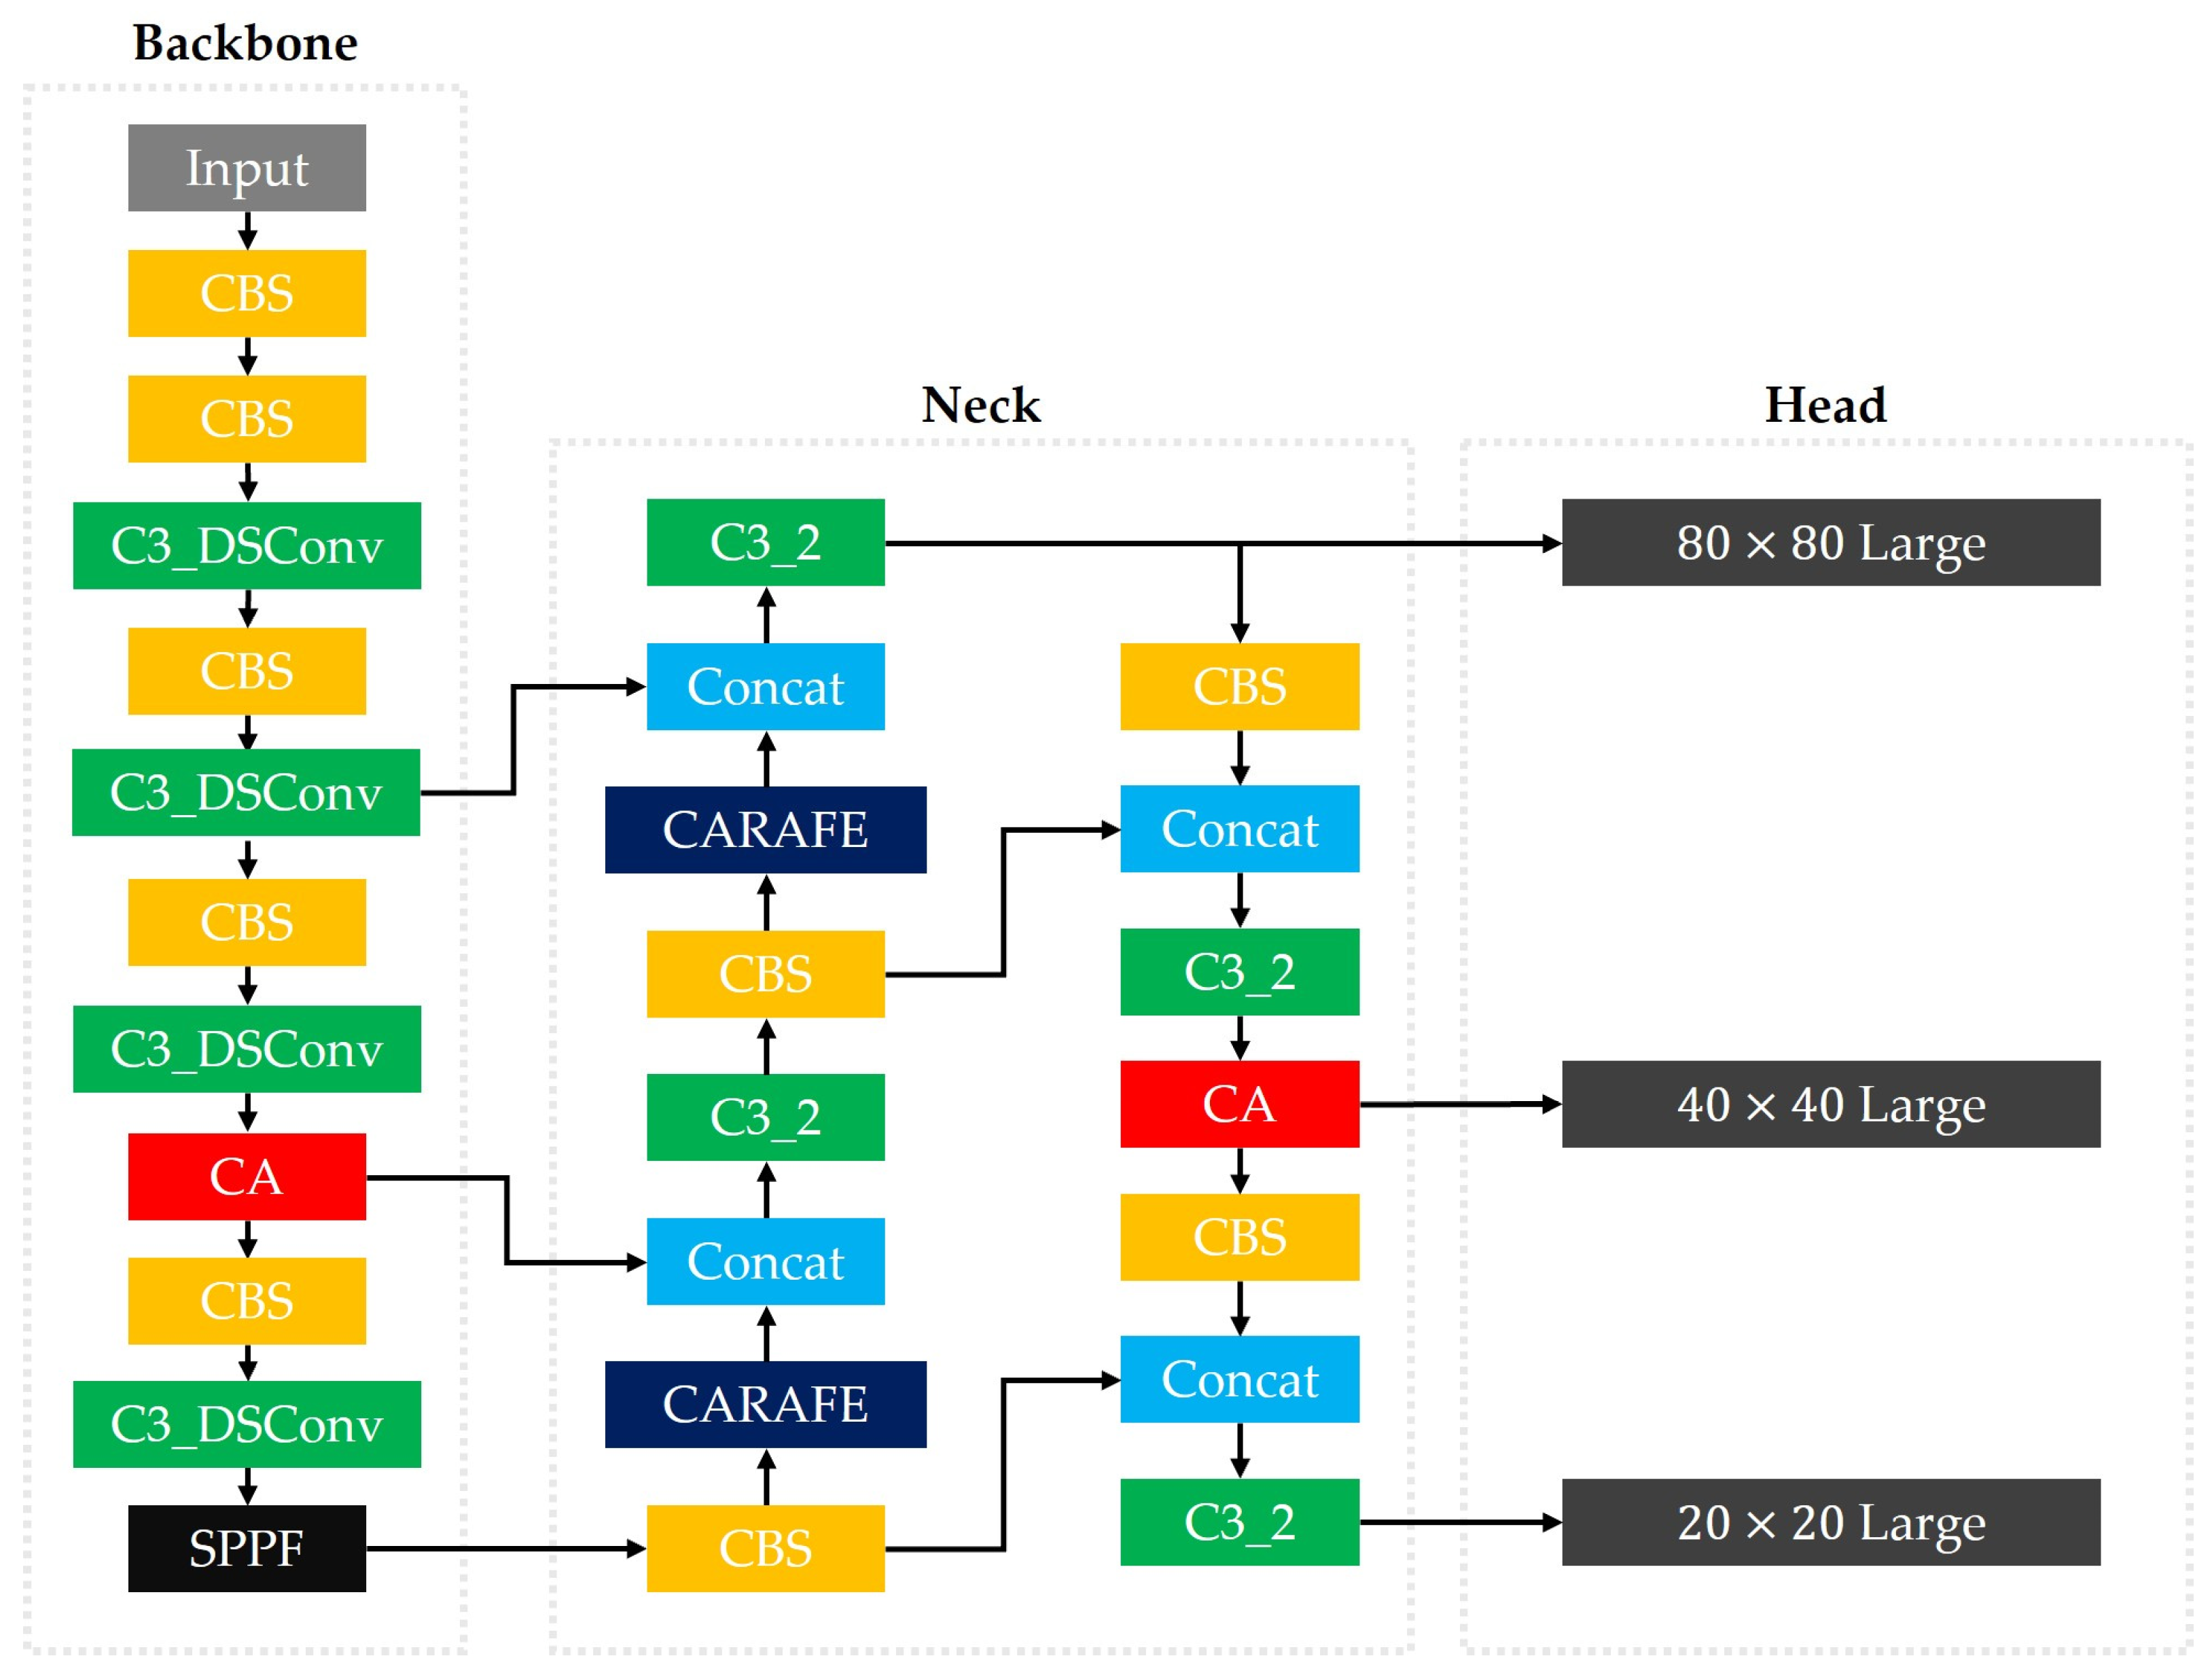
2.1.1. Backbone
- (1)
- CBS
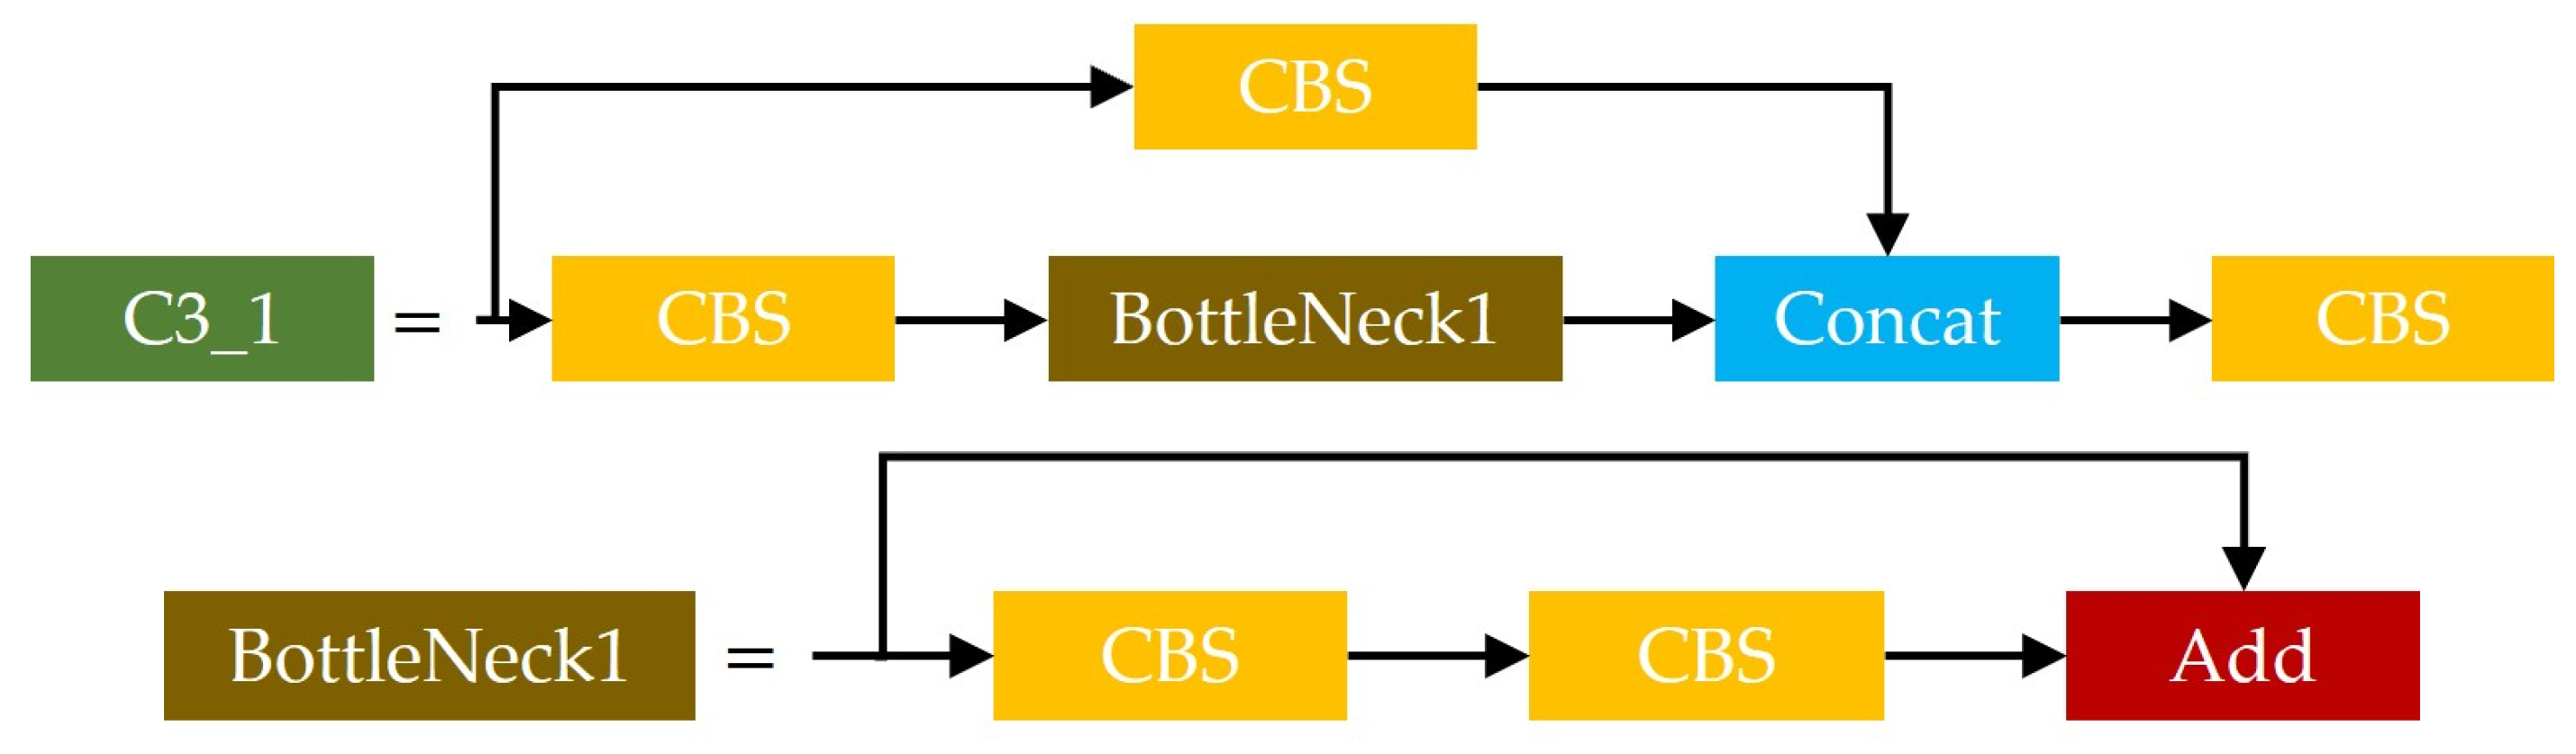
- (2)
- C3_1
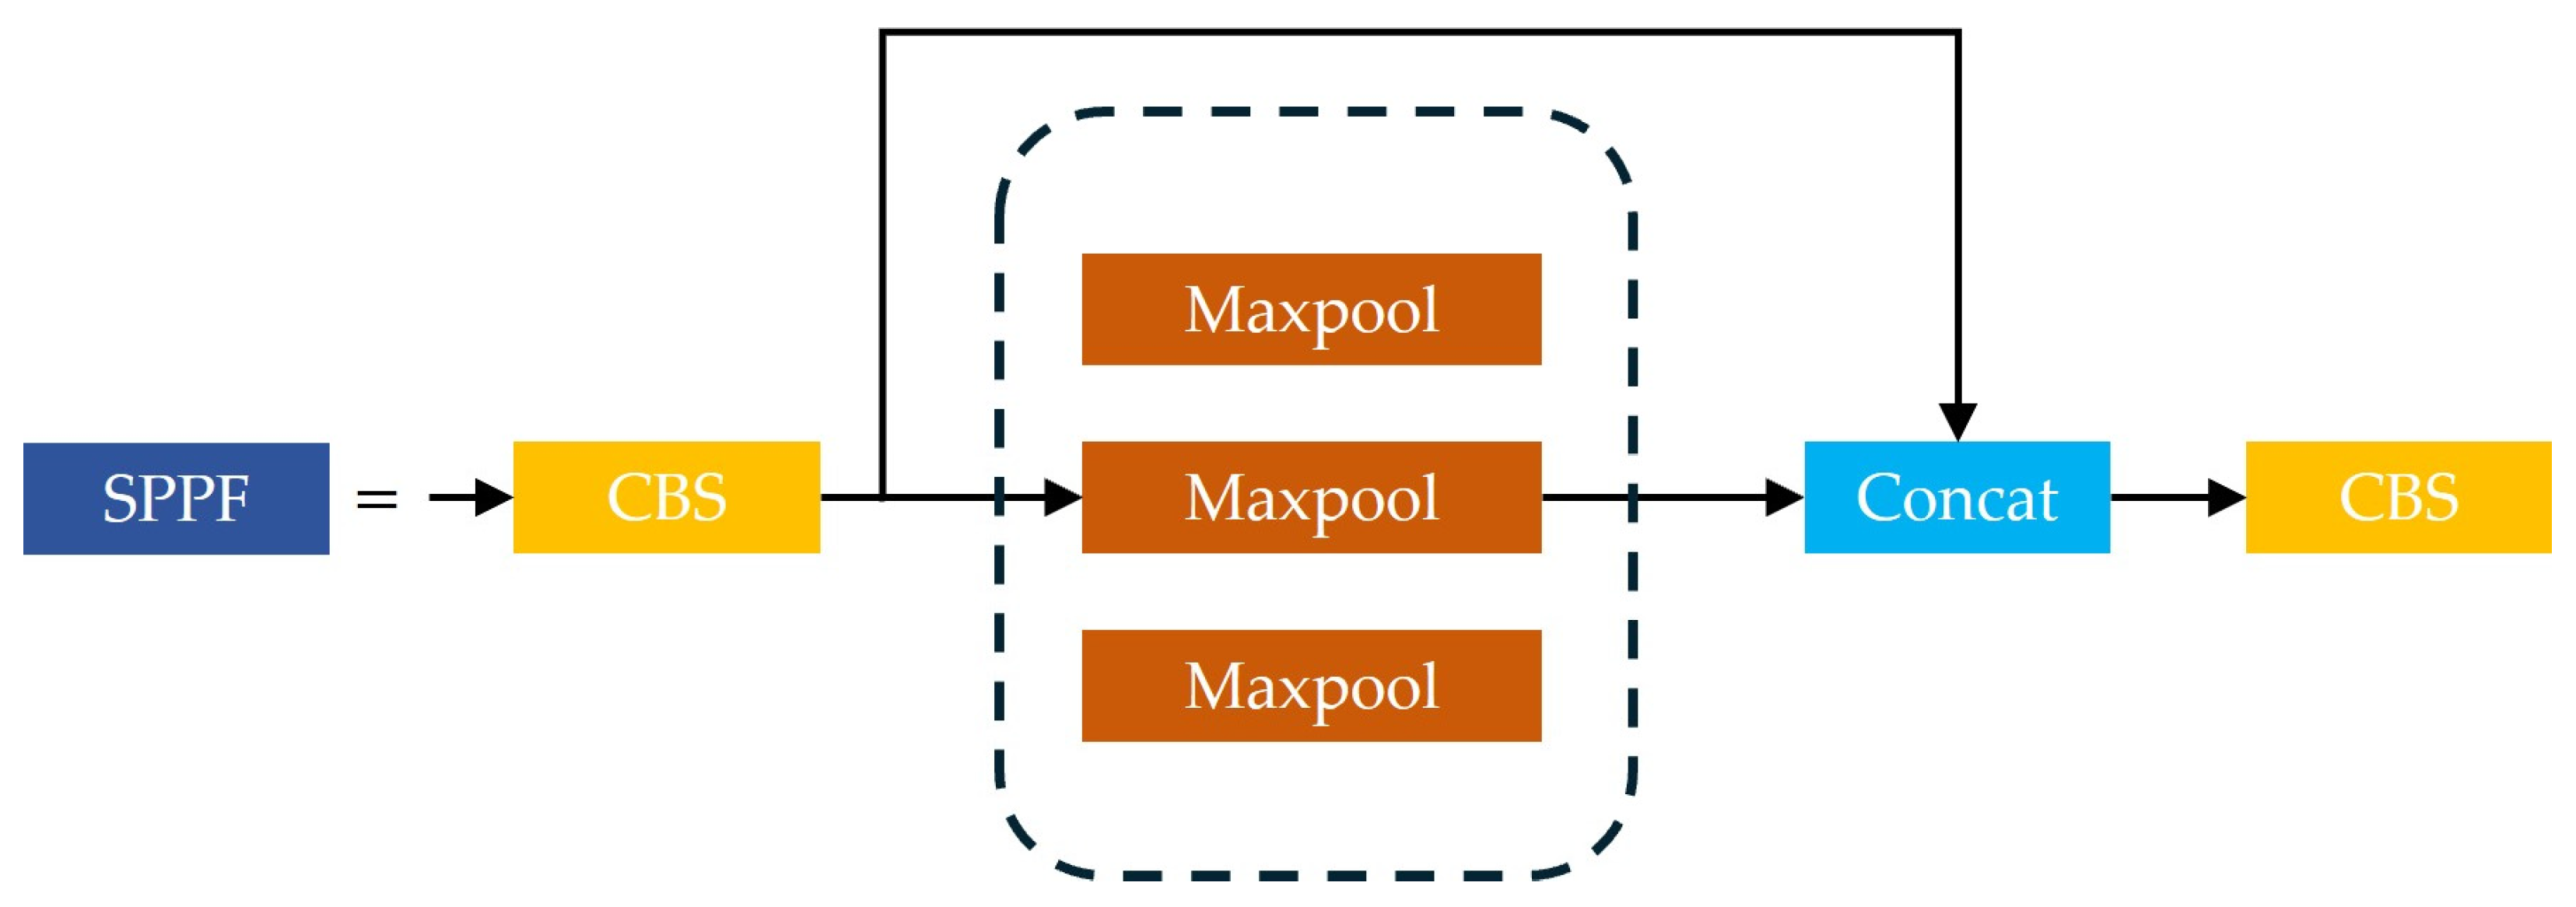
- (3)
- SPPF
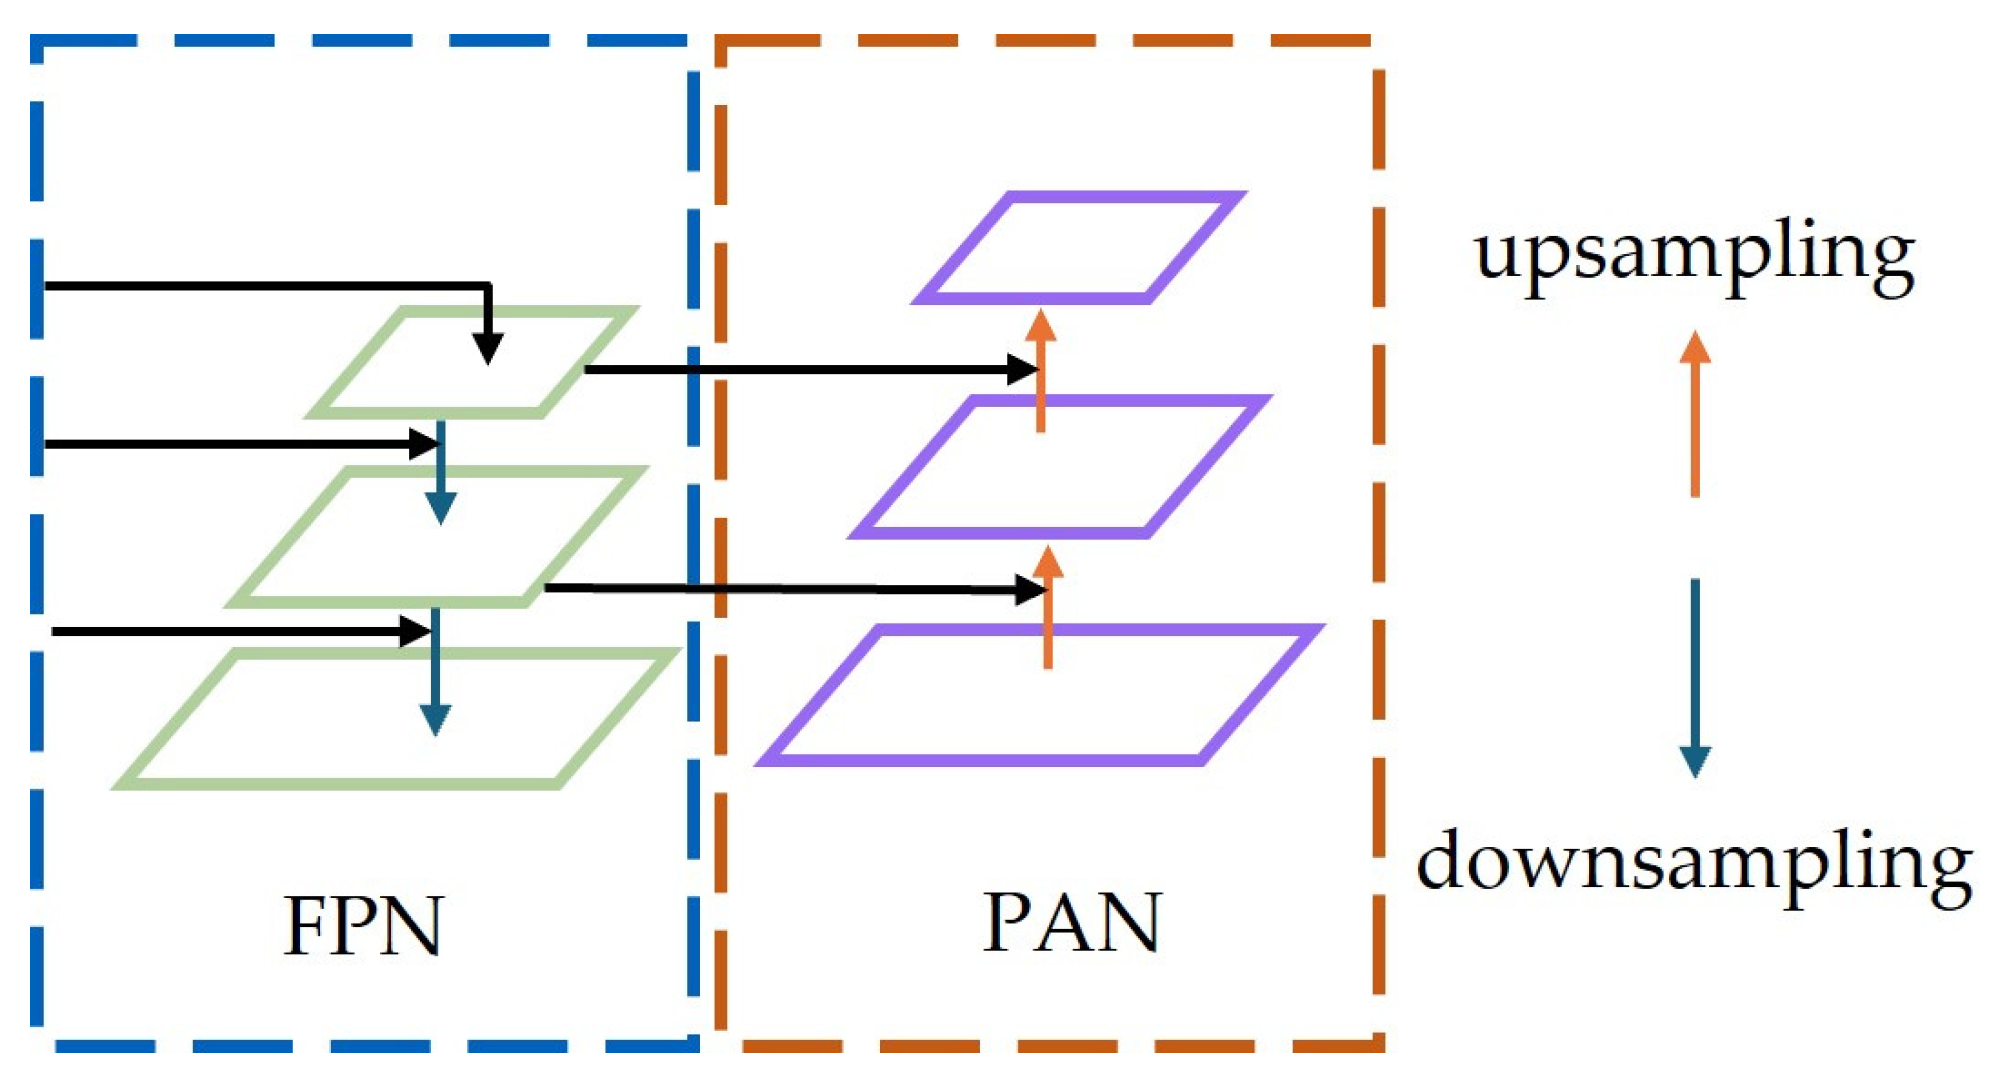
2.1.2. Neck
2.1.3. Head
2.2. YOLOv5s-CACSD Land Target Detection Algorithm
2.2.1. Introducing Attention Mechanisms
2.2.2. Improving Upsampling Methods
2.2.3. Improving the Bounding Box Regression Loss Function
2.2.4. Depthwise Separable Convolution
2.2.5. Improved Model Structure
2.3. Experimental Design
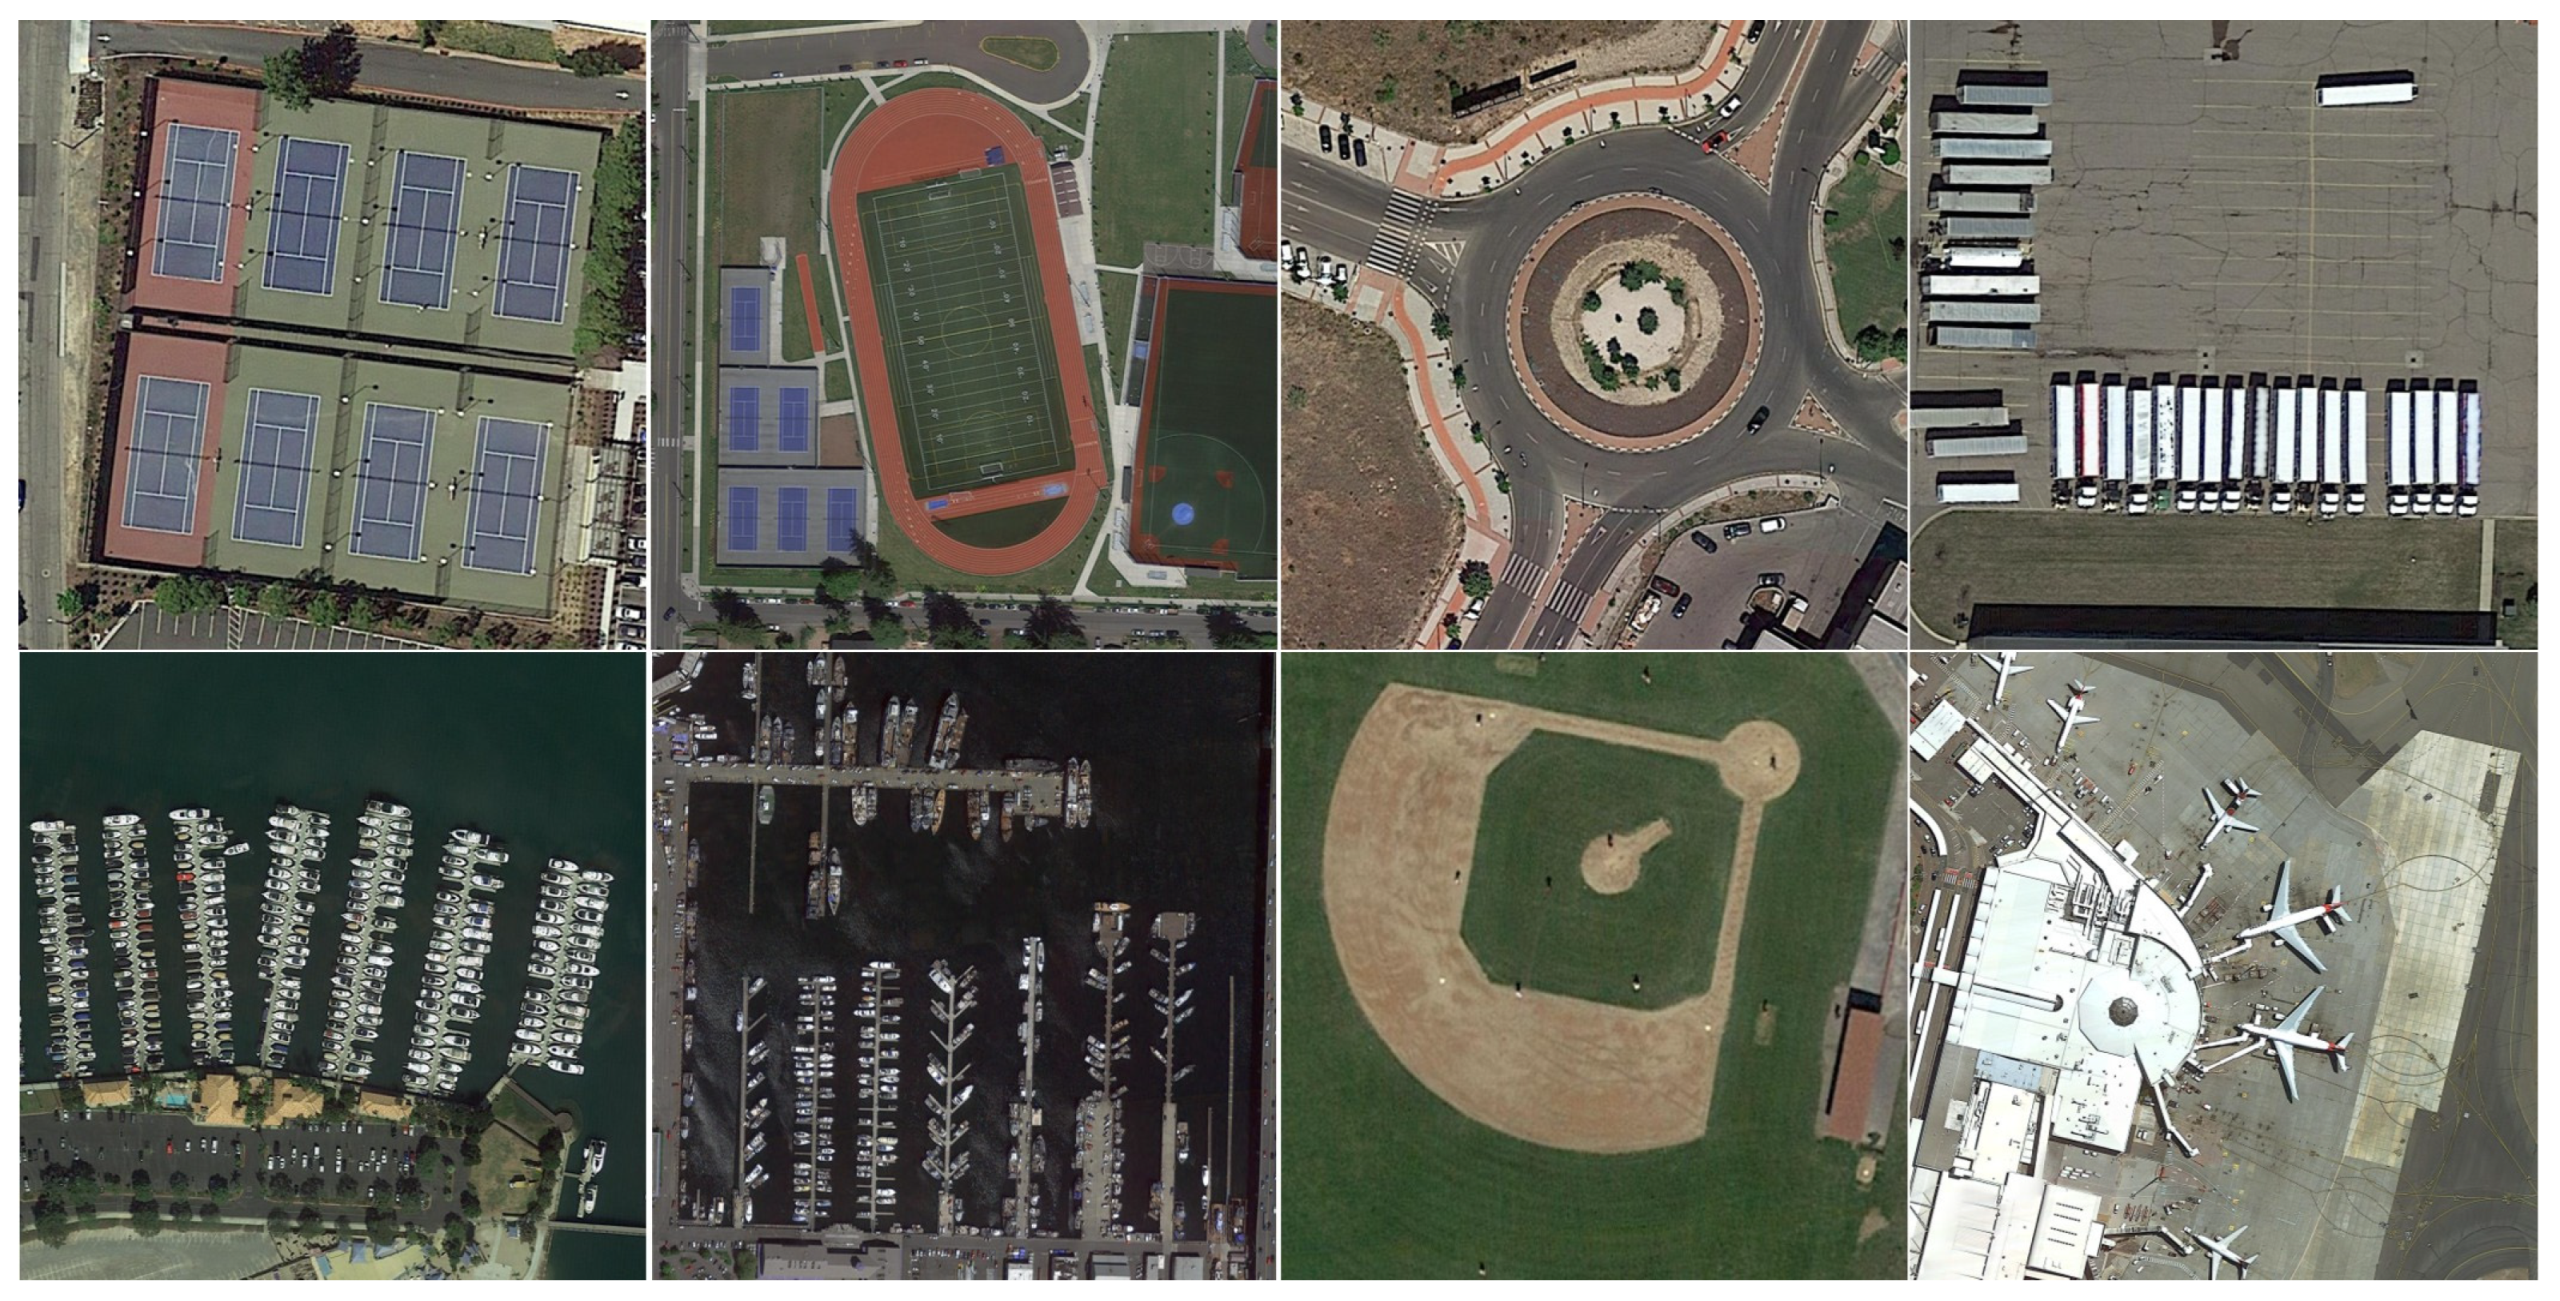
2.3.1. Description of the Dataset
2.3.2. Evaluation Indicators
2.3.3. Experimental Methods
3. Results
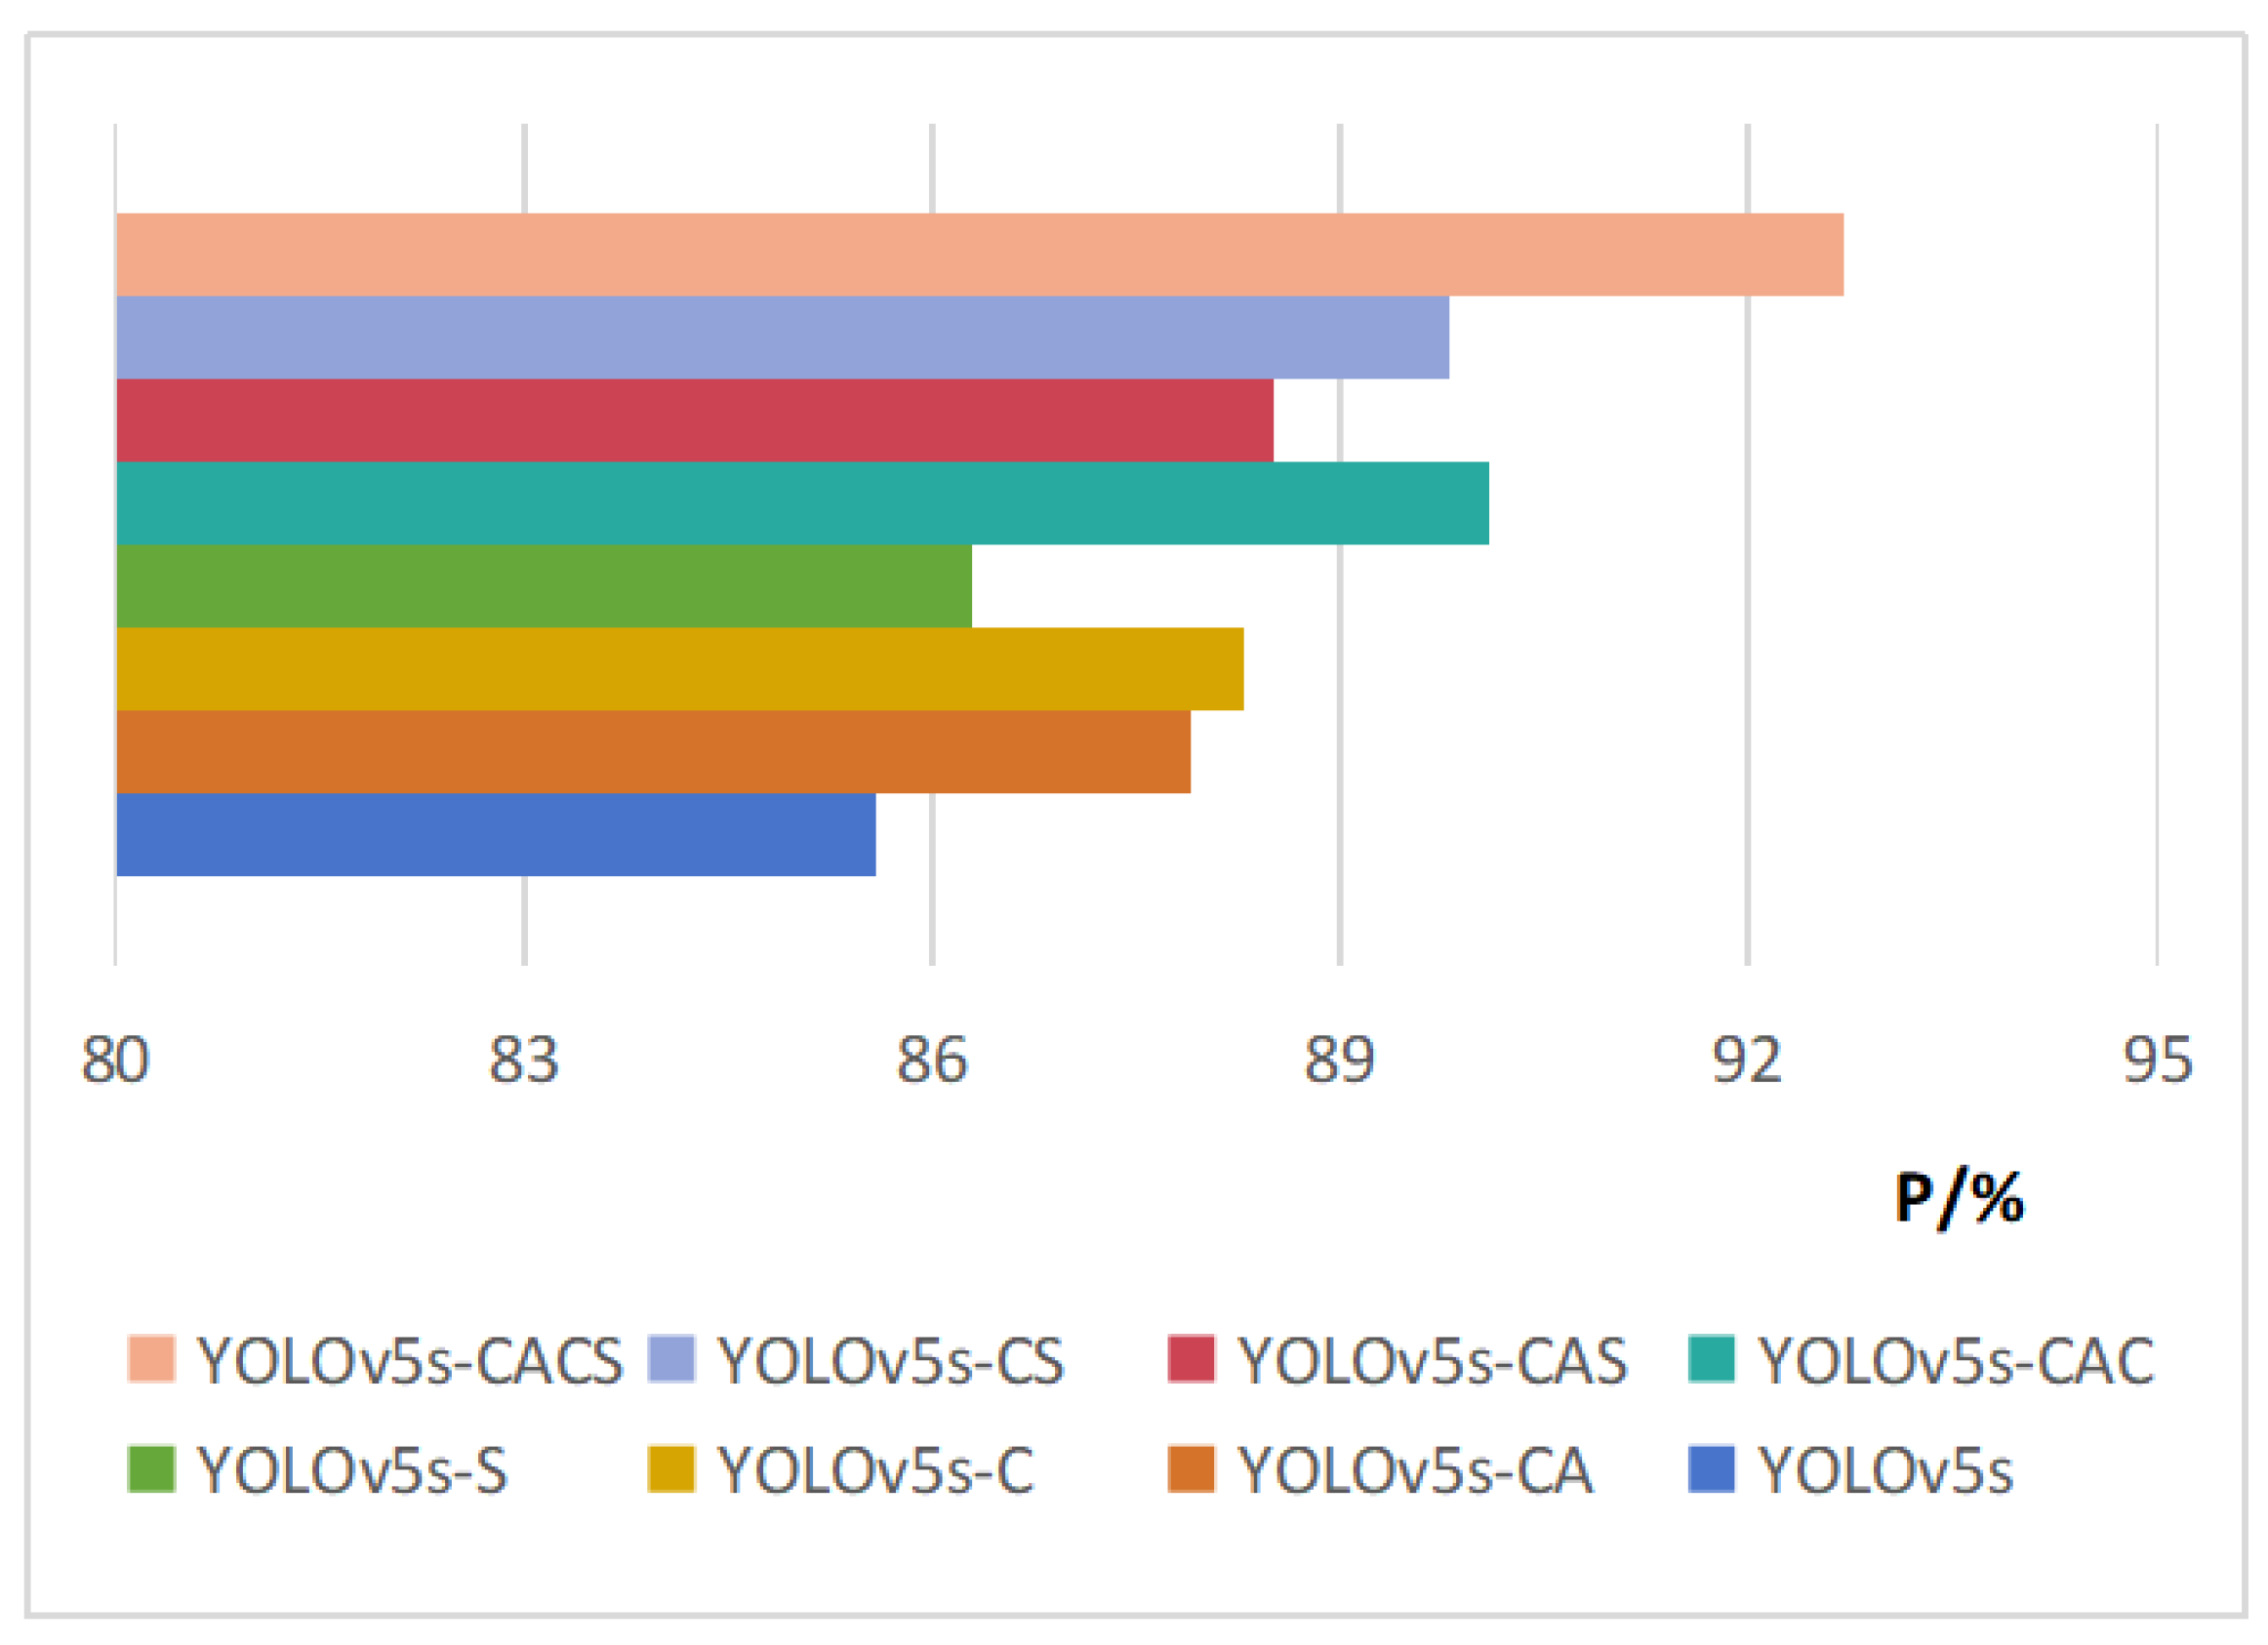
3.1. Results of Ablation Experiments
3.2. Results of Comparative Experiments
4. Discussion
5. Conclusions
Author Contributions
Funding
Data Availability Statement
Conflicts of Interest
References
- Hui, C.; Yong, X.; Xin, X. Design of disaster meteorological observation data monitoring system based on multi-source satellite remote sensing. Comput. Meas. Control 2023, 31, 24–29. [Google Scholar]
- Shuchen, Z.; Kun, L.; Yi, Z.; Wu, X. The Great Transformation of Intelligent Remote Sensing Monitoring Technology. Computer News, 8 January 2024. [Google Scholar] [CrossRef]
- Yang, C. Application examples of remote sensing and precision agriculture technology in crop disease detection and management. Engineering 2020, 6, 102–112. [Google Scholar] [CrossRef]
- Wei, C.; Du, Y.; Cheng, Z.; Zhou, Z.; Gu, X. Study on yield estimation of winter wheat covered with plastic film based on drone remote sensing vegetation index optimization. J. Agric. Mach. 2024, 5, 1–14. [Google Scholar]
- Bao, S.; Lu, L. The impact of spatial evolution guided by urban planning in Hefei on the spatiotemporal evolution of land prices. J. Geogr. 2015, 70, 906–918. [Google Scholar]
- Kuffer, M.; Pfeffer, K.; Persello, C. Special issue “remote-sensing-based urban planning indicators. Remote Sens. 2021, 13, 1264. [Google Scholar] [CrossRef]
- Chen, J.; Wu, H.; Zhang, J.; Liao, A.; Liu, W.; Zhang, J.; Miao, Q.; Feng, W.; Lu, W. The direction and tasks of constructing a natural resource survey and monitoring technology system. J. Geogr. 2022, 77, 1041–1055. [Google Scholar]
- Guo, D.; Li, S.; Chen, Z.; Wang, L. Evaluation of Demand Satisfaction for High Resolution Satellite Natural Resource Survey. J. Remote Sens. 2022, 26, 579–587. [Google Scholar]
- Wang, Z.; Kang, Q.; Xun, Y.; Shen, Z.Q.; Cui, C.B. Military reconnaissance application of high-resolution optical satellite remote sensing. In Proceedings of the International Symposium on Optoelectronic Technology and Application 2014: Optical Remote Sensing Technology and Applications, Beijing, China, 13–15 May 2014; Volume 9299, pp. 301–305. [Google Scholar]
- Zhu, W.; Xie, B.; Wang, T.; Shen, J.; Zhu, H. Review of Aircraft Target Detection Technology in Optical Remote Sensing Images. Comput. Sci. 2020, 47, 165–171+182. [Google Scholar]
- Hu, H.; Zuo, J.; Lu, Y.; Zhao, R. Remote sensing image road network detection method for autonomous driving. Chin. J. Highw. 2022, 35, 310–317. [Google Scholar] [CrossRef]
- Gao, Y.; Lei, R. Progress and Prospects of Multi source Remote Sensing Forest Fire Monitoring. J. Remote Sens. 2024, 28, 1854–1869. [Google Scholar]
- Liu, L.; Ouyang, W.; Wang, X.; Fieguth, P.; Chen, J.; Liu, X.; Pietikäinen, M. Deeplearning for generic object detection: A survey. Int. J. Comput. Vis. 2020, 128, 261–318. [Google Scholar] [CrossRef]
- Guo, H.; Liang, D.; Liu, G. Progress of Earth Observation in China. Chin. J. Space Sci. 2020, 40, 908–919. [Google Scholar] [CrossRef]
- Lowe, D.G. Distinctive image features from scale-invariant keypoints. Int. J. Comput. Vis. 2004, 60, 91–110. [Google Scholar] [CrossRef]
- Hui, Y.; You, S.; Hu, X.; Yang, P.; Zhao, J. SEB-YOLO: An Improved YOLOv5 Model for Remote Sensing Small Target Detection. Sensors 2024, 24, 2193. [Google Scholar] [CrossRef]
- Luo, H.; Chen, H. A review of deep learning based object detection research. J. Electron. 2020, 48, 1230–1239. [Google Scholar]
- Yang, Z.; Luo, L.; Wu, T.; Yu, B. Improved lightweight optical remote sensing image ship target detection algorithm for YOLOv8. Comput. Eng. Appl. 2024, 60, 248–257. [Google Scholar]
- Girshick, R.; Donahue, J.; Darrell, T.; Malik, J. Rich feature hierarchies for accurate object detection and semantic segmentation. In Proceedings of the IEEE Conference on Computer Vision and Pattern Recognition, Columbus, OH, USA, 23–28 June 2014; pp. 580–587. [Google Scholar]
- Girshick, R. Fast r-cnn. In Proceedings of the IEEE International Conference on Computer Vision, Santiago, Chile, 7–13 December 2015; pp. 1440–1448. [Google Scholar]
- Ren, S.; He, K.; Girshick, R.; Sun, J. Faster R-CNN: Towards Real-Time Object Detection with Region Proposal Networks. IEEE Trans. Pattern Anal. Mach. Intell. 2017, 39, 1137–1149. [Google Scholar] [CrossRef] [PubMed]
- Redmon, J.; Divvala, S.; Girshick, R.; Farhadi, A. You only look once: Unified, real-time object detection. In Proceedings of the IEEE Conference on Computer Vision and Pattern Recognition, Las Vegas, NV, USA, 27–30 June 2016; pp. 779–788. [Google Scholar]
- Wang, A.; Chen, H.; Liu, L.; Chen, K.; Lin, Z.; Han, J.; Ding, G. YOLOv10: Real-Time End-to-End Object Detection. arXiv 2024, arXiv:2405.14458. [Google Scholar]
- Kumar, S.S.; Shreenath, K.N.; Sunil, G.; Vishwanath, P.; Shankar, S.S. A Rapid Object Recognition Scenario Based on Improved YOLO-V3 Network. In Proceedings of the 2023 International Conference on Evolutionary Algorithms and Soft Computing Techniques (EASCT), Bengaluru, India, 20–21 October 2023; pp. 1–5. [Google Scholar]
- Gong, J.; Zhao, J.; Li, F.; Zhang, H. Vehicle detection in thermal images with an improved yolov3-tiny. In Proceedings of the 2020 IEEE International Conference on Power, Intelligent Computing and Systems (ICPICS), Shenyang, China, 28–30 July 2020; pp. 253–256. [Google Scholar]
- Li, Y.; Lv, C. Ss-yolo: An object detection algorithm based on YOLOv3 and shufflenet. In Proceedings of the 2020 IEEE 4th Information Technology, Networking, Electronic and Automation Control Conference (IT-NEC) 2020, Chongqing, China, 12–14 June 2020; Volume 1, pp. 769–772. [Google Scholar]
- Zhu, G.; Wei, Z.; Lin, F. An object detection method combining multi-level feature fusion and region channel attention. IEEE Access 2021, 9, 25101–25109. [Google Scholar] [CrossRef]
- Zhang, Y.; Sun, J.; Sun, Y.; Liu, S.; Wang, C. Lightweight object detection based on segmentation attention and linear transformation. J. Zhejiang Univ. (Eng. Ed.) 2023, 57, 1195–1204. [Google Scholar]
- Kim, S. ECAP-YOLO: Efficient Channel Attention Pyramid YOLO for Small Object Detection in Aerial Image. Remote Sens. 2021, 13, 4851. [Google Scholar] [CrossRef]
- Arunnehru, J.; Thalapathiraj, S.; Vaijayanthi, S.; Ravikumar, D.; Loganathan, V.; Kannadasan, R.; Khan, A.A.; Wechtaisong, C.; Haq, M.A.; Alhussen, A.; et al. Target Object Detection from Unmanned Aerial Vehicle (UAV) Images Based on Improved YOLO Algorithm. Electronics 2022, 11, 2343. [Google Scholar] [CrossRef]
- Yin, L.; Wang, L.; Li, J.; Lu, S.; Tian, J.; Yin, Z.; Liu, S.; Zheng, W. YOLOV4_CSPBi: Enhanced Land Target Detection Model. Land 2023, 12, 1813. [Google Scholar] [CrossRef]
- Zhang, J.; Ding, A.; Li, G.; Zhang, L.; Zeng, D. A pyramid attention network with edge information injection for remote sensing object detection. IEEE Geosci. Remote Sens. Lett. 2023, 20, 1–5. [Google Scholar] [CrossRef]
- Zhao, L.L.; Zhu, M.L. MS-YOLOv7: YOLOv7 based on multi-scale for object detection on UAV aerial photography. Drones 2023, 7, 188. [Google Scholar] [CrossRef]
- Qu, H.; Wang, M.; Chai, R. Efficient remote sensing image vehicle detection using bidirectional multi-scale feature fusion. Comput. Eng. Appl. 2024, 60, 346–356. [Google Scholar]
- Cao, F.; Xing, B.; Luo, J.; Li, D.; Qian, Y.; Zhang, C.; Bai, H.; Zhang, H. An Efficient Object Detection Algorithm Based on Improved YOLOv5 for High-Spatial-Resolution Remote Sensing Images. Remote Sens. 2023, 15, 3755. [Google Scholar] [CrossRef]
- Zheng, Z.; Wang, P.; Liu, W.; Li, J.; Ye, R.; Ren, D. Distance-IoU Loss: Faster and Better Learning for Bounding Box Regression. In Proceedings of the AAAI Conference on Artificial Intelligence, New York, NY, USA, 7–12 February 2020; pp. 12993–13000. [Google Scholar]
- Bi, J.; Li, K.; Zheng, X.; Lei, T. SPDC-YOLO: An Efficient Small Target Detection Network Based on Improved YOLOv8 for Drone Aerial Image. Remote Sens. 2025, 17, 685. [Google Scholar] [CrossRef]
- Vijayakumar, A.; Vairavasundaram, S. YOLO-based Object Detection Models: A Review and its Applications. Multimed. Tools Appl. 2024, 83, 83535–83574. [Google Scholar] [CrossRef]
- Liu, S.; Qi, L.; Qin, H.; Shi, J.; Jia, J. Path aggregation network for instance segmentation. In Proceedings of the IEEE Conference on Computer Vision and Pattern Recognition, Salt Lake City, UT, USA, 18–23 June 2018; pp. 8759–8768. [Google Scholar]
- Hu, J.; Shen, L.; Sun, G. Squeeze-and-excitation networks. In Proceedings of the IEEE Conference on Computer Vision and Pattern Recognition, Salt Lake City, UT, USA, 18–23 June 2018; pp. 7132–7141. [Google Scholar]
- Woo, S.; Park, J.; Lee, J.Y.; Kweon, I.S. Cbam: Convolutional block attention module. In Proceedings of the European Conference on Computer Vision (ECCV), Munich, Germany, 8–14 September 2018; pp. 3–19. [Google Scholar]
- Hou, Q.; Zhou, D.; Feng, J. Coordinate attention for efficient mobile network design. In Proceedings of the IEEE/CVF Conference on Computer Vision and Pattern Recognition, Nashville, TN, USA, 19–25 June 2021; pp. 13713–13722. [Google Scholar]
- Wang, J.; Chen, K.; Xu, R.; Liu, Z.; Loy, C.C.; Lin, D. Carafe: Content-aware reassembly of features. In Proceedings of the IEEE/CVF International Conference on Computer Vision, Seoul, Republic of Korea, 27 October–2 November 2019; pp. 3007–3016. [Google Scholar]
- Howard, A.G.; Zhu, M.; Chen, B.; Kalenichenko, D.; Wang, W.; Weyand, T.; Andreetto, M.; Adam, H. Mobilenets: Efficient convolutional neural networks for mobile vision applications. arXiv 2017, arXiv:1704.04861. [Google Scholar]


| Parameter Settings | |
|---|---|
| Initial learning rate | 0.01 |
| Learning rate momentum | 0.937 |
| Optimizer | SGD |
| Learning rate adjustment strategy | Cosine annealing strategy |
| Training order | 200 |
| Training woker | 8 |
| Batch size | 64 |
| Network Names | CA | CARAFE | SIoU |
|---|---|---|---|
| YOLOv5s | × | × | × |
| YOLOv5s-CA | √ | × | × |
| YOLOv5s-C | × | √ | × |
| YOLOv5s-S | × | × | √ |
| YOLOv5s-CAC | √ | √ | × |
| YOLOv5s-CAS | √ | × | √ |
| YOLOv5s-CS | × | √ | √ |
| YOLOv5s-CACS | √ | √ | √ |
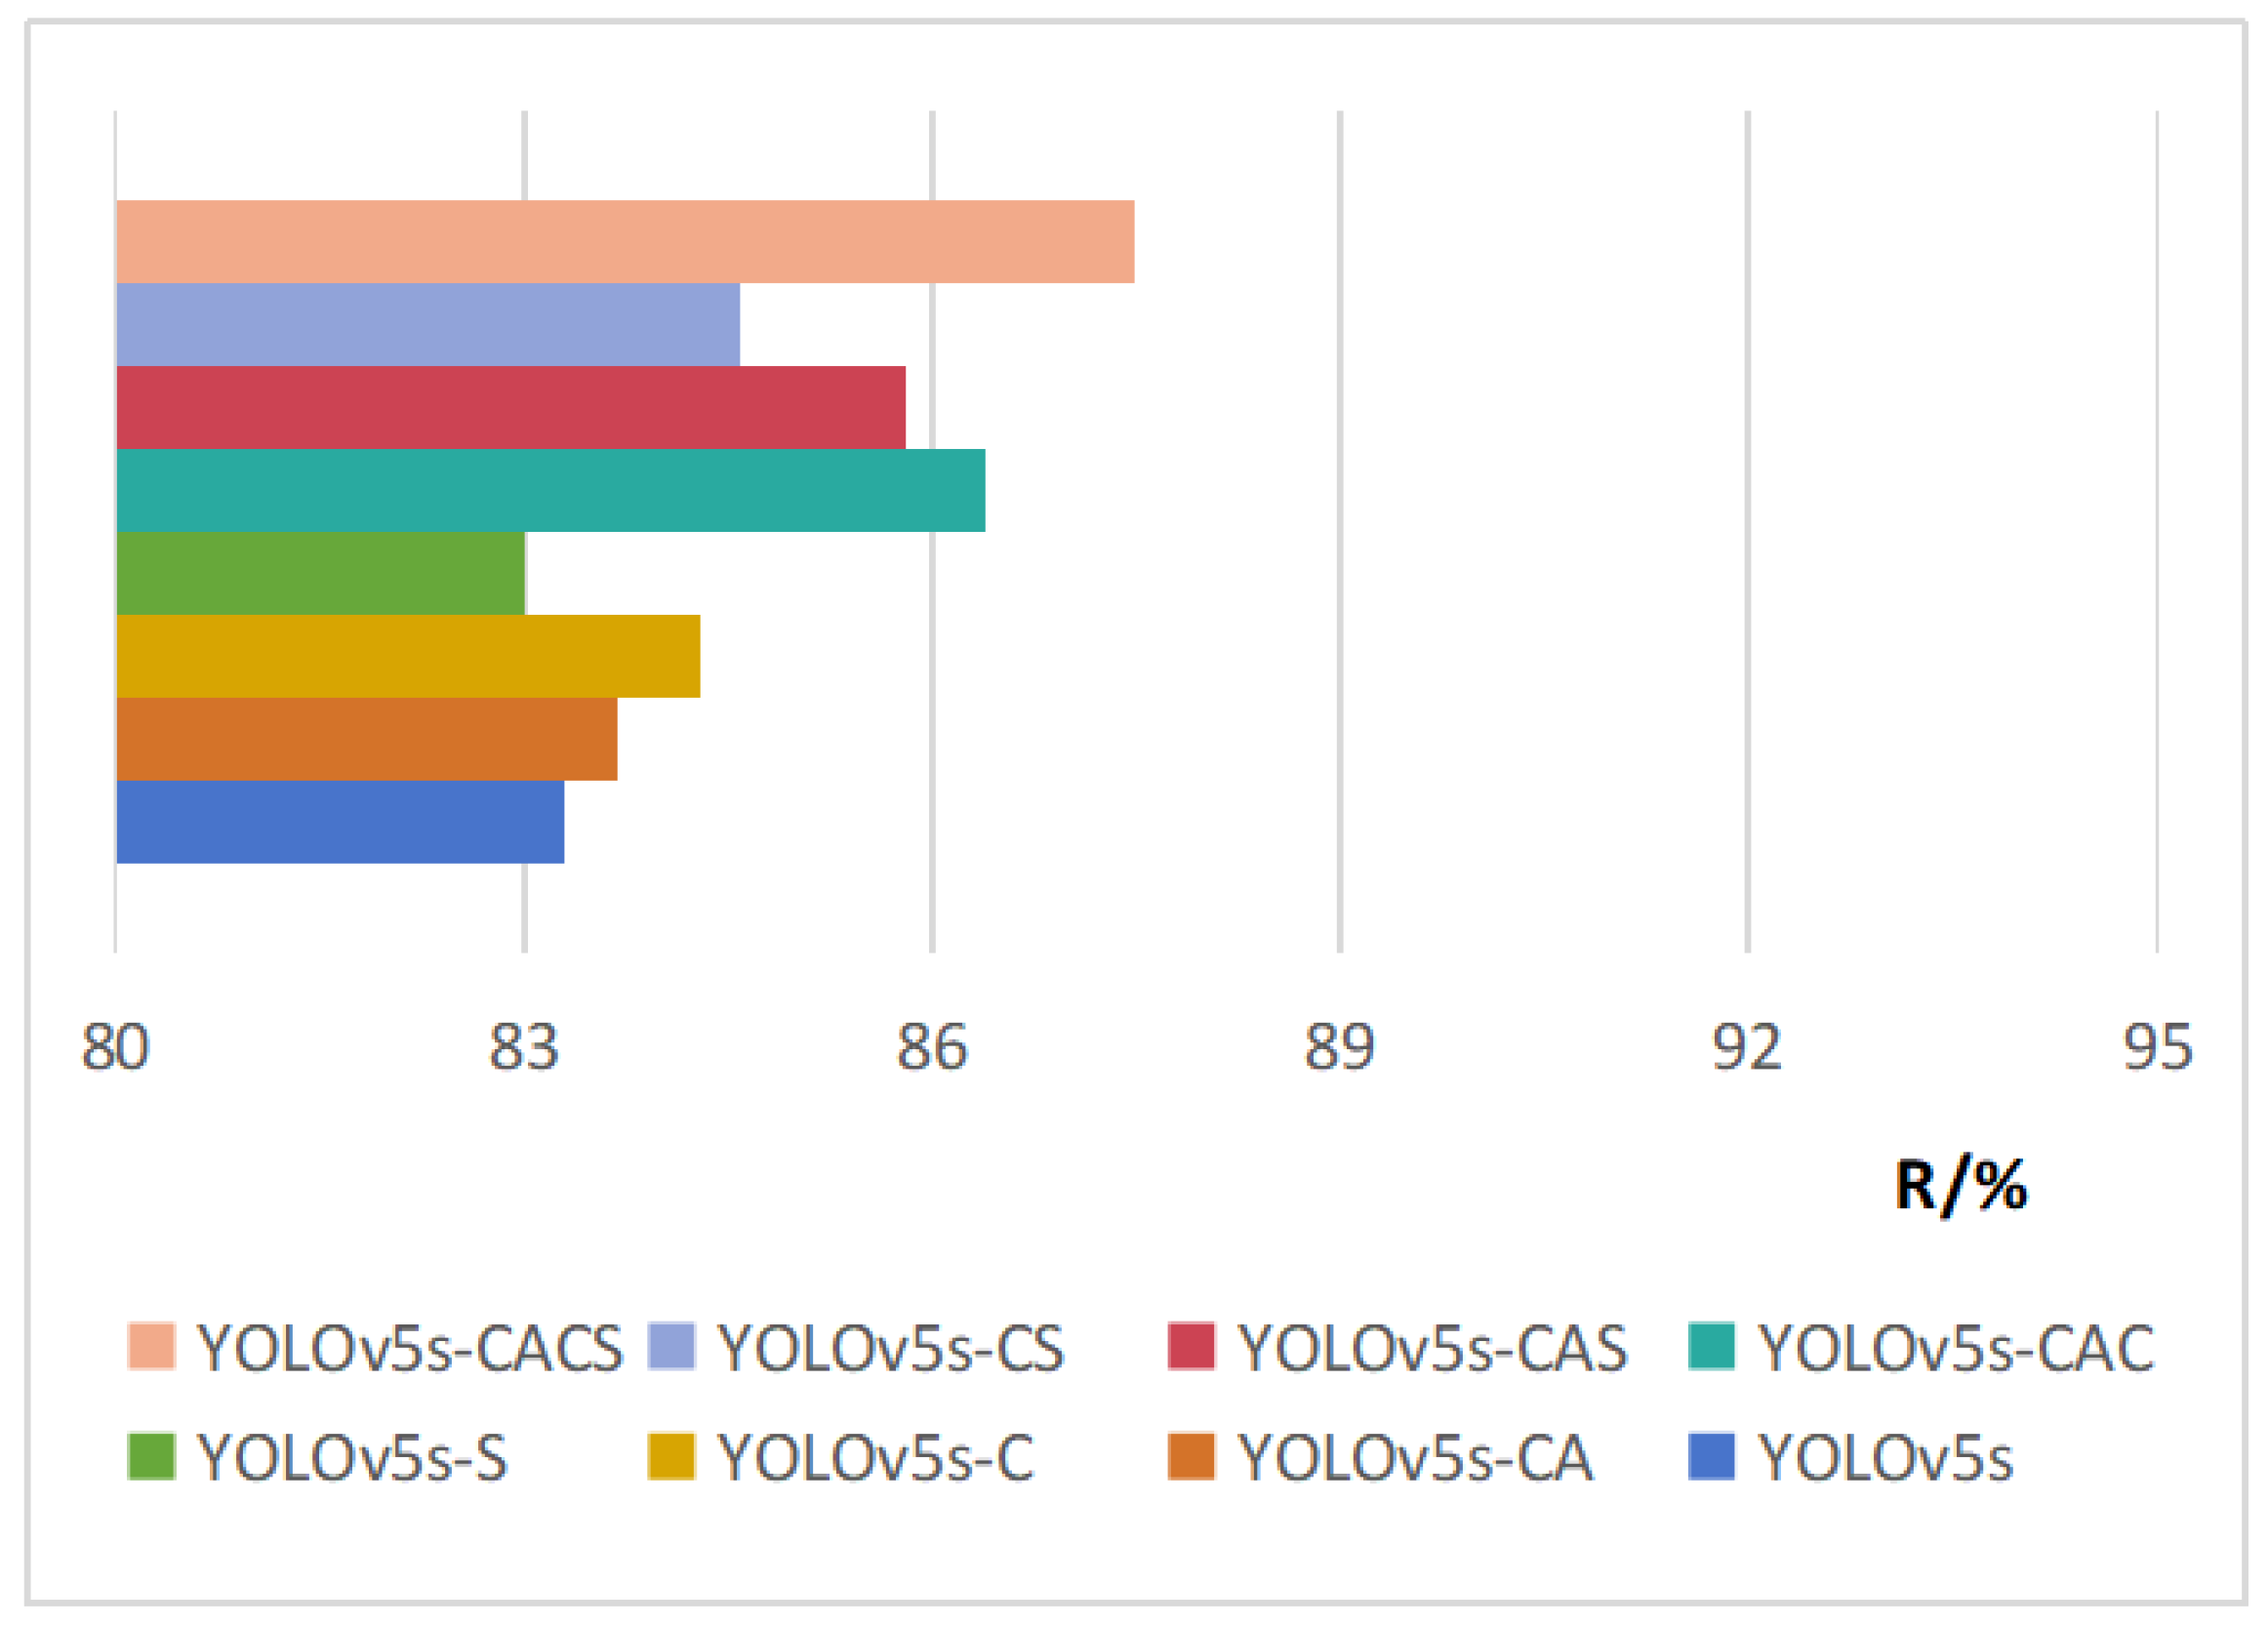
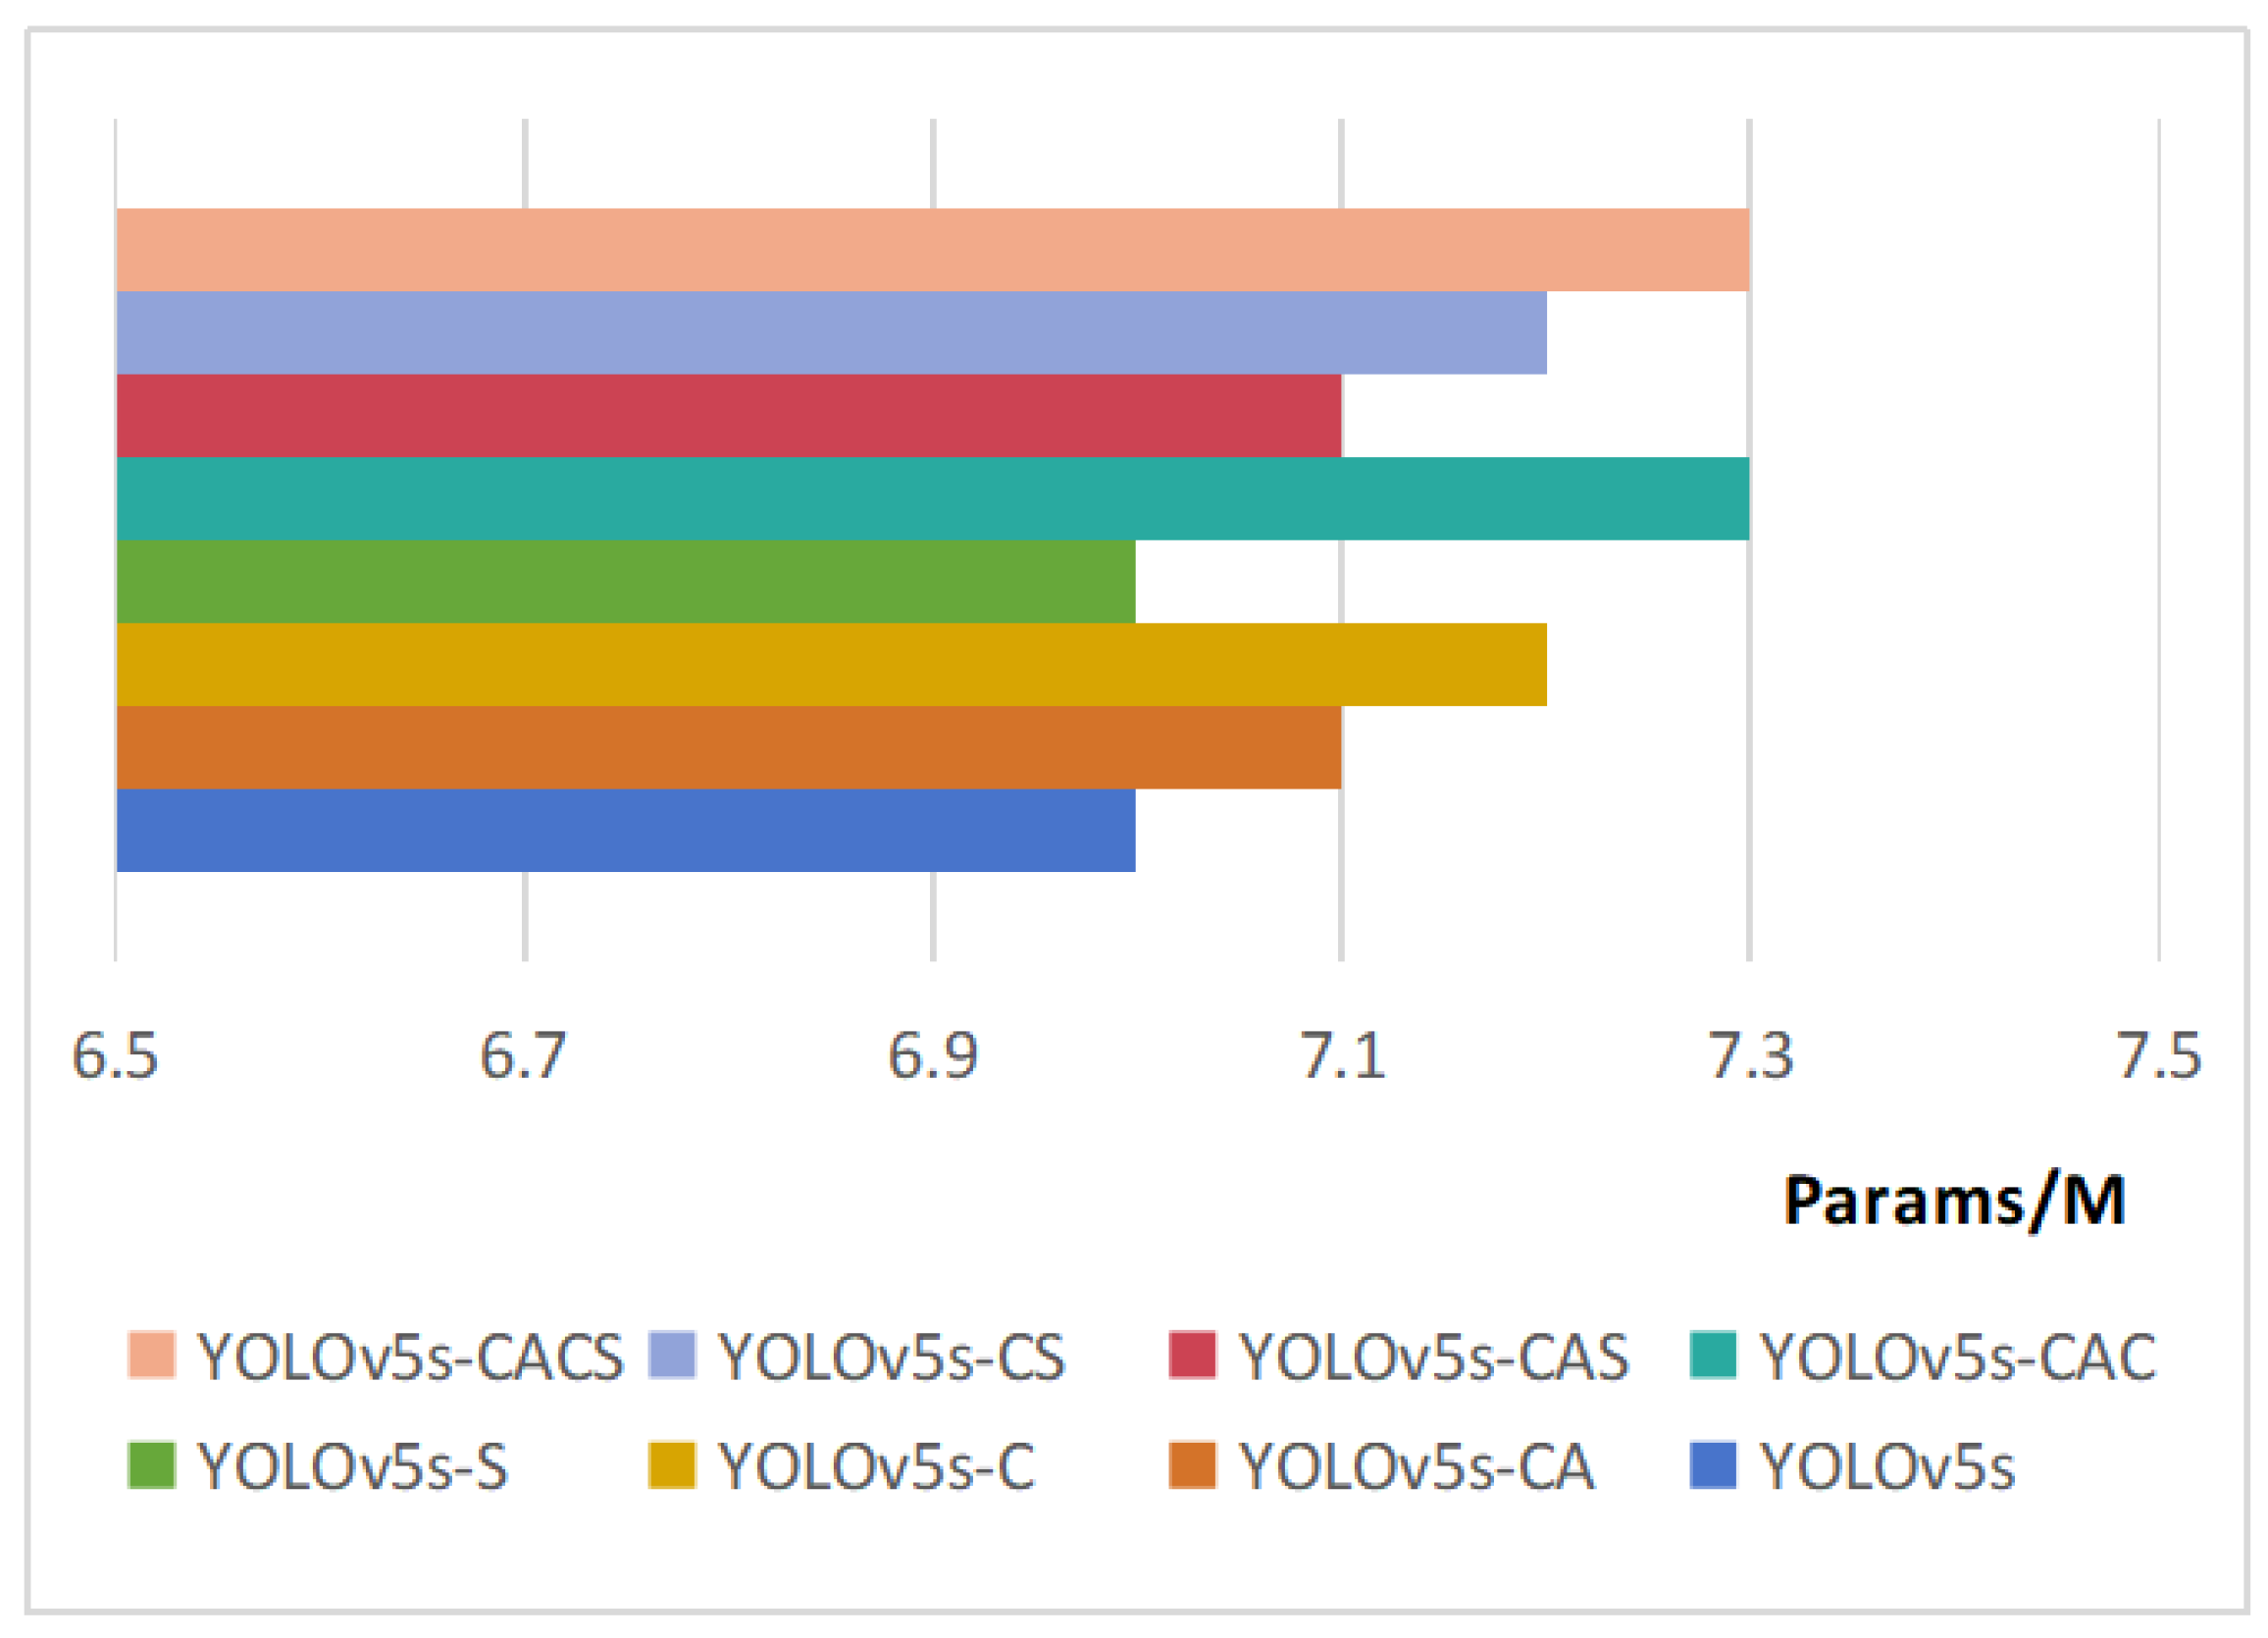
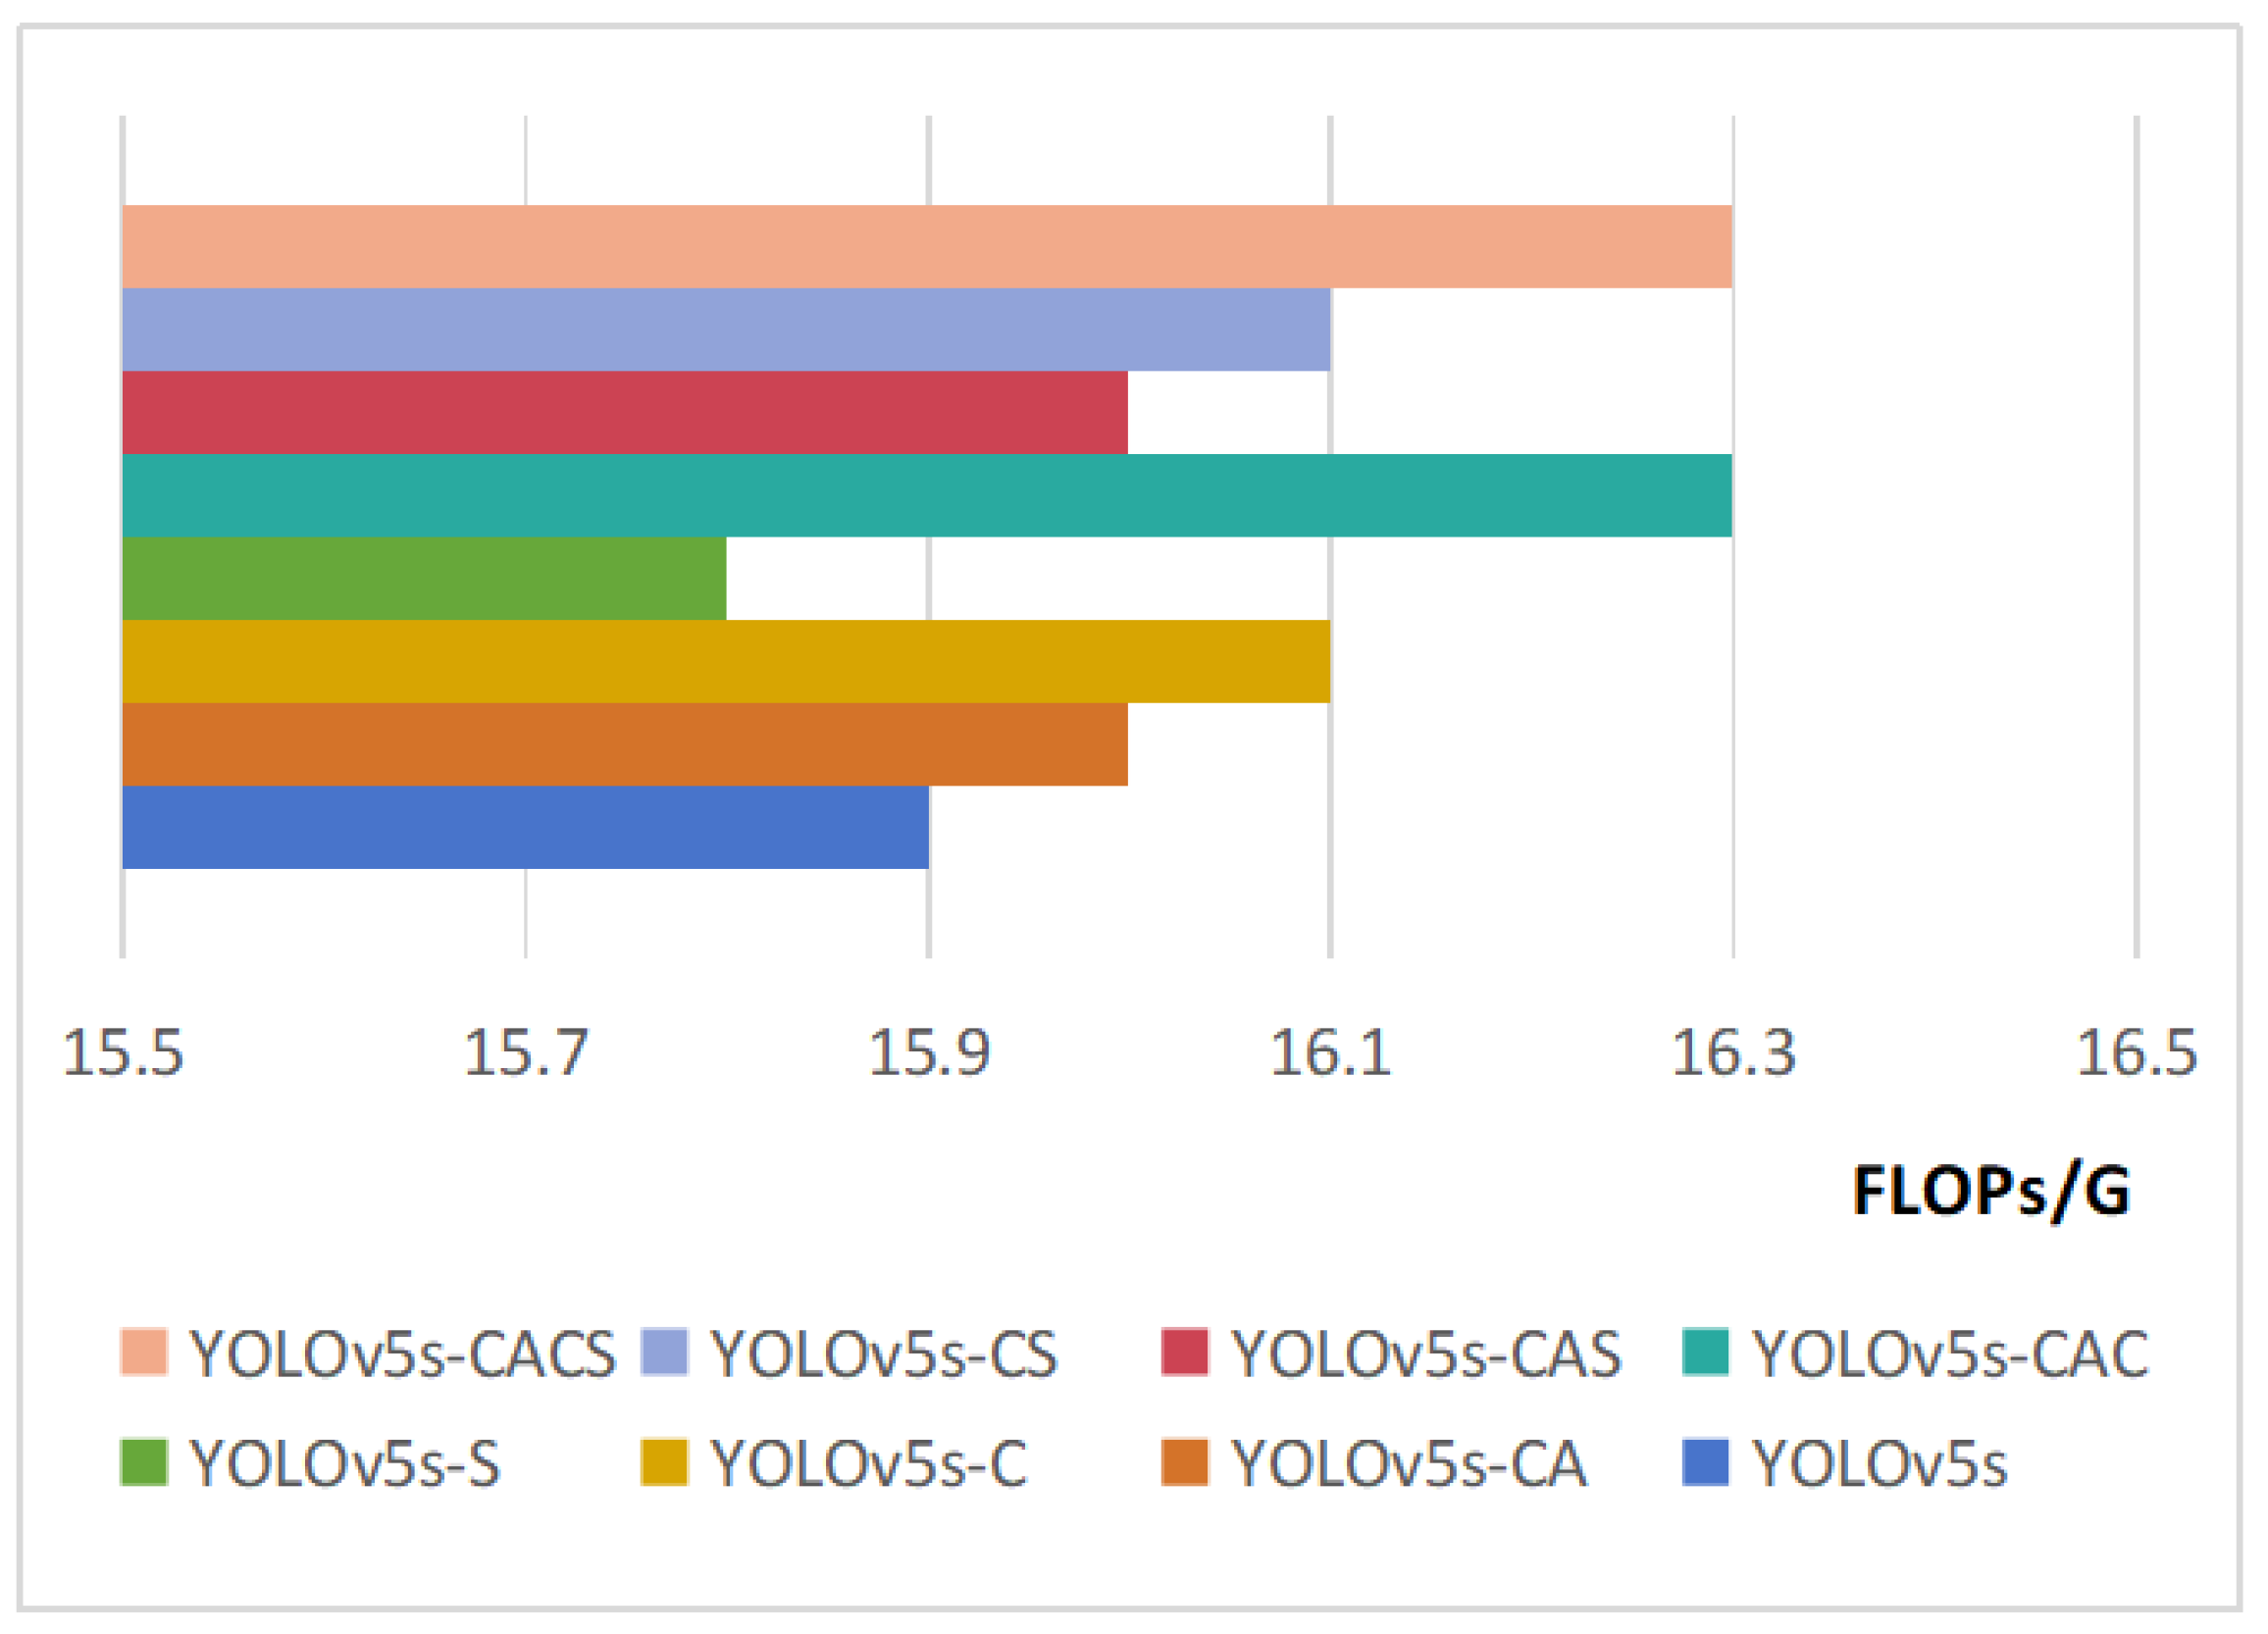
| Network Names | mAP/% | P/% | R/% | Params/M | FLOPs/G |
|---|---|---|---|---|---|
| YOLOv5s | 87.3 | 85.6 | 83.3 | 7.0 | 15.9 |
| YOLOv5s-CA | 88.7 | 87.9 | 83.7 | 7.1 | 16.0 |
| YOLOv5s-C | 88.9 | 88.3 | 84.3 | 7.2 | 16.1 |
| YOLOv5s-S | 87.7 | 86.3 | 83.0 | 7.0 | 15.8 |
| YOLOv5s-CAC | 90.3 | 90.1 | 86.4 | 7.3 | 16.3 |
| YOLOv5s-CAS | 89.2 | 88.5 | 85.8 | 7.1 | 16.0 |
| YOLOv5s-CS | 89.6 | 89.8 | 84.6 | 7.2 | 16.1 |
| YOLOv5s-CACS | 91.8 | 92.7 | 87.5 | 7.3 | 16.3 |
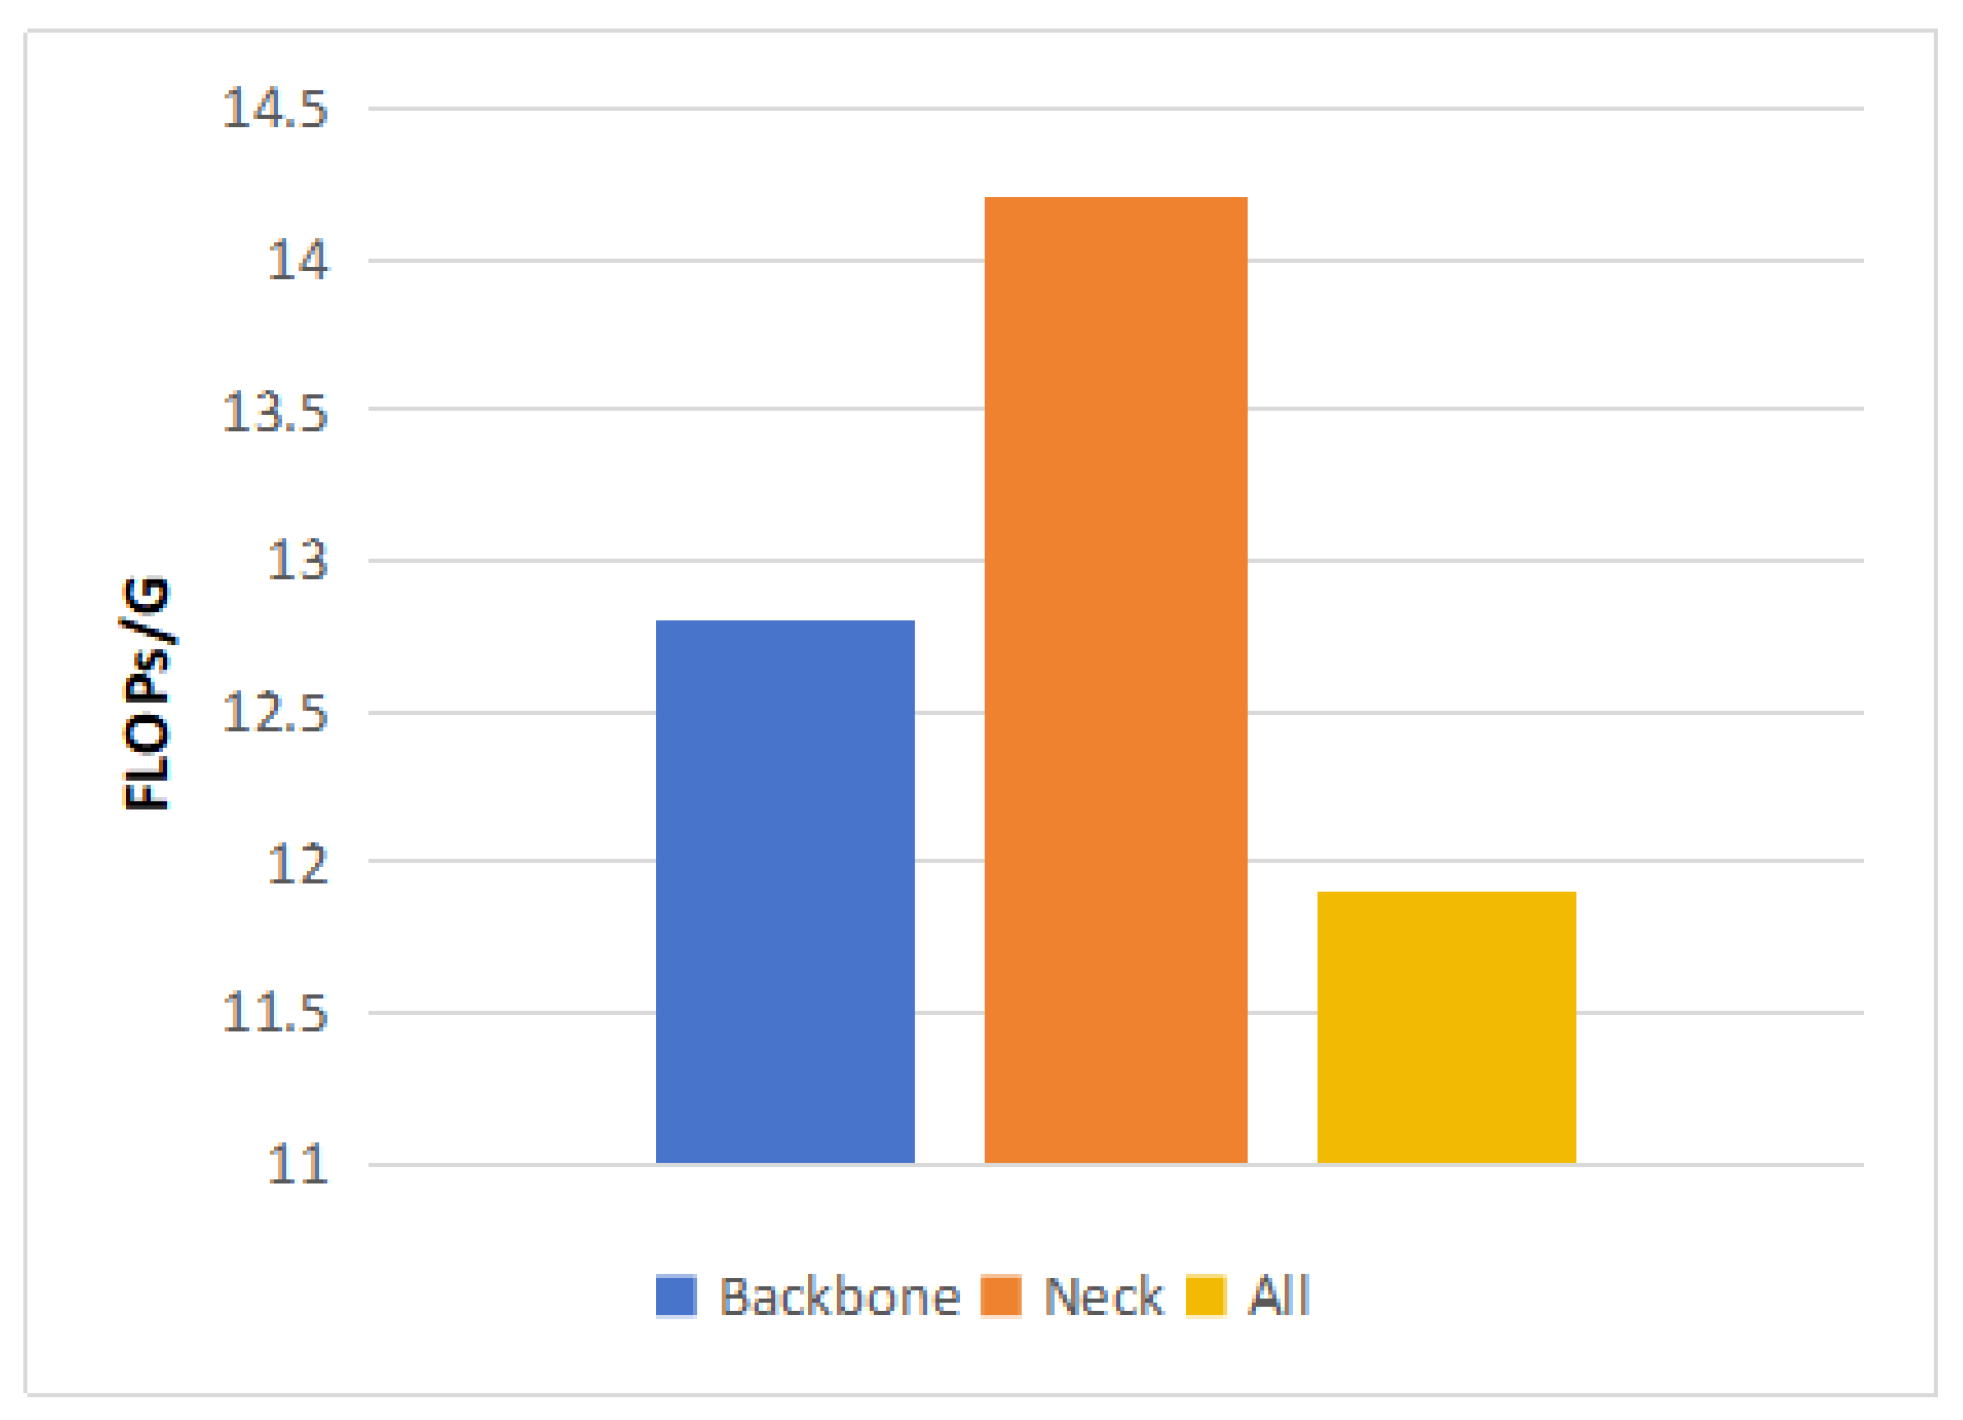
| Replace Position | mAP/% | P/% | R/% | Params/M | FLOPs/G |
|---|---|---|---|---|---|
| Backbone | 91.0 | 92.6 | 87.1 | 6.1 | 12.8 |
| Neck | 89.8 | 93.2 | 85.7 | 6.6 | 14.2 |
| All | 87.3 | 87.3 | 82.9 | 5.4 | 11.9 |
| Network Names | mAP/% | Params/M | FLOPs/G |
|---|---|---|---|
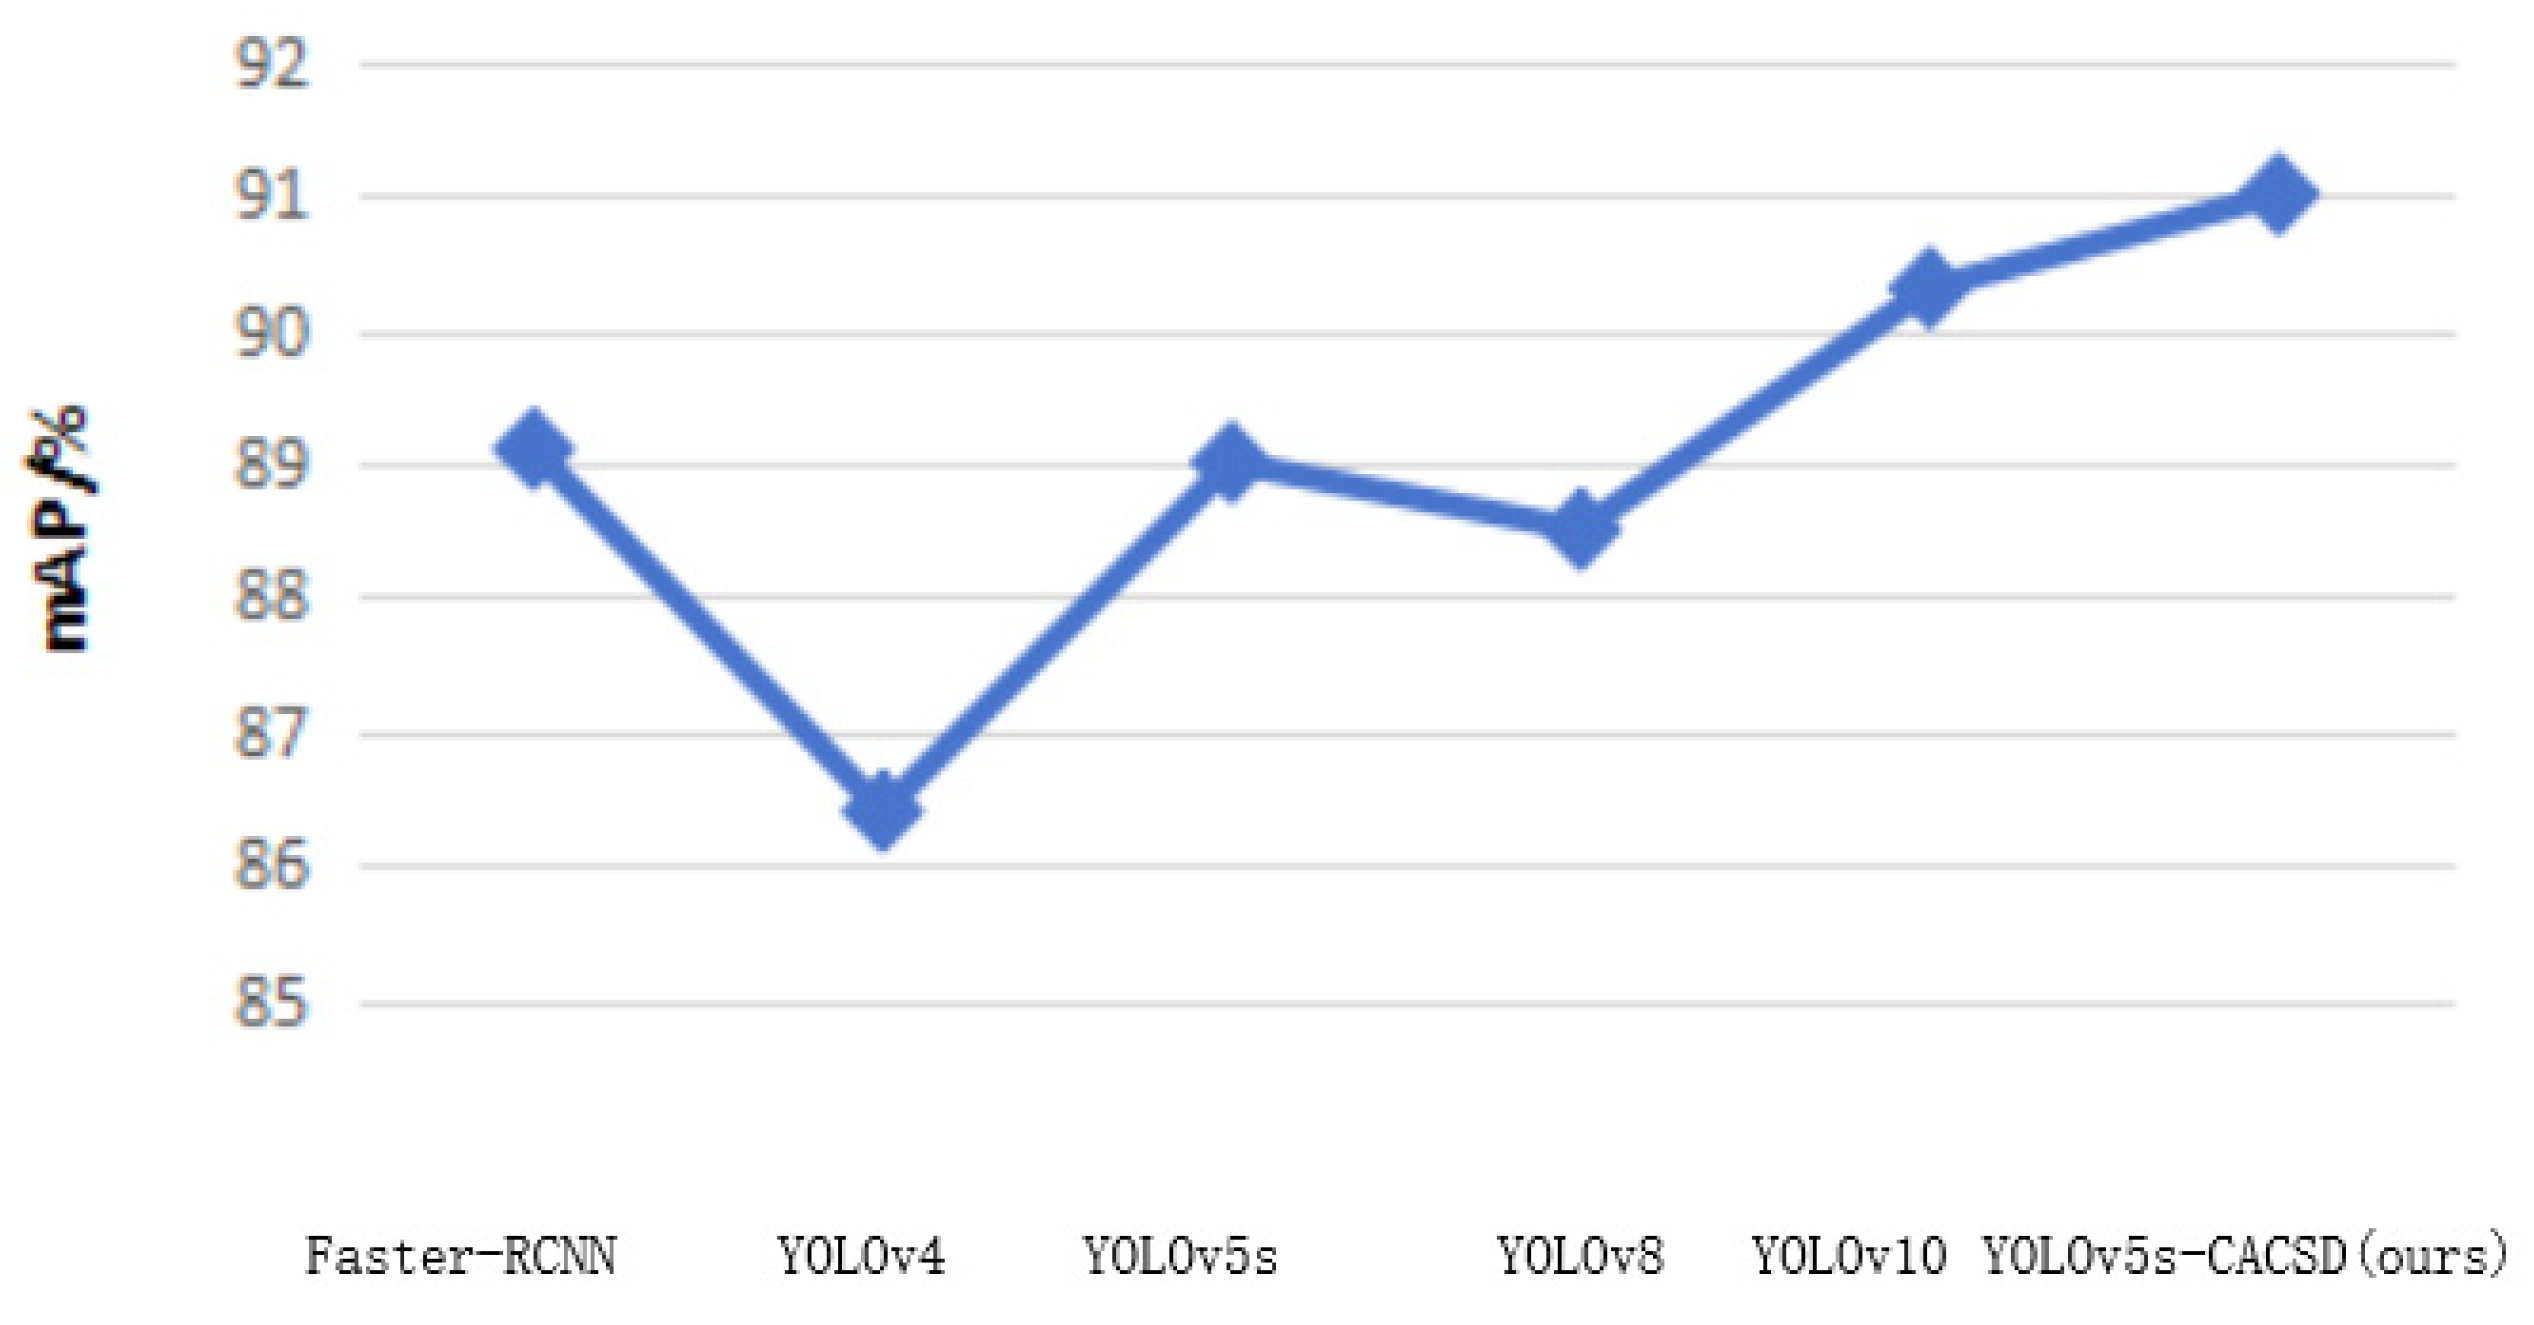
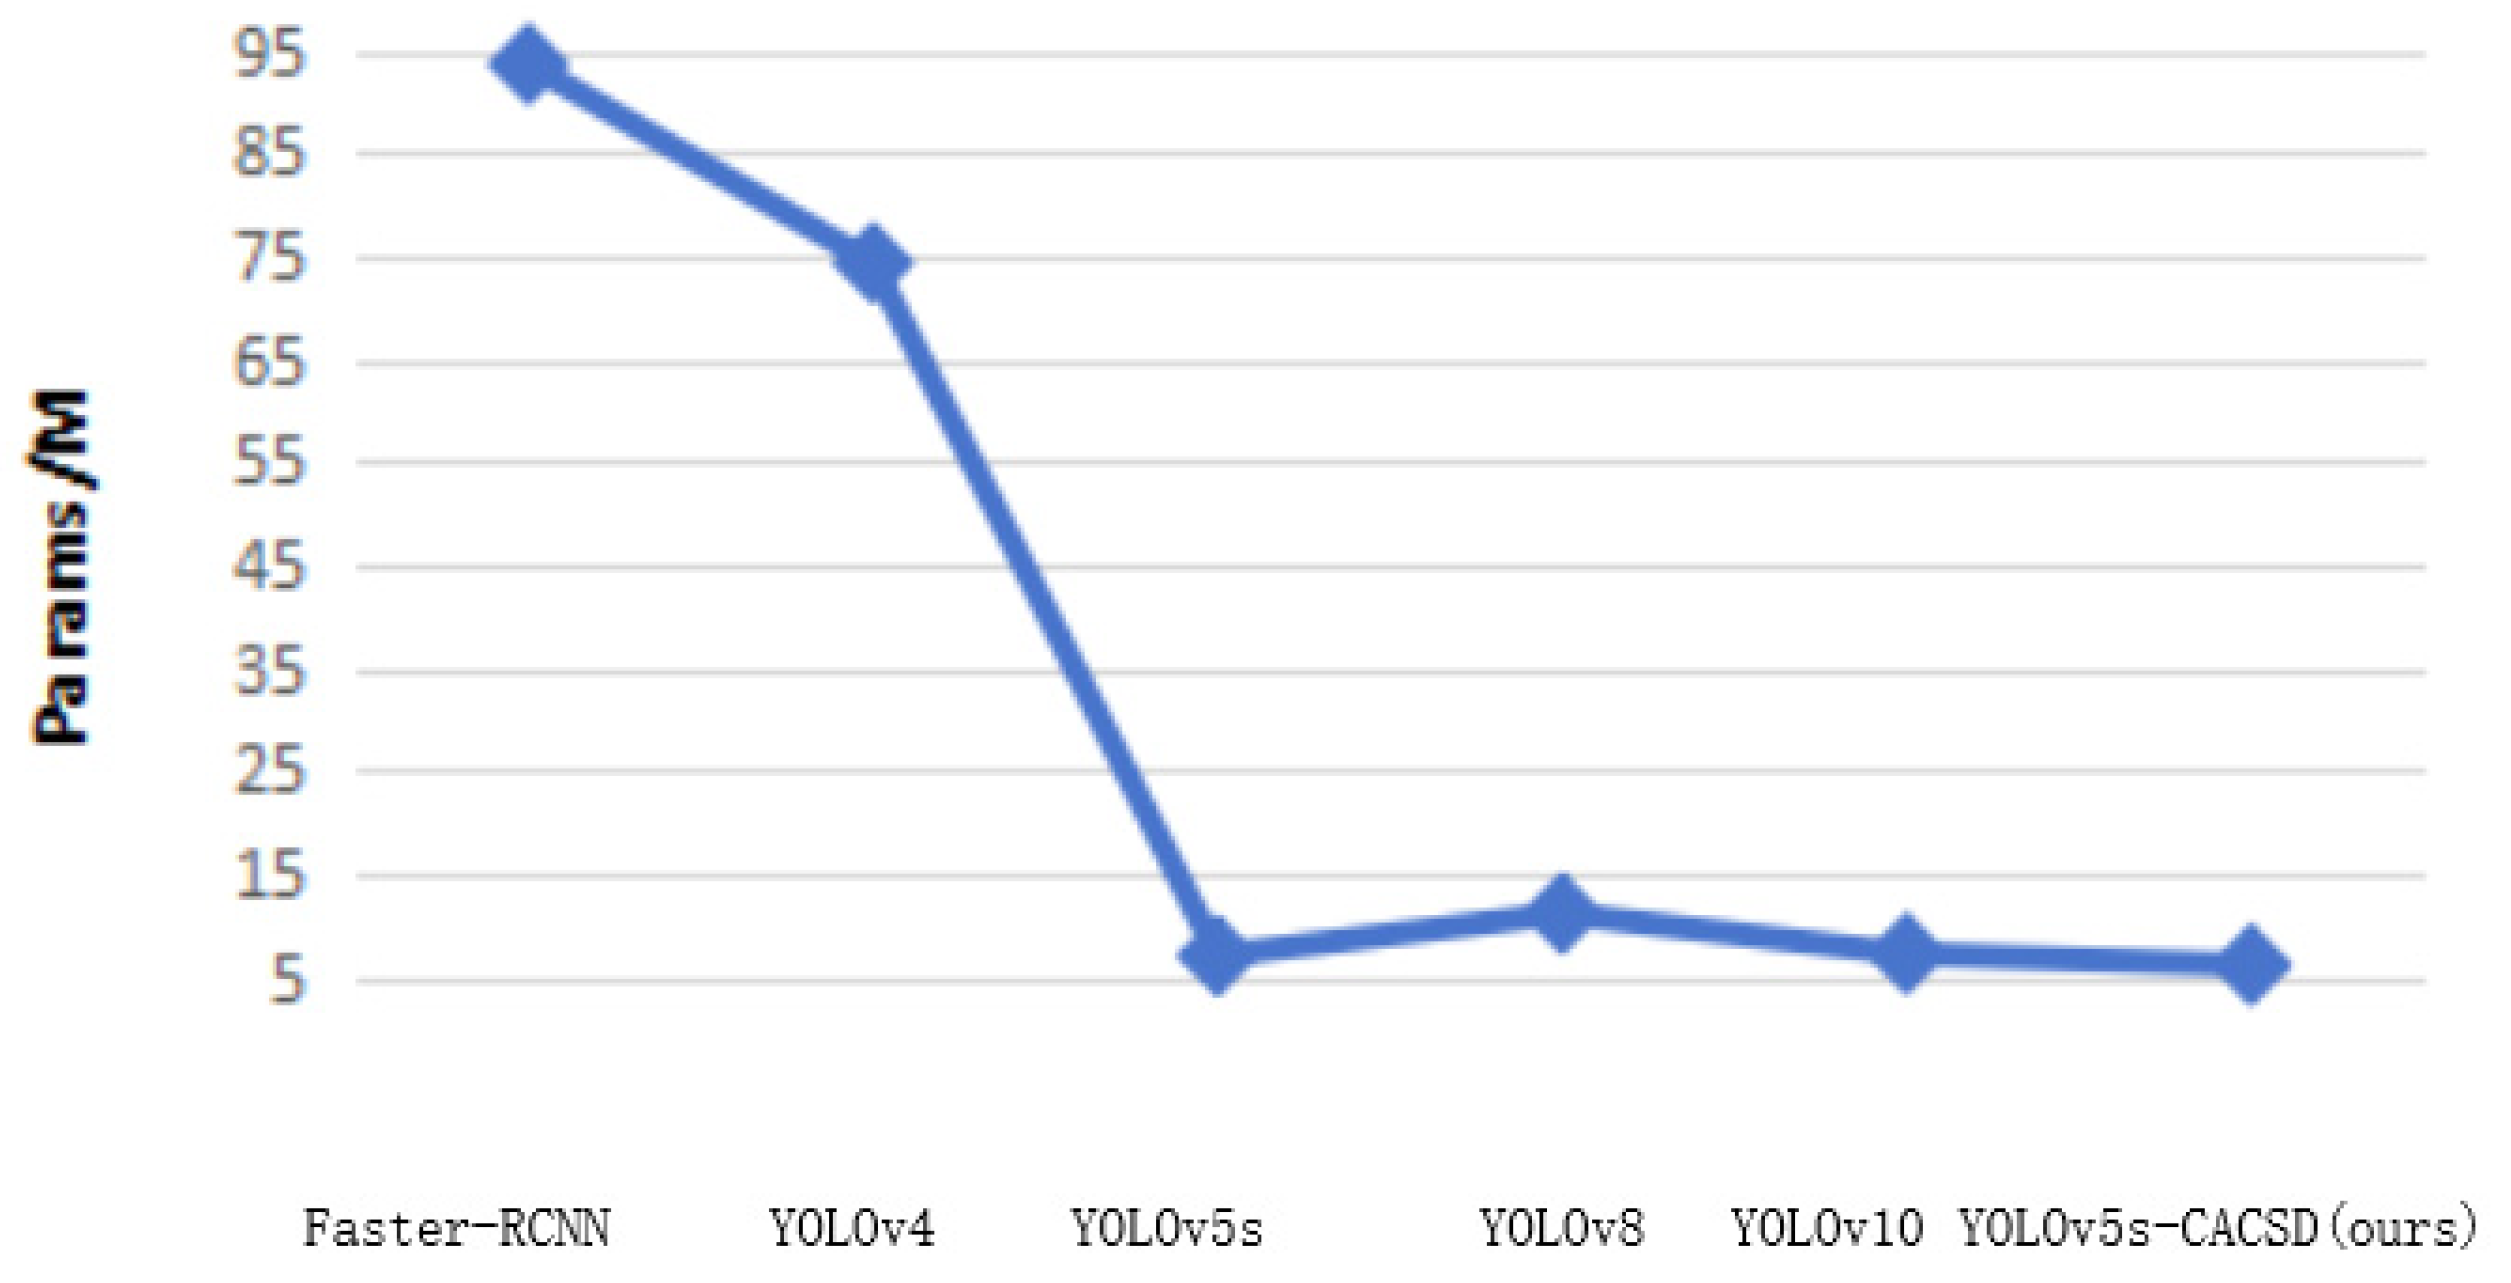
| Faster-RCNN | 89.1 | 93.6 | 198.7 |
| YOLOv4 | 86.4 | 74.3 | 153.2 |
| YOLOv5s | 89.0 | 7.0 | 15.9 |
| YOLOv8 | 88.5 | 11.1 | 28.4 |
| YOLOv10 | 90.3 | 7.2 | 21.6 |
| YOLOv5s-CACSD (ours) | 91.0 | 6.1 | 12.8 |
| Target Categories | Faster-RCNN | YOLOv4 | YOLOv5s | YOLOv8 | YOLOv10 | YOLOv5s-CACSD |
|---|---|---|---|---|---|---|
| plane | 84.6 | 87.4 | 83.7 | 82.6 | 87.9 | 86.7 |
| ship | 81.3 | 81.2 | 81.6 | 80.9 | 82.2 | 82.5 |
| storage tank | 83.7 | 87.5 | 85.2 | 84.3 | 88.6 | 89.3 |
| baseball diamond | 93.1 | 93.3 | 90.4 | 92.7 | 94.8 | 94.1 |
| tennis court | 95.6 | 89.7 | 95.8 | 94.9 | 96.1 | 96.4 |
| basketball court | 94.5 | 90.3 | 89.9 | 91.3 | 94.5 | 94.9 |
| ground track field | 97.4 | 92.4 | 88.1 | 89.1 | 94.3 | 93.6 |
| harbor | 94.1 | 88.5 | 85.8 | 87.2 | 89.5 | 88.8 |
| bridge | 70.3 | 90.1 | 79.4 | 75.5 | 84.4 | 85.0 |
| large vehicle | 88.6 | 86.9 | 84.6 | 85.6 | 88.7 | 89.3 |
| small vehicle | 79.7 | 80.0 | 77.5 | 78.4 | 81.3 | 82.1 |
| helicopter | 82.3 | 83.0 | 75.5 | 75.0 | 81.5 | 82.8 |
| roundabout | 77.9 | 90.2 | 86.8 | 84.9 | 87.8 | 86.3 |
| soccer field | 92.7 | 93.6 | 84.2 | 86.8 | 94.0 | 92.1 |
| swimming pool | 76.4 | 88.7 | 79.2 | 78.8 | 87.2 | 87.4 |
Disclaimer/Publisher’s Note: The statements, opinions and data contained in all publications are solely those of the individual author(s) and contributor(s) and not of MDPI and/or the editor(s). MDPI and/or the editor(s) disclaim responsibility for any injury to people or property resulting from any ideas, methods, instructions or products referred to in the content. |
© 2025 by the authors. Licensee MDPI, Basel, Switzerland. This article is an open access article distributed under the terms and conditions of the Creative Commons Attribution (CC BY) license (https://creativecommons.org/licenses/by/4.0/).
Share and Cite
Hu, W.; Jiang, X.; Tian, J.; Ye, S.; Liu, S. Land Target Detection Algorithm in Remote Sensing Images Based on Deep Learning. Land 2025, 14, 1047. https://doi.org/10.3390/land14051047
Hu W, Jiang X, Tian J, Ye S, Liu S. Land Target Detection Algorithm in Remote Sensing Images Based on Deep Learning. Land. 2025; 14(5):1047. https://doi.org/10.3390/land14051047
Chicago/Turabian StyleHu, Wenyi, Xiaomeng Jiang, Jiawei Tian, Shitong Ye, and Shan Liu. 2025. "Land Target Detection Algorithm in Remote Sensing Images Based on Deep Learning" Land 14, no. 5: 1047. https://doi.org/10.3390/land14051047
APA StyleHu, W., Jiang, X., Tian, J., Ye, S., & Liu, S. (2025). Land Target Detection Algorithm in Remote Sensing Images Based on Deep Learning. Land, 14(5), 1047. https://doi.org/10.3390/land14051047