1. Introduction
With the acceleration of global urbanization, rapid urban expansion has led to the loss of ecosystem services (ESs), a decline in biodiversity, and various socio-economic challenges [
1]. For example, green space resources are converted into urban construction land due to urban expansion, limiting recreational areas for residents and negatively impacting public health. Urban expansion can also have a negative impact on ecosystems such as wetlands and forests, weakening the resilience of ecosystems. To address these issues, optimizing land use efficiency and promoting compact urban development have been proposed as potential solutions to achieve economic, social, and environmental goals [
2]. Although intensive development strategies can reduce land consumption, they may also lead to a deterioration in ecological quality [
3]. For instance, Hong Kong, as a representative compact city, has experienced continuous shrinkage and fragmentation of its natural environment due to high-density urban land use [
4]. In particular, Kowloon and the coastal areas of Hong Kong Island exhibit the highest degree of green space fragmentation, with small and scattered green patches that limit their ecological functions [
5]. Compact and intensive urban planning often results in high-density urban areas, where green space allocation is deprioritized, especially in developing countries. A study on green space distribution across the capitals of 159 countries found a strong correlation between green space availability and economic development, with cities in developing countries generally having fewer green spaces due to high population density [
6].
ESsare generally categorized into supporting, regulating, provisioning, and cultural services; each service category is interconnected yet distinct [
7]. Supporting services provide the foundational processes for ecosystem functions, regulating services manage environmental conditions (such as climate regulation and air quality), and provisioning services emphasize the supply of material resources [
8]. Among them, cultural ecosystem services (CESs) refer to the non-material benefits that people derive from natural and semi-natural ecosystems, including recreation, aesthetics, cultural identity, and spiritual well-being [
9]. Compared to other types of ES, CES is intangible, making it difficult to quantify and compare directly [
10]. A survey on public perception of tree-related CES found that while most respondents were unfamiliar with the term “CES”, they highly valued the aesthetic and spiritual benefits provided by trees [
11]. Similarly, qualitative interviews revealed that respondents found it difficult to articulate the specific benefits of nature experiences, although they perceived them as “obvious” and “irreplaceable” [
12].
Urban green spaces play a crucial ecological role in urban environments [
2]. As primary carriers of CES, they serve as important avenues for residents to access cultural services, contributing significantly to social well-being and environmental sustainability [
13]. By enhancing CES, urban green spaces improve ecological functionality, strengthen green infrastructure, and bolster urban resilience [
14]. However, as urban demand for CES continues to grow, the mismatch between CES supply and demand has become increasingly severe [
15]. Existing studies have identified spatial disparities in CES distribution, where central urban areas and high-income districts tend to enjoy more cultural services, whereas peripheral areas and low-income communities often face inadequate CES supply [
16]. Furthermore, in most urban regions, CES supply fails to meet demand, particularly in high-density areas, where demand for cultural services significantly exceeds availability [
17]. Therefore, exploring the spatial coupling relationships of urban green space CES and addressing supply–demand mismatches is of great research significance and practical value. As a rapidly urbanizing country, China faces pronounced urban expansion challenges, making it imperative to incorporate balanced CES allocation into urban planning strategies [
18].
For CES valuation, monetization approaches, such as willingness to pay, are commonly employed to assess public valuation of CES [
19]. However, these methods often suffer from subjectivity, as survey respondents’ perceptions significantly influence valuation outcomes [
20]. In terms of CES characterization and perception studies, researchers frequently use questionnaires [
21], interviews [
22], social media data [
23,
24,
25], and participatory GIS mapping [
26] to gather public opinions. However, due to data limitations, most studies focus on small- or medium-scale ecosystems or communities [
27,
28], making it difficult to capture city-wide CES dynamics [
29]. Consequently, research on CES at the urban scale remains limited.
Nanjing, like many rapidly urbanizing cities, has undergone significant land expansion and land-use transformations [
30], leading to a notable decline in ES levels [
31]. At the same time, Nanjing’s unique geographical location and ecological environment reflect the characteristics of cities in the Global South, such as facing more severe urban heat island effects during the urbanization process [
32], heightened ecological risks of rivers and other water bodies [
33], and more significant impacts from industrialization [
34]. As urbanization progresses, large areas of natural land are being converted into urban construction land, leading to a gradual reduction in urban green space and the degradation of ecological functions [
35]. In particular, the ecological environment in the peripheral areas of the city has come under significant pressure, and the imbalance between CES supply and demand has become increasingly prominent [
36]. Therefore, land use issues in Nanjing not only threaten the quality of life for residents but also directly impact the sustainable development of the city. To bridge the research gap, this study investigates the following key questions: What are the spatial characteristics of CES supply and demand in urban green spaces? Is the CES supply–demand relationship in urban green spaces well-balanced? How should future green space planning be optimized in similar urban contexts? This study integrates multi-source data and employs spatial quantitative analysis to generate a city-scale CES valuation map, revealing spatial variations in cultural service supply capacity and demand intensity. By providing a visual representation of CES supply–demand relationships, this research offers critical insights into urban green space planning strategies. Based on the findings, this study proposes practical green space layout strategies to mitigate supply–demand mismatches, enhance CES functions, and ultimately improve urban residents’ quality of life. The results provide scientific evidence for urban planners and policymakers, assisting in the development of strategies to better address growing public cultural needs.
2. Materials and Methods
2.1. Subsection
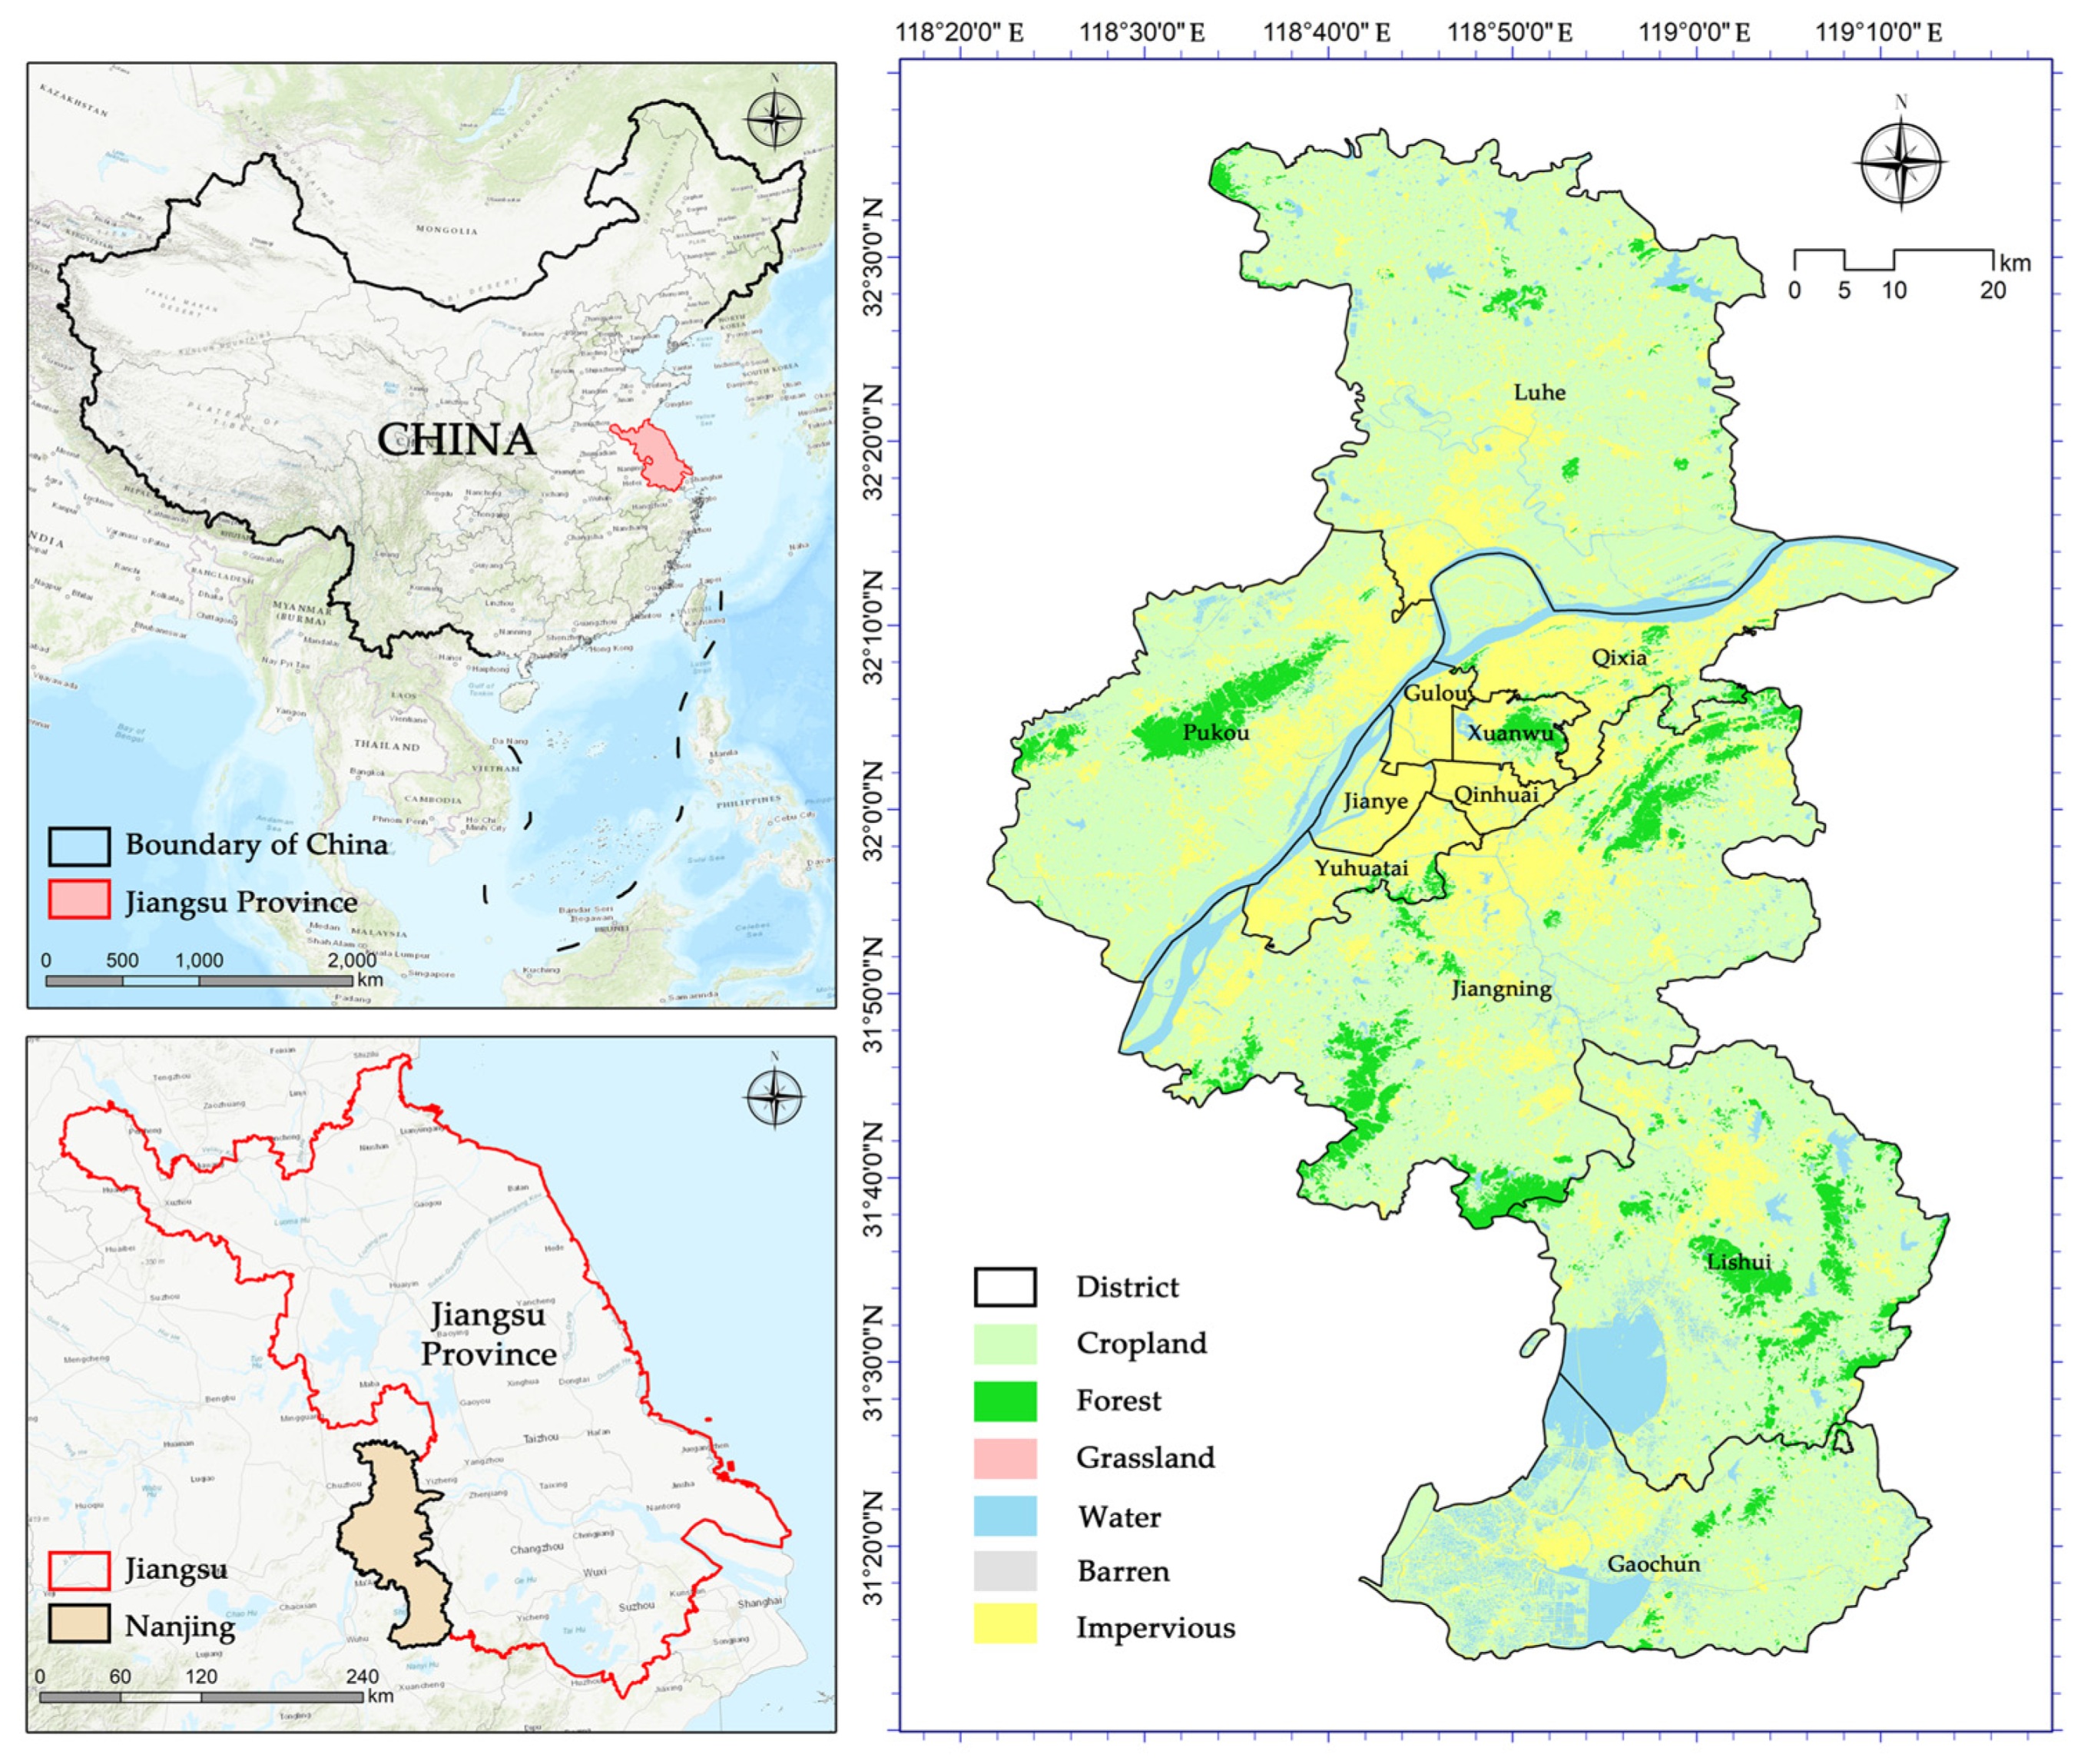
Nanjing, the capital of Jiangsu Province, is located in the southwestern part of Jiangsu Province and the lower reaches of the Yangtze River. It extends from 31°14′ N in the south to 32°37′ N in the north, and from 118°22′ E in the west to 119°14′ E in the east (
Figure 1). The city has a maximum east–west span of approximately 70 km and a north–south span of about 150 km. With a total area of 6587.04 square kilometers, Nanjing has a permanent population of 9.547 million. As a representative city of rapid urbanization in China, it embodies the typical characteristics of highly urbanized areas. Its significant urban expansion, coupled with the challenges of managing green spaces and ecosystem services, makes it an ideal case study for understanding the dynamics of urban green space management. The city’s rapid population growth, spatial restructuring, and urban sprawl reflect broader trends seen in other Chinese cities undergoing similar levels of urbanization. Therefore, selecting Nanjing for this study provides a valuable opportunity to explore the complex interactions between urban development and CES, offering insights that can be applied to other rapidly urbanizing cities in China and beyond.
Nanjing administers 11 districts: Xuanwu, Qinhuai, Jianye, Gulou, Pukou, Qixia, Yuhuatai, Jiangning, Liuhe, Lishui, and Gaochun. Based on geographic distribution and urban development, this study classifies all districts except Liuhe, Lishui, and Gaochun as the main urban area of Nanjing.
The primary datasets used in this research include the Normalized Difference Vegetation Index (NDVI), China Land Use and Land Cover Data, Points of Interest (POI) Data for Nanjing, Areas of Interest (AOI) Data, Road Network Data, Water Surface Data, Population Density Raster Data, and Nighttime Light Index. These datasets facilitate the identification of residential communities, urban green spaces, and related infrastructure, as well as the spatial patterns of urban development. The data sources are summarized in the table below (
Table 1). The comprehensive use of these data provides crucial support for a holistic understanding of the supply–demand characteristics of CESs in urban green spaces and their spatial interactions.
2.2. Research Methods
2.2.1. Research Frame
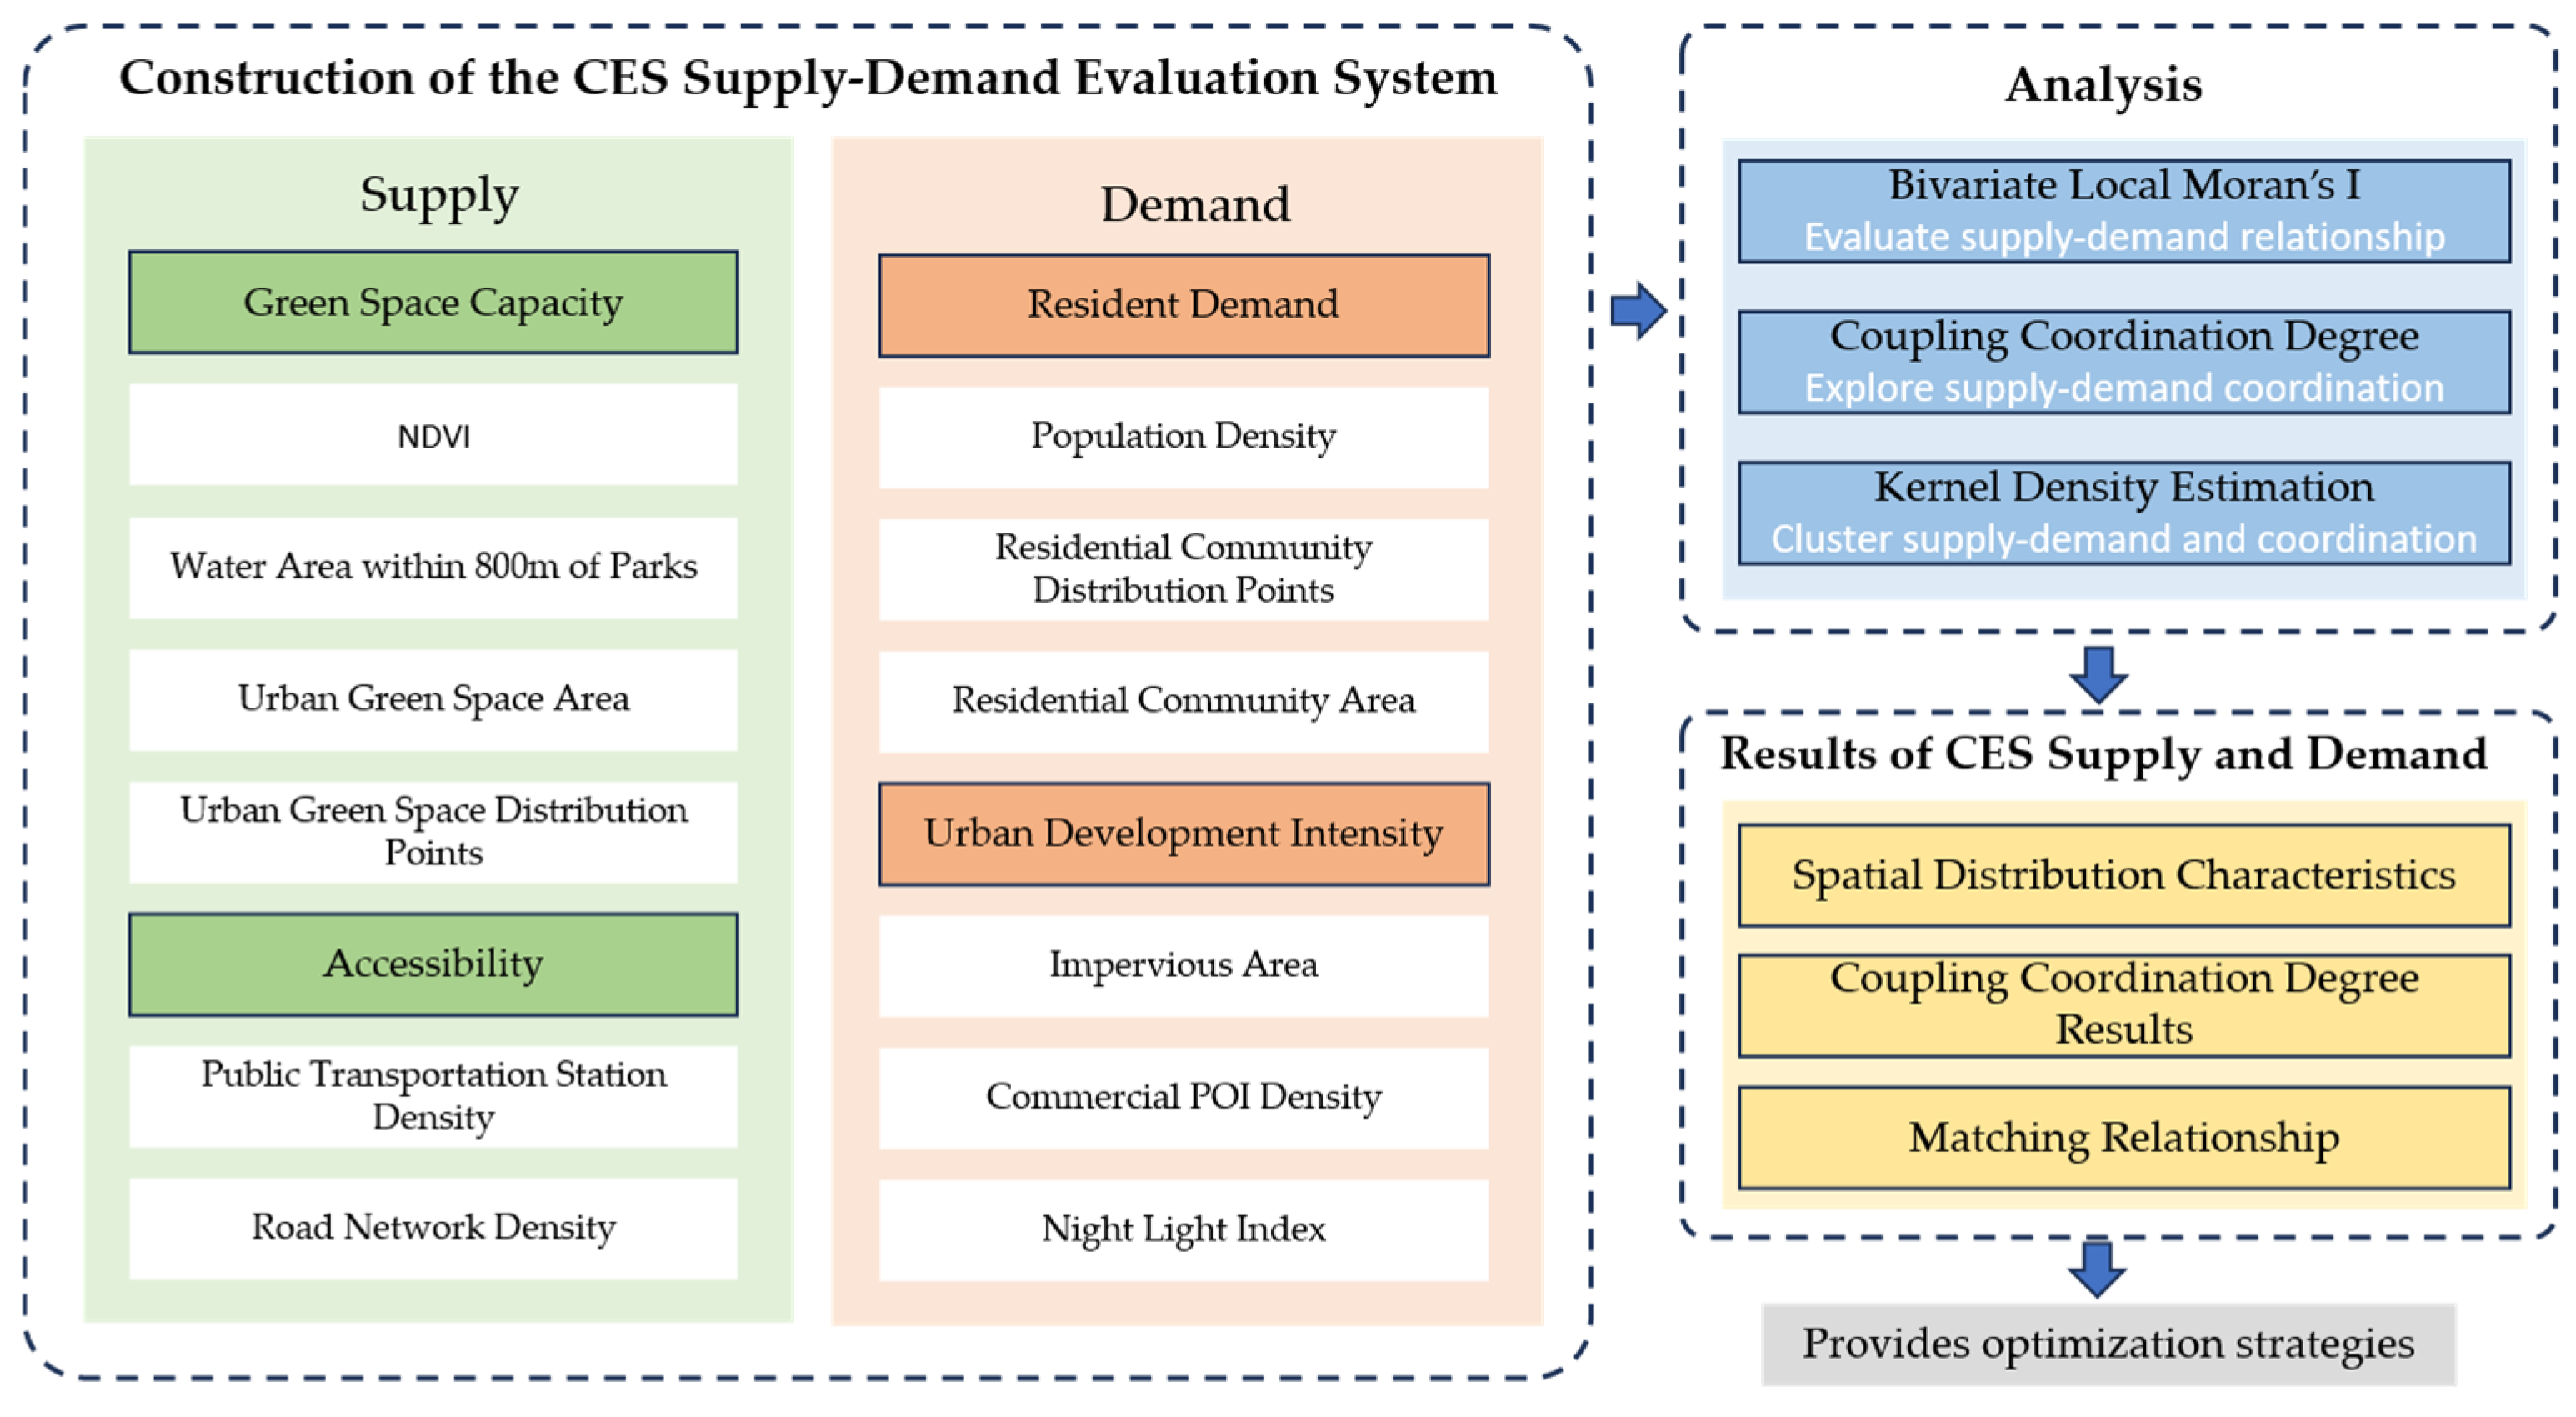
To analyze the spatial coupling characteristics of CES supply and demand in urban green spaces in Nanjing, a research framework was established using a series of spatial analysis techniques. First, a fishnet grid was constructed for the study area, onto which the spatial distribution characteristics of CES supply and demand intensity were projected within each grid unit. Spatial autocorrelation analysis (Bivariate Moran’s I) was then applied to examine the spatial patterns of supply, demand, and their matching characteristics. Subsequently, a coupling coordination model was used to assess the degree of coordination between the CES supply and demand systems. Finally, k-means clustering was employed to classify the spatial distribution characteristics of supply and demand along with their coupling coordination levels. This approach allowed for the identification of distinct clustering patterns of CES supply and demand in Nanjing’s urban green spaces. The research framework is illustrated in the accompanying figure (
Figure 2).
2.2.2. Entropy Method
To eliminate the differences in dimensions across various data, this study applies the range normalization method to standardize the data, mapping the values to a range between 0 and 1. This ensures that the indicators are comparable when calculating. Through normalization, the relative differences between the data are preserved while the influence of absolute values on the analysis results is eliminated. This forms the foundation for consistent data in the subsequent weight assignment and comprehensive evaluation. The selected indicators in this study are all positive indicators, and the normalization process is as follows:
where
yij is the normalized value of the j-th indicator for the i-th unit area,
Xij is the corresponding raw data, and
Xmin,
Xmax are the minimum and maximum values of the indicator, respectively.
In this study, the entropy method is used to objectively assign weights to the data based on their importance. The entropy method assigns weights by calculating the information entropy of each indicator, which is objective and does not rely on subjective judgment, thus avoiding biases in the results. Additionally, since this study uses multiple indicators to reflect the CES supply–demand characteristics, the entropy method effectively avoids the deviation caused by redundant information [
38,
39]. The calculation formula is as follows:
where
pij is the proportion of the j-th indicator in the i-th unit area,
ej is the information entropy of this indicator,
gj is the information utility value of this indicator, and
wj is the weight of this indicator.
2.2.3. Spatial Autocorrelation Analysis (Bivariate Local Moran’s I)
Spatial autocorrelation refers to the interdependence of attribute values of a geographical variable across different spatial regions. It is a spatial statistical analysis method that can be used to assess the degree of association between two variables in geographic space. By introducing a spatial weight matrix, this method quantifies the spatial correlation between variables, reflecting the degree of match or mismatch in their geographic distributions [
27,
40,
41]. In this study, this method is applied to reflect the supply and demand relationship of CESs. The Bivariate Moran’s I index can reveal the spatial distribution patterns of service supply and demand in different regions. The calculation formula is as follows:
where
Ii represents the local spatial autocorrelation coefficient for the
i-th unit area, S
i and D
i are the CES supply capacity and demand level of the
i-th unit area,
and
are the average values of supply capacity and demand level, σ
S and σ
D represent the variance of supply capacity and demand level, and W
ij is the spatial weight matrix. In this study, the Queen contiguity rule is used to construct the spatial weight matrix. The spatial autocorrelation analysis generates four categories based on the supply–demand relationship: high supply–high demand, low supply–high demand, high supply–low demand, and low supply–low demand.
2.2.4. Coupling Coordination Degree
The coupling coordination degree is a method used to evaluate the interaction between two or more systems. It quantitatively measures the coordination between the supply and demand systems by constructing a mathematical model [
42]. In this study, the CES supply system and the demand system are considered as two interacting subsystems. After calculating the indices for supply and demand, the coupling degree formula is used to assess the degree of interaction between them. Then, the coordination degree model is applied to analyze the overall coordination level between the supply and demand systems. The formula for calculating the coupling coordination index is as follows:
where
x represents the supply amount (
xs) or demand amount (
xd) of CES in urban green spaces,
D is the supply–demand coupling coordination index,
C is the coupling degree, and
T is the coordination index. In this study, the CES supply and demand are regarded as two equally important systems, so the coefficients α = β = 0.5 are used.
The coupling coordination degree value typically ranges between 0 and 1. A higher value indicates better coordination between the supply and demand systems, while a lower value indicates a severe mismatch between the systems. In this study, the Jenks natural breaks classification method is used to divide the coupling coordination degree into five categories: good coordination, moderate coordination, approaching disorder, mild disorder, and coupling disorder. This method comprehensively reflects the coupling degree and developmental stage of the supply–demand relationship, providing a quantitative basis for resolving the supply–demand mismatch.
2.3. Indicator Framework for CES Supply and Demand in Urban Green Spaces
Based on previous research on CES supply and demand, this study constructs a CES supply–demand indicator framework to identify and analyze the CES-related supply–demand relationship in urban green spaces. The framework comprehensively considers both the ecosystem’s supply capacity and the demand characteristics of human society, ensuring both the scientific and practical significance of the framework. The urban green space CES supply–demand indicator framework is divided into two dimensions: supply and demand. The supply dimension focuses on the potential of the ecosystem itself and its realization pathways, reflecting the service capacity and accessibility of urban green spaces. The demand dimension reveals the characteristics of cultural service demand from a socio-economic and demographic perspective, covering aspects such as population distribution, urbanization, and commercial activities (
Table 2).
- (1)
Green space capacity:
NDVI (Normalized Difference Vegetation Index): NDVI is directly related to the ecosystem function and cultural service capacity of green spaces [
43].
Urban park green space distribution points (GP): The uniformity and density of park distribution affect service coverage, which is a key factor in reflecting the supply of green space [
44].
Park green space area (GA): Larger park areas have a greater carrying capacity, accommodating more visitors and offering richer services [
45].
Water area within 800 m of the park (WA): This includes water bodies within the park and those in its surrounding area. Based on the appropriate walking range for residents’ recreational activities, water bodies within 800 m are considered accessible to people [
46]. Water bodies, as an important component of ecosystems, enhance the aesthetic value and ecological attractiveness of green spaces, making them a crucial element of cultural services [
47].
These indicators together reflect the ecological quality and potential cultural service capacity of urban green spaces, covering the scale, distribution, and specific attributes of green spaces.
- (2)
Accessibility indicators:
Public transportation station density (PD): The density of bus stops reflects the level of public transportation coverage of urban green spaces. Accessibility to transportation is a crucial prerequisite for residents to enjoy cultural services.
Road network density (RD): Reflects how easily green spaces can be reached by walking or by vehicle. A high road network density indicates good connectivity around the urban green space, providing convenient access for residents.
Accessibility indicators emphasize the spatial realization process of ecological services, i.e., how the potential supply of urban green spaces is practically utilized [
48].
- (1)
Residential volume and urban development intensity:
Residential community distribution points (CPs): These reflect the spatial distribution of residential communities. Areas with denser residential distribution generally have higher cultural service demand [
49].
Residential community area (CA): The area of residential communities represents the carrying capacity of living space, indirectly reflecting the demand density for services.
Population density (PD): The population density in a specific area directly reflects the potential intensity of demand for cultural services. The higher the population concentration, the stronger the demand for services.
These indicators together reflect the spatial characteristics and demand volume of cultural services in different urban areas.
- (2)
Socio-economic factors:
Night light index (LI): The intensity of night lights is highly correlated with the level of urban activity, representing the busyness of socio-economic activities within the region [
50]. Areas with higher night light intensity usually correspond to higher CES demand.
Commercial POI density (CD): Areas with dense commercial points (e.g., restaurants, entertainment, shopping) are typically hotspots where residents gather and are key areas for CES demand.
Impervious surface area (IA): The proportion of impervious surfaces reflects the level of urbanization. Areas with higher urbanization tend to have a more urgent demand for ecological cultural services [
51].
The urban development intensity indicator reflects the dynamic and complex nature of cultural service demand from both socio-economic and spatial utilization perspectives. This indicator highlights the characteristics of cultural service demand in terms of urban development intensity.
This framework attempts to assess the potential supply and demand of CESs at the urban scale through quantitative analysis of macro data. To effectively reflect the CES situation in urban green spaces, this study focuses on the supply of CESs in four areas: recreation, aesthetics, spirituality, and culture. Based on these four types of CES, this study selects various indicators within the urban green space CES supply dimension. For example, urban green space area (GA) affects the quality and quantity of CES supply, while NDVI and water area (WA) are positively correlated with the aesthetic services of CESs. Additionally, urban green space distribution points (GPs) reflect the distribution of various urban green spaces, such as parks and cultural heritage sites, which can indicate the spiritual and cultural potential of cultural services.
3. Results
3.1. Spatial Distribution Characteristics of CES Supply and Demand in Urban Green Spaces
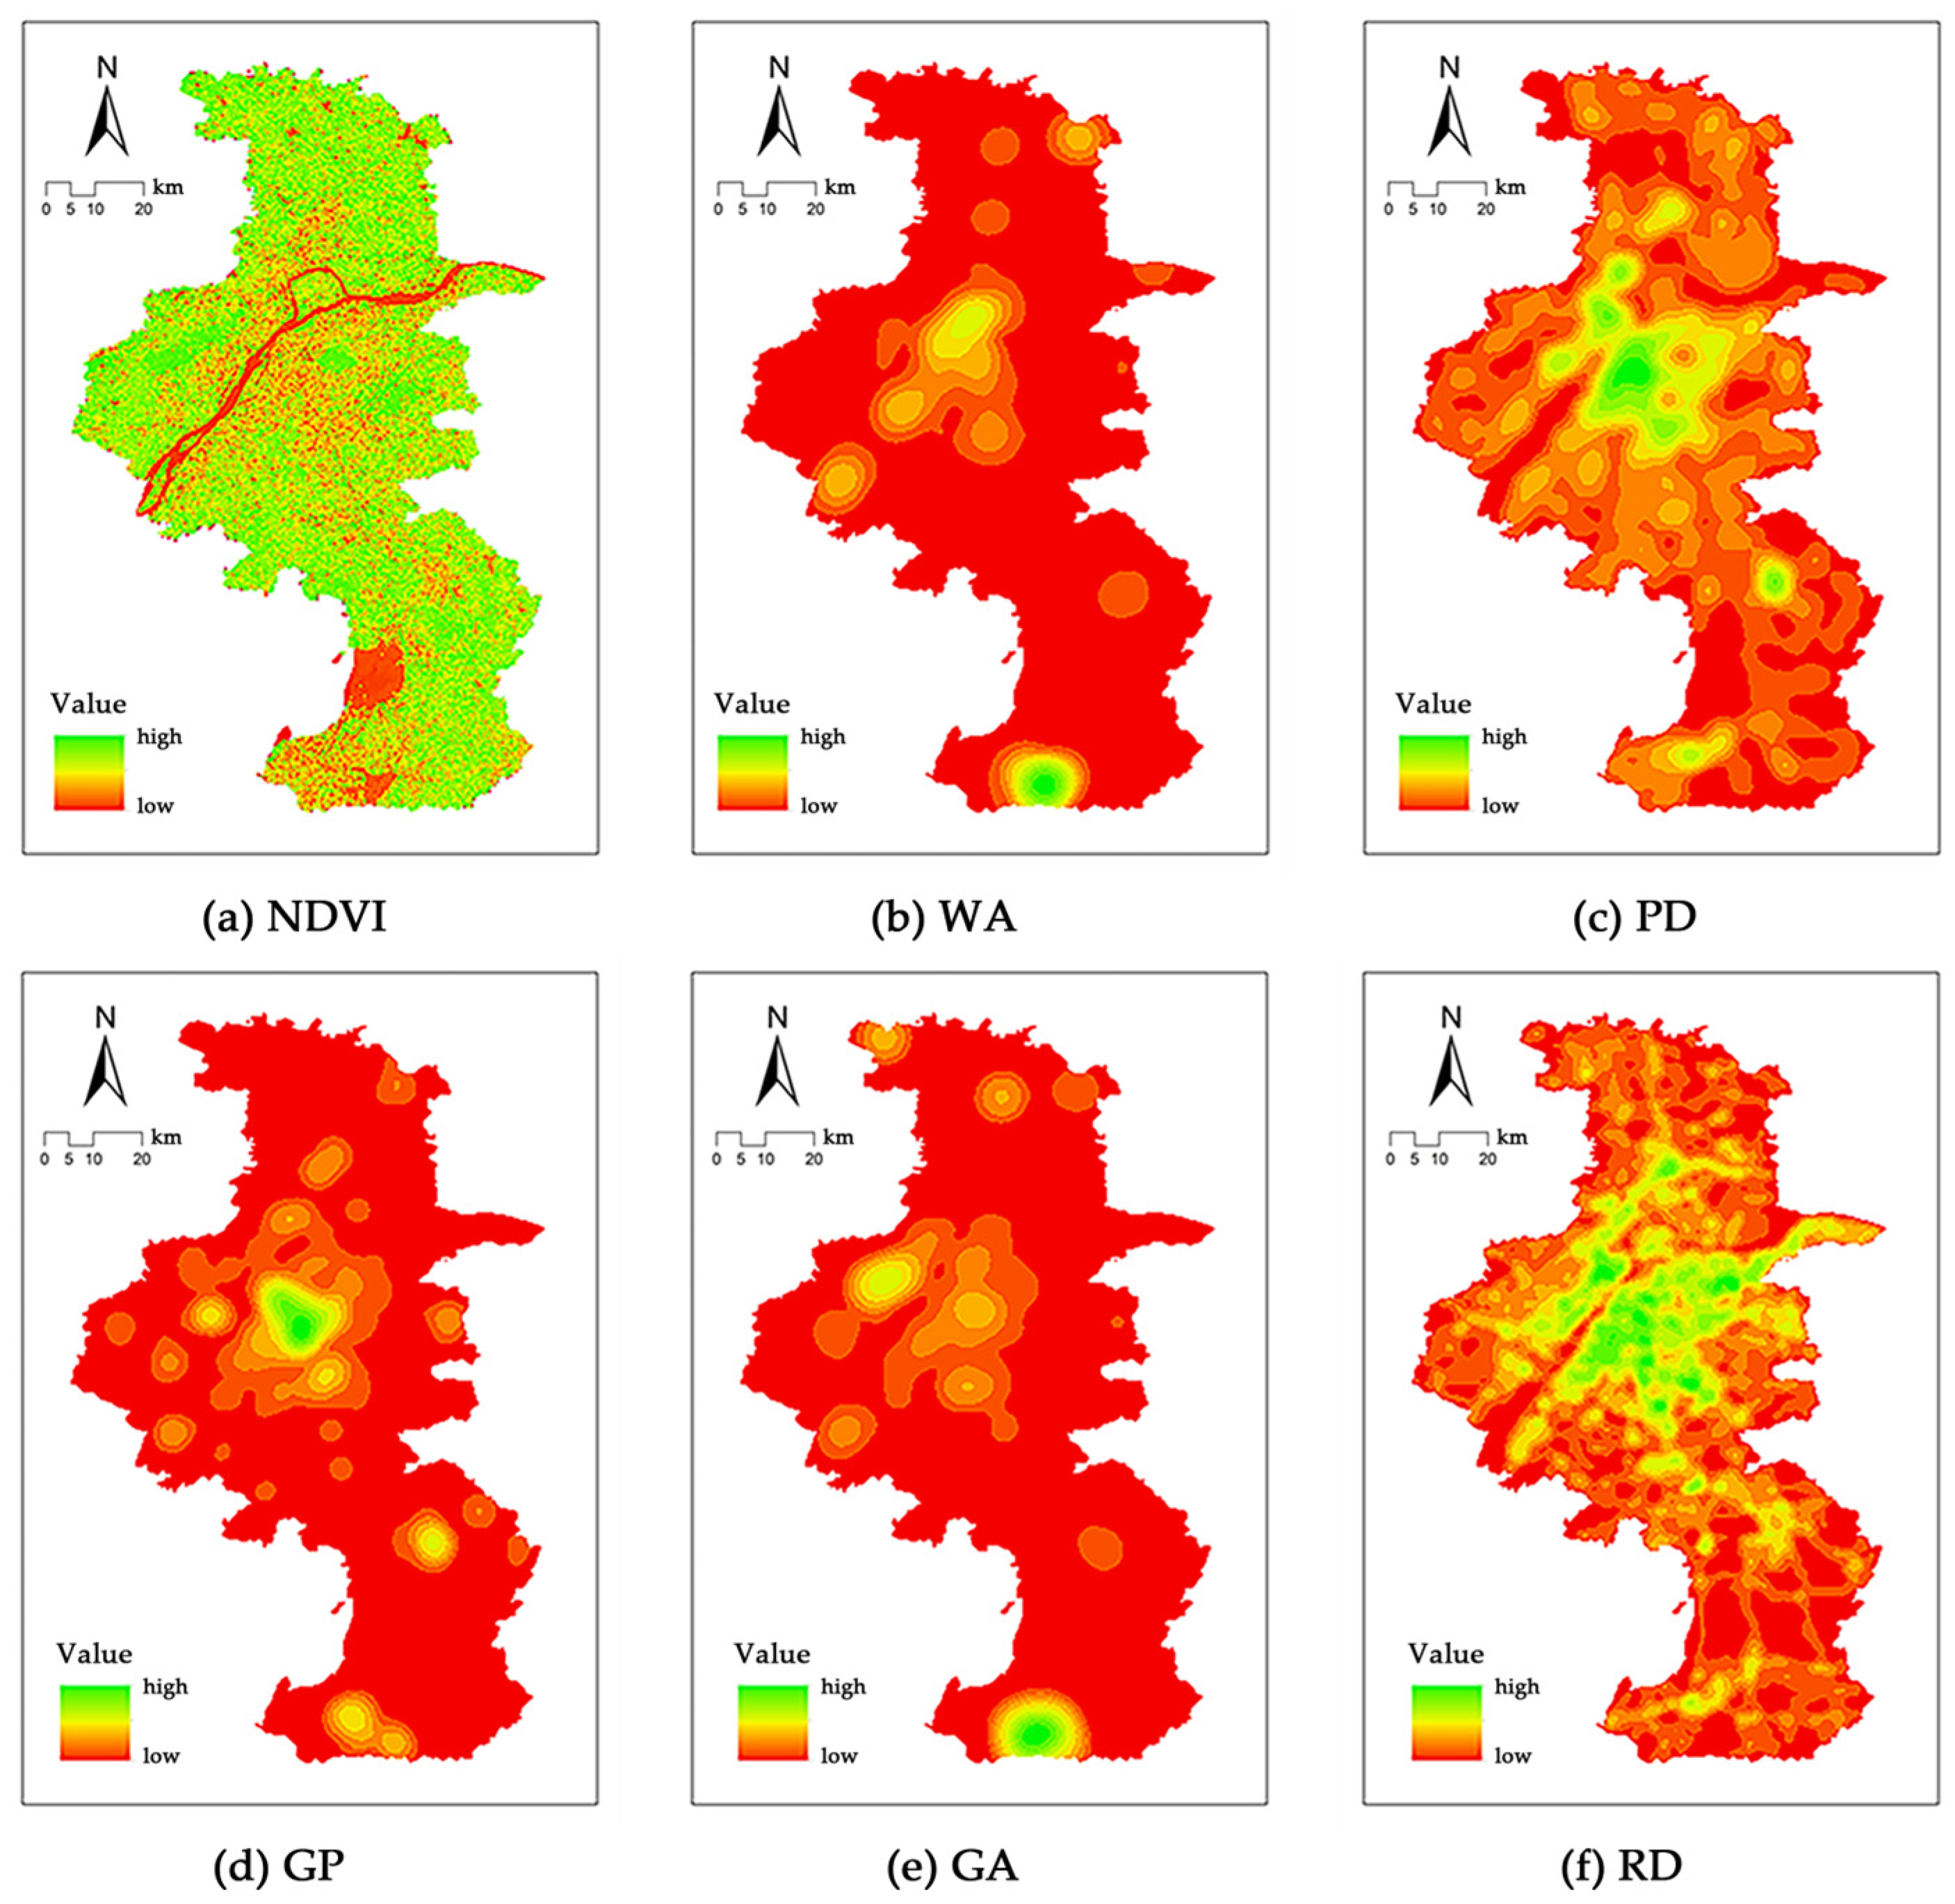
The spatial distribution characteristics of CES supply and demand in urban green spaces of Nanjing are shown in the figures.
Figure 3 and
Figure 4 display the normalized distribution maps of each secondary indicator in the index system, reflecting the spatial characteristics of the basic indicators of CES supply and demand. The larger the values in the cells of the figures, the higher the corresponding supply or demand, and vice versa.
3.1.1. CES Supply Characteristics
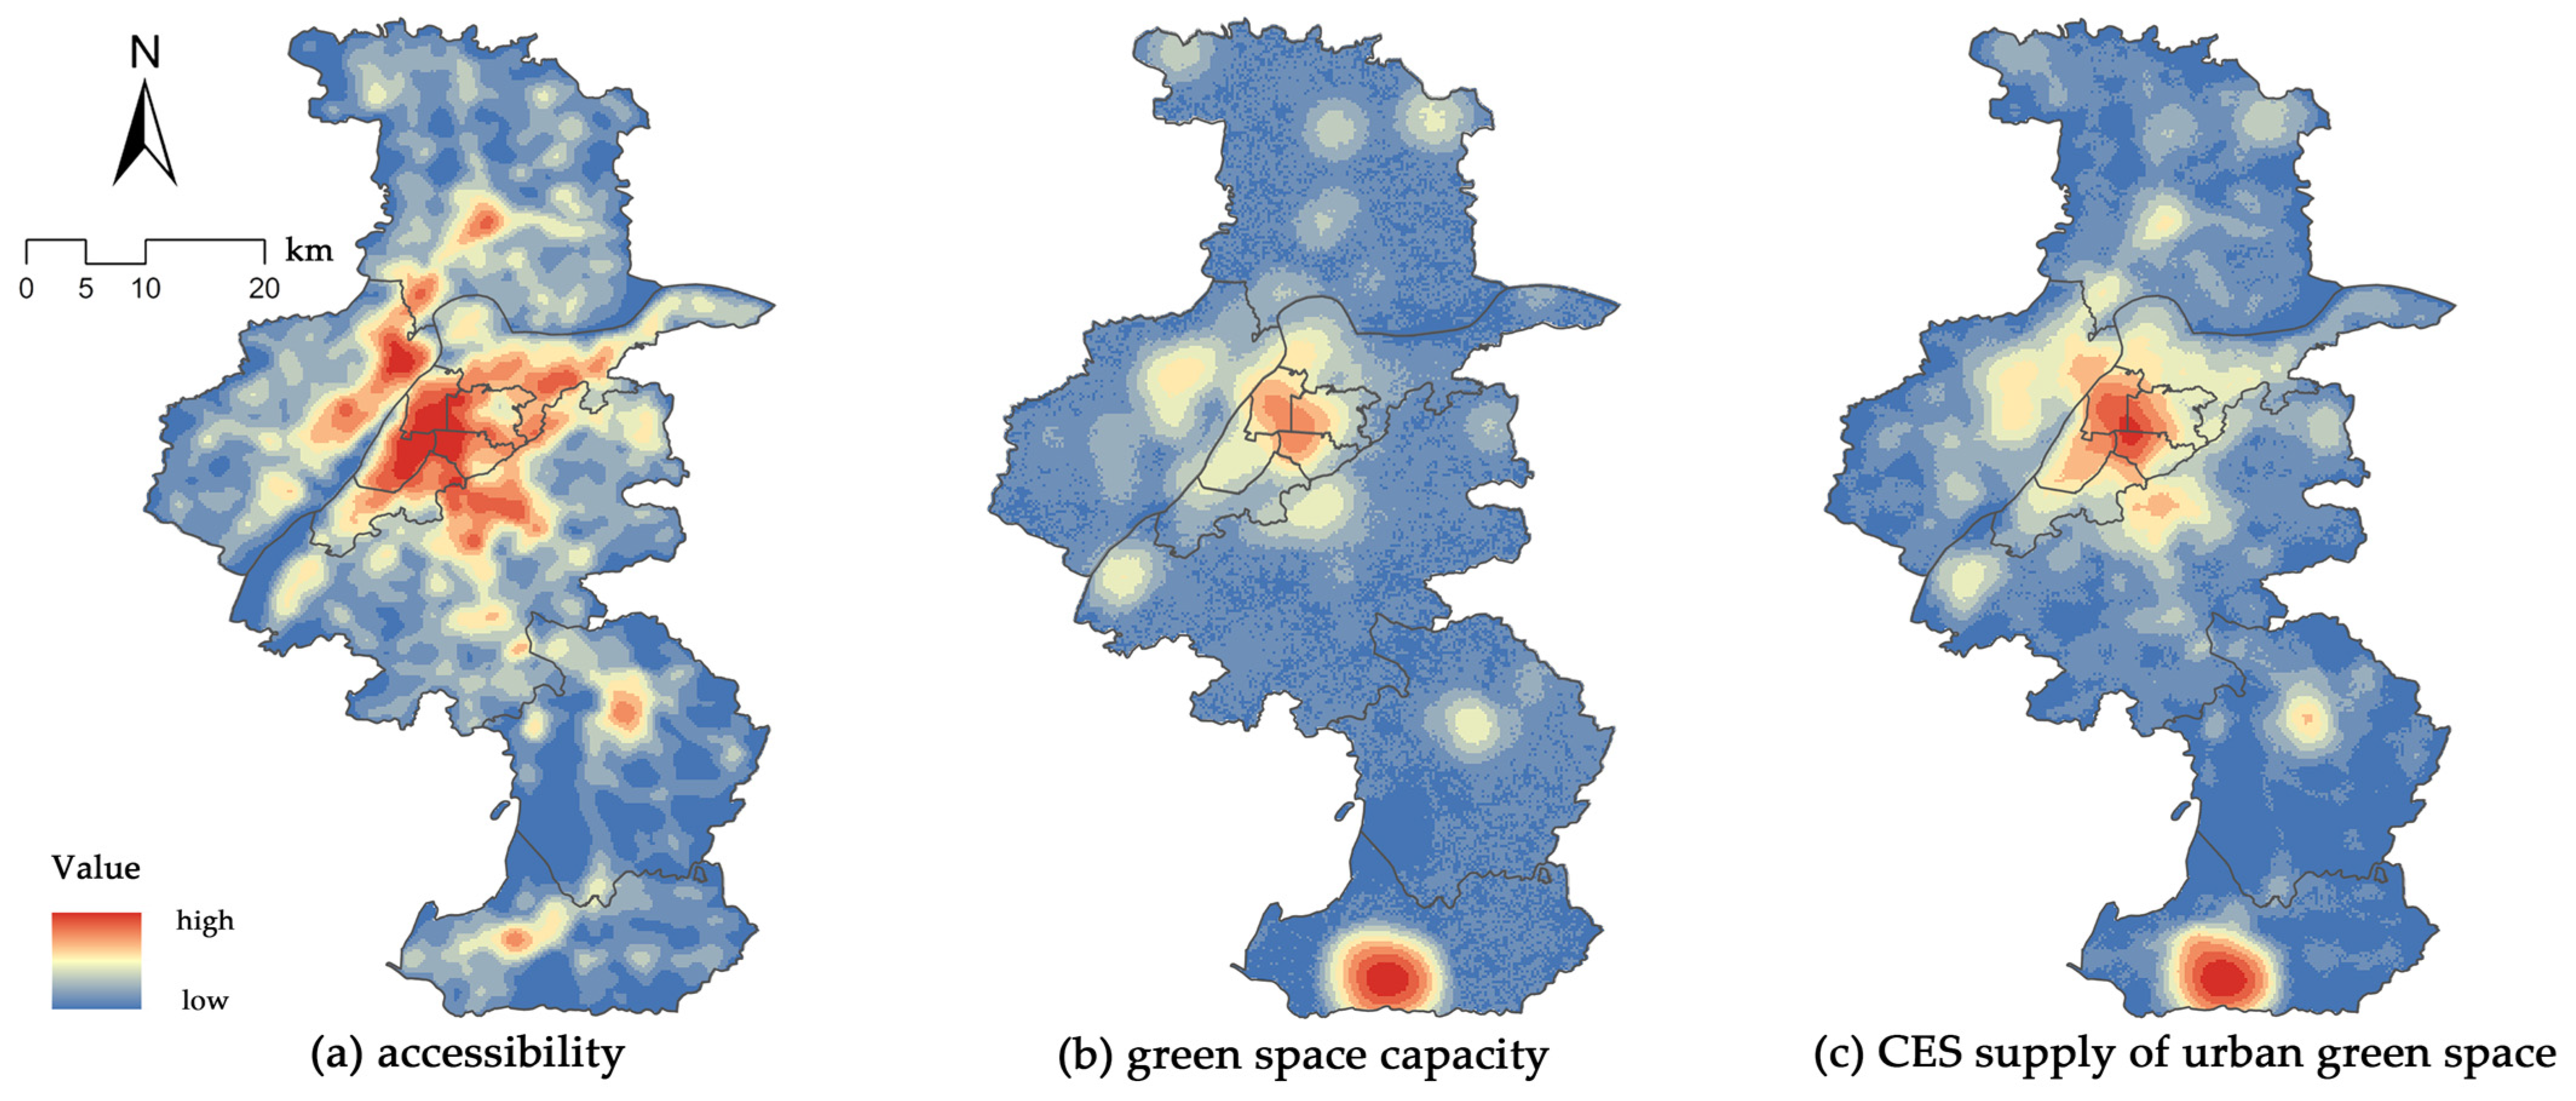
The CES supply distribution map of Nanjing is shown in
Figure 5. Green space capacity reflects the distribution characteristics of urban green spaces and their potential to provide CESs. From the green space capacity map, it is observed that there are two main high-value aggregation hotspots: one in the central main urban area and another in the southern Gaochun District. The hotspot in the main urban area is centered at the intersection of Gulou District, Xuanwu District, and Qinhuai District, spreading outward; the aggregation point in Gaochun District is centered on the northern shore of Gucheng Lake, presenting a more concentrated feature with a lower degree of diffusion. Additionally, there are no other significant high-value aggregation points within Nanjing, with only a few low-intensity sub-centers scattered.
Accessibility, which includes the distribution characteristics of the road network and public transportation, reflects the development level of urban transportation facilities. The accessibility distribution map shows that, overall, Nanjing has relatively high accessibility. High-value aggregation centers appear in the main urban area and Pukou areas, while Lishui and Gaochun also have high-value aggregation points, though the intensity is relatively low, and the area is smaller. In addition to aggregation features, accessibility also reflects the degree of connectivity between core areas. From this, it can be concluded that the central region of Nanjing has strong connectivity, while the northern and southern areas, particularly Luhe and Gaochun districts, have weaker connections with the central city, especially Gaochun, which has fewer and weaker accessibility paths.
Through a comprehensive analysis of Nanjing’s green spaces capacity and accessibility, the spatial distribution map of the total CES supply for the city was obtained. From the distribution map, it is evident that the convenient transportation system in the main urban area significantly enhances the capacity to provide cultural services. The high coverage of the transportation network increases the utilization of urban green spaces and parks, which in turn expands the spatial influence of CES supply in the main urban area, significantly increasing the area of the supply core and showing a diffusion characteristic. Moreover, the supply distribution map clearly shows three significant supply aggregation hotspots in Nanjing, from north to south: the diffusion-type supply core centered on the main urban area, the low-intensity supply center in Lishui District, and the high-intensity supply center in Gaochun District. The formation of these aggregation areas is closely related to both the quantity and quality of urban green spaces and is also influenced by factors such as transportation accessibility. Among them, the supply core in the main urban area, with its dense urban green space resources and well-developed transportation system, has a broader service range and stronger radiation capacity. Lishui District is characterized by low-intensity supply with relatively limited service functions, forming a small core area. Gaochun District, as a high-intensity supply center, shows higher service capacity and concentration.
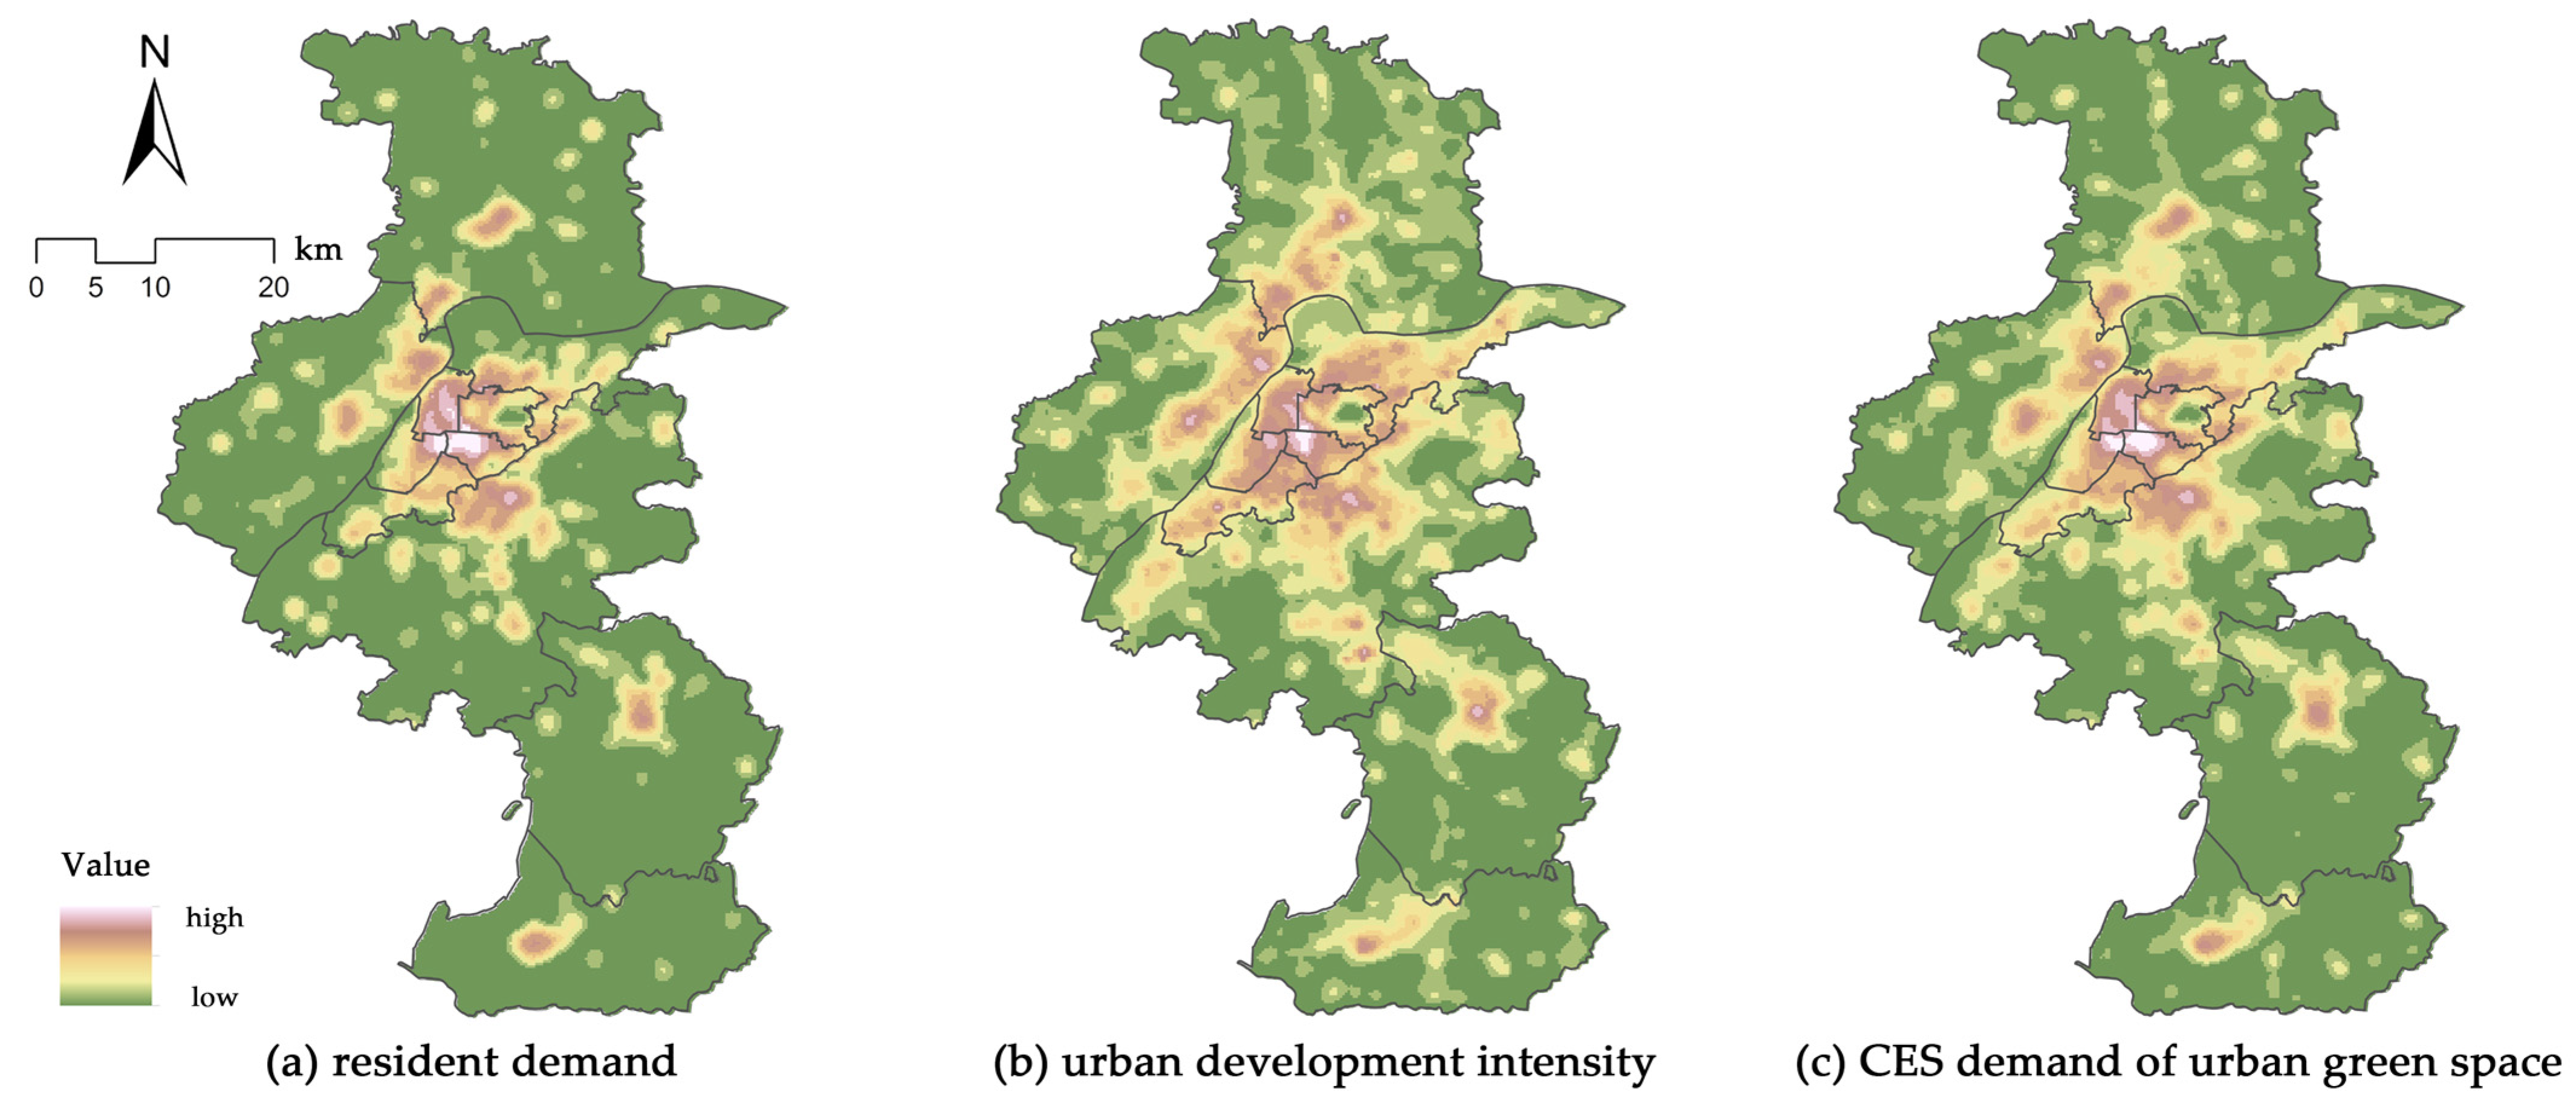
3.1.2. CES Demand Characteristics
From the CES demand distribution map of Nanjing (
Figure 6), it can be observed that the overall urban development intensity is high, and the demand for CES is mainly concentrated in the central area of the main urban area. This phenomenon fully reflects the spatial concentration of urban CES demand. This demand concentration is closely related to the urban structure of the main urban area: on the one hand, a large number of residential communities are concentrated in the main urban area; on the other hand, this area has frequent commercial and entertainment activities, and the high level of urban development further amplifies the demand for cultural services.
In addition, CES demand in Nanjing also shows multiple high-value aggregation sub-centers. These centers are mainly distributed in the core areas of various districts across the city. However, compared to the distribution of CES supply, the degree of demand aggregation is relatively lower. The demand aggregation center in the main urban area has a large diffusion degree and covers a wide area. In contrast, the core boundaries of other areas are more blurred, showing a lack of prominence in their centers. At the same time, the degree of connection between the demand centers is tighter, forming a relatively continuous demand network. This phenomenon is likely closely related to the urbanization process in Nanjing in recent years. The demand for cultural services from residents has gradually expanded from a single core to multiple centers and points. The close connection of CES demand suggests that the demand for cultural services among Nanjing residents is no longer limited to the central urban area but is presenting a trend of sharing and complementarity across regional boundaries.
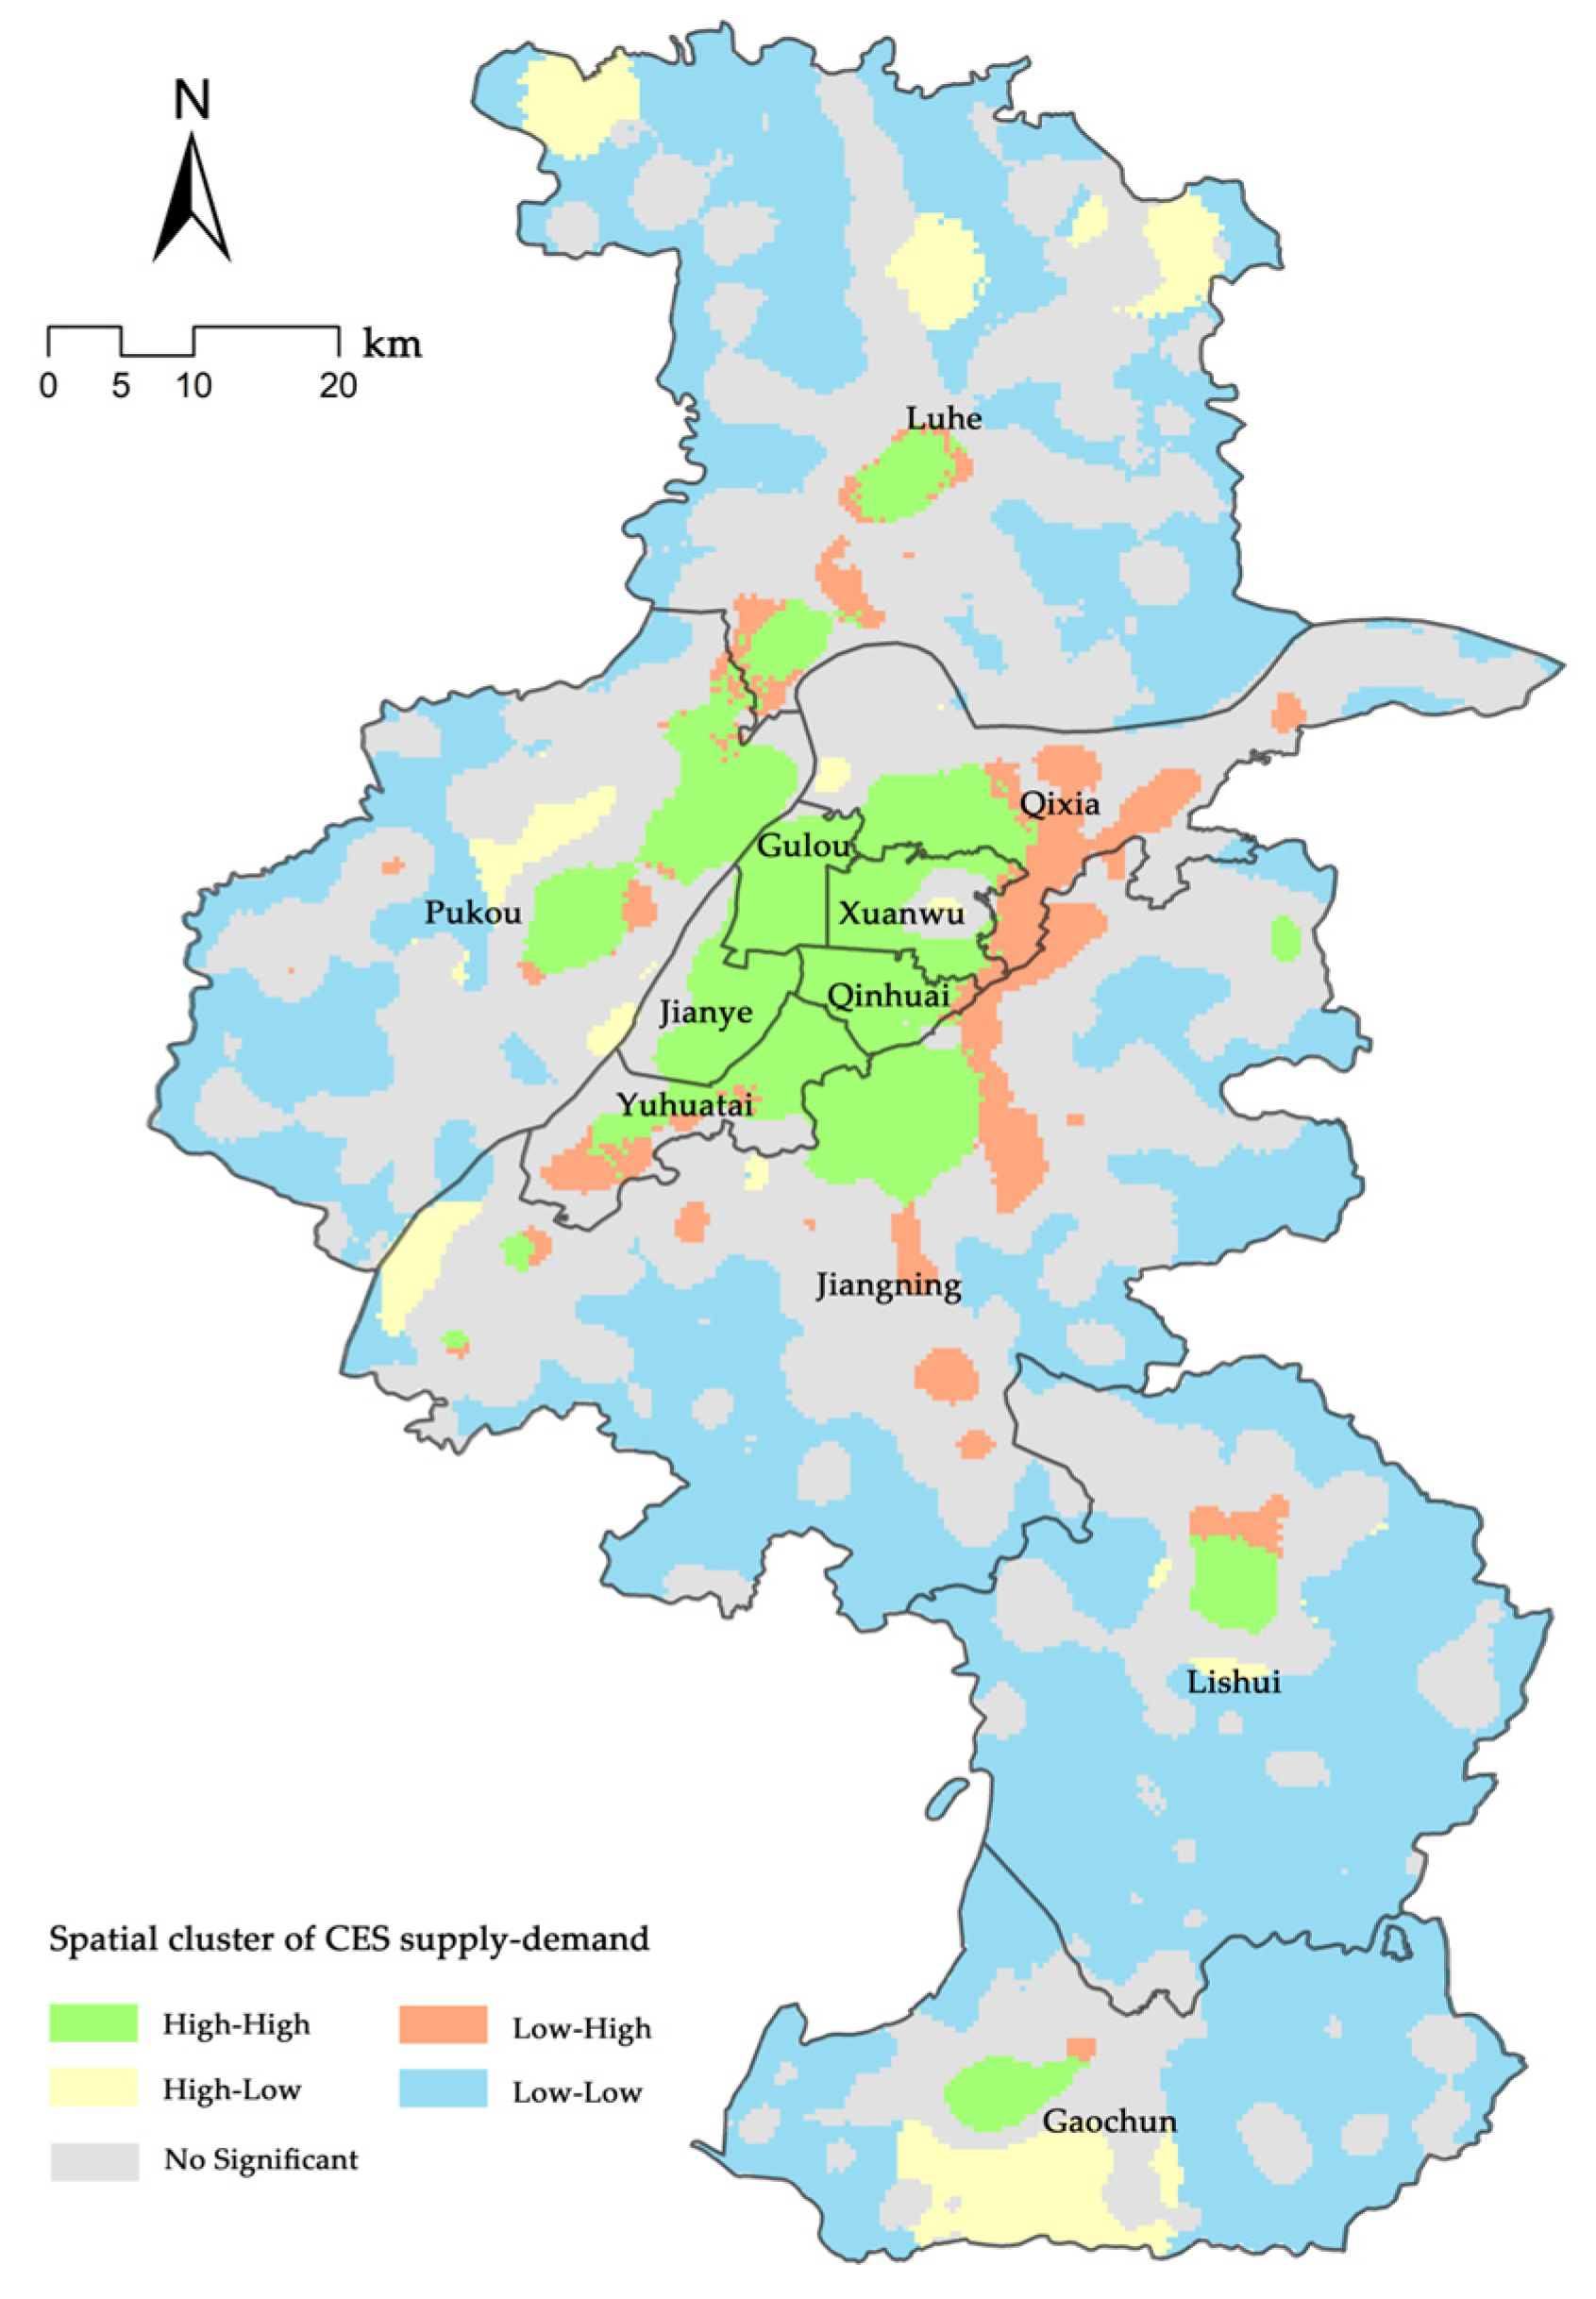
3.2. Spatial Autocorrelation Results of CES Supply and Demand in Nanjing
By conducting a spatial autocorrelation analysis on the total supply and demand of CESs in Nanjing, the CES supply–demand relationship map of Nanjing was obtained (
Figure 7). The supply–demand relationship is divided into five categories: (1) High supply–high demand: Both the supply and demand for cultural ecosystem services are abundant and well-matched. (2) Low supply–high demand: The demand for cultural ecosystem services exceeds the available supply. (3) High supply–low demand: There is an excess of cultural ecosystem services supply with low demand. (4) Low supply–low demand: Both the supply and demand for cultural ecosystem services are low. (5) Non-significant: There is no clear relationship between the supply and demand for CES. The following conclusions can be drawn:
The CES supply and demand relationship in Nanjing shows significant spatial variation across the city. The central urban area, including Xuanwu District, Qinhuai District, Gulou District, Jianye District, and Yuhuatai District, is primarily characterized by high supply–high demand areas. These regions not only have abundant urban green space resources but also have a strong demand for CESs, resulting in a good match between supply and demand. On the urban fringes, such as parts of Jiangning District, low supply–high demand areas are concentrated. These regions have a higher demand for CESs but lack sufficient urban green space supply, leading to an imbalanced supply–demand relationship. In the suburban areas, including Luhe District, Gaochun District, and Lishui District, high supply–low demand areas dominate. These areas have sufficient urban green space resources, but, due to the relatively low demand, there is an excess supply of CESs. The area of low supply–low demand regions accounts for a large proportion. These areas are currently low-vitality areas, characterized by both low levels of citizen activity and fewer urban green spaces. These areas are mostly undeveloped land or agricultural land. Additionally, some transitional urban–rural areas and regions with less human activity exhibit non-significant CES supply–demand characteristics, showing no distinct patterns in their supply–demand relationship in the spatial distribution.
Overall, the spatial distribution of CES supply and demand in Nanjing presents the following characteristics: high coordination of supply and demand in the central urban area, supply–demand imbalance on the urban fringes, and supply redundancy in suburban areas.
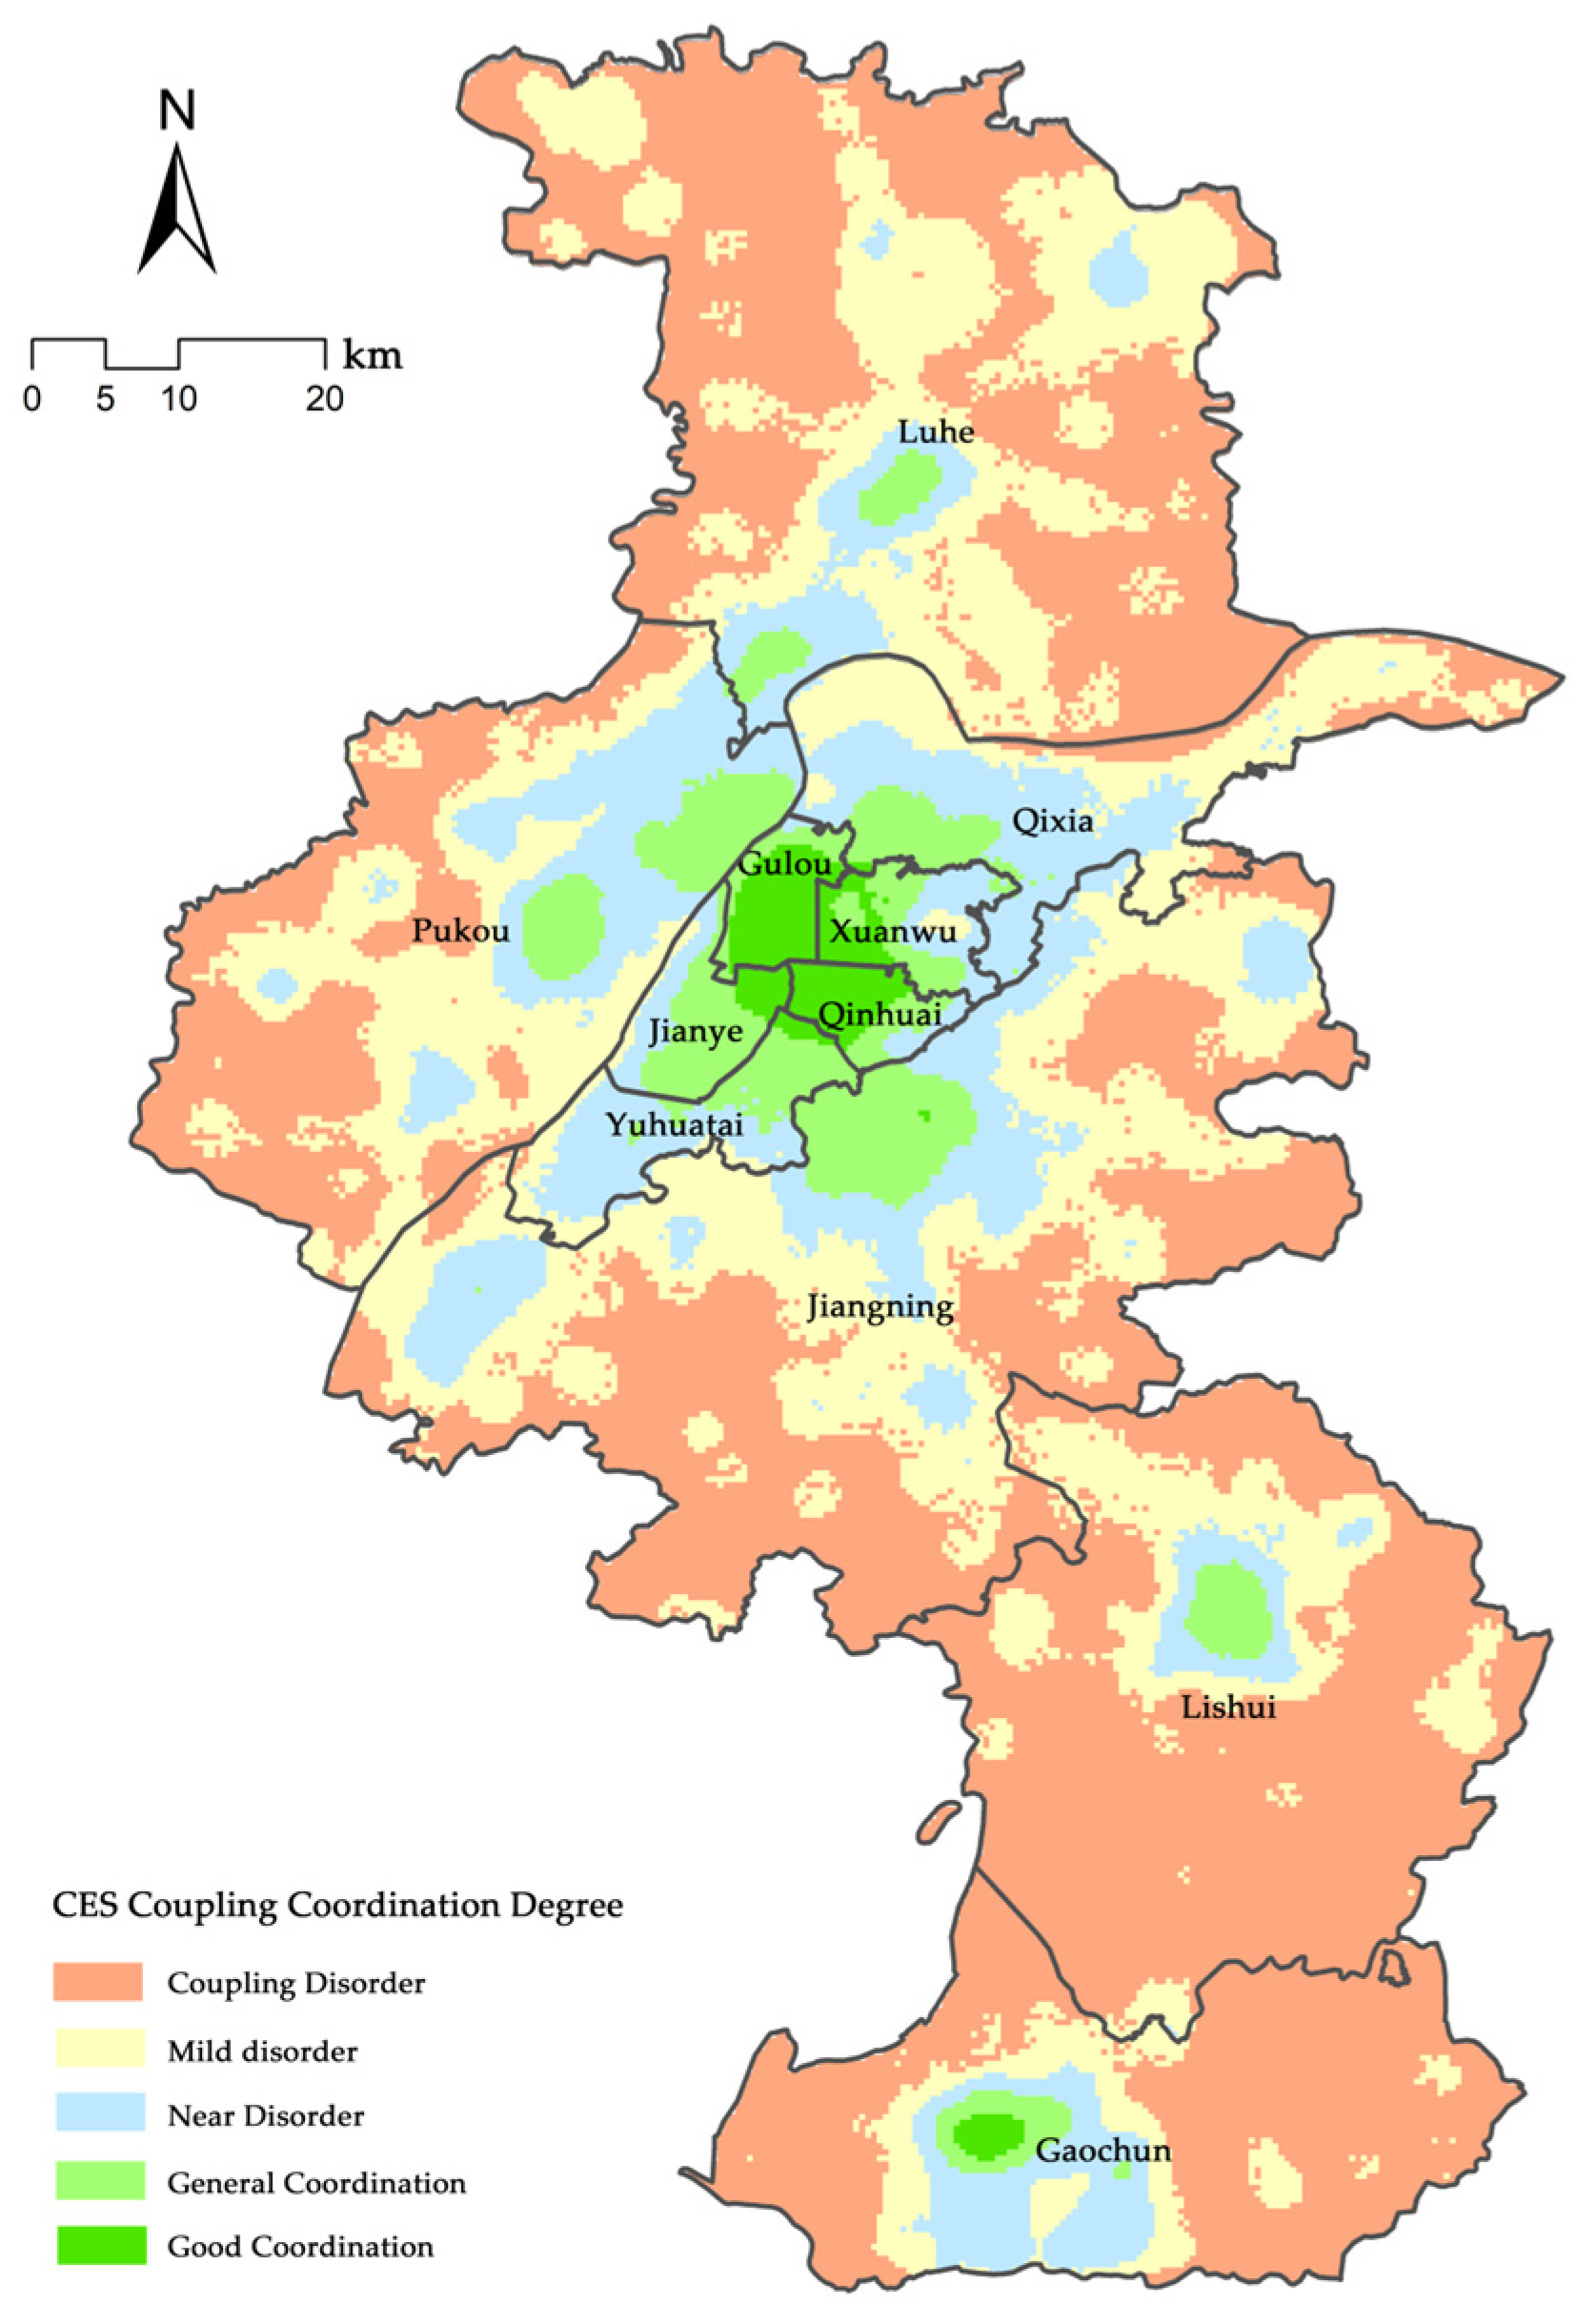
3.3. CES Coupling Coordination Degree Results in Urban Green Spaces of Nanjing
The coupling types in this study are divided into five categories: (1) Good Coordination, where supply and demand are highly matched, with urban green space resources and cultural services fully meeting residents’ needs; (2) Moderate Coordination, where the supply and demand relationship is moderate, but some areas have imbalances, leaving room for optimization; (3) Approaching Disorder, where supply and demand are gradually mismatched, with some areas showing a trend of supply–demand inconsistency; (4) Mild Disorder, where the supply and demand relationship is loose, with some areas experiencing either an excess or shortage of resources; and (5) Coupling Disorder, where supply and demand are completely mismatched, with significant gaps that affect the effective provision of cultural services.
From the CES supply–demand coupling coordination degree spatial distribution map of Nanjing (
Figure 8), it can be observed that the coordination degree of CES supply and demand shows significant spatial regional differences. The central urban area, including Xuanwu District, Qinhuai District, Gulou District, Jianye District, and Yuhuatai District, exhibits a higher coupling coordination degree, especially in areas with dense green space resources, such as Zhongshan Scenic Area and the vicinity of Xuanwu Lake, where it reaches a “Good Coordination” state. This indicates that the green space supply in the central urban area is able to better meet the demand of surrounding residents, making it the most balanced area in terms of supply and demand across the city.
In contrast, the coupling coordination degree of supply and demand significantly declines in the main urban area edges and some suburban areas. In certain regions of Jiangning District, the coupling coordination degree of supply and demand is mainly in a “Mild Disorder” or “Lower Disorder” state, indicating some issues in the matching of green space service supply and demand in these areas. Additionally, in areas with lower urbanization levels, such as Luhe District, Gaochun District, and Lishui District, the coordination degree further decreases, with many areas exhibiting “Coupling Disorder” or “Mild Disorder.” This reflects that while these regions have abundant green space resources, the actual effectiveness of their CES has not been fully realized.
From an overall spatial distribution perspective, the CES supply–demand coordination degree in Nanjing follows a pattern of high in the center, low at the edges, and disorder in the suburbs. The central urban area shows a better supply–demand balance, while the supply–demand relationship in the fringes and suburbs is relatively uncoordinated. This spatial distribution directly reveals the current state of CES supply–demand coupling in Nanjing, providing an intuitive quantitative basis for further research on the balance of green space resource allocation in Nanjing.
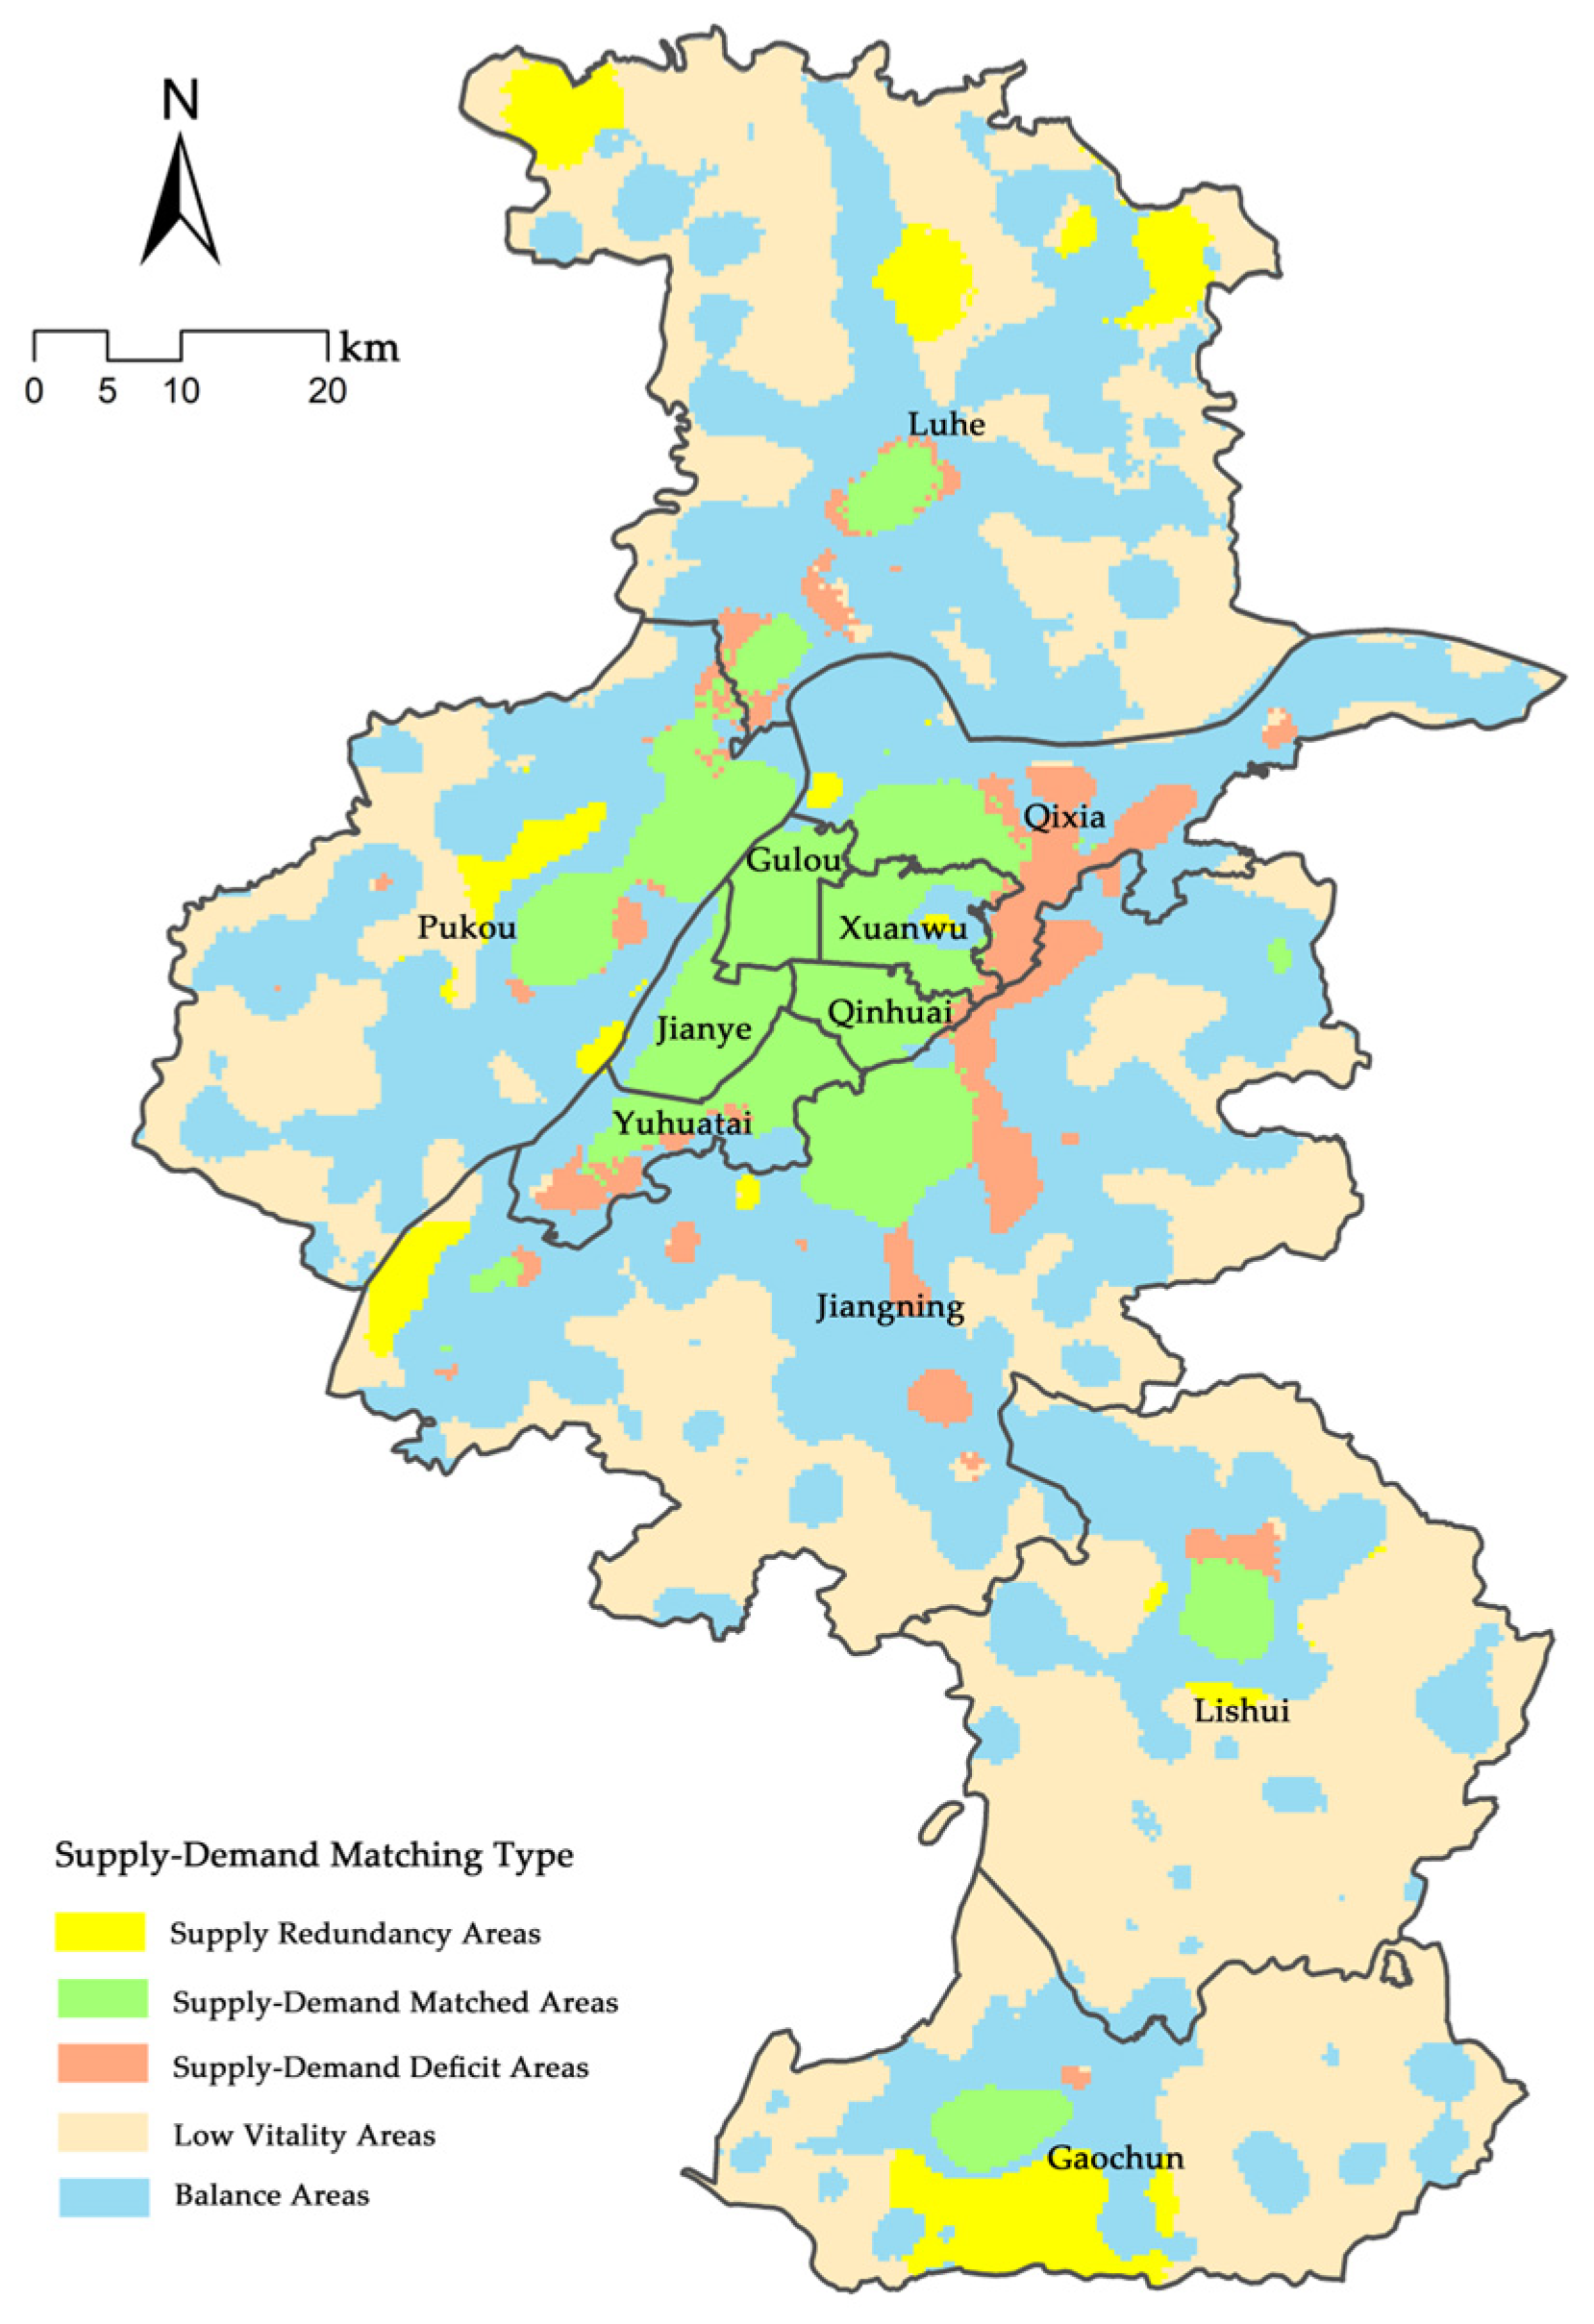
3.4. CES Supply–Demand Matching Relationship in Urban Green Spaces of Nanjing
By conducting K-means clustering analysis on the results of CES supply–demand spatial autocorrelation and CES supply–demand coupling degree in Nanjing (
Figure 9). Based on the degree of coupling, the number of supply–demand clustering types, and previous research experience, the K-means clustering was divided into five types: supply redundancy areas, supply–demand matching areas, supply–demand deficit areas, low vitality areas, and balance areas. Additionally, the clustering results show that the clustering results for k = 5 have significant inter-group differences (with a significant
p-value), thus, this classification method reasonably reflects the distribution of CES supply and demand. The final clustering results are shown in the table below (
Table 3).
Among these, the supply–demand matching areas present good supply–demand coordination with high supply–high demand characteristics, accounting for 9.71% of the total area. These areas are primarily distributed in the central urban areas of various administrative districts in Nanjing. The green space resources and CES in these areas can effectively meet residents’ demands, showing a high degree of supply–demand consistency.
The supply–demand mismatch areas are divided into two types: supply redundancy areas and supply–demand deficit areas, which account for 4.14% and 3.66% of Nanjing’s total area, respectively. Supply redundancy areas are characterized by general coordination between supply and demand, with high supply–low demand, mainly distributed in regions with a good natural environment, such as the northern mountainous areas and areas near large water bodies in the south. Supply–demand deficit areas, at the same time, exhibit coupling disorder with low supply–high demand, and these areas are primarily concentrated on the eastern edge of the main urban area in Nanjing, extending outward. Some sub-center areas also face similar supply–demand mismatch problems.
In addition, low-vitality areas and balance areas account for 40.9% and 41.6% of the total area, respectively. Low-vitality areas are characterized by coupling disorder with low supply–low demand and are generally found in areas with lower levels of urban development. Balance areas show characteristics close to disorder, with no significant aggregation, and are mainly distributed at the junctions of developed and undeveloped urban areas. These two types of areas occupy a large proportion of the area, reflecting the dynamic supply–demand balance at different stages of urban development.
4. Discussion
4.1. Causes of CES Supply and Demand Characteristics in Nanjing
The results of CES supply and demand clustering in Nanjing are caused by a combination of environmental factors and socio-economic factors. The following is a discussion of the reasons:
From the overall results, the coordination of CES supply and demand in Nanjing’s urban green spaces shows high coordination in the city center, low coordination at the outskirts, and imbalance in suburban areas. This result is consistent with most previous studies, which found that both the supply and demand of urban CES are concentrated in the city center [
16,
41,
52]. Meanwhile, the finding of imbalanced CES supply and demand in suburban areas is also similar to past research [
53], with this characteristic being more prominent in cities undergoing rapid urbanization [
36]. Future planning should pay attention to the suburban spaces of the city.
A large area of CES demand in the main urban area of Nanjing is primarily due to the high density of residential populations, high levels of urban development intensity, and active service industry activities. At the same time, there is a concentration of high CES supply, ultimately forming a high supply–high demand aggregation. This matching of supply and demand is closely related to the rich cultural heritage resources in the main urban area [
54]. As a symbol of Nanjing’s history, the main urban area contains a large number of culturally significant heritage spaces, such as the Zhongshan Scenic Area, Ming City Wall, Confucius Temple, and Sun Yat-sen Mausoleum. These cultural heritage sites have high historical and artistic value. The Nanjing municipal government has successfully transformed these heritage resources into cultural services that residents and visitors can directly enjoy through a series of protection and development measures, such as heritage restoration, cultural park construction, and diversified cultural activities. This has significantly enhanced the main urban area’s ability to provide cultural, entertainment, and aesthetic experiences, similar to the results of previous CES studies in Beijing [
55].
CES supply–demand deficit areas are concentrated on the western edge of the main urban area. This phenomenon is mainly caused by the dual pressures of urban development and population concentration. First, the Jiangning District on the edge of the main urban area is an important area for urban expansion and has become a new area for urban development in recent years. The area prioritized residential, commercial, and infrastructure development in the expansion of urban functions. However, due to the delayed planning of urban green spaces, the supply of green spaces did not match the rapidly growing population demand. Additionally, the limited spatial resources in Jiangning District, along with the lack of consideration for the long-term service needs brought by high-density populations and economic activities in early urban planning, have further exacerbated the supply–demand contradiction in CES.
Furthermore, Qixia District is home to dense residential areas and university towns, where the primary residents are young people, families, and students, all of whom have a strong demand for cultural services from urban green spaces, diverse populations bring specific cultural needs [
56], including daily recreation, social interaction, mental relaxation, and educational experiences. However, due to the limited urban green space area in the region and insufficient development of existing green space functions, the rapidly growing demand cannot be met, making the supply–demand deficit issue more prominent. Therefore, in response to the CES supply–demand imbalance in the edge areas of the main urban area, it is urgent that this contradiction be alleviated by optimizing urban green space layout, improving supporting infrastructure, and enhancing service functions, thereby providing higher quality CESs to residents and promoting sustainable development in the region.
CES supply redundancy areas are mainly distributed in areas with good natural environments, such as Zhongshan and Laoshan, as well as suburban areas with low levels of urbanization. This phenomenon is mainly due to the combination of natural resource advantages and low development intensity. Regions like Zhongshan and Laoshan, with abundant forests, mountains, and wetlands, have high potential for providing CESs [
57]. Due to natural conservation policies and terrain constraints, urban development intensity is low, and green space resources have been well-preserved, resulting in a strong CES supply capability. However, because the population density in these areas is relatively low and the demand for CESs is limited, this leads to supply redundancy. Moreover, these low urbanization areas are primarily focused on ecological protection and agricultural use, lacking dense residential areas and economic activity centers. The functional distribution tends to prioritize natural landscape displays rather than serving large populations [
58]. Therefore, although these areas have abundant green space resources and high supply potential, the actual service effectiveness has not been fully realized.
4.2. Strategies for Matching CES Supply and Demand in Urban Green Spaces
Nanjing reflects some typical characteristics of Chinese cities. Based on the research results, the following urban green space planning strategies are proposed, which can serve as a reference for future urban planning (
Table 4).
Cultural heritage is an important carrier of cultural and aesthetic services in CESs. The protection and moderate development of cultural heritage should be strengthened to ensure its authenticity and sustainability. Urban green space planning should integrate the protection of cultural heritage with the development of CESs, emphasizing the cultural value and spiritual experience functions of historical and cultural heritage. To effectively link cultural heritage with CESs, the significance of cultural heritage in CESs should first be qualitatively defined. Secondly, quantitative methods, such as surveys and interviews, should be used to collect residents’ perceptions of cultural heritage. Ultimately, this should lead to the development of a CES evaluation system and planning strategy that prioritizes cultural heritage. In future urban planning, the protection of cultural heritage should be prioritized. By restoring cultural landscapes, maintaining historical sites, and beautifying the environment, the cultural service effectiveness of urban green spaces can be further enhanced. Additionally, intangible cultural activities should be organized to enhance citizens’ sense of participation and experience. Furthermore, the service radiation range of cultural heritage should be expanded through transportation, publicity, and educational means, allowing more people to conveniently enjoy the CES benefits brought by cultural heritage.
Regions with a good natural environment are usually far from densely populated areas, so it is necessary to optimize the connection between urban core areas and surrounding natural landscapes. By planning green walkways, bike lanes, and efficient public transportation systems, the accessibility of natural areas should be enhanced, especially by setting up direct transportation routes to natural landscapes in densely populated areas. This can reduce the time cost for residents to reach natural areas and establish an efficient ecological grid composed of multiple urban green space aggregation cores [
59]. Previous studies have predicted that the conversion of ecological land to urban land will be the dominant driver of land use change in urban environments, leading to a decline in ESs [
60]. However, limiting changes to natural reserves can effectively mitigate ecosystem degradation [
61]. These measures can improve the utilization efficiency of natural resources, alleviate supply–demand pressure in the urban center, and enhance the balance of urban ecosystem services.
In the rapid urbanization process, the supply of urban green space needs to keep pace with the speed of urban development and spatial expansion, especially in newly built residential areas and rapidly expanding areas on the urban fringes. To avoid the demand pressure caused by the lag of urban green space construction behind urban expansion, urban planning should integrate parks and urban green spaces in the early stages of urban expansion. Through forward-looking planning, the green space needs of densely populated areas and expanding areas should be prioritized in different urban environments, flexible and locally tailored planning measures should be adopted based on the differences in resource endowment, environmental characteristics, and residents’ needs. This can ensure that these areas can enjoy sufficient cultural and ecological services during the urbanization process, thus alleviating the supply–demand imbalance caused by insufficient urban green space resources.
4.3. Limitations and Future Research Directions
Although this study builds upon previous research and proposes an urban green space CES supply–demand framework suitable for typical Chinese cities, along with an in-depth analysis of the spatial coupling characteristics of CES in Nanjing, certain limitations remain.
First, this study proposes an indicator framework based on NDVI, POI, and land use data, but the use of such data may overlook the qualitative aspects of CESs. Unlike methods such as surveys and participatory mapping, these data cannot fully capture people’s cultural relationships and emotional connections with urban green spaces. Future research should integrate qualitative methods, such as direct perception assessments from residents, to gain a more comprehensive understanding of the CES supply and demand relationship.
Second, since this study is conducted at the urban scale, it primarily focuses on the overall supply–demand distribution across the entire city. However, cities often consist of multiple administrative districts with distinct developmental backgrounds, and urban green space planning cannot fully capture the actual CES supply–demand dynamics at the level of individual urban green spaces; for example, there are differences among various social groups in accessing cultural ecosystem services. Additionally, urban green spaces encompass various types, each differing significantly in ecological functions and cultural service provision capacities. A single city-wide analysis may fail to reflect these subtle spatial and usage variations, limiting a deeper understanding of the actual effectiveness of green space utilization.
Finally, while this study suggests prioritizing green space distribution in urban planning strategies, which provides valuable insights for Nanjing and other cities, the complexity of social, economic, and cultural factors may pose challenges to the direct application of these strategies in different cities and regions. For instance, social demand differences may affect the acceptance of prioritized green space allocation strategies, economic imbalances complicate resource distribution during strategy implementation, and cultural differences influence the specific CES needs in different regions. These factors collectively impact the implementation of the strategy. Therefore, future research should focus on refining the differences in CES demand among social groups; analyzing the relationship between economic development and green space construction; comparing cultural differences and proposing region-specific strategies. This will help understand the impact of complex factors on CES supply and demand matching and provide support for urban green space planning.
5. Conclusions
Nanjing, as one of the rapidly urbanizing cities in developing countries, is also an important city in the Yangtze River Delta region of China, with representative urban development patterns and ecological characteristics. While undergoing rapid urbanization, Nanjing faces challenges such as the fragmentation of urban green spaces, unequal distribution, and the imbalance of CES caused by mismatches between supply and demand. Therefore, these characteristics provide valuable insights for urban planning, landscape ecology, and ecosystem services. This study uses Nanjing as a case study, collecting multi-source data and establishing an indicator framework for the supply and demand of urban green space CESs. Spatial autocorrelation and coupling coordination analysis are employed to analyze and visualize the coupling characteristics of CES supply and demand in urban green spaces. The following conclusions are drawn: 9.71% of the areas in Nanjing show a matched CES supply and demand, while 4.14% of the areas face insufficient demand, and 3.66% have inadequate supply, leading to a mismatch of urban green spaces. The CES supply–demand coordination exhibits a pattern of high coordination in the center, low coordination at the edges, and imbalance in the suburbs. Due to the concentration of population, abundant urban green spaces, and historical heritage, the central urban areas exhibit relatively balanced CES supply and demand. In contrast, the supply and demand relationship in the peripheral and suburban areas is relatively uncoordinated, which is closely linked to the outward expansion of urban development.
Based on the above results, we provide a more intuitive reflection of the CES supply–demand relationship, deepening the understanding of urban green space CES and providing a theoretical basis for urban development. Future urban planning should integrate CES supply and demand assessments early on, planning urban green space distribution based on social, economic, and natural factors, while monitoring CES supply and demand in real-time to align urban green space development with cultural service needs and urban growth.


 ,
, 

