Article

Assessing Users’ Satisfaction with the Urban Central Metro Station Area in Chengdu: An SEM-IPA Approach

School of Architecture, Southwest Jiaotong University, 999 Xi’an Road, Chengdu 610097, China
*
Authors to whom correspondence should be addressed.
Land 2025, 14(5), 1023; https://doi.org/10.3390/land14051023
Submission received: 27 March 2025 / Revised: 20 April 2025 / Accepted: 6 May 2025 / Published: 8 May 2025
(This article belongs to the Special Issue Territorial Space and Transportation Coordinated Development)

Abstract

:
An urban central metro station area is a core hub within the high-quality Transit-Oriented Development (TOD) model. This study explores users’ perceptions of built environments around urban central metro stations to investigate the critical determinants of user satisfaction and proposes strategies to enhance the quality of these environments. First, a comprehensive perception system, including location situation, field environment, and urban aesthetics, was developed through literature reviews and expert consultation. Secondly, three typical central metro station areas in Chengdu were selected as study cases, and 425 questionnaires were collected from August to October 2024. The data were analyzed using a structural equation model (SEM) to reveal the impact of built environment perception on overall satisfaction. The results indicate that the field environment has the strongest direct influence on satisfaction. Urban aesthetics impacts satisfaction both directly and indirectly, making its overall effect the most significant. While the location situation does not directly affect satisfaction, it indirectly influences satisfaction through its impact on the field environment and urban aesthetics. Subsequently, based on the satisfaction performance and SEM outcomes, an importance–performance analysis (IPA) was conducted to identify specific areas needing enhancement. Finally, we integrated environmental assessments with the above findings and put forth strategic recommendations to enhance the quality of the built environment.

1. Introduction

A central metro station area (CMSA), as a practical implementation of the Transit-Oriented Development (TOD) model, plays a pivotal role in urban centers and sub-centers. It integrates crucial functions such as transportation, employment, and daily living, positioning itself as a critical public space within the city [1]. TOD has been widely recognized as a sustainable growth strategy, guiding cities towards a more polycentric structure and fostering territorial cohesion [2,3,4]. CMSAs are designed to encourage “metro + walking” travel patterns, where users can complete their remaining activities through short walking or cycling distances after using public transport. This concept aligns with Carlos Moreno’s “15 min city” model, which, when adopted in long-term planning, would improve quality of life by reducing time wasted in traffic and promoting sustainable mobility [5,6].
In practical design, however, due to the complex environment of urban centers and the competition among various elements, the built environment design of a CMSA faces numerous conflicts between economic benefits and user experience [7]. The latest research on public perception of urban space shows that users are more likely to show negative emotions in urban transportation nodes than at other places [8]. These metro station areas located in the center or sub-center of the city bear more social responsibility than other ordinary TOD areas [9], necessitating design considerations that extend beyond mere transportation and economic considerations to encompass public sentiment and perception [10]. The primary way to enhance public satisfaction is to create a people-oriented, efficient, and comfortable pedestrian environment [11]. Consequently, a comprehensive understanding of public perceptions of central metro station areas is imperative for formulating socially oriented design strategies and policies to enhance overall urban livability [7].
The station catchment area represents an intersection of transportation planning and urban design. Currently, traffic researchers focus primarily on the impact of macro-level indicators on passenger travel and the complex interrelationships among these variables [12,13]. In contrast, urban design researchers concentrate on universal methodologies to enhance the satisfaction of urban public spaces [14,15]. However, there exists a significant gap in the literature regarding the in-depth exploration of urban spatial perception within the context of traffic characteristics. The primary reason for this gap lies in the fact that traffic research typically focuses on macro-level indicators such as traffic flow and travel patterns, while urban design research tends to emphasize spatial form and aesthetic experience. The lack of an integrated interdisciplinary perspective has resulted in insufficient exploration of how traffic characteristics influence urban spatial perception. Thus, establishing a user satisfaction research framework that combines the dual attributes of urban public spaces and traffic node functions in central metro station areas is essential. Specifically, the evaluation of transit catchment areas should include the integrated development characteristics of TOD, such as the 5D principles and node place attributes, while also incorporating aspects like urban aesthetics and service experience. This is necessary for shaping dual benefits that balance both urban economic development and a human-centered society [10,16].
This study delves into the determinants of user satisfaction with the built environment of a CMSA through the application of a combined approach involving the structural equation modeling (SEM) and importance–performance analysis (IPA) methodologies [17]. By assessing the comparative impact intensity and satisfaction levels of these factors, this study aims to pinpoint areas requiring enhancement. First, we devised a conceptual framework for the CMSA that includes location situation, field environment, and urban aesthetics. Subsequently, a selection of observed variables was curated through word frequency analysis and expert consultation, culminating in the construction of a second-order structural equation model. Drawing upon the SEM analysis of 425 questionnaires collected from three typical CMSAs in Chengdu, our investigation elucidates the intricate influence mechanisms of location situation, density, diversity, distance to transit, destination accessibility, road networks, connection design, street characteristics, and order management on user satisfaction. Then, we assessed the alignment between the significance and performance of objective environmental elements by IPA. Finally, tailored strategic recommendations were formulated for the CMSA by synthesizing these findings with on-site investigations. This study offers a dual contribution: (1) It develops a perception assessment framework for the CMSA, which aids in evaluating user satisfaction and analyzing potential correlations between the perception of individual environmental elements and public sentiment. (2) The findings provide various policy recommendations for urban designers and TOD developers to enhance CMSA design, ultimately improving user satisfaction and promoting human-centered development.
The contents are organized as follows: The second section describes the theoretical framework, hypothesis, and CMSA perception index system. The third section details the research method, encompassing the methodology of SEM-IPA, study areas, data sources, and research process. The fourth section presents the empirical study results, focusing on survey data characteristics, model testing and fitness, path impact outcomes, and the alignment identified by importance–performance. In the last section, some design lessons and key points are summarized.

2. Theoretical Framework and Index

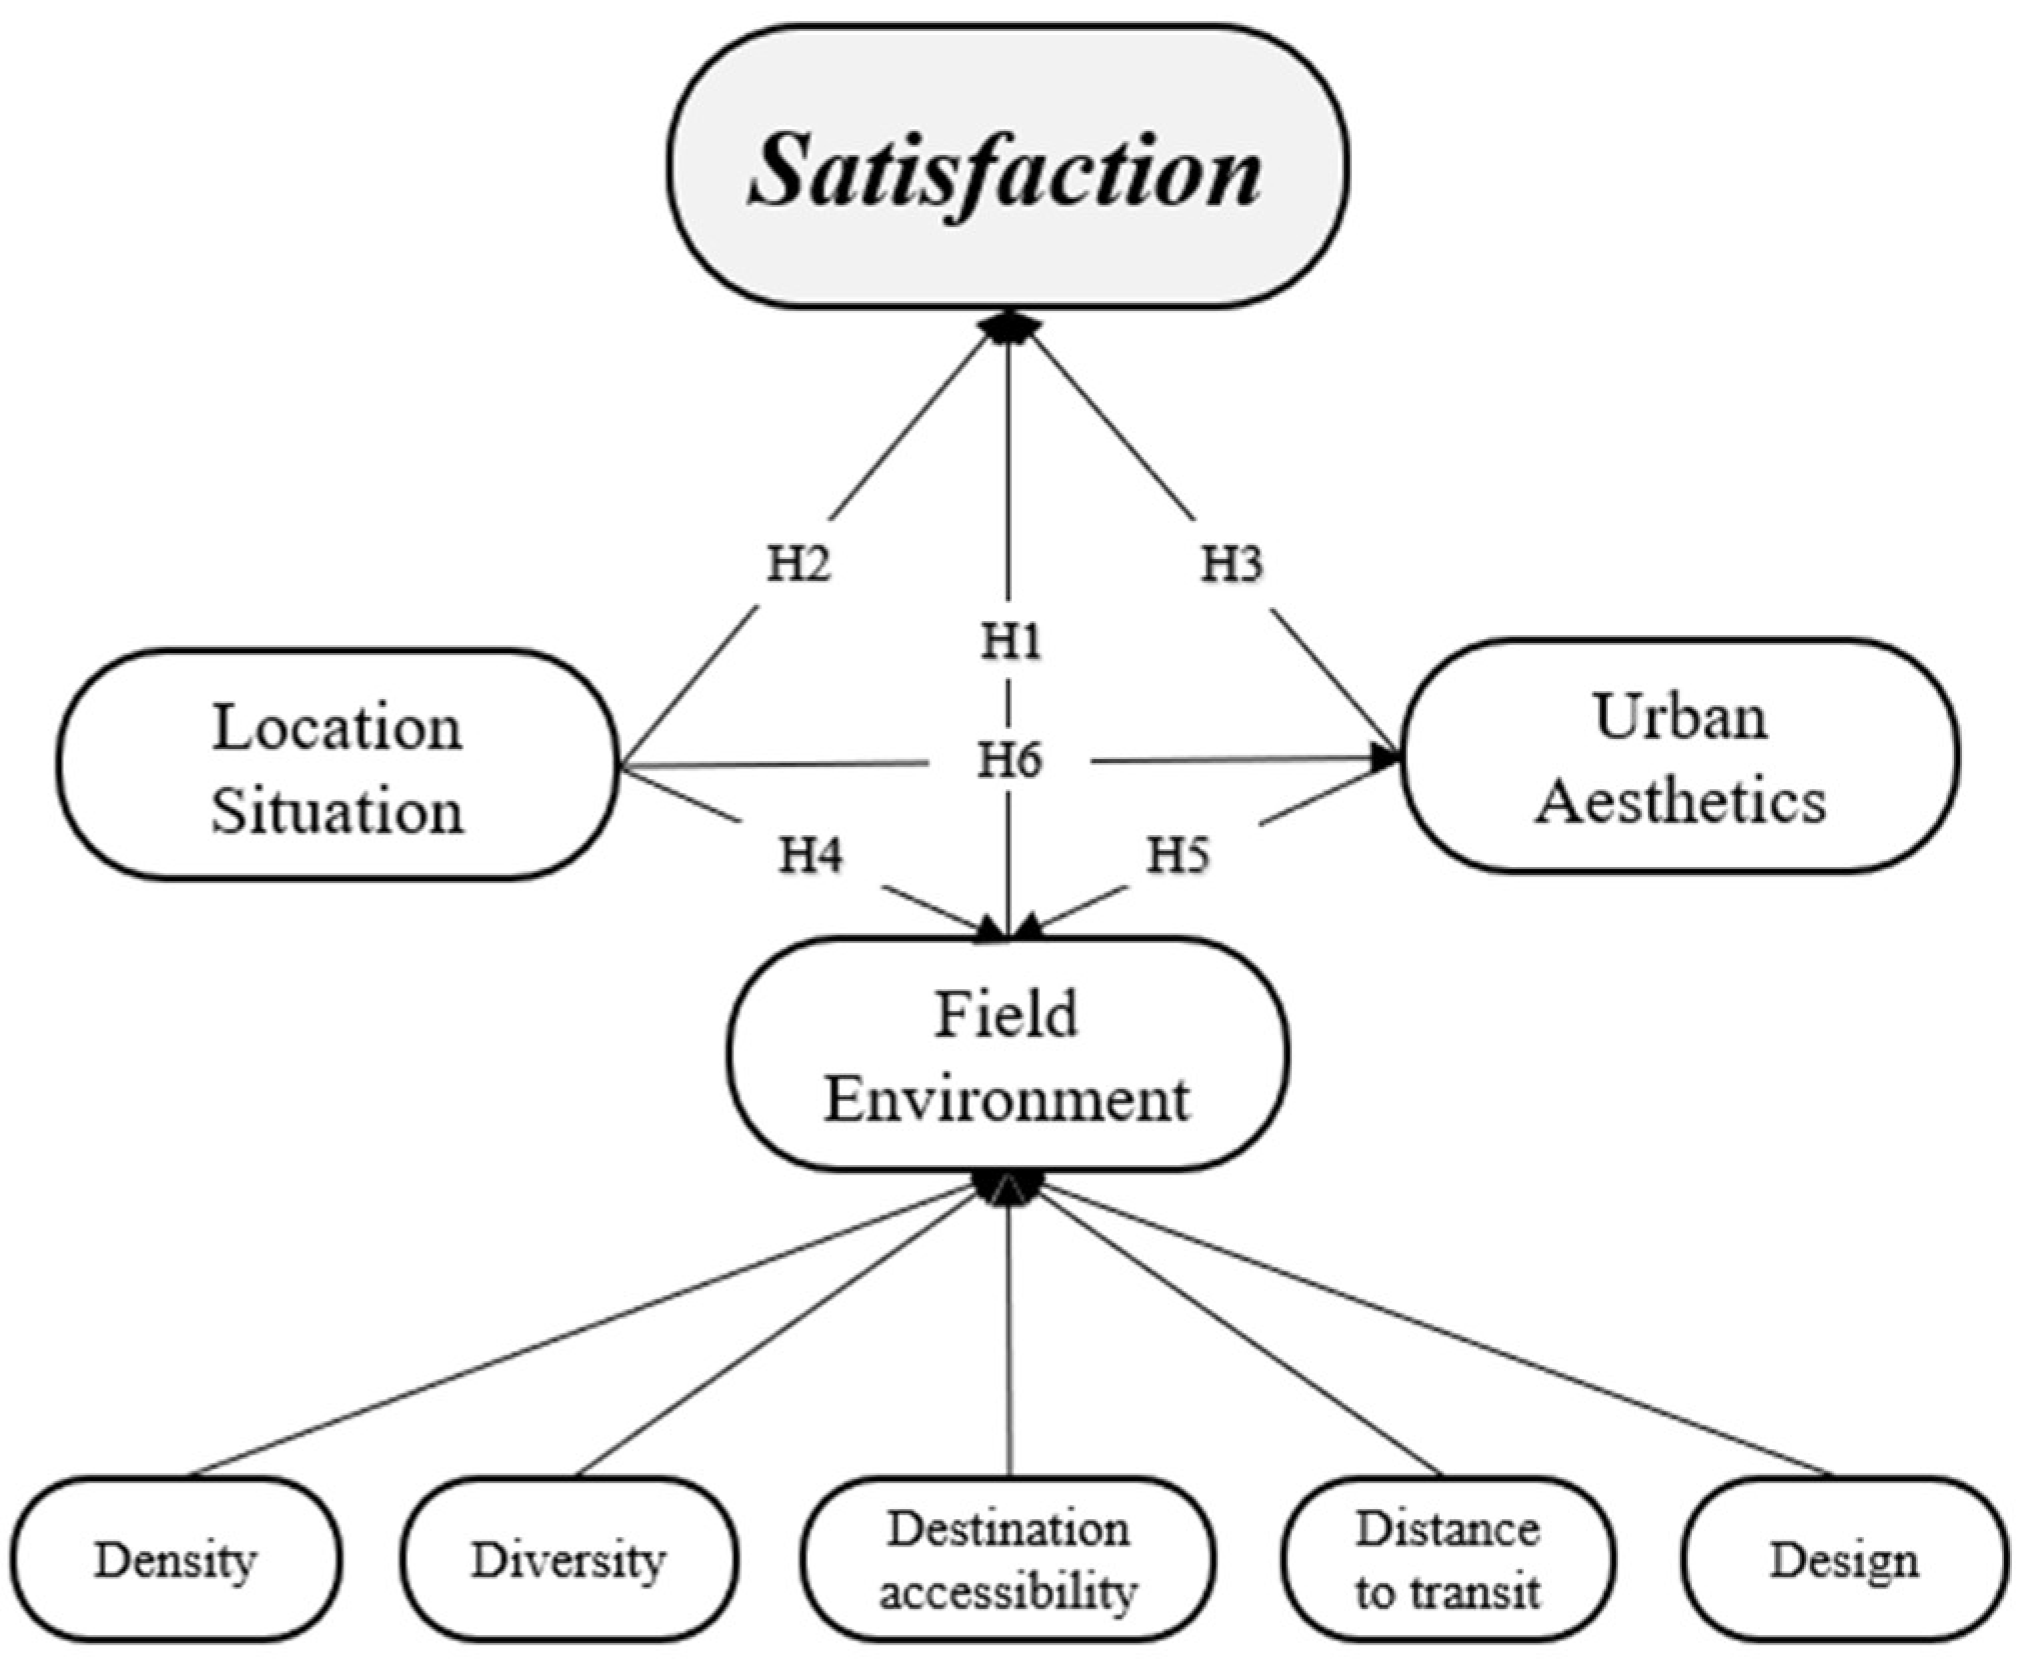
2.1. Theoretical Framework and Hypothesis

A conceptual framework is constructed based on the interpretation of the content of the catchment area of a metro station by existing academic theory. The 3D theory (and its extensions) and node–place model are the academic theories commonly used to characterize the built environment of a catchment area. The mesoscale factors of the built environment are gauged within an area and include land use diversity, street designs, and densities. These factors are designated as the 3Ds; later, these 3Ds were expanded to 5Ds by the addition of two more factors: distance to transit and destination accessibility [18]. Banerjee [19] proposed the concept of ‘railscape’, emphasizing the role of streetscape aesthetics, historical imagery, and user perception in the built environment surrounding railways. The node–place model introduced by Bertolini [20] underscores the necessity to characterize the catchment area by considering both macroscopic traffic performance and the mesoscale place design. The descriptions of the built environment by the NP model and “D” theory overlap. Cao et al. [21] took the 5Ds as the second-level index of the NP model. Deng et al. [22] combined the 5Ds and NP model to evaluate the catchment area. They identified density, diversity, and design as indicators of place design and added a ‘linkage’ dimension to represent the distance to transit and destination accessibility.
By the explanation of the built environment of the catchment area in different scales, we intended to deconstruct the theoretical connotation of the built environment into the location situation, field environment, and urban aesthetics. Figure 1 is a diagrammatic representation of built environment quality attributes for user satisfaction as a theoretical framework for this study, which is also the basis for the structural equation model. There are three first-order latent variables and five second-order latent variables.
Hypotheses regarding the direct and indirect effects among latent constructs may be verified after an SEM analysis has been conducted. Table 1 shows six hypotheses between latent variables and satisfaction and between latent variables.

2.2. Index System

Based on the conceptual framework, the corresponding observed variables were selected through word frequency analysis and expert consultation to form a measurable model. We selected the indicators through word frequency analysis and expert consultation. As one of the bibliometric methods, the word frequency analysis is a research method that uses quantitative statistical analysis to describe the external characteristics of publications and evaluate the critical spots in a particular research field [34]. Expert consultation is seen as a consensus-oriented technique where experts orient themselves towards a greater or lesser degree of consensus around the critical projection or visions of the future within a specific field [35].
We searched for relevant studies that met two conditions: first, a title containing the words “Station Area”, “Transit Oriented”, “TOD”, “Transit Station”, and so on; second, an abstract or keywords containing words such as “performance”, “influence”, “impact”, “effect”, “quality”, “evaluate”, “assess”, or “measure”. In total, 158 studies from 2019 to 2023 were collected, and 94 indicators were selected. According to the frequency of these words, we divided them into high, mid, and low frequencies. All the high-frequency indicators were adopted, most mid-frequency indicators were retained, the indicators that did not meet the research theme were deleted, and only a few of the low-frequency indicators were retained. Finally, 58 primary indicators were obtained.
We consulted 13 experts on these 58 indicators and asked them to rate the impact of each indicator on user perception on a scale of 1–5. The experts were from university scholars, designers, TOD developers, and metro companies, and 12 experts responded—a positive degree of 93.3%. The index was further selected by calculating and comparing the average value and coefficient of variation of each indicator. The average value reflects the influence of the indicator on the perception, and the coefficient of variation reflects the degree of expert consensus. The calculation results are shown in Figure 2. Indicators with low average values and a high coefficient of variation were deleted. Table 2 shows the index system after preliminary selection. We designed the questionnaire based on the indicator system. Specifically, for each indicator in the table, respondents were asked to provide their perceptions, which were quantified using a Likert scale. A score of 5 indicated “very satisfied”, 4 indicated “somewhat satisfied”, 3 indicated “neutral”, 2 indicated “somewhat dissatisfied”, and 1 indicated “very dissatisfied”.

3. Method and Data

3.1. SEM-IPA Model

3.1.1. Structural Equation Model (SEM)

Structural equation modeling (SEM) is a statistical method for analyzing variables based on their covariance matrix to find their inherent structural relationships. Users provided judgments for each aspect, allowing them to be evaluated as observed endogenous latent variables in the model [36]. A complete SEM includes structural and measurement models. Of these, the former reflects the relationship between latent variables, which is expressed as
η = β η + Γ ξ + ξ ,
where η denotes the endogenous latent variable, β is the influence relationship between the endogenous latent variables, Γ is the influence relationship between the exogenous latent variable and the endogenous latent variable, and ξ is the residual term of the endogenous latent variable.
The measurement model reflects the relationship between latent variables and explicit variables, which can be expressed as
X = Λ x × ξ + δ , Y = Λ y × η + ε ,
where X is the exogenous explicit variable, Y is the endogenous explicit variable, Λx is the relationship matrix between the exogenous explicit variable X and the exogenous latent variable ξ, Λy is the relationship between the endogenous explicit variable Y and the endogenous latent variable η, and δ and ε are X and Y error terms.

3.1.2. Importance–Performance Analysis (IPA)

Importance–performance analysis (IPA) is a method for identifying the alignment of importance and performance and assumes a distribution of a set of attributes in four sets, according to the four possible combinations, with respect to the performance and importance of attributes [37,38]. Quadrant I is the area of “high importance and high performance”. Quadrant II is the area of “high importance and low performance”. Quadrant III is the area of “low importance and low performance”. Quadrant IV is the area of “low importance and high performance”. The recommendable actions given by the IPA theory for the four areas of appeal are “Keep up the good work”, “Concentrate here”, “Low priority”, and “Possible overkill” [39].

3.1.3. SEM-IPA Method

The SEM-IPA method is also presented as an importance–performance matrix (Figure 3), and the quantification of importance is based on the results of SEM. We calculate the importance of these variables based on their total contribution to satisfaction, as the greater the contribution of a factor to satisfaction, the higher its importance. For both first-order and second-order latent variables, their contribution to satisfaction is the sum of their direct and indirect effects, i.e., the total effect on satisfaction. For observed variables, their importance is determined by the product of their factor loadings and total effects. Similarly, the performance value is defined by the satisfaction score; the higher the satisfaction, the better the perceived performance.
In the IPA results, the alignment of importance and performance is essential for the evaluation of user perception. Specifically, a higher perception of elements should correspond to increased satisfaction, indicating that users have had a positive experience with these environmental factors. Based on the assessment of this alignment, we categorized the quality attributes in the four quadrants into two groups: matched (Quadrants I and III) and unmatched (Quadrants II and IV). When importance and performance align, they can be either high or low; in both scenarios, the strategy is to maintain the current state. Conversely, when there is a mismatch, two situations arise: in Quadrant II, the importance of factors significantly exceeds their performance, necessitating additional investment for improvement. In Quadrant IV, the importance of elements is considerably lower than their performance, indicating a need to reduce input.

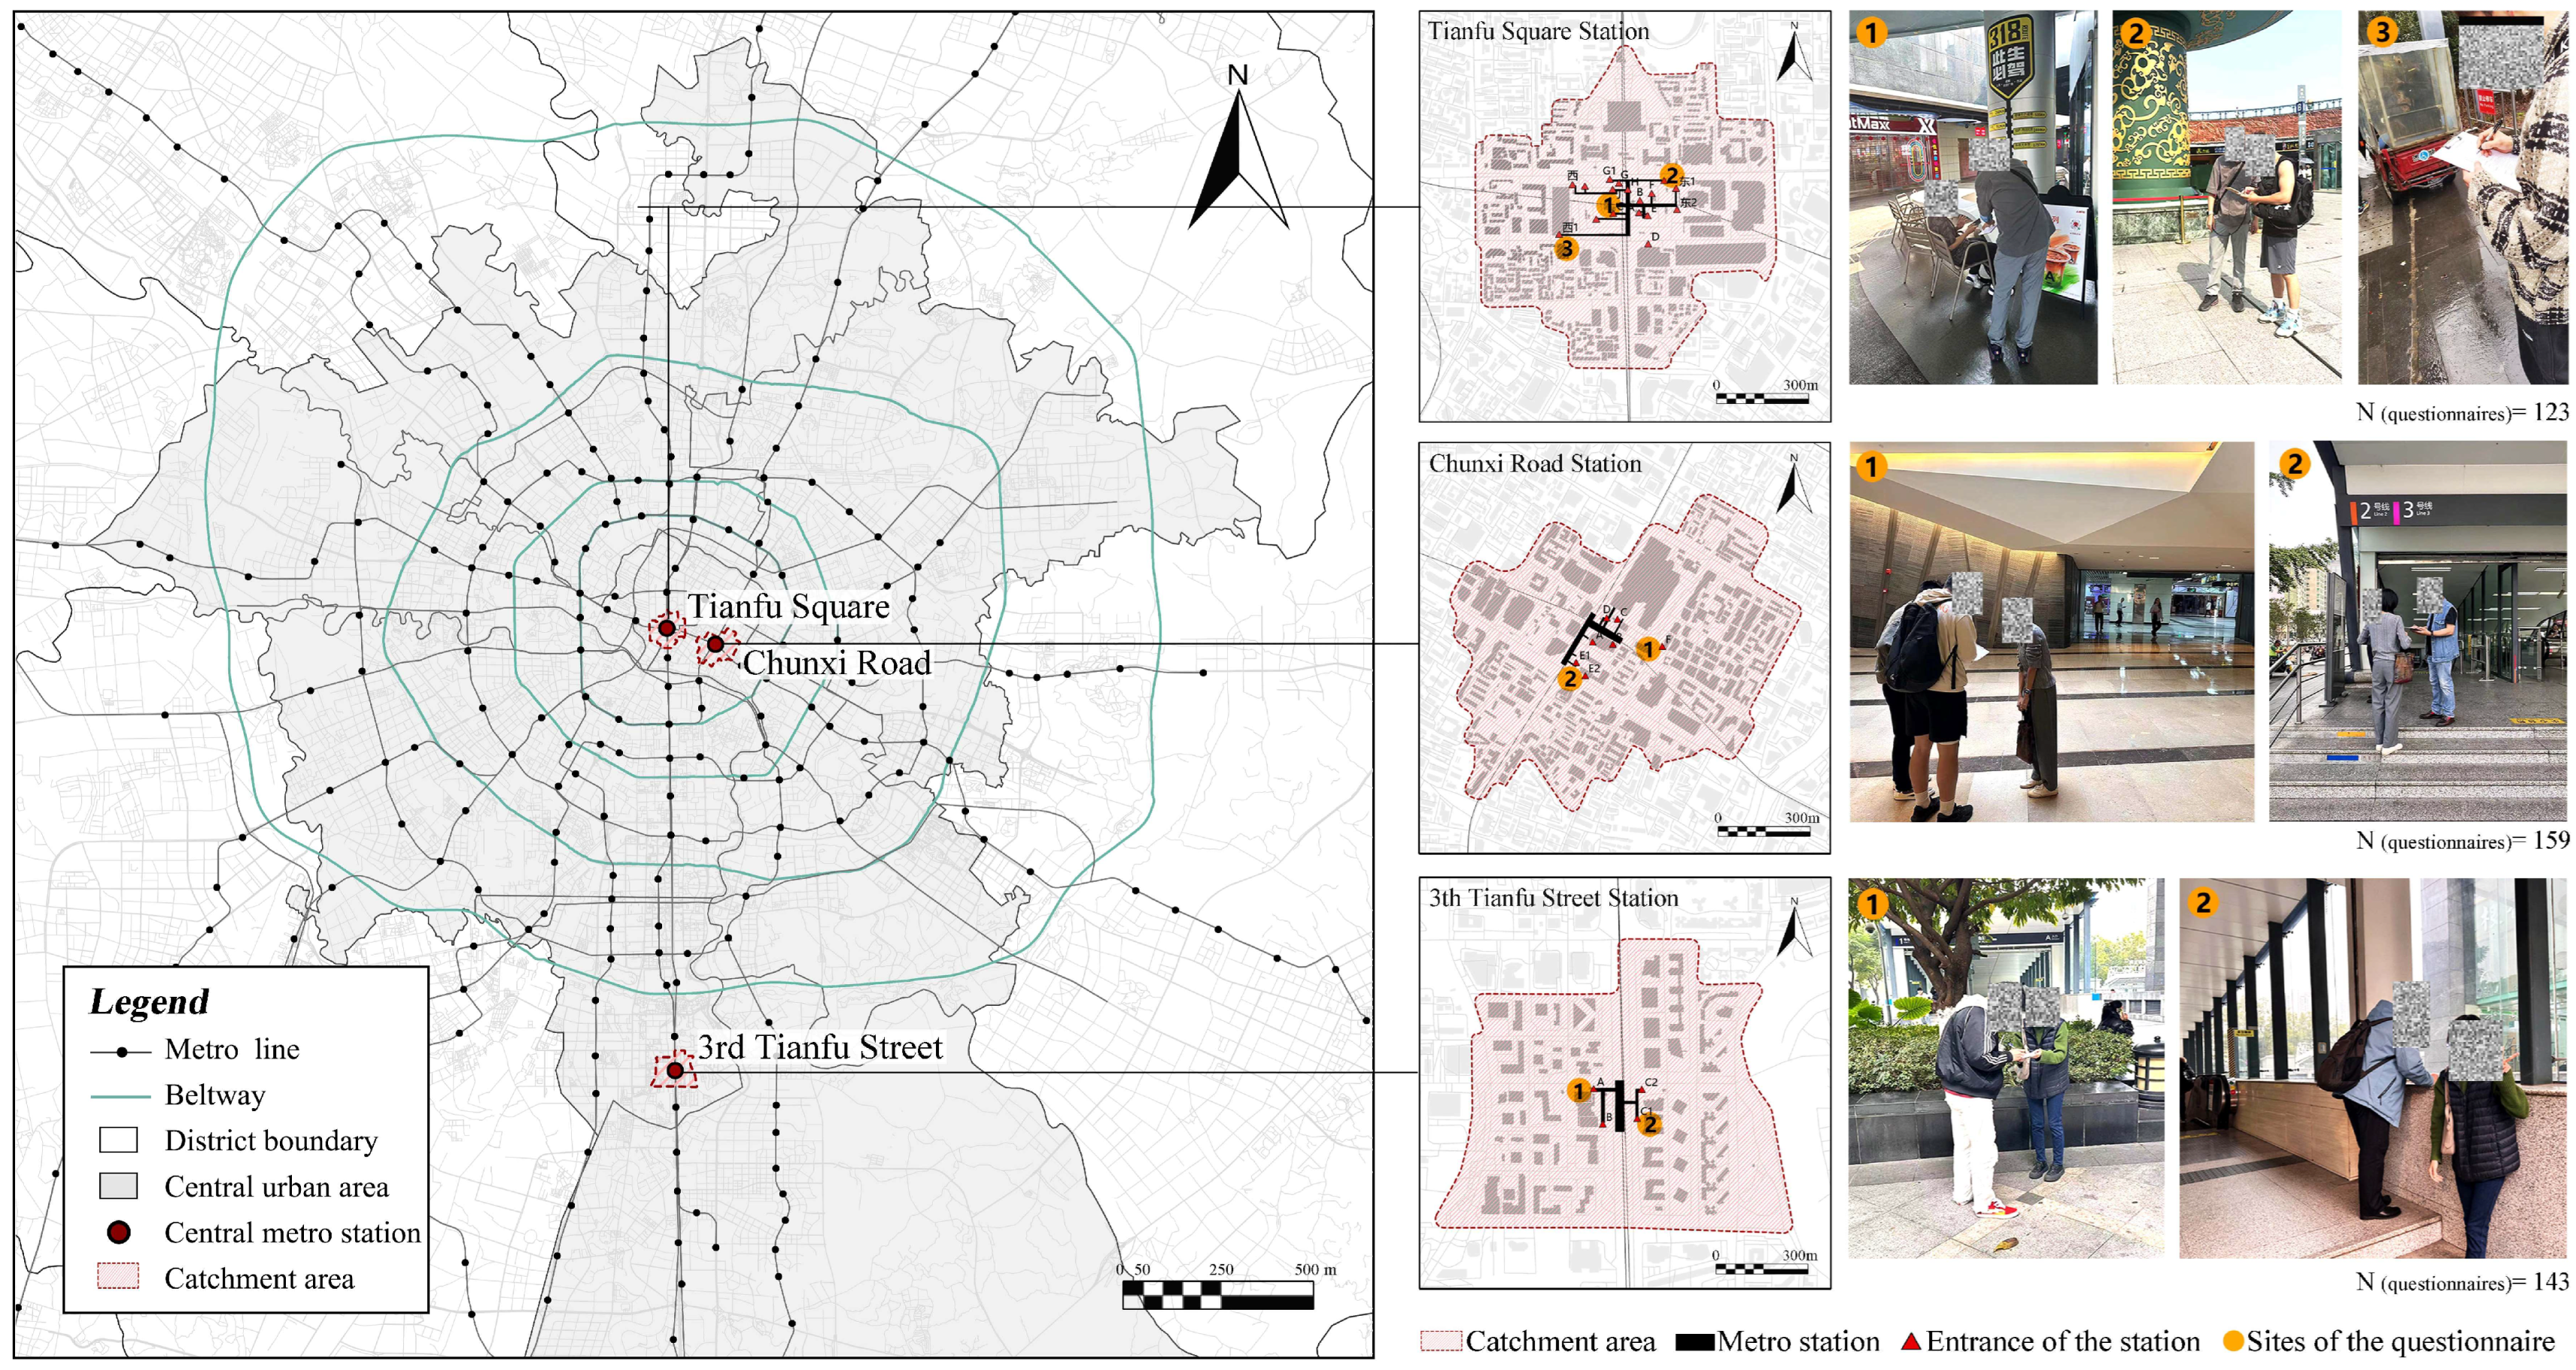
3.2. Study Area and Data

Based on the “Guidelines for Integrated Urban Design of Chengdu Metro Stations”, the differences among several city-level central metro stations are primarily reflected in two aspects: location and dominant function. Location differences refer to whether the stations are situated in the new city or the old city. Functional differences are seen in whether the stations are dominated by historical landmarks, comprehensive commercial, business, and administration areas, or large transit hubs. Due to their unique characteristics in terms of function, form, and clientele, stations dominated by large transit hubs have been excluded from this study. The selection of the study samples was based on three principles: first, including the representation of different locations; second, covering stations with different dominant functional types; and third, including stations with a relatively high level of development. Three stations were chosen: Tianfu Square, 3rd Tianfu Street, and Chunxi Road. Tianfu Square, located in the old city center, primarily serves administrative and historical functions; Chunxi Road is a commercial hub; and 3rd Tianfu Street is predominantly a business and office district. These three stations are well-established urban centers, each with distinct functional characteristics (Figure 4).
The scale range of the catchment area is defined by the effective perception range of the user in actual use. We simulated the 5 min walk at the outermost entrance and exit of the site through Mapbox, combined with the 5 min range and the shape of the plot, and manually outlined the effective perception range. The overall size is about 400–800 m, which is similar to previous research [41,42].
Based on the theoretical framework, this study utilized a questionnaire consisting of self-formulated questions of the index system. The questionnaire comprised two sections: personal information and a satisfaction survey. The personal information section gathered data on participants’ gender, age, educational background, occupation, purpose of visit, and frequency of visits. The satisfaction survey required participants to evaluate various components of the catchment area using a standardized rating scale ranging from 1 (dissatisfaction) to 5 (satisfaction). Questionnaires were distributed near different entrances of the three stations. This approach ensured a diverse sampling of individuals using these stations, thereby enhancing the representativeness and reliability of the collected information.

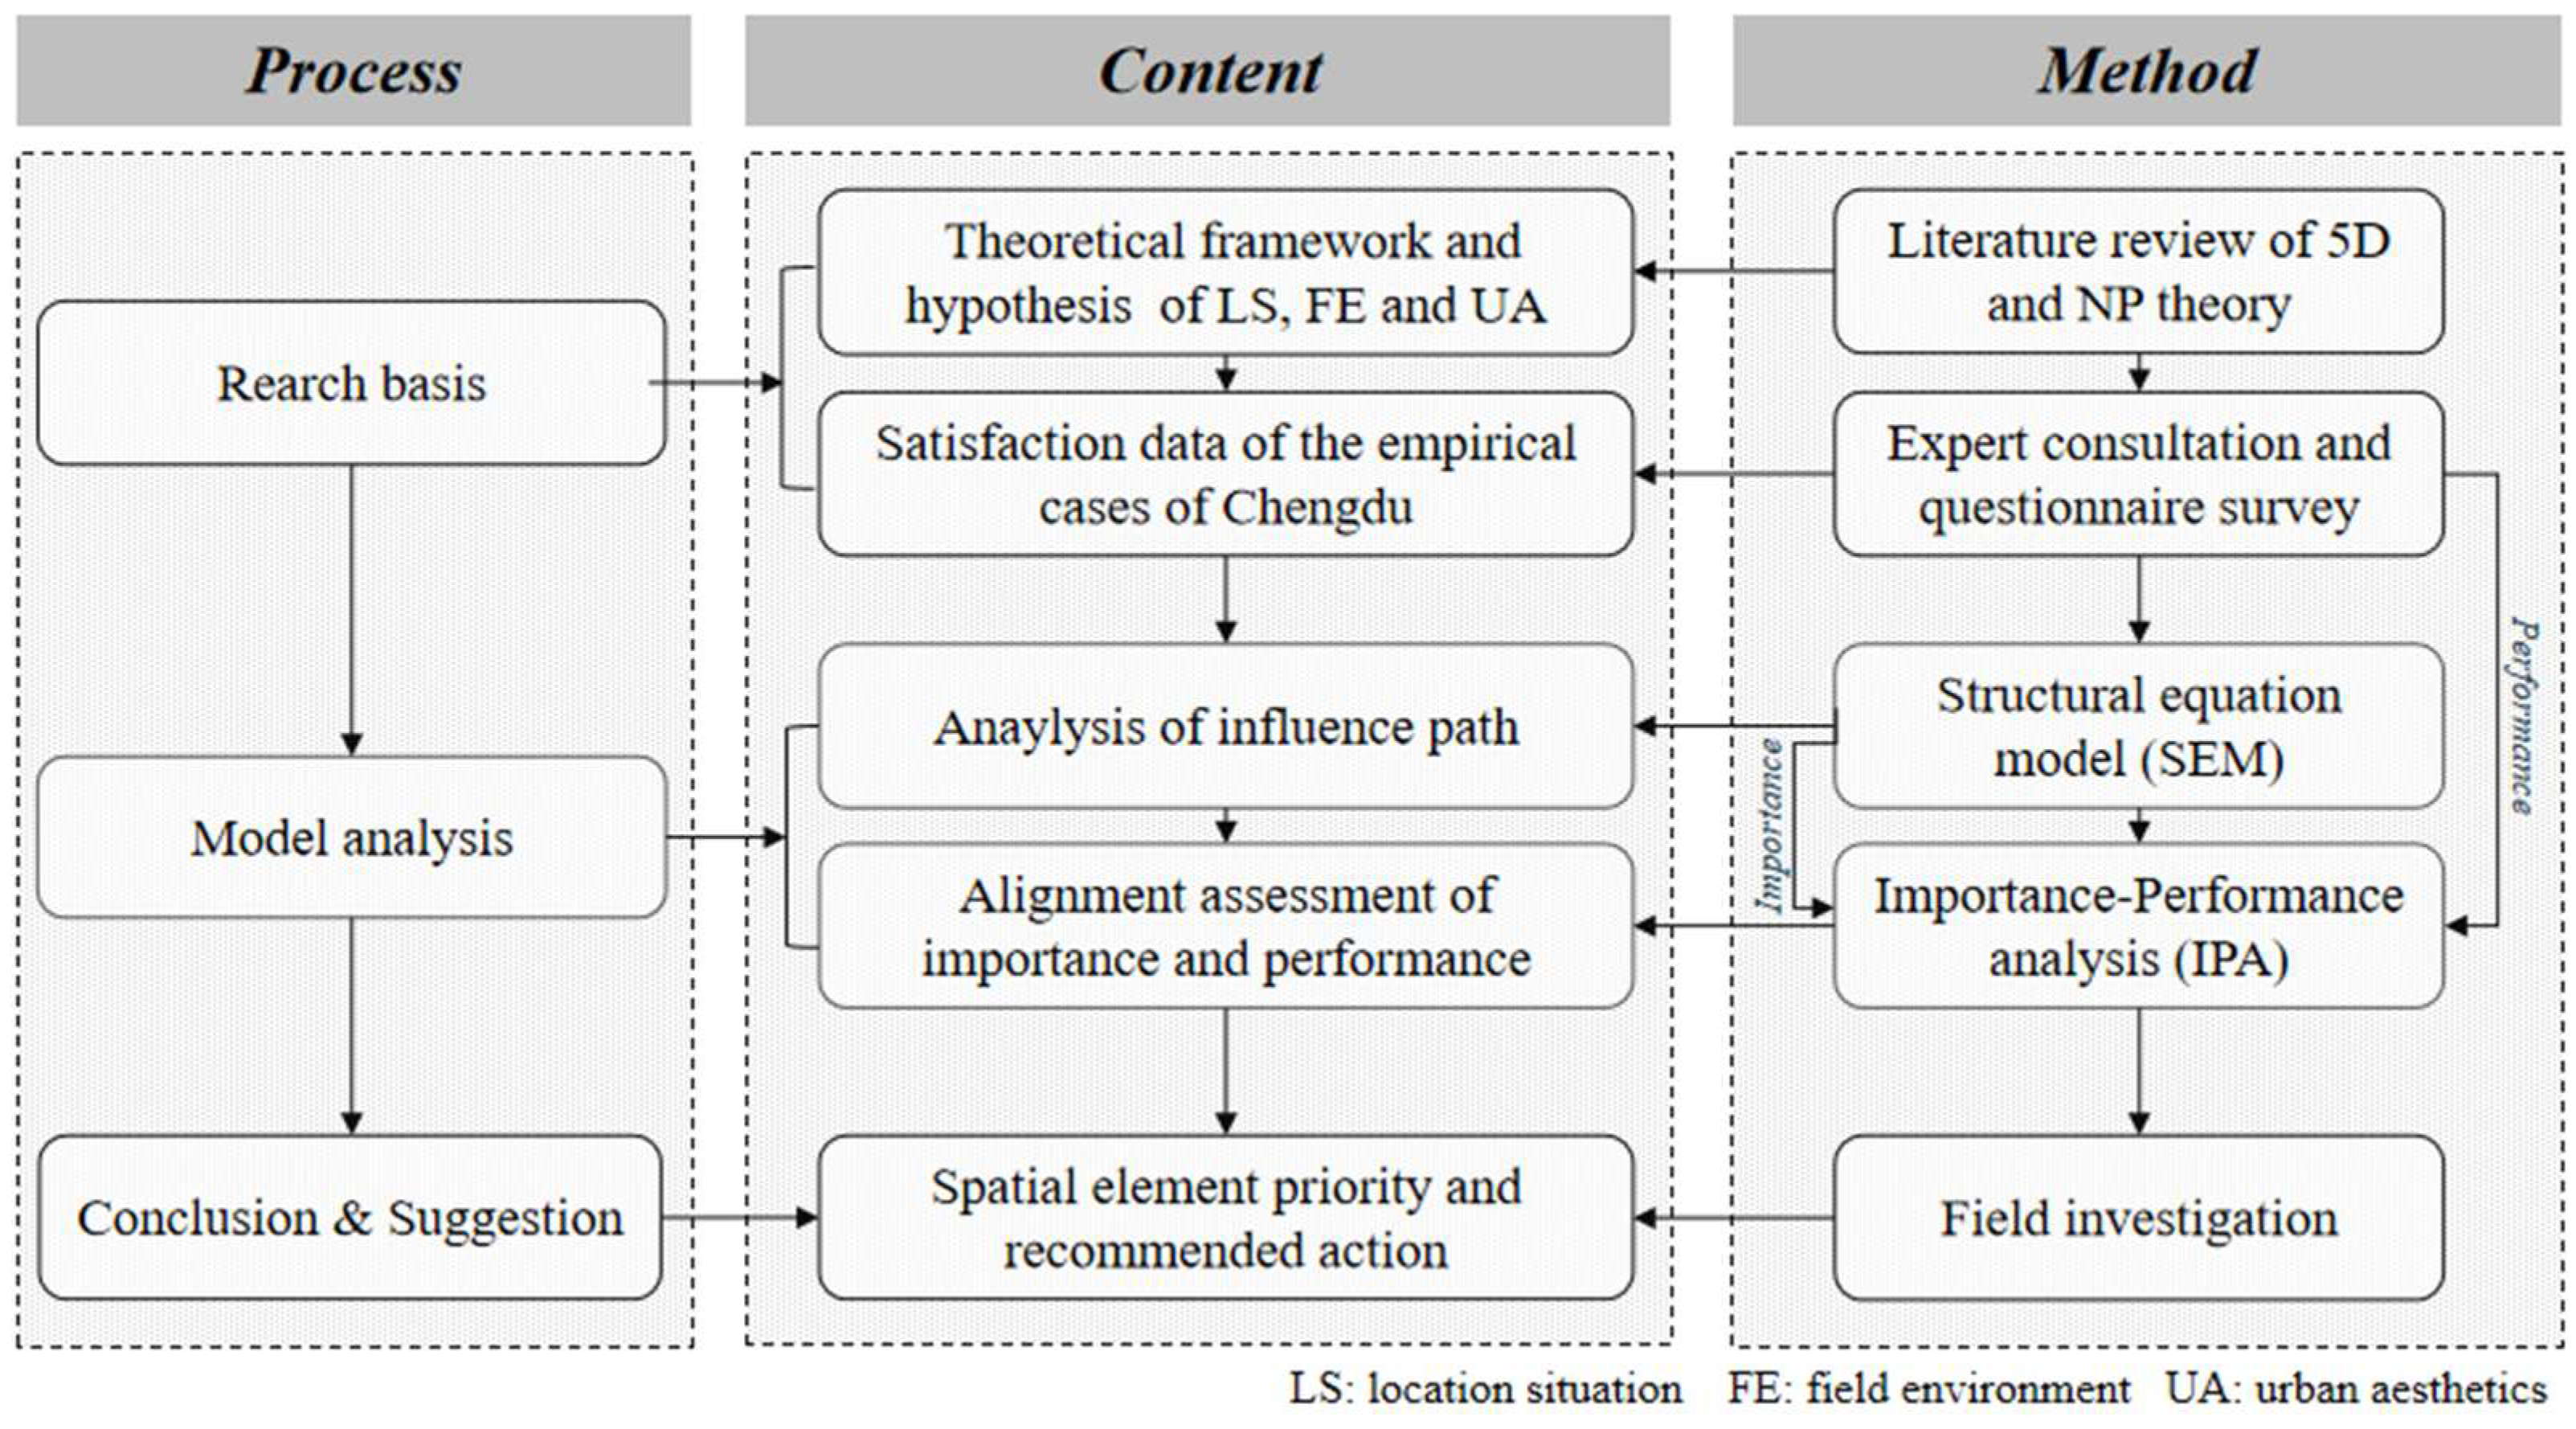
3.3. Research Process

We developed the following framework (Figure 5): The initial phase established the research foundation by conducting a literature review to construct a theoretical framework. This phase also involved administering a satisfaction questionnaire to gather fundamental study data. The theoretical framework was developed based on the built environment of the transport area theory, with formulated study hypotheses. The framework was refined through word frequency analysis and expert consultation into a specific and measurable perceptual evaluation index system supported by data from a questionnaire survey.
In the subsequent phase, SEM was employed to depict the interplay among different dimensions of the perception of the catchment area. Concurrently, the IPA method was utilized to evaluate the alignment between the importance and performance of individual spatial elements. A two-order SEM model was constructed based on the theoretical framework and questionnaire data, adjusted iteratively to test the validity of the proposed hypotheses. The SEM results unveiled each factor’s influence mechanisms and intensities in relation to satisfaction, providing an importance value for the IPA analysis. IPA analysis categorized indicators based on perceived importance and performance, distinguishing matched and unmatched types.
In the final phase, the research findings were carefully examined, culminating in the development of strategic recommendations. Drawing from the SEM-IPA analysis, additional insights into the perceptual attributes of elements are presented. These insights, combined with on-site structural assessments, led to the identification of deficient built environment elements and the provision of targeted recommendations. Furthermore, some critical environmental features conducive to enhancing satisfaction in the central catchment area were summarized.

4. Results

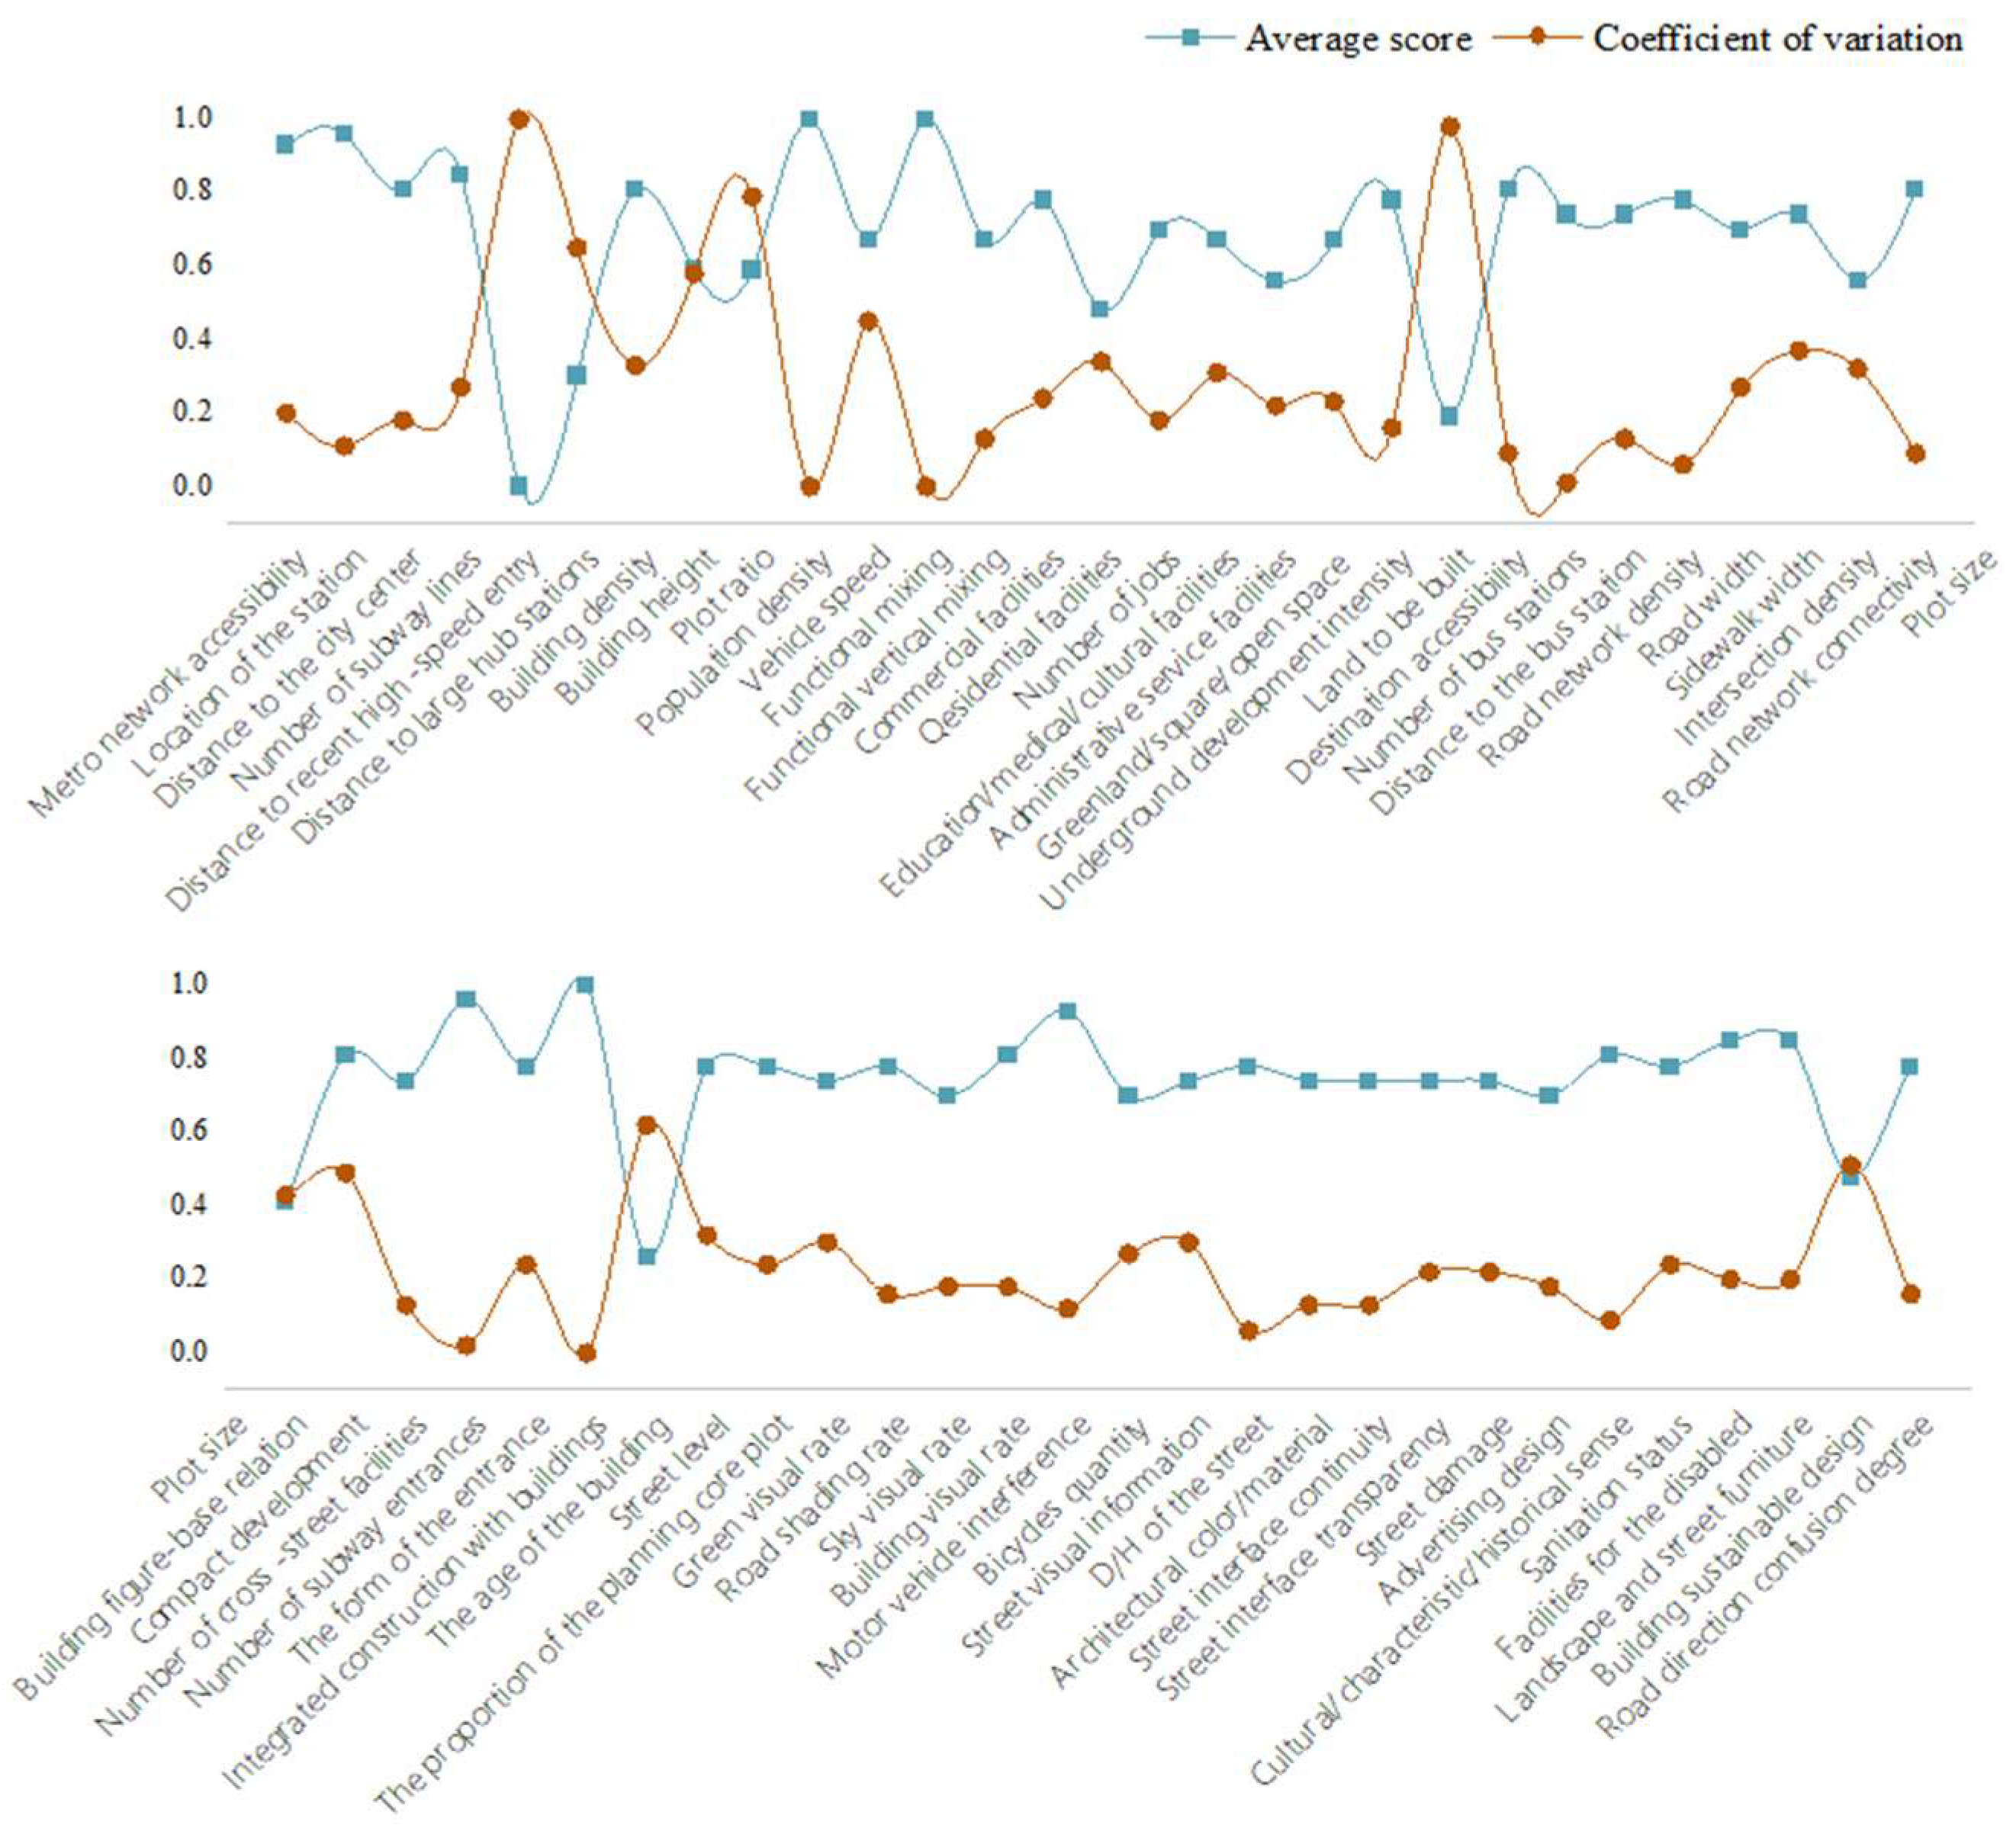
4.1. Data Description

In total, 425 valid questionnaires were collected: 167 at Tianfu Square Station, 138 at Chunxi Road Station, and 120 at 3rd Tianfu Street Station. Table 3 presents a statistical overview of the respondents’ information, revealing the following key characteristics: (1) The gender distribution of the respondents was nearly balanced, with an average age of 28.6 years. The education level was primarily dominated by bachelor’s degrees. (2) Most respondents have low knowledge of TOD and urban design. (3) The primary purposes for visiting the stations were work, official business, shopping, and entertainment, with a low frequency.

4.2. Reliability and Validity
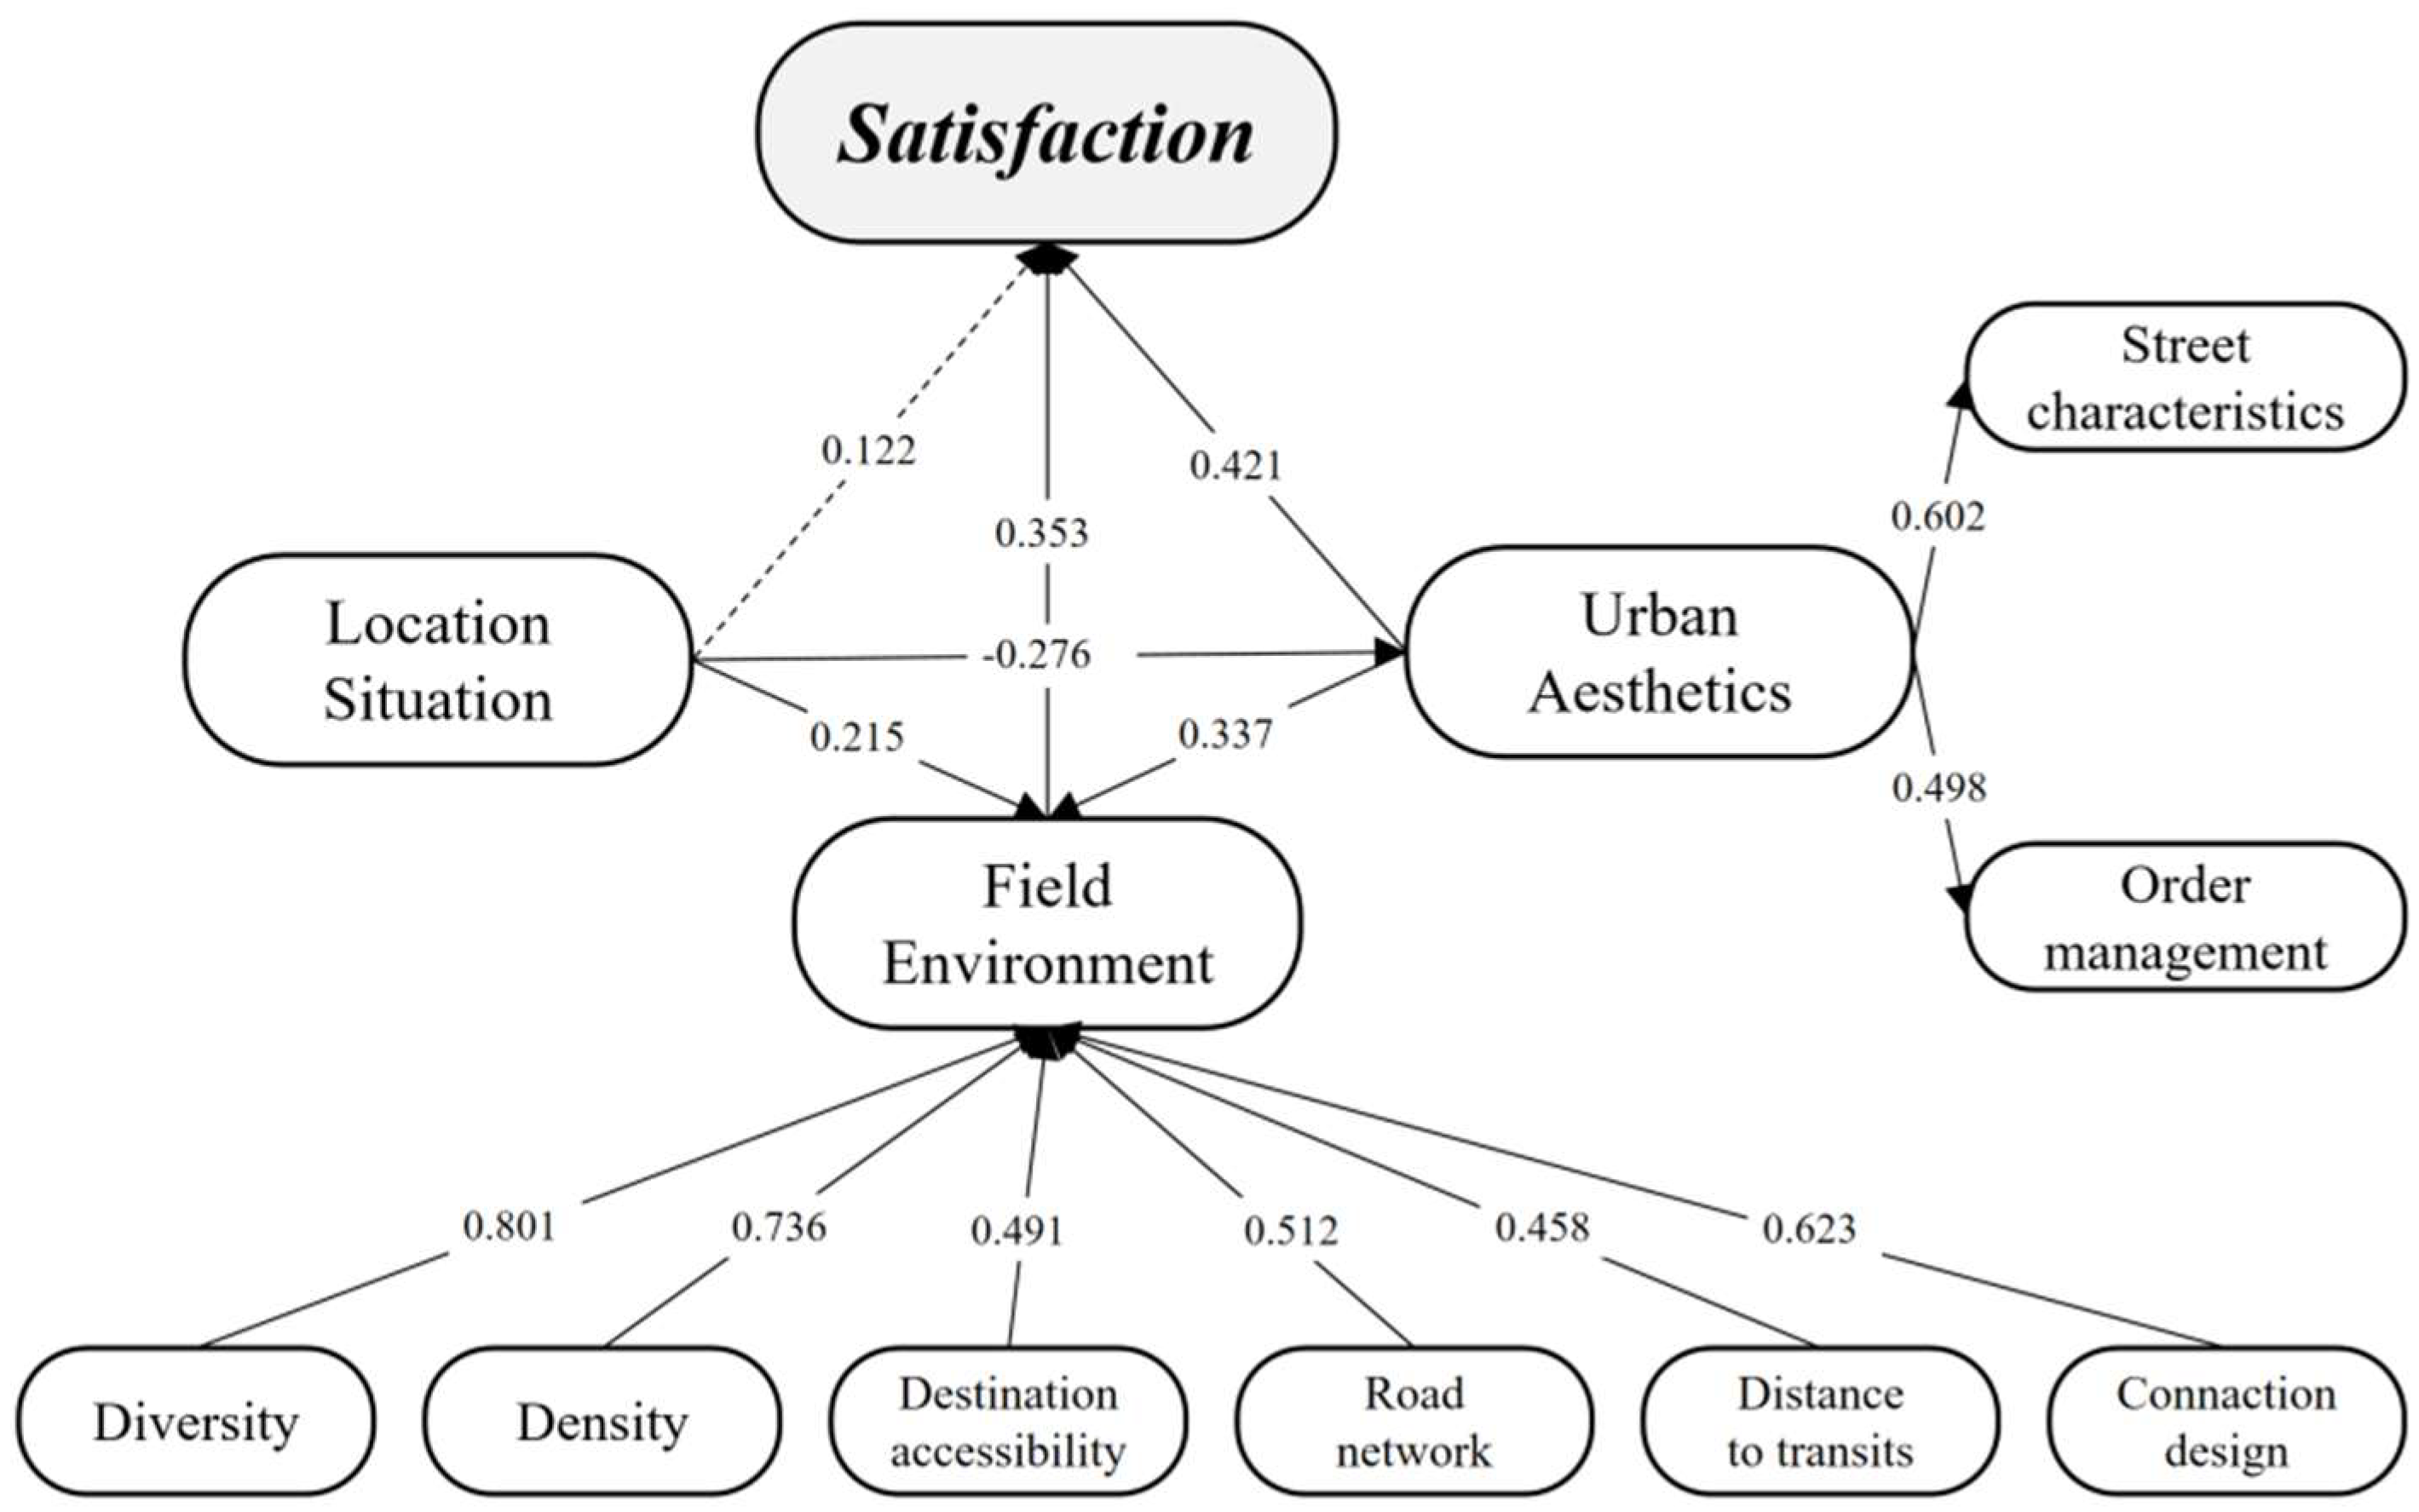
Using SPSS 25.0, we evaluated the reliability and validity of the questionnaire data to assess their rationality. Reliability is the evaluation of the stability and consistency of the results. Validity is used to assess the consistency between predicted and actual measured data results.
We adopted Cronbach’s alpha (α) to evaluate the reliability of the scale. It is generally believed that alpha should be greater than 0.6 to indicate that the internal consistency of the questionnaire is accepted [43]. The α for the destination accessibility dimension is 0.596. Upon examining the α coefficient after item deletion, it was found that the α coefficient for C3 (accessibility of residential facilities) increased to 0.720. Consequently, the C3 item was removed. The overall α coefficient is 0.871, with the coefficients for each dimension ranging from 0.720 to 0.875 (Table 4), indicating good internal consistency. The results showed that KMO was greater than 0.8 [44] (Table 5), indicating the data were suitable for factor analysis to test the validity and the variables had good independence.
Exploratory factor analysis strives to uncover the coherence between the variables and the primary component factors extracted from empirical data. It can also conduct mathematical tests on the previously constructed observed variables. With the principal component extraction method and the maximum variance rotation, nine factors with eigenvalues greater than 1.0 were extracted, and the cumulative explanatory variance was 69.014%, which is above 50% and is acceptable [45] (Table 6). Therefore, we adjusted the original index system: The first-order latent variable named design dimension is refined into road network design and connection design, and the first-order latent variable named urban aesthetics is refined into street characteristics and order management (Table 7). After principal component analysis, all factors loading above 0.4 can be retained [46]. Among the observed variables, the standard factor load of E6 (difficulty of finding entrance) is lower than 0.4, so the item is deleted.

4.3. Influence Path

We used Amos 28 software to build and compute the structural equation model, establishing a model that includes four first-order latent variables and eight second-order latent variables, and imported the questionnaire data into the model. The model (Figure 6) demonstrated that location situation (H2, p-value > 0.05, C.R. < 1.96) had no significant effect on satisfaction; thus, these exogenous latent variables were removed. This was represented by the broken lines. The remaining five hypothetical paths are all supported (Table 8). In addition, items with values > 0.50 were deemed significant [47]. In the current model, all items exceed this threshold. The SEM was rerun after the removal of the exogenous latent variable and the consideration of the parameters to create the final model in evaluating the effect on satisfaction.
Table 9 demonstrates the IFI, CFI, GFI, AGFI, and RMSEA of the adjusted model. By the standard [48,49], values higher than 0.800 are cut off. The value of x2/df ranges from 1 to 3, and RMSEA < 0.07 is acceptable, which provides the reliability of a good representation of the data observed.
Table 10 presents the AVE and CR values of the adjusted model. AVE reflects the explanatory power of latent variables on their respective indicators, while CR is used to assess the reliability of latent variables. The majority of the latent variables exhibit an AVE greater than 0.5. According to Hair et al. [50], factor loadings greater than 0.5 and CR values above 0.70 are typically considered ideal. In this study, a few dimensions have AVE values slightly below 0.5, which can be considered acceptable as they demonstrate moderate explanatory power.
The final model (Figure 7 and Table 11) shows the impact path results as follows: (1) Field environment perception has the most significant direct perceptual effect on station satisfaction, and it is also affected by urban aesthetics and location perception. (2) Urban aesthetic perception exerts a significant direct influence on satisfaction and also serves as a mediator by positively impacting the field environment. Consequently, urban aesthetic perception demonstrates the most substantial total effect on satisfaction. (3) The direct influence of location perception on satisfaction is relatively modest. However, it impacts the field environment and urban aesthetic perception, indirectly affecting satisfaction. The positive correlation between location conditions and the field environment suggests that superior location conditions enhance users’ inclusiveness towards the field environment. Conversely, the negative relationship between location conditions and urban aesthetics implies that a more centralized site elevates public expectations regarding its portal effect.

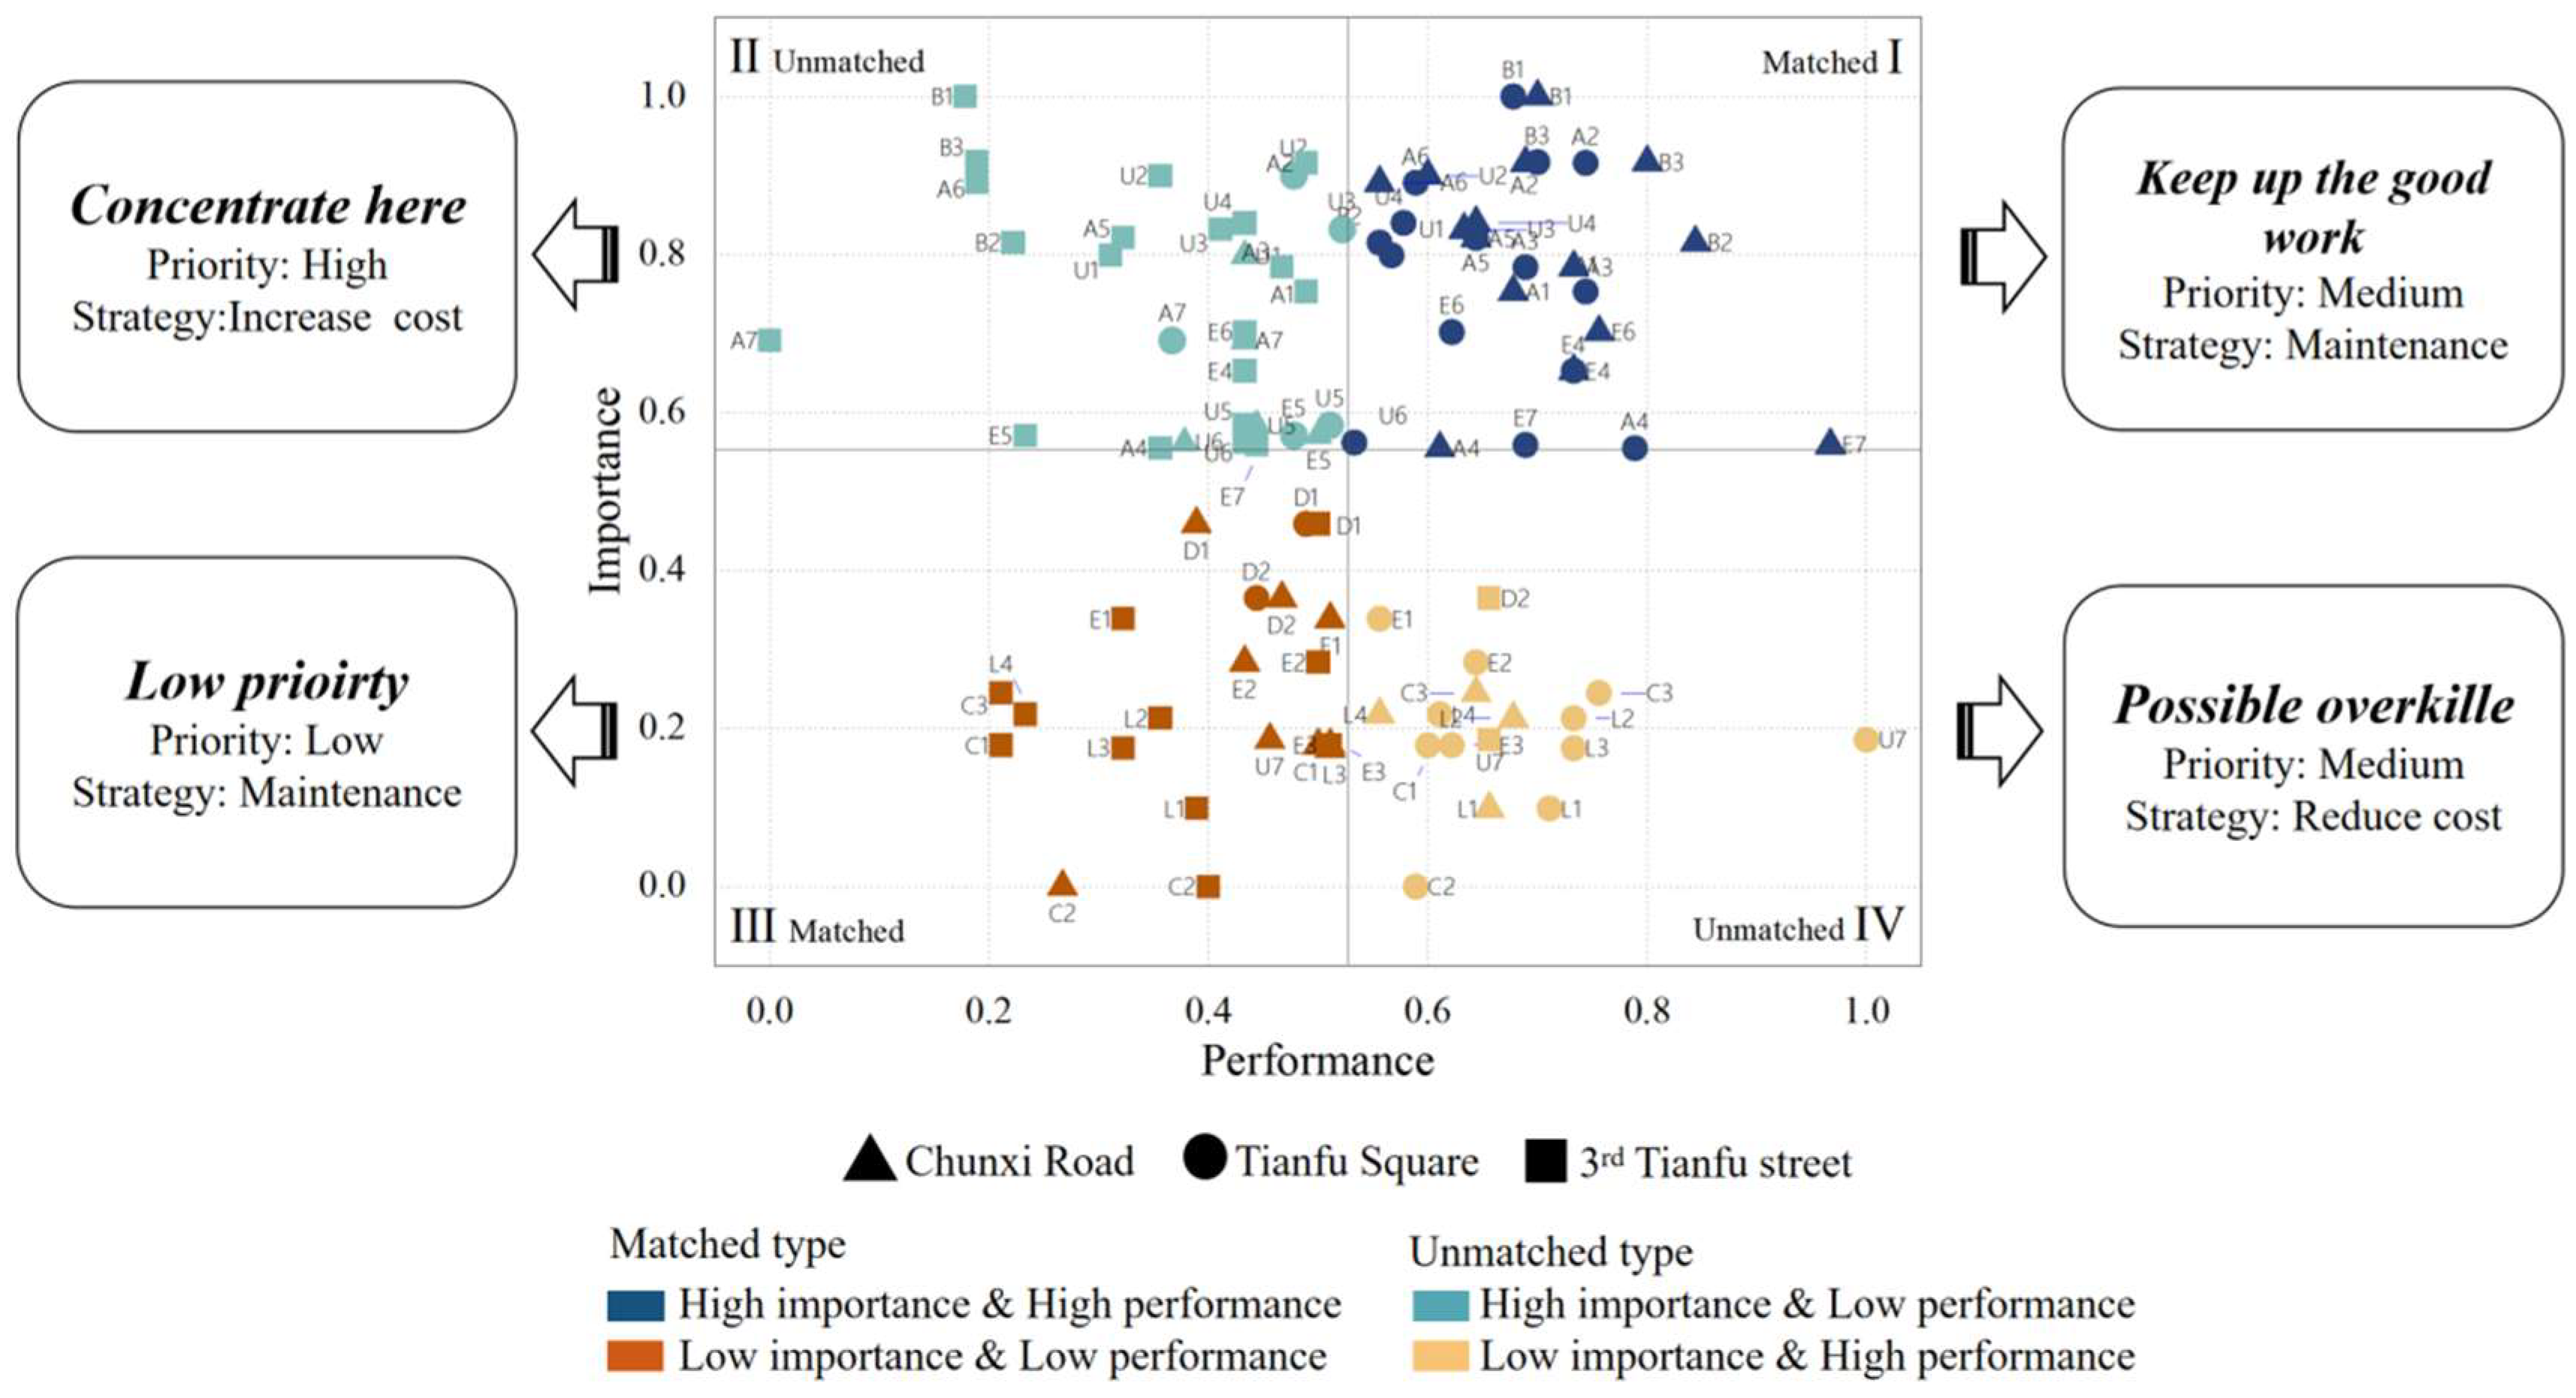
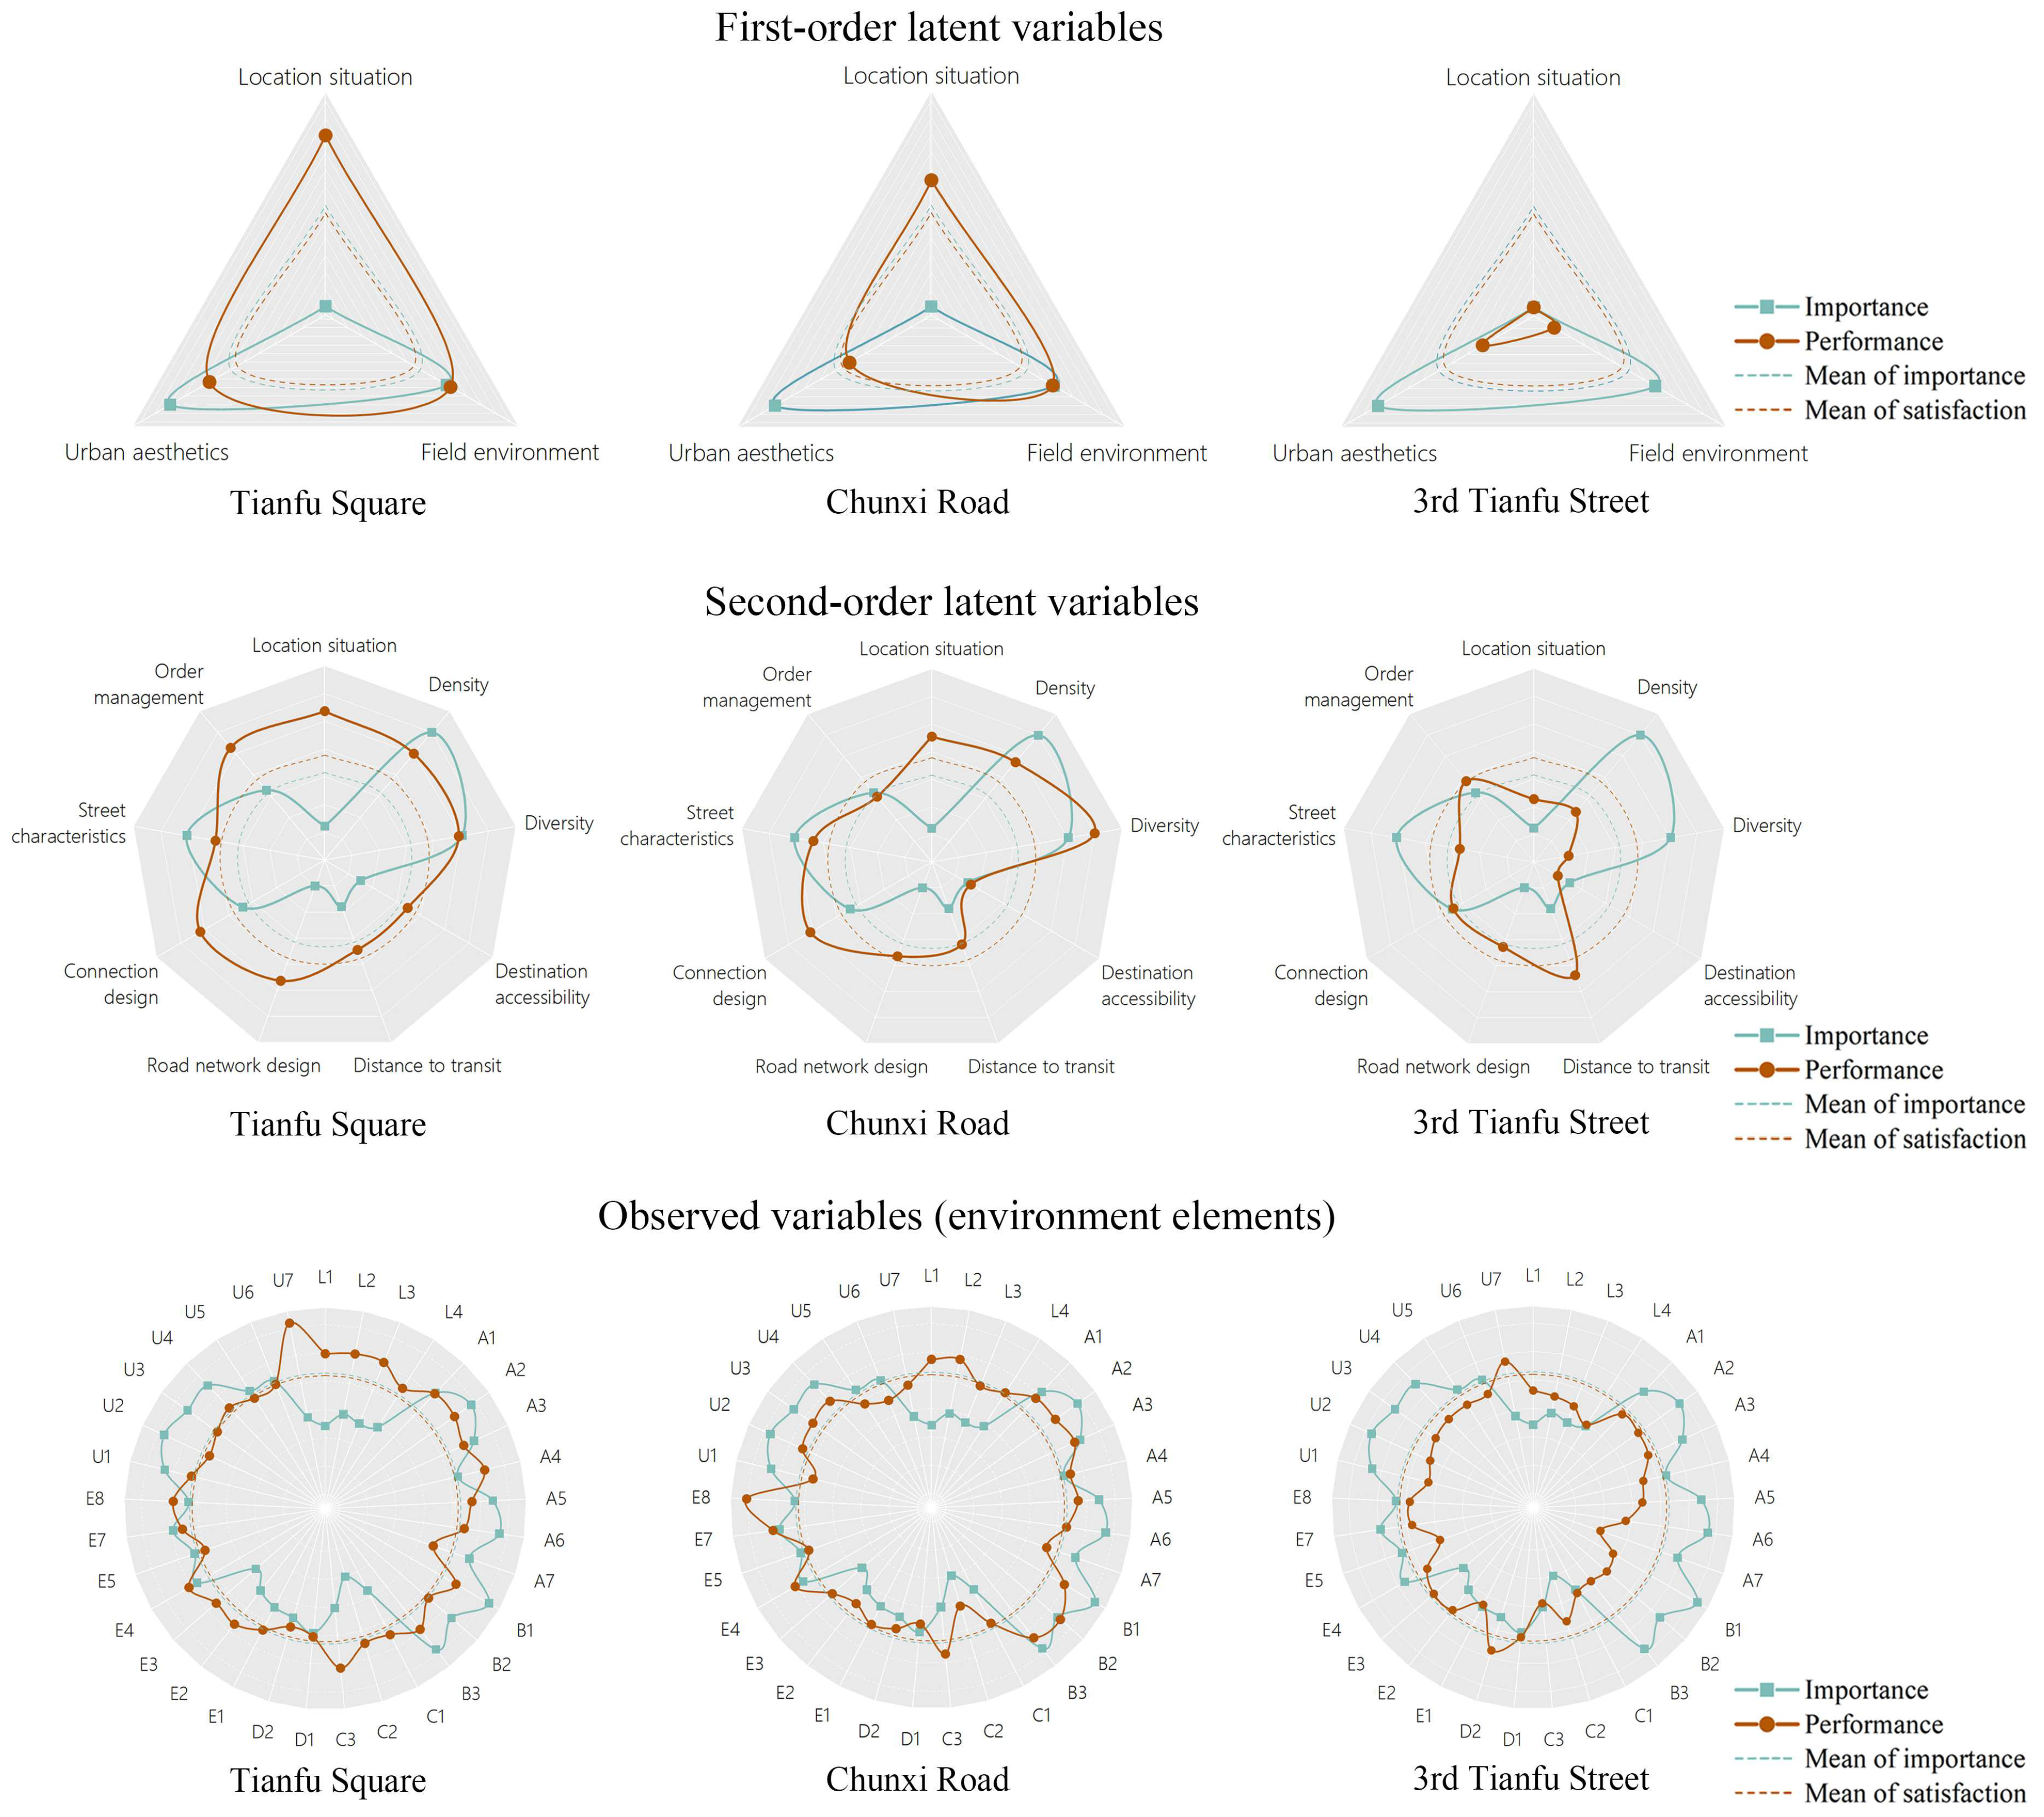
4.4. Importance–Performance Alignment

Figure 8 and Table 12 displays the IPA results. The values of the contribution of each element to perception and the satisfaction scores represent the importance and performance, respectively. Using the average values of all elements’ importance and performance as the thresholds, two dividing lines are drawn vertically and horizontally on the coordinates, categorizing the elements into four quadrants.
Quadrant I: The elements located in this area exhibit both high importance and high performance, indicating a well-aligned relationship between their perception influence and satisfaction situation. These elements represent significant strengths and are the primary contributors to users’ positive experiences within the catchment area. Notably, elements in this quadrant are predominantly found in Chunxi Road and Tianfu Square, accounting for 48.3% and 51.7%, respectively.
Quadrant II: The elements in quadrant II exhibit a stark mismatch between their high importance and their performance, which is notably low. These elements significantly influence user satisfaction but fail to receive the corresponding user praise, leading to a diminished user experience. Elements in this quadrant are predominantly found in 3rd Tianfu Street, accounting for 66.7%. Tianfu Square and Chunxi Road both accounted for 16.7%.
Quadrant III: The elements located in this area exhibit both low importance and low performance, indicating a matching relationship between their perceived influence and satisfaction levels. These elements have a minimal impact on user satisfaction, and their evaluations by users are correspondingly low. Elements in this quadrant are present across all three stations, with proportions of 50.0% at 3rd Tianfu Street, 40.1% at Chunxi Road, and 10.0% at Tianfu Square.
Quadrant IV: The elements located in this quadrant exhibit a mismatch between their importance and performance, with performance significantly exceeding importance. These elements have a minimal impact on user satisfaction, yet they receive disproportionately positive feedback from users. Elements in this quadrant are present across all three stations, with proportions of 64.7% at Tianfu Square, 23.5% at Chunxi Road, and 11.8% at 3rd Tianfu Street.
Figure 9 utilizes radar charts to illustrate the standardized comparison of the importance and performance of different level variables in each station area. These charts facilitate the easy identification of defect elements. An image is formed by connecting the importance and performance values of each area. The higher the resemblance in shape and area between the importance and performance representations, the greater the matching degree of the catchment area. Conversely, notable disparities in shape indicate potential design flaws within the catchment area. A performance graph area surpassing that of importance signifies inadequacy in the station area, prompting a need to “Concentrate here”, while an importance graph area exceeding that of performance suggests a potential “Possible overkill” in the area. Below, we elaborate the presentation results of latent variables and observed variables in the three CMSAs.
The radar charts of the first- and second-order latent variables and observed variables illustrate the overall and detailed situations of all station areas. The results indicate that the performance graphs of Tianfu Square and Chunxi Road stations both exceed their importance graphs, suggesting that overall input should be maintained or reduced. Conversely, the performance graphs of 3rd Tianfu Street are significantly lower than the importance graphs, indicating a need for further optimization and improvement. In the first-order latent variables, field environment and urban aesthetics are identified as variables with high perceptual influence. Correspondingly, in the second-order latent variables, density, diversity, connection design, street characteristics, and order management are recognized as having significant perceptual effects. At Tianfu Square station, these variables fall into the “high importance–high performance” category, suggesting that maintaining the status quo is appropriate. At Chunxi Road station, the first-order variable of urban aesthetics falls into the “high importance–low performance” unmatched category. A detailed analysis reveals that while street characteristics at Chunxi Road are excellent, the evaluation of order management is poor and requires improvement. In the 3rd Tianfu Street station area, two important first-order variables also fall into the “high importance–low performance” mismatch category. Among the second-order variables, only order management performs well, while the others perform poorly and need significant improvement.
The radar chart of observed variables can highlight specific environmental elements that need optimization. For example, at Chunxi Road station, the order management dimension includes U5 (street hygiene) and U6 (landscape maintenance), which are high-impact elements but exhibit low performance, categorizing them as “high importance–low performance” elements. There are more than two-thirds of such elements in the 3rd Tianfu Street station area. Improving these built elements will result in a noticeable enhancement in evaluations.

5. Discussion and Conclusions

5.1. Discussion

5.1.1. Field Environment

The field environment has the most significant direct effect on the satisfaction of the CMSA. Here, density, diversity, and connection design are the most important second-order latent variables. The density and diversity perception are related to the land use, while the connection design is the pedestrian planning and design with the metro entrance as the core. We discuss some of the key design points of land use and pedestrian design.
We listed a part of land use indicators for the three cases (Figure 10) and found that the apparent differences in density perception among the three stations are building height and open space. We infer that building height and open space can directly affect the user’s perception of density. Another noticeable difference is the proportion of commerce. 3rd Tianfu Street needs a higher proportion of commercial function, which may reduce the diversity of users’ activity choices. Based on the above analysis, we recommend the primary strategy to enhance land use satisfaction is to dispel the feeling of high-density development and increase the number of business-oriented functional types. High-density development does help improve land use efficiency and promote urban vitality; it is also considered a critical factor in the successful implementation of TOD, but a common problem central-type sites face is the poor sense of repression and congestion it brings [51]. One of the strategies to solve this problem is to appropriately add small-scale buildings in the station area so that the buildings have a difference of height and height. This strategy is conducive to creating a sparse and staggered urban spatial pattern in old cities and maximizing the agglomeration effect of land development [52]. Another suggestion is to increase the development area of the underground space and release the ground space, thus providing citizens with more open spaces like plazas and parks. Open space can also reduce the degree of interference between people and vehicles and enhance pedestrian safety and comfort.
In terms of diversity, a study showed that neighborhoods with a relatively higher land-use mix have a significantly positive association with walking activity [53]. In the planning concept of the “15 min city”, residents should be able to enjoy a higher quality of life within walking or cycling distance, where they can effectively fulfill six essential urban functions to sustain a decent urban life. These functions include living, working, commerce, healthcare, education, and entertainment [6]. These functions are integrated into TOD planning, expanding outward in concentric circles in decreasing order of economic value and development intensity, to enhance land-use diversity and the completeness of urban functions. Moreover, to maximize these benefits, diversity needs to be implemented at various scales within the city—not only at the urban level, across broader areas, but also at finer scales, such as at the building level.
A suggestion about pedestrian design is to strengthen the walking continuity and enrich the entrance’s form. The planning and design of a station play a significant role in the construction of the station area walking system [54]. For example, the distance to the entrance of Tianfu Square station is more than 380 m, crossing several main roads to achieve passenger–vehicle separation and providing a comfortable underground walking space in extreme weather. Its entrance and exit of Tianfu Square take the form of a sunken square (Figure 11a) to organize passenger flow into the subway station and the commercial complex built on the station. Chunxi Road features a metro entrance that connects directly to the underground of the commercial center (Figure 11b). These designs not only facilitate the management of pedestrian traffic and enhance the integration of the station with the city but also help regulate the microclimate at the metro station entrance [55]. The form of the subway entrance is also an essential factor. Subway stations are usually built underground without building facades, and entrances are vital nodes for users to recognize and remember environmental information. Li’s finding verifies that the traffic demand is the priority in the landscape design of the metro station entrance [56]. The entrances and exits of Chunxi Road adopt various forms of glass to give users a novel experience (Figure 11c). In conclusion, the planning of station entrances and exits should adopt a field-oriented approach, enhancing crowd diversion efficiency by integrating urban main roads and linking key areas and buildings. Additionally, the design of entrances and exits should be both memorable and aesthetically pleasing, while also reflecting the cultural characteristics of the city.

5.1.2. Urban Aesthetics

Urban aesthetics had the strongest influence on satisfaction because of its direct and indirect effects. Here, street characteristics are the dominant second-order variable. Color and culture are two important elements that shape street characteristics. In the cases we studied, we found that 3rd Tianfu Street Station is located in the city’s new district, which was completed in a short time, and the government uniformly planned the facade of the building. Therefore, it may lack characteristics compared to Tianfu Square, which has historical charm, and Chunxi Road, which has diversified colorful characteristics (Figure 12). The use of culture as a tool for urban regeneration is not recent; it has been used as a preferred concept to direct the revitalization of urban centers [57]. The color and form of architecture are the design methods that reflect a city’s culture. It is of contemporary significance to retain regional characteristics, stimulate emotional resonance, and enhance the readability of the city image by portraying the urban ethnic image.
Order management, as another second-order variable in urban aesthetics, is not more important than the average in our conclusion, but a variety of studies have shown that a clean, orderly, and safe environment is an essential condition of urban aesthetics and an important guarantee for citizens’ quality of life [58]. This means that order management is also an indispensable part of urban aesthetics. Street hygiene and the pruning of plants are two significant factors. Keeping the streets clean requires adding garbage disposal facilities and regularly cleaning the ground. Vegetation is another fundamental element of urban design. Trees provide the shade necessary to walk and stay in the streets during the day’s hottest hours. Also, vegetation has aesthetic qualities that are indispensable for the design of attractive and pleasing places [59]. The integration of the Smart City concept is also a key factor in improving management levels. For example, within the Smart City framework, factors such as inclusivity, resident participation, and real-time service delivery are promoted through various digital platforms [6].

5.1.3. Location Situation

The location situation does not have a direct impact on satisfaction, but it is not irrelevant. Instead, it indirectly influences satisfaction by affecting the field environment and urban aesthetics. The centers of new urban areas compete with the old urban centers, which tend to have better absolute geographical locations in the process of urban expansion [13]. It is worth noting that there is a negative correlation between location situation and urban aesthetics. For station areas with superior locations, which are more likely to represent the cultural and economic hubs of a city, people tend to have stricter evaluations of their urban aesthetics. From a psychological perspective, there is a tension between functionality and aesthetics. People typically expect high-density areas to not only fulfill basic functional needs but also provide a good visual and environmental experience.
Urban location is a multidimensional performance that is affected by natural and artificial urban areas [60]. Therefore, for stations located in less favorable areas, particularly in new districts, we recommend enhancing the relative centrality of the station area by increasing the number of subway lines at the central station of the new city and ensuring these lines traverse densely populated areas. These two strategies are also key components of our model findings. Studies indicated that increasing the number of subway lines at metro stations and enhancing transportation options to other central areas can improve urban compactness and promote more efficient living for residents [61,62]. There are many examples of urban planning in Japan that we can learn from, the construction goal of which is a “network compact city” [63].
It is worth noting that the relationship between the location situation and field environment is positively correlated, indicating that when the location situation is favorable, people tend to have a higher tolerance for the perceived aspects of the field environment. For instance, when a site is situated in a high-density development area, individuals are more accepting of crowded buildings and heavy pedestrian traffic. Conversely, the relationship between the location situation and urban aesthetics is negatively correlated. This can be understood as follows: These areas are typically located in the traditional center of the city or the old town, characterized by their mixed and chaotic streets. However, they often serve as urban public spaces characterized by gateway effects. People tend to apply more stringent evaluation criteria to these types of stations. Thus, evaluating the location situation provides insights into the design of the field environment and urban aesthetics. For stations with favorable location attributes, greater emphasis can be placed on the relationship between density, business type, and economic value, as people tend to be more accepting of these factors. Moreover, increased investment to enhance the beauty of the streets and elevate the overall image of the city is necessary.

5.2. Conclusions

This study explores the interaction between the built environment and public perception of CMSAs by combining SEM and IPA methods. The results revealed the effects of various variables (location, density, diversity, distance to transit, destination accessibility, road network, connection design, street characteristics, and order management) within the built environment (location, field environment, and urban aesthetics) on satisfaction. The main conclusions of the SEM model are as follows: First, perceptions of the field environment have a direct positive effect on satisfaction. Among these, density, diversity, and connection design are critical factors within the field environment dimension. Secondly, urban aesthetic perception directly affects satisfaction, with street characteristics being a critical factor. Thirdly, the location situation does not have a direct impact on satisfaction, but it indirectly influences satisfaction by positively affecting the field environment and negatively affecting urban aesthetics. Based on this, we used the value of the contribution of each element to perceived importance as the importance score, and the user satisfaction ratings of the elements as the performance score, to conduct an IPA analysis. We compared the importance and satisfaction alignment of various environmental elements across three sample CMSAs in Chengdu, and based on this, we proposed optimization suggestions.
This study aims to deeply understand the complex relationship between perceptions of the built environment and public satisfaction in the CMSAs. We provided an innovative approach to exploring environmental perception and assessing the effectiveness of the built environment. After the application of the proposed SEM-IPA model, the empirical results can provide valuable insights for urban designers and policymakers, as well as an empirical basis for the construction and renewal of central TOD in future cities.
This study has some limitations. Due to the limited sample size, sufficient data were not obtained for certain demographic characteristics, such as elderly individuals and children. Therefore, weight adjustments based on different sample proportions were not considered. In future research, we will aim to collect a broader range of samples using methods such as stratified sampling and targeted interviews with specific populations and further analyze whether significant differences in perceptions exist across various demographic groups.

Author Contributions

Conceptualization, J.M. and Z.S.; Investigation, Y.Z. and W.S.; Methodology, J.M. and P.L.; Software, J.M. and P.L.; Writing—Original Draft, J.M.; Writing—Review and Editing, Z.S., P.L. and Y.Z. All authors have read and agreed to the published version of the manuscript.

Funding

This research was funded by the National Natural Science Foundation of China [grant number 52378039 and 51978573].

Data Availability Statement

The data presented in this study are available on request from the corresponding author. The data are not publicly available due to privacy.

Acknowledgments

The authors wish to thank the people who filled out the survey in the study areas.

Conflicts of Interest

The authors declare no conflict of interest.

References

  1. Choi, K.; Park, H.J.; Uribe, F.A. The impact of light rail transit station area development on residential property values in Calgary, Canada: Focus on land use diversity and activity opportunities. Case Stud. Transp. Pol. 2023, 12, 100924. [Google Scholar] [CrossRef]
  2. Papa, E.; Bertolini, L. Accessibility and Transit-Oriented Development in European metropolitan areas. J. Transp. Geogr. 2015, 47, 70–83. [Google Scholar] [CrossRef]
  3. Vale, D.S. Transit-oriented development, integration of land use and transport, and pedestrian accessibility: Combining node-place model with pedestrian shed ratio to evaluate and classify station areas in Lisbon. J. Transp. Geogr. 2015, 45, 70–80. [Google Scholar] [CrossRef]
  4. Yang, L.; Chen, Y.; Xu, N.; Zhao, R.; Chau, K.W.; Hong, S. Place-varying impacts of urban rail transit on property prices in Shenzhen, China: Insights for value capture. Sustain. Cities Soc. 2020, 58, 102140. [Google Scholar] [CrossRef]
  5. Mocak, P.; Matlovicova, K.; Matlovic, R.; Penzes, J.; Pachura, P.; Mishra, P.K.; Kostilnikova, K.; Demkova, M. 15-minute city concept as a sustainable urban development alternative: A brief outline of conceptual frameworks and slovak cities as a case. Folia Geogr.-Slovak 2022, 64, 69–89. [Google Scholar]
  6. Moreno, C.; Allam, Z.; Chabaud, D.; Gall, C.; Pratlong, F. Introducing the “15-Minute City”: Sustainability, Resilience and Place Identity in Future Post-Pandemic Cities. Smart Cities 2021, 4, 93–111. [Google Scholar] [CrossRef]
  7. Mondschein, A.; Moga, S.T. New Directions in Cognitive-Environmental Research. J. Am. Plan. Assoc. 2018, 84, 263–275. [Google Scholar] [CrossRef]
  8. Gao, Y.; Chen, Y.Y.; Mu, L.; Gong, S.Z.; Zhang, P.C.; Liu, Y. Measuring urban sentiments from social media data: A dual-polarity metric approach. J. Geogr. Syst. 2022, 24, 199–221. [Google Scholar] [CrossRef]
  9. Olaru, D.; Curtis, C. Designing TOD precincts: Accessibility and travel patterns. Eur. J. Transp. Infrastruct. Res. 2015, 15, 6–26. [Google Scholar] [CrossRef]
  10. Gao, W.; Sun, X.L.; Zhao, M.; Gao, Y.; Ding, H.R. Evaluate Human Perception of the Built Environment in the Metro Station Area. Land 2024, 13, 90. [Google Scholar] [CrossRef]
  11. Li, C.N.; Lin, C.; Hsieh, T.K. TOD District Planning Based on Residents’ Perspectives. ISPRS Int. J. Geo-Inf. 2016, 5, 52. [Google Scholar] [CrossRef]
  12. Chen, T.; Chen, Y.; Zhou, Y.; Guo, J. Efficiency Assessment of Transit-Oriented Development Focusing on the 500-m Core Catchment of Metro Stations Based on the Concept of a Metro Microcenter in Beijing. J. Transp. Eng. A-Syst. 2023, 149, 04023117. [Google Scholar] [CrossRef]
  13. Ma, J.X.; Shen, Z.W.; Xie, Y.; Liang, P.P.; Yu, B.J.; Chen, L. Node-place model extended by system support: Evaluation and classification of metro station areas in Tianfu new area of Chengdu. Front. Environ. Sci. 2022, 10, 990416. [Google Scholar] [CrossRef]
  14. Wu, W.J.; Chen, W.Y.; Yun, Y.W.; Wang, F.L.; Gong, Z.Y. Urban greenness, mixed land-use, and life satisfaction: Evidence from residential locations and workplace settings in Beijing. Landsc. Urban Plan. 2022, 224, 104428. [Google Scholar] [CrossRef]
  15. Lee, K.Y. Relationship between Physical Environment Satisfaction, Neighborhood Satisfaction, and Quality of Life in Gyeonggi, Korea. Land 2021, 10, 663. [Google Scholar] [CrossRef]
  16. Bivina, G.R.; Gupta, A.; Parida, M. Walk Accessibility to Metro Stations: An analysis based on Meso- or Micro-scale Built Environment Factors. Sustain. Cities Soc. 2020, 55, 102047. [Google Scholar] [CrossRef]
  17. Yang, L.; Yang, H.; Tang, J.; Lu, Y.; Liu, J. Assessing attribute performance and older adults’ satisfaction with transit services: Implications for age-friendly planning. Travel. Behav. Soc. 2025, 40, 101026. [Google Scholar] [CrossRef]
  18. Cervero, R.; Sarmiento, O.L.; Jacoby, E.; Gomez, L.F.; Neiman, A. Influences of Built Environments on Walking and Cycling: Lessons from Bogota. Int. J. Sustain. Transp. 2009, 3, 203–226. [Google Scholar] [CrossRef]
  19. Banerjee, I. Production of Railwayscape in urban environment: Analysing railway heritage tourism potential in Siliguri City, India. Reg. Sustain. 2023, 4, 1–12. [Google Scholar] [CrossRef]
  20. Bertolini, L. Nodes and places: Complexities of railway station redevelopment. Eur. Plan. Stud. 1996, 4, 331–345. [Google Scholar] [CrossRef]
  21. Cao, Z.; Asakura, Y.; Tan, Z. Coordination between node, place, and ridership: Comparing three transit operators in Tokyo. Transp. Res. Part D Transp. Environ. 2020, 87, 102518. [Google Scholar] [CrossRef]
  22. Deng, X.D.; Zhang, J.; Liao, S.Y.; Zhong, C.J.; Gao, F.; Teng, L. Interactive Impacts of Built Environment Factors on Metro Ridership Using GeoDetector: From the Perspective of TOD. ISPRS Int. J. Geo-Inf. 2022, 11, 623. [Google Scholar] [CrossRef]
  23. Cao, J.; Ettema, D. Satisfaction with travel and residential self-selection: How do preferences moderate the impact of the Hiawatha Light Rail Transit line? J. Transp. Land. Use 2014, 7, 93–108. [Google Scholar] [CrossRef]
  24. Huang, X.; Yuan, W.; White, M.; Langenheim, N. A Parametric Framework to Assess Generative Urban Design Proposals for Transit-Oriented Development. Buildings 2022, 12, 1971. [Google Scholar] [CrossRef]
  25. Zhengyu, D.; Xuan, H.; Chuan, C. The Impacts of Urban Residential Location and Travel Behavior on Commuters’ Quality of Life: A Case Study of Shanghai, China. Mod. Urban Res. 2023, 88–93. [Google Scholar] [CrossRef]
  26. Junyan, Y.; Yi, S. Research on spatial location mechanism and layout methods of urban district-wide center. City Plan. Rev. 2018, 1, 43–51. [Google Scholar]
  27. Aghaabbasi, M.; Moeinaddini, M.; Shah, M.Z.; Asadi-Shekari, Z.; Kermani, M.A. Evaluating the capability of walkability audit tools for assessing sidewalks. Sustain. Cities Soc. 2018, 37, 475–484. [Google Scholar] [CrossRef]
  28. Lynch, K. Lynch Image of the City; The MIT Press: Cambridge, MA, USA, 1960. [Google Scholar]
  29. Cho, G.H.; Rodriguez, D. Location or design? Associations between neighbourhood location, built environment and walking. Urban Stud. 2015, 52, 1434–1453. [Google Scholar] [CrossRef]
  30. Yin, C.H.; Liu, Y.F.; Wei, X.J.; Chen, W.Q. Road Centrality and Urban Landscape Patterns in Wuhan City, China. J. Urban Plan. Dev. 2018, 144, 05018009. [Google Scholar] [CrossRef]
  31. Torquati, B.; Giacchè, G.; Tempesta, T. Landscapes and Services in Peri-Urban Areas and Choice of Housing Location: An Application of Discrete Choice Experiments. Land 2020, 9, 393. [Google Scholar] [CrossRef]
  32. Yang, L.; Wang, X.; Sun, G.; Li, Y. Modeling the perception of walking environmental quality in a traffic-free tourist destination. J. Travel. Tour. Mark. 2020, 37, 608–623. [Google Scholar] [CrossRef]
  33. Cetintahra, G.E.; Cubukcu, E. The influence of environmental aesthetics on economic value of housing: An empirical research on virtual environments. J. Hous. Built Environ. 2015, 30, 331–340. [Google Scholar] [CrossRef]
  34. Fu, Y.; Zhang, X.L. Trajectory of urban sustainability concepts: A 35-year bibliometric analysis. Cities 2017, 60, 113–123. [Google Scholar] [CrossRef]
  35. Julsrud, T.E.; Uteng, T.P. Technopolis, shared resources or controlled mobility? A net-based Delphi-study to explore visions of future urban daily mobility in Norway. Eur. J. Futures Res. 2015, 3, 1–13. [Google Scholar] [CrossRef]
  36. Allen, J.; Eboli, L.; Forciniti, C.; Mazzulla, G.; de Dios Ortuzar, J. The role of critical incidents and involvement in transit satisfaction and loyalty. Transp. Policy 2019, 75, 57–69. [Google Scholar] [CrossRef]
  37. Arbore, A.; Busacca, B. Rejuvenating importance-performance analysis. J. Serv. Manag. 2011, 22, 409–430. [Google Scholar] [CrossRef]
  38. Rasovska, I.; Kubickova, M.; Ryglova, K. Importance-performance analysis approach to destination management. Tour. Econ. 2021, 27, 777–794. [Google Scholar] [CrossRef]
  39. Ban, O.I.; Ban, A.I.; Tuşe, D.A. Importance–Performance Analysis by Fuzzy C-Means Algorithm. Expert. Syst. Appl. 2016, 50, 9–16. [Google Scholar] [CrossRef]
  40. Martilla, J.A.; James, J.C. Importance-performance analysis. J. Mark. 1977, 1, 77–79. [Google Scholar] [CrossRef]
  41. Kuby, M.; Barranda, A.; Upchurch, C. Factors influencing light-rail station boardings in the United States. Transp. Res. Part A Policy Pract. 2004, 38, 223–247. [Google Scholar] [CrossRef]
  42. O’Sullivan, S.; Morrall, J. Walking Distances to and from Light-Rail Transit Stations. Transp. Res. Rec. J. Transp. Res. Board. 1996, 1538, 19–26. [Google Scholar] [CrossRef]
  43. Field, A. Discovering Statistics Using SPSS for Windows: Advanced Techniques for Beginners; Springer: New York, NY, USA, 2000. [Google Scholar]
  44. Hair, J.; Black, W.; Babin, B.; Anderson, R. Multivariate Data Analysis; Prentice Hall: Upper Saddle River, NJ, USA, 2009. [Google Scholar]
  45. Wu, M. Questionnaire Statistical Analysis: SPSS Operation and Application; Chongqing University Press: Chongqing, China, 2010. [Google Scholar]
  46. Hair, J.; Black, W.; Babin, B.; Anderson, R. Multivariate Data Analysis, 6th ed.; Prentice Hall: Upper Saddle River, NJ, USA, 2006. [Google Scholar]
  47. Ong, A.K.S.; Prasetyo, Y.T.; Lagura, F.C.; Sigua, K.M.; Villas, J.A.; Nadlifatin, R.; Young, M.N.; Diaz, J.F.T. Determining tricycle service quality and satisfaction in the Philippine urban areas: A SERVQUAL approach. Cities 2023, 137, 104339. [Google Scholar] [CrossRef]
  48. Steiger, J.H. Understanding the limitations of global fit assessment in structural equation modeling. Personal. Individ. Differ. 2007, 42, 893–898. [Google Scholar] [CrossRef]
  49. Gefen, D.; Straub, D.W.; Boudreau, M. Structural Equation Modeling and Regression: Guidelines for Research Practice. Commun. Assoc. Inf. Syst. 2000, 4, 7. [Google Scholar] [CrossRef]
  50. Hair, J.F. Multivariate Data Analysis with Readings; Macmillan, Collier Macmillan: New York, NY, USA, 1987. [Google Scholar]
  51. Nematollahi, S.; Tiwari, R.; Hedgecock, D. Desirable Dense Neighbourhoods: An Environmental Psychological Approach for Understanding Community Resistance to Densification. Urban Policy Res. 2015, 34, 132–151. [Google Scholar] [CrossRef]
  52. Dai, P.; Fu, H.; Yang, X.X.; Han, S.; Fu, G.N.; Wang, Y.J. Exploring the urban renewal strategy based on transit-oriented development concept--A case study of Japan and Hong Kong. Front. Mater. 2023, 10, 1098027. [Google Scholar] [CrossRef]
  53. Sung, H.; Lee, S.; Jung, S. Identifying the relationship between the objectively measured built environment and walking activity in the high-density and transit-oriented city, Seoul, Korea. Environ. Plan. B-Plan. Des. 2014, 41, 637–660. [Google Scholar] [CrossRef]
  54. Liang, X.; Lu, Z.R.; Ye, F.; Zhang, W.J. Investigation of design of independent metro station entrances in China. Proc. Inst. Civ. Eng.-Munic. Eng. 2023, 176, 10–31. [Google Scholar] [CrossRef]
  55. Zhao, J.J.; Dong, J.K.; Zhang, X.H.; Na, Y.L.; Jiang, C.X.; He, F.; Cui, Q.J.; Liu, J. Field measurement of microclimate of sunken square and its effect on indoor environment of underground metro station in subtropical region. Build. Environ. 2023, 228, 109873. [Google Scholar] [CrossRef]
  56. Li, Z.; Lin, X.S.; Han, X.; Lu, X.Y.; Zhao, H.Y. Landscape Efficiency Assessment of Urban Subway Station Entrance Based on Structural Equation Model: Case Study of Main Urban Area of Nanjing. Buildings 2022, 12, 294. [Google Scholar] [CrossRef]
  57. Garza-Rodríguez, F. Identifying cultural clusters in Monterrey city center. A Case study. Contexto-Rev. Fac. Arq. 2019, 13, 41–56. [Google Scholar]
  58. Mateo-Babiano, I. Pedestrian’s needs matter: Examining Manila’s walking environment. Transp. Policy 2016, 45, 107–115. [Google Scholar] [CrossRef]
  59. Yang, L.; Yang, H.; Yu, B.; Lu, Y.; Cui, J.; Lin, D. Exploring non-linear and synergistic effects of green spaces on active travel using crowdsourced data and interpretable machine learning. Travel. Behav. Soc. 2024, 34, 100673. [Google Scholar] [CrossRef]
  60. Portnov, B.A.; Schwartz, M. On the Importance of the ‘Location Package’ for Urban Growth. Urban Stud. 2009, 46, 1665–1679. [Google Scholar] [CrossRef]
  61. Yang, L.; Lu, Y.; Cao, M.; Wang, R.; Chen, J. Assessing accessibility to peri-urban parks considering supply, demand, and traffic conditions. Landsc. Urban Plan. 2025, 257, 105313. [Google Scholar] [CrossRef]
  62. Peng, P.P.; Liu, Z.; Guo, J.H.; Wang, C. Dynamic Metro Stations Importance Evaluation Based on Network Topology and Real-Time Passenger Flows. Ksce J. Civ. Eng. 2023, 27, 4459–4471. [Google Scholar] [CrossRef]
  63. Liu, Q.; Qian, Z.; Lai, Y. Transit Oriented Shrinkage: Planning Methods of Location Optimization Plan in Japan from the Perspective of TOD. Urban. Plan. Int. 2023, 38, 112–122, 144. [Google Scholar]
Figure 1. Theoretical framework and hypothesis.
Land 14 01023 g001
Figure 2. Index average score and coefficient of variation of expert consultation.
Land 14 01023 g002
Figure 3. Importance–performance analysis [40].
Land 14 01023 g003
Figure 4. Study areas and questionnaire survey.
Land 14 01023 g004
Figure 5. Research process.
Land 14 01023 g005
Figure 6. The SEM for the perception of the CMSA.
Land 14 01023 g006
Figure 7. The adjusted final SEM for the perception of the CMSA.
Land 14 01023 g007
Figure 8. The matching relationship between the importance and performance of the environment element.
Land 14 01023 g008
Figure 9. Comparison of the importance and performance of first-order, second-order, and observed variables.
Land 14 01023 g009
Figure 10. The indicators of land use of three catchment areas.
Land 14 01023 g010
Figure 11. The station entrance design. (a) The open form entrance of Tianfu Square; (b) the entrance of Chunxi Road connects to the mall; (c) the artistic entrance of Chunxi Road.
Land 14 01023 g011
Figure 12. Street view of 3 catchment areas: (a)Tianfu Square; (b) Chunxi Road; (c) 3rd Tianfu Street.
Land 14 01023 g012
Table 1. Theoretical hypothesis.
HypothesisDescriptionReference
H1Field environment directly affects satisfaction[14,23,24]
H2Location situation directly affects satisfaction[25,26]
H3Urban aesthetics directly affects satisfaction[14,27,28]
H4Location situation affects field environment[29]
H5Location situation affects urban aesthetics[30,31]
H6Urban aesthetics affects field environment[32,33]
Table 2. Perception index of the built environment of the CMSA.
Dimension1st-Order Index2nd-Order Index
Location
Situation
/L1. Location in the city
L2. The rationality of subway line planning
L3. Number of subway lines
L4. Accessibility to other centers
Field
Environment
DensityA1. Development intensity
A2. Building volume
A3. Underground space development intensity
A4. Adequacy of open space
A5. Crowdedness
A6. Traffic jam
A7. The interference between people and vehicles
DiversityB1. Satisfaction of basic needs
B2. Adequacy of function selection
B3. The rationality of function ratio
Destination accessibilityC1. Accessibility of commercial facilities
C2. Accessibility of official facilities
C3. Accessibility of residential facilities
C4. Accessibility of public service facilities
Distance to transitD1. The convenience of the bus transfer
D2. The convenience of the bicycle transfer
DesignE1. Road connectivity
E2. Road directivity
E3. The convenience of getting to the destination
E4. Entrance quantity
E5. Entrance location
E6. Degree of difficulty of finding entrance
E7. Form of entrance
E8. Entrance connection with building
Urban
Aesthetics
/U1. Proportion and scale of the street
U2. Color and style of the street
U3. Street furniture
U4. Culture of the street
U5. Street hygiene
U6. Landscape maintenance
U7. Perceived safety
Table 3. Respondents’ characteristics.
Personal ParticularsItemPercent (%)Personal ParticularsItemPercent (%)
GenderMale47.29Purpose of visitTransfer1.65
Female52.71Shopping15.06
Age<3050.82Work33.65
≥3049.18Residence7.06
EducationSub-bachelor’s56.94Affairs32.94
Bachelor’s degree or above43.06Travel5.42
Professional relevanceUnrelated74.82Others4.22
Relevant25.18
Visiting frequency<2 times/month43.53
3–4 times/month33.88
Almost every day22.59
Table 4. Reliability analysis of latent variables.
Latent VariableCronbach’s AlphaLatent VariableCronbach’s Alpha
Location situation0.825Distance to transit0.835
Density0.872Design0.763
Diversity0.875Urban aesthetics0.801
Destination accessibility0.720Satisfaction0.858
Table 5. Results of KMO test and the Bartlett’s test of sphericity for the questionnaires.
KMO Measure of Sampling Adequacy0.847
Bartlett Test of SphericityApproximate Chi-Square6977.882
df561
Sig.0.000
Table 6. Total variance explained based on the field questionnaire.
FactorsTotal% of
Variance
Cumulative
%
Total% of
Variance
Cumulative
%
Total% of
Variance
Cumulative
%
17.43521.86721.8677.43521.86721.8674.20712.37212.372
23.58610.54732.4143.58610.54732.4143.0568.98721.359
32.5037.36239.7762.5037.36239.7762.9838.77330.133
42.1456.3146.0862.1456.3146.0862.6797.8838.013
51.8265.37151.4571.8265.37151.4572.4477.19745.21
61.7535.15756.6141.7535.15756.6142.2596.64451.853
71.6124.74161.3551.6124.74161.3552.0696.08657.94
81.3383.93765.2911.3383.93765.2911.9655.77863.718
91.2663.72369.0141.2663.72369.0141.8015.29769.014
Table 7. Factor analysis.
ComponentFactor Loading
1DensityA1/0.576A2/0.715A3/0.710A4/0.669
A5/0.761A6/0.806A7/0.728
2Connection designE4/0.797E5/0.806E7/0.857E8/0.830
3Location situationL1/0.783L2/0.796L3/0.830L4/0.795
4Urban characteristicsU1/0.823U2/0.859U3/0.837U4/0.842
5DiversityB1/0.762B2/0.801B3/0.814
6Order managementU5/0.845U6/0.830U7/0.737
7Road network designE1/0.859E2/0.879E3/0.838
8Destination accessibilityC1/0.804C2/0.732C4/0.781
9Distance to transitD1/0.871D2/0.859
Table 8. Model path coefficients and hypothesis results.
HypothesisPathC.R.Result
H1Field environment—>Satisfaction4.789 ***True
H2Location situation—>Satisfaction0.069False
H3Urban aesthetics—>Satisfaction3.242 **True
H4Location situation—>Field environment3.006 **True
H5Location situation—>Urban aesthetics−3.151 **True
H6Urban aesthetics—>Field environment2.932 **True
* denotes a p-value less than 0.05, ** denotes a p-value less than 0.01, and *** denotes a p-value less than 0.001.
Table 9. Fitness of the SEM.
Goodness of Fit MeasuresIFICFIGFIAGFIx2/dfRMSEA
Parameter estimates0.9490.9480.8900.8741.6540.039
Minimum cut-off>0.80>0.80>0.80>0.801~3<0.07
Table 10. AVE and CR scores.
Observed VariableLatent VariableEstimateAVECRObserved VariableLatent VariableEstimateAVECR
L4Location
Situation
0.7690.5420.827D2Distance to transit0.8140.7190.837
L30.736D10.881
L20.765E3Road network design0.7630.6980.873
L10.677E20.847
A7Density0.6670.4850.874E10.891
A60.758E7Connection design0.7810.6700.89
A50.726E60.865
A40.605E50.788
A30.709E40.836
A20.769U1Urban characteristics0.780.6430.878
A10.695U20.83
B3Diversity0.840.7010.876U30.796
B20.789U40.8
B10.881U5Order management0.8040.5320.769
C3Destination accessibility0.7580.4700.724U60.791
C20.576U70.569
C10.709
Table 11. Influence path analysis.
Independent VariableDependent VariableDirect EffectIndirect EffectTotal Effect
Field environmentSatisfaction0.399/0.399
Location situation/−0.023−0.023
Urban aesthetics0.3360.1260.462
Location situationField environment0.206−0.0720.134
Location situationUrban aesthetics−0.228/0.228
Urban aestheticsField environment0.316/0.316
Table 12. The distribution of elements in the IPA quadrants.
StationFirst QuadrantSecond QuadrantThird QuadrantFourth Quadrant
Tianfu SquareA1, A2, A3, A4, A5, A6, B1, B2, B3, E4, E6, E7, U1, U4, U6A7, E5, U2, U3, U5D1, D2L1, L2, L3, L4, C1, C2, C3, E1, E2, E3, U7
Chunxi RoadA1, A2, A3, A4, A5, A6, B1, B2, B3, E4, E6, E7, U2, U3, U4A7, E5, U1, U5, U6L3, C1, C2, D1, D2, E1, E2, E3L1, L2, L4, C3
3rd Tianfu Street/A1, A2, A3, A4, A5, A6, A7, B1, B2, B3, E4, E5, E6, E7, U1, U2, U3, U4, U5, U6L1, L2, L3, L4, C1, C2, C3, D1, E1, E2, E3D2, D7
Disclaimer/Publisher’s Note: The statements, opinions and data contained in all publications are solely those of the individual author(s) and contributor(s) and not of MDPI and/or the editor(s). MDPI and/or the editor(s) disclaim responsibility for any injury to people or property resulting from any ideas, methods, instructions or products referred to in the content.

