Article

Monitoring Fast-Growing Megacities in Emerging Countries Through the PS-InSAR Technique: The Case of Addis Ababa, Ethiopia

1
Entoto Observatory and Research Center (EORC), Space Science and Geospatial Institute (SSGI), 1000 Addis Ababa, Ethiopia
2
Department of Geosciences, University of Padua, Via Giovanni Gradenigo 6, 35131 Padua, Italy
*
Author to whom correspondence should be addressed.
Land 2025, 14(5), 1020; https://doi.org/10.3390/land14051020
Submission received: 11 March 2025 / Revised: 18 April 2025 / Accepted: 1 May 2025 / Published: 8 May 2025
(This article belongs to the Special Issue Assessing Land Subsidence Using Remote Sensing Data)

Abstract

:
In the past three decades, the city of Addis Ababa, a capital city of Africa, has grown significantly in population, facilities, and infrastructure. The area involved in the recent urbanization is prone to slow natural subsidence phenomena that can be accelerated due to anthropogenic factors such as groundwater overexploitation and loading of unconsolidated soils. The main aim of this study is to identify and monitor the areas most affected by subsidence in a context, such as that of many areas of emerging countries, characterized by the lack of geological and technical data. In these contexts, advanced remote sensing techniques can support the assessment of spatial and temporal patterns of ground instability phenomena, providing critical information on potential conditioning and triggering factors. In the case of subsidence, these factors may have a natural or anthropogenic origin or result from a combination of both. The increasing availability of SAR data acquired by the Sentinel-1 mission around the world and the refinement of processing techniques that have taken place in recent years allow one to identify and monitor the critical conditions deriving from the impressive recent expansion of megacities such as Addis Ababa. In this work, the Sentinel-1 SAR images from Oct 2014 to Jan 2021 were processed through the PS-InSAR technique, which allows us to estimate the deformations of the Earth’s surface with high precision, especially in urbanized areas. The obtained deformation velocity maps and displacement time series have been validated using accurate second-order geodetic control points and compared with the recent urbanization of the territory. The results demonstrate the presence of areas affected by a vertical rate of displacement of up to 21 mm/year and a maximum displacement of about 13.50 cm. These areas correspond to sectors that are most predisposed to subsidence phenomena due to the presence of recent alluvial deposits and have suffered greater anthropic pressure through the construction of new buildings and the exploitation of groundwater. Satellite interferometry techniques are confirmed to be a reliable tool for monitoring potentially dangerous geological processes, and in the case examined in this work, they represent the only way to verify the urbanized areas exposed to the risk of damage with great effectiveness and low cost, providing local authorities with crucial information on the priorities of intervention.

1. Introduction

Land subsidence refers to the downward displacement of the ground relative to a reference surface, such as the mean sea level or the ellipsoid. It encompasses both gradual down-warping and the sudden sinking of specific segments of the ground surface. Although the displacement is primarily downward, the concomitant horizontal deformation frequently causes severe damage [1]. Land subsidence in urban areas may be caused by excessive groundwater extraction, buildings and construction loads (i.e., settlement of high compressibility soils), natural consolidation of recent deposits, and tectonic activity. Groundwater extraction, driven by urbanization and population growth, is the primary cause of significant land subsidence in megacities such as Jakarta, Ho Chi Minh City, Bangkok, and numerous other coastal agglomerations [2]. The causes of ground deformation in the city of Addis Ababa (AA) are both natural and human-induced, with groundwater over-extraction, the huge amounts of construction and urbanization, and the influence of the Main Ethiopian Rift’s (MER) margin [3,4] being the main conditioning factors. Excessive groundwater extraction causes compaction of susceptible aquifer systems [1,5]. Civil buildings such as residential buildings, factories, highways, malls, hotels, and office buildings have sprouted all over the study area, causing unseen land subsidence [6,7,8]. Dynamic loads resulting from pile base construction and traffic loading frequently affect land subsidence. Moreover, several local faults and earthquakes that occurred in and around AA have potentially influenced the depth, orientation, and elongation of the area’s weak zone.
Satellite-based radar interferometry is a useful tool for detecting and monitoring ground deformation. Numerous studies have used radar interferometry in different fields, such as ground instabilities caused by landslides [9,10,11,12] and land subsidence due to groundwater extraction [13,14,15,16,17,18], mining [19,20,21], urban planning [22,23,24], seismology [25,26], volcanology [27,28], glaciology [29,30], and ground subsidence and uplift [31,32,33]. In particular, the evolution and rate of surface subsidence due to various factors were estimated by analyzing multiple space-borne Synthetic Aperture Radar (SAR) datasets with different spatial resolutions, revisiting times and acquisition geometries [34].
Permanent Scatterers-InSAR (PSI) techniques allow measuring the rate of displacements of the Earth’s surface over time with millimetric precision [35]. In the last two decades, the PSI and Differential Interferometric SAR (DInSAR) approaches have improved thanks to the large availability of C-band data acquired by ERS-1/2, RADARSAT-1/2, Envisat, and Sentinel-1 missions [36]. These satellite sensors have collected data over long periods, which is essential for long-term deformation monitoring. The C-band sensor onboard of Sentinel-1 satellite, which was launched on 3 April 2014, collects interferometric C-band SAR data and has a higher data collection capability than the prior C-band sensors onboard ERS-1/2, Envisat, and RADARSAT satellites. Sentinel-1 acquires images covering 250 by 180 km with a 12day revisiting cycle (IW Swath) in its regular data-collection mode. The large area coverage and free availability of Sentinel-1 data are important and cost-effective for wide-area monitoring compared to other commercial datasets like COSMO-SkyMed and TerraSAR-X.
The PSI approach involves three key steps: (1) PS identification through coherence analysis, where temporal coherence assesses signal stability over time [37] and spatial coherence evaluates neighboring pixels [38]; (2) phase unwrapping, employing techniques such as the branch-cut method [39] or minimum cost flow method [40] to resolve phase ambiguities; and (3) time-series analysis, utilizing least squares estimation [41] or Kalman filtering [42] to derive deformation trends. These methods enhance the accuracy of subsidence monitoring, tectonic studies, and infrastructure stability assessments, making PSI a primary tool in geodetic remote sensing.
The spatial–temporal pattern, rate, and mechanism of land subsidence in AA have not been well studied yet. There are only a few studies that assessed earthquakes in the Afar region [43,44], the landslide in Gidole [45], and land deformation due to magmatic movement in Corbetti, Aluto, Bora, and Haledebi [46] using InSAR data in Ethiopia. However, none have systematically addressed dynamics of subsidence in AA’s unique geological and urbanization context. This gap hampers evidence-based urban management in a city undergoing unprecedented infrastructure development amid geomorphological instability. This research aims to assess land subsidence, spatial patterns, and determine the amplitude displacement for identifying and monitoring the most affected areas in AA, Ethiopia, using the PSI technique. This study is particularly useful for emerging countries like Ethiopia, where the use of InSAR for land subsidence assessment is rare and the availability of geological and technical data is very limited. AA is facing exceptional sprawl urbanization with huge infrastructures and constructions in a dynamic geological and geomorphological context; therefore, there is a need for more effective city planning tools.
The integration of Persistent Scatterer Interferometry (PSI) with geospatial analyses of urbanization patterns and geological fault maps directly addresses the need to identify causal factors, such as groundwater depletion versus construction-induced loading [47]. By correlating ground displacement data with infrastructure density and aquifer stress zones, this approach enhances understanding of anthropogenic versus natural drivers of subsidence, a critical gap in the existing literature. Furthermore, the high spatial resolution of Sentinel-1 (Interferometric Wide Swath mode) enables localized risk assessments, facilitating the identification of subsidence hotspots in proximity to critical infrastructure, an essential input for urban planners in AA.
This study represents the first application of PSI approaches to land subsidence in Ethiopia, offering a replicable framework for other low-data environments. The findings aim to inform adaptive urban planning in AA, where unchecked construction and groundwater reliance intersect with active tectonics, creating urgent demands for risk mitigation strategies. This research directly addresses AA’s urgent need for science-based urban resilience strategies, bridging the gap between geotechnical data scarcity and rapid infrastructural development in seismically active regions.
High-resolution maps of land subsidence rates and spatial patterns in AA have been generated, identifying hotspots where displacement exceeds 5–10 mm/year. By correlating these patterns with urban infrastructure density, groundwater extraction zones, and fault systems, this research clarifies whether subsidence is dominantly driven by anthropogenic activities (e.g., construction loads or aquifer depletion) or tectonic processes. This distinction is critical for seismic risk assessment, as subsidence in tectonically active regions like the MER margin can amplify ground instability during earthquakes, increasing vulnerability to infrastructure collapse.
The key contributions of this work to risk mitigation are summarized as follows:
  • Seismic Risk: Subsidence maps refine seismic hazard models by identifying overlaps with faults or liquefaction-prone zones, guiding retrofitting of critical infrastructure.
  • Urban Planning: Results support zoning policies that limit high-density construction in subsidence-prone areas, reducing future damage.
  • Groundwater Management: If linked to subsidence, findings can inform regulations on extraction and promote alternative water sources.
  • Early Warning: Sentinel-1 displacement trends enable predictive models for gradual subsidence, supporting timely interventions.
  • Scalable Model: The PSI-based method offers a low-cost, replicable framework for monitoring in data-scarce cities across the Global South.

2. Materials and Methods
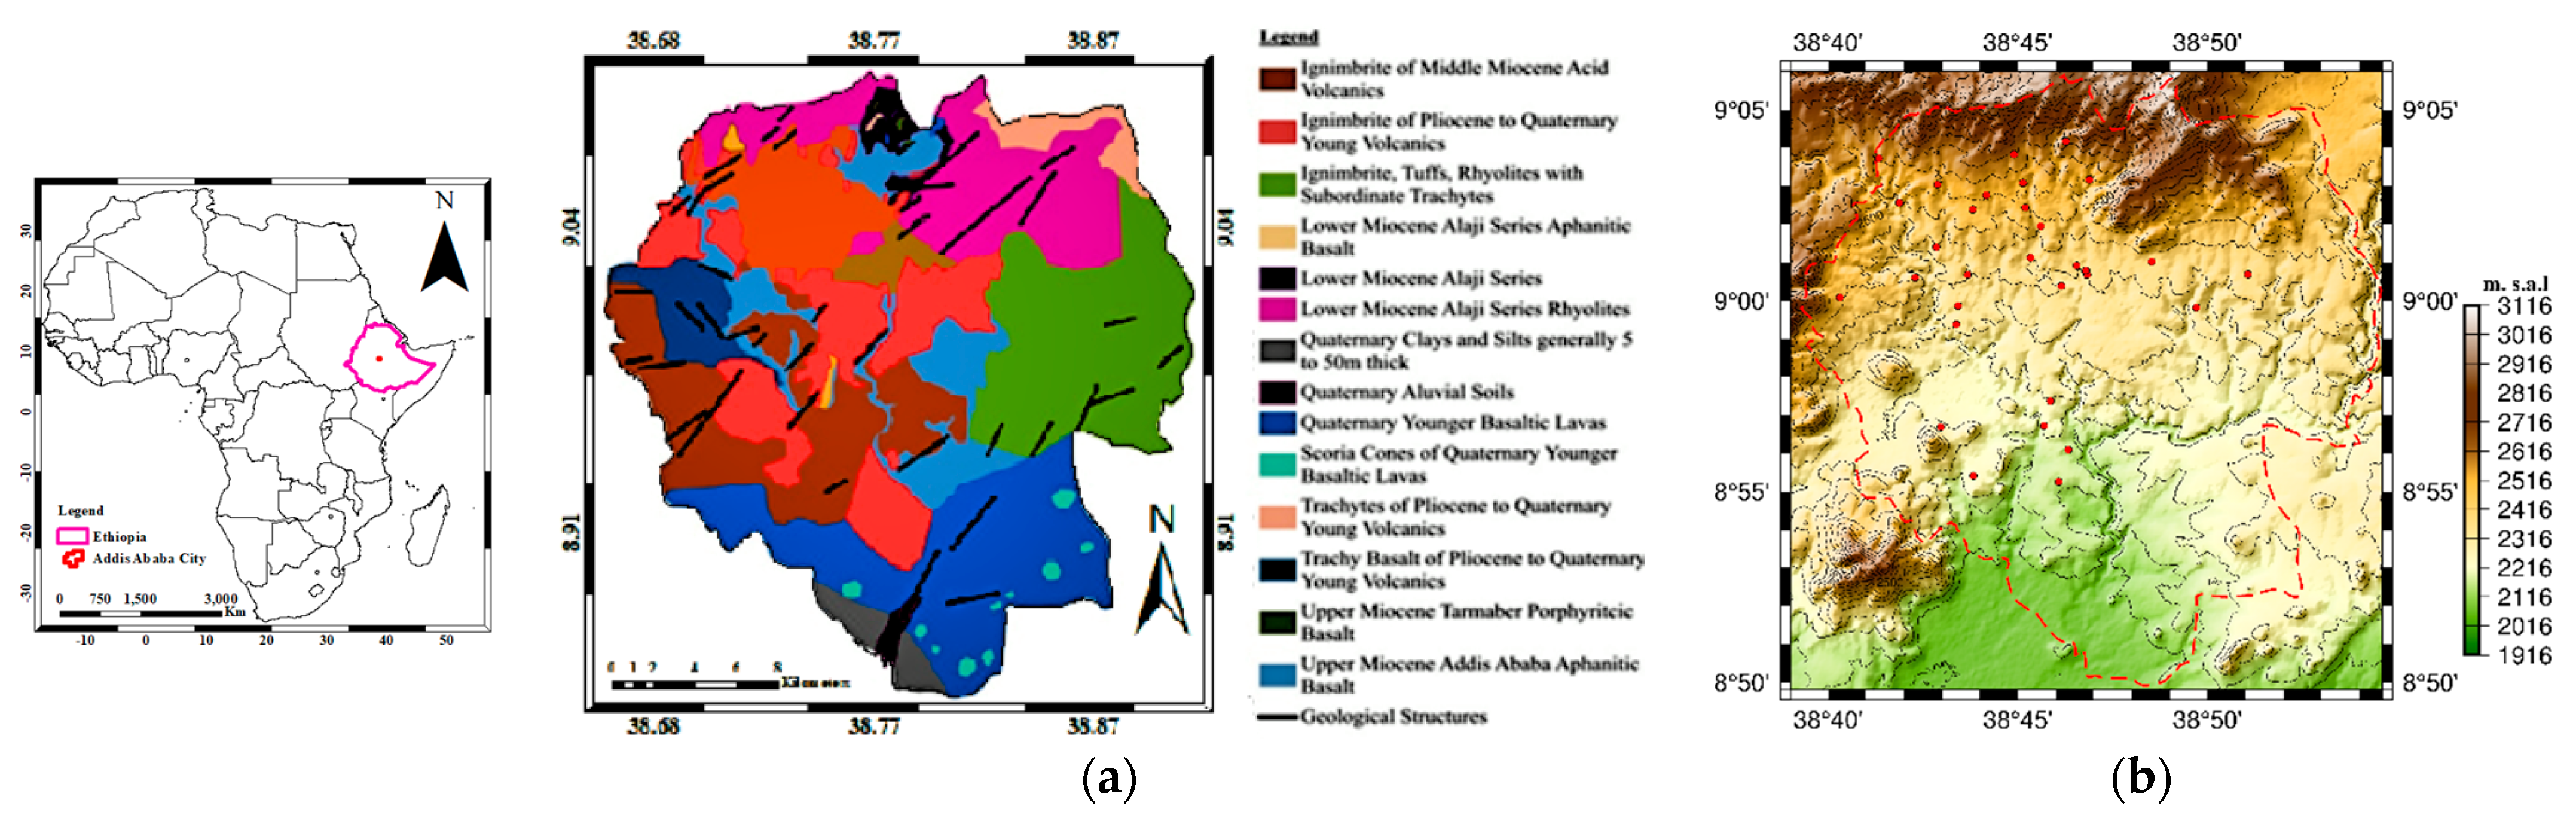
2.1. Study Area

The study area is roughly bounded by latitudes 8.830 N and 9.100 N, and longitudes 38.650 E and 38.910 E, with an approximate area of 1400 km2 (Figure 1a). The elevation of AA ranges from over 3000 m at the Entoto Mountain in the north to 1916 m in the southern periphery around the Akaki-Kality area, with an average elevation of 2355 m. The area is situated at the crossroads of the Ethiopian plateau and the northern portion of MER. As a result, both the plateau volcanic cover and rift-related volcanic sequences are present. The Oligo-Miocene plateau unit (Tarmaber and Alaji units-basalts, rhyolites, and trachytes), Miocene rift shoulder basalts, ignimbrites, rhyolites, and quaternary basalts, as well as alluvial-lacustrine sediments, are the dominant geological units of the area (Figure 1b) [48]. The main soil types in the study area include pellic vertisol, vertic cambisol, orthic solonchaks, leptosols, euthric nitisols, chromic vertisols, chromic luvisols, and calcic xerosols, with pellic vertisols being the dominant type (Figure 2). The thickness of the soil ranges from 1 m in the northern mountainous areas (i.e., Gulele, Yeka, Wechecha, and Furi), to 40 m in the southern part of AA (i.e., Lebu and Jemmo) [49].
The climate in AA is mild and temperate, where the summer receives more substantial rainfall than the winter. The mean annual precipitation of the study area is 1874 mm, while the mean daily temperature is 15.6 °C [50].
Recent studies highlight alarming groundwater depletion in Addis Ababa, with direct implications for land subsidence. Satellite data from [51] reveals a significant decline in groundwater storage in the Upper Awash Basin, driven by urban expansion and over-extraction. Hydrogeological modeling by [52] shows that extraction rates exceed natural recharge by 40%, leading to annual water table declines of 1.5–2 m. This unsustainable depletion is further exacerbated by unregulated private wells and industrial usage, as reflected in field reports of dried-up wells (250–500 m deep) in Akaki-Kality [53]. Another study [33] confirms the trend of declining groundwater levels, but does not address subsidence, a critical oversight, considering that over-pumped aquifers often result in ground sinking. These data underscore the urgent need for integrated groundwater management and subsidence monitoring. Unchecked extraction not only jeopardizes water security, but also accelerates infrastructure damage due to subsidence, calling for immediate regulatory measures under Ethiopia’s new water policy framework.
The continuous demand for water resources and land consumption in AA is closely connected with the expansion of the urbanized area after a strong increase in population in recent years. Between 2014 and 2021, the population increased by about 1,300,000 individuals, with an annual growth rate of 4.35% (Table 1). The increase in population and the expansion of the urbanized area are the factors that have led to an exceptional increase in anthropogenic pressure on the territory and, consequently, the acceleration of instability phenomena.

2.2. Interferometric Data and Processing Approach

2.2.1. Ground and Satellite Data

Currently, SAR satellite data are collected by several missions: COSMO-SkyMed constellation (X-band), TerraSAR-X (X-band), Sentinel-1 A/B (C-band), RADARSAT-2 (C-band), and ALOS-2 (C- and L-bands). Each band has its own characteristics and applications [55,56,57]:
  • C-band. This band operates at wavelengths around 5.6 cm and is suitable for a wide range of applications due to its balanced performance in terms of spatial resolution and penetration capability. It offers moderate resolution and can penetrate vegetation to some extent, making it useful for monitoring agriculture, forestry, and land cover changes.
  • X-band. With shorter wavelengths around 3 cm, X-band SAR data provide high spatial resolution imagery. This band is particularly beneficial for applications requiring fine details, such as urban monitoring, infrastructure analysis, and disaster management. However, X-band SAR has limited penetration capabilities compared to lower frequency bands.
  • L-band. L-band SAR data operate at longer wavelengths (around 23.6 cm). They offer excellent penetration capabilities through vegetation and soil, making them valuable for applications like forest monitoring, agriculture, and subsidence monitoring. Although L-band SAR provides coarser spatial resolution compared to X-band, its ability to penetrate through vegetation can be advantageous for certain applications.
In summary, the choice of SAR frequency band depends on the specific application requirements, with C-band offering a balance between resolution and penetration, X-band providing high-resolution imagery, and L-band excelling in penetration through vegetation and soil.
The data-gathering strategies of the missions, such as regular acquisition over a defined area versus on-demand acquisitions, have an impact on data availability, which is highly inconsistent around the world. In the case of AA, Sentinel-1A SAR data are the only freely available data from Oct 2014. Accordingly, in this study, 146 Sentinel-1A images acquired in the C-band with vertical co-polarization (VV) and in descending geometry (Path 79) were considered. Sentinel-1A images were acquired from 23 October 2014 to 31 January 2021, using the interferometric broad-swath mode with a 12-day revisiting period, a look angle of ~39.0°, and a ground resolution of ~15 m by using a multi-look of 4 to 1 in range and azimuth directions.
The ground-based data currently available consist of high-precision levelling and Continuous Global Positioning System (CGPS) measurements gathered by the Space Science and Geospatial Institute (SSGI). The positions of the calculated benchmarks and the CGPS stations (Figure 1a) are used as ground control points (GCPs) to validate the InSAR results. The GCPs were established between 16 May and 7 December 2018; they are second-order control points with an accuracy of 10–20 cm, and the measurements collected until 2021 indicate that they are placed in stable areas.

2.2.2. PSI Technique

PSI is a powerful remote sensing-based technique able to measure and monitor displacements of the Earth’s surface over time with millimetric precision. Together with SBAS-InSAR [58], PSI represents one of the main multi-temporal interferometric synthetic aperture radar (MT-InSAR) approaches. Proposed by [35], it requires at least 20 SAR images to perform the analysis using the C-band data [59]. The surface deformation over months or years can be estimated by removing the effects of atmosphere, topography, and signal noise. The potential of the PSI technique to assess land subsidence, especially in urban areas, has been reported in numerous studies [60,61,62,63,64].
The performance of PSI in estimating the deformation velocity and displacement time series depends on the number of images. The higher the number of images used, the higher the quality and reliability of the result [65,66]. The PSI technique uses time-series radar images to find possible deformation measurement points in the area of interest. It is a more advanced version of the traditional InSAR and allows us to overcome the issues of temporal and geometrical decorrelations [67]. A primary image is selected based on the geometry of the other images in order to maintain a high coherence and minimal atmospheric disturbance. The remaining images, known as secondaries, are co-registered with the primary. After the images have been co-registered, a series of interferograms is developed using the most precise orbit information available. Possible persistent scatterer (PS) points are determined by evaluating interferometric phase differences over time. Finally, because of their associated phase activity over time, natural reflectors in SAR images are detected as temporally coherent. The technique then estimates the displacement of each PS point.
The interferogram is the key product generated during the processing of SAR data using InSAR techniques. InSAR involves the comparison of two or more SAR images of the same area acquired at different times to detect ground surface displacements with high precision. To this end, SAR images are co-registered to ensure precise alignment. Then, the phase difference between the corresponding pixels in the two images is calculated. This phase difference is caused by changes in the distance traveled by the radar signal between the two acquisitions, which in turn is influenced by ground surface movements. The phase difference calculated for each pixel is represented as a color-coded or grayscale image, known as an interferogram. Each pixel in the interferogram corresponds to a specific location on the ground, and the phase difference indicates the amount of ground displacement along the radar line-of-sight direction. Interferograms are analyzed to identify areas of ground deformation, such as subsidence, uplift, or lateral movement. By interpreting the fringe patterns in the interferogram, scientists can determine the magnitude and spatial extent of the surface deformation.
All interferograms generated by the PS algorithm are formed on the primary image, which means that for 146 SAR images, 145 interferograms were obtained. To begin the PSI process employed in this study, a collection of 146 images and a redundant network of interferograms were used. The primary processing steps include the estimation and removal of the atmospheric phase screen (APS), the estimation of the deformation rate and residual topographic error (RTE), and the removal of RTE [68].
For the full-resolution datasets, over half a million point targets were obtained, a fact that poses some difficulties in handling the dataset for post-analysis purposes. The average spatial coherence threshold used was 0.75, which is quite a restrictive value that has been chosen due to the small multi-look factor. The density of the PS was 645 points/km2, which is a relatively good value for the C-band data, but it is limited to urbanized sectors. No prevalent phase-coherent radar targets were detected in vegetated areas, as coherence is almost completely lost due to temporal decorrelation.
PSI deformation measurements refer to the line-of-sight (LOS) of the SAR sensor, i.e., the line that connects the sensor and the target. Based on the incidence and azimuth angles, the vertical displacement has been calculated from the LOS deformation rate derived by the images acquired in descending orbits. To fully determine the 3D components (vertical, east-to-west, and north-to-south) of the deformation, images acquired both in ascending and descending orbits are required [69]. The SAR satellite image geometry along the descending orbits and the relation between the LOS displacement and vertical deformation are mathematically expressed using Equation (1). For a ground target, the LOS displacement rate D can be represented as a function of the 3D motion rates and the SAR imaging angular parameters:
D = d v cos θ d e cos φ sin θ + d n sin φ sin θ
where dv, de, and dn are the vertical, east-west (E-W), and north-south (N-S) displacements at a target, respectively; θ is the radar incidence angle; and φ is the azimuth angle (measured clockwise from the north) of the satellite flight direction along the descending orbit. According to Equation (1), the sensitivities of a SAR system to 3D motion components can be expressed by the partial derivatives, i.e.,
D d v = cos θ ;   D d e = cos φ sin θ ;   D d n = sin φ sin θ
This study determined only the maximum displacement rate in the vertical direction using the two angles and the displacement rate in the LOS direction. The 3D decomposition has not been done because the number of images in ascending orbit is very small and cannot be processed using PSI. In our opinion, investigating subsidence in the vertical component is enough and can be calculated using one orbit.
Vertical PS velocity maps and displacement time series were calculated through the PSI processing. The results were compared with the main geological characteristics of the area and the change in land cover in order to verify the relationships between subsidence phenomena and the rapid and extensive increase in anthropic pressure over the last 20 years.

2.2.3. PSI Workflow Diagram

A pixel is defined as PS if the phase of the pixel is dominated by a stable scatterer. The authors of [35] presented an index called the amplitude dispersion index (ADI) that can be employed as an estimation for the phase stability in scatterers with high values of the Signal-to-Noise ratio (SNR). In this method, a low value of ADI, e.g., 0.4, is selected as the threshold, and pixels with an ADI value higher than the threshold are candidates for PS [35]. The main steps of processing are the following (Figure 3):
  • Generation of a connection graph;
  • Definition of the area of interest;
  • Interferometric Workflow: co-registration, creation and flattening of interferograms, and development of mean power image and amplitude dispersion index (MuSigma) (input: DEM and GCPs);
  • Inversion First Step: estimation of coherence, velocity, and residual topography;
  • Second Inversion Step: elimination of atmosphere patterns, estimation of coherence, velocity, and residual topography, and estimation of displacement component (input: GCPs);
  • Geocoding: velocity, precision result geocoding, and displacement geocoding (input: DEM).

3. Results

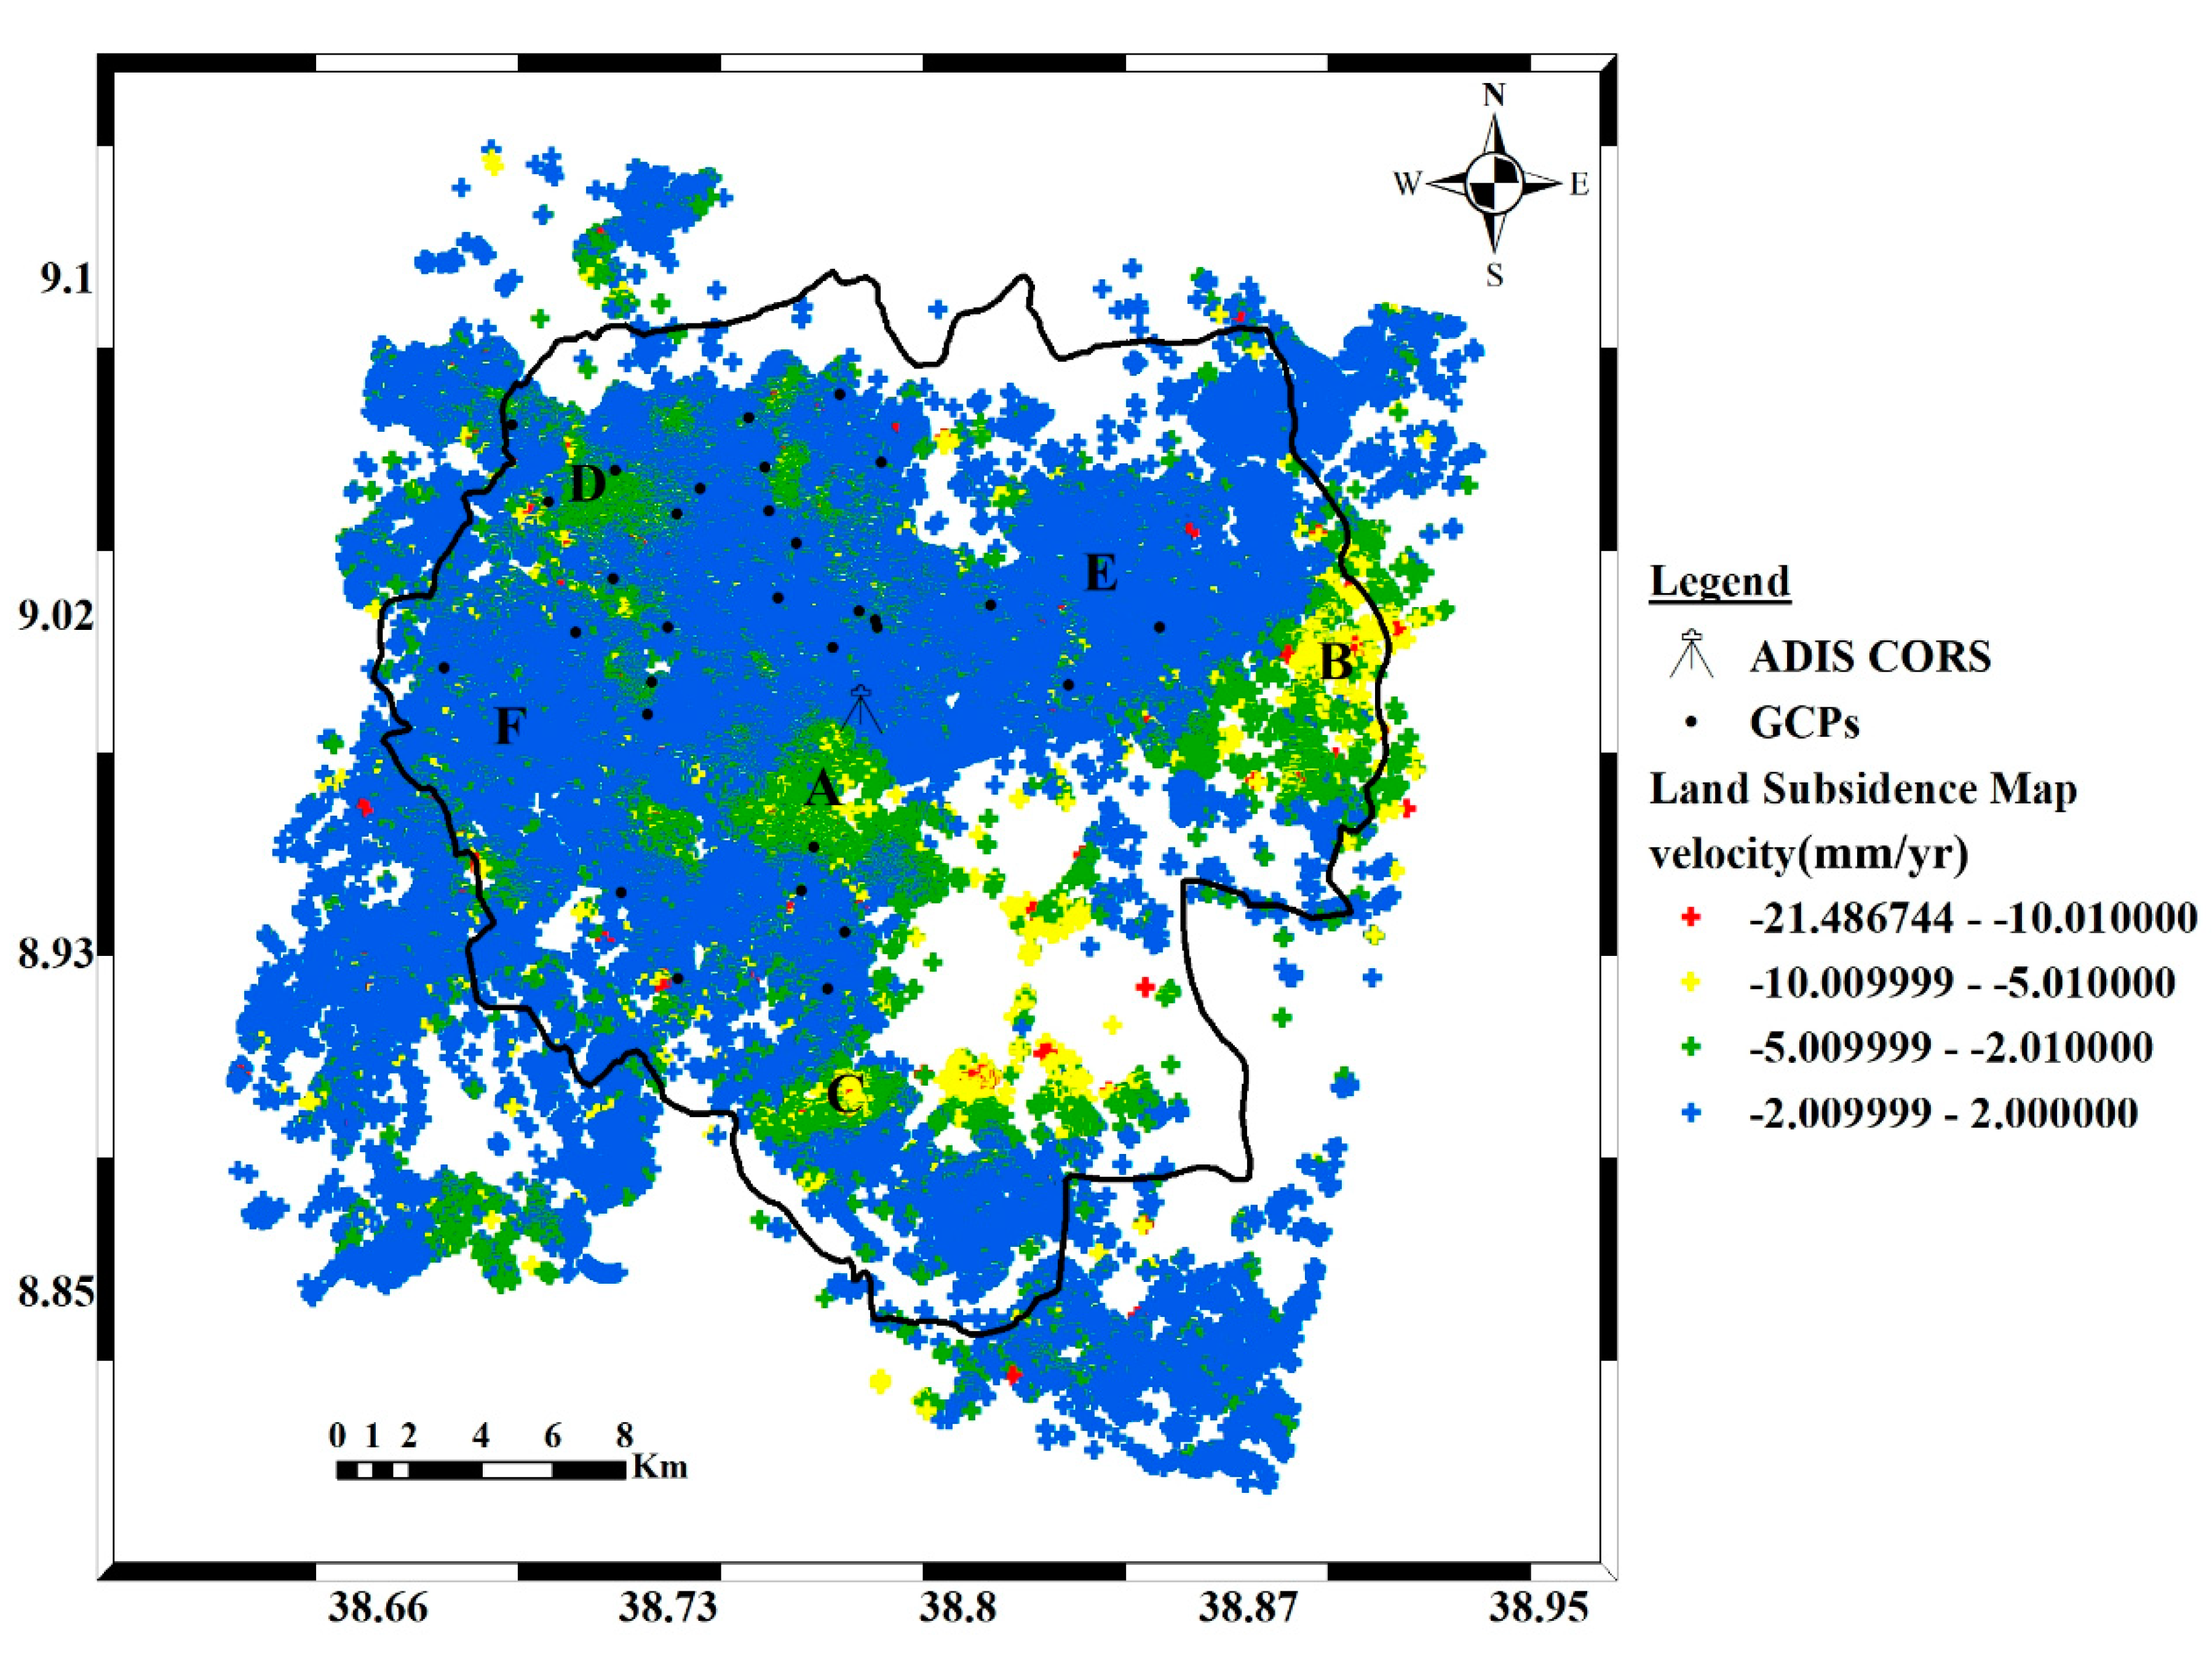
3.1. PS Velocity Map

The vertical velocity map derived by the PSI processing of Sentinel 1 images acquired in descending orbit is shown in Figure 4. Displacement rates range from −21.5 to 2.0 mm/year: the average vertical displacement rate of AA is 0.6 mm/year, with a standard deviation of the accumulated vertical displacement rate of 1.7 mm/year. Points with a velocity between −2.00 and 2.00 mm/year are considered stable, positive values indicate upward movement of the land (uplift), and negative values indicate downward movement (subsidence). As can be seen in Figure 4, the GCPs, which have measured no displacements in the period 2014–2021, fall in areas estimated as stable, confirming the correctness of interferometry processing. The higher deformation velocities (i.e., high land subsidence) were observed in the Bole-Saris (A), Ayat-Arabsa (B), Akaki-Kality (C), and Atena-Tera (D) districts. Bole-Saris is the largest unstable area, hosting huge buildings and the main commercial district of the city. Various wall and road cracks, as well as small sinkholes, were observed in this area during field observations. The highest displacement was observed in Ayat-Arabsa, located in the eastern part of the city, where agricultural land has been transformed into the city’s newest residential and largest industrial area, hosting large manufacturing plants such as the Bole-Lemi Industrial Park. Akaki-Kality is the city’s oldest area and is undergoing rapid economic growth, featuring large buildings and major factories such as the Kaliti Food Share Company. Atena-Tera is located on the west side of the city and has the highest residential density. In this area, damage to walls and roads was observed during on-site inspections. Interestingly, all these areas are distributed across the central zone and the outskirts of the city. The remaining unstable areas shown in Figure 4 are smaller and present a slower displacement rate (less than −7.5 mm/year). Most of the old villages such as Kotebe (E) and Kolfe-Keraniyo (F) seem relatively stable, with displacement values ranging between −2 and 2 mm/year. No damages attributable to land subsidence were observed in these areas during the field visits, except for a few cracks in the buildings and roads.
The city of AA has expanded at an impressive rate during the last 30 years (Figure 5): the expansion occurred mainly from the east to the southwest directions and was higher in the period between 2010 and 2020 (Table 2 and Table 3). The comparison between Figure 4 and Figure 5 shows that a high rate of subsidence is affecting the high-rise building area of Bole-Saris and the new highly urbanized of Ayat-Arabsa, Akaki-Kality, and Atena-Tera. The old city area (i.e., the Kotebe and Kolfe-Keraniyo districts), which has not experienced the development of new buildings, appears stable.
The rates of subsidence in the Bole-Saris, Ayat-Arabsa and Akaki-Kality areas have increased over time (Figure 4). These areas are associated with highly urbanized areas located in the center of the Ayat and Akaki-Kality villages (Figure 5). Particularly, since 2015, these sectors have undergone intense urbanization through the construction of new residential buildings and malls, and most of the subsiding areas are in correspondence of these new settlements and high-rise building zones. However, a small portion of the old city is affected by subsidence, mainly due to soil compaction and groundwater exploitation for potable water in response to urbanization and increasing population. The most affected areas (i.e., A, B, C, and D shown in Figure 4) are characterized by tall buildings, dense road networks, and very thick compressible soil layers. For example, the thickness of the topsoil in the Bole-Saris (A), Ayat-Arabsa (B), Akaki-Kality (C), and Atena-Tera (D) areas are 6–18 m, 12–14 m, 6–10 m, and 20–40 m, respectively. On the other hand, the thickness of soil in Kotebe (E) and Kolfe-Keraniyo (F) is very thin (about 1 m); in addition, these areas have been subjected to a lower anthropic pressure increase, so, as a result, they are stable.
Observing changes in land cover over time can offer insights into the primary causes of subsidence in AA. Figure 6A–D illustrates the evolution of land cover and displacements from 2014 to 2021 in the most critical areas identified through interferometric analysis.
-
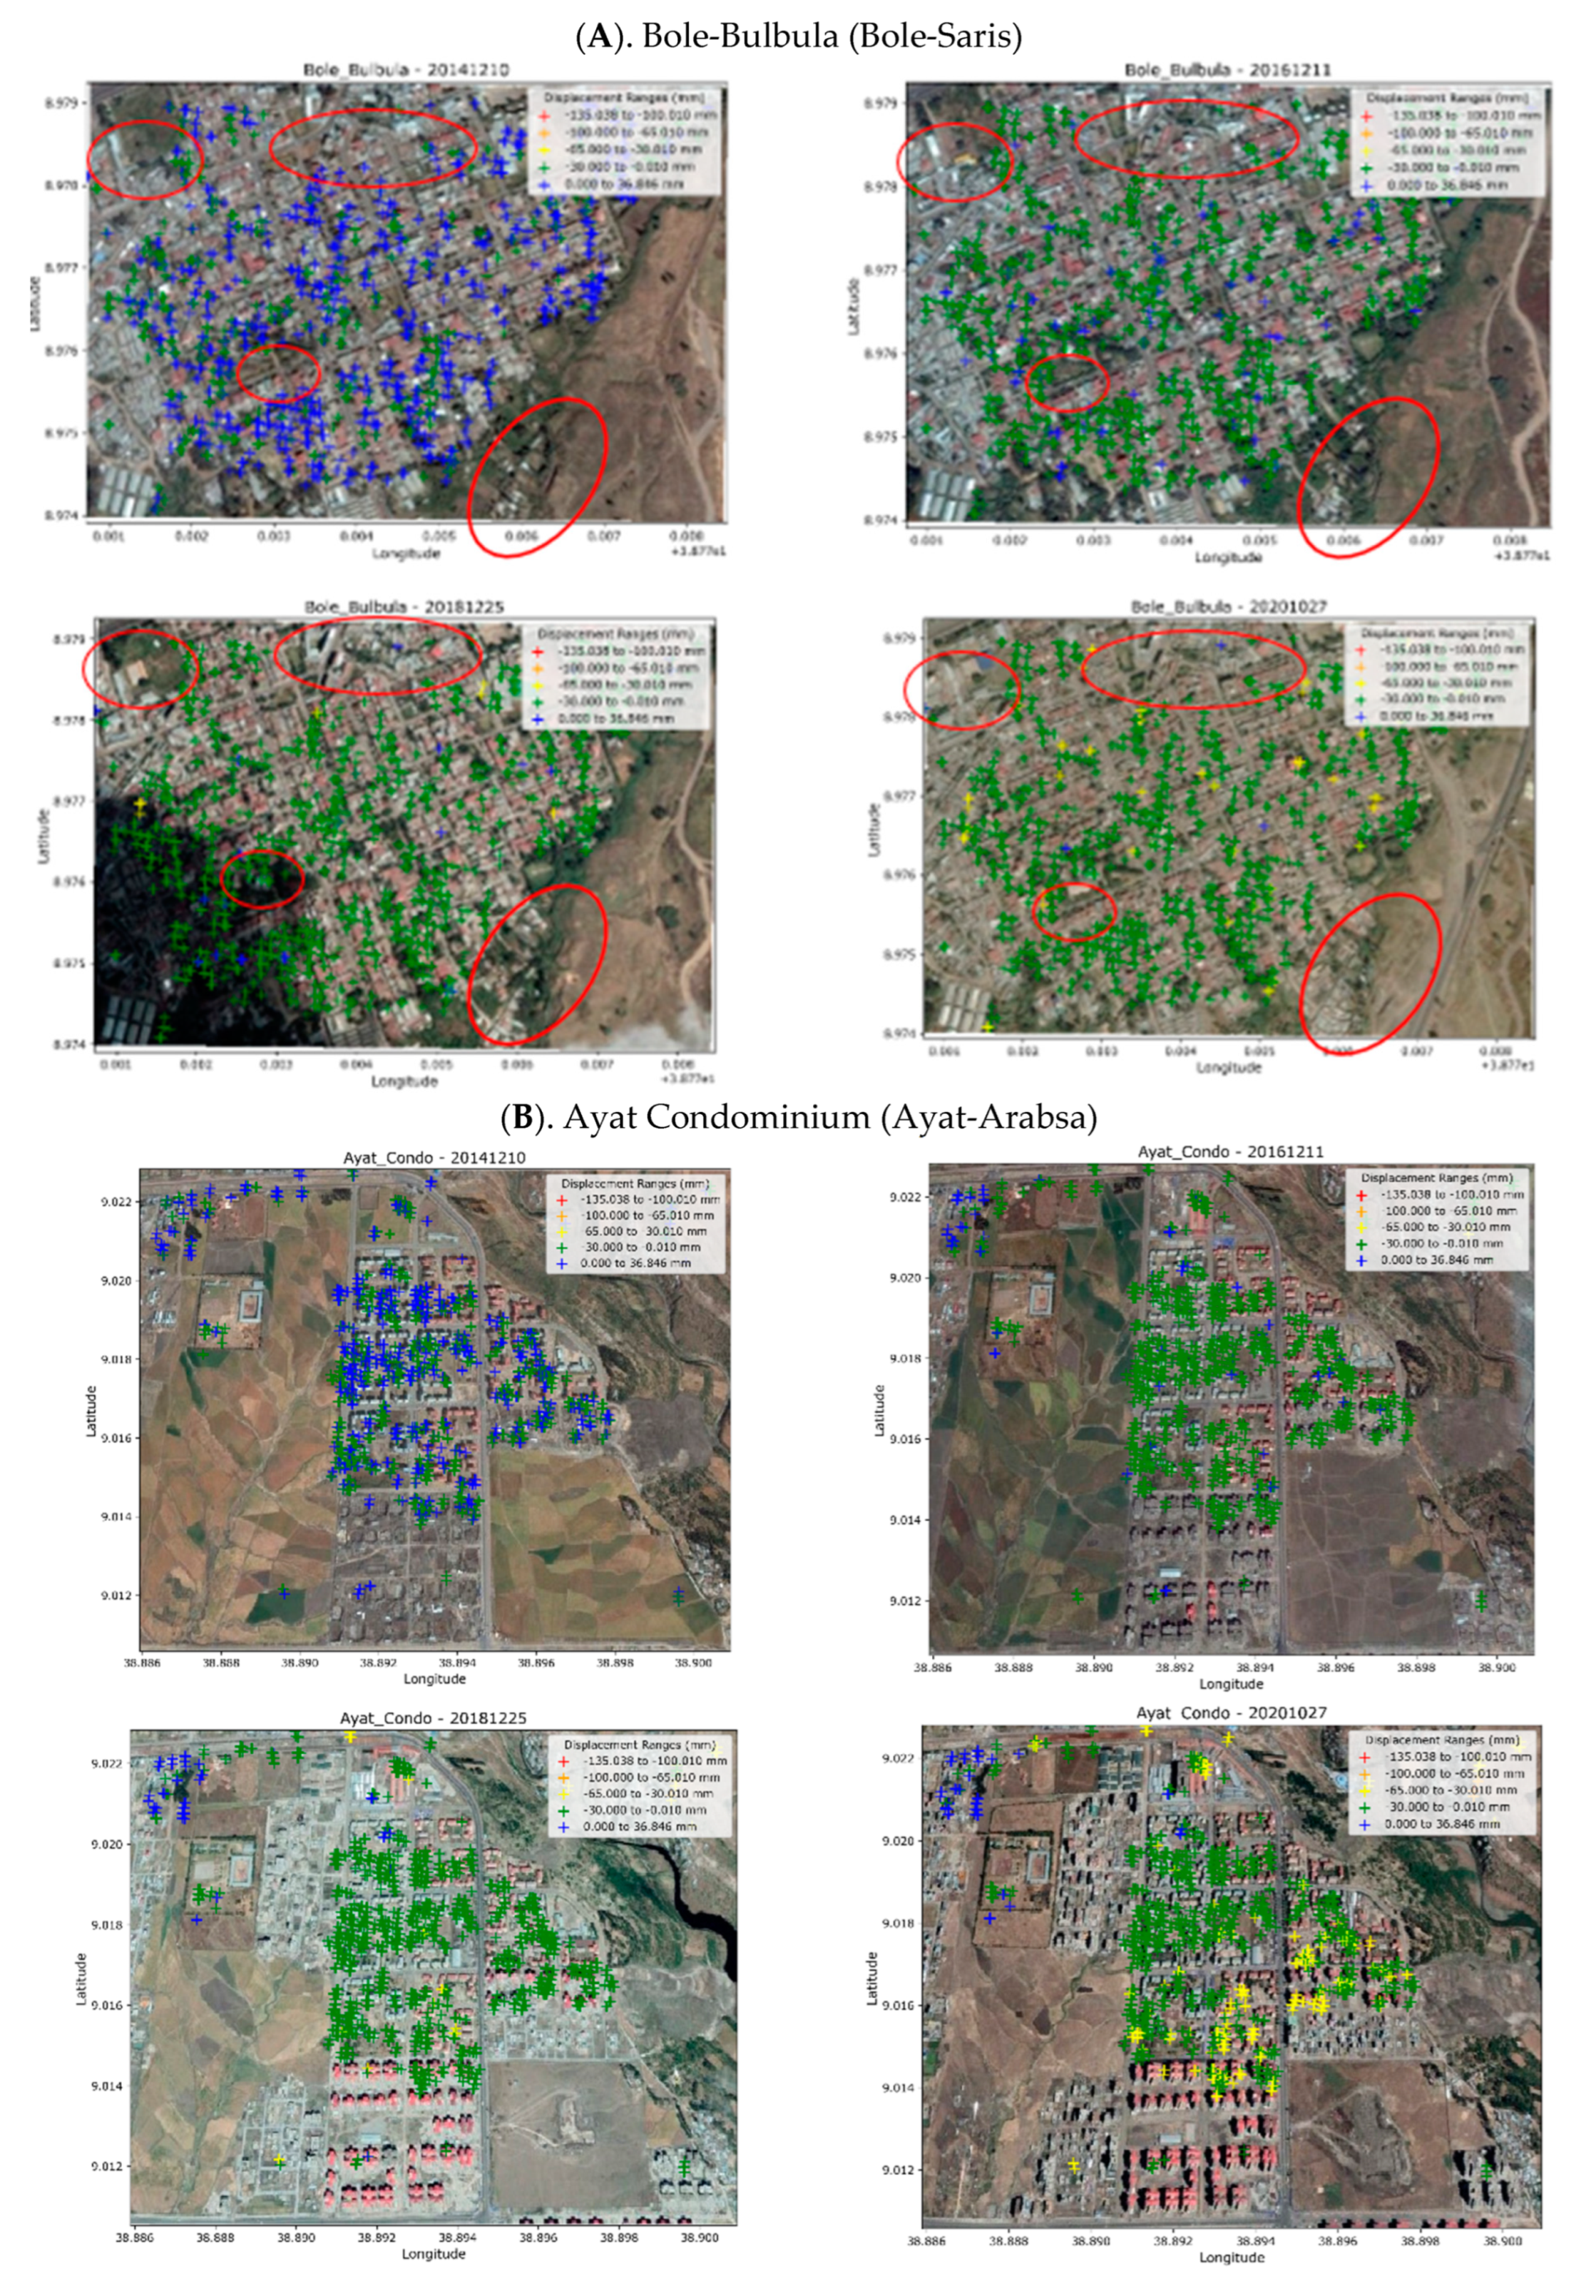
Bole-Saris (A): The Bole-Saris area has experienced intense urbanization since 2015, with the construction of new residential buildings and malls, especially in Bole-Bulbula village, as shown in the Figure. The district has become highly urbanized, characterized by tall buildings and dense road networks. The subsidence in this area is likely due to soil compaction caused by the construction activities and the extraction of groundwater for potable water to support the growing population and urban development. The increased ground deformation in Bole-Saris is primarily attributed to the presence of thick soil layers, as well as the intense urbanization and the construction of tall buildings which have accelerated land subsidence in the area. The magnitude of displacements increases both spatially and temporally in response to the rising anthropogenic pressure. On average, cumulative deformations of up to 30 mm are observed, with maximum values reaching 65 mm.
-
Ayat-Arabsa (B): The Ayat-Arabsa area has also experienced significant urbanization, particularly in the center of Ayat’s real state and condominium village, as shown in the Figure. The construction of new settlements and high-rise buildings has been prominent since 2015. Similar to Bole-Saris, the subsidence in Ayat-Arabsa is likely caused by soil compaction resulting from the loads imposed by new buildings and excessive groundwater extraction to meet the demands of growing urbanization and population needs. The areas experiencing subsidence in Ayat-Arabsa are primarily located in the new settlements and sectors with high-rise buildings. In this sector as well, displacements have increased both spatially and temporally, corresponding to the expansion of the urbanized area. Average displacements of up to approximately 30 mm are observed, while in the central portion, the most impacted by urbanization, they can reach up to 65 mm.
-
Akaki-Kality (C): The Akaki-Kality areas have experienced significant urban development and high-rise building construction since 2015. The intense urbanization, industrial activity, dense road networks, soil compaction from new buildings, and substantial groundwater exploitation in this area have caused significant subsidence, as seen near landmarks such as the Heineken Brewery SC around Kilinto. Displacements have been particularly intense during the final years of the observation period, ranging between 30 and 60 mm, and have been affecting both older and more recent buildings.
-
Atena-Tera (D): In this area, a rapid increase in anthropogenic pressure has also occurred since 2015. This increase has been accompanied by a rise in surface deformations, with displacement values reaching up to 30 mm across the entire study area (Figure 6D). The observed land subsidence can be attributed to soil compaction caused by urban development and the construction of high-rise buildings. Additionally, the high thickness of surface soils has further intensified the subsidence process.

3.2. Displacement Time Series

Vertical displacement time series for selected pixels from highly subsiding areas in Bole-Saris, Ayat-Arabsa, Akaki-Kality, and Atena-Tera, as well as the stable areas of Kotebe and Kolfe-Keraniyo, are shown in Figure 7. The maximum, minimum, and average accumulated vertical displacements in the unstable areas were −134.6 mm, 27.3 mm, and −12.0 mm, respectively. The average rate of land subsidence at Kotebe (E) and Kolfe-Keraniyo (F) is almost zero (~±0.2), with a range of −2 to 2 mm/year, suggesting that these areas have remained relatively stable with minimal subsidence or uplift.
The plots show different rates of displacement, categorized as linear (increase or decrease), bilinear (e.g., increase then decrease, both increase, or both decrease), quadratic (increase or decrease), and uncorrelated (stable area).
-
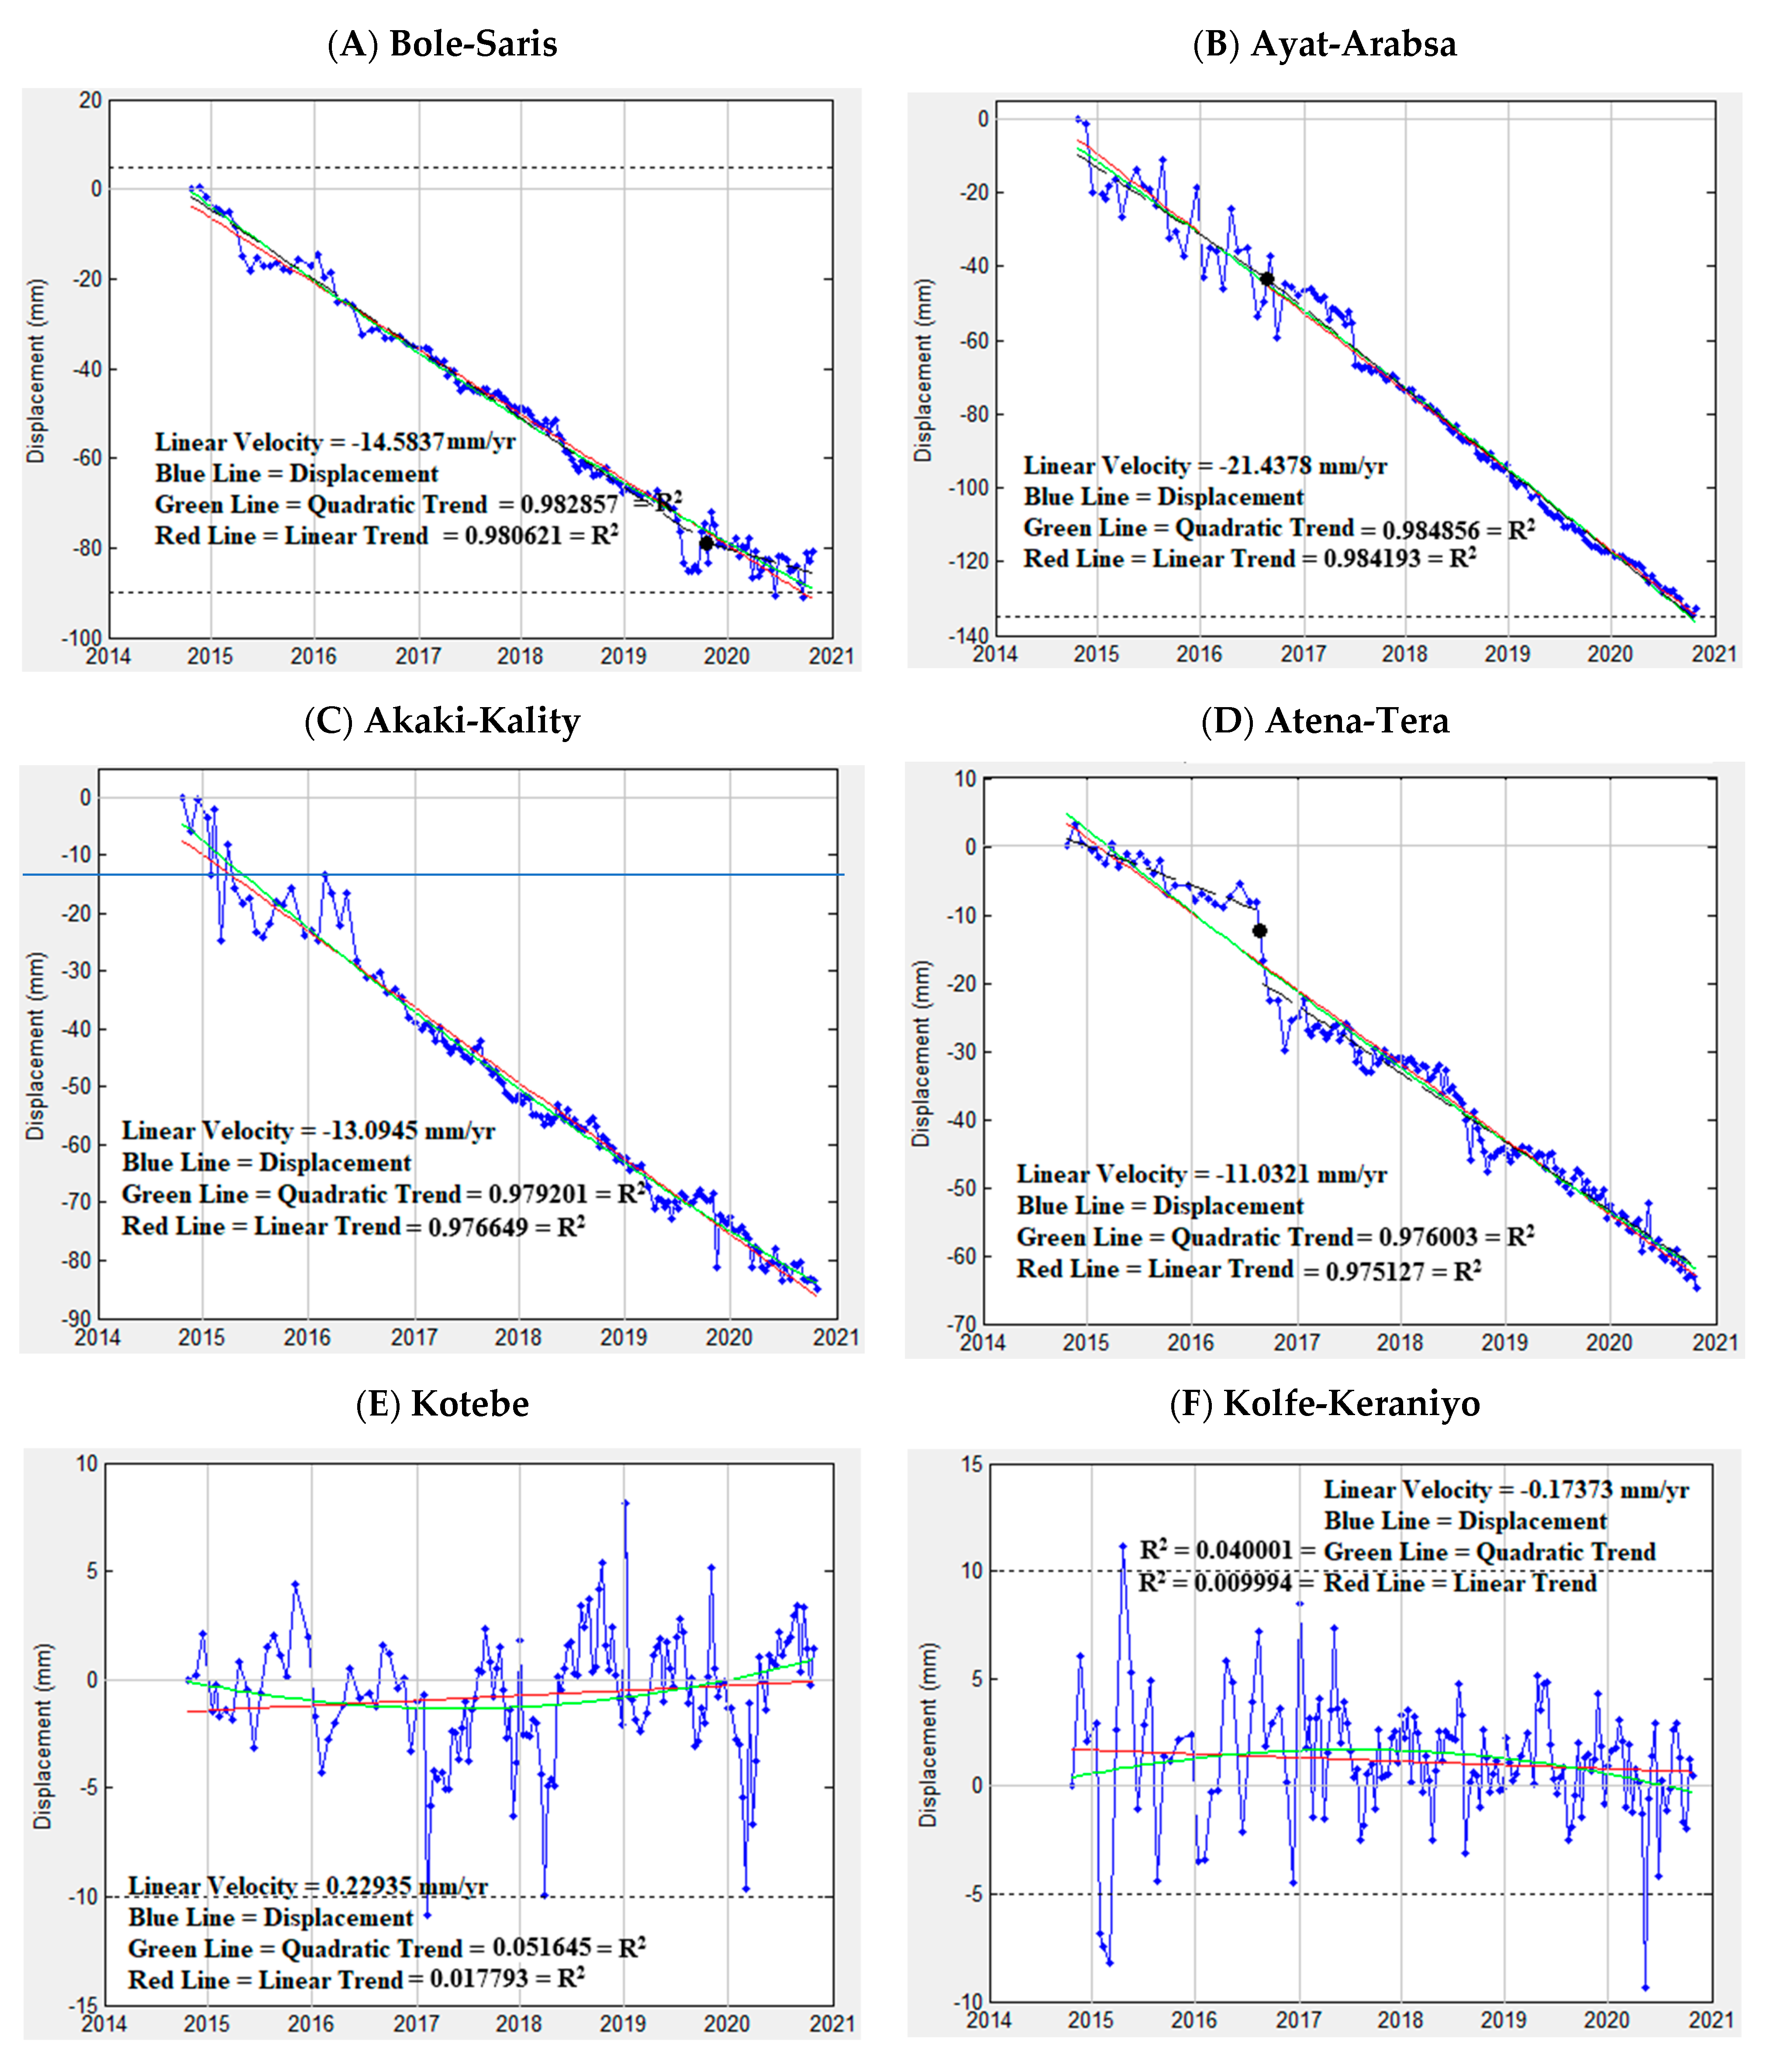
Linear (Increase or Decrease): In some areas, the displacement time series follows a linear pattern from 2017 to 2021 (Figure 7A–D), showing either a steady increase or a decrease in vertical displacement over time. A linear trend may indicate gradual, constant subsidence or uplift in the region.
-
Bilinear (Increase, Decrease, or Vice Versa): A bilinear pattern indicates two distinct linear trends in the displacement time series, which may occur in opposite directions. This suggests a change in the subsidence or uplift rate during the observation period. For example, the subsidence rate might increase or decrease abruptly at a specific point in time, as observed in Figure 7C,D between 2016 and 2017.
-
Quadratic (Increase or Decrease): A quadratic pattern suggests a nonlinear trend in the displacement time series, indicating that the subsidence or uplift is either accelerating or decelerating over time. The rate of displacement changes nonlinearly, resulting in a curved trend, as observed in Figure 7C,D from 2014 to 2017.
-
Uncorrelated (Stable area): In the stable areas (Figure 7E,F), the displacement time series does not exhibit any significant pattern or trend over time. The vertical displacements appear uncorrelated, indicating that the ground remains relatively stable, with no notable subsidence or uplift.
R-squared values in Figure 7A show that quadratic regression is a better fit for the data than linear regression. The quadratic regression explains 98.29% of the variance in the data, while the linear regression explains 98.06% of the variance in the data. This means that the quadratic regression model perfectly fits the data. Similarly, the values shown in Figure 6B–D indicate that the quadratic regression model fits the data slightly better than the linear regression model. In conclusion, the quadratic trend is a better model to fit the data than the linear model. This indicates that subsidence in the area undergoes phases of acceleration, generally associated with sudden changes in geo-environmental factors, typically driven by anthropogenic activity.
For region E, the quadratic model (R2 = 0.0516) marginally outperforms the linear trend (R2 = 0.0178), though both show negligible explanatory power. Similarly, region F exhibits weak model fits (quadratic R2 = 0.0400; linear R2 = 0.0099), suggesting significant variability or noise in the displacement data. These low R2 values indicate that neither linear nor quadratic trends adequately capture the underlying dynamics, highlighting the need for caution when interpreting the reported velocities.
Overall, Figure 7 provides valuable insights into the deformation history of the observed areas. It allows for the study of the kinematics of a given phenomenon (quiescence, activation, and acceleration) and their correlation with potential driving factors. However, it is essential to note that the displacement time series are a zero-redundancy product, meaning that they contain one deformation estimate per each SAR acquisition. This sensitivity to phase noise can result in the dominance of the linear deformation model in the time series patterns. Careful data interpretation is required to effectively use and interpret the deformation time series.
To validate and reinforce the findings, a validation point was established utilizing the ADIS Global Navigation Satellite System (GNSS) Continuously Operating Reference Station (CORS), operated by the Institute of Geophysics, Space Science, and Astronomy at Addis Ababa University. To process the time series data, high-precision GNSS positioning techniques were applied using daily RINEX observation files from the ADIS station. The dataset was processed with precise ephemerides and clock corrections to achieve millimeter-level accuracy. Quality control procedures, including outlier removal and linear detrending, were implemented to filter out noise and isolate long-term tectonic trends. Particular attention was given to the vertical (Up) component, which was analyzed for potential ground deformation and compared with displacements obtained from PSI analysis.
The time series shown in Figure 8 presents GNSS-derived displacement data in the ENU directions for the ADIS station, covering the period from early 2014 to 2021. The East and North components exhibit a gradual and consistent linear trend, reflecting horizontal tectonic motion characteristics of regional plate dynamics. In contrast, the Up component, crucial for assessing vertical ground motion, remains relatively stable, with only minor fluctuations. This subtle variability is typical of GNSS vertical measurements, which are often affected by atmospheric disturbances and multipath effects, and does not suggest any significant vertical ground displacement during the observation period. The strong agreement between the GNSS and InSAR datasets enhances confidence in the conclusion that the ADIS station is situated in a tectonically stable area, confirming its suitability as a reliable reference point for regional deformation monitoring and the validity of interferometric data.

4. Discussion

The results of this study show that ground subsidence is ongoing, particularly in the central part of the analyzed area (in front of AA Bole International Airport), with a maximum vertical deformation rate of −21.5 mm/year during the 2014–2021 period. Such a high rate of land subsidence may compromise key infrastructure, where the failure of even a single structure could lead to serious environmental consequences and considerable socioeconomic impacts, including service disruptions, property damage, and costly repair. The extent of the unstable area around the maximum deformation covers a large portion of the city’s central core. Most of the Bole-Saris, Akaki-Kality, Arabsa, and Ayat-Tafo areas are affected by subsidence rates ranging from −21.5 to −2.0 mm/year. If the regional natural subsidence given by tectonic forces is not considered, because its contribution can be neglected, the non-uniform distribution of the displacements can be attributed mainly to the variation in the loading of infrastructures, groundwater exploitation, and natural consolidation of the soil after the impressive increase in anthropic pressure in the last thirty years. The southeastern side of the city, where pellic vertisols are present, is generally dominated by higher rates of displacement. On the other hand, the land subsidence is more intense on the northeastern side of the city, which is mainly made of chromic vertisols.
The infrastructure developed over the past decade has contributed to the local acceleration of the settlement process. PSI detected significant subsidence rates resulting from the load exerted by new constructions on unconsolidated sediments. The long consolidation time of soils is a critical factor when assessing potential risk to buildings and essential infrastructure [71]. Interferometric data enable the monitoring of subsidence over time and support the investigation of its causes, particularly the role of new building construction inducing the compaction of fine-grained deposits [72,73]. This behavior is evident in the urban development along the incision margins shown in Figure 6 and Figure 7. In these zones, consolidation associated with recent construction activity is fully observable through interferometry. The city experienced a great urban expansion 15 years ago. These new settlements triggered subsidence phenomena and provided ideal targets for the Sentinel-1 acquisitions, which began on 23 October 2014. In the subsequent years, urban development was largely confined to emerging residential areas on the city’s outskirts and a few central zones. The construction of buildings, along with road network upgrades and maintenance, has been effectively detected and monitored by the Sentinel-1 SAR sensor. While satellite revisiting times and bandwidth may influence PS point density, they do not hinder the capacity to track urbanization dynamics in the study area.
The technique and analysis utilized in this work have an impact on the scientific contribution of remote sensing for managing land subsidence in the megacities of emerging countries where there is a huge lack of geological and technical data, helping local administrators to put mitigation actions in place. Future research should continue to apply InSAR techniques by using both ascending and descending data for a reliable and accurate 3D analysis and long displacement time series that, together with in situ measurements, will help to investigate the causes of the subsidence.
The observed patterns of subsidence are consistent with other case studies in which urban sprawl and overexploitation of groundwater have induced deformation phenomena [74,75]. The correlation between the construction of civil and industrial buildings and the acceleration of subsidence phenomena in AA mirrors what has been observed in other large megacities such as Jakarta and Ho Chi Minh City, highlighting the impact of anthropogenic loads on unconsolidated soils. However, the availability of only one orbit of Sentinel-1 data may have led to an underestimation of the vertical displacements. Furthermore, the lack of data on groundwater exploitation and the geotechnical properties of materials emphasizes the need for local governments to collect such information. Currently, mitigation strategies should consider possible InSAR monitoring, but integrated with hydrogeological and geotechnical investigations, aimed at identifying and weighting the conditioning and triggering factors. Finally, an integration of interferometric data with seismic risk analysis could provide a more complete knowledge of the natural hazards to which AA is subjected, as demonstrated in recent studies conducted in areas of strong urban expansion and affected by subsidence [76].
The analyses conducted in this study identified critical subsidence hotspots in AA, areas of high risk for urban infrastructure. These areas with high rates of deformation are closely correlated with the expansion of urbanized areas in the last two decades, the presence of compressible soils, and the overexploitation of groundwater resources. The phenomena of ground deformation threaten the structural integrity of buildings, drainage systems, hydraulic pipelines, and the telecommunications network, leading to a significant increase in maintenance and repair costs. Crucial sectors of AA, such as the commercial area of Bole-Saris, which has experienced an impressive increase in anthropogenic pressure through the construction of modern high-rise buildings, show clear signs of deformation, such as fractures in the roads and the presence of sinkholes, signs that suggest immediate intervention by local authorities. These considerations highlight the importance of better spatial planning that takes into account areas potentially subject to subsidence phenomena if affected by new urbanization or groundwater extraction. Planning must be based on remote monitoring tools such as interferometry, but a plan of territorial investigations aimed at geotechnical and hydrogeological characterization of the territory is absolutely necessary. In the absence of planning, the risk induced by subsidence phenomena will increase significantly, as will damage and repair costs.

5. Conclusions

The main aims of this paper were to evaluate the temporal and spatial patterns of land subsidence affecting AA and to determine the amplitude of the displacements for identifying and monitoring the most affected areas. The subsidence rate in AA from October 2014 to January 2021 using Sentinel-1-based PSI techniques for the first time in this area was estimated. The results demonstrated that the maximum vertical deformation rate of the study area is −21.5 mm/year. Moreover, some areas experienced severe ground settlement exceeding 134.6 mm, which is the maximum displacement at a point found in the Bole-Saris area, one of the most important commercial areas of the city. The main factors contributing to land subsidence include excessive groundwater extraction, intense sprawl urbanization, consolidation of alluvial soil, and tectonic activity. Displacements were more severe in existing urban areas near AA Bole International Airport and in the new residential areas where buildings and road networks are dense. Moreover, intense land subsidence rates ranging from −2 to −21 mm/year were observed in the rapidly urbanized areas of the eastern, central, and southern parts of the study area, including Ayat-Tafo, Lebu, Torhailoch, Merkato, Saris, and Akaki-Kality. The results were assessed and validated using moderately precise GCPs (second-order geodetic networks), but future research needs to validate the conclusions. At the time of data collection, this study could not find an equal number of ascending (42) and descending (146) images for single-look complex (SLC) Sentinel-1 data. In the studied region, there is only one GNSS CORS, and it also lacks geological and technical data, as well as detailed field studies to assess the impact of land subsidence in the city.
The results obtained in this study provide critical elements on the dynamics of subsidence in AA, identifying high-risk areas where anthropogenic pressure induces severe ground deformations. Estimation of subsidence rates and relationships between deformation and expansion of the urban fabric, soil characteristics, and potential depletion of aquifers demonstrate an urgent need for planning of human activities and resilience strategies in areas already affected. The evidence of deformation that is affecting newly built areas represents a wake-up call for city planners and policymakers, clearly showing the need to intervene in areas where critical infrastructures fall within subsidence hotspots, and where potentially catastrophic damage to human health and property can occur. These emergencies cannot be addressed exclusively through remote monitoring but also require ground data that includes the properties of anthropogenic elements exposed to risks and technical information on geological materials and hydrogeological conditions. Only through multidisciplinary studies will it be possible to fully understand the phenomenon of subsidence and its causes in order to be able to put in place effective mitigation measures. Without such data-driven interventions, AA and similar other large and rapidly expanding cities present in all emerging countries will face a very high economic loss and an increase in the vulnerability of the social fabric.
The PSI technique demonstrated significant advantages for monitoring subsidence in AA, especially in urbanized areas. The level of precision of this technique makes it possible to estimate very small rates of displacement, a crucial aspect for an early identification of areas at risk of subsidence, especially in densely populated areas or if critical infrastructures are present. Compared to traditional survey methods, such as levelling, interferometric techniques provide extensive spatial coverage and a low cost/benefit ratio. These techniques are particularly effective in megacity environments in emerging countries that are experiencing significant expansion of the urban fabric. In fact, in AA, the large density of built surface provides a large number of measurement points (persistent scatterers); consequently, it is possible to create very precise and detailed surface deformation rate maps. In addition, the PSI technique reduces the temporal decorrelation problems that affect conventional DInSAR techniques, as it focusses on stable targets, providing effective long-term monitoring through regular satellite acquisitions. However, PSI has some limitations that must be considered, especially in the context of AA. Atmospheric variability, such as humidity and temperature oscillations attributable to high altitudes and the consequent climate variability, can disturb the RADAR signal, requiring complex corrections to obtain an accurate estimate of ground deformation rates. The effectiveness of the technique also depends on the availability of permanent targets on the ground; consequently, poorly urbanized areas can introduce discontinuities in the coverage of information and uncertainties about the phenomena taking place. Rapid urbanization, on the one hand, can create those permanent targets necessary for the success of the processes, but, on the other hand, it can induce such sudden changes that they can cause considerable loss of measurement points. Data acquisition and processing can also be a limitation: the PSI technique requires a large number of images acquired over long periods, but this can be negatively affected by satellite revisit times or financial constraints. Processing requires a high level of experience and large computational resources, factors that have often limited the use of this monitoring tool.
In AA, PSI’s strengths are amplified by the city’s infrastructure density, but its limitations underscore the need for complementary methods like GPS or ground levelling to validate results and fill coverage gaps. Addressing atmospheric interference and enhancing scatterer detection in non-urban areas could further optimize its application, ensuring comprehensive subsidence monitoring to safeguard the city’s growth and resilience.

Author Contributions

E.A.: Conceptualization, Formal Analysis (SAR and GNSS Data), Methodology, Software, Validation, Writing—Original Draft Preparation, Writing—Review and Editing. M.F.: Formal Analysis (SAR Data), Software, Data Curation, Supervision, Validation, Writing—Review and Editing. All authors have read and agreed to the published version of the manuscript.

Funding

This research received no external funding.

Data Availability Statement

Data will be made available on request.

Acknowledgments

The authors thank the Alaska Satellite Facility Data Search Vertex (https://search.asf.alaska.edu/, accessed on 5 May 2021) for providing Sentinel-1A and UNAVCO (https://www.unavco.org/, accessed on 19 January 2022) and Institute of Geophysics, Space Science and Astronomy (IGSSA) for archiving and providing GNSS data, respectively.

Conflicts of Interest

The authors declare that they have no known competing financial interests or personal relationships that could have appeared to influence the work reported in this paper.

References

  1. Galloway, D.L.; Burbey, T.J. Review: Regional land subsidence accompanying groundwater extraction. Hydrogeol. J. 2011, 19, 1459–1486. [Google Scholar] [CrossRef]
  2. Land Subsidence Is One of the World’s Underrated Problems. Deltares. 24 December 2021. Available online: https://www.deltares.nl/en/topdossiers/subsidence/ (accessed on 15 March 2024).
  3. Kurz, T.; Gloaguen, R.; Ebinger, C.; Casey, M.; Abebe, B. Deformation distribution and type in the MER: A remote sensing study. J. Afr. Ear. Sci. 2007, 48, 100–114. [Google Scholar] [CrossRef]
  4. Agostini, A.; Bonini, M.; Corti, G.; Sani, F.; Manetti, P. Distribution of Quaternary deformation in the central Main Ethiopian Rift, East Africa. Tectonics 2011, 30, 1–21. [Google Scholar] [CrossRef]
  5. Navarro-Hernández, M.I.; Tomás, R.; Lopez-Sanchez, J.M.; Cárdenas-Tristán, A.; Mallorquí, J.J. Spatial Analysis of Land Subsidence in the San Luis Potosi Valley Induced by Aquifer Overexploitation Using the Coherent Pixels Technique (CPT) and Sentinel-1 InSAR Observation. Remote Sens. 2020, 12, 3822. [Google Scholar] [CrossRef]
  6. UN-Habitat. Addis Ababa Urban Profile: Sustainable Urban Development and Housing; United Nations Human Settlements Programme: Nairobi, Kenya, 2017. [Google Scholar]
  7. Gebre, Y.; Gebremariam, K. Urban Sprawl and Infrastructure Development in Addis Ababa: Challenges and Opportunities. J. Urban Dev. Stud. 2020, 12, 45–60. [Google Scholar]
  8. World Bank. Ethiopia Urbanization Review: Urban Institutions for a Middle-Income Ethiopia; World Bank Group: Washington, DC, USA, 2015. [Google Scholar]
  9. Bovenga, F.; Wasowski, J.; Nitti, D.O.; Nutricato, R.; Chiaradia, M.T. Using COSMO-SkyMed X-band and ENVISAT C band SAR interferometry for landslides analysis. Remote Sens. Environ. 2012, 119, 272–285. [Google Scholar] [CrossRef]
  10. García-Davalillo, J.C.; Herrera, G.; Notti, D.; Strozzi, T.; Álvarez-Fernández, I. DInSAR analysis of ALOS PALSAR images for the assessment of very slow landslides: The Tena Valley case study. Landslides 2014, 11, 225–246. [Google Scholar] [CrossRef]
  11. Ma, P.; Cui, Y.; Wang, W.; Lin, H.; Zhang, Y.; Zheng, Y. Landslide Movement Monitoring with InSAR Technologies. In Landslides; Zhang, Y., Cheng, Q., Eds.; IntechOpen: Rijeka, Croatia, 2022. [Google Scholar] [CrossRef]
  12. Mohsen, P.; Ali, M.; Saied, P.; Reza, D. Monitoring of Maskun landslide and determining its quantitative relationship to different climatic conditions using D-InSAR and PSI techniques. Geomat. Nat. Hazards Risk 2022, 13, 1134–1153. [Google Scholar] [CrossRef]
  13. Bell, J.W.; Amelung, F.; Ferretti, A.; Bianchi, M.; Novali, F. Permanent scatterer InSAR reveals seasonal and long-term aquifer-system response to groundwater pumping and artificial recharge. Water Resour. Res. 2008, 44, W02407. [Google Scholar] [CrossRef]
  14. Heleno, S.I.N.; Oliveira, L.G.S.; Henriques, M.J.; Falcão, A.P.; Lima, J.N.P.; Cooksley, G.; Ferretti, A.; Fonseca, A.M.; Lobo-Ferreira, J.P.; Fonseca, J.F.B.D. Persistent Scatterers Interferometry detects and measures ground subsidence in Lisbon. Remote Sens. Environ. 2011, 115, 2152–2167. [Google Scholar] [CrossRef]
  15. Rafiei, F.; Gharechelou, S.; Golian, S.; Johnson, B.A. Aquifer and Land Subsidence Interaction Assessment Using Sentinel-1 Data and DInSAR Technique. ISPRS Int. J. Geo-Inf. 2022, 11, 495. [Google Scholar] [CrossRef]
  16. Xiao, B.; Zhao, J.; Li, D.; Zhao, Z.; Xi, W.; Zhou, D. The Monitoring and Analysis of Land Subsidence in Kunming (China) Supported by Time Series InSAR. Sustainability 2022, 14, 12387. [Google Scholar] [CrossRef]
  17. Shi, L.; Gong, H.; Chen, B.; Shao, Z.; Zhou, C. Land subsidence simulation considering groundwater and compressible layers based on an improved machine learning method. J. Hydrol. 2025, 656, 133008. [Google Scholar] [CrossRef]
  18. Othman, L.S.; Majidi, J.; Amini, A. Land Subsidence Assessment in the Darab Plain, Fars Province, Iran: Integrating Sentinel-1 InSAR and Groundwater Level Data. Adv. Civ. Eng. Environ. Sci. 2025, 2, 57–61. [Google Scholar] [CrossRef]
  19. Jung, H.; Kim, S.; Jung, H.; Min, K.; Won, J. Satellite observation of coal mining subsidence by permanent scatterer analysis. Eng. Geol. 2007, 92, 1–13. [Google Scholar] [CrossRef]
  20. Escayo, J.; Marzan, I.; Martí, D.; Tornos, F.; Farci, A.; Schimmel, M.; Carbonell, R.; Fernández, J. Radar Interferometry as a Monitoring Tool for an Active Mining Area Using Sentinel-1 C-Band Data, Case Study of Riotinto Mine. Remote Sens. 2022, 14, 3061. [Google Scholar] [CrossRef]
  21. Soni, R.; Alam, M.S.; Vishwakarma, G.K. Prediction of InSAR deformation time-series using improved LSTM Deep Learning Model. Sci. Rep. 2025, 15, 5333. [Google Scholar] [CrossRef] [PubMed]
  22. Vallone, P.; Giammarinaro, M.S.; Crosetto, M.; Agudo, M.; Biescas, E. Ground motion phenomena in Caltanissetta (Italy) investigated by InSAR and geological data integration. Eng. Geol. 2008, 98, 144–155. [Google Scholar] [CrossRef]
  23. Cigna, F.; Osmanoglu, B.; Cabral-Cano, E.; Dixon, T.H.; Ávila-Olivera, J.A.; Garduño-Monroy, V.H.; DeMets, C.; Wdowinski, S. Monitoring land subsidence and its induced geological hazard with Synthetic Aperture Radar Interferometry: A case study in Morelia, Mexico. Remote Sens. Environ. 2012, 117, 146–161. [Google Scholar] [CrossRef]
  24. Reyes-Carmona, C.; Herrera, G.; Galve, J.P.; Solari, L.; Mateos, R.M.; Azañón, J.M.; Béjar-Pizarro, M.; López-Vinielles, J.; Palamà, R.; Crosetto, M.; et al. From satellite interferometry displacements to potential damage maps: A tool for risk reduction and urban planning. Remote Sens. Environ. 2022, 282, 113294. [Google Scholar] [CrossRef]
  25. Via Dalla, G.; Crosetto, M.; Crippa, B. Resolving vertical and east-west horizontal motion from differential interferometric synthetic aperture radar: The L’Aquila earthquake. J. Geophys. Res. Solid Earth 2012, 117, 1–14. [Google Scholar] [CrossRef]
  26. Fang, H.; Shao, Y.; Xie, C.; Tian, B.; Zhu, Y.; Guo, Y.; Yang, Q.; Yang, Y. Using Persistent Scatterer Interferometry for Post-Earthquake Landslide Susceptibility Mapping in Jiuzhaigou. Appl. Sci. 2022, 12, 9228. [Google Scholar] [CrossRef]
  27. Antonielli, B.; Monserrat, O.; Bonini, M.; Righini, G.; Sani, F.; Luzi, G.; Feyzullayev, A.A.; Aliyev, C.S. Pre-eruptive ground deformation of Azerbaijan mud volcanoes detected through satellite radar interferometry (DInSAR). Tectonophysics 2014, 637, 163–177. [Google Scholar] [CrossRef]
  28. Richter, N.; Froger, J.L. The role of Interferometric Synthetic Aperture Radar in Detecting, Mapping, Monitoring, and Modelling the Volcanic Activity of Piton de la Fournaise, La Réunion: A Review. Remote Sens. 2020, 12, 1019. [Google Scholar] [CrossRef]
  29. Rignot, E.J.; Gogineni, S.P.; Krabill, W.B.; Ekholm, S. North and northeast Greenland ice discharge from satellite radar interferometry. Science 1997, 276, 934–937. [Google Scholar] [CrossRef]
  30. Dammann, D.O.; Johnson, M.A.; Fedders, E.R.; Mahoney, A.R.; Werner, C.L.; Polashenski, C.M.; Meyer, F.J.; Hutchings, J.K. Ground-Based Radar Interferometry of Sea Ice. Remote Sens. 2020, 13, 43. [Google Scholar] [CrossRef]
  31. Amelung, F.; Galloway, D.L.; Bell, J.W.; Zebker, H.A.; Laczniak, R.J. Sensing the ups and downs of Las Vegas: InSAR reveals structural control of land subsidence and aquifer-system deformation. Geology 1999, 27, 483–486. [Google Scholar] [CrossRef]
  32. Li, G.; Zhao, C.; Wang, B.; Liu, X.; Chen, H. Land Subsidence Monitoring and Dynamic Prediction of Reclaimed Islands with Multi-Temporal InSAR Techniques in Xiamen and Zhangzhou Cities, China. Remote Sens. 2022, 14, 2930. [Google Scholar] [CrossRef]
  33. UPGro. UPGro Impact Report. 2021. Available online: https://upgro.org/2020/07/03/upgro-impact-d5/ (accessed on 6 April 2025).
  34. Raspini, F.; Caleca, F.; Del Soldato, M.; Festa, D.; Confuorto, P.; Bianchini, S. Review of satellite radar interferometry for subsidence analysis. Earth-Sci. Rev. 2022, 235, 104239. [Google Scholar] [CrossRef]
  35. Ferretti, A.; Prati, C.; Rocca, F. Permanent scatterers in SAR interferometry. IEEE Trans. Geosci. Remote Sens. 2001, 39, 8–20. [Google Scholar] [CrossRef]
  36. Crosetto, M.; Monserrat, O.; Cuevas-González, M.; Devanthéry, N. Persistent Scatterer Interferometry: A review. Photogram. Eng. Remote Sens. 2015, 115, 78–89. [Google Scholar] [CrossRef]
  37. Giorgini, E.; Orellana, F.; Arratia, C.; Tavasci, L.; Montalva, G.; Moreno, M.; Gandolfi, S. Insar monitoring using persistent scatterer interferometry (PSI) and small baseline subset (SBAS) techniques for ground deformation measurement in metropolitan area of Concepción, Chile. Remote Sens. 2023, 15, 5700. [Google Scholar] [CrossRef]
  38. Hooper, A.; Zebker, H.; Segall, P.; Kampes, B. A new method for measuring deformation on volcanoes and other natural terrains using InSAR persistent scatterers. Geophys. Res. Lett. 2007, 34, L16302. [Google Scholar] [CrossRef]
  39. Goldstein, R.M.; Zebker, H.A.; Werner, C.L. Satellite radar interferometry: Two-dimensional phase unwrapping. Radio Sci. 1988, 23, 713–720. [Google Scholar] [CrossRef]
  40. Costantini, M. A novel phase unwrapping method based on network programming. IEEE Trans. Geosci. Remote Sens. 1998, 36, 813–821. [Google Scholar] [CrossRef]
  41. Berardino, P.; Fornaro, G.; Lanari, R.; Sansosti, E. A new algorithm for surface deformation monitoring based on small baseline differential SAR interferograms. IEEE Trans. Geosci. Remote Sens. 2002, 40, 2375–2383. [Google Scholar] [CrossRef]
  42. Kampes, B.M. Radar Interferometry: Persistent Scatterer Technique; Springer: Berlin/Heidelberg, Germany, 2006. [Google Scholar]
  43. Hamling, I.J.; Wright, T.J.; Calais, E.; Lewi, E.; Fukahata, Y. InSAR observations of post-rifting deformation around the Dabbahu rift segment, Afar, Ethiopia. Geophys. J. Int. 2014, 197, 33–49. [Google Scholar] [CrossRef]
  44. Pagli, C.; Wang, H.; Wright, T.J.; Calais, E.; Lewi, E. Current plate boundary deformation of the Afar rift from a 3-D velocity field inversion of InSAR and GPS. J. Geophys. Res. Solid Earth 2014, 119, 8562–8575. [Google Scholar] [CrossRef]
  45. Mengistu, F.; Suryabhagavan, K.; Raghuvanshi, T.K.; Lewi, E. Landslide Hazard Zonation and Slope Instability Assessment using Optical and InSAR Data: A Case Study from Gidole Town and its Surrounding Areas, Southern Ethiopia. Remote Sens. Land 2019, 3, 1–14. [Google Scholar] [CrossRef]
  46. Biggs, J.; Bastow, I.D.; Keir, D.; Lewi, E. Pulses of deformation reveal frequently recurring shallow magmatic activity beneath the Main Ethiopian Rift. Geochem. Geophys. Geosyst. 2011, 12, Q0AB10. [Google Scholar] [CrossRef]
  47. Guo, H.; Martínez-Graña, A.M.; González-Delgado, J.A. Monitoring the Subsidence in Wan’an Town of Deyang Based on PS-InSAR Technology (Sichuan, China). Sustainability 2024, 16, 10010. [Google Scholar] [CrossRef]
  48. Kebede, S. Groundwater in Ethiopia; Springer Hydrogeology; Springer: Berlin/Heidelberg, Germany, 2013. [Google Scholar] [CrossRef]
  49. Biruk. Types of Soil of Addis Ababa for Seismic amplification. Unpublished. Ph.D. Dissertation, Addis Ababa University, Addis Ababa, Ethiopia, 2020.
  50. Ethiopian Meteorological Institute. Data Request Portal. 2022. Available online: https://www.ethiomet.gov.et/data-request/ (accessed on 5 April 2025).
  51. Sishah, S. Rainfall runoff estimation using GIS and SCS-CN method for Awash River basin, Ethiopia. Int. J. Hydrol. 2021, 5, 33–37. [Google Scholar] [CrossRef]
  52. Birhanu, B.; Kebede, S.; Masetti, M.; Ayenew, T. Weap-MODFLOW dynamic modeling approach to evaluate surface water and groundwater supply sources of Addis Ababa City. Acque Sotter.-Ital. J. Groundw. 2018, 7, 5–24. [Google Scholar] [CrossRef]
  53. Yoseph, N. Addis Ababa is running out of groundwater: Study warns. The Reporter. 30 March 2024. Available online: https://www.thereporterethiopia.com/39447/ (accessed on 6 April 2025).
  54. MacroTrends. Addis Ababa, Ethiopia Metro Area Population 1950–2025. MacroTrends. (n.d.) 2025. Available online: https://www.macrotrends.net/global-metrics/cities/20921/addis-ababa/population (accessed on 8 April 2025).
  55. Meyer, F. Spaceborne Synthetic Aperture Radar—Principles, Data Access, and Basic Processing Techniques. In SAR Handbook: Comprehensive Methodologies for Forest Monitoring and Biomass Estimation; Flores, A., Herndon, K., Thapa, R., Cherrington, E., Eds.; NASA: Washington, DC, USA, 2019. [Google Scholar] [CrossRef]
  56. Kellndorfer, J. Using SAR Data for Mapping Deforestation and Forest Degradation. In SAR Handbook: Comprehensive Methodologies for Forest Monitoring and Biomass Estimation; Flores, A., Herndon, K., Thapa, R., Cherrington, E., Eds.; NASA: Washington, DC, USA, 2019. [Google Scholar] [CrossRef]
  57. Saatchi, S. SAR Methods for Mapping and Monitoring Forest Biomass. In SAR Handbook: Comprehensive Methodologies for Forest Monitoring and Biomass Estimation; Flores, A., Herndon, K., Thapa, R., Cherrington, E., Eds.; NASA: Washington, DC, USA, 2019. [Google Scholar] [CrossRef]
  58. Suhadha, A.G.; Trinugroho; Umbara, R.P.; Melati, D.N.; Astisiasari; Wisyanto; Arifianti, Y.; Trisnafiah, S.; Sukristianti; Hadivanto, A.L.; et al. Comparative analysis of PSI and SBAS INSAR in landslide monitoring: Influence of topography and precipitation dynamics. In Proceedings of the 2024 IEEE International Conference on Aerospace Electronics and Remote Sensing Technology (ICARES), Yogyakarta, Indonesia, 8–9 November 2024; pp. 1–6. [Google Scholar] [CrossRef]
  59. Crosetto, M.; Monserrat, O.; Devanthéry, N.; Cuevas-González, M.; Barra, A.; Crippa, B. Persistent Scatterer Interferometry Using Sentinel-1 Data. Int. Arch. Photogramm. Remote Sens. Spat. Inf. Sci. 2016, XLI-B7, 835–839. [Google Scholar] [CrossRef]
  60. Ng, A.H.M.; Ge, L.; Li, X.; Abidin, H.Z.; Andreas, H.; Zhang, K. Mapping land subsidence in Jakarta, Indonesia using persistent scatterer interferometry (PSI) technique with ALOS PALSAR. Int. J. Appl. Earth Obs. Geoinf. 2012, 18, 232–242. [Google Scholar] [CrossRef]
  61. Yan, D.; Zeng, Q.; Guo, X.; Ge, D. PSI analyses of land subsidence due to industrial structure near the city of Hangzhou, China. In Proceedings of the 2012 IEEE International Geoscience and Remote Sensing Symposium, Munich, Germany, 22–27 July 2012. [Google Scholar] [CrossRef]
  62. Davila-Hernandez, N.; Madrigal, D.; Exposito, J.L.; Antonio, X. Multi-Temporal Analysis of Land Subsidence in Toluca Valley (Mexico) through a Combination of Persistent Scatterer Interferometry (PSI) and Historical Piezometric Data. Adv. Remote Sens. 2014, 3, 49–60. [Google Scholar] [CrossRef]
  63. Khorrami, M.; Abrishami, S.; Maghsoudi, Y.; Alizadeh, B.; Perissin, D. Extreme subsidence in a populated city (Mashhad) detected by PSInSAR considering groundwater withdrawal and geotechnical properties. Sci. Rep. 2020, 10, 11357. [Google Scholar] [CrossRef] [PubMed]
  64. Poreh, D.; Pirasteh, S.; Cabral-Cano, E. Assessing subsidence of Mexico City from InSAR and LandSat ETM+ with CGPS and SVM. Geoenviron. Disasters 2021, 8, 7. [Google Scholar] [CrossRef]
  65. Monserrat, O.; Crosetto, M.; Cuevas, M.; Crippa, B. The thermal expansion component of Persistent Scatterer Interferometry observations. IEEE Geosci. Remote Sens. Lett. 2011, 8, 864–868. [Google Scholar] [CrossRef]
  66. van Leijen, F. Persistent Scatterer Interferometry Based on Geodetic Estimation Theory. Ph.D. Dissertation, TU Delft, Delft University of Technology, Delft, The Netherlands, 2014. [Google Scholar]
  67. Yu, M.; Hanssen, R.F. Temporal decorrelation in L-, C-, and X-band satellite radar interferometry for pasture on drained peat soils. IEEE Trans. Geosci. Remote Sens. 2015, 53, 1096–1104. [Google Scholar]
  68. Devanthéry, N.; Crosetto, M.; Monserrat, O.; Cuevas-González, M.; Crippa, B. An approach to Persistent Scatterer Interferometry. Remote Sens. 2014, 6, 6662–6679. [Google Scholar] [CrossRef]
  69. Dai, K.; Liu, G.; Li, Z.; Li, T.; Yu, B.; Wang, X.; Singleton, A. Extracting vertical displacement rates in Shanghai (China) with multi-platform SAR images. Remote Sens. 2015, 7, 9542–9562. [Google Scholar] [CrossRef]
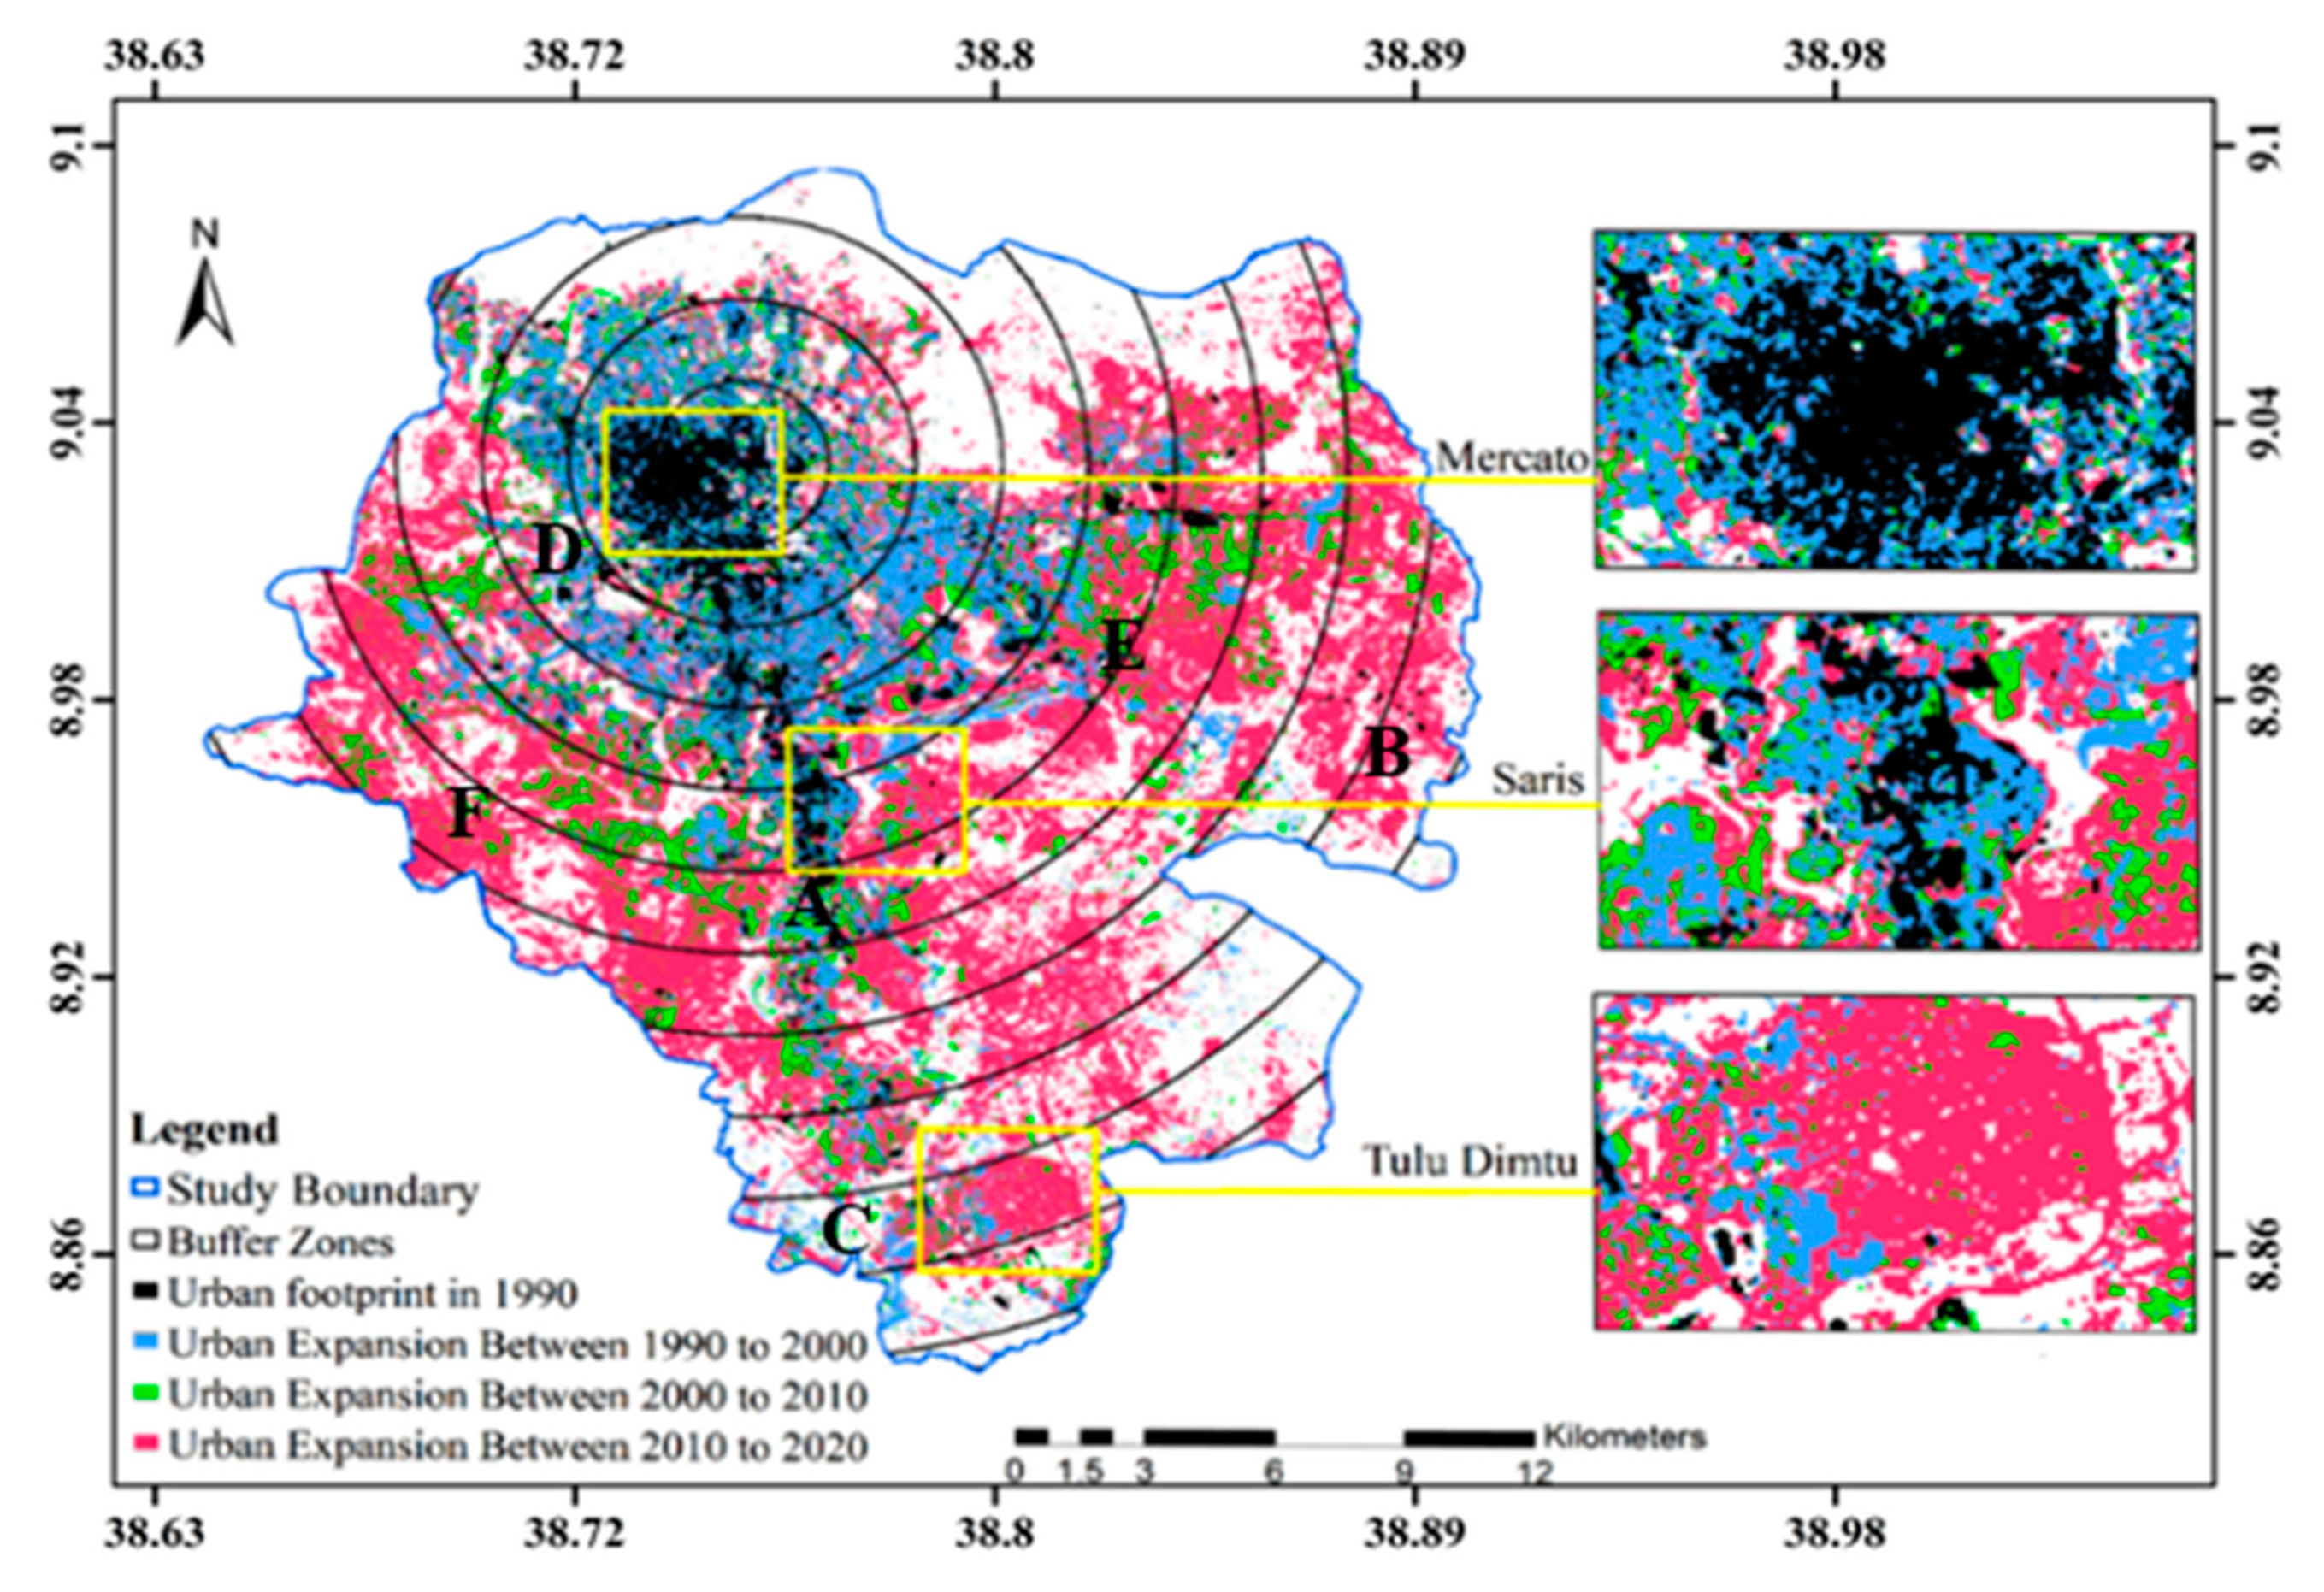
  70. Busho, S.W.; Wendimagegn, G.T.; Muleta, A.T. Quantifying spatial patterns of urbanization: Growth types, rates, and changes in Addis Ababa City from 1990 to 2020. Spat. Inf. Res. 2021, 29, 699–713. [Google Scholar] [CrossRef]
  71. Fiaschi, S.; Fabris, M.; Floris, M.; Achilli, V. Estimation of land subsidence in deltaic areas through differential SAR interferometry: The Po River Delta case study (Northeast Italy). Int. J. Remote Sens. 2018, 39, 8724–8745. [Google Scholar] [CrossRef]
  72. Terzaghi, K.; Peck, R.B. Soil Mechanics in Engineering Practice; John Wiley Sons: New York, NY, USA, 1967. [Google Scholar]
  73. Lambe, T.W.; Whitman, R.V. Soil Mechanics; John Wiley & Sons: New York, NY, USA, 1979; p. 505. [Google Scholar]
  74. Abidin, H.Z.; Andreas, H.; Gumilar, I.; Fukuda, Y.; Pohan, Y.E.; Deguchi, T. Land subsidence of Jakarta (Indonesia) and its relation with urban development. Nat. Hazards 2011, 59, 1753–1771. [Google Scholar] [CrossRef]
  75. Higgins, S.; Overeem, I.; Steckler, M.S.; Syvitski, J.P.; Seeber, L.; Akhter, S.H. InSAR measurements of compaction and subsidence in the Ganges-Brahmaputra Delta, Bangladesh. J. Geophys. Res. Earth Surf. 2014, 119, 1768–1781. [Google Scholar] [CrossRef]
  76. Osmanoğlu, B.; Sunar, F.; Wdowinski, S.; Cabral-Cano, E. Time series analysis of InSAR data: Methods and trends. ISPRS J. Photogramm. Remote Sens. 2016, 115, 90–102. [Google Scholar] [CrossRef]
Figure 1. (a) Simplified geological and tectonic sketch of AA [digitized, extracted and modified from Ethiopian Geological Institute]; (b) topographic map and ground control points (red points) [prepared using Generic Mapping Tools v6].
Land 14 01020 g001
Figure 2. Digital soil map of Addis Ababa (extracted from the FAO/UNESCO Digital Soil Map of the World), illustrating the distribution of soil types across the study area. This map supports the identification of specific soil types most susceptible to subsidence. By highlighting regions where soil composition may influence land deformation, it provides essential insights into the relationship between soil characteristics and subsidence patterns.
Land 14 01020 g002
Figure 3. Workflow of the Persistent Scatterer Interferometry (PSI) approach, showing the main steps from data acquisition to the estimation of surface deformations.
Land 14 01020 g003
Figure 4. Vertical velocity map derived from PSI processing of descending Sentinel-1 images. Negative values indicate areas most affected by high subsidence rates. These zones are located in the districts of Bole-Saris (A), Ayat-Arabsa (B), Akaki-Kality (C), Atena-Tera (D), Kotebe (E), and Kolfe-Keraniyo (F).
Land 14 01020 g004
Figure 5. Urban expansion map of Addis Ababa from 1990 to 2020 (modified from [70]). The map illustrates the growth of urban areas in the Addis Ababa region over the three-decade period, highlighting key zones of urban sprawl and expansion. It provides insights into the spatial dynamics of urbanization, which are essential for understanding land-use changes and their potential environmental and socioeconomic impacts.
Land 14 01020 g005
Figure 6. Evolution of the land cover (i.e., anthropic pressure) in the areas labeled as (AD) in Figure 4: the aerial views show the land cover and displacement in mm on December 2014 (top left), December 2016 (top right), December 2018 (bottom left), and October 2020 (bottom right). The red boxes indicate the areas that have undergone significant changes.
Land 14 01020 g006aLand 14 01020 g006b
Figure 7. Time series plot for selected points (AF), as indicated in Figure 3. The plots show the temporal variation in vertical displacement (in mm) for each selected point, highlighting differences in displacement patterns across various locations within the study area. These points represent regions with varying degrees of subsidence and stability and can help in investigating the relationship between anthropogenic pressure and ground deformation.
Land 14 01020 g007
Figure 8. Time series plot showing the ENU (East, North, Up) displacement for ADIS station. The plot illustrates the temporal variations in the displacement components (East, North, and Up) over the study period, providing insights into the movement and deformation patterns at the ADIS station.
Land 14 01020 g008
Table 1. Total urban area (km2) and proportion (%) of the urban land increase from 2014 to 2021 in AA City [54].
Year20142015201620172018201920202021
Population3,709,0003,871,0004,040,0004,216,0004,400,0004,592,0004,794,0005,006,000
Growth Rate4.36%4.37%4.37%4.36%4.36%4.36%4.40%4.42%
Table 2. Total urban area (km2) and corresponding percentage (%) of urban land expansion in AA City from 1990 to 2020 [70].
Urban Area (km2)Percentage Increase in Urban Area (%)
19902000201020201990–20002000–20102010–20201990–2020
9113018229942.840.064.2228.5
Table 3. Annual increase (AI, km2) and normalized annual urban growth rate (AGR, %) for three consecutive periods between 1990 and 2020 in AA City [70]).
1990–20002000–20102010–2020Average
Increase (km2)3.95.211.76.93
Annual Growth Rate (%)3.63.45.14.03
Disclaimer/Publisher’s Note: The statements, opinions and data contained in all publications are solely those of the individual author(s) and contributor(s) and not of MDPI and/or the editor(s). MDPI and/or the editor(s) disclaim responsibility for any injury to people or property resulting from any ideas, methods, instructions or products referred to in the content.

