Article

Synergistic Zoning and Management Strategies for Ecosystem Service Value and Ecological Risk at the County Level: A Case Study of Songzi City, Hubei Province, China

1
Key Laboratory for Geographical Process Analysis & Simulation Hubei Province, Central China Normal University, Wuhan 430079, China
2
College of Urban and Environmental Sciences, Central China Normal University, Wuhan 430079, China
3
Hubei Institute of Economic and Social Development, Central China Normal University, Wuhan 430079, China
*
Author to whom correspondence should be addressed.
Land 2025, 14(5), 1021; https://doi.org/10.3390/land14051021
Submission received: 7 April 2025 / Revised: 3 May 2025 / Accepted: 5 May 2025 / Published: 8 May 2025

Abstract

:
Counties are fundamental units for ecological restoration, where scientifically delineated zoning is essential for resource allocation and governance. This study proposes a dual-dimensional, multi-source ecological zoning framework combining ecosystem service value (ESV) and Comprehensive Ecological Risk Index (CERI), with the CERI incorporating endogenous, exogenous, and regulatory ecological risk, providing a holistic representation of county-level ecological risk mechanisms. A Self-Organizing Map (SOM) neural network model clusters ESV and CERI, identifying spatial conflict zones and enabling high-resolution ecological management unit delineation. The results indicate the following: (1) The total ESV of Songzi City amounts to CNY 7.64 billion, showing spatial heterogeneity high-value clustering and low-value dispersion pattern, and water bodies and woodlands contributing 49.17% and 29.61%, respectively. (2) The spatial distribution of CERI is high in the central and eastern regions, and low in the west pattern, radiating from river systems under the combined effects of endogenous, exogenous, and regulatory risks. (3) Based on SOM clustering, four service clusters are identified and classified into ecological preventive conservation, vulnerability restoration, safeguard restoration, and improvement and utilization, shifting from broad-scale control to targeted ecological governance. This framework addresses the limitations of traditional single-dimensional risk assessments and provides a scientific basis for sustainable county-level ecological management.

1. Introduction

Since the beginning of the 21st century, rapid population growth and accelerated urbanization have intensified the human exploitation of natural resources, leading to significant degradation of ecosystem services and increased ecological fragility [1]. As ecological challenges, nations and regions worldwide have increasingly recognized the urgency of ecological restoration [2]. In response, the United Nations launched the Decade on Ecosystem Restoration (2021–2030) in 2019, aiming to achieve sustainable development through ecological reconstruction, rehabilitation, and reorganization [3,4]. In March 2024, the General Office of the Central Committee of the Communist Party of China and the State Council released the Guidelines on Strengthening Ecological and Environmental Zoning Control, which explicitly state that implementing a differentiated and precise environmental management system based on zoning control is a key measure for enhancing modern ecological governance. As the fundamental unit of ecological restoration, county-level regions play a significant role in implementing national and provincial/municipal ecological policies, coordinating regional ecological resource distribution, and promoting sustainable development [5]. However, traditional ecological zoning methods often inadequately capture the fine-scale heterogeneity of the ecological environment at the countylevel, thereby limiting the effectiveness and precision of restoration initiatives. To accurately identify regional restoration priorities and objectives, it is imperative to assess both the ecosystem service value (ESV) and Ecological Risk Index (ERI) at the county level, providing essential support for regional ecological, environmental protection, and sustainable development [6].
Ecological zoning is a fundamental strategy for ensuring sustainable ecosystem development through scientifically guided planning and management [7]. By Canadian ecologist Loucks in 1962 and further development by Bailey’s comprehensive framework in 1976, the concept has since evolved through various methodological advances [8,9]. In the field of ecological zoning research, a variety of methods have been widely used. International research has primarily focused on constructing indicator-based frameworks for ecological zoning. For example, Sadeghi et al. [10] used a Pressure–State–Response (PSR) model to assess watershed health in Iran, advocating for a multi-indicator integration approach and hierarchical management strategies. Similarly, Sarker et al. [11] defined multi-tiered marine protected areas based on socioeconomic and ecological data, while Raj and Sharma [12] evaluated ecological vulnerability by analyzing ecosystem pressure, resilience, and recovery potential to delineate zoning strategies. In China, ecological zoning research has focused on ecologically sensitive regions such as arid areas [4], and river systems [6,7], with an established framework for the construction of ecological security patterns [13], ecological functional zoning [7,8], the evaluation of ecosystem service trade-offs and synergies [14], supply–demand relationships [15], and value–risk assessments [16,17,18]. Despite their achievements, several limitations persist. Ecological security pattern analysis emphasizes ecological networks and barrier functions but often neglects the dynamic evolution of ecological risks. Meanwhile, ecological function zoning, though effective for large-scale ecological regulation, tends to overlook local ecological risk heterogeneity at finer scales [7,8]. Moreover, many studies focus solely on the trade-offs and synergies of ecosystem services without sufficiently addressing their interactions with ecological risks, thus constraining the development of integrated management strategies.
In recent years, assessments that integrate ESV and ERI have garnered increasing attention for ecological zoning [19,20,21]. This dual-dimensional approach simultaneously evaluates ecosystem service provision and ecological risk exposure, enhancing the scientific rigor and spatial precision of the zoning framework [20]. Specifically, ESV quantifies the direct and indirect contributions of ecosystems to human well-being, providing critical insights for identifying key functional areas, designing ecological compensation mechanisms, and promoting rational resource use [22]. ERI assesses the susceptibility of ecosystems to degradation from natural and anthropogenic disturbances, offering a spatial foundation for identifying vulnerable zones and informing risk prevention efforts [19,20]. The integration of ESV and ERI facilitates the identification of spatial patterns, which refine zoning strategies for both protection and sustainable utilization. Compared with traditional ecological zoning methods, the integrated assessment approach based on ESV and ERI enables more precise identification of ecosystem service distribution, thereby enhancing the accuracy, adaptability, and fine-grained guidance of regional ecological management [18,21,23]. However, the existing studies are constrained by two critical gaps. First, ERI assessments typically focus on isolated or single-source risks, neglecting the synergistic effects of multiple endogenous, exogenous, and regulatory risk factors. Second, most research remains anchored at large spatial scales, such as urban agglomerations [24], provinces [22], and cities [25], failing to capture the spatial heterogeneity and management needs at the county level. This omission reduces the precision and specificity of ecological restoration strategies. Amid accelerating urbanization and intensifying ecological pressures, county-level administrative units serve as pivotal nodes within China’s multi-tiered governance framework, bridging provincial, municipal, and township jurisdictions while assuming critical responsibilities for ecological restoration implementation and policy alignment. Thus, formulating targeted ecological restoration strategies at the county level and improving the operational feasibility of zoning management constitute the central focus of this study. To address this gap, this study proposes an innovative dual-dimensional, multi-source integrated ecological zoning framework. This framework integrates the ESV with the Comprehensive Ecological Risk Index (CERI), incorporating three risk dimensions (endogenous, exogenous, and regulatory), thereby enhancing the scientific basis and spatial resolution of ecological zoning. This approach enables the conversion of ecological advantages into developmental strengths, thereby promoting country-level high-quality development while ensuring the long-term stability and sustainability of ecosystems, ultimately achieving coordinated economic–ecological development.
Located in the southwestern Hubei Province, China, Songzi City is geographically delineated by the Yangtze River to the south and the piedmont zones of the Wuling Mountains to the north. Functioning as a critical ecological corridor linking the Jianghan Plain with the Three Gorges Reservoir Area, the city encompasses key ecological entities such as the Weishui Reservoir and Xiaonanhai Lake, which collectively sustain indispensable ecosystem services. As designated in China’s third cohort of resource-exhausted cities, Songzi currently confronts a dual mandate of ecological rehabilitation and industrial transformation. Despite recent advancements in promoting “ecological development” and “green growth” strategies, a persistent disjunction persists between strategic planning at the policy level and operational implementation at the local scale. This governance disconnect exacerbates fundamental trade-offs between ecological preservation and resource exploitation, necessitating the establishment of an enhanced ecological zoning framework. Such a system would improve both methodological robustness and spatial resolution in ecological management, thereby fortifying foundational support for the city’s sustainable development trajectory.
Our study objectives are as follows: (1) At the theoretical level, this study aims to address the inherent limitations of traditional uni-dimensional approaches in landscape ecological risk assessment by integrating ESV with multi-source Comprehensive Ecological Risk Index (CERI), including endogenous, exogenous, and regulatory factors. This integration expands the theoretical framework of ecological risk research and provides a novel lens to understand the dynamics of ecological risk within coupled human–nature–policy systems. (2) At the practical level, the study challenges the conventional perception of countries as homogeneous units by disaggregating them into fine-scale grid cells. This approach enables fine-scale spatial analysis of ESV and CERI, substantially improving the accuracy, practical relevance, and management efficiency of ecological decision making. It provides both a solid theoretical foundation and actionable strategies to support county-level ecological conservation and sustainable development.

2. Materials and Methods
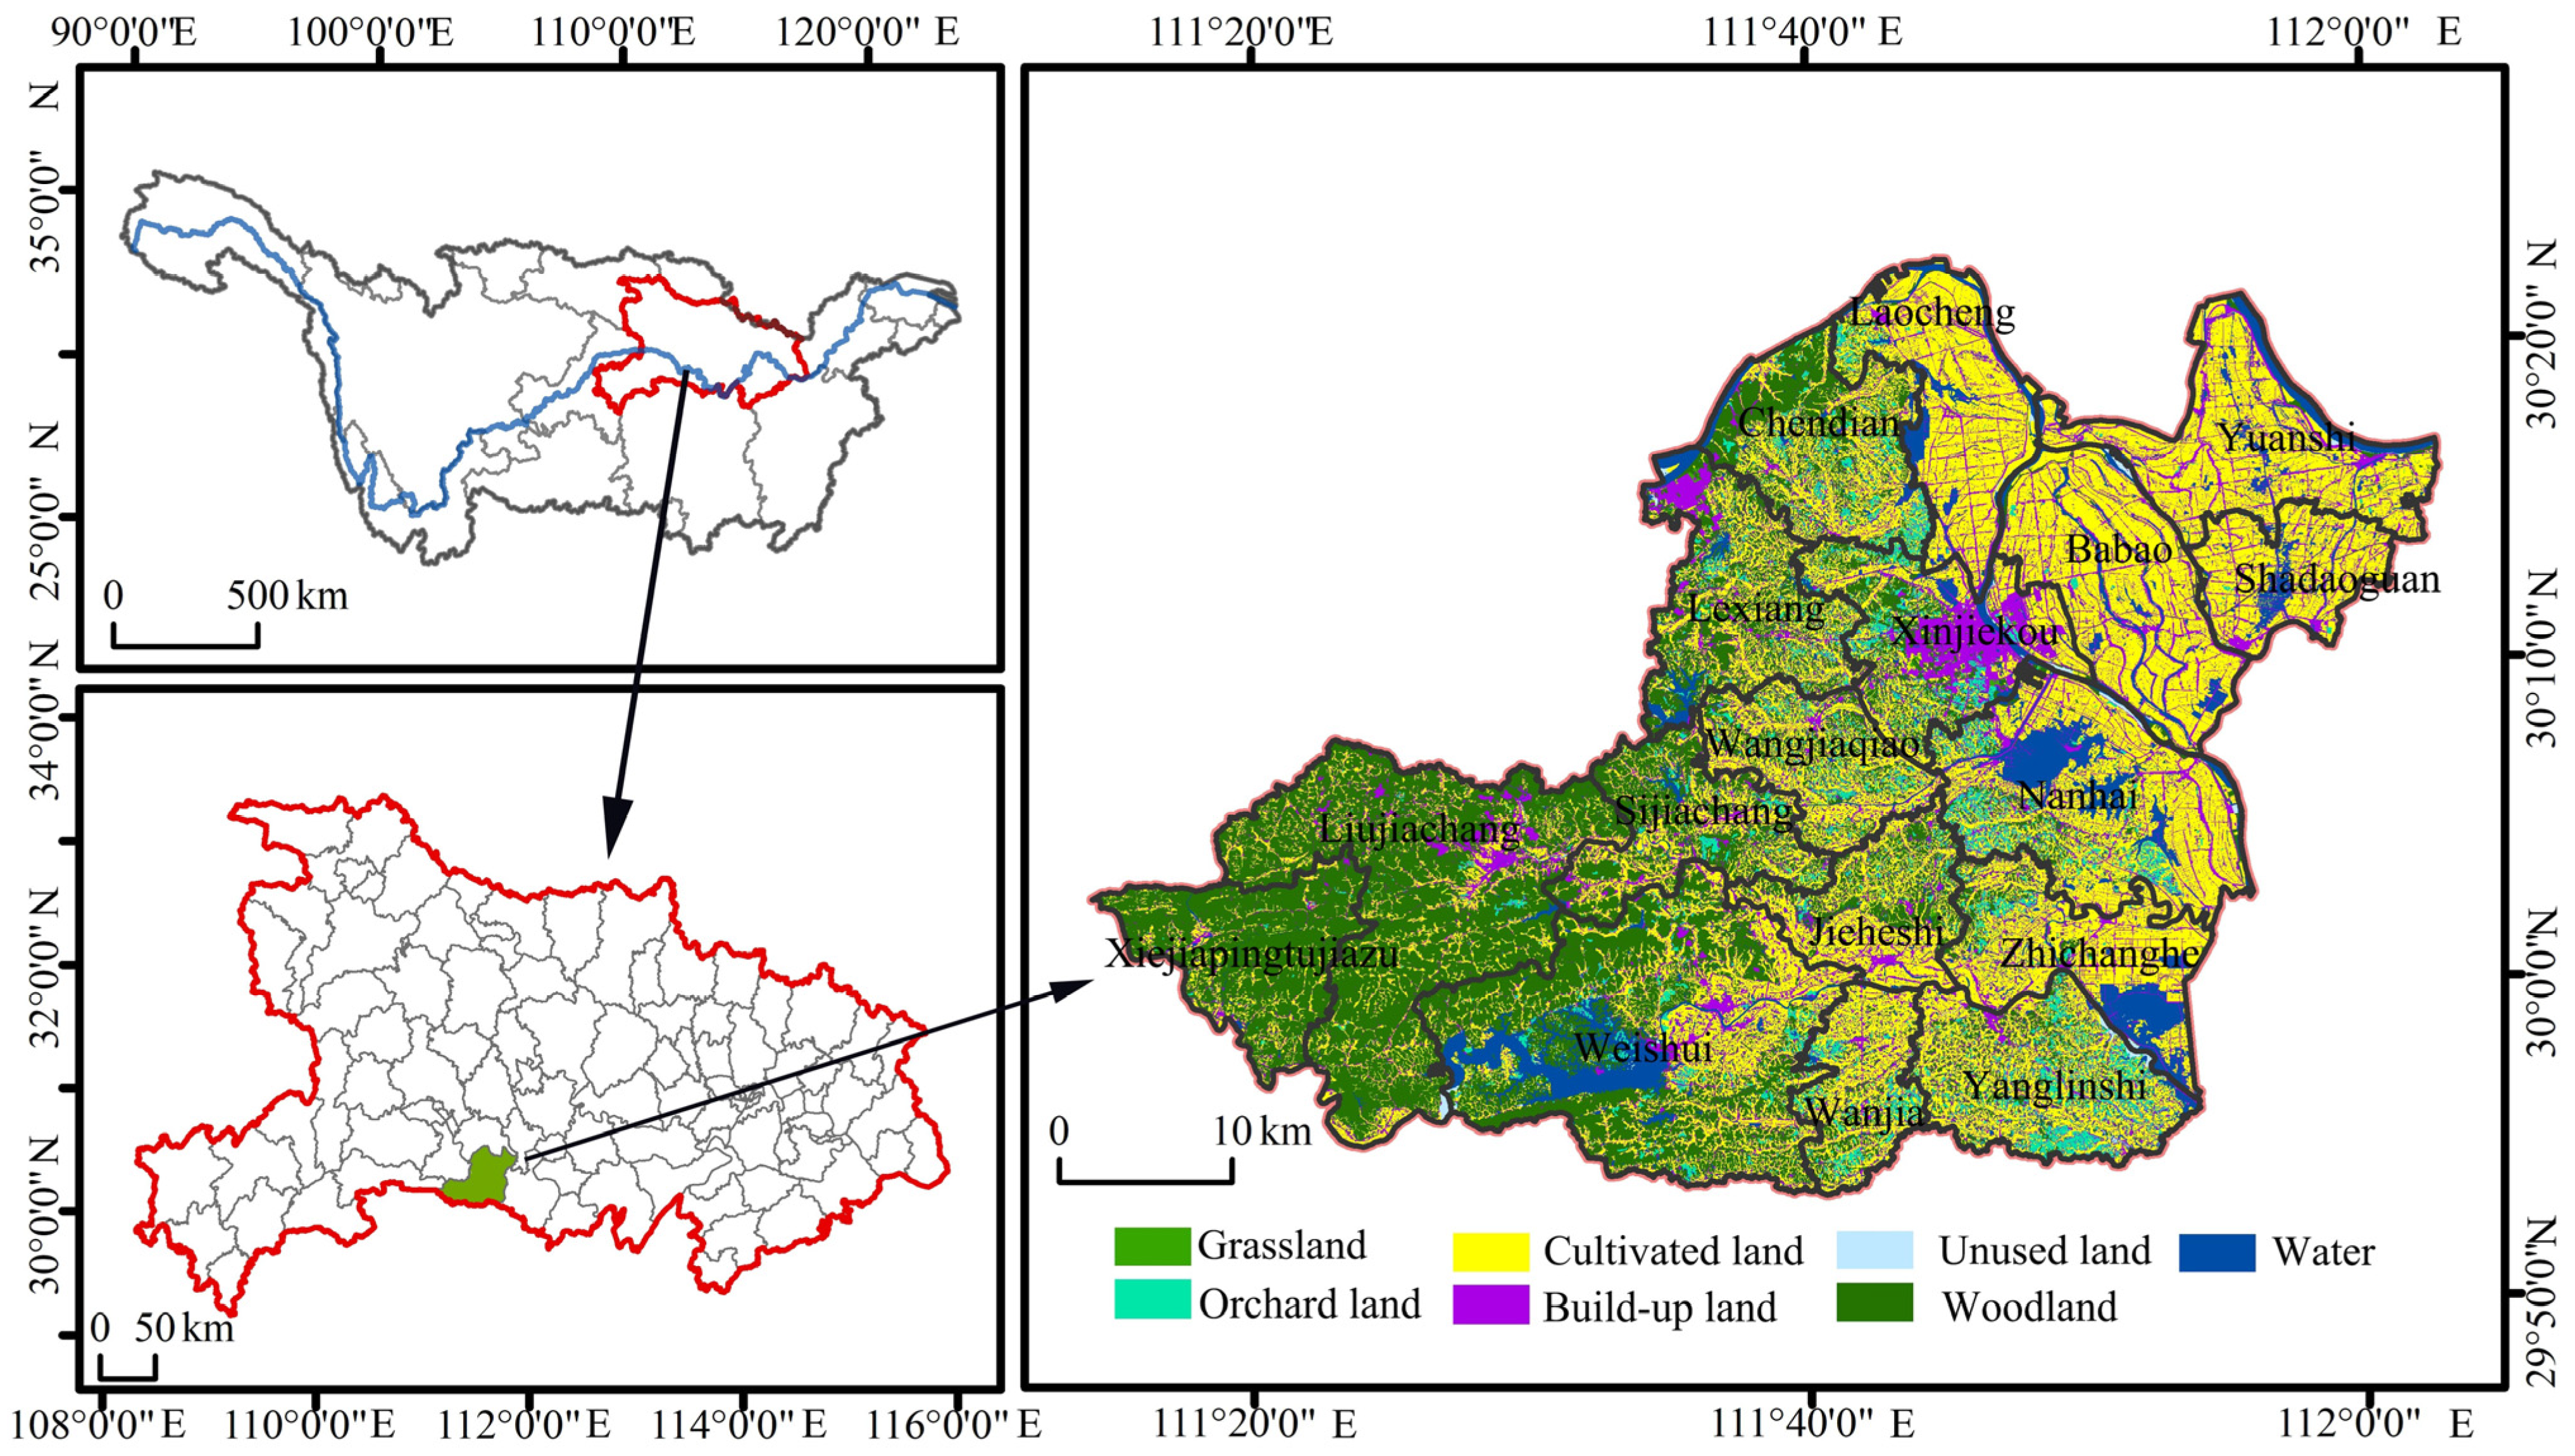
2.1. Study Area

Songzi City is located in the southwestern part of Hubei Province, within the middle reaches of the Yangtze River. A 27.36 km stretch of the Yangtze River’s Golden Waterway flows through its territory, making the city a crucial hub connecting the upper and lower reaches of the Yangtze River Basin. As a primary conduit for water inflow from the Yangtze River Basin into the Jianghan Plain, Songzi City encompasses four major water systems, 48 rivers, 13 lakes, and 60 reservoirs. It serves as an ecological security buffer for the Jianghan Plain and a critical water source for the Jingzhou region (Figure 1). However, the city faces considerable ecological security challenges. In 2011, Songzi City was designated as a national resource-exhausted city, highlighting the inherent conflict between economic development and ecological protection, which manifests in the following aspects: (1) Severe soil erosion in mountainous regions: The southwestern mountainous areas of the county contain a high proportion of sloping arable land, leading to severe soil erosion. Low and unstable agricultural yields further constrain land use efficiency and the region’s environmental carrying capacity, necessitating a more rational resource allocation to enhance both ecological and economic benefits. (2) Intensive human activities and water pollution: The central and eastern regions of the city have high population density, intensive agricultural land use, and a concentration of rivers and lakes. These factors contribute to severe challenges, including excessive water resource exploitation, agricultural non-point source pollution, and environmental degradation. (3) Inadequate ecological damage control: The existing ecological restoration efforts are hindered by weak regulatory enforcement, ineffective supervision, and a lack of coordinated maintenance strategies. The absence of an integrated governance mechanism exacerbates these issues, leading to persistent ecological risks. Given these challenges, Songzi City is situated at the intersection of several major national strategic initiatives, including the Yangtze River Economic Belt, the Middle Reaches City Cluster of the Yangtze River, the Dongting Lake Ecological Economic Zone, and the West Hubei Ecological, Cultural, and Tourism Circle. This positioning subjects the city to multiple development imperatives, including economic transformation, urbanization, ecological protection, and cultural tourism development. Its unique geographical location, complex ecological challenges, and diverse development tasks make it a valuable case study for county-level ecological protection and high-quality development.

2.2. Data Sources

To ensure a comprehensive assessment of ecosystem services and ecological risks, this study integrates multiple datasets from various authoritative sources: (1) Land use and spatial planning data, obtained from the Songzi City Natural Resources and Planning Bureau, with the 2020 land change survey serving as the primary data source. (2) Population data, sourced from the World Population Data Platform (https://www.worldpop.org/, accessed on 18 October 2024), with a 100 m resolution, and further refined using township-level statistical corrections. (3) Road network data retrieved from OpenStreetMap (https://www.openstreetmap.org/, accessed on 29 September 2024). (4) Vegetation and productivity data, including the Normalized Difference Vegetation Index (NDVI) and Gross Primary Productivity (GPP), obtained from the National Earth System Science Data Center (https://www.geodata.cn/main/, accessed on 25 October 2024) at a 500 m resolution. (5) Socioeconomic data from the China Statistical Yearbook, the Songzi City Statistical Yearbook, and the National Compendium of Cost and Benefit Information of Agricultural Products.
To establish a scientific ecological zoning framework, this study accounts for landscape heterogeneity, patch size, and the total area of the study region. Following the principle that the selected grid size should be 2–5 times the average landscape patch size [26,27] while also considering sampling efficiency and computational feasibility, we employed the fishnet tool in ArcGIS 10.8 to transform Songzi City’s administrative divisions into a 500 m × 500 m grid system, resulting in 9082 grid cells as the fundamental units for evaluation.

2.3. Methods

2.3.1. Ecosystem Service Value Estimation

The equivalent factor method has been extensively applied in ESV assessments due to its computational efficiency and scalability across spatial scales [28]. To enhance the accuracy of county-level ESV estimations, this study adopts an adjusted equivalent factors approach, incorporating refinements proposed by Xie et al. and Cui et al. [29,30]. These adjustments incorporate region-specific biophysical parameters to enhance spatial precision for micro-scale assessments. Provisioning services, such as food production, raw material production, and water supply, are calibrated as follows: Food production is subdivided into categories (e.g., crops, fruits, vegetables, aquatic products, and livestock), with adjustments based on the total agricultural, forestry, animal husbandry, and fishery output per unit area [29]. Raw material production is modified using the Normalized Difference Vegetation Index (NDVI) [29]. Water supply is adjusted according to per capita availability, reflecting local hydrological conditions. Regulatory services and support services are fundamental components of the overall ecosystem productivity. As Gross Primary Productivity (GPP) directly reflects ecological productivity, it is utilized to calibrate the valuation of these services [30]. Cultural services exhibit significant spatial heterogeneity due to variations in cultural resources, tourism development, and consumer preferences [31]. Thus, tourism revenue data are incorporated as a key adjustment factor [32]. The adjusted equivalent factors C i is calculated as follows:
C i = a i A i
where a i   and   A i denote the study area’s and national averages for total agricultural, forestry, animal husbandry, and fishery output per unit area, NDVI, per capita water availability, annual GPP, and the ratio of tourism revenue to GDP.
The ESV per unit area is subsequently calculated using Songzi City’s major crop yields (kg), planting areas (ha), per-unit output (kg ha−1), and national average market prices (CNY kg−1). These adjusted equivalent factors ( VC i ) are then applied to the grid-based land use dataset to compute ESV at the pixel level, following the equation below:
The ESV for each land use type within a grid ( E S V i ) is determined by the following:
E S V i = k = 1 n A k i VC i
where E S V i represents the ecosystem services value (ESV) for the ith land use type, VC i denotes the adjusted equivalent value coefficient for the ith ecosystem service category (dimensionless), and A k i represents the spatial (hm2) of the kth grid’s ith land use type.
The ESV of each grid cell is computed using the following equation:
E S V = i = 1 n E S V i

2.3.2. Comprehensive Ecological Risk Assessment

ERI arises from complex interactions between anthropogenic activities and the natural environment. Traditional single-indicator assessments often fail to capture the multi-dimensional nature of ecological risks, limiting their applicability for precise environmental management [16,33]. To address this limitation, this study constructs a CERI that integrates three key dimensions: endogenous, exogenous, and regulatory risk. Endogenous ecological risk reflects the internal ecological stability and system functions of the natural environment, revealing the inherent vulnerabilities within the ecosystem [16,21]. Exogenous ecological risk primarily reflects the negative impacts brought by anthropogenic activities, particularly the disruption of ecosystem service functions [33]. Regulatory ecological risk is defined as a concept that leverages policy frameworks to pinpoint areas requiring special protection and mitigate developmental pressures exacerbating ecological vulnerabilities [12]. By comprehensively considering the sources of these three dimensions of risk, we have developed a comprehensive ecological risk assessment framework. This framework, grounded in the synergistic integration of natural, socioeconomic, and policy factors, identifies the sources of various ecological risks and provides scientific support for ecological management decisions at the county level.
(1)
Endogenous Ecological Risk
Endogenous ecological risk (ENER) reflects the intrinsic vulnerability of the ecosystem, which is primarily influenced by landscape fragmentation, landscape separation, and landscape dominance [20]. To quantify this, we adopted a landscape disturbance index ( U i ) and a landscape vulnerability index ( E i ), incorporating metrics such as fragmentation, separation, and dominance indices [26,27]. The ENER for each grid cell ( E N E R i ) is calculated using the following equations:
E N E R i = i = 1 n A k i A k E i × U i
E i = a C i + b S i + c K i
where n is the number of landscape types, A k i represent the area of landscape type i within grid k, and A k is the total area of grid k. Referring to related studies [26,27], the weights are set as a = 0.5, b = 0.3, and c = 0.2.
(2)
Exogenous Ecological Risk
Exogenous ecological risk (EXER) is driven by anthropogenic activities such as population expansion, land use transformations, and transportation infrastructure development [33]. These factors contribute to habitat degradation, resource overexploitation, and elevated environmental pollution loads [34,35,36]. To quantitatively assess these human-induced pressures, a Human Activity Index (HAI) is constructed, which integrates three components: Population Disturbance Intensity (PDIS), Land Use Intensity (LUIS), and Traffic Disturbance Intensity (TDIS).
P D I S i = 10 ,   P d 1000   people / km 2 3.333 × log P d + 1 , P d < 10000   people / km 2
N o r P D I S i = P D I S i m i n P D I S m a x P D I S m i n P D I S
where P d represents the population density ( p e o p l e / k m 2 ) ; N o r P D I S i represents the normalized disturbance intensity score of population density of grid i, ranging from 0∼1; and m a x P D I S and m i n P D I S represent the maximum and minimum PDIS values across all the grid cells, respectively. This normalization ensures comparability across spatial units.
L U I S i = 100 × i = 1 n A i P i A T
N o r L U I S i = L U I S i m i n L U I S m a x L U I S m i n L U I S
where A i represents the area of the ith land use type, A T represents the total area of the study area, and P i represents the disturbance intensity score for land use type i. The normalized Land Use Intensity Score ( N o r L U I S i ) is then calculated through min–max normalization. m a x L U I S and m i n L U I S represent the maximum and minimum LUIS values across all the grid cells, respectively. Reference is made to existing studies to assign the degree of land use [36,37].
E X E R i = N o r P D I S i + N o r L U I S i + N o r T D I S i
where E X E R i is the exogenous ecological risk for each grid, and T D I S i is the traffic intensity in the ith grid, determined by road type, buffer zone distance, and assigned interference scores based on existing research [36]. The normalized Traffic Disturbance Intensity ( N o r T D I S i ) is then calculated through min–max normalization.
(3)
Regulatory Ecological Risk
Regulatory ecological risk (REER) refers to the systematic intervention against ecosystem damage induced by various stochastic factors through regulatory and managerial strategies, thereby mitigating both the probability and intensity of ecological risk manifestations. In alignment with the Regulatory Measures for Ecological Protection Redlines and the Comprehensive Basin Management and Integrated Development Plan of Hubei Province, this study implements a spatially explicit risk quantification framework. Specifically, grid cells entirely encompassed by dike systems, flood retention zones, reservoir catchments, lacustrine environments, riverine networks, cultivated land protection red line, and ecological protection red line are assigned a standardized risk value of 10. Conversely, grid cells outside these defined areas are assigned a value of 0, with cumulative scoring applied across intersecting boundaries. Specifically, the failure of dykes and irrational development of flood storage and retention areas can severely compromise ecological structures and functions during flood events, thereby threatening surrounding water quality and the ecological chain. Irrational reservoir operations may alter ecological flow, water temperature, and water quality, consequently affecting the survival of aquatic organisms and overall ecosystem health. Pollution of rivers and lakes from industry, domestic, and agricultural sources will lead to a reduction in biodiversity. Excessive use of fertilizers and pesticides, along with irrational land use patterns within the red line of arable land, will further decrease biodiversity. Within the red line of arable land protection, the excessive application of fertilizers and pesticides, coupled with irrational land use, can degrade soil quality, thereby impairing ecosystem service functions. The red line of ecological protection, serving as a critical ecological security barrier, may trigger ecological risks such as biodiversity loss and ecosystem instability if compromised. Given the complex interrelationships among these factors and the comprehensive influence of each resource within the ecosystem, it is difficult to assess the relative importance of each resource in controlling ecological risks from a single dimension; therefore, no specific weights are assigned in the calculation of regulatory ecological risk. The REER formula is as follows:
R E E R i = W S i + W E S i + F S i + E S i
where R E E R i is the regulatory ecological risk of grid i, W S i is the bottom-line control of water security of each grid, W E S i is the bottom-line control of water environmental security of each grid, F S i is the bottom-line control of food security of each grid, and E S i is the bottom-line control of the ecological security of each grid.
(4)
Comprehensive Ecological Risk Index
To achieve a comprehensive assessment of multi-source ecological risk in Songzi City, this study developed a CERI, which integrates three key dimensions—ENER, EXER, and REER. Specifically, ENER reflects the internal structural vulnerability of ecosystems, and EXER reflects the intensity of external disturbances caused by human activities. These two factors represent the potential pressures of disturbance and degradation that ecosystems face. Higher values indicate greater ecological instability and increased risk of disturbance, thus they are defined as “positive risk factors.” In contrast, REER refers to the capacity of the regional ecosystems to mitigate damage from various uncertainties through management and regulatory measures, thereby reducing both the likelihood and the impact of ecological risks. This dimension includes policy and management interventions that aim to minimize external disturbances and enhance the resilience and recovery capacity of the ecosystem. Accordingly, REER is considered a “negative risk factor”.
Given the differences in units and scales among the indicators, the study employs the min–max normalization method to standardize all the variables. Indicator weights were determined using the Analytic Hierarchy Process (AHP) based on expert judgment. Ten specialists in environmental science and geography provided pairwise comparisons to construct the judgment matrix, which yielded a Consistency Ratio (CR) of 0.070 (<0.1), confirming the matrix’s logical consistency. The final weights assigned to each dimension are as follows: ENER (0.4), EXER (0.4), and REER (0.2). The CERI is calculated as follows:
C E R I i = 0.4 E N E R i + 0.4 E X E R i 0.2 R E E R i

2.3.3. Ecosystem Service Cluster Identification

Ecosystem service clusters categorize spatial units based on similarities in ESV and CERI [38,39]. The Self-Organizing Map (SOM) neural network model is an unsupervised learning technique that combines principal component analysis (PCA) and K-means cluster analysis [40]. SOM has been widely applied for spatial data clustering due to its ability to handle high-dimensional data and uncover complex patterns in an unsupervised manner [41,42]. It features parallel processing, self-organization, self-learning, robustness, and fault tolerance, making it well suited for ecological data analysis [43]. During the SOM’s training process, the algorithm identifies the closest “winning unit” based on input vectors, iteratively adjusts initial weights, and adjusts the output nodes to approximate the topological features of the input vector [41]. Subsequently, it maps clustering results in a two-dimensional format. The SOM algorithm adapts to input patterns, iteratively fine-tuning node weights to minimize the distance from input vectors. This facilitates the formation of spatially coherent clusters and maps distinct ecological patterns across Songzi City. These clusters form the basis for delineating zoning units and for developing targeted management strategies. In the implementation of the SOM, 9082 image elements of Songzi City were used as sample inputs to identify ecosystem service clusters for partitioning using the Kohonen package in R4.3.3.
In this study, the SOM neural network model was employed to conduct a comprehensive analysis of 9082 grid cells within the study area, achieving an in-depth integration of ESV and the CERI. The SOM method autonomously classified the grid cells into distinct categories based on intrinsic data characteristics, with each category representing spatial regions exhibiting similar ESV and CERI profiles. Through a detailed examination of the clustering results, the study successfully identified the compositional characteristics of ecosystem service values and the sources of ecological risks across different zones. Moreover, it revealed the complex internal relationships and spatial interactions between ESV and CERI, thereby providing a scientific foundation for regional ecological conservation and management efforts.

3. Results

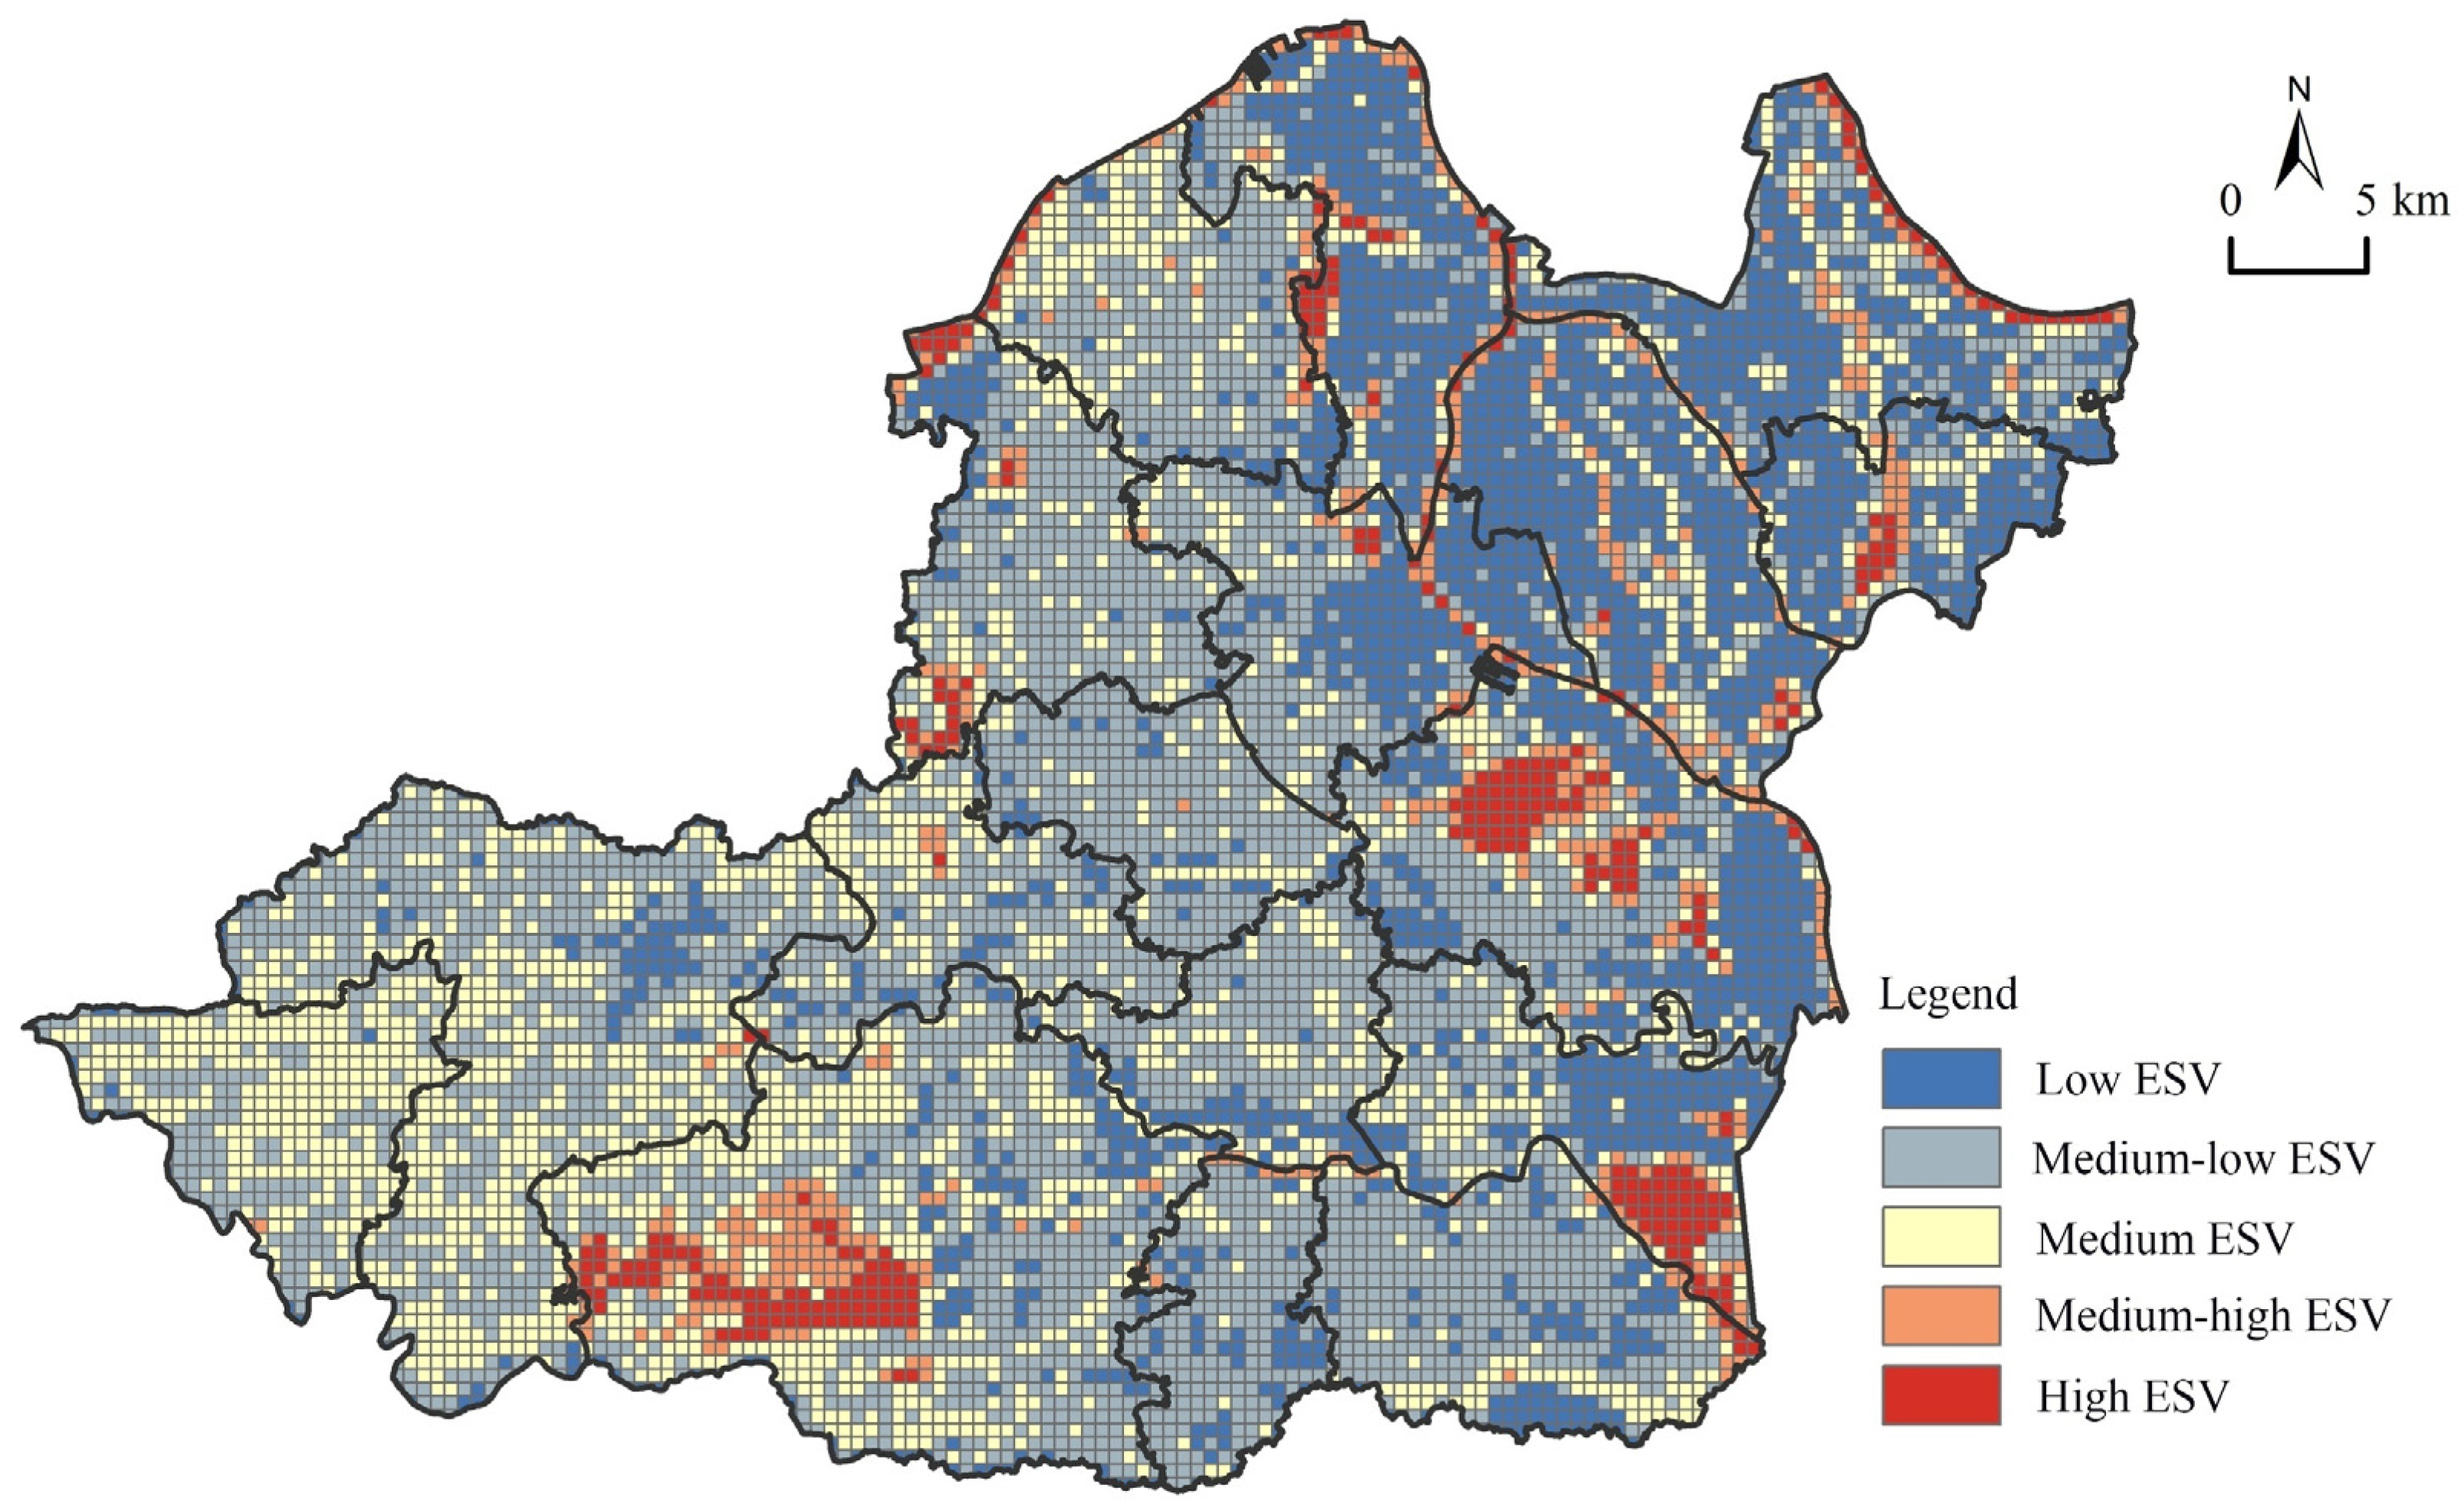
3.1. Ecosystem Service Value Assessment

As shown in Table 1, the total ESV of Songzi City is CNY 7.64 billion, exhibiting significant spatial heterogeneity. The distribution follows a pattern of high-value clustering and low-value dispersion, indicating concentrated ecological value in certain regions. Among the land use types, water bodies and woodlands contribute the highest ESV, accounting for 49.17% and 29.61% of the total value, respectively. This highlights the critical role of water and woodland ecosystems in maintaining regional ecological stability. From a per-unit-area perspective, water and woodlands exhibit the highest ESV, followed by Orchard lands and grasslands, with cultivated land ranking the lowest (Table 2). Regarding ecosystem service categories, regulatory services contribute the largest share, exceeding supply services, support services, and cultural services. Notably, regulatory services and support services together constitute 64.38% of the total ESV, underscoring their dominant role in regional ecological function.
The natural breaks method (Jenks optimization) is a classification technique that maximizes inter-group variance while minimizing intra-group variance, effectively identifying ESV intervals and grouping them into appropriate categories. This method ensures that the final classification results align with the actual ESV distribution in the study area. Accordingly, the ESV of Songzi City is classified into five distinct grades using the natural breaks method (Figure 2). The results reveal significant spatial heterogeneity in ESV across Songzi City, exhibiting a staggered distribution pattern characterized by high-value clustering and low-value dispersion. High-value and medium-high-value areas are predominantly concentrated around lakes and reservoirs, which hold higher ecological importance and deliver greater ecosystem services. In contrast, low-value areas are primarily located in the eastern part of the city, encompassing rural settlements, cultivated land, and built-up land, where intensive land use and high levels of human activity contribute to a decline in ESV.

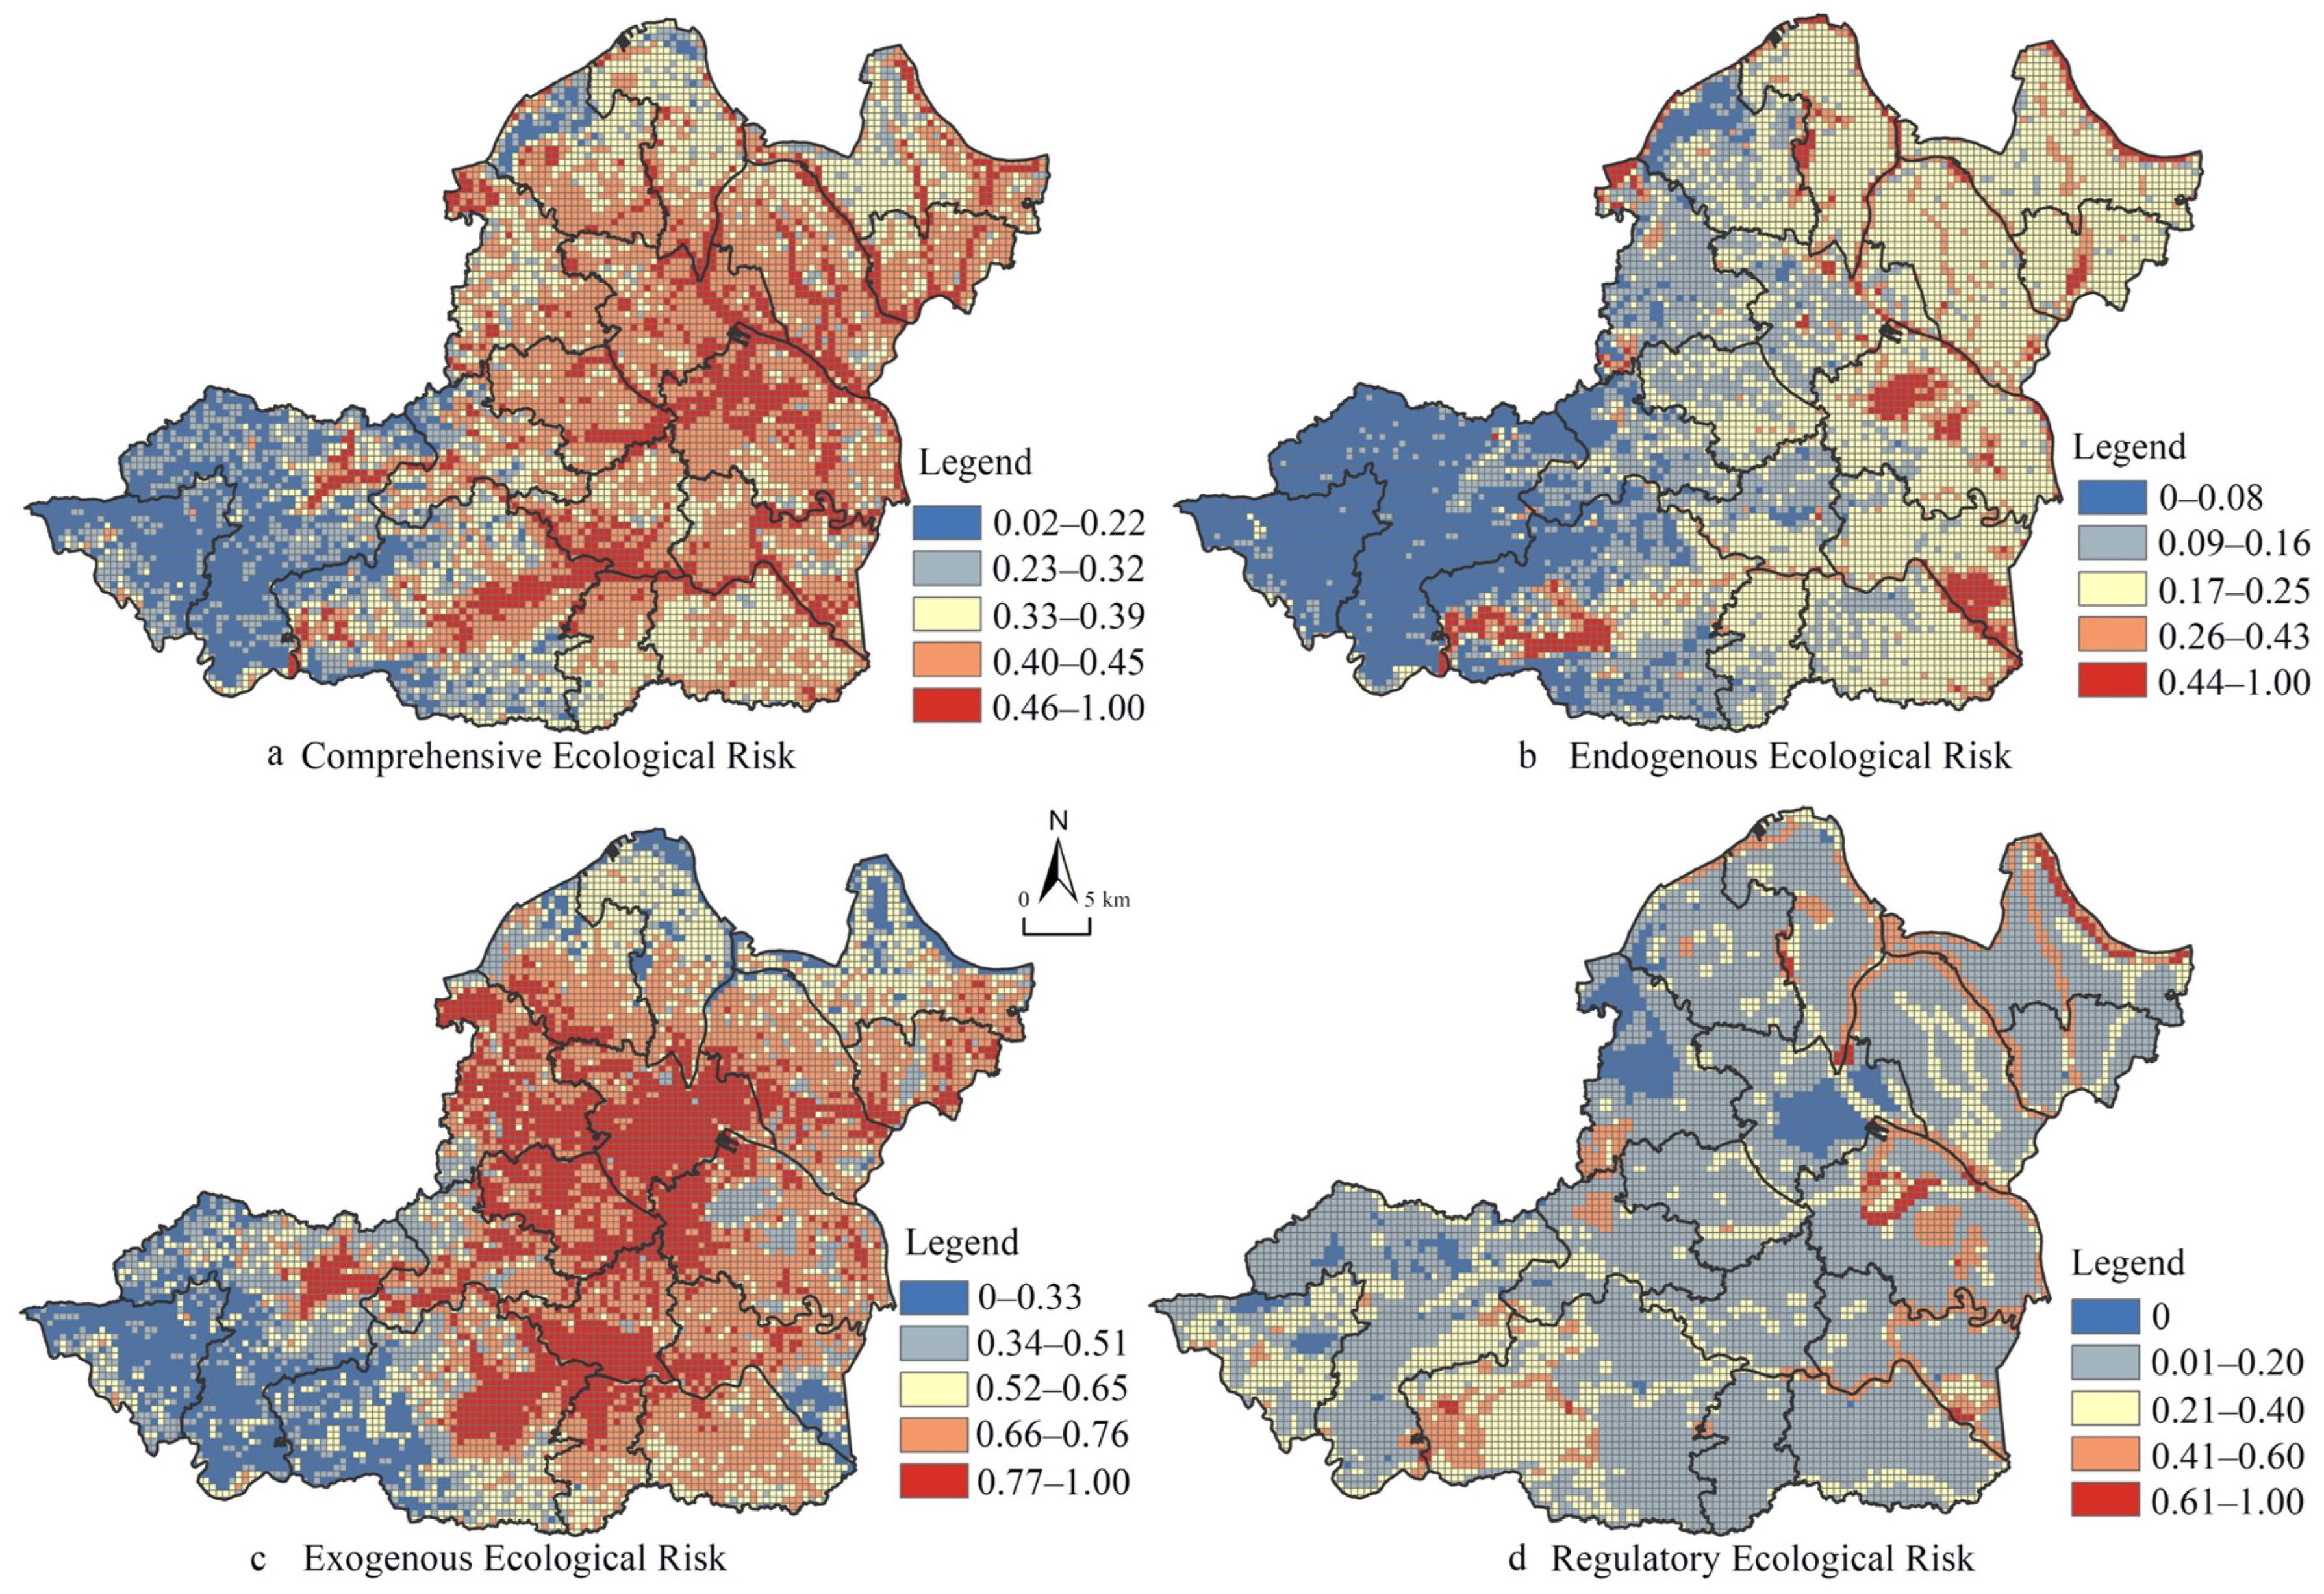
3.2. Comprehensive Ecological Risk Index Identification

The CERI for Songzi City follows a spatial pattern of high in the central and eastern regions and low in the west, radiating outward from major river systems (Figure 3a). This pattern reflects the combined impact of endogenous, exogenous, and regulatory ecological risks. The central and eastern areas are subject to intensified ecological risks due to high agricultural development, leading to increased soil erosion and surface pollution. In contrast, the western mountainous areas experience lower ecological risks, attributed to their extensive forest cover and strong ecological regulation capacity. Endogenous ecological risk exhibits a higher in the east, and lower in the west distribution (Figure 3b). High-risk zones are scattered around water bodies, where frequent human–water interactions disturb aquatic ecosystems. In contrast, western forested areas exhibit lower risk levels due to extensive vegetation coverage and limited anthropogenic disturbance. Exogenous ecological risk exhibits a high in the center and low in the periphery pattern (Figure 3c). The central region, with its high population density, industrial activity, and urban expansion, experiences intense human-induced ecological pressure, leading to habitat degradation and pollution. In contrast, peripheral areas, characterized by low population density and limited development, function as natural ecological buffers with lower risks. Regulatory ecological risk manifests distinctive patterns of Water Environmental Safety and Mountainous Ecological Stability (Figure 3d). The concept of Water Environmental Safety refers to the reduction in water pollution risks through the ecological restoration of riverine habitats and the implementation of water environmental management initiatives. Meanwhile, Mountainous Ecological Stability is highlighted by the protection of forested mountainous and hilly regions and the control of soil erosion, which sustain the ecological security of mountainous areas, thereby playing a crucial role in the overall risk control of the ecosystem in the region.

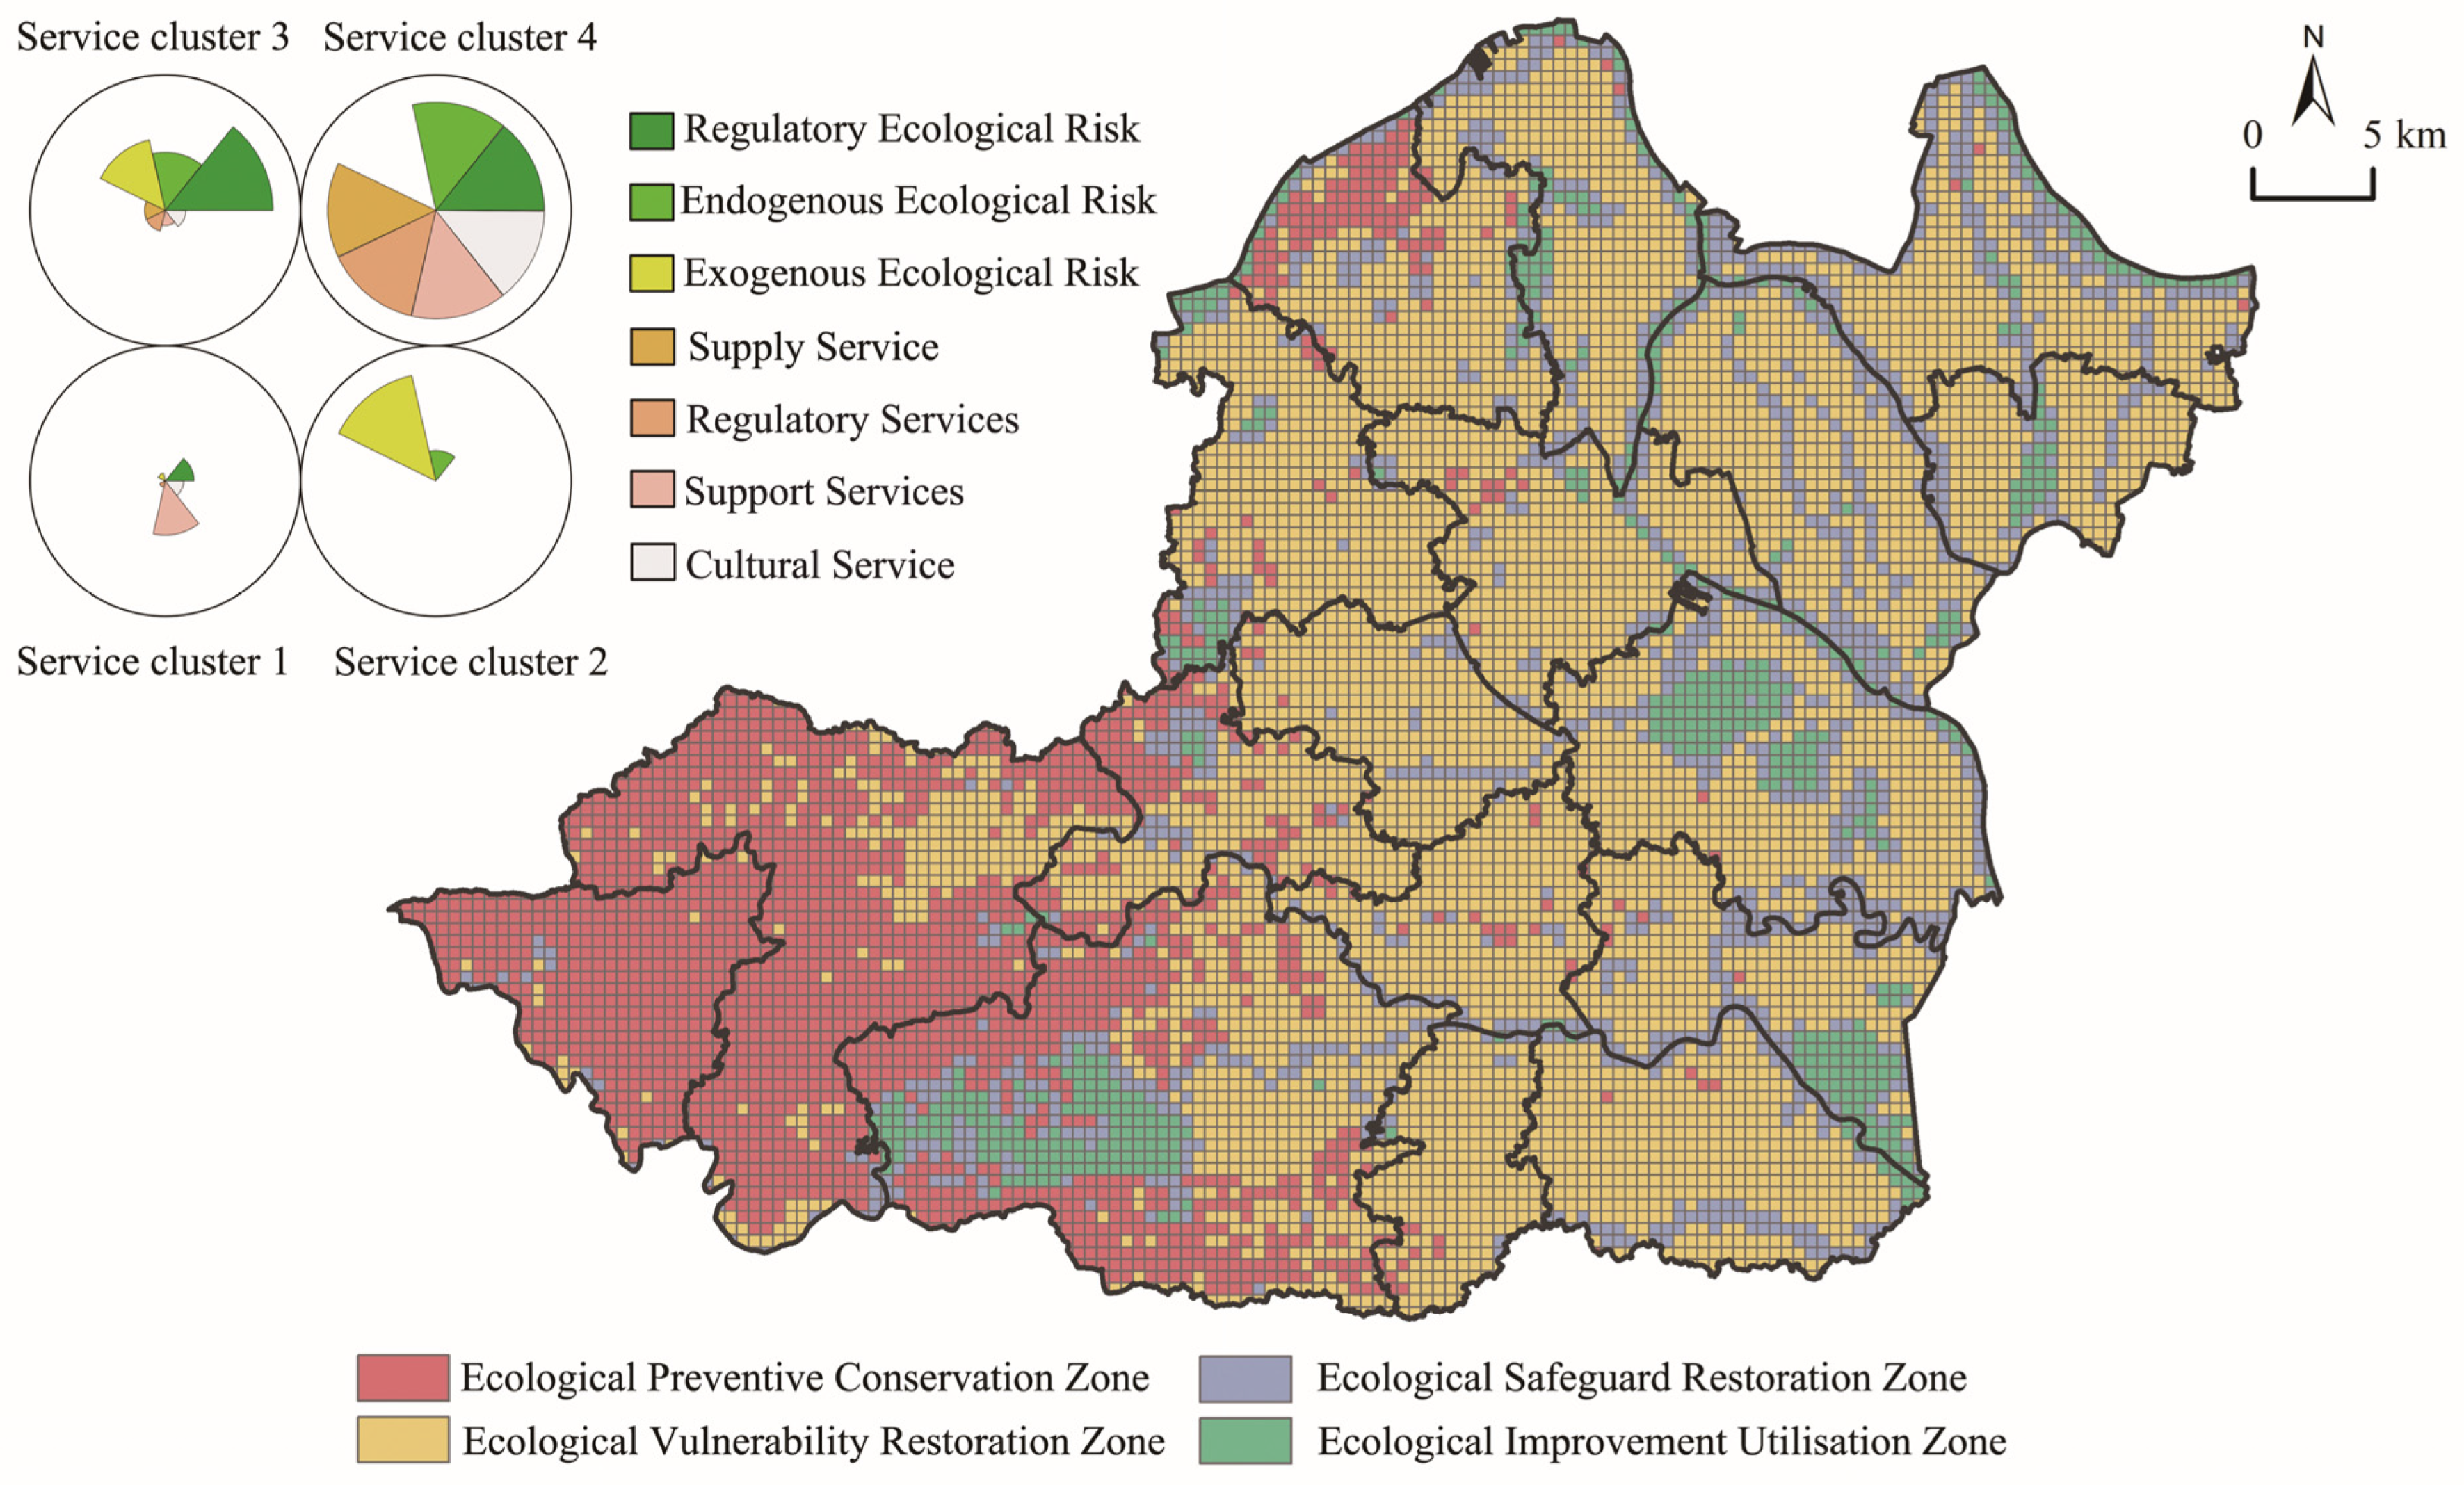
3.3. Zoning-Based Ecological Management Strategies

The study employs the SOM to identify four distinct ecosystem service clusters, which serve as the foundation for zoning-based ecological management strategies (Figure 4). Service Cluster 1, located in the western woodland of Songzi City, is characterized by support and cultural services with a relatively low ecological risk burden. Service Cluster 2, situated in the central part of the city, experiences significant exogenous and regulatory ecological risks, primarily driven by intensive human activities and land use changes. Service Cluster 3, predominantly found near watersheds, demonstrates higher ESV but faces substantial ecological risk pressures from various sources. Service Cluster 4, positioned at the intersection of reservoirs and lakes, is distinguished by both high ESV and CERI, highlighting the coexistence of ecological benefits and environmental vulnerabilities in this area. The delineation of these zones is based on the unique characteristics of each ecosystem service cluster, considering the dominant ecosystem services and ecological risks (Table 3 and Figure 4). Building on this classification, key functional and vulnerable zones were identified, enabling the development of targeted management strategies tailored to the specific ESV and CERI profiles of each zone.
The Ecological Preventive Conservation Zone (Service Cluster 1) is primarily composed of western woodlands and functions as a critical environmental security buffer for Songzi City. This region is fundamental to soil conservation, maintenance of nutrients, and biodiversity preservation but remains highly susceptible to geological hazards, particularly soil erosion. Therefore, reinforcing ecological protection and ensuring the stability and integrity of the ecosystem are key priorities for its future management. To mitigate soil and water erosion, it is essential to implement science-based erosion control strategies while upholding strict ecological safety standards. This includes expanding afforestation programs, strengthening forest ecosystem protection and restoration, and enhancing forest quality and vegetation density. Furthermore, targeted measures should be adopted to reduce the negative spillover effects of agricultural activities and urban expansion on natural ecosystems. A comprehensive forest management system should be proactively established, integrating ecological protection mechanisms at the county, township, and village levels. Moreover, effective interdepartmental coordination and rigorous enforcement of ecological policies are essential to ensuring the successful implementation of these conservation strategies.
The Ecological Vulnerability Restoration Zone (Service Cluster 2) is situated at the core of Songzi City, where intensive human activities and exogenous ecological risks are prevalent. It faces the dual challenges of low ESV and high CERI. To address these issues, zoning strategies should prioritize human activity management as a starting point, aiming to reduce anthropogenic pressures on the ecosystem and guide the transition of land use toward high ESV and low CERI. As a key agricultural development hub, this area must uphold the baseline of food security while implementing integrated pollution control measures. Efforts should be directed toward enhancing the comprehensive management of domestic and agricultural surface pollution, improving the efficiency of agricultural irrigation water use, and upgrading urban and rural sewage infrastructure to minimize the ecological footprint of human activities. Furthermore, as a center of economic growth, this zone should actively promote the transition from traditional industries to emerging sustainable industries, establishing an ecology + industry dual-driven development model. By fostering a mutually reinforcing cycle of ecological conservation and economic growth, this approach will lay a solid foundation for long-term sustainable development.
The Ecological Safeguard Restoration Zone (Service Cluster 3) exhibits a linear distribution along river corridors, reflecting the closely interconnected ecological relationships of river systems. The rivers and their surrounding areas form a diverse ecological network, which can effectively support the realization of various ecosystem services. However, in the face of multiple challenges posed by endogenous, exogenous, and regulatory ecological risks, the ecosystem continues to face growing pressures. Therefore, the effective management and regulation of these risks have become crucial for ensuring regional ecological health and enhancing ecosystem service value. To address these challenges, an integrated water resources and ecological management approach that encompasses the entire river basin is required. This approach should optimize water resource allocation, strengthen water quality protection, and place particular emphasis on the ecological connectivity and collaborative functioning of upstream and downstream regions, ensuring positive interactions between ecological nodes. Furthermore, the promotion of ecological compensation mechanisms and pollution source control is vital for reducing ecological risks. By linking resource distribution with stakeholder benefits, these mechanisms ensure the sustained provision of ecosystem services across all stages. Specifically, the ecological compensation mechanism encourages local governments and stakeholders to engage in environmental protection through clearly defined compensation subjects, methods, standards, and focus areas. Pollution source control, on the other hand, utilizes strict pollution discharge standards and technical measures to reduce the negative impacts on the ecological environment. These strategies will help to reduce ecological risks, foster ecosystem restoration, and further enhance the stability and sustainability of regional ecosystem service functions.
The Ecological Improvement and Utilization Zone (Service Cluster 4) is primarily concentrated in lake and reservoir areas, exhibiting distinct patchy characteristics, which possess high ESV but are highly susceptible to CERI. The ecosystems of lakes and reservoirs possess significant service value and are capable of continuously providing ecological functions. However, the maintenance of these functions is subject to the impact of endogenous and controllable ecological risks. Therefore, ecological protection and restoration should be considered a priority, with particular emphasis on the comprehensive management of the water environment, including the control of industrial pollution sources, the improvement of domestic wastewater treatment, and the enhancement of the sewage treatment network. On this basis, the rational use of ecological resources should be incorporated into regional development strategies, exploring the “Ecology +” industrial model to transform ecological resources into economic and service products, thereby optimizing resource utilization efficiency and promoting sustainable regional development. At the same time, a comprehensive mechanism for realizing the value of ecological products should be established, including ecological product certification and market trading mechanisms, to support the synergistic advancement of ecological protection and economic development, and promote their organic integration in resource utilization, industrial development, and environmental protection. By realizing the marketization and valorization of ecological products, not only can the economic benefits of ecological resources be enhanced, but the development of the green economy can also be promoted, thereby ensuring environmental sustainability while fostering high-quality regional economic growth.

4. Discussion

4.1. Comprehensive Assessment of Multi-Dimensional Ecological Risks

Ecological risk assessment serves as a fundamental basis for formulating ecological management strategies [6]. Previous studies have predominantly focused on single-source risk evaluations, particularly employing landscape ecological risk assessment methods [18,43,44]. While these methodologies offer valuable insights at a macro level, they often fall short in addressing the complexities of multifaceted ecological risk scenarios encountered in practical management, thereby necessitating the development of more integrated assessment frameworks [45]. Building upon this need, our study introduces a multi-dimensional risk identification framework encompassing endogenous, exogenous, and regulatory risks. This framework enables a more precise determination of the origins and characteristics of ecological risks, offering a novel perspective for understanding the interactions among human activities, natural processes, and policy interventions. It addresses the gap in county-level risk assessments and provides a scientific foundation for devising targeted management strategies. By integrating the identification of diverse risk sources with ESV assessments, we propose differentiated management strategies categorized as protective, restoration, safeguard, and utilization. Specifically, for forested areas in the western region predominantly affected by endogenous risks, we recommend stringent ecological protection measures to maintain ecosystem integrity and stability. In the central and eastern agricultural zones, where exogenous risks are prominent, strategies should focus on enhancing agricultural management and pollution control to alleviate anthropogenic pressures and promote ecosystem recovery. For riparian zones and lake peripheries, which serve as critical ecological transition areas between terrestrial and aquatic systems and exhibit high-risk characteristics, we advocate for ecological restoration and safeguarding strategies. In lake regions with high ecosystem service values and coexisting multiple ecological risks, we propose strategies that harmonize ecological resource utilization with economic development. In contrast, existing studies have also proposed ecological restoration strategies focusing on forests and water bodies [6,46,47]. By emphasizing the identification of various risk sources, our study enables a more precise assessment of ecological risks and values, facilitating a transition from broad-scale management to targeted governance and providing more effective tools for ecological management practices.

4.2. Refinement of Ecological Management Frameworks at the County Level

Within the framework of modern ecological restoration research, ecosystem structure and function exhibit pronounced scale dependence, resulting in significant variations in policy implementation effectiveness across different spatial scales [48]. Against this backdrop, refining ecological management paradigms at the county level has become critical for advancing regional ecological protection and sustainable development. However, traditional studies often rely on administrative boundaries or large-scale units, neglecting micro-scale differences in ecological value and risk within counties [6,22,33], thereby producing governance policies that fail to accurately address actual needs and resulting in a “one-size-fits-all” approach [5]. As demand for finer spatial information grows, micro-scale analysis based on geographic grids has gradually emerged as a research hotspot, given its ability to capture subtle spatial variations in land use, vegetation cover, and other factors. This scale enables the precise identification of spatial heterogeneity in ecological value and risk within regions, thereby supporting the analysis of internal mechanisms underlying unbalanced development and providing a scientific foundation for formulating more targeted policies [49]. In this study, a 500 m geographic grid is used to assess ESV and CERI in Songzi City, revealing distinct spatial gradients in ecological value and risk across the county. Notably, important ecological transition zones at the land-water interface, particularly within the 500 m buffer zone, generally exhibit high-risk characteristics and should be prioritized in ecological protection planning. This finding is consistent with existing research conclusions [50]. Furthermore, the ESV between the western mountainous areas and the eastern plains differs by more than an order of magnitude, a disparity often overlooked in large-scale studies. The micro-scale analysis conducted in this study significantly enhances the precision of ecological assessments, enabling the accurate identification of ecological value and risk characteristics across different regions within the county. It offers a robust scientific foundation for formulating refined governance strategies encompassing “protective—restoration—safeguard—utilization,” thereby contributing to the achievement of ecological protection and sustainable development goals at the county level.

4.3. Limitations and Future Study Directions

Although this study proposes a novel value–risk dual-perspective ecosystem assessment framework at the county level and employs a Self-Organizing Map (SOM) neural network for fine-scale zoning, several limitations remain and provide opportunities for further improvement in future study. First, the framework currently relies on static data from the year 2020, which only reflects the state of ecosystem structures and socioeconomic activities at a single time point, making it difficult to capture the temporal dynamics of ESV and the CERI. Therefore, future studies should integrate multi-temporal datasets, such as remote sensing time series imagery and spatiotemporal socioeconomic data, to quantify the temporal and spatial evolution of ESV and CERI. On this basis, a dynamic evolution model of ecosystem service value and ecological risk at the county level can be developed. This model should couple dynamic factors—such as climate variability, land use transformation, and policy changes—with core indicators like ESV and CERI. By designing multiple simulation scenarios, including baseline, policy optimization, and extreme-change conditions, the model can be used to predict the trends of ESV and CERI. These results would provide a scientific basis for the refined management of county-level ecosystems, dynamic adjustment of ecological red lines, and the formulation of regional sustainable development policies. Moreover, the effectiveness of ecological governance largely depends on active stakeholder participation. Future studies should consider integrating stakeholder behavior modeling by aligning ecological zoning units with socioeconomic data, including population structure, industrial composition, and income levels. Utilizing sources such as census records, land tenure data, and enterprise registrations, this approach facilitates the identification of key actors, such as farmers, business operators, investors, and local governments, and their functional roles and interests within different ecological zones. Based on this foundation, dynamic interaction models can be constructed to simulate stakeholders’ behavioral responses under various ecological policy scenarios. Stratified sampling, combined with open-ended and semi-structured household interviews, can aid in calibrating model parameters through qualitative insights. Incorporating variables such as economic capacity, policy preferences, and perceptions of environmental risk enables a comprehensive evaluation of governance strategy effectiveness. Ultimately, this framework supports the development of a technical pathway of “precise identification–dynamic simulation–iterative adjustment,” improving spatial targeting, distributive equity, stakeholder engagement, and institutional responsiveness. It provides a practical foundation for building inclusive, equitable, and sustainable ecological governance at the county level.

5. Conclusions

This study conducts a comprehensive spatial assessment of ESV and the CERI in Songzi City using a geospatial grid-based framework. The objective is to delineate micro-scale ecological management units at the county level to support evidence-based, customized ecological conservation and restoration strategies, and to provide a scientific basis for the rational allocation of ecological resources. The key findings are as follows:
(1) The total ESV of Songzi City is estimated at CNY 7.64 billion, exhibiting a clear pattern of high-value clustering and widespread low-value dispersion. Forestland and water bodies are the main contributors, accounting for 49.17% and 29.61% of the total value, respectively. Their values per unit area are notably higher than those of other land uses, with forestland at CNY 15.69 million per km2 and water bodies at CNY 3.53 million per km2. Among the individual ecosystem services, regulating and supporting services dominate, contributing 64.38% of the total ESV, and play a critical role in maintaining regional ecological resilience and functional stability.
(2) The spatial distribution of CERI displays a higher in the central and eastern regions and lower in the west gradient. Endogenous ecological risk is primarily localized in riparian and lake-bordering regions, where recurrent human–water interactions amplify ecosystem vulnerability. Exogenous ecological risk is prevalent in central–eastern areas characterized by dense populations and intensive economic activity, where waste generation and unsustainable resource extraction exert substantial environmental pressure. Regulatory ecological risks are predominantly located along riverbanks, lake shores, and reservoir edges, as well as within western forested regions. Targeted management strategies can effectively mitigate these risks and protect the integrity and stability of ecological systems.
(3) Zoning-based ecological management enhances the precision of conservation planning. Using SOM clustering, Songzi City is delineated into four distinct ecological management zones, each characterized by specific ecological attributes and risk profiles. The Ecological Preventive Conservation Zone covers forested landscapes with low external risks, warranting ongoing conservation measures. The Ecological Vulnerability Restoration Zone encompasses high-risk areas characterized by low ESV, which necessitates rigorous ecological restoration efforts. The Ecological Improvement Utilization Zone corresponds to zones of high value and risk, where achieving a balance between ecological enhancement and sustainable use is essential. The Ecological Safeguard Restoration Zone pertains to water-dominated ecosystems, demanding stringent protection and proactive restoration initiatives. A strategic framework termed protective–restoration–safeguard–utilization is proposed, marking a transition from broad-scale governance to interventions that are precisely targeted.

Author Contributions

Conceptualization, T.H., J.L. and L.T.; methodology, Y.G.; data curation, Y.S.; writing—original draft preparation, T.H.; writing—review and editing, Y.G. and L.T.; supervision, L.T.; project administration, J.L. and L.T.; funding acquisition, J.L. All authors have read and agreed to the published version of the manuscript.

Funding

This research was supported by the National Natural Science Foundation of China (No. 42271228) and the Natural Science Foundation of Hubei Province (2023AFB897).

Data Availability Statement

Data supporting the results of the report can be found in the article. However, due to the nature of legal restrictions, the land use data is not available to be shared publicly.

Conflicts of Interest

The authors declare no conflict of interest.

References

  1. Qiu, J.J.; Liu, Y.H.; Yuan, L.; Chen, C.J.; Huang, Q.Y. Research progress and prospect of the interrelationship between ecosystem services and human well-being in the context of coupled human and natural system. Prog. Geogr. 2021, 40, 1060–1072. [Google Scholar] [CrossRef]
  2. Zhang, Y.W.; Su, T.; Zhang, F.G.; Li, K.; Liu, X.H. Conception and framework of land ecological restoration for a new stage in China. Chin. J. Appl. Ecol. 2021, 32, 1573–1580. [Google Scholar]
  3. Cao, Y.; Wang, J.Y.; Li, G.Y. Ecological Restoration for Territorial Space: Basic Concepts and Foundations. Chin. Land Sci. 2019, 33, 1–10. [Google Scholar]
  4. Wang, C.; Wu, X.; Fu, B.J.; Han, X.G.; Chen, Y.N.; Wang, K.L.; Zhou, H.K.; Feng, X.Y.; Li, Z.S. Ecological restoration in the key ecologically vulnerable regions: Current situation and development direction. Acta Ecol. Sin. 2019, 39, 7333–7343. [Google Scholar]
  5. Cheng, G.; Wu, Z.B. Comprehensive Land Consolidation and Ecological Restoration of Counties. Planner 2020, 36, 35–40. [Google Scholar]
  6. Fu, Y.J.; Shi, X.Y. Ecological restoration zoning of county-level territorial space based on small watershed scale: A case study of the upper Fenhe River in Shanxi. J. Nat. Resour. 2023, 38, 1225–1239. [Google Scholar] [CrossRef]
  7. Ma, Y.B.; Zhai, T.L.; Bi, Q.S.; Chang, M.Y.; Li, L.; Ma, Z.Y.; Li, Y.C. Ecological management zoning in the Yellow River Basin based on hierarchy of needs theory and ecosystem services supply and demand. Acta Ecol. Sin. 2024, 44, 6513–6526. [Google Scholar]
  8. Fu, B.J.; Chen, L.D.; Liu, G.H. The objectives, tasks and characteristics of China ecological regionalization. Acta Ecol. Sin. 1999, 19, 591–595. [Google Scholar]
  9. Bailey, R.G. Delineation of Ecosystem Regions. Environ. Manag. 1983, 7, 365–373. [Google Scholar] [CrossRef]
  10. Sadeghi, S.H.; Chamani, R.; Zabihi, S.M.; Tavosi, M.; Katebikord, A.; Khaledi, D.A.; Moosavi, V.; Sadeghi, P.S.; Vafakhah, M.; Moradi, R.H. Watershed Health and Ecological Security Zoning Throughout Iran. Sci. Total Environ. 2023, 905, 167123. [Google Scholar] [CrossRef]
  11. Sarker, S.; Rahman, M.J.; Rahman, M.M.; Akter, M.; Rahman, M.S.; Wahab, M.A. MPA Zoning Integrating Socio-Ecological Data in the South East Coast of Bangladesh. Mar. Policy 2021, 133, 104736. [Google Scholar] [CrossRef]
  12. Raj, A.; Sharma, L.K. Spatial E-PSR Modelling for Ecological Sensitivity Assessment for Arid Rangeland Resilience and Management. Ecol. Model. 2023, 478, 110283. [Google Scholar] [CrossRef]
  13. Jiang, X.; Jiang, Z.Y.; Zeng, Y.Y.; Wu, M.D.; Huang, Z.W.; Huang, Q. Integrating Land-Sea Coordination Into Construction of an Ecological Security Pattern for Urban Agglomeration: A Case Study in the Guangdong-Hong Kong-Macao Greater Bay Area. Environ. Sci. Pollut. Res. 2024, 31, 2671–2686. [Google Scholar] [CrossRef]
  14. Feng, L.; Lei, G.P. Study on Spatial-temporal Evolution Characteristics and Functional Zoning of Ecosystem Services and Trade-offs/Synergies Relationships in Northeastern China. China Land Sci. 2023, 37, 100–113. [Google Scholar]
  15. Zhao, X.Q.; Xu, Y.F.; Pu, J.W.; Tao, J.Y.; Chen, Y.J.; Huang, P.; Shi, X.Y.; Ran, Y.J.; Gu, Z.X. Achieving the Supply-Demand Balance of Ecosystem Services through Zoning Regulation Based On Land Use Thresholds. Land Use Pol. 2024, 139, 107056. [Google Scholar] [CrossRef]
  16. Li, J.L.; Hu, D.W.; Wang, Y.Z.; Chu, J.L.; Yin, H.W.; Ma, M. Study of Identification and Simulation of Ecological Zoning through Integration of Landscape Ecological Risk and Ecosystem Service Value. Sustain. Cities Soc. 2024, 107, 105442. [Google Scholar] [CrossRef]
  17. Liang, S.H.; Li, W.; Gao, Y.; Liu, B.Z. Correlations between ecosystem service value and landscape ecological risk and its spatial heterogeneity in Jilin Province, China. Chin. J. Appl. Ecol. 2024, 35, 769–779. [Google Scholar]
  18. Qiao, B.; Cao, X.Y.; Sun, W.J.; Gao, Y.Y.; Chen, Q.; Yu, H.Y.; Wang, Z.; Wang, N.A.; Cheng, H.Y.; Wang, Y.P.; et al. Ecological zoning identification and optimization strategies based on ecosystem service value and landscape ecological risk: Taking Qinghai area of QilianMountain National Park as an example. Acta Ecol. Sin. 2023, 43, 986–1004. [Google Scholar]
  19. Peng, J.; Dang, W.X.; Liu, Y.X.; Zong, M.L.; Hu, X.X. Review on landscape ecological risk assessment. Acta Geogr. Sin. 2015, 70, 664–677. [Google Scholar] [CrossRef]
  20. Zhu, Q.; Cai, Y.L. Assessment framework and simulation prediction for ecological security based on “risk-health-services”: A case study of the Huaihe River Basin. J. Nat. Resour. 2024, 39, 2676–2690. [Google Scholar] [CrossRef]
  21. Jia, Y.Y.; Tang, X.L.; Ren, Y.J. Spatial-temporal evolution and correlation analyses of ecosystem service values and landscape ecological risks in Anhui section of the Yangtze River basin. J. Nanjing For. Univ. 2022, 46, 31–40. [Google Scholar]
  22. Xie, Y.C.; Zhang, S.X.; Lin, B.; Zhao, Y.J.; Hu, B.Q. Spatial zoning for land ecological consolidation in Guangxi based on the ecosystem services supply and demand. J. Nat. Resour. 2020, 35, 217–229. [Google Scholar]
  23. Xie, L.X.; Bai, Y.P.; Che, L.; Qiao, F.W.; Sun, S.S.; Yang, X.D. Construction of ecological zone based on value-risk ecological function area in the Upper Yellow River. J. Nat. Resour. 2021, 36, 196–207. [Google Scholar] [CrossRef]
  24. Zhang, W.; Long, N.; Li, S.G.; Wang, L. Zoning of Territorial Space for Ecological Restoration Based on Potential Ecological Background Pattern Framework: A Case Study of the Guangdong-Hong Kong-Macao Greater Bay Area. Trop. Geogr. 2024, 44, 212–225. [Google Scholar]
  25. Yang, Q.Y.; Zhang, H.Z.; Tang, Q. Ecological restoration zoning of territorial space in Chongqing City based on adaptive cycle model. Acta Geogr. Sin. 2022, 77, 2583–2598. [Google Scholar]
  26. Kang, Z.W.; Zhang, Z.Y.; Wei, H.; Liu, L.; Ning, S.; Zhao, G.N.; Wang, T.X.; Tian, H. Landscape ecological risk assessment in Manas River Basin based on land use change. Acta Ecol. Sin. 2020, 40, 6472–6485. [Google Scholar]
  27. Wang, F.; Ye, C.S.; Hua, J.Q.; Li, X. Coupling relationship between urban spatial expansion and landscape ecological risk in Nanchang City. Acta Ecol. Sin. 2019, 39, 1248–1262. [Google Scholar]
  28. Xie, G.D.; Zhen, L.; Lu, C.X.; Xiao, Y.; Che, C. Expert Knowledge Based Valuation Method of Ecosystem Services in China. J. Nat. Resour. 2008, 23, 911–919. [Google Scholar]
  29. Cui, W.L.; Xi, H.H.; Cai, L.; Chen, M.Y.; Xu, C.L. Spatial and Temporal Change of Ecosystem Service Value in China’s Island Counties Base on NDVI. Econ. Geogr. 2021, 41, 184–192, 224. [Google Scholar]
  30. Xie, G.D.; Zhang, C.X.; Zhang, L.M.; Chen, W.H.; Li, S.M. Improvement of the Evaluation Method for Ecosystem Service Value Based on Per Unit Area. J. Nat. Resour. 2015, 30, 1243–1254. [Google Scholar]
  31. Li, X.Y. Research Progress and Trend of Integration of Chinese Cultural Industry and Tourism Industry: Based on Catespace Analysis. Econ. Geogr. 2019, 39, 212–220. [Google Scholar]
  32. Hu, Y.; Chen, X.; Zhao, G.; Liu, X.; Yu, J.; Li, M.; Liu, Y.; Hu, X.; Zhong, R.; Chen, Y. Ecosystem Service Responses to Land Use Change in Southern Guangzhou—The Practice of Applying Natural Resources Integrated Database for Research. Land 2022, 11, 1012. [Google Scholar] [CrossRef]
  33. Zhang, X.X.; Jin, X.B.; Liang, K.Y.; Han, B.; Wang, S.L.; Zhu, W.H.; Liang, X.Y.; Zhou, Y.K. Ecological risk assessment and management zoning in rapid urbanization areas from the perspective of social-ecological system: A case study of Jiangsu Province. Acta Ecol. Sin. 2024, 44, 8138–8149. [Google Scholar]
  34. Liu, R.J.; Pu, L.J.; Zhu, M.; Huang, S.H.; Jiang, Y. Coastal Resource-Environmental Carrying Capacity Assessment: A Comprehensive and Trade-Off Analysis of the Case Study in Jiangsu Coastal Zone, Eastern China. Ocean. Coast. Manag. 2020, 186, 105092. [Google Scholar] [CrossRef]
  35. Zhang, X.; Gu, R.X. Spatio-temporal pattern and multi-scenario simulation of land use conflict: A case study of the Yangtze River Delta urban agglomeration. Geogr. Res. 2022, 41, 1311–1326. [Google Scholar]
  36. Ai, M.S.; Chen, X.; Yu, Q. Spatial Correlation Analysis Between Human Disturbance Intensity (HDI) and Ecosystem Services Value (ESV) in the Chengdu-Chongqing Urban Agglomeration. Ecol. Indic. 2024, 158, 111555. [Google Scholar] [CrossRef]
  37. Liu, F.; Yan, H.M.; Liu, J.Y.; Xiao, X.M.; Qin, Y.W. Spatial pattern of land use intensity in China in 2000. Acta Geogr. Sin. 2016, 71, 1130–1143. [Google Scholar]
  38. Ma, Z.Y.; Li, P.; Xiao, L.; Wang, B.; Xu, Y.T.; Pan, J.J. Identification of Key Areas for Ecological Restoration and Division of Restoration Zones in Qinghai Province. J. Soil Water Conserv. 2024, 38, 252–265. [Google Scholar]
  39. Yan, X.L.; Li, X.Y.; Liu, C.H.; Li, J.W.; Zhong, J.Q. Spatial evolution trajectory of ecosystem service bundles and its social-ecological driven by geographical exploration: A case study of Dalian. Acta Ecol. Sin. 2022, 42, 5734–5747. [Google Scholar]
  40. Kohonen, T. Self-organized formation of topologically correct feature maps. Biol. Cybern. 1982, 43, 59–69. [Google Scholar] [CrossRef]
  41. Xia, H.; Yuan, S.F.; Prishchepov, A.V. Spatial-Temporal Heterogeneity of Ecosystem Service Interactions and their Social-Ecological Drivers: Implications for Spatial Planning and Management. Resour. Conserv. Recycl. 2023, 189, 106767. [Google Scholar] [CrossRef]
  42. Zhang, X.M.; Xie, B.G.; Zhou, K.C.; Li, J.H.; Yuan, C.; Xiao, J.Y.; Xie, J. Mapping ecosystem service clusters and exploring their driving mechanisms in karst peak-cluster depression regions in China. Ecol. Indic. 2024, 156, 111524. [Google Scholar] [CrossRef]
  43. Xu, G.Y.; Xiong, K.N.; Shu, T.; Shi, Y.J.; Chen, L.S.; Zheng, L.L.; Fan, H.X.; Yang, Z.H. Bundling evaluating changes in ecosystem service under karst rocky desertification restoration: Projects a case study of Huajiang-Guanling, Guizhou province, Southwest China. Environ. Earth Sci. 2022, 81, 302. [Google Scholar] [CrossRef]
  44. Gong, J.; Cao, E.J.; Xie, Y.C.; Xu, C.X.; Li, H.Y.; Yan, L.L. Integrating Ecosystem Services and Landscape Ecological Risk Into Adaptive Management: Insights From a Western Mountain-Basin Area, China. J. Environ. Manag. 2021, 281, 111817. [Google Scholar] [CrossRef]
  45. Li, S.Z.; Yan, Z.F.; Fu, W.Q.; Yang, Y.F.; Feng, C.L. Technical Framework of Ecological Risk Assessment and its Application in Environmental Management. Environ. Eng. 2019, 37, 181–191. [Google Scholar]
  46. Zhou, S.; Ou, Z.R.; Zhang, J.M.; Dong, L.M.; Li, X.F.; Deng, Z.H.; Sun, Y.Y.; Qiu, X.T. Temporal and Spatial Variations in Landscape Pattern–Function Risk Coupling Over 20 Years in the Dry–Hot Valley of the Jinsha River in China. Land 2024, 13, 2068. [Google Scholar] [CrossRef]
  47. Zeng, J.; Cui, X.Y.; Chen, W.X.; Yao, X.W. Ecological management zoning based on the supply-demand relationship of ecosystem services in China. Appl. Geogr. 2023, 155, 102959. [Google Scholar] [CrossRef]
  48. Zhong, F.M.; Chen, Z.A. Impacts of human disturbances on the supply and demand of ecosystem services in the middle reaches of Yangtze River urban agglomeration across multiple scales. Chin. J. Appl. Ecol. 2025, 36, 271–283. [Google Scholar]
  49. Wang, Z.Y.; Shi, P.J.; Zhang, X.B.; Yao, L.T.; Tong, H.L. Grid-scale-based ecological security assessment and ecological restoration: A case study of Suzhou district, Jiuquan. J. Nat. Resour. 2022, 37, 2736–2749. [Google Scholar]
  50. Xie, Y.Y.; Zhu, Q.C.; Bai, H.; He, H.Z.; Zhang, Y.A. Combining ecosystem service value and landscape ecological risk to subdivide the riparian buffer zone of the Weihe River in Shaanxi. Ecol. Indic. 2024, 166, 112424. [Google Scholar] [CrossRef]
Figure 1. Study area.
Land 14 01021 g001
Figure 2. Spatial distribution of ESV in Songzi City.
Land 14 01021 g002
Figure 3. Spatial distribution of CERI in Songzi City.
Land 14 01021 g003
Figure 4. Functional zoning of ecosystem service clusters and ESV and CERI components in Songzi City.
Land 14 01021 g004
Table 1. ESV and proportion of land use types in Songzi City.
Land Use TypeESV/Billion CNYProportion/%Unit Area ESV Million CNY per km2
Cultivated land1.3617.80%1.51
Orchard land0.253.35%2.87
Woodland2.2629.61%3.53
Grassland0.010.07%2.21
Water3.7549.17%15.69
Build-up land
Unused land
Total7.64100%3.50
Table 2. Percentage of the individual ESV in Songzi City.
Main TypeMinor TypeESV/Billion CNYProportion/%
Supply serviceFood production1.3617.85%
Raw material production0.334.38%
Water supply−0.34−4.45%
Regulatory servicesGas regulation0.425.51%
Climate regulation0.719.39%
Purify environment0.324.25%
Hydrological regulation2.6234.36%
Support servicesSoil conservation0.385.00%
Maintenance of nutrients0.050.73%
Biodiversity0.395.14%
Cultural serviceAesthetic Landscape1.3617.84%
Total 7.64100.00%
Table 3. Zoning control types and objectives of Songzi City.
Type of Zoning ControlService Cluster TypeRestoration ObjectsRestoration Goals
Ecological Preventive Conservation ZoneService cluster 1WoodlandsMaintenance of ecosystem integrity and stability
Ecological Vulnerability Restoration ZoneService cluster 2Cultivated and built-up landAgricultural security, habitat improvement
Ecological Safeguard Restoration Zone Service cluster 3Rivers and surroundingsWater ecosystem restoration and management
Ecological Improvement and Utilization Zone Service cluster 4Reservoirs, lakes, and Yangtze River shorelineRealization of ecological product value
Disclaimer/Publisher’s Note: The statements, opinions and data contained in all publications are solely those of the individual author(s) and contributor(s) and not of MDPI and/or the editor(s). MDPI and/or the editor(s) disclaim responsibility for any injury to people or property resulting from any ideas, methods, instructions or products referred to in the content.

