
Loess Plateau Cropland: Evolution and Ecological Impacts over Four Millennia
Abstract
1. Introduction
2. Methods
2.1. Study Area
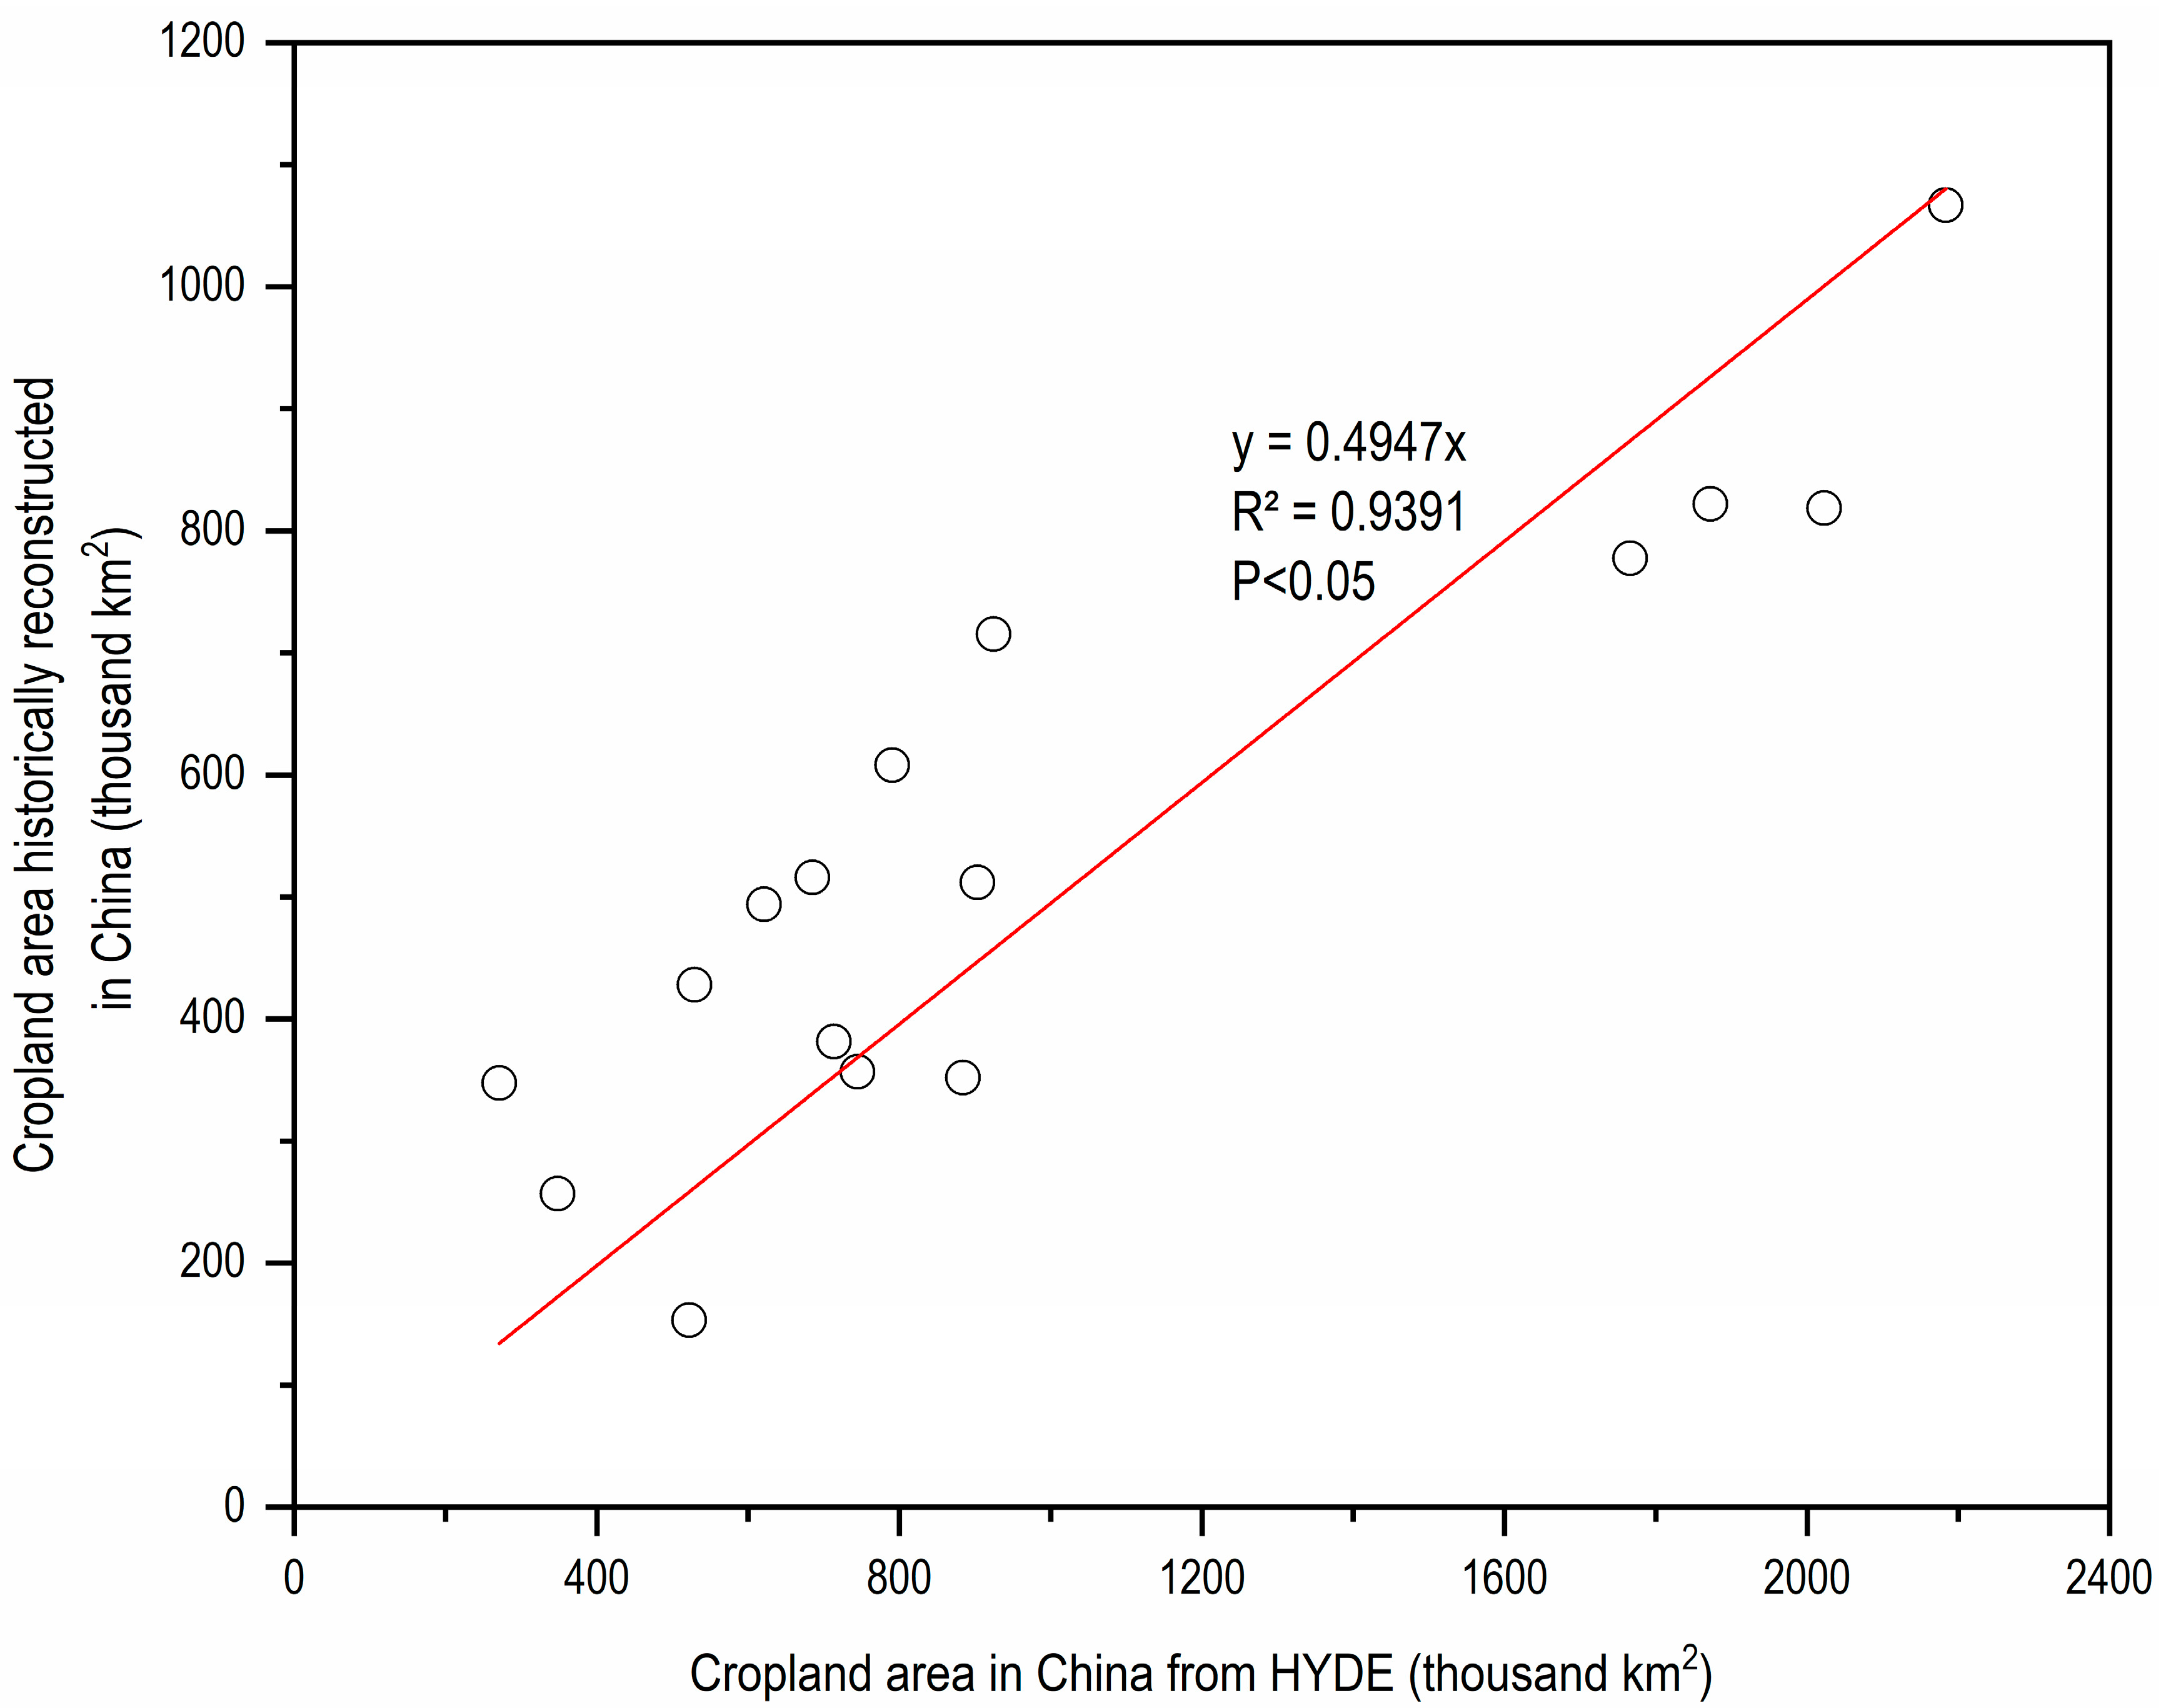
2.2. Cropland Area
2.3. Farming–Grazing Boundary
2.4. Population
2.5. Other Datasets
2.6. Calculation of Contribution Rates
3. Results
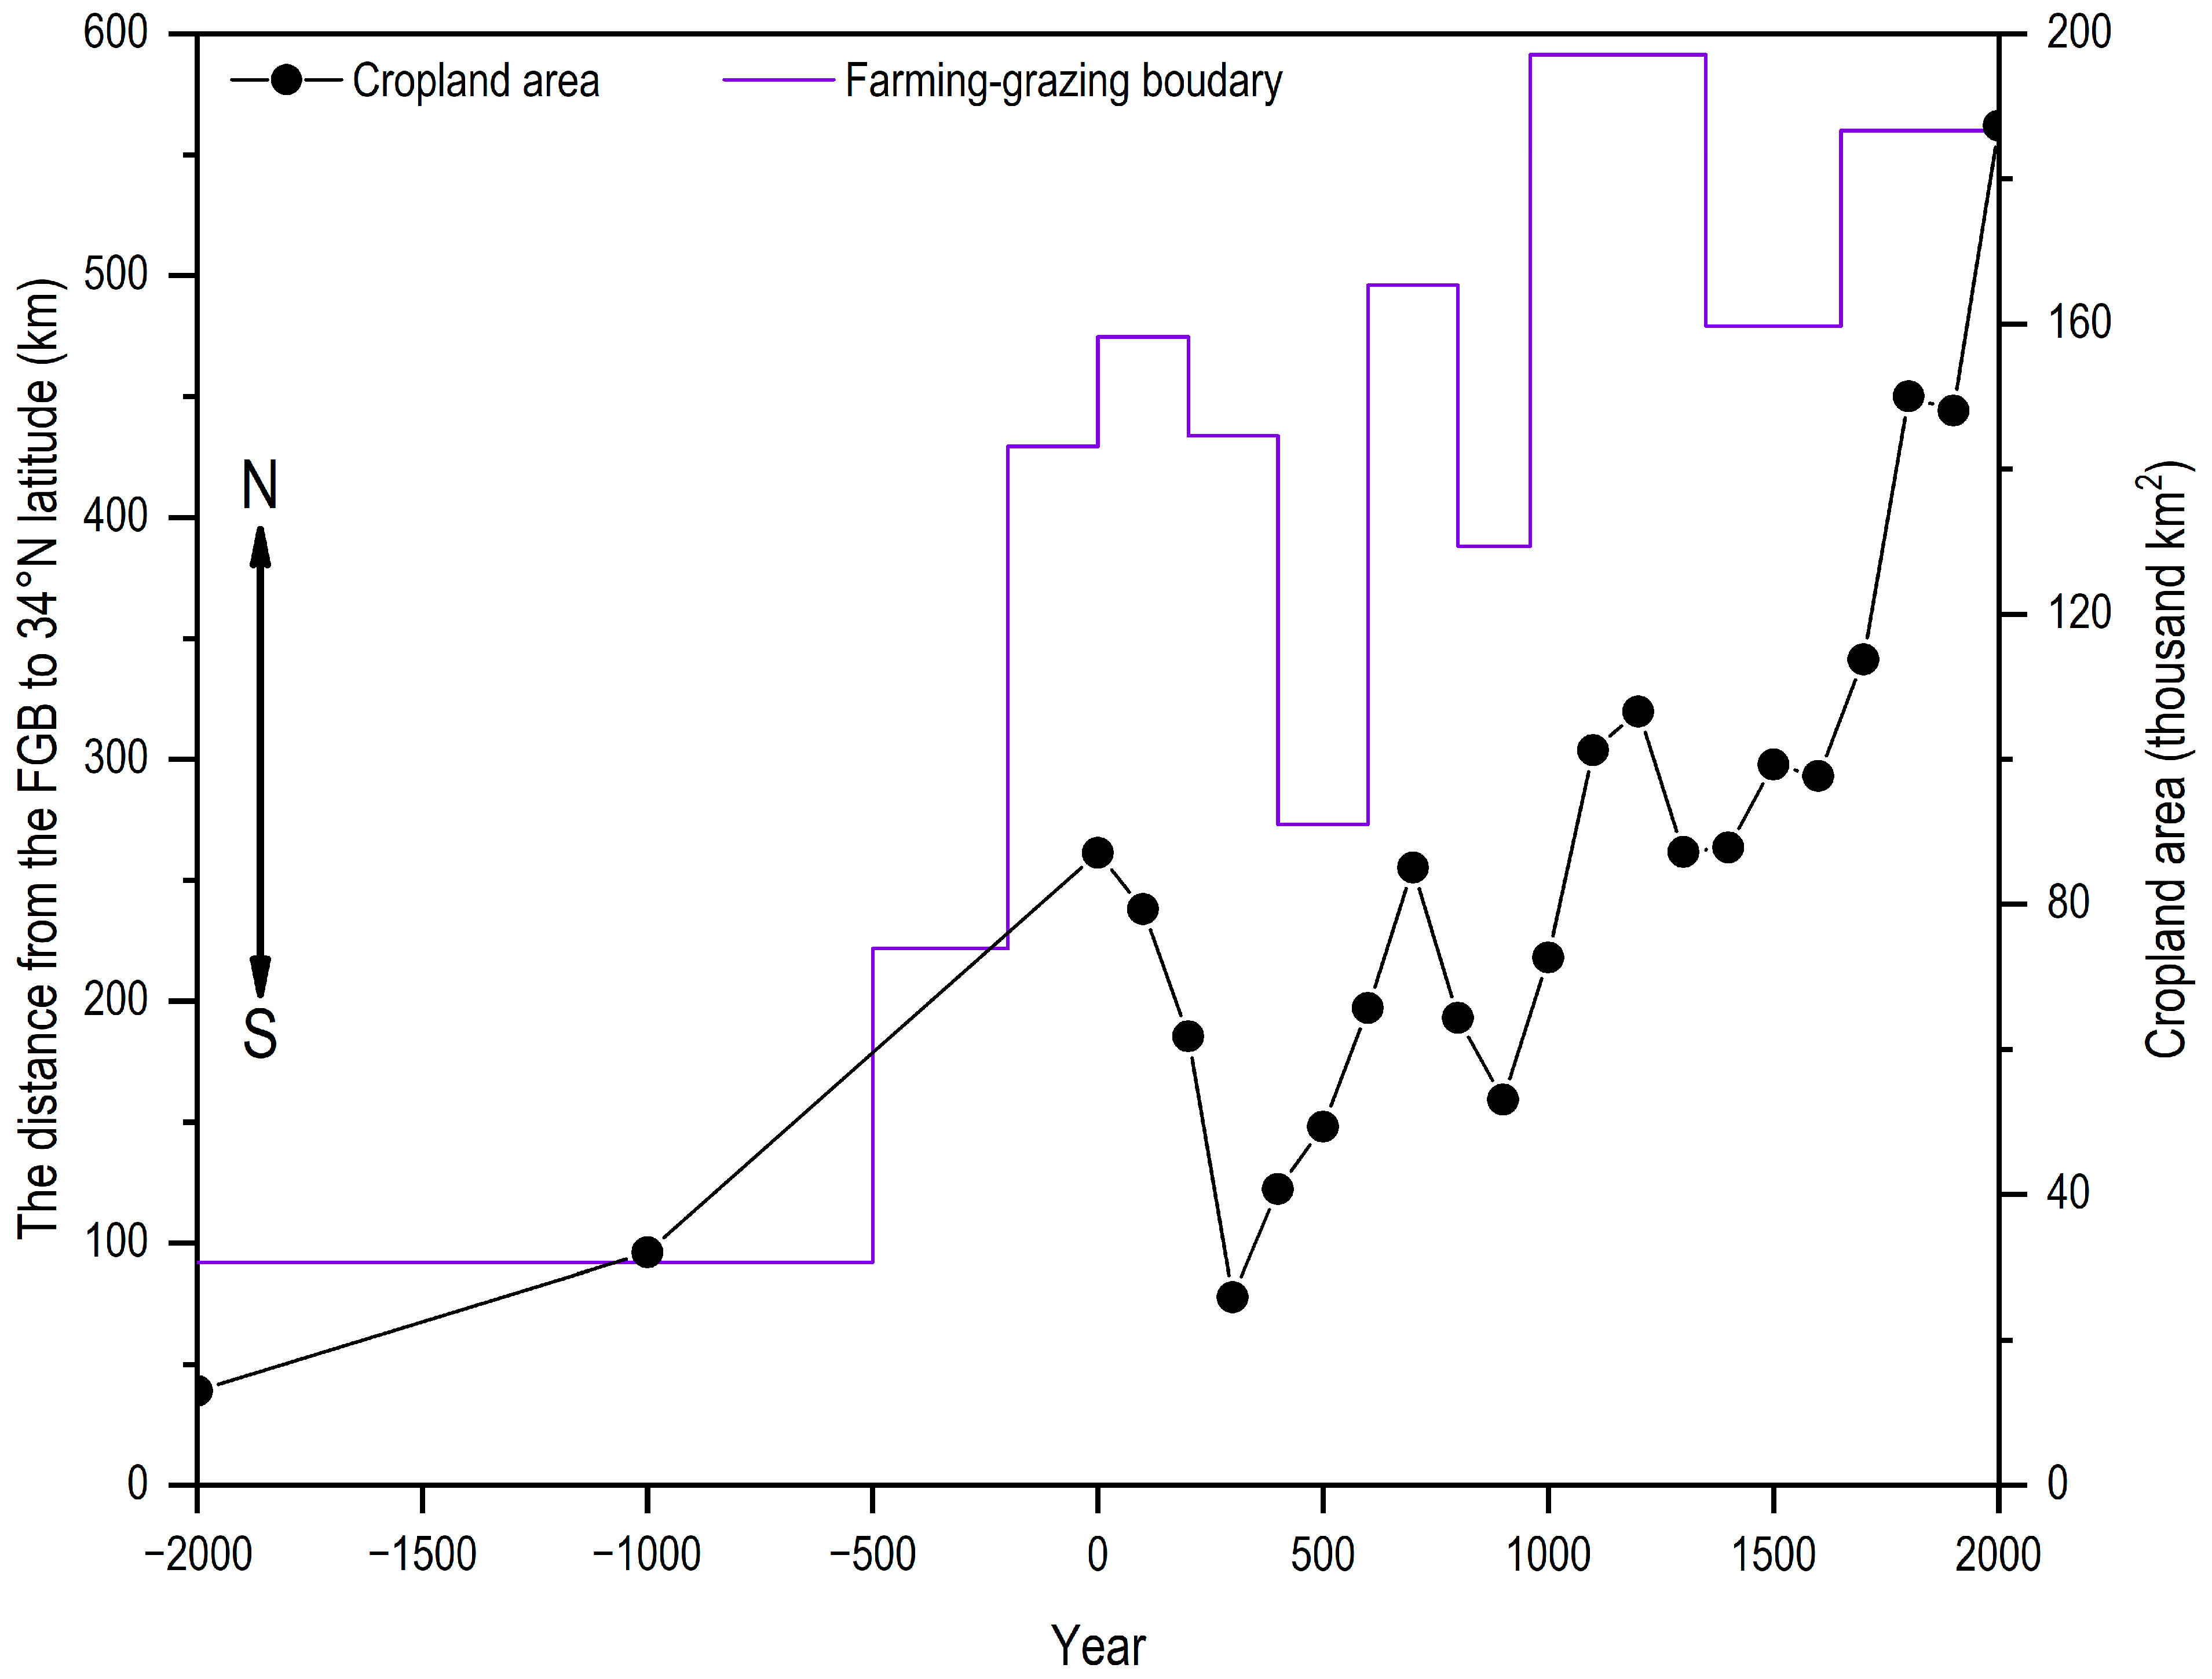
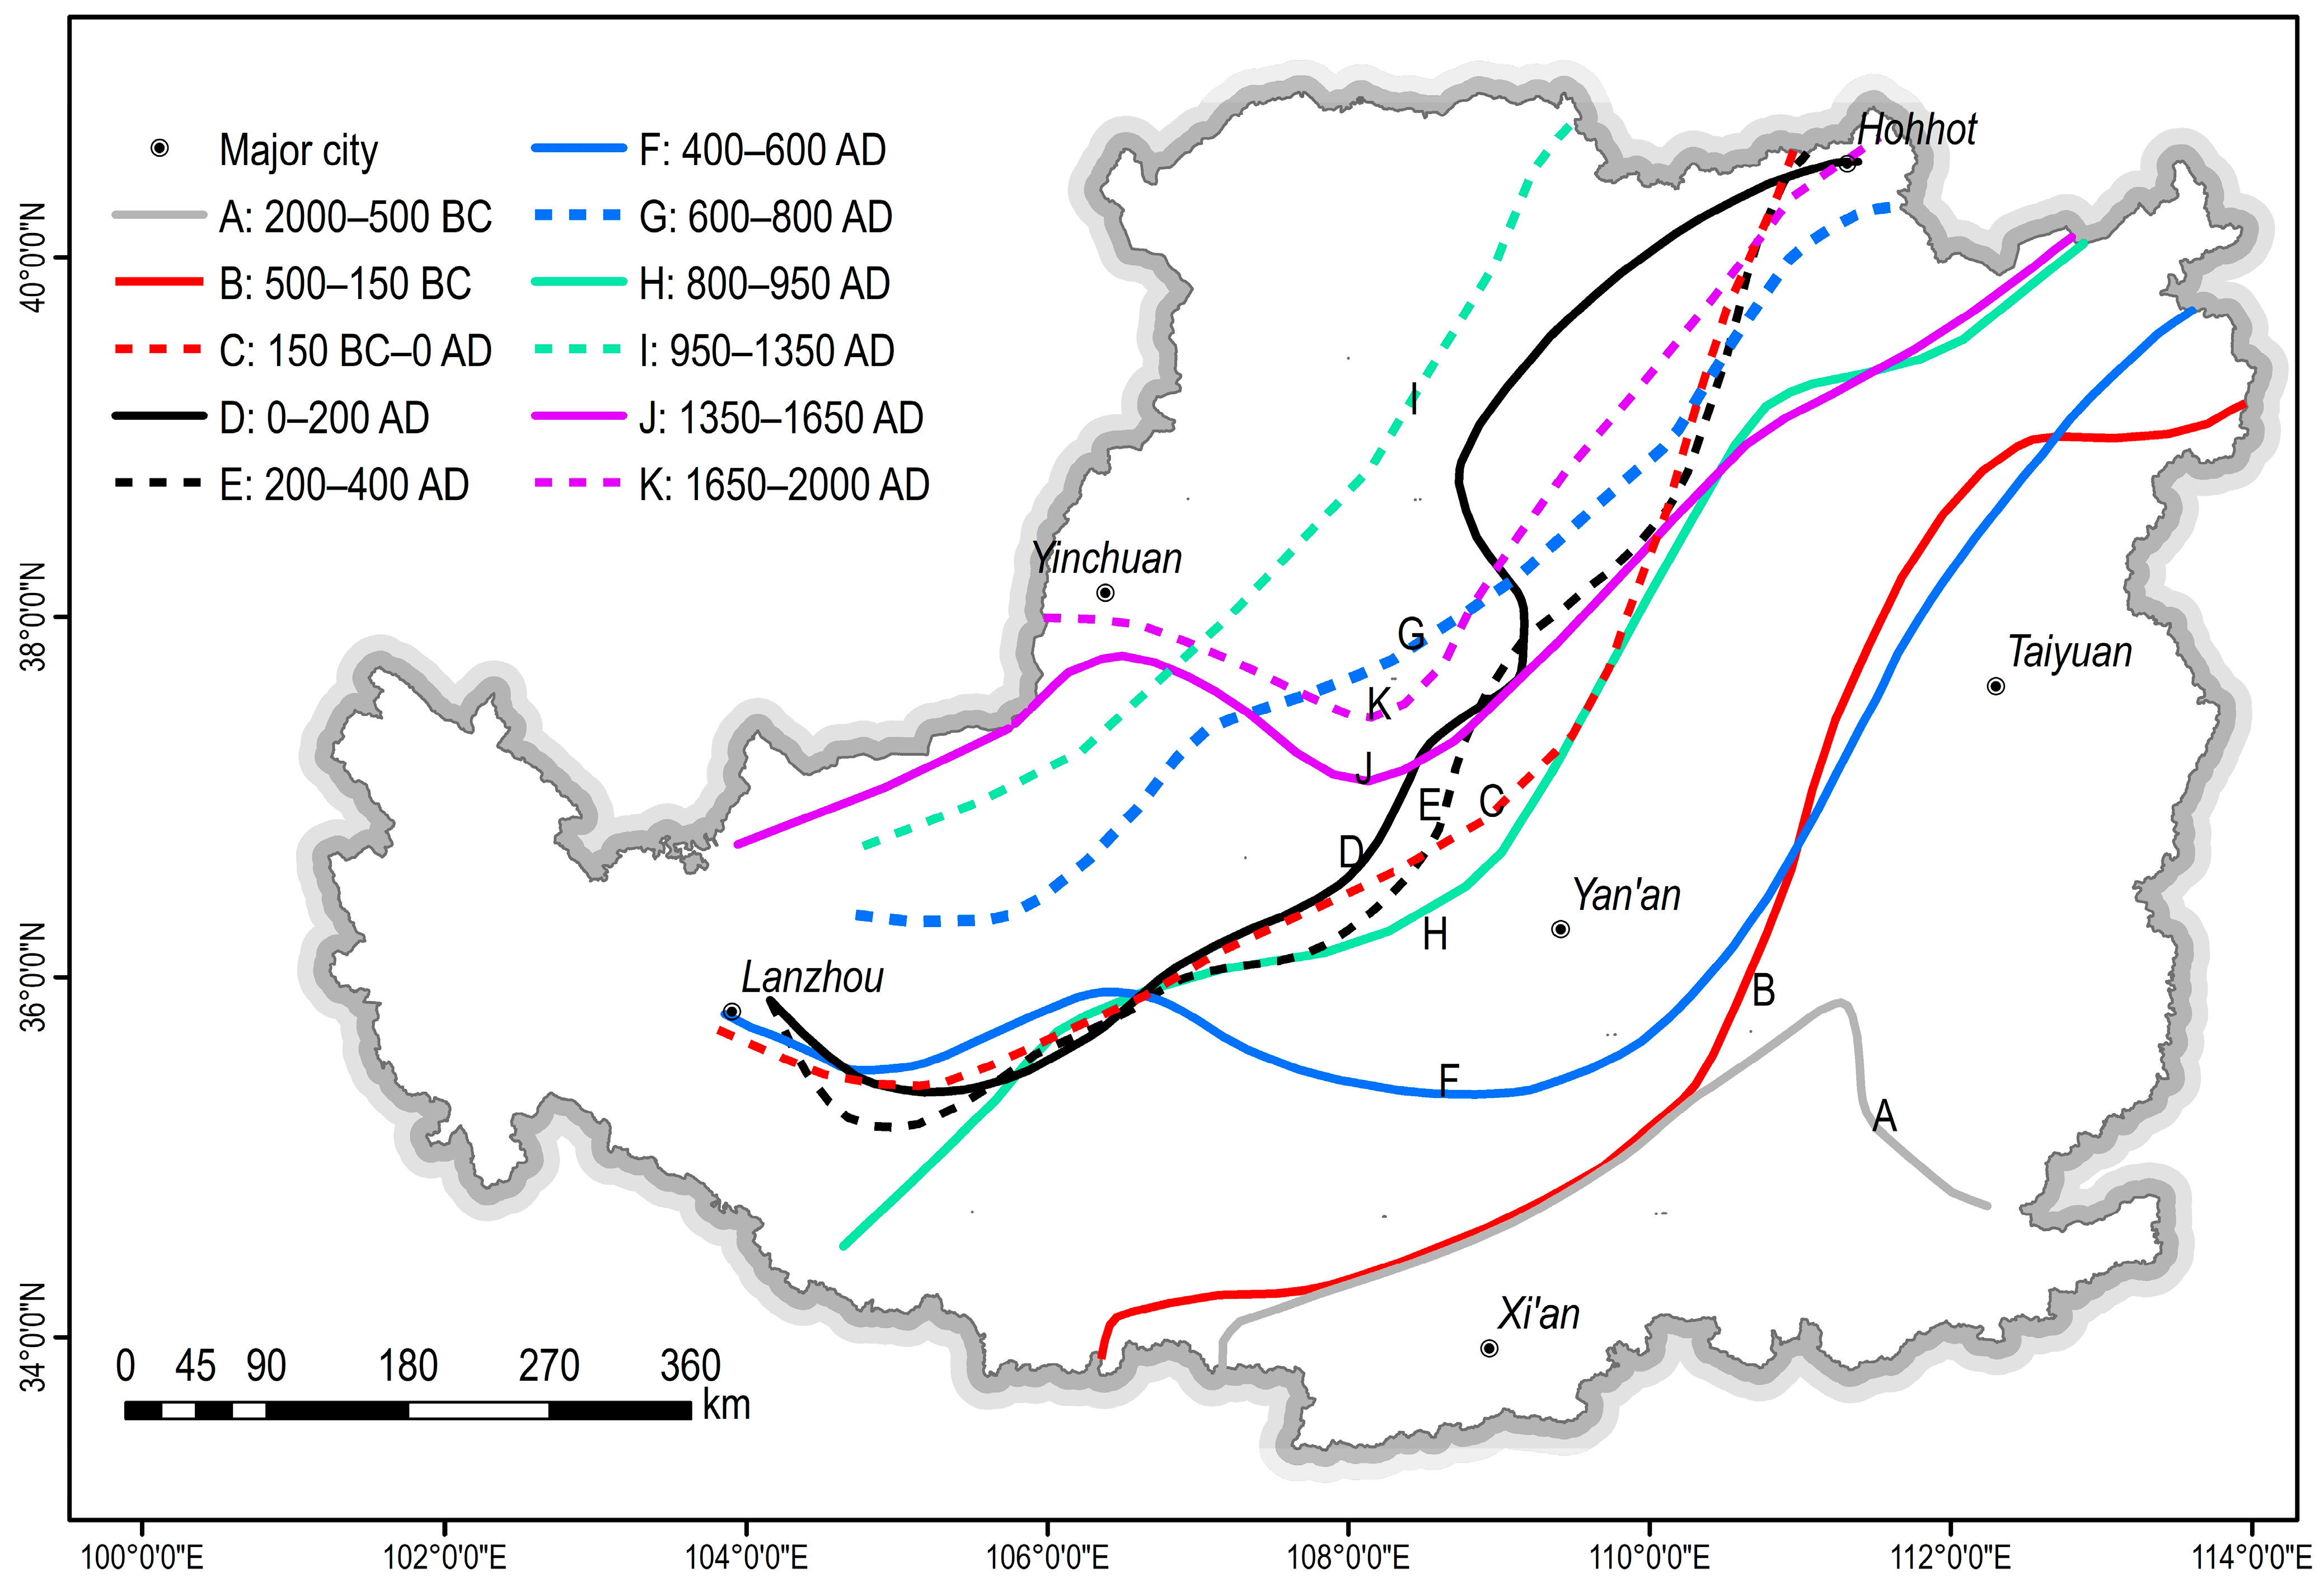
3.1. 4000-Year Cropland Area Dynamics of the LP
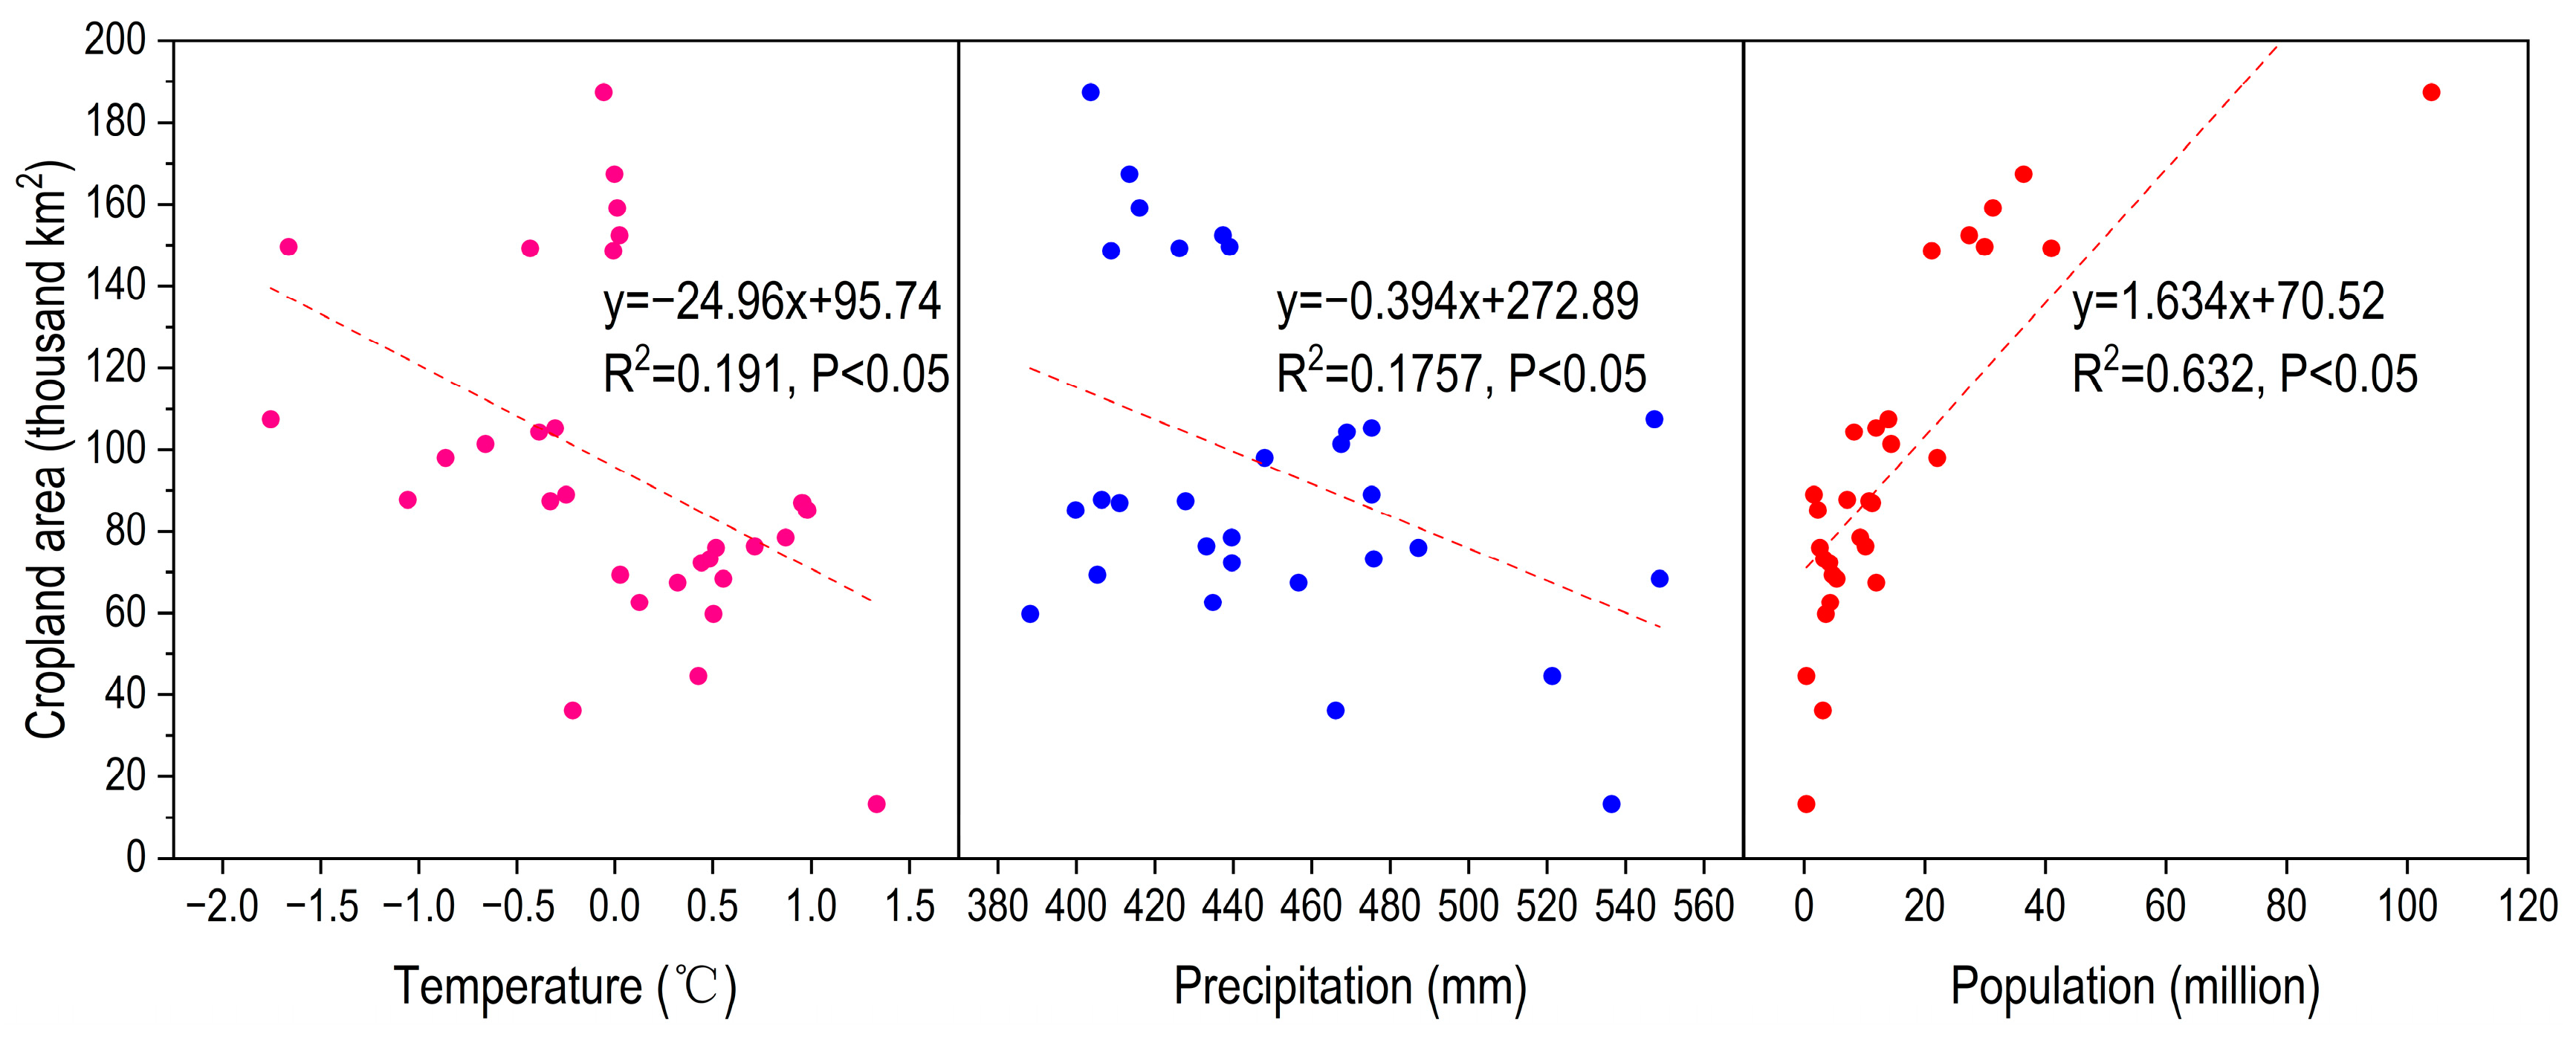
3.2. Drivers of Changes in Cropland Area
3.3. Local and Spillover Effects of Cropland Area Changes
4. Discussions
4.1. Multi-Factor Driving Mechanisms of Cropland Expansion
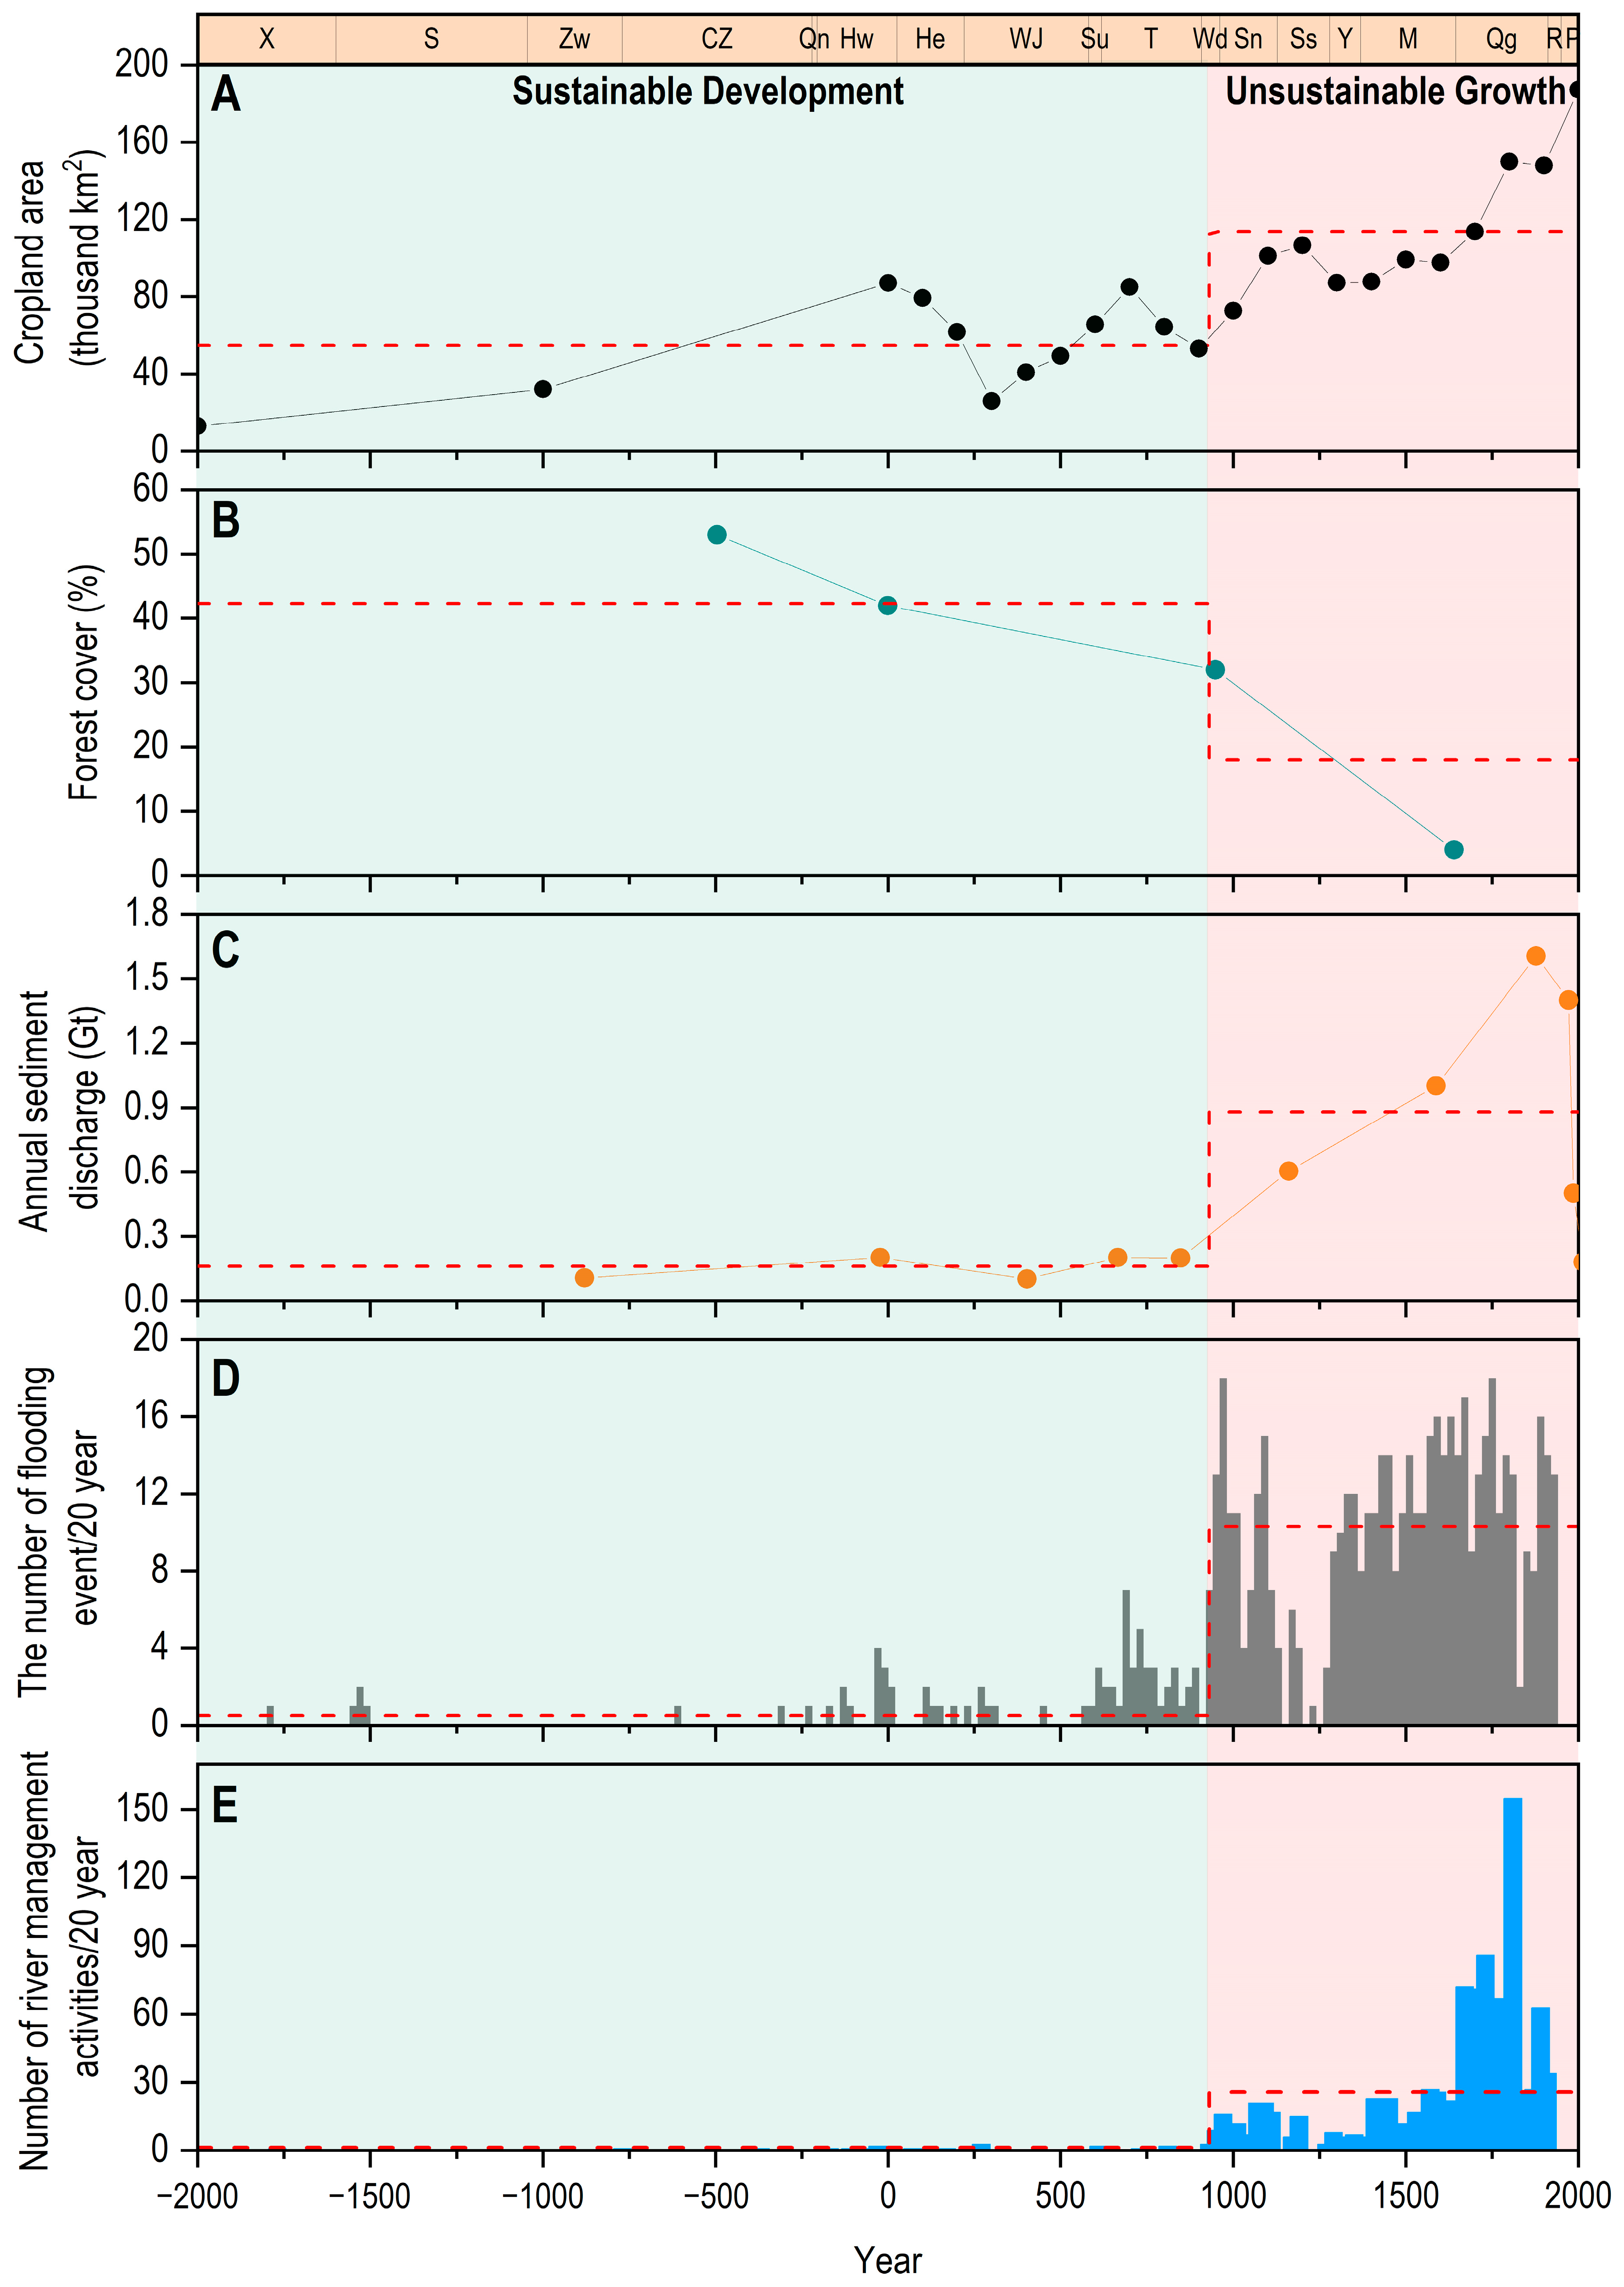
4.2. Historical Evolution of Ecological Effects and Thresholds
4.3. Implications for Modern Ecological Governance
4.4. Research Limitations and Future Directions
5. Conclusions
Author Contributions
Funding
Data Availability Statement
Conflicts of Interest
Abbreviations
| LP | Loess Plateau |
| YR | Yellow River |
| LUCC | Land Use/Cover Change |
| IGBP | International Geosphere-Biosphere Programme |
| HYDE | Historical Database of the Global Environment |
| SAGE | Global Land Use Database |
| FGB | Farming–Grazing Boundary |
References
- Goldewijk, K.K. Estimating global land use change over the past 300 years: The HYDE database. Glob. Biogeochem. Cycles 2001, 15, 417–433. [Google Scholar] [CrossRef]
- Raju, R.; Zhang, Y.; Basanta, P.; Narendra, R.K.; Bipin, K.A. Satellite Image-based Monitoring of Urban Land Use Change and Assessing the Driving Factors in Pokhara and Bharatpur Metropolitan Cities, Gandaki Basin, Nepal. J. Resour. Ecol. 2020, 11, 87–99. [Google Scholar] [CrossRef]
- Goldewijk, K.K.; Beusen, A.; Doelman, J.; Stehfest, E. Anthropogenic land use estimates for the Holocene-HYDE 3.2. Earth Syst. Sci. Data 2017, 9, 927–953. [Google Scholar] [CrossRef]
- Fang, X.; Ye, Y.; Zhang, C.; Tang, C. Cropland cover change and its environmental impacts in the history of China. J. Palaeogeogr. 2019, 21, 160–174. [Google Scholar]
- Huang, B.W. On the factors of soil erosion in the Loess Plateau of northwest China. Sci. Bull. 1954, 6, 65–66. (In Chinese) [Google Scholar]
- Jing, K.; Wang, B.K. Modern erosion environment and sediment yield effect of the Loess Plateau. People’s Yellow River 1992, 4, 35–38. (In Chinese) [Google Scholar]
- Wang, T.M.; Wu, J.G.; Kou, X.J.; Oliver, C.; Mou, P.; Ge, J.P. Ecologically asynchronous agricultural practice erodes sustainability of the Loess Plateau of China. Ecol. Appl. 2010, 20, 1126–1135. [Google Scholar] [CrossRef]
- Shi, C.X.; Zhang, D.D. A sediment budget of the lower Yellow River, China, over the period from 1855 to 1968. Geogr. Ann. 2005, 87, 461–471. [Google Scholar] [CrossRef]
- Comprehensive scientific investigation team of Loess Plateau; Chinese Academy of Sciences. Population Problems in the Loess Plateau; China Economic Publishing House: Beijing, China, 1990. (In Chinese) [Google Scholar]
- Tan, Q. Why did the Yellow River keep a calm period for a long time after the Eastern Han Dynasty—To verify the view that the rational use of land in the middle reaches of the Yellow River is the decisive factor to eliminate water disasters in the lower reaches from the perspective of history. Acad. Mon. 1962, 2, 23–35. (In Chinese) [Google Scholar]
- Liu, B.Y.; Tang, K.L.; Jiao, J.Y.; Ma, X.Y.; Zhang, X.P.; Cao, Q.; Xiao, P.Q.; Wei, X.; Fu, S.H.; Miao, C.Y.; et al. The Spatial-Temporal Atlas of Water and Sediment in the Yellow River, 2nd ed.; Science Press: Beijing, China, 2019. (In Chinese) [Google Scholar]
- Ren, M.E. Sediment discharge of the Yellow River, China: Past, present and future—A synthesis. Acta Oceanol. Sin. 2015, 34, 1–8. [Google Scholar] [CrossRef]
- Chen, Y.; Syvitski, J.P.M.; Gao, S.; Overeem, I.; Kettner, A.J. Socio-economic impacts on flooding: A 4000-year history of the Yellow River, China. AMBIO 2012, 41, 682–698. [Google Scholar] [CrossRef] [PubMed]
- Xu, J.; Li, F. Response of lower Yellow River bank breachings to La Niña events since 924 CE. CATENA 2019, 176, 159–169. [Google Scholar] [CrossRef]
- Bu, F.X. Assessment on the level of food security in traditional agriculture period of China. Agric. Hist. China 2007, 4, 19–30. [Google Scholar]
- Ge, Q.S.; Dai, J.H.; He, F.N.; Pan, Y.; Wang, M.M. Land use/cover change and carbon cycle in China over the past 300 years. Chin. Sci. 2008, 38, 197–210. [Google Scholar]
- He, F.N.; Li, S.C.; Zhang, X.Z.; Ge, Q.S.; Dai, J.H. Comparisons of reconstructed cropland area from multiple datasets for the traditional cultivated region of China in the last 300 years. Acta Geogr. Sin. 2012, 67, 1190–1200. [Google Scholar]
- He, F.N.; Li, M.J.; Liu, H.L. Reconstruction of cropland area at Lu scale and its spatial temporal characteristics in the Northern Song Dynasty. Acta Geogr. Sin. 2016, 71, 1967–1978. [Google Scholar]
- Li, M.J.; He, F.N.; Yang, F.; Li, S.C. Reconstruction of cropland area at the provincial level in the early Yuan Dynasty. Acta Geogr. Sin. 2018, 73, 832–842. [Google Scholar]
- Turner, B.L.; Meyer, W.B.; Skole, D.L. Global Land-Use/Land-Cover Change: Towards an Integrated Study. AMBIO 1994, 23, 91–95. [Google Scholar]
- Goldewijk, K.K.; Battjes, J.J. A Hundred Year (1890—1990) Database for Integrated Environmental Assessments (HYDE, version 1.1); Rijksinstituut Voor Volksgezondheid En Milieu Rivm: Utrecht, The Netherlands, 1997. [Google Scholar]
- Ramankutty, N.; Foley, J.A. Estimating historical changes in global land cover: Croplands from 1700 to 1992. Glob. Biogeochem. Cycles 1999, 13, 997–1027. [Google Scholar] [CrossRef]
- Kaplan, J.O.; Krumhardt, K.M.; Zimmermann, N. The prehistoric and preindustrial deforestation of Europe. Quat. Sci. Rev. 2009, 28, 3016–3034. [Google Scholar] [CrossRef]
- Leite, C.C.; Costa, M.H.; Soares-Filho, B.S.; Hissa, L.B.V. Historical land use change and associated carbon emissions in Brazil from 1940 to 1995. Glob. Biogeochem. Cycles 2012, 26, 1–13. [Google Scholar] [CrossRef]
- Zumkehr, A.; Campbell, J.E. Historical US cropland areas and the potential for bioenergy production on abandoned croplands. Environ. Sci. Technol. 2013, 47, 3840–3847. [Google Scholar] [CrossRef] [PubMed]
- Yuan, C.; Ye, Y.; Tang, C.C.; Fang, X.Q. Accuracy Comparison of Gridded Historical Cultivated Land Data in Jiangsu and Anhui Provinces. China Geogr. Sci. 2017, 27, 273–285. [Google Scholar] [CrossRef]
- Ye, Y.; Fang, X.Q.; Ren, Y.Y.; Zhang, X.Z.; Chen, L. Northeast China’s Past 300 Years of Cultivated Land Cover Change. Chin. Sci. D Ser. Earth Sci. 2009, 32, 340–350. [Google Scholar]
- Liu, D.S. The Loess Deposits of China; Science Press: Beijing, China, 1964. (In Chinese) [Google Scholar]
- Huang, T. The Impact of Human Activities on Sediment Deposition and Flooding in the Lower Reaches of the Yellow River in the Past 4000 Years. Doctoral Dissertation, Northwest A&F University, Xianyang, China, 2023. [Google Scholar]
- Shi, N. A Study of the Historical Geography of the Loess Plateau; The Yellow River Water Conservancy Press: Zhengzhou, China, 2001. (In Chinese) [Google Scholar]
- Zhang, P.Y. Climate Change in Chinese History; Shandong Science and Technology Press: Jinan, China, 1996. (In Chinese) [Google Scholar]
- Meng, Q. Soil and Water Conservation in Loess Plateau; Yellow River Water Conservancy Press: Zhengzhou, China, 1996. (In Chinese) [Google Scholar]
- Liu, Y.H.; Xu, Y.; Liu, Y. Population Growth and Temporal-spatial Differentiation in Loess Plateau Region in the last 2000 Years. Prog. Geogr. 2012, 1, 156–166. [Google Scholar] [CrossRef]
- Zhao, G.; Mu, X.; Wen, Z.; Wang, F.; Gao, P. Soil erosion, Conservation and Eco-environment changes in the Loess Plateau of China. Land Degrad. Dev. 2013, 24, 499–510. [Google Scholar] [CrossRef]
- Lu, Y.; Teng, Z. A Study of Historical Population by Province and Region in China (Hardcover Edition); Shandong Peoples’ Publishing House: Jinan, China, 2006; Volumes I and II. (In Chinese) [Google Scholar]
- Wang, S. Research Progress on the Relationship Between Vegetation Changes, Human Factors Change and Runoff and Sediment of the Yellow River in the Loess Plateau in Historical Period. In Collection of Researches on Environment Changes of the Yellow River and Laws of Water and Sediment Transportation; Wang, S., Ed.; Science Press: Beijing, China, 1993; Volume 5, pp. 1–9. (In Chinese) [Google Scholar]
- Sang, G. Vegetation Variation of Loess Plateau during human history. J. Arid. Land Resour. Environ. 2005, 19, 54–58. [Google Scholar]
- Chen, F.; Xu, Q.; Chen, J.; Birks, H.; Liu, J.; Zhang, S.; Jin, L.; An, C.; Telford, R.; Cao, X. East Asian summer monsoon precipitation variability since the last deglaciation. Sci. Rep. 2015, 5, 1–11. [Google Scholar] [CrossRef]
- Zhu, K. A preliminary study on climate change in China in recent 5000 years. Sci. Sin. 1973, 2, 168–189. [Google Scholar] [CrossRef]
- Chen, Y. Balancing green and grain trade. Nat. Geosci. 2015, 10, 739–741. [Google Scholar] [CrossRef]
- Shen, Y.; Zhao, S.; Zheng, D. Chronology of the Yellow River. Military Committee and Resources Committee of the Republic: Nanjing, China, 1935. (In Chinese) [Google Scholar]
- Фoлoд, Н.И.; Tan, J.W.; Liu, T.F. Prediction of Agricultural Production Effect; Agriculture Press: Beijing, China, 1983. (In Chinese) [Google Scholar]
- Wang, F.J.; Liang, W.; Fu, B.J.; Jin, Z.; Yan, N.N. Spatial and temporal changes of cultivated land and quantitative analysis of ration safe cultivated land on the Loess Plateau in recent years. Arid. LAND Geogr. 2020, 43, 161–171. [Google Scholar]
- Wu, X.; Wang, H.; Bi, N.; Saito, Y.; Xu, J.; Zhang, Y.; Lu, T.; Cong, S.; Yang, Z. Climate and human battle for dominance over the Yellow River’s sediment discharge: From the Mid-Holocene to the Anthropocene. Mar. Geol. 2020, 425, 106188. [Google Scholar] [CrossRef]
- Paulo, A.A.; Pereira, L.S. Drought concepts and characterization. Water Int. 2006, 31, 37–49. [Google Scholar] [CrossRef]
- Elvin, M. The Retreat of the Elephants: An Environmental History of China; Yale University Press: New Haven, CT, USA, 2004. [Google Scholar] [CrossRef]
- Huang, T.; Liu, B.Y.; Zhao, Y.G. The demographic changes and their driving forces on the Loess Plateau since 4000 years BP. Sustainability 2023, 15, 7095. [Google Scholar] [CrossRef]
- Montgomery, D.R. Soil erosion and agricultural sustainability. Proc. Natl. Acad. Sci. USA 2007, 104, 13268–13272. [Google Scholar] [CrossRef]
- Tang, K.L.; Zhang, K.L.; Lei, A.L. Research and Argumentation on the Maximum Slope for Returning Farmland to Forests and Grasslands in the Loess Hilly Region. Sci. Bull. 1998, 43, 200–203. [Google Scholar]
- Tang, K.L.; Zhang, K.L.; Zheng, F.L.; Zha, X.; Wang, W.L.; Cai, Q.; Bai, H.Y. Analyzing on natural erosion and man-made accelerated erosion in the Ziwuling forest area. Mem. NISWC Acad. Sin. Minist. Water Resour. 1993, 17, 18–20. [Google Scholar]
- Wang, S.; Fu, B.J.; Piao, S.L.; Lü, Y.H.; Ciais, P.; Feng, X.M.; Wang, Y.F. Reduced sediment transport in the yellow river due to anthropogenic changes. Nat. Geosci. 2015, 9, 38–41. [Google Scholar] [CrossRef]
- Wang, H.; Sun, F. Variability of annual sediment load and runoff in the Yellow River for the last 100 years (1919-2018). Sci. Total Environ. 2021, 758, 143715. [Google Scholar] [CrossRef]
- Jin, Z. The creation of farmland by gully filling on the Loess Plateau: A double-edged sword. Environ. Sci. Technol. 2014, 48, 883–884. [Google Scholar] [CrossRef]


| Year | Dynasties | Cropland Area (Thousand km2) | References | Year | Dynasties | Cropland Area (Thousand km2) | References |
|---|---|---|---|---|---|---|---|
| 770- 221 BC | Spring and Autumn and Warring States | 153 | [15] | 1290 | Yuan | 357 | [19] |
| 2 AD | Western Han | 381 | [15] | 1368–1644 | Ming | 671 | [15] |
| 220–581 | Wei–Jin Southern–Northern dynasties | 257 | [15] | 1661 | Qing | 608 | [16] |
| 618–907 | Tang | 428 | [15] | 1724 | Qing | 715 | [17] |
| 1000 | Northern Song | 347 | [18,19] | 1821 | Qing | 777 | [15] |
| 1066 | Northern Song | 494 | [18,19] | 1887 | Qing | 822 | [17] |
| 1078 | Northern Song | 516 | [18,19] | 1910 | Qing | 819 | [17] |
| 1162 | Southern Song | 352 | [19] | 1953 | - | 1067 | [15] |
| 1215 | Southern Song | 512 | [19] |
Disclaimer/Publisher’s Note: The statements, opinions and data contained in all publications are solely those of the individual author(s) and contributor(s) and not of MDPI and/or the editor(s). MDPI and/or the editor(s) disclaim responsibility for any injury to people or property resulting from any ideas, methods, instructions or products referred to in the content. |
© 2025 by the authors. Licensee MDPI, Basel, Switzerland. This article is an open access article distributed under the terms and conditions of the Creative Commons Attribution (CC BY) license (https://creativecommons.org/licenses/by/4.0/).
Share and Cite
Huang, T.; An, S.; Huang, W.; Liu, B. Loess Plateau Cropland: Evolution and Ecological Impacts over Four Millennia. Land 2025, 14, 1015. https://doi.org/10.3390/land14051015
Huang T, An S, Huang W, Liu B. Loess Plateau Cropland: Evolution and Ecological Impacts over Four Millennia. Land. 2025; 14(5):1015. https://doi.org/10.3390/land14051015
Chicago/Turabian StyleHuang, Tao, Shaoshan An, Wanyun Huang, and Baoyuan Liu. 2025. "Loess Plateau Cropland: Evolution and Ecological Impacts over Four Millennia" Land 14, no. 5: 1015. https://doi.org/10.3390/land14051015
APA StyleHuang, T., An, S., Huang, W., & Liu, B. (2025). Loess Plateau Cropland: Evolution and Ecological Impacts over Four Millennia. Land, 14(5), 1015. https://doi.org/10.3390/land14051015