Article

Multi-Scenario Simulation of Land Use Change Along with Ecosystem Service Value for the Lanzhou–Xining Urban Agglomeration

by
Jing Bai
,
Zhuo Jia
*,
Yufan Sun
,
Chengyi Zheng
and
Mingxing Wen
College of Earth and Environmental Sciences, Lanzhou University, Lanzhou 730000, China
*
Author to whom correspondence should be addressed.
Land 2025, 14(4), 860; https://doi.org/10.3390/land14040860
Submission received: 12 March 2025 / Revised: 10 April 2025 / Accepted: 11 April 2025 / Published: 14 April 2025
(This article belongs to the Section Land, Biodiversity, and Human Wellbeing)

Abstract

:
Research on the characteristics of land use change in urban agglomerations and its influences on ecosystem service value has important theoretical significance and practical value for supporting spatial development and guaranteeing ecological security. Located in the upper reaches of China’s Yellow River, the Lanzhou–Xining urban agglomeration is situated in the mosaic of the transition from the Qinghai–Tibet Plateau to the Loess Plateau. It is a substantial industrial base and economic region of western China. It is also the essence of a relatively concentrated population and dense cities. It is not only a key development area but also an essential ecological barrier in western China, shouldering the important responsibility of ensuring a win-win situation for both economic and social development and ecological and environmental protection. This research takes the Lanzhou–Xining urban agglomeration as a case region, investigates the characteristics of changes in land use and ecosystem service value from 2000 to 2020, and applies the PLUS model to emulate land use changes and ecosystem service value in 2030 in three scenarios: the natural development scenario, cultivated land protection scenario, and ecological conservation scenario. The results indicate that: (1) The land use type of the Lanzhou–Xining urban agglomeration from 2000 to 2020 was dominated by grassland, accounting for 60.32~61.25% of the gross area. The reciprocal transfer between cultivated land and grassland was the most significant, and the expansion of construction land mainly took over cultivated land and grassland, accounting for 58.23% and 34.84%. (2) As a result of ecological rehabilitation projects and the continuous increase of water areas, the ecosystem service value of Lanzhou–Xining urban agglomeration continued to increase between 2000 and 2020, with a cumulative total of 56.84 × 10⁸ yuan and a growth rate of 2.67%. Grassland donated the most to the ecosystem service value, constituting 52.56~53.44%. Among the individual ecosystem service values, hydrological regulation and climate regulation contributed the most, and together accounted for 50.86~51.69% of the ecosystem service value. (3) Under the natural development scenario, unrestricted urban sprawl has taken possession of cultivated land and grassland. Under the cultivated land protection scenario, cultivated land has maintained a relatively stable level while construction has been subject to certain constraints. Under the ecological conservation scenario, ecological land has been largely protected and the encroachment of construction onto ecological land has been curbed. (4) Of the three scenarios, only the ecological conservation scenario saw an increase in the ecosystem service values compared to 2020. The reduction in grassland and water area was the main cause for the decrease of the ecosystem service values in the natural development scenario and cultivated land protection scenario. The results can supply a solid foundation for decision-making for future development of the Lanzhou–Xining urban agglomeration and the rational use of land, as well as offer references for the ecological conservation and high-quality development of urban agglomerations in the upper reaches of the Yellow River.

1. Introduction

Land use change (LUC) is the consequence of the combination of drivers under a specific human–land relationship and is the main driver affecting ecosystem change, which is related to human survival and sustainable development [1,2]. Ecosystem Services (ES) are commodities and services that humans obtain directly or indirectly from ecosystems, and they are closely linked to human welfare [3]. LUC brings about changes in both the function and structure of ES, resulting in changes in ecosystem service values (ESVs) [4,5]. The scientific and rational utilization of land resources is a basis for achieving a harmonious relationship between humans and nature, which in turn achieves the purpose of coordinating the ecosystem. Therefore, exploring the role of LUC on ESVs is essential for optimizing land use and ensuring ecological safety.
Ecosystem service value (ESV) is a quantification of competence in managing ES, and its assessment pathways mainly include two categories: energization and monetization [6]. The valuation of ES by monetization is more easily understood by decision-makers and the public and is most widely applied [7]. Among the studies conducted, American scholars have carried out a monetized assessment of ESVs on a global scale by creating an equivalent factor for measuring ESVs [8]. According to the actual situation in China, Chinese scholars developed the “China Terrestrial Ecosystem Service Value Equivalent Factor Scale” [9] and used it to evaluate the ESVs in China [10], the Jinsha River Basin [11], the urban agglomerations of the Yangtze River Delta [12], and the Tibet Autonomous Region [13] to evaluate the ESVs at different spatial scales.
A lot of researchers have investigated the impacts of LUC on ESVs [14,15,16], but most of them have been concerned with the impacts of the “past-now”, and the effects of future LUC on ESVs need to be further investigated. Changes in ESVs are mainly affected by LUC, so modeling and predicting LUC is important for assessing the ESVs of the future. Research that has been conducted has proposed a variety of hybrid models and algorithms to simulate LUC, including Cellular Automata (CA) [17], the CLUE-S (Conversion of Land Use and its Effects) model [18], the SLEUTH (Slope, Land use, Exclusion, Urban, Transportation, Hillshade) model [19], the Future Land Use Simulation (FLUS) model [20], etc. However, these models have certain restrictions [21,22]. In contrast, the patch-generating land use simulation model (PLUS) can simulate LUC under human activities and natural influences at a higher resolution and thus can more accurately explore the spatial and temporal patterns of future land use [23].
As a local and nurturing urban agglomeration in China, the Lanzhou–Xining urban agglomeration (LXUA) is one of the 19 urban agglomerations in China with a relatively low hierarchy and less development. On the one hand, LXUA is a highland for socioeconomic development in the inland of Northwest China, a hub for opening up the land bridge corridor to the west and the land and sea corridor to the south, a link for communication between Northwest China and Southwest China, and a gateway for entering Xinjiang and Tibet, which is an important strategic underpinning for optimizing the pattern of territorial development, supporting the economic development of Northwest China, consolidating the stability of the western border, and promoting the interactions and integration of the nationalities. On the other hand, LXUA is located at the combination of the country’s three major ecological barriers of the key ecological function zones of the Qinghai–Tibetan Plateau, the key ecological function zones of the Yellow River and the Loess Plateau, and the Desert Control Strip of Northern China, constituting an essential component of China’s ecological security pattern and shouldering the prominent responsibility of safeguarding the ecological security of western China. It has been a unique ecological conservation role in safeguarding the “Chinese Water Tower” on the Qinghai–Tibet Plateau, promoting water conservation in the upper reaches of the Yellow River, curbing soil erosion on the Loess Plateau, and preventing the spread of desertification from west to east [24]. Therefore, this paper takes LXUA as a case region and refers to the land use data of 2000, 2005, 2010, 2015, and 2020. Firstly, we used ArcGIS10.8 to get the land use transfer matrix of LXUA, investigate the spatial and temporal patterns of LUC, and evaluate its ESV. Secondly, the PLUS model was used to anticipate the LUC under different scenarios in the future and calculate its ESV. Finally, according to the conducted research, a specific path for LXUA to efficiently utilize the land and sustainably increase the ESV is presented to provide decision-making references for ecological conservation and high-quality development of the urban agglomeration in the upper reaches of the Yellow River.

2. Data and Methods

2.1. Research Area and Data Sources

2.1.1. Research Area

LXUA is located at 98°05′ E–105°38′ E, 34°07′ N–39°05′ N, containing 20 county-level units in Gansu Province and 19 county-level units in Qinghai Province, with an overall of 39 counties (county-level cities and districts) (Figure 1), a gross area of 9.75 × 10⁴ km2 accounting for 8.3% of the total area of the Gansu and Qinghai provinces, a gross population of 1346 × 104 people, accounting for 66.5% of the total population of the Gansu and Qinghai provinces, and a gross GDP of 6139.14 × 108 yuan, accounting for 51% of the total GDP of the Gansu and Qinghai provinces in 2022. Located in the upper reaches of the Yellow River, LXUA is a prominent growth pole for the socioeconomic development of Northwest China and plays a prominent supporting role in promoting the prosperity and stabilization of Northwest China. With the Lanzhou–Chongqing railway in operation, the Xining–Chengdu railway started, and the new western land and sea dual composite corridor construction, the LXUA has become the new Asia–Europe Land Bridge corridor and the new western land and sea corridor the intersection of the double cross-hub. The LXUA is expected to become a hub region of China’s new development pattern based on domestic macro-circulation and the mutual promotion of the domestic and international double-circulation, a key region for the construction of a national strategic hinterland, a key industrial backup, a receiving region for the transfer of industries from East and Central China to the West, and a model region for innovation-driven leadership and transformation of the old and new kinetic energies.
LXUA is located in the Loess Plateau and the Tibetan Plateau transition zone. “China’s mother river”, the Yellow River, and its third largest tributary the Huangshui River, flow from China’s terrain of the first step to the second step of the articulation area. The natural unit of geography is divided into western and eastern parts, the west for the Huangshui River Valley and Yellow River Valley in the east of Qinghai Province, and the east for the Loess Plateau, Yellow River Basin, and Yellow River Valley in central Gansu Province. Beginning at an altitude of 1800–2200 m, the Huangshui River Valley terrain is high in the west and low in the east. It is the lowest point of the entire Tibetan plateau. From that direction, the Huangshui River Valley as a whole runs from northwest to southeast through gradually lowering terrain on three sides of the mountains. One side, opening to the southeast, carries the Pacific Ocean’s warm and humid air deep into the interior of Northwest China as the southeastern monsoon, resulting in the average annual precipitation in Xining reaching 380 mm. The annual rainfall in the east 200 km of Lanzhou is more than 50 mm higher. Relatively low altitude as well as the depth of the southeast monsoon also make the Huangshui River Valley climate warm and humid, conducive to the growth of vegetation, making the Huangshui River Valley an important agricultural area of the Tibetan Plateau.
In the Tibetan plateau’s strong tectonic movement uplifts, the Yellow River’s constant downward erosion and hydraulic pressure cut through the rock. In the hard granite, gneiss, and other sections, the rock’s resistance to erosion is strong. It is not easy for the river’s long-term erosion to destroy, and thus it forms the canyon. In the loose sand shale, the red rock system, and other sections, the rock is easy to erode, resulting in the formation of a wide valley. Within the territory of LXUA, 18 terraced hydropower stations have been built, forming a landscape pattern of reservoirs and cities distributed in a bead-like fashion, of which the Longyangxia Reservoir and the Liujiaxia Reservoir are the two reservoirs with the largest and second largest watersheds, respectively.
Due to the influence of climate and topography, the distribution of vegetation is characterized by non-zonal differentiation, such as local differentiation and vertical differentiation. In the west, there are meadow grasslands, forests, alpine meadows, and other vegetation landscapes, and in the east, there are grasslands, desert grasslands, and other vegetation landscapes which are affected by the southeastern monsoon, the local topography and mountain and river structures, and other factors. They form a special distribution law in the local range which is different from the law of longitude zoning due to the difference in dry and wet conditions caused by the changes in distance from the sea, so that vegetation landscapes appear to be “anomalous” phenomena, which makes habitats more unique and the landscape more colorful.

2.1.2. Data Sources and Handling

The data required for land use simulation of LXUA and its sources are shown in Table 1. The land use data were selected for five periods in 2000, 2005, 2010, 2015, and 2020, and the land use types were classified into cultivated land (CL), forest land (FL), grassland (GL), water area (WA), construction land (CSL), and unused land (UL) with reference to the National Remote Sensing Monitoring Land Use/Cover Classification System and existing studies [25,26]. The natural condition data included DEM data, slope, river, temperature, and precipitation. The slope data were based on DEM data extracted in ArcGIS 10.8 using the slope generation tool. Social and economic data included GDP, population, railways, highways, national and provincial trunk roads (including primary roads, secondary roads, and tertiary roads), and county government sites. The constrained data were nature reserves.

2.2. Research Methods

2.2.1. Land Use Transfer Matrix

The land use transfer matrix provides a dynamic representation of the transitions in land area among various land use types within a specified region throughout the research [27]. The formula is expressed as follows:
S i j = S 11 S 1 n S n 1 S n n
where S i j represents the area of land type i that has been converted to land type j. The term n represents the number of land use types before and after the transfer. The terms i and j (where i,j = 1, 2,⋯,n) correspond to the specific land use types before and after the conversion, respectively.

2.2.2. ESV Estimation

Principles and Operation of the Equivalent Factor Method

Most methods of estimating ESV are either based on the price of ecosystem service products per unit or based on the value equivalent factor per unit area for the valuation of ecosystem services. For this paper, we adopted the method based on the unit area value equivalent factor, mainly considering that this method is intuitive and easy to use, has fewer data requirements, and is particularly suitable for the assessment of ecosystem service value at the regional scale. In order to construct an objective and accurate equivalence factor table, Xie et al. [28] constructed an expert-knowledge-based ecosystem service valorization method based on Costanza et al.’s functional classification of ecosystem services, which was continuously revised in the process of application. Since Xie’s et al. “Table of Equivalent Coefficients for the Value of Terrestrial Ecosystem Services in China” was used to assess the value of ecosystem services in China [29], it needs to be further revised for assessing the value of ecosystem services in specific regions of China.

Improvement and Calibration of the Equivalent Factor Method

In this research, the equivalence factor table was modified according to the actual situation of LXUA and existing studies [30,31,32], in which the ESV of CSL was generally not considered and the coefficient was 0 [33]. The economic value of the equivalent ESV in China is 3406.50 Yuan/hm2 (503.2 USD/hm2) [9]. The grain production per unit area in LXUA was 3462.61 kg/hm2 in 2010 (Gansu Development Yearbook 2011, Qinghai Statistical Yearbook 2011), and the grain production per unit area nationwide was 4974 kg/hm2 in 2010 [34]. The corrective coefficient of ESV is 0.6961, so the value of one ecosystem service equivalent in LXUA is 2371.26 Yuan/hm2, and the table of ecosystem service equivalents of LXUA is derived from this table (Table 2). Here, the ESV is divided into four aspects: supply, adjustment, support, and cultural services. Supply is subdivided into food production (FP), raw material production (RMP), and water resources supply (WRS). Adjustment is subdivided into gas regulation (GR), climate regulation (CR), environmental purification (EP), and hydrological regulation (HR). Support is subdivided into soil maintenance (SM), maintaining nutrient circulation (MNC), and biological diversity (BD). Cultural services is subdivided into aesthetic landscape (AL). The same is shown below (Table 2). The formula for calculating the ESV is shown in Equations (2) and (3):
E S V = i = 1 n A i × V C i
E S V f = i = 1 n ( A i × V C f i )
where A i is the area (hm2) of land type i and V C i is the ESV coefficient of land type i. E S V f is the value of ecosystem service function f and V C f i is the f ESV coefficient of land type i.

2.2.3. PLUS Model

The PLUS model is an improved meta-cellular automaton model constructed based on the FLUS model, with an enhanced ability to identify the factors that trigger various types of LUCs and accurately simulate a variety of LUC scenarios at the patch level [23]. The PLUS model consists of the land expansion analysis strategy (LEAS) module and the cellular automaton model based on the multitype random patch seeds (CARS) module [35]. The PLUS model can extract the land use type changes in two periods and investigate the connection between LUCs and drivers using the Random Forest (RF) algorithm. The LEAS module can calculate the growth probability of each land use type in the research area and combine the number of image elements of different land use types, the transfer matrix, and the neighborhood weights of each land use type to carry out a land use simulation based on the CARS module. The CARS module operates under the constraints of the development potential of each type of land use and simulates the process of patch formation in time and space.

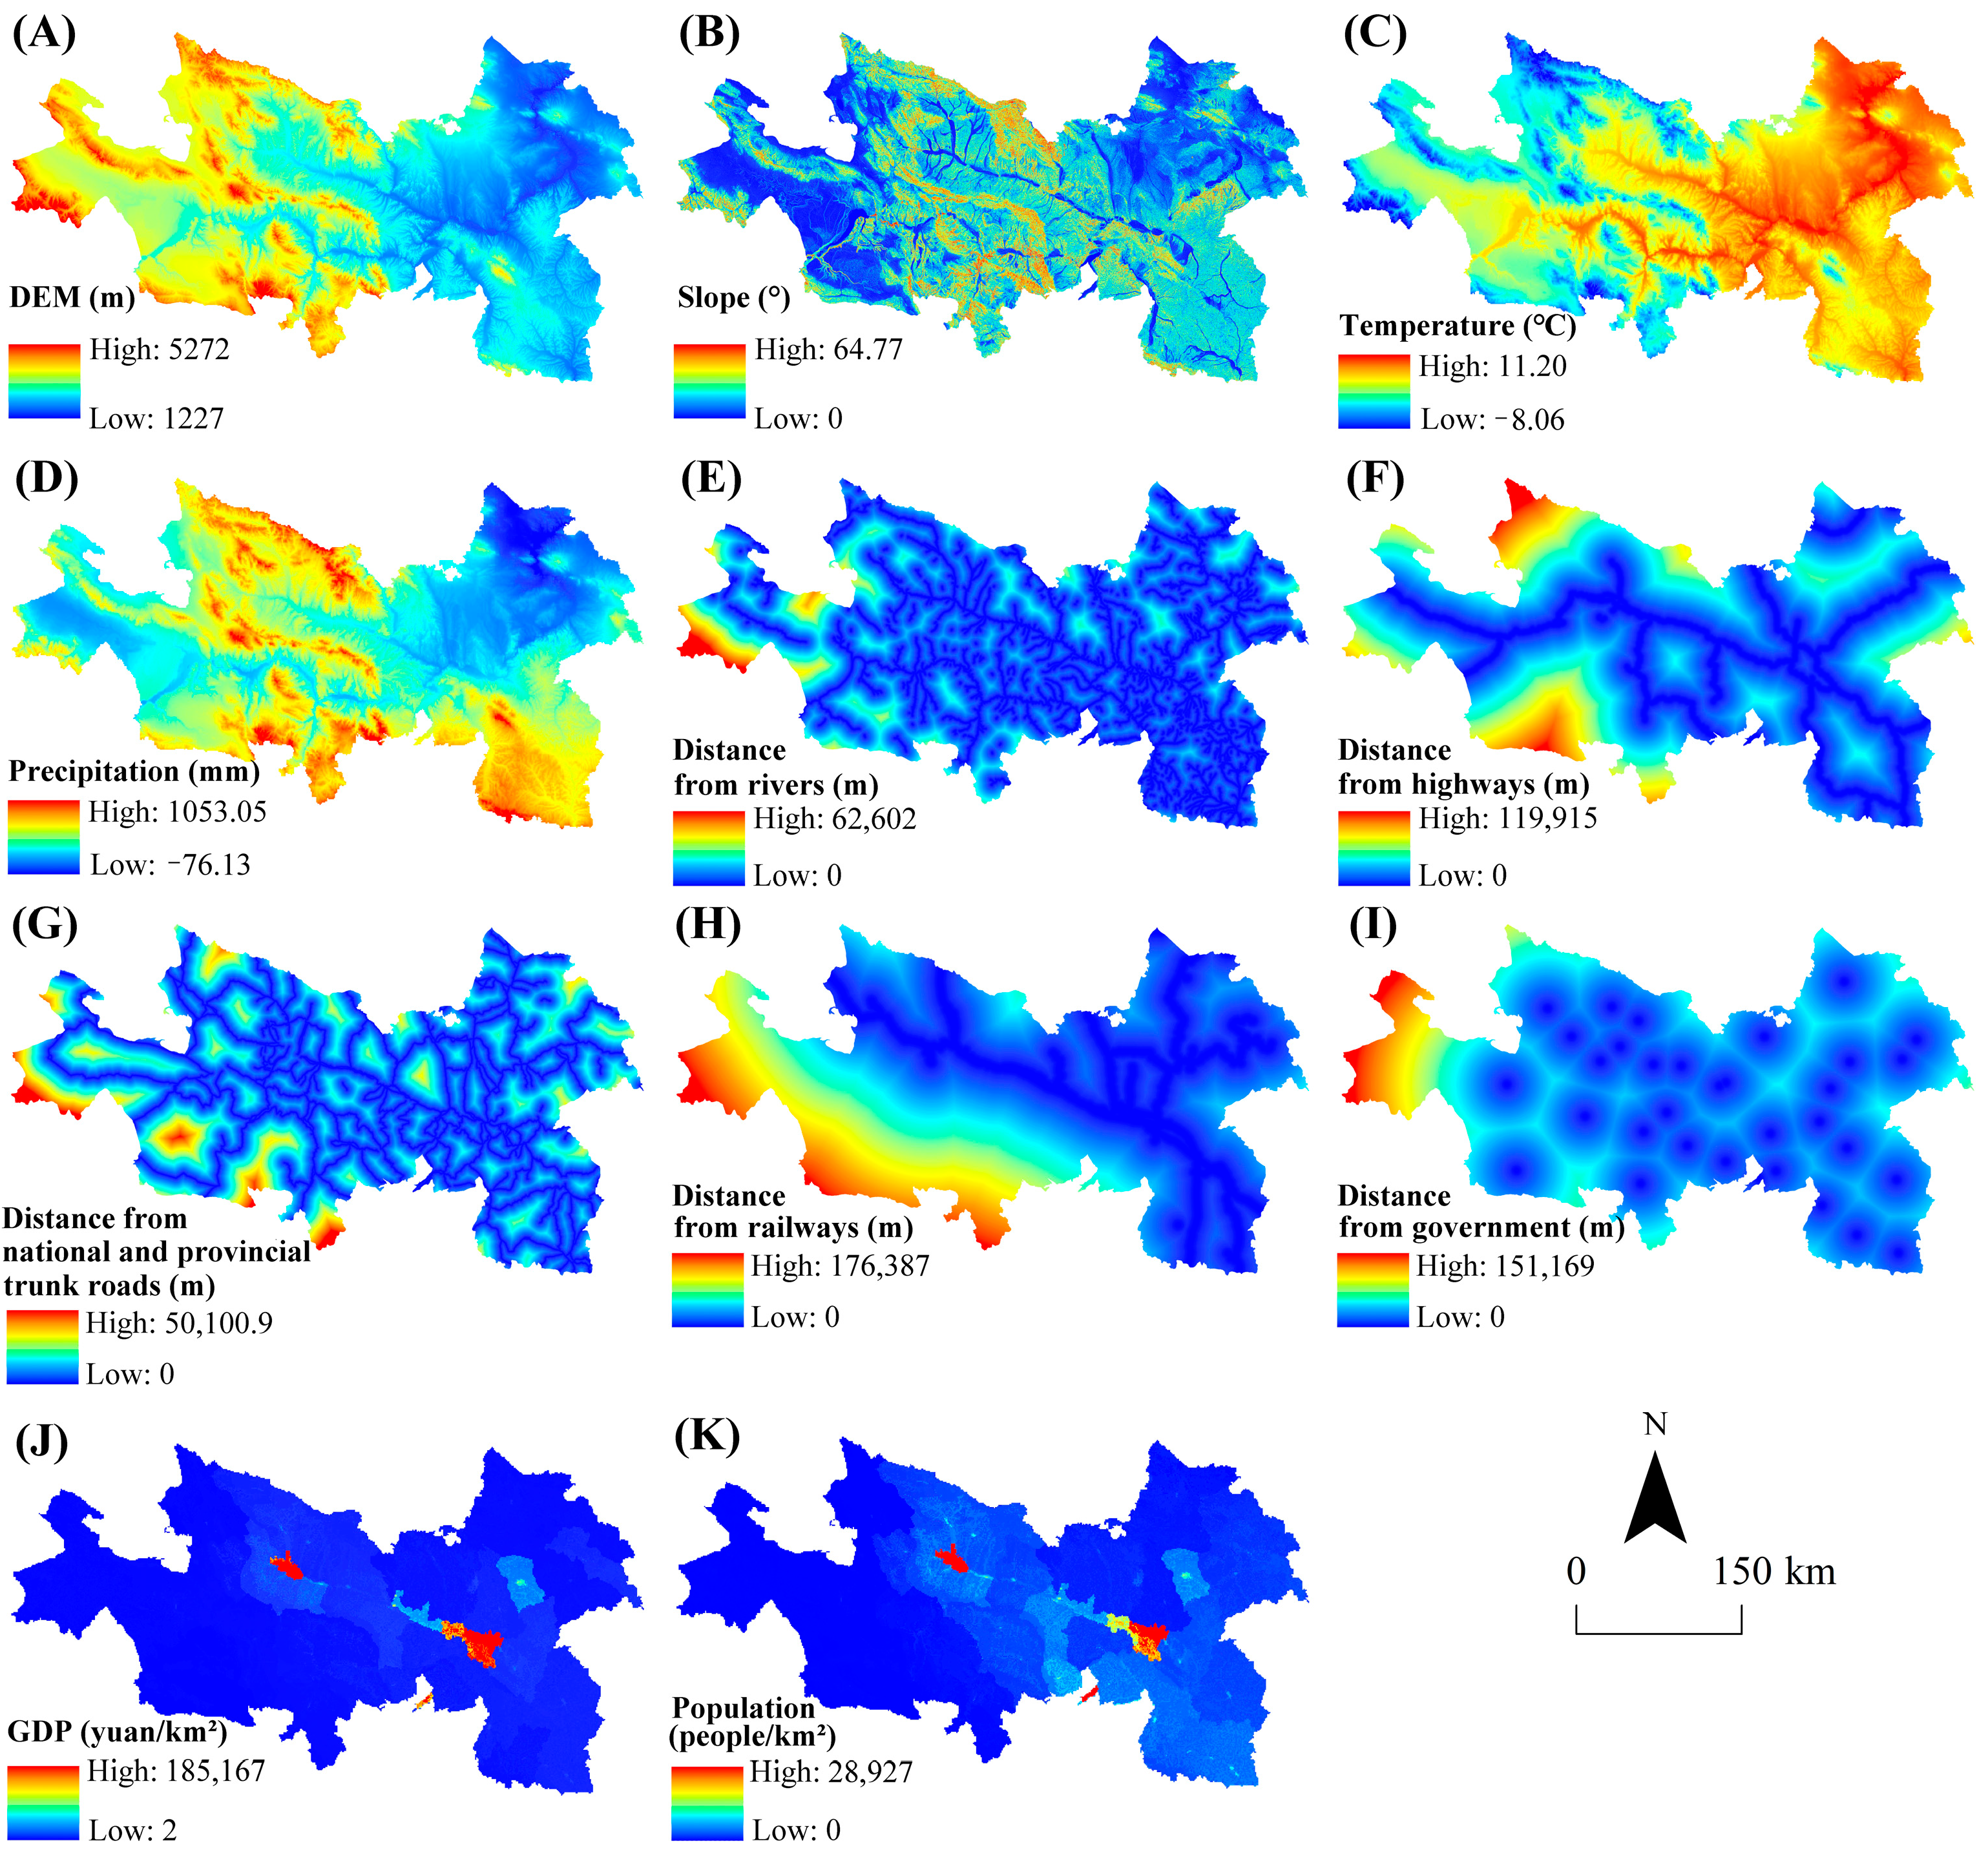
PLUS Model Drivers of Land Use

In compliance with specific simulation results, data accessibility, and the accumulation of previous research [35,36], data from the natural conditions and socioeconomic dimensions were selected as drivers for this research. The natural condition data include DEM data, slope, temperature, precipitation, and distance from rivers. The socioeconomic data include distance from highways, distance from national and provincial trunk roads (including primary, secondary, and tertiary roads), distance from railways, distance from the seat of county government, GDP, and population (Figure 2). All of the distance data were obtained by Euclidean distance calculation in ArcGIS 10.8. To meet the requirements for input into the PLUS model, all data were resampled through ArcGIS 10.8 at a sampling rate of 100 m.

Neighborhood Weight

The neighborhood weight parameter represents the sprawl intensity of different land types, with larger values indicating a stronger sprawl capacity of the land use type [37,38]. The formula is as follows:
W = T A i T A m i n T A m a x T A m i n
where T A i is the change in the amount of land type i, T A m i n is the land type with the smallest variation, and T A m a x is the land type with the largest variation. Thus, the neighborhood weights were calculated according to the land type changes in the LXUA between 2000 and 2020 (Table 3), and these were subsequently used in the PLUS model.

Multi-Scenario Settings

The emulation and forecasting of land use in urban agglomerations under different scenarios can provide decision-makers with different perspectives to judge the spatial and temporal patterns in future land use more scientifically. On the one hand, LXUA is an area with better development conditions and greater development potential, which plays the role of an initiator in promoting socioeconomic development in Northwest China. On the other hand, the fragile natural environment of LXUA, together with the enhancement of human activity behaviors, has resulted in the following tendencies for eco-environmental issues to get more serious in the region. Based on the above regional background and existing research [39,40,41], the following three scenarios were set up to apply the 2020 land use data as the basic data to replicate the temporal and spatial patterns of land use of the LXUA in 2030: the natural development scenario (NDS), cultivated land protection scenario (CLPS), and ecological conservation scenario (ECS).
(1)
The NDS, according to the characteristics of land use transfer in the historical context, applies the Markov chain demand forecasting module in the PLUS model to access the area of each land use type based on the change rule of land use between 2010 and 2020. In this scenario, the transfer of CSL to other land use types is restricted, and the remaining land use types can be transferred to each other.
(2)
The CLPS was developed according to the LXUA Development Plan’s increased requirements for the protection of CL, which restricts the occupation of CL by other land use types so the amount of CL can be well ensured. In this scenario, the transfer of CL to other land use types is restricted, and the transfer of FL, GL, and UL to CL is allowed.
(3)
The ECS was developed according to the requirement to increase the protection of ecological land in the Yellow River Basin Ecological Conservation and High-Quality Development Plan, in which context the nature reserves and WA within the LXUA are regarded as restricted conversion areas. This scenario restricts the transfer of FL, GL, and WA to CSL, and allows the transfer of UL and CL to FL, GL, and WA.
The transfer cost matrix is used to indicate whether transfers can occur between land use types (Table 4), where 0 means that transfers are prohibited and 1 means that transfers are allowed [42].

3. Results Analysis

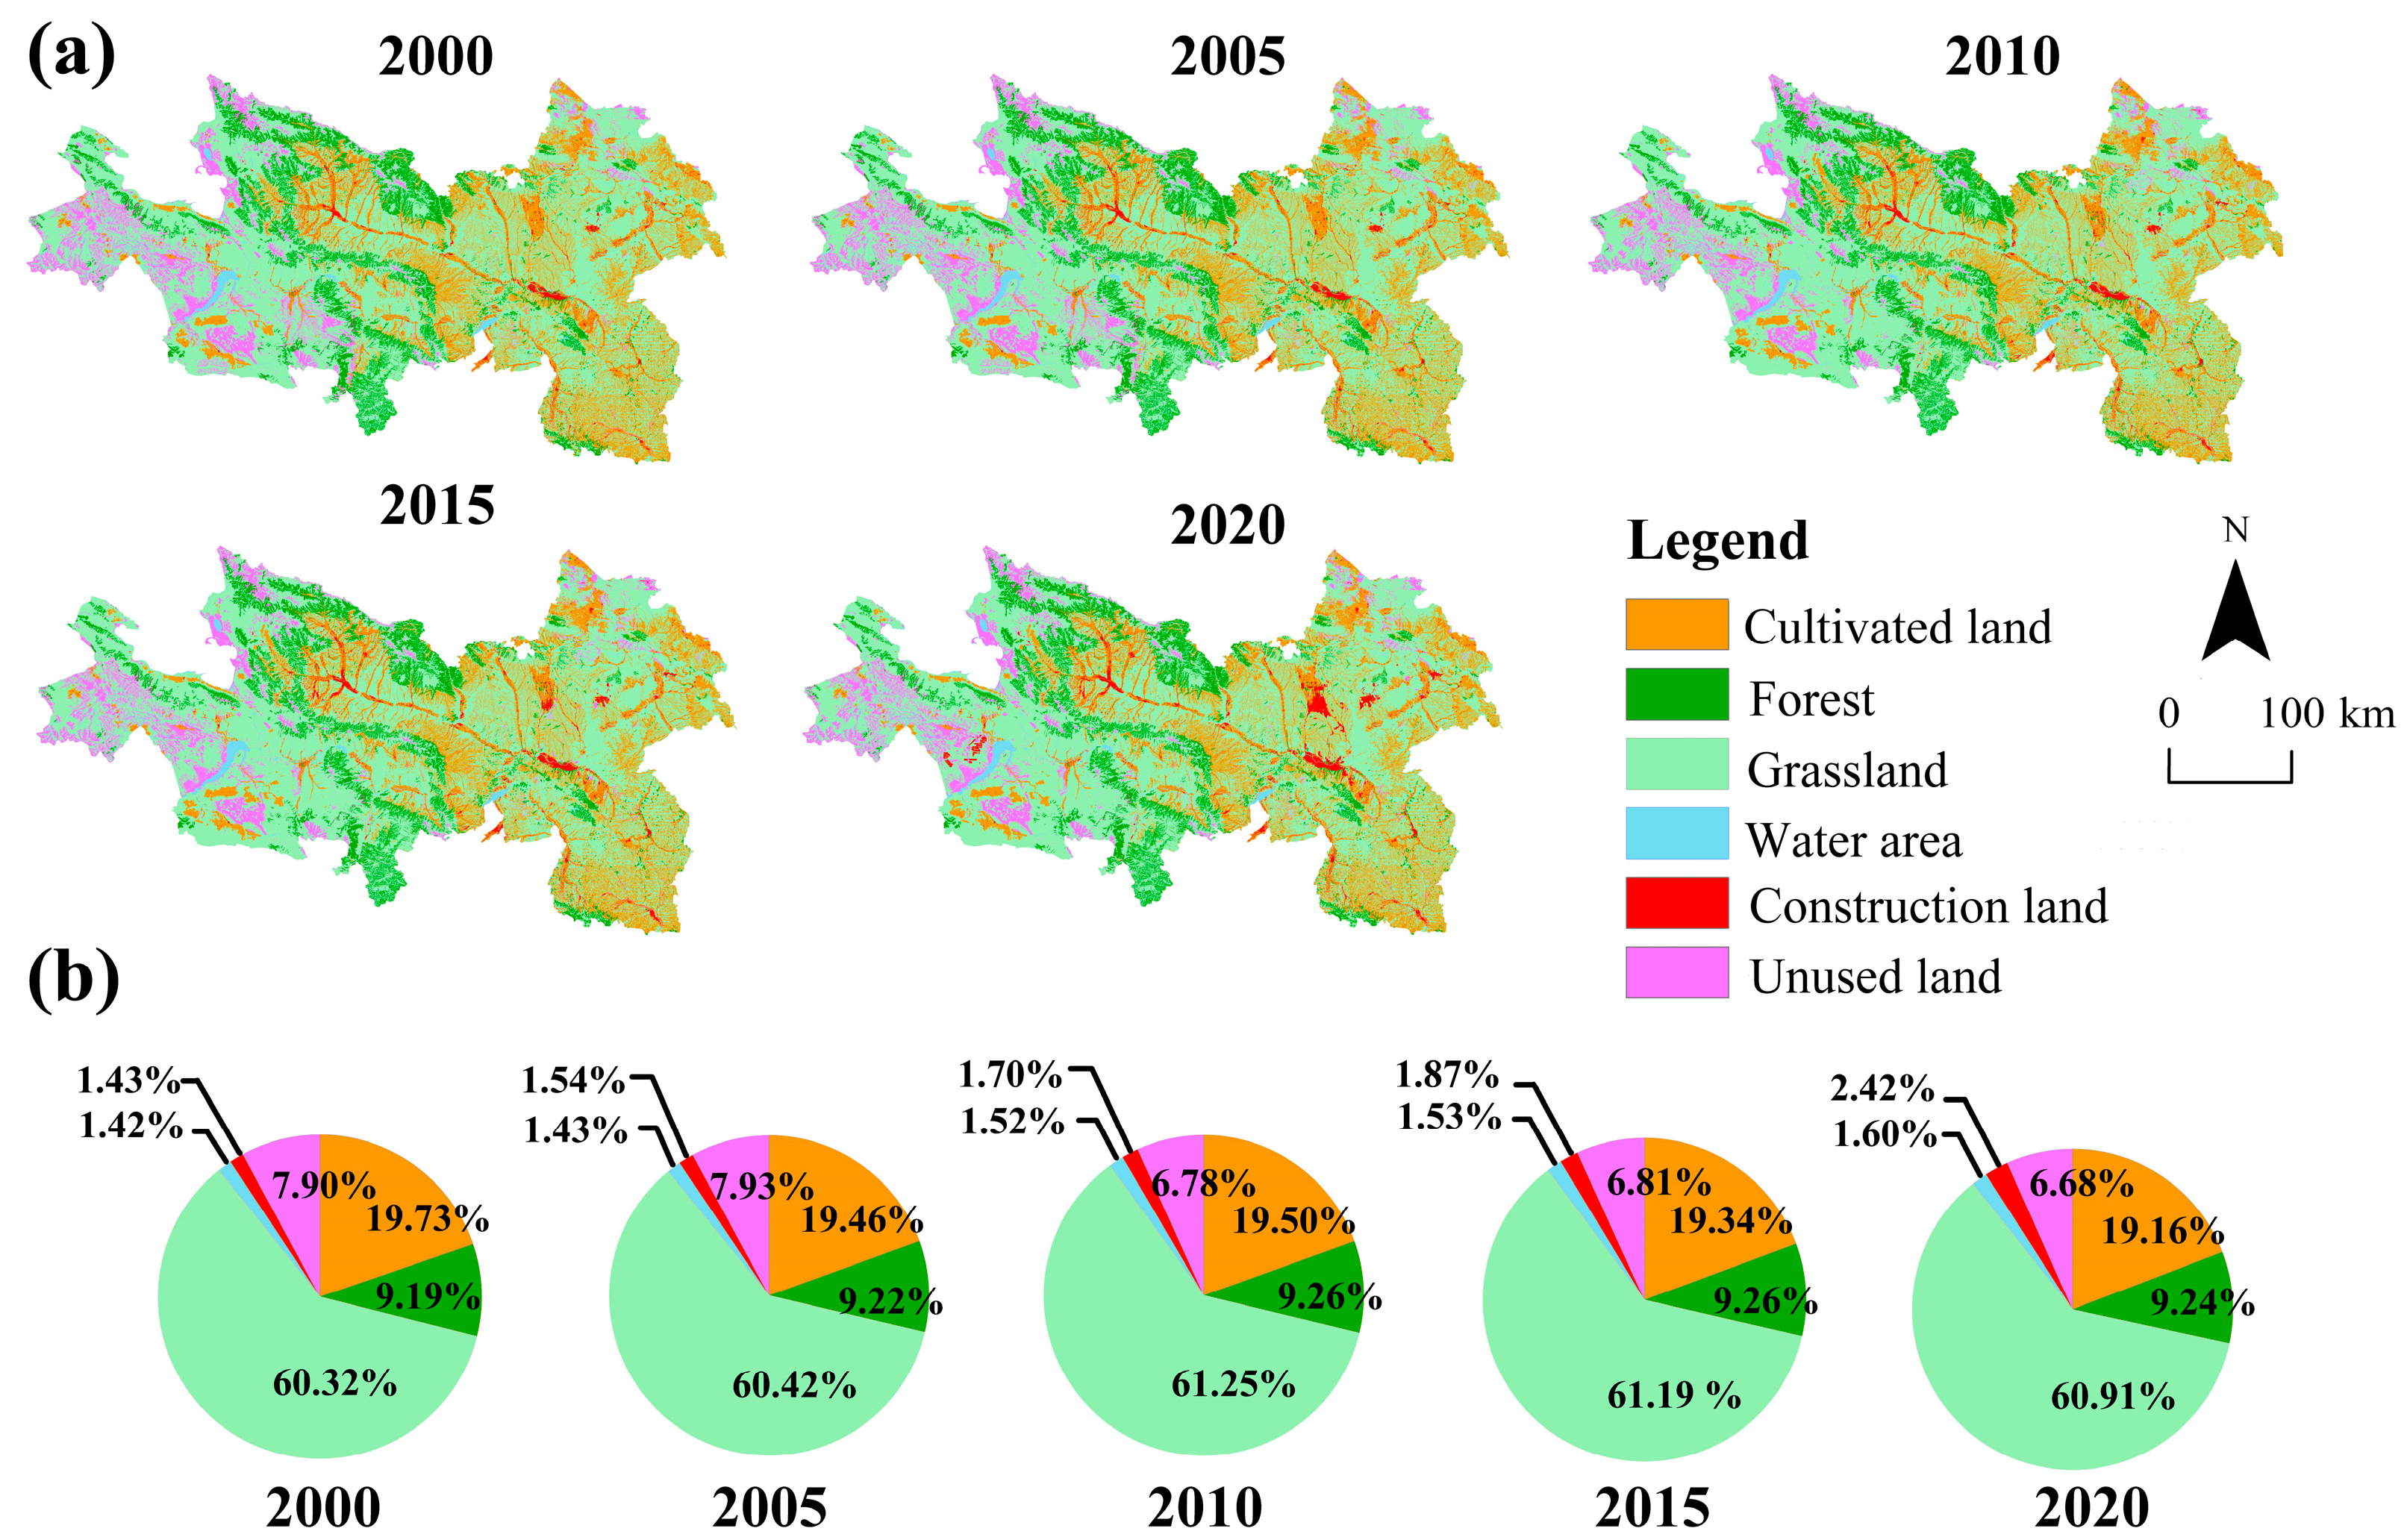
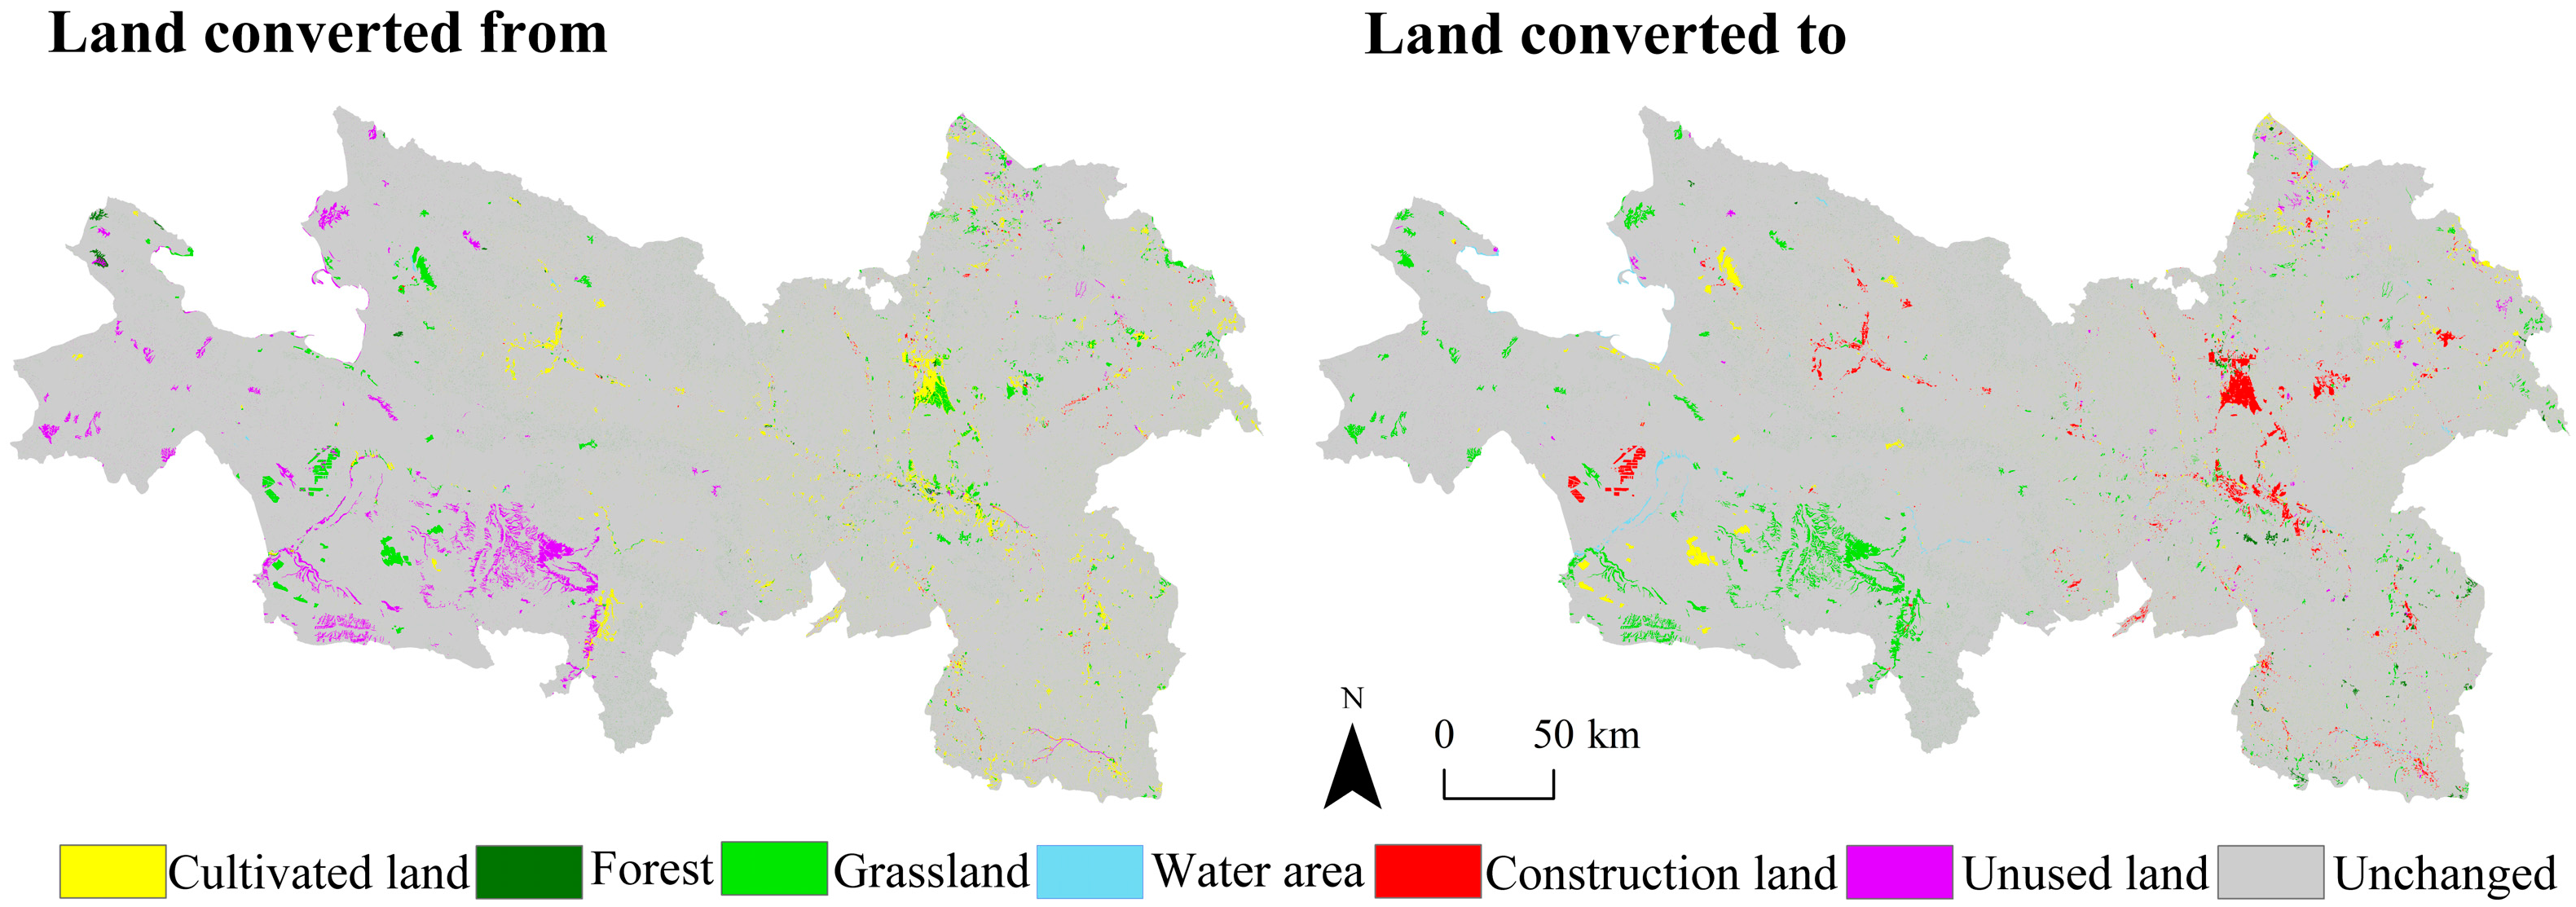
3.1. Features of LUC

Between 2000 and 2020, the proportion of land area of each type in the gross area of the LXUA was, in descending order: GL > CL > FL > UL > CSL > WA (Figure 3). GL accounts for 60.32% to 61.25% of the land area, which is the dominant land use category in the LXUA. CL accounts for 19.16~19.73%, mainly distributed in the Loess Plateau and the Yellow River Valley in central Gansu Province, and the Huanghe Valley and Huangshui Valley in Qinghai Province. The proportion of FL is 9.19~9.26%, mainly distributed in counties such as Huzhu, Jianzha, Xunhua, and Minhe of Qinghai Province, and Yuzhong and Weiyuan of Gansu Province. The area of UL accounted for 6.78~7.93%, mainly distributed the counties such as Guide, Gonghe, and Haiyan of Qinghai Province. The area of CSL accounted for 1.43~2.42%, mainly distributed in cities such as Lanzhou, Xining, Baiyin, and Haidong City. WA accounted for the lowest proportion, 1.42% to 1.60%, and was mainly distributed in the Longyangxia Reservoir on the border of Gonghe County and Guide County in Qinghai Province and the Liujiaxia Reservoir in Yongjing County in Gansu Province.
ArcGIS 10.8 was applied to process and calculate the land use data for the two periods of 2000 and 2020 to attain the land use transfer matrix (Table 5) and the spatial visual representation (Figure 4). In terms of transfer, the mutual transfer between CL and GL is most significant, but the transfer of GL to CL is greater, 104.43 km2 more than the transfer of CL to GL. The increase in CSL mainly comes from CL and GL, which are 634.16 km2 and 379.43 km2 respectively, accounting for 58.23% and 34.84% of the amount of CSL transferred, respectively. The scale of conversion of GL into FL was 234.99 km2, accounting for 70.74% of the amount of FL transferred. The transfer of UL to GL was 1245.40 km2, accounting for 88% of the amount of UL transferred out, while 107.89 km2 of UL was transferred to WA. Minor changes occurred between other land uses, which did not affect the characteristics of the overall land use.

3.2. Characteristics of Change in ESV

According to Formula (2) and Formula (3), the ESVs of the LXUA in 2000, 2005, 2010, 2015, and 2020 were calculated to be 2134.44 × 108 yuan, 2138.28 × 108 yuan, 2179.00 × 108 yuan, 2179.63 × 108 yuan, and 2191.47 × 108 yuan, respectively, and the ESVs went through three phases of slow growth, relative stability, and accelerated growth (Table 6), with a cumulative growth of 57.04 × 10⁸ yuan, a growth rate of 2.67%. The quantities of change in the ESVs in 2000–2005, 2005–2010, 2010–2015, and 2015–2020, calculated respectively on a five-year period, were 3.84 × 10⁸ yuan, 40.72 × 10⁸ yuan, 0.63 × 10⁸ yuan, and 11.84 × 10⁸ yuan.
The proportion of ESV supplied by each type of land use was, in descending order: GL > WA > FL > CL > UL. From 2000 to 2020, the proportion of ESV supplied by GL was 52.56~53.44%, the proportion of WA was 19.18~21.01%, the proportion of FL was 17.95~18.35%, the proportion of CL was 8.03~8.49%, and the proportion of UL is 0.45~0.55%.
The characteristics of change in the ESV of each type of land in 2020 compared with 2000 are as follows: the ESV of WA showed a continuous uptrend and the largest increment, with a cumulative increase of 50.97 × 10⁸ yuan, a growth rate of 12.45%. Due to the construction of reservoirs in the upper reaches of the Yellow River and the development of hydropower, the WA continues to increase. The ESV of GL and FL also showed an uptrend, ranking second and third in terms of increment, with cumulative increases of 11.06 × 10⁸ yuan and 2.08 × 10⁸ yuan and growth rates of 0.97% and 0.53%, respectively. The reason for this is attributed to the fact that the LXUA is located on the Loess Plateau in central Gansu Province and eastern Qinghai Province, where the main vegetation of the habitat background is desert grassland and meadow, and only a few stony mountains have remnants of natural forests and secondary scrub. The rate of loss of the ESV of UL is the largest, 15.50%, but since most of the UL is barren and bare land, etc., the ESV provided by it is the smallest, so it only loses 1.82 × 10⁸ Yuan. The loss rate of the ESV of CL was 2.90%, while the ESV decreased by 5.26 × 10⁸ yuan, with a downtrend annually, which is determined by the duality of productive space and ecological space that CL has.
Based on the spatial visualization of ESVs in ArcGIS 10.8, ESVs were classified into five levels: high, medium-high, medium, medium-low, and low, according to the natural breakpoint method. The features of the spatial distribution of ESVs of each class in the LXUA in the period of 2000–2020 were presented on the map from high to low and showed in five classes of red, orange-red, yellow, earthy yellow, and blue, respectively (Figure 5). There are few high value areas for ES, and the spatial pattern is distributed in a belt-like manner, mainly in large reservoirs such as the Longyangxia Reservoir in the junction of Gonghe County and Guide County of Qinghai Province and the Liujiaxia Reservoir in Yongjing County of Gansu Province, as well as in the northeastern edge of the Qinghai Lake, which includes the territory of Haiyan County. There are fewer medium-high value areas for ES, similar to the distribution of broad waters area along the Yellow River, with a point-like spatial pattern, mainly in counties such as Gonghe, Haiyan, Datong, and Guide in Qinghai Province. There is an average number of medium-value areas for ES, similar to the distribution of FL, with an island-like spatial pattern, mainly distributed on the border between Jianzha County and Hualong County and the broad waters area along the Yellow River in Guide County, Qinghai Province, in addition to the original forests in Xinglong Mountain, which is the border between Yuzhong County and Lintao County. There are many medium-low value areas for ES, similar to the distribution of GL, and the spatial pattern is mostly distributed in the form of corridors, primarily in counties or cities such as Gonghe, Haiyan, Datong, Guide, and Tongren in Qinghai Province and less prominently in counties or districts such as Yongdeng, Gaolan, Yuzhong, Jingyuan, Dongxiang, Lintao, Weiyuan, Longxi, and Pingchuan in Gansu Province. They are more low-value areas for ES are concentrated in cities such as Lanzhou, Xining, Haidong, and most of Baiyin, and four counties in the northern of Dingxi; the spatial pattern is mostly patchy, similar to the distribution of CSL and CL.
To better reveal the ESV composition, it was divided into 11 single ESVs (Table 7). The proportion of each ESV is as follows, in descending order: HR> CR > SM > GR > BD > EP > AL > FP > RMP > WRS > MNC. HR and CR contribute the most to the ESV of LXUA. Together, they account for 50.86~51.69% of the gross ESV, with a value of 1132.78 × 108 yuan in 2020. They are followed by SM, which accounts for 10.75~11.01% of the gross ESV, with a value of 235.49 × 10⁸ yuan in 2020. The value of the other ES accounted for a smaller proportion, all less than 10%. When 2020 was compared with 2000, HR CR, SM, GR, BD, EP, AL, and WRS showed a tendency to increase. FP, RMP, and MNC showed a decreasing tendency. Among them, the top three contributions to the increase in the individual ESV to the total increase are: HR, which increased by 43.38 × 10⁸ yuan, accounting for 76.05% of the total increase with a growth rate of 6.69%; CR, which increased by 3.83 × 10⁸ yuan, accounting for 6.72% of the total increase with a growth rate of 0.87%; and WRS, which increased by 3.51 × 10⁸ yuan, accounting for 6.16% of the total increase with a growth rate of 6.34%. The rest of the ESV increases contributed less than 5% to the total increase. FD, RMP, and MNC decreased by 0.83%, 0.16%, and 0.09%, respectively, with FD losing 0.56 × 10⁸ yuan, the largest loss; RMP losing 0.10 × 10⁸ yuan, the second largest loss; and MNC losing 0.02 × 10⁸ yuan, the smallest loss. The decline in FD was mainly due to the decrease in the area of CL, and RMP and MNC were affected by the combined impact of various types of land use, with a decline in the ESV. The continued increase in the area of WA was the main reason for the annual increase in HR, CR, and WRS.

3.3. Evolutionary Trends in Land Use and ESV Under Different Scenarios

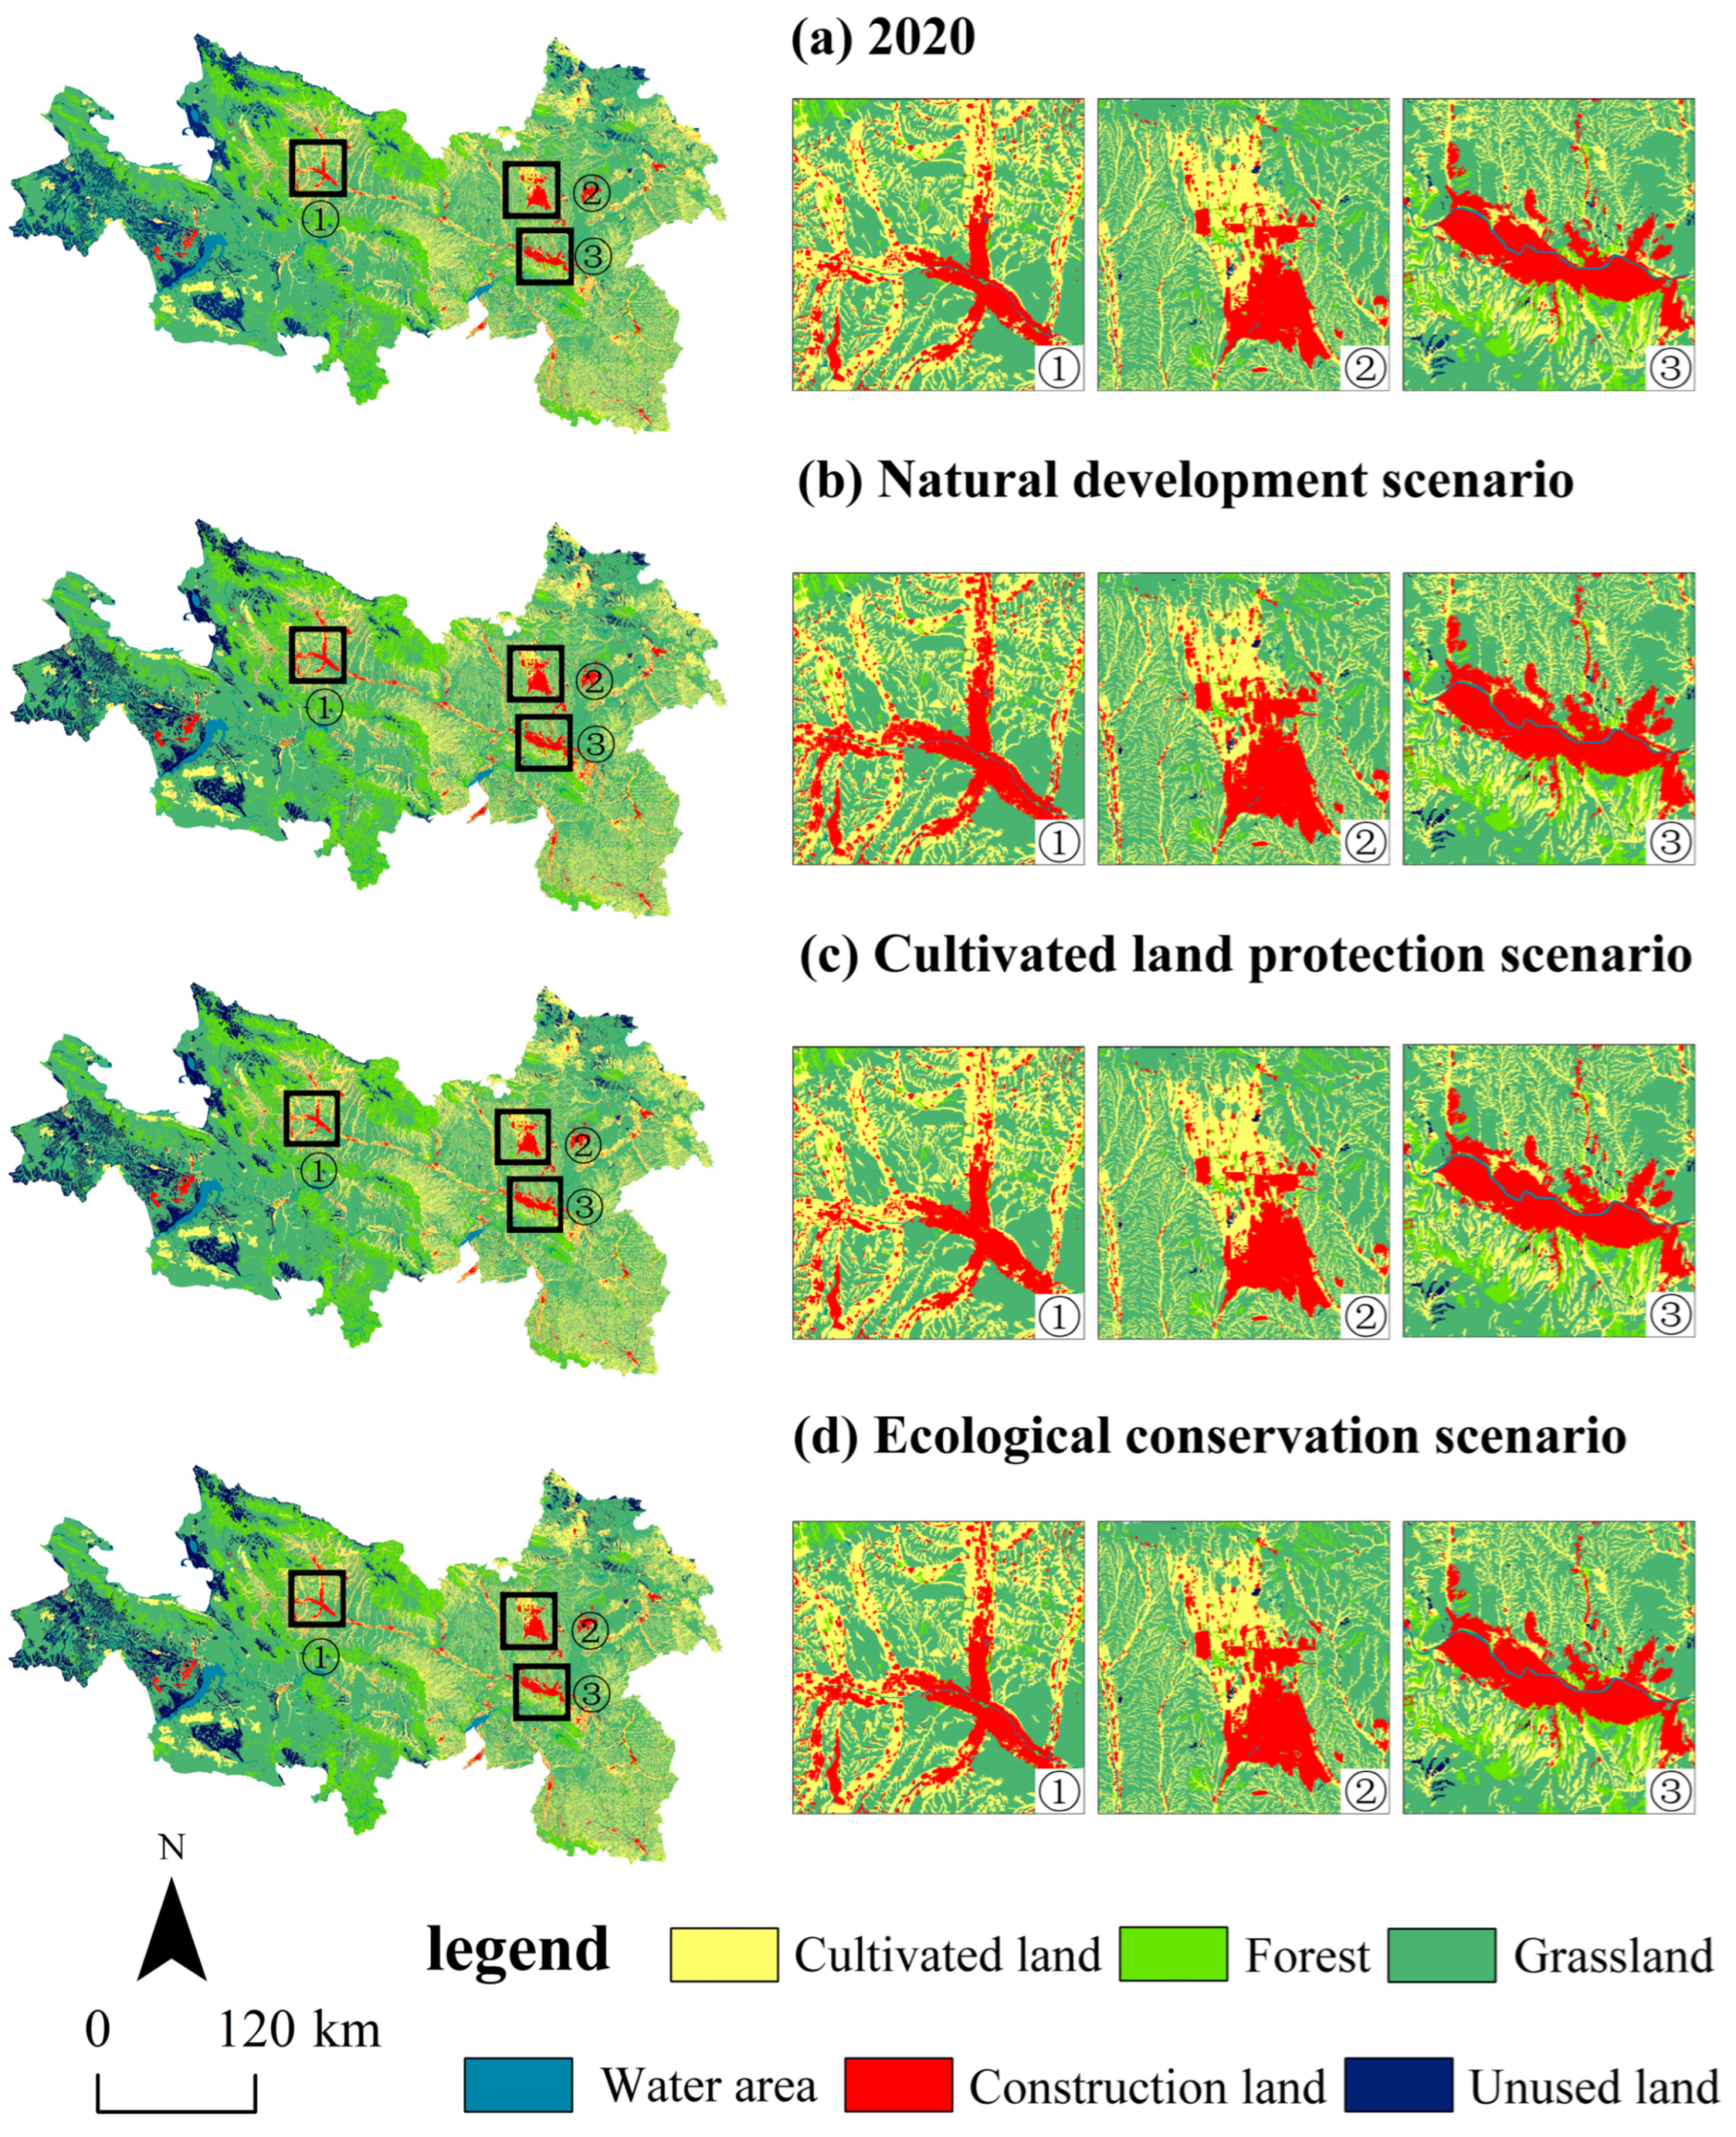
3.3.1. Evolutionary Trends of LUC

Based on the historical trajectory of LUC in LXUA between 2000 and 2010, the temporal and spatial patterns of land use in 2020 were simulated, and the simulated data are compared with the actual situation to verify the accuracy and reliability of the PLUS model. The results show that the Kappa coefficient of the PLUS model for the land use prediction results is 0.94, and the overall accuracy is 96%, indicating that the PLUS model has a high simulation accuracy for land use. The trends of LUCs under the NDS, CLPS, and ECS of the LXUA in 2030 were obtained by PLUS model simulation (Figure 6). Compared with 2020, the trends of LUC under each scenario are as follows:
Under the NDS, land use is dominated by the transfer of CL and GL to CSL, showing a significant increase in the red area on the map. The area of CL and GL decreased by 222.13 km2 and 335.50 km2, respectively, while the area of CSL increased by 646.62 km2, with a growth rate of 27.67%, which is mainly congregated in the main city districts of Lanzhou, Xining, and the Lanzhou New Area. Under this scenario, the sprawl of CSL is not constrained, and productive space and ecological spaces such as CL and GL are greatly reduced, posing an impediment to regional grain security and ecological safety.
Under the CLPS, land use is dominated by the transfer of GL and WA to CL and CSL, showing a significant increase in the yellow area and a slight increase in the red area on the map. The areas of GL and WA decreased by 335.50 km2 and 130.47 km2, respectively, the area of CL increased significantly by 342.64 km2 with a growth rate of 1.85%, and the area of CSL increased by 218.67 km2 with a growth rate of 9.36%. However, compared with the NDS, the growth rate of CSL decreased by 18.31%, showing that the sprawl of CSL was constrained to a certain degree when the protection of CL was carried out.
Under the ECS, land use is dominated by the transfer of CL to GL, WA, and CSL, showing a significant increase in the green area and a slight increase in the red area on the map. The area of CL decreased by 298.78 km2, and the areas of FL, GL, and WA increased, with the area of WA increasing by 6.77 km2, with a growth rate of 4.75%, which is the largest increase. The area of CSL increased by 270.95 km2, with a growth rate of 11.60%. As LXUA is in a stage of accelerated urbanization, the sprawl of CSL is unavoidable, and the area of CL decreases to different degrees, but the encroachment of CSL on other land types can be controlled, and ecological land such as FL, GL, and WA can be guaranteed.

3.3.2. Evolutionary Trends of ESV

According to the simulation land use pattern of the LXUA in 2030, ESVs were assessed under the NDS, the CLPS, and the ECS (Table 8). Spatial visualizations of ESVs were carried out based on the natural breakpoint method of ArcGIS 10.8, which classified ESVs into five levels of high, medium-high, medium, medium-low, and low (Figure 7). Under the three scenarios, ESVs were 2183.89 × 108 yuan, 2148.46 × 108 yuan, and 2211.06 × 108 yuan, respectively. Only the ESV under the ECS increased compared with that of 2020. The ESVs of the other two scenarios declined, and the ESV under the CLPS had the greatest loss. Relative to 2020, the changes in ESV of each type of land under the three scenarios in 2030 are as follows:
Under the NDS, the sprawl of CSL was unrestrained, occupying a great deal of ecological land, and the ESV of GL declined by 0.57%, decreasing by 6.56 × 10⁸ yuan, accounting for 86.55% of the total loss. CL, FL, and UL all lost ESV, with a total ESV loss of 7.58 × 10⁸ yuan.
Under the CLPS, the ESV of CL increased by 3.26 × 10⁸ yuan, due to the restriction of the transfer of CL to other land uses. In contrast, the ESV of WA decreased significantly, with a loss of 38.80 × 10⁸ yuan. In addition, the ESV of other types of land use also decreased to different degrees. As a result, the total ESVs under the CLPS decreased by 1.96%, with a loss of 43.02 × 10⁸ yuan. The total ESVs in this scenario are the lowest among the three scenarios.
Under the ECS, the ESV increases by 0.89%, which is the only scenario among the three scenarios in which the ESV increases. The ESV of CL loses 2.84 × 10⁸ yuan, but the ESV of ecological land such as FL, GL, and WA all increases, with the ESV of WA contributing the most, at 21.88 × 10⁸ yuan, supplementing the loss of the ESV of CL. This ESV is the highest among the three scenarios. Under the ECS, ecological land such as FL, GL, and WA are provided with corresponding protection.
In order to better reveal the composition of ESV in 2030, the value of each individual ES was analyzed by scenario (Table 9).
Under the NDS, supply, adjustment, supporting, and cultural services are all lost in the primary type, with adjustment and supporting services losing 3.81 × 10⁸ yuan and 2.42 × 10⁸ yuan, respectively, totaling 82.15% of the total loss, and provisioning and cultural services losing 0.99 × 10⁸ yuan and 0.37 × 10⁸ yuan, respectively, totaling 17.85%. In the secondary type, there was a loss of all other ESVs, except for WRS and HR, where the increase in ESVs did not exceed 0.03 × 10⁸ yuan. The CR suffered the greatest loss of 2.12 × 10⁸ yuan, followed by the SM, with a loss of 1.43 × 10⁸ yuan, and the GR, with a loss of 1.08 × 10⁸ yuan, while the other ESV suffered a loss of no more than 0.85 × 10⁸ yuan.
Under the CLPS, supply, adjustment, support, and cultural services were all lost in the primary type. The loss of adjustment services was 37.95 × 10⁸ yuan, accounting for 76.31% of the total loss, while the loss of supply, supporting, and cultural services were 2.31 × 10⁸ yuan, 1.86 × 10⁸ yuan, and 0.90 × 10⁸ yuan, respectively, accounting for a total of 23.69% of the total loss. There was a loss of all other ESVs in the secondary type, except for the increase in the ESVs for FP, RMP, and MNC, which did not exceed 0.32 × 10⁸ yuan. The HR suffered the greatest loss of 32.83 × 10⁸ yuan, followed by the WRS, CR, and EP, with losses of 2.66 × 10⁸ yuan, 2.38 × 10⁸ yuan, and 2.31 × 10⁸ yuan in that order.
Under the ECS, all services in the primary type increase to varying degrees, except for support services, which decrease slightly by no more than 1.86 × 10⁸ yuan. Among them, adjustment services increase the most, at 18.67 × 10⁸ yuan, accounting for 95.33% of the total increase, while supply services and cultural services increase by a comparable amount, at 0.76 × 10⁸ yuan and 0.31 × 10⁸ yuan, respectively, with the two accounting for a total of 5.47% of the total increase. The value of the HR, WRS, EP, BD, CR, and AL ESs in the secondary type all increased to different degrees. Among them, the HR had a higher increase of 17.73 × 10⁸ yuan, followed by WRS and EP, with an increase of 1.44 × 10⁸ yuan and 0.91 × 10⁸ yuan, respectively, and the remaining BD, CR, and AL, with a loss of no more than 0.42 × 10⁸ yuan. In contrast, the ESVs of SM, FP, GR, RMP, and MNC decreased slightly. Among them, SM and FP lost more, at 0.50 × 10⁸ yuan and 0.45 × 10⁸ yuan, respectively; followed by GR and RMP, at 0.29 × 10⁸ yuan and 0.23 × 10⁸ yuan, respectively; and the least was MNC, with a loss of 0.07 × 10⁸ yuan. The most remarkable increase in the ESV of HR was 90.53% of the total increase, which supplemented the loss of ESVs such as FP, resulting in an overall increase in ESV.

4. Discussion

4.1. Similarities and Differences Between This Research and Previous Research

4.1.1. Breakthroughs in Research Perspectives

The development pattern and path of LXUA, which is located in underdeveloped areas and fragile ecological environments, are different from those of the urban agglomeration in the eastern developed areas. Therefore, this research tries to analyze spatiotemporal patterns and change trends of the ESVs of urban agglomerations based on land use change, starting from national urban agglomerations in underdeveloped areas, which is a breakthrough in research perspectives.

4.1.2. Exploration of Empirical Research

LXUA is located in the mosaic of the transition from the Qinghai–Tibet Plateau to the Loess Plateau. It is the first national urban agglomeration in the upper reaches of the Yellow River, whose lower elevation, southeast-facing terrain, and mountainous topography channel the warm and humid airflow of the southeast monsoon deep inland in Northwest China. Coupled with this, the distribution of ravines and wide valleys formed by crustal movement and river hydraulics, the distribution of reservoirs, and cities built as a series of beads make the non-zonal distribution of vegetation landscape remarkable, and the ESV of the region is high. At the same time, LXUA is an important growth pole for socioeconomic development in Northwest China, and it plays an important supporting role in promoting the prosperity and stability of Northwest China. It has become a key issue to be solved in order to achieve a win-win ending for the efficient development and utilization of land and ESV of the urban agglomeration in the underdeveloped regions of China. Therefore, taking LXUA as a research case, carrying out multi-scenario simulation research of LUC and ESV is territorial and typical.

4.2. Policy Implications

4.2.1. Controlling Cut Mountains and Creating Land in the Expansion of Central Cities

Among the various types of land in the LXUA, GL not only has the largest amount of land, but also has the greatest change in land use, with CSL mainly coming from CL and GL. The increase in CSL will inevitably lead to a decline in the ESV. In the early stage of accelerated urbanization, CSL mainly comes from CL around the city. In the late stage of slowing urbanization, CSL mainly comes from GL in the suburbs of the city. The land cuts in urban expansion are mainly from hay fields and sparse desert GL, so the land cuts in central city expansion can be moderately controlled to mitigate the decline in the ESV.

4.2.2. Promoting the Return of CL to GL and Ecological Restoration in Peripheral Villages

GL in the LXUA mainly comes from CL and UL. GL taken from CL relies mainly on returning CL to GL, and GL taken from UL relies mainly on ecological restoration and national land greening. It actively promotes the return of CL to GL, ecological restoration, and national land greening in peripheral villages, promoting the rise of the ESV.

4.2.3. Valuing GL as a Major Player in the ESV

The LXUA has a large number and area of GLs, which occupy a dominant position in the contribution to the ESV. It is necessary to establish a basic GL protection system, to strengthen the protection and management of GL resources, to strengthen research on the ESV of GL, and to ensure the sustainable use of GL ecosystems.

4.2.4. Harnessing the Speeding-Up Function of WA in the ESV

WAs in the LXUA are the fastest growing in ESV, thanks to the distribution of ravines and wide valleys formed by crustal movement and river hydraulics, as well as the bead layout of reservoirs and cities built by human activities, which have a variety of ESVs such as WRS, GR, CR, EP, HR, BD, and AL. The use and protection of WA should be rationally planned to avoid over-exploitation and destruction. Damaged WA should be restored through ecological restoration projects. Long-term monitoring and assessment mechanisms should be established to identify and solve the problems faced by WA promptly, and public participation in the protection and management of WA should be encouraged.

4.3. Limitation

4.3.1. Driving Mechanism of ESV

In this research, the evolution of ESV in space and time under different scenarios is explored from the perspective of future multi-scenario modeling. It can be inferred that the evolution of ESVs in space and time gradually becomes more complex as the intensity of human activities increases. Limited to the length of the main text, this research only explores the evolution process of ESV and does not further explore its complex driving mechanism. However, certainly, the complexity of the driving mechanism behind it is closely related to the interactions of regional socio-ecological systems, which inevitably involve many natural, economic, social, and human factors, such as climate, GDP, population density, technological progress, level of non-farming, and level of urbanization. Therefore, the driving mechanisms of ESV formation and evolution should be further explored in the future to provide more scientific and effective theoretical references for regional development management.

4.3.2. Carbon Fixation and Storage

Carbon fixation and storage are important components of ecosystem services, and changes in land use types have a significant impact on carbon fixation and storage capacity. For example, the conversion of UL to CL and GL contributes to an increase in carbon storage, while the conversion of GL to CL may lead to a decrease in carbon storage. Due to inadequate research depth, the ESVs for carbon fixation and storage were not considered in this research for the time being.

4.3.3. ESV of Wetland

Wetlands along the Yellow River and around reservoirs contribute significantly to the ESV, mainly in terms of CR, HR, WRS, CR, BD, and AL of wetlands. Due to the macro scale of this research, wetlands are too small compared with other land areas, and wetland is not measured separately as a land type but are considered as part of WA.

4.3.4. Negative Impacts of Construction Land on the ESV

Generally speaking, among the ESVs generated by various types of land, the ESV of CSL is the smallest, and the ESV of CSL is regarded as zero in this research. The increase of CSL often encroaches on ecological and agricultural land, resulting in the decline of ESVs such as habitat quality and carbon sinks. The expansion of CSL has a significant negative impact on the ESV, especially in the function of regulating services and supporting services. Due to the limited research data, the negative impact of CSL on the ESV was not considered in this research for the time being.

4.4. Future Research

4.4.1. U-Curve Theory of Regional Development Levels and the ESV

Through the theory of the inverted U-shaped Kuznets curve between per capita income and environmental pollution, it is possible to construct the theory of the U-shaped curve of economic and social development and ecological environmental protection. Via the theory of the U-shaped curve of economic and social development and ecological environmental protection, it is possible to directly derive the theory of the U-shaped curve of the level of regional development and the value of ecosystem services. Firstly, the environmental Kuznets curve argues that the relationship between per capita income and environmental pollution is that pollution rises with the increase of per capita GDP at the low-income level, and pollution falls with the increase of per capita GDP at the high-income level. Secondly, the U-curve theory of economic and social development and ecological environment protection suggests that when a region’s ecological environment is in good condition, the ESV increases accordingly. Conversely, when a region’s ecological environment deteriorates, the ESV of its decreases accordingly. Thirdly, when a region’s development level is underdeveloped, the ESV decreases as the intensity of regional development increases. When the level of economic development reaches a certain threshold or inflection point, the ESV rises as the intensity of regional development increases, with the ESV displaying a downward and then upward evolutionary trajectory.

4.4.2. The Extent to Which the Level of Regional Development Affects the ESV

It is crucial to analyze the extent to which the level of regional development affects the ESV. The influence of regional development on the ESV may involve several factors, so we refer to the internationally accepted method of selecting indicators for the human development index to construct a system of evaluation indicators that is more descriptive, with fewer indicators, simple, easy to use, and efficient, constructing the regional development index from the three dimensions of income, health care, and education, and introducing population weights as the adjusting coefficients. Here, the regional development index is regarded as an explanatory variable, the ESV is regarded as an explanatory variable, and other economic and social influences in addition to the regional development index are regarded as control variables to explore the extent to which the level of regional development affects the ESV.

4.4.3. Spatial Effects of Regional Development Levels on the ESV

The spatial effects of regional development levels on the ESV are mainly reflected in three aspects: spatial differences, spatial correlations, and the evolution of spatial patterns. Firstly, there are differences in the development conditions of different regions, resulting in obvious spatial differences in the ESV. Secondly, the ESV between regions does not exist in isolation, but has certain spatial correlations, and the ESV in a region may be affected by the development status of neighboring regions. Thirdly, the spatial pattern of ESV will evolve accordingly as the level of regional development changes.

5. Conclusions

According to the changes in land use and ESV of LXUA in 2000–2020, this research uses the PLUS model to simulate the changes in land use dynamics and the implications of the changes of ESV under three scenarios of NDS, CLPS, and ECS in 2030. The conclusions of the research are as follows:
(1)
The land use type of the LXUA from 2000 to 2020 was dominated by GL, accounting for more than 60% of the gross area. The shift of CL and GL was the most significant, but the shift of GL to CL was greater. As urbanization continues to accelerate, the sprawl of CSL encroaches on both GL and CL.
(2)
The ESV of the LXUA between 2000 and 2020 increased year by year, with a cumulative increase of 57.04 × 10⁸ yuan and a growth rate of 2.67%, mainly due to the faster increase in the area of WA, which made the ESVs of WA continue to rise and had the largest increment, with a cumulative increase of 50.97 × 10⁸ yuan and a growth rate of 12.45%. In 2000–2020, GL contributed the most to the ESVs, accounting for 53.44% to 52.56%, and HJ and CR contributed the most to the ESV of individuals, with a combined share of 50.86% to 51.69%.
(3)
Through the scenario simulation of the spatial and temporal pattern of land use in the LXUA in 2030, under the NDS, the area of CSL increases by 646.62 km2, with a growth rate of 27.67%, occupying a lot of GL and CL, and the sprawl of urban areads is not constrained. Under the CLPS, the area of CL increases significantly by 342.64 km2, with a growth rate of 1.85%. The area of CSL increases by 218.67 km2, with a growth rate of 9.36% compared with the NDS. The sprawl of CSL was constrained in some measure. Under the ECS, the area of CSL increases by 270.95 km2, with a growth rate of 11.60%. The increase in CSL was mainly in the way of the transfer of CL, the encroachment on ecological land was controlled, and there was an increase in the areas of FL, GL, and WA.
(4)
The ESVs of the LXUA under the NDS, the CLPS, and the ECS are 2183.89 × 108 yuan, 2148.46 × 108 yuan, and 2211.06 × 108 yuan in 2030, respectively. Compared with 2020, the ESV decreases under the ND and CLPS, at 7.58 × 10⁸ yuan and 43.02 × 10⁸ yuan, respectively. Under the NDS, the ESV of GL decreased by 6.54 × 10⁸ yuan, accounting for 86.55% of the gross loss. Under the CLPS, the ESV of CL increased, but the ESV of WA decreased dramatically, resulting in a 1.96% decrease in the ESV, the lowest among the three scenarios. Under the ECS, ecological land was protected accordingly, increasing the ESV of FL, GL, and WA, with the ESV increasing by 0.89%, the highest among the three scenarios.

Author Contributions

Conceptualization, J.B. and Z.J.; Data curation, J.B., Y.S. and M.W.; Funding acquisition, Z.J.; Investigation, Y.S.; Methodology, Z.J.; Software, J.B.; Supervision, Z.J.; Visualization, J.B. and C.Z.; Writing—original draft, J.B.; Writing—review and editing, Z.J., Y.S., C.Z. and M.W. All authors have read and agreed to the published version of the manuscript.

Funding

This research was funded by the National Natural Science Foundation (Grant No. 41601606), the Humanities and Social Sciences Foundation of the Ministry of Education (Grant No. 22YJC790048), the Gansu Basic Research Program-Soft Science Project (Grant No. 22JR4ZA044), the Fundamental Research Funds for the Central Universities (Grant No. lzujbky-2023-46).

Data Availability Statement

Publicly available datasets were analyzed in this research. The data are from https://www.resdc.cn, https://www.earthdata.nasa.gov, https://www.webmap.cn, Gansu Development Yearbook, and Qinghai Statistical Yearbook. The original contributions presented in the study are included in the article, and further inquiries can be directed to the corresponding author.

Conflicts of Interest

The authors declare no conflicts of interest.

Abbreviations

The following abbreviations are used in this manuscript:
LUCLand use change
ESEcosystem services
ESVEcosystem service value
ESVsEcosystem service values
LXUALanzhou–Xining Urban Agglomeration
NDSNatural development scenario
CLPSCultivated land protection scenario
ECSEcological conservation scenario
CSLConstruction land
CLCultivated land
FLForestland
GLGrassland
WAWater area
ULUnused land
FPFood production
RMPRaw material production
WRSWater resources supply
GRGas regulation
CRClimate regulation
EPEnvironment purification
HRHydrological regulation
SMSoil maintenance
MNCMaintaining nutrient circulation
BDBiological diversity
ALAesthetic landscape

References

  1. Hasan, S.S.; Zhen, L.; Miah, M.G.; Ahamed, T.; Samie, A. Impact of land use change on ecosystem services: A review. Environ. Dev. 2020, 34, 100527. [Google Scholar] [CrossRef]
  2. Wu, K.; Wang, D.; Lu, H.; Liu, G. Temporal and spatial heterogeneity of land use, urbanization, and ecosystem service value in China: A national-scale analysis. J. Clean. Prod. 2023, 418, 137911. [Google Scholar] [CrossRef]
  3. Costanza, R.; de Groot, R.; Braat, L.; Kubiszewski, I.; Fioramonti, L.; Sutton, P.; Farber, S.; Grasso, M. Twenty years of ecosystem services: How far have we come and how far do we still need to go? Ecosyst. Serv. 2017, 28, 1–16. [Google Scholar] [CrossRef]
  4. Duan, X.; Chen, Y.; Wang, L.; Zheng, G.; Liang, T. The impact of land use and land cover changes on the landscape pattern and ecosystem service value in Sanjiangyuan region of the Qinghai-Tibet Plateau. J. Environ. Manag. 2023, 325, 116539. [Google Scholar] [CrossRef]
  5. Gao, P.; Li, Y.; Gong, J.; Huang, G. Urban land-use planning under multi-uncertainty and multiobjective considering ecosystem service value and economic benefit—A case study of Guangzhou, China. Ecol. Complex. 2021, 45, 100886. [Google Scholar] [CrossRef]
  6. Li, S. Reflections on Ecosystem Service Research. Landsc. Arch. Front. 2019, 7, 82–87. [Google Scholar] [CrossRef]
  7. Liu, Z.; Wang, S.; Fang, C. Spatiotemporal evolution and influencing mechanism of ecosystem service value in the Guangdong-Hong Kong-Macao Greater Bay Area. J. Geogr. Sci. 2023, 33, 1226–1244. [Google Scholar] [CrossRef]
  8. Costanza, R.; d’Arge, R.; de Groot, R.; Farber, S.; Grasso, M.; Hannon, B.; Limburg, K.; Naeem, S.; O’Neill, R.V.; Paruelo, J.; et al. The value of the world’s ecosystem services and natural capital. Nature 1997, 387, 253–260. [Google Scholar] [CrossRef]
  9. Xie, G.; Zhang, C.; Zhen, L.; Zhang, L. Dynamic changes in the value of China’s ecosystem services. Ecosyst. Serv. 2017, 26, 146–154. [Google Scholar] [CrossRef]
  10. Wang, M.; Sun, X. Potential impact of land use change on ecosystem services in China. Environ. Monit. Assess. 2016, 188, 248. [Google Scholar] [CrossRef]
  11. Liu, F.; Yang, L.; Wang, S. Spatial and Temporal Evolution and Correlation Analysis of Landscape Ecological Risks and Ecosystem Service Values in the Jinsha River Basin. J. Resour. Ecol. 2023, 14, 914–927. [Google Scholar] [CrossRef]
  12. Li, R.; Xu, Q.; Yu, J.; Chen, L.; Peng, Y. Multiscale assessment of the spatiotemporal coupling relationship between urbanization and ecosystem service value along an urban–rural gradient: A case study of the Yangtze River Delta urban agglomeration, China. Ecol. Indic. 2024, 160, 111864. [Google Scholar] [CrossRef]
  13. Liu, J.; Pei, X.; Liao, B.; Zhang, H.; Liu, W.; Jiao, J. Scale effects and spatial heterogeneity of driving factors in ecosystem services value interactions within the Tibet autonomous region. J. Environ. Manag. 2024, 351, 119871. [Google Scholar] [CrossRef]
  14. Long, H.; Liu, Y.; Hou, X.; Li, T.; Li, Y. Effects of land use transitions due to rapid urbanization on ecosystem services: Implications for urban planning in the new developing area of China. Habitat Int. 2014, 44, 536–544. [Google Scholar] [CrossRef]
  15. Shifaw, E.; Sha, J.; Li, X.; Bao, Z.; Zhou, Z. An insight into land-cover changes and their impacts on ecosystem services before and after the implementation of a comprehensive experimental zone plan in Pingtan island, China. Land Use Policy 2019, 82, 631–642. [Google Scholar] [CrossRef]
  16. Song, W.; Deng, X.; Yuan, Y.; Wang, Z.; Li, Z. Impacts of land-use change on valued ecosystem service in rapidly urbanized North China Plain. Ecol. Model. 2015, 318, 245–253. [Google Scholar] [CrossRef]
  17. Rahaman, Z.A.; Kafy, A.A.; Faisal, A.-A.; Al Rakib, A.; Jahir, D.M.A.; Fattah, M.A.; Kalaivani, S.; Rathi, R.; Mallik, S.; Rahman, M.T. Predicting Microscale Land Use/Land Cover Changes Using Cellular Automata Algorithm on the Northwest Coast of Peninsular Malaysia. Earth Syst. Environ. 2022, 6, 817–835. [Google Scholar] [CrossRef]
  18. Verburg, P.H.; Soepboer, W.; Veldkamp, A.; Limpiada, R.; Espaldon, V.; Mastura, S.S.A. Modeling the Spatial Dynamics of Regional Land Use: The CLUE-S Model. Environ. Manag. 2014, 30, 391–405. [Google Scholar] [CrossRef]
  19. Zhou, Y.; Varquez, A.C.G.; Kanda, M. High-resolution global urban growth projection based on multiple applications of the SLEUTH urban growth model. Sci. Data 2019, 6, 34. [Google Scholar] [CrossRef]
  20. Liu, X.; Liang, X.; Li, X.; Xu, X.; Ou, J.; Chen, Y.; Li, S.; Wang, S.; Pei, F. A future land use simulation model (FLUS) for simulating multiple land use scenarios by coupling human and natural effects. Landsc. Urban Plan. 2017, 168, 94–116. [Google Scholar] [CrossRef]
  21. Gao, L.; Tao, F.; Liu, R.; Wang, Z.; Leng, H.; Zhou, T. Multi-scenario simulation and ecological risk analysis of land use based on the PLUS model: A case study of Nanjing. Sustain. Cities Soc. 2022, 85, 104055. [Google Scholar] [CrossRef]
  22. Saadani, S.; Laajaj, R.; Maanan, M.; Rhinane, H.; Aaroud, A. Simulating spatial-temporal urban growth of a Moroccan metropolitan using CA–Markov model. Spat. Inf. Res. 2020, 28, 609–621. [Google Scholar] [CrossRef]
  23. Liang, X.; Guan, Q.; Clarke, K.C.; Liu, S.; Wang, B.; Yao, Y. Understanding the drivers of sustainable land expansion using a patch-generating land use simulation (PLUS) model: A case study in Wuhan, China. Comput. Environ. Urban Syst. 2021, 85, 101569. [Google Scholar] [CrossRef]
  24. Fang, C. Spatial Organization Pattern and High-Quality Development of Urban Agglomeration in the Yellow River Basin. Econ. Geogr. 2020, 40, 1–8. (In Chinese) [Google Scholar]
  25. Guo, R.; Wu, T.; Wu, X.; Luigi, S.; Wang, Y. Simulation of Urban Land Expansion Under Ecological Constraints in Harbin-Changchun Urban Agglomeration, China. Chin. Geogr. Sci. 2022, 32, 438–455. [Google Scholar] [CrossRef]
  26. Wang, Q.; Guan, Q.; Sun, Y.; Du, Q.; Xiao, X.; Luo, H.; Zhang, J.; Mi, J. Simulation of future land use/cover change (LUCC) in typical watersheds of arid regions under multiple scenarios. J. Environ. Manag. 2023, 335, 117543. [Google Scholar] [CrossRef]
  27. Ding, T.; Chen, J.; Fang, Z.; Wang, Y. Exploring the differences of ecosystem service values in different functional areas of metropolitan areas. Sustain. Prod. Consum. 2023, 38, 341–355. [Google Scholar] [CrossRef]
  28. Xie, G.; Zhen, L.; Lu, C.; Xiao, Y.; Chen, C. Expert Knowledge Based Valuation Method of Ecosystem Services in China. J. Nat. Resour. 2008, 23, 911–919. (In Chinese) [Google Scholar]
  29. Xie, G.; Zhang, C.; Zhang, C.; Xiao, Y.; Lu, C. The value of ecosystem services in China. Resour. Sci. 2015, 37, 1740–1746. (In Chinese) [Google Scholar]
  30. Lv, Y.; Xiu, L.; Yao, X.; Yu, Z.; Huang, X. Spatiotemporal Evolution and Driving Factors Analysis of the Eco-Quality in the Lanxi Urban Agglomeration. Ecol. Indic. 2023, 156, 111114. [Google Scholar] [CrossRef]
  31. Tong, H.; Shi, P. Using Ecosystem Service Supply and Ecosystem Sensitivity to Identify Landscape Ecology Security Patterns in the Lanzhou-Xining Urban Agglomeration, China. J. Mt. Sci. 2020, 17, 2758–2773. [Google Scholar] [CrossRef]
  32. Xu, N.; Guo, L.; Xue, D.; Sun, S. Land use structure and the dynamic evolution of ecosystem service value in Gannan region, China. Acta Ecol. Sin. 2019, 39, 1969–1978. (In Chinese) [Google Scholar]
  33. Jiang, W.; Lü, Y.; Liu, Y.; Gao, W. Ecosystem service value of the Qinghai-Tibet Plateau significantly increased during 25 years. Ecosyst. Serv. 2020, 44, 101146. [Google Scholar] [CrossRef]
  34. Lei, J.; Chen, Z.; Chen, X.; Li, Y.; Wu, T. Spatio-temporal changes of land use and ecosystem services value in Hainan Island from 1980 to 2018. Acta Ecol. Sin. 2020, 40, 4760–4773. (In Chinese) [Google Scholar]
  35. Wang, M.; Jiang, Z.; Li, T.; Yang, Y.; Jia, Z. Analysis on absolute conflict and relative conflict of land use in Xining metropolitan area under different scenarios in 2030 by PLUS and PFCI. Cities 2023, 137, 104314. [Google Scholar] [CrossRef]
  36. Jiang, Y.; Du, G.; Teng, H.; Wang, J.; Li, H. Multi-Scenario Land Use Change Simulation and Spatial Response of Ecosystem Service Value in Black Soil Region of Northeast China. Land 2023, 12, 962. [Google Scholar] [CrossRef]
  37. Wang, B.; Liao, J.; Zhu, W.; Qiu, Q.; Wang, L.; Tang, L. The weight of neighborhood setting of the FLUS model based on a historical scenario: A case study of land use simulation of urban agglomeration of the Golden Triangle of Southern Fujian in 2030. Acta Ecol. Sin. 2019, 39, 4284–4298. (In Chinese) [Google Scholar]
  38. Zheng, L.; Wang, Y.; Li, J. How to achieve the ecological sustainability goal of UNESCO Global Geoparks? A multi-scenario simulation and ecological assessment approach using Dabieshan UGGp, China as a case study. J. Clean. Prod. 2021, 329, 129779. [Google Scholar] [CrossRef]
  39. Lou, Y.; Yang, D.; Zhang, P.; Zhang, Y.; Song, M.; Huang, Y.; Jing, W. Multi-Scenario Simulation of Land Use Changes with Ecosystem Service Value in the Yellow River Basin. Land 2022, 11, 992. [Google Scholar] [CrossRef]
  40. Chen, C.; Liu, Y. Spatiotemporal changes of ecosystem services value by incorporating planning policies: A case of the Pearl River Delta, China. Ecol. Model. 2021, 461, 109777. [Google Scholar] [CrossRef]
  41. Chen, W.; Wang, G.; Gu, T.; Fang, C.; Pan, S.; Zeng, J.; Wu, J. Simulating the impact of urban expansion on ecosystem services in Chinese urban agglomerations: A multi-scenario perspective. Environ. Impact Assess. Rev. 2023, 103, 107275. [Google Scholar] [CrossRef]
  42. Chen, X.; He, L.; Luo, F.; He, Z.; Bai, W.; Xiao, Y.; Wang, Z. Dynamic characteristics and impacts of ecosystem service values under land use change: A case study on the Zoigê plateau, China. Ecol. Inform. 2023, 78, 102350. [Google Scholar] [CrossRef]
Figure 1. Map of the study area. Note: This map is based on standard maps from the Standard Map Service website of the Map Technical Review Center of the Ministry of Natural Resources of China, with no modifications to the base map boundaries. Review map number: GS (2019)1822.
Land 14 00860 g001
Figure 2. Driving factors. (A) DEM, (B) Slope, (C) Temperature, (D) Precipitation, (E) Distance from rivers, (F) Distance from highways, (G) Distance from national and provincial trunk roads, (H) Distance from railways, (I) Distance from government, (J) GDP, and (K) Population.
Land 14 00860 g002
Figure 3. Land use in the LXUA from 2000 to 2020. (a) Spatial distribution of land use. (b) Proportion of land use type area.
Land 14 00860 g003
Figure 4. Dynamic monitoring of land use in the LXUA from 2000 to 2020.
Land 14 00860 g004
Figure 5. The features of the spatial distribution of ESV in LXUA in 2000, 2005, 2010, 2015, and 2020.
Land 14 00860 g005
Figure 6. Results of land use in 2020 and multi-scenario simulations in 2030. (a) Land use in 2020, (b) Land use under the NDS, (c) Land use under the CLPS, and (d) Land use under the ECS. Note: ①, ②, and ③ represent Xining City, the Lanzhou New Area, and Lanzhou City, respectively.
Land 14 00860 g006
Figure 7. Spatial distribution of ESV in 2030 under three scenarios. (a) ESV under the NDS, (b) ESV under the CLPS, and (c) ESV under the ECS.
Land 14 00860 g007
Table 1. Data list.
Table 1. Data list.
CategoryDataSpatial ResolutionTimeData Sources
Natural condition datasetLand use30 m2000–2020https://www.resdc.cn
(accessed on 10 April 2025)
DEM2020https://www.earthdata.nasa.gov
(accessed on 10 April 2025)
SlopeObtained by DEM
RiversVector data2021https://www.webmap.cn
(accessed on 10 April 2025)
Temperature1 km2020https://www.resdc.cn
(accessed on 10 April 2025)
Precipitation
social and economic datasetGDP2019
Population
RailroadsVector data2021https://www.webmap.cn
(accessed on 10 April 2025)
Highway
Primary roads
Secondary roads
Tertiary roads
Seat of county government
Constrained datasetEcological conservation area2018https://www.resdc.cn
(accessed on 10 April 2025)
Table 2. The equivalent of ESV per unit area in the LXUA (yuan/hm2).
Primary TypeSecondary TypeCLFLGLWAUL
Supply servicesFP2015.57553.29379.401897.0111.86
RMP948.501272.58557.25545.3935.57
WRS47.43656.05308.2619,657.7523.71
Adjustment servicesGR1588.744173.421956.291825.87154.13
CR853.6512,488.645169.355430.19118.56
EP237.133714.971707.3113,160.49486.11
HR640.249034.503782.16242,817.02284.55
Support servicesSM2442.405082.402383.122205.27177.84
MNC284.55387.31189.70165.9911.86
BD308.264631.862169.706046.71165.99
Cultural servicesAL142.282031.38960.364481.6871.14
Total9508.7544,026.3919,562.90298,233.371541.32
Note: ESV is divided into four aspects: supply services, adjustment services, support services, and cultural services, where supply services are subdivided into food production (FP), raw material production (RMP), and water resources supply (WRS); adjustment services is subdivided into gas regulation (GR), climate regulation (CR), environment purification (EP), and hydrological regulation (HR); support services is subdivided into soil maintenance (SM), maintaining nutrient circulation (MNC), and biological diversity (BD); cultural services is subdivided into aesthetic landscape (AL). The same is below. CL: Cultivated land; FL: Forestland; GL: Grassland; WA: Water area; UL: Unused land. The same is below.
Table 3. Weight of each variety.
Land Use TypeCLFLGLWACSLUL
T A −5066.55 −272.25 −456.93 227.52 5563.35 4.86
Neighborhood weight0.00 0.45 0.43 0.50 1.00 0.48
Table 4. The cost matrix for each scenario.
2020–2030NDS CLPS ECS
abcdef abcdef abcdef
a111111 100000 111111
b111111 111011 010000
c111111 111111 011100
d111111 110111 000100
e000010 000010 000010
f111111 111111 111111
Note: a, b, c, d, e, and f denote different land types including CL, FL, GL, WA, CSL, and UL, respectively. The same is below.
Table 5. Land use transition matrix from 2000 to 2020 (km2).
2020
CLFLGLWACSLUL
2000CL17,489.1883.33728.9557.61634.1672.44
FL26.778601.04210.135.0537.575.25
GL833.38234.9956,645.1063.07379.43147.97
WA22.702.5117.901306.0816.036.13
CSL108.813.5121.602.821247.450.55
UL32.307.831245.40107.8921.886219.73
Table 6. The quantity of change in the ESVs of each land use type of the LXUA in 2000–2020 (108 yuan).
Land Use TypeCLFLGLWAULTotal
2000ESV181.31391.261140.70409.3911.772134.44
Proportion/%8.49%18.33%53.44%19.18%0.55%100.00%
2005ESV178.80392.341142.43412.9011.812138.28
Proportion/%8.36%18.35%53.43%19.31%0.55%100.00%
2010ESV179.20394.261158.21437.2410.092179.00
Proportion/%8.22%18.09%53.15%20.07%0.46%100.00%
2015ESV177.71394.101156.88440.7910.152179.63
Proportion/%8.15%18.08%53.08%20.22%0.47%100.00%
2020ESV176.05393.341151.76460.379.952191.47
Proportion/%8.03%17.95%52.56%21.01%0.45%100.00%
ESV changes from 2000 to 2020−5.262.0911.0650.97−1.8257.04
ESV rate of change from 2000 to 2020−2.90%0.53%0.97%12.45%−15.50%2.67%
Table 7. The individual ESV of LXUA from 2000 to 2020 (108 yuan).
Ecosystem Service Functions20002005201020152020
Supply servicesFP68.1767.7068.2667.9467.60
Proportion/%3.19%3.17%3.13%3.12%3.08%
RMP62.9162.7563.3063.1162.81
Proportion/%2.95%2.93%2.90%2.90%2.87%
WRS51.8852.1453.9954.2055.39
Proportion/%2.43%2.44%2.48%2.49%2.53%
Adjustment servicesGR185.14185.02186.82186.45185.69
Proportion/%8.67%8.65%8.57%8.55%8.47%
CR437.04437.65442.71442.25440.87
Proportion/%20.48%20.47%20.32%20.29%20.12%
EP158.87159.21161.29161.30161.55
Proportion/%7.44%7.45%7.40%7.40%7.37%
HR648.53651.78674.75677.26691.90
Proportion/%30.38%30.48%30.97%31.07%31.57%
Support servicesSM235.08234.80237.03236.50235.49
Proportion/%11.01%10.98%10.88%10.85%10.75%
MNC20.2520.2020.3820.3320.23
Proportion/%0.95%0.94%0.94%0.93%0.92%
BD183.12183.42185.70185.56185.24
Proportion/%8.58%8.58%8.52%8.51%8.45%
Cultural servicesAL83.4683.6184.7784.7384.70
Proportion/%3.91%3.91%3.89%3.89%3.87%
Table 8. Multi-scenario simulations of ESV of various land uses in the LXUA (108 yuan).
ESV and ProportionCLFLGLWAULTotal
2020ESV176.05393.341151.76460.379.952191.47
Proportion/%8.03%17.95%52.56%21.01%0.45%100.00%
NDS
scenario
ESV173.94392.571145.20462.379.812183.89
Proportion/%7.96%17.98%52.44%21.17%0.45%100.00%
CLPS
scenario
ESV179.31392.571145.20421.569.812148.46
Proportion/%8.35%18.27%53.30%19.62%0.46%100.00%
ECS
scenario
ESV173.21393.431152.36482.259.812211.06
Proportion/%7.83%17.79%52.12%21.81%0.44%100.00%
Table 9. Multi-scenario simulations of the individual ESV in the LXUA (108 yuan).
Ecosystem Service FunctionsNDSCLPSECS
The Primary TypeThe Secondary Type
Supply
services
FP67.0367.9167.15
Volume of growth −0.570.31−0.45
Growth rate (%)−0.850.45−0.67
RMP62.3962.8562.58
Volume of growth−0.420.04−0.23
Growth rate (%)−0.670.07−0.36
WRS55.3952.7356.82
Volume of growth0.00−2.661.44
Growth rate (%)0.01−4.802.59
account184.81183.49186.56
Volume of growth−0.99−2.310.76
Growth rate (%)−0.53−1.240.41
Adjustment servicesGR184.61185.25185.40
Volume of growth−1.08−0.44−0.29
Growth rate (%)−0.58−0.24−0.15
CR438.76438.50441.19
Volume of growth−2.12−2.380.32
Growth rate (%)−0.48−0.540.07
EP160.90159.24162.46
Volume of growth−0.65−2.310.91
Growth rate (%)−0.40−1.430.56
HR691.94659.08709.64
Volume of growth0.03−32.8317.73
Growth rate (%)0.01−4.742.56
account1476.211442.071498.69
Volume of growth−3.81−37.9518.67
Growth rate (%)−0.26−2.561.26
Support servicesSM234.05235.13234.98
Volume of growth−1.43−0.35−0.50
Growth rate (%)−0.61−0.15−0.21
MNC20.1020.2320.16
Volume of growth−0.130.00−0.07
Growth rate (%)−0.660.02−0.33
BD184.38183.73185.65
Volume of growth−0.85−1.510.41
Growth rate (%)−0.46−0.810.22
account438.53439.10440.80
Volume of growth−2.421−1.86−0.16
Growth rate (%)−0.55−0.42−0.04
Cultural servicesAL84.3483.8085.01
Volume of growth−0.37−0.900.31
Growth rate (%)−0.43−1.060.37
Total2183.892148.462211.06
Volume of growth−7.58−43.0219.59
Growth rate (%)−0.35−1.960.89
Disclaimer/Publisher’s Note: The statements, opinions and data contained in all publications are solely those of the individual author(s) and contributor(s) and not of MDPI and/or the editor(s). MDPI and/or the editor(s) disclaim responsibility for any injury to people or property resulting from any ideas, methods, instructions or products referred to in the content.

