Article

A Method for Delineating Urban Development Boundaries Based on the Urban–Rural Integration Perspective

1
School of Spatial Planning and Design, Hangzhou City University, Hangzhou 310015, China
2
School of Engineering and Design, Department Aerospace and Geodesy, Technical University of Munich, 80333 Munich, Germany
3
Zhejiang University Urban-Rural Planning & Design Institute, Hangzhou 310027, China
4
College of Civil Engineering and Architecture, Zhejiang University, Hangzhou 310027, China
5
School of Public Administration, Zhejiang University of Finance & Economics, Hangzhou 310018, China
6
School of Art and Archaeology, Hangzhou City University, Hangzhou 310015, China
*
Author to whom correspondence should be addressed.
Land 2025, 14(4), 859; https://doi.org/10.3390/land14040859
Submission received: 9 March 2025 / Revised: 31 March 2025 / Accepted: 7 April 2025 / Published: 14 April 2025

Abstract

:
Urban development boundaries are efficient tools for coordinating urban–rural relations and ensuring sustainable development. From 2000 to 2020, the expansion rate of the built-up area in cities and towns throughout China reached 177%, far exceeding the urban population growth rate of 96.5% in the same period. As this spatial expansion seems to continue, there is a need to intervene and control urban boundaries. We believe using the urban–rural integration perspective to set (or reset) and maintain urban development boundaries will help manage urban expansion more effectively than present methods. This research, therefore, develops an urban development boundary delineation method from a macroscopic view for China. A new model for defining boundaries was developed based on the four dimensions of urban–rural interaction: economic demand, environmental protection, urban carrying capacity, and urban development resistance. And an empirical study was conducted in Guiyang City as an example. The results show that the resultant urban boundary can provide a more comprehensive and realistic growth model than current methods, making it more applicable for controlling and fostering sustainable urban and rural development.

1. Introduction

Urbanization in China has accelerated at an unprecedented pace, driven by high rates of rural–urban migration and rapid socio-economic transformations in both urban and rural areas. This rapid growth has led to cities expanding beyond their planned boundaries, resulting in imbalanced service provisions and unsustainable land-use patterns. The uncontrolled demand for urban land and energy resources has come at the cost of farmland loss and wetland degradation [1,2,3,4,5]. According to the data from Statistical Communique on National Economic and Social Development, by the end of 2024, China’s urbanization rate reached 67%, with projections indicating that it may rise to 70% by 2025. Remarkably, China achieved this level of urbanization in just 30 years, while this process took Western countries between 100 and 200 years.
To address these challenges, the Chinese Ministry of Land Resources and the Ministry of Housing and Urban Development jointly introduced the concept of urban development boundaries (UDBs) in July 2014. The UDB policy aimed to control the scale of urban development, manage the process more effectively, and prevent disordered urban expansion. However, in practice, the principle of development within fixed boundaries has often been replaced with the principle of development through boundary extension. This shift has effectively transformed UDBs into urban growth boundaries (UGBs), reflecting a paradigmatic and practical transition from actively containing growth to passively permitting it. This approach has exacerbated urban–rural conflicts and undermined the original intent of the policy.
In 2014, the Chinese government selected 14 pilot cities across the eastern, central, and western regions to test the UDB framework. Guiyang, a city in southwest China, emerged as a representative case study, revealing several critical issues during implementation: (1) local governments often default to “pancake-style” development, diluting the UDB’s intended control over urban expansion; (2) the lack of a robust theoretical foundation and methodological guidelines has led to planning processes that are more administrative than scientific, often reflecting the preferences of local leaders, rather than evidence-based strategies; (3) the existing UDB delineation methods tend to focus on single factors, such as construction land demand or ecological space protection, while urban expansion and land-use control are inherently multifaceted and require integrated, poly-rational analysis.
These challenges highlight a significant research gap between urban management theory and practice. Current urban growth management strategies lack a comprehensive theoretical framework to measure and guide policy interventions, as well as a coherent organizational structure to address urban and rural land use simultaneously. Moreover, systematically monitored and controlled urban growth boundary models remain underdeveloped. Against this backdrop, several critical questions arise: How can a theoretical framework and methodology be developed based on China’s urbanization experience? How can the tension between ecological resource protection and urban space development be better coordinated? How can a more rational and sustainable model for urban development boundary delineation be established? These questions are central to advancing urban ecological civilization and achieving sustainable urban–rural development.
This study focuses on Guiyang as a case study, examining the challenges of urban expansion and boundary management in the region. It proposes a multidimensional integrated boundary demarcation model that addresses the coupling of land use, ecological resource protection, and urban development at both the macro and micro levels. The model seeks to harmonize existing planning frameworks and integrate them into a cohesive strategy. To ensure practical relevance, the study draws on government policies, planning documents, and in-depth interviews with urban developers and planners, capturing the real demands of local development.
The following sections develop the boundary demarcation model in a structured sequence. First, the study evaluates the strengths and limitations of existing theories and models on urban development and growth. Next, it assesses the lessons learned from the Guiyang pilot project, identifying how these experiences have shaped or constrained growth control possibilities. Building on this analysis, the study constructs a new boundary approach.

2. Evolution of Urban Development Boundaries (UDBs)/Urban Growth Boundaries (UGBs)

2.1. Definition

Based on existing research, an urban growth boundary (UGB) is a regional boundary established to control urban sprawl by designating the area inside the boundary for urban development and preserving the area outside in its natural state or for agricultural use [6]. In China, the concept of the urban development boundary (UDB) was formally introduced in July 2014 as a response to the challenges of uncontrolled urban expansion [7]. The UDB serves as a clear demarcation between construction land and non-construction land, and it has become a critical tool in China’s Territorial Spatial Planning framework.
The UDB is fundamentally understood as a policy instrument for land space control and urban–rural construction management, with a focus on ensuring grain security and ecological security. It can be defined as a specific region or a zone with a certain width, designed to balance the pushing force of urban expansion and the pulling force of ecological protection. While the UDB and the UGB share the same essence, the UDB is considered an evolution and continuation of the UGB concept. Therefore, this paper combines the study of the evolution of both UDBs and UGBs to provide a comprehensive analysis.

2.2. Research Progress on UGBs

Urban expansion boundaries serve as a foundational tool for urban land-use planning [8,9,10,11]. Among these, the urban growth boundary (UGB) is a prominent approach to conceptualizing and managing urban expansion. The concept of UGBs traces its origins to the establishment of a greenbelt around London, England, in the mid-20th century, aimed at preserving productive farmland near the city center [12]. Since then, UGBs have been widely adopted in the United States, particularly in states such as Kentucky, Oregon, Washington, Minnesota, Maryland, Montana, Florida, California, and Las Vegas [13,14,15,16]. For instance, in 1958, UGBs were first implemented in Lexington, Kentucky, as a tool to limit and control urban sprawl [13]. However, the requirements and applications of UGBs vary significantly across U.S. states. Beyond the U.S., urban growth boundaries have been adopted in diverse forms worldwide, reflecting regional planning priorities and challenges.
In recent years, research has increasingly shifted toward the implementation and management of UGBs, moving beyond their initial delineation. While early studies primarily focused on the conceptualization and delineation of UGBs, there remains a notable gap in research exploring the practical experiences and outcomes of UGB implementation [17,18]. Most related studies have concentrated on developing quantitative models for boundary delineation. Table 1 provides an overview of widely used models in UGB delineation.
Recent research has predominantly focused on urban growth models (UGMs), which analyze urban growth data but often fail to directly address the delineation of UGBs. UGMs typically reflect changes in pixel status from non-urban to urban, resulting in indistinct urban boundaries. Consequently, they are insufficient for generating precise UGBs [25]. Moreover, while UGMs are algorithmically transparent and user-friendly, they tend to be monolithic and difficult to integrate with one another. Additionally, these models are often based on urban growth patterns and statistics from Europe or the United States, making them less applicable to the unique urban dynamics of contemporary China.
Given the urgent need to control urban expansion in China, there is a growing demand for urban growth boundary models (UGBMs) that focus explicitly on delineating and managing boundaries. UGBMs, characterized by their spatial–temporal nature, aim to produce actual boundaries, rather than merely simulating urban growth. This shift in focus is critical for addressing the challenges of rapid urbanization in China and ensuring sustainable urban development.

2.3. Practical Implementation of UDBs in China

The urban development models (UDMs) in China are a form of urban growth boundary management (UGBM). In recent years, significant progress has been made in the practical implementation of UDBs, driven by the integration of advanced technologies and policy innovations [26,27]. For instance, Xiamen has pioneered the use of digital information platforms to enhance collaborative management and strengthen the regulation of development boundaries. The city has established a dual-control system, including ecological control lines and construction land-use control lines, which clearly delineate ecological and urban spaces. Through various measures, the construction land within the ecological control zone has been gradually reduced, while the ecological buffer zone serves as a strategic reserve for long-term urban development. In Wuhan, the confirmed basic ecological control lines have been utilized to conduct comprehensive research on city-level environmental capacity and construction land suitability evaluations, resulting in a scientifically drafted urban development boundary [17,28]. A flexible zone has been established between the ecological red line (a rigid boundary with limited adjustability) and the development boundary, allowing for dynamic adjustments and serving as a reserve space for future urban expansion. Similarly, Nanjing has implemented strict land use planning controls, focusing on the scale and intensity of construction land use. The city has rationally determined the morphology, expression, and management regulations of urban development boundaries based on the carrying capacity of future resources and environmental conditions, integrating urban structure, spatial axes, functional groups, and ecological needs.
On 25 April 2015, the “Opinions of the CPC Central Committee and the State Council on Accelerating the Ecological Civilization Construction” emphasized the need to vigorously promote green urbanization, delineate UDBs, enforce stricter rules for urban construction land supply, and shift urbanization development from outward expansion to internal quality improvement. Additionally, the document called for tightening the conditions and procedures for establishing new cities and districts. These policies have laid a solid foundation for the nationwide implementation of UDBs.
Despite these advancements, researchers and urban planners still face challenges in developing a unified methodology for UDB delineation [29]. The current research has extensively covered the concept, connotation, theoretical framework, and efficiency of UDBs, but most methods tend to focus on either the demand for construction land or ecological and environmental protection [30,31,32,33,34]. These approaches are often susceptible to external interference and subjective judgments. Therefore, there is an urgent need to establish a comprehensive macro-level objective demarcation model and a standardized methodological framework.
Moreover, UDBs are not merely tools for controlling urban expansion; they also play a critical role in protecting natural resources and the environment. The ecological pattern of a region is a key determinant of the boundary form, and urban planning should aim to achieve a balance between development and ecological preservation. Equally important are the post-demarcation processes, including policy-making, process control, and risk prevention, as effective implementation is crucial for successful spatial governance.

2.4. Overall Review

Based on the study of related theories and methods for delimiting urban development boundaries, it is evident that research on UGBs began early and has evolved with diverse methodological characteristics. Each method emphasizes different aspects, such as perspective selection, evaluation index system construction, and simulation model development. However, most approaches are still based on single-factor analysis, focusing either on urban spatial growth or ecological resource protection. The existing methods primarily rely on the analysis of socio-economic and natural factors.
In general, the delineation of UDBs should meet the following conditions: (1) while various delineation methods exist, there is a lack of a unified and standardized methodology; (2) urban development boundaries should not only control the scale of cities but also prioritize the protection of ecological and cultural resources; (3) Current boundary demarcation practices are largely influenced by foreign experiences and may not be universally applicable to China’s unique context; (4) The delineation of urban development boundaries must be supported with robust and enforceable policies to ensure effective implementation.

3. Reconstruction of New Demarcation Model of UDB

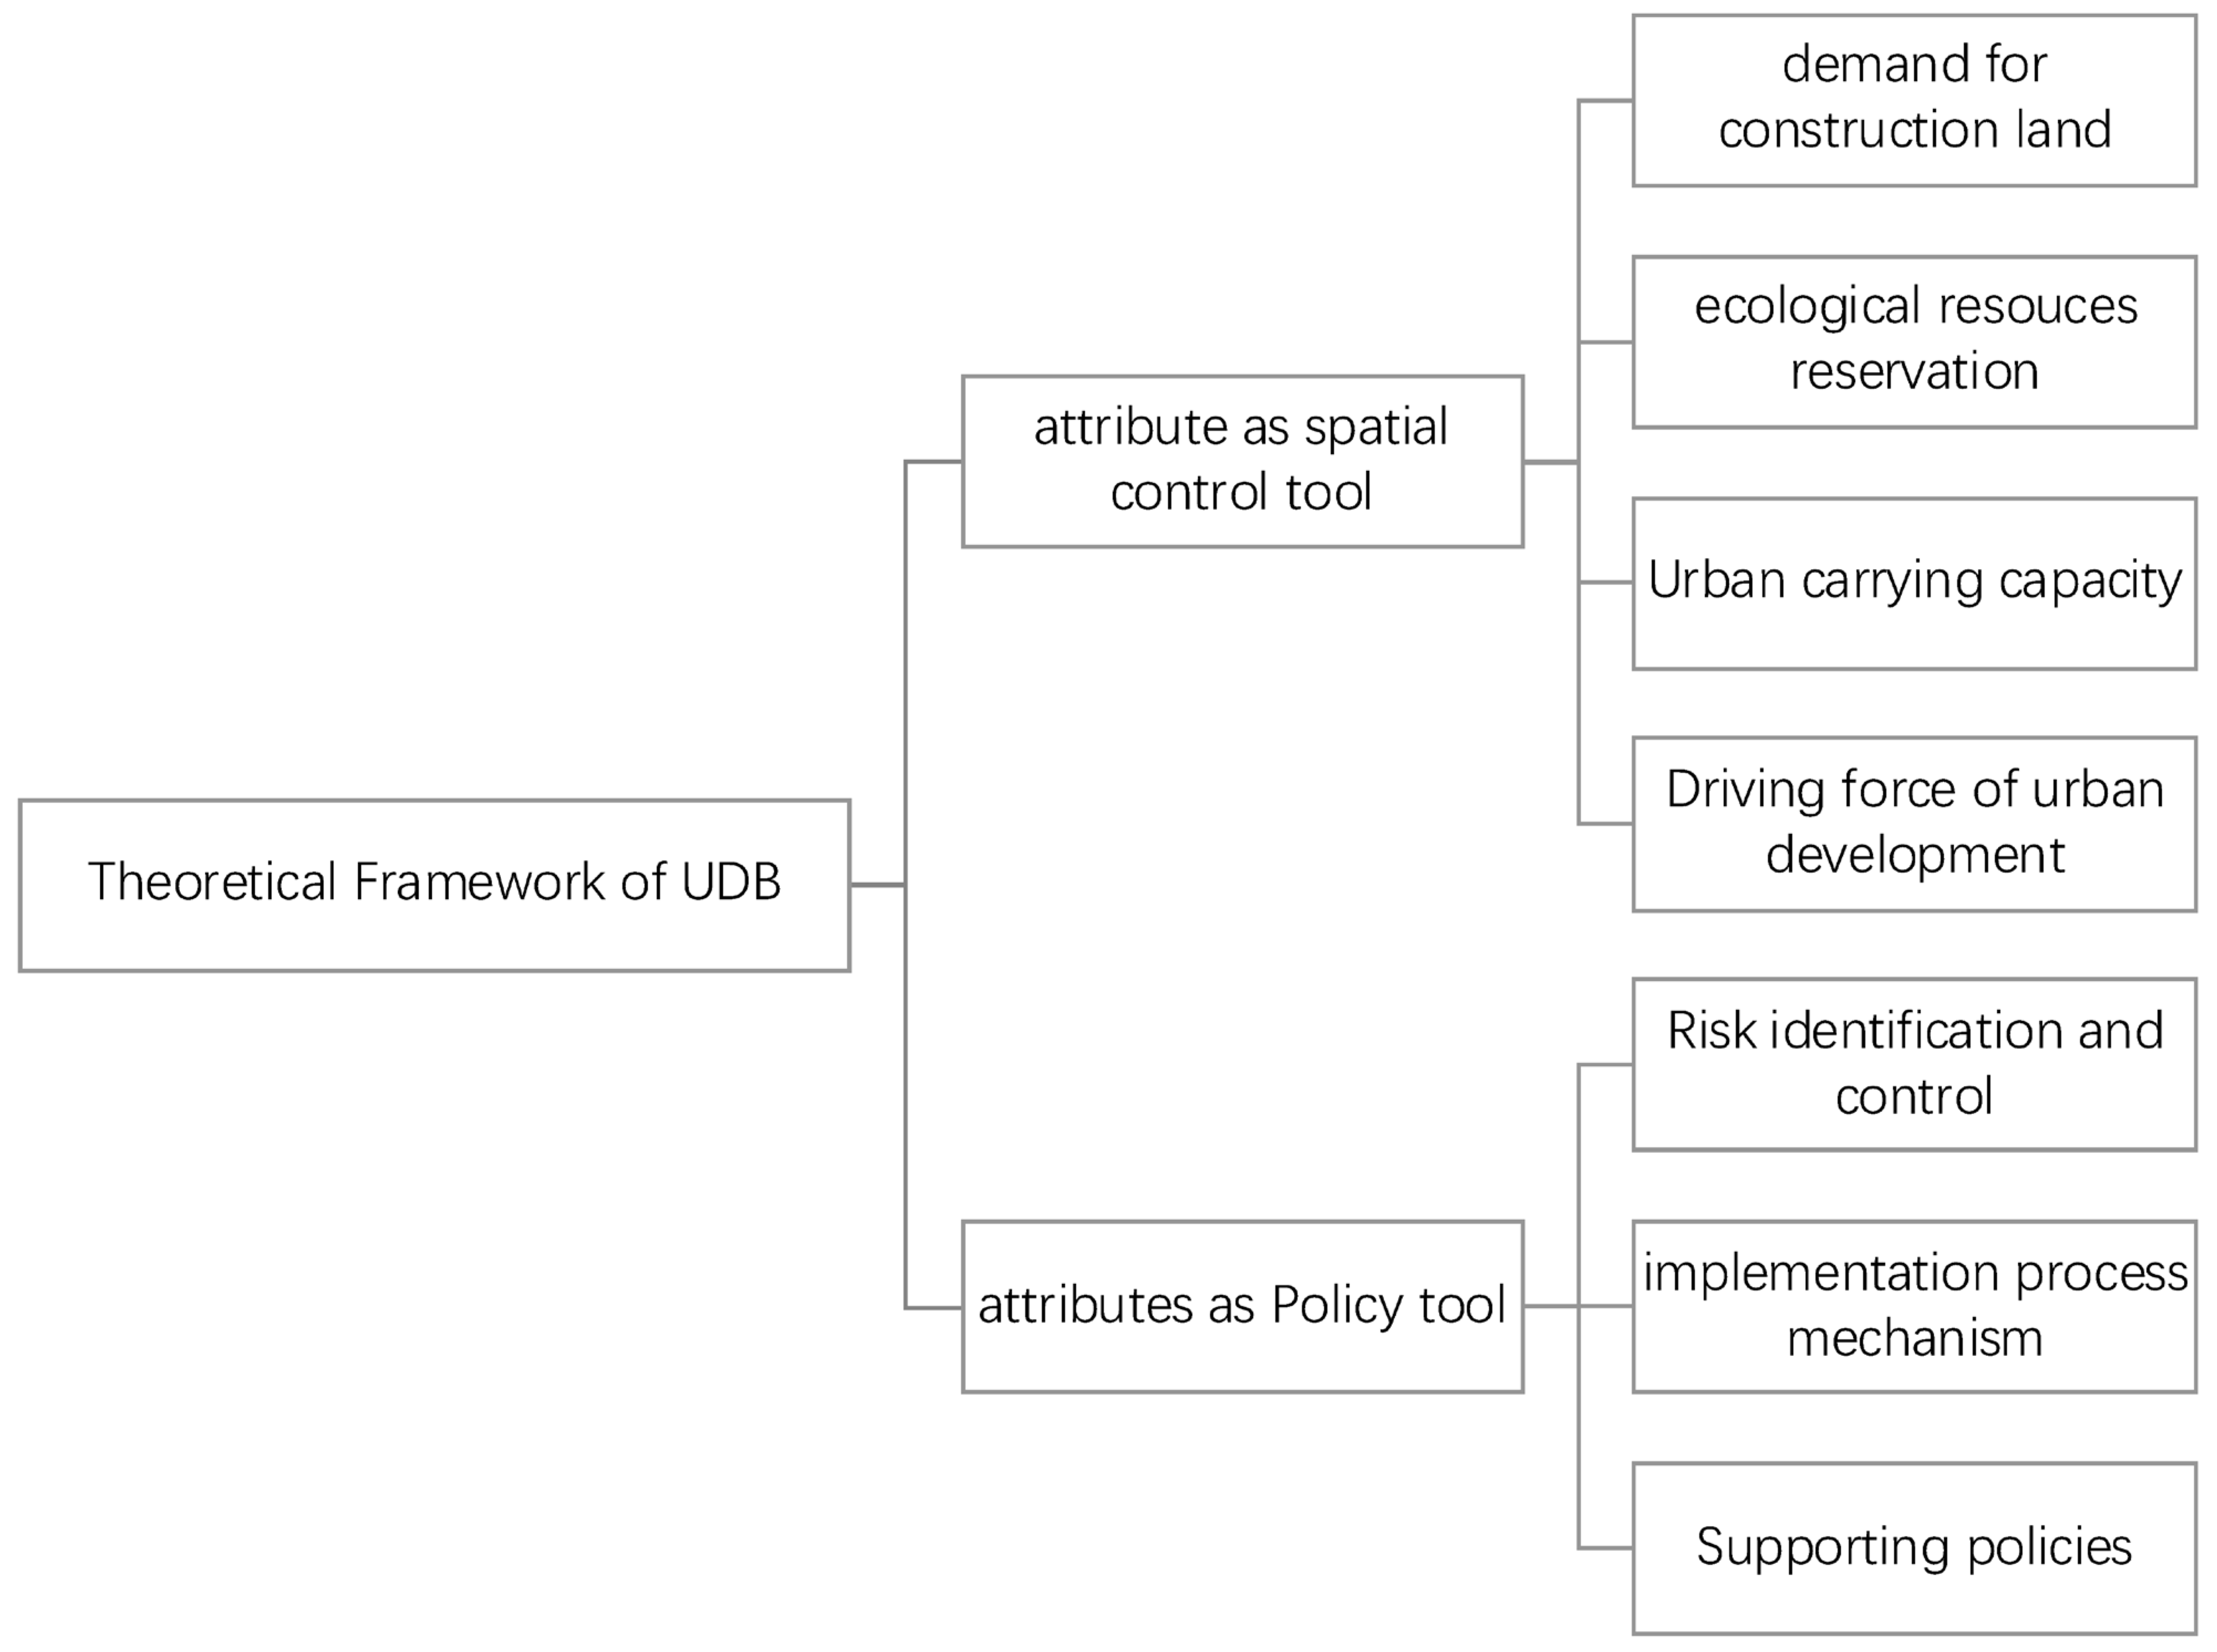
3.1. Theoretical Framework

The existing urban growth control methodologies predominantly focus on rigid boundary delineation or single-dimensional ecological constraints, with a critical limitation being their fragmentation of the organic urban–rural nexus and inadequate adaptability to dynamic development needs. We proposed urban–rural integration-oriented model, which addresses these shortcomings through three innovative mechanisms: First, it establishes a functional complementarity index system integrating synergy factors (e.g., industrial collaboration and infrastructure sharing) into boundary decision-making. Second, it constructs a dynamic game-theoretic model coupling ecological networks and construction land expansion, enabling the spatial integration of rigid control and adaptive flexibility. Compared to conventional approaches, this model uniquely unifies the bidirectional mechanisms of “urban-driven rural development” and “rural-constrained urban growth” within a single analytical framework.
In developing our new theoretical framework, we adopted a bounded rational approach, which distinguishes it from previous research. Cities, as complex giant systems, are composed of diverse factors and multiple stakeholders, often leading to contradictions between the means and objectives of spatial planning. Traditional analyses of target chains may yield inaccurate conclusions due to these inherent complexities. Within such systems, various factors and stakeholders can operate independently yet remain interconnected and correlated across space and time. This dynamic interplay results in a city system characterized by uncertain outcomes, influenced by both endogenous (internal) and exogenous (external) factors. Urban planning, therefore, involves balancing the city’s developmental needs with its natural growth processes, which refers to the organic, unplanned, or self-organized ways in which cities expand and evolve over time, driven by socio-economic, cultural, and environmental dynamics, rather than formal planning interventions. These processes often emerge from the collective actions of residents, businesses, and communities adapting to immediate needs.
Urban development and expansion are not only natural endogenous processes but also processes that require active intervention through land-use measures and control techniques. By repeatedly deliberating and interactively measuring both processes, the outcomes can better align with real demands, providing a more accurate and practical framework for urban planning (Figure 1).
The theoretical logical framework of UDB consists of two attributes; one is the delineation of the development boundary, which tries to construct and explain the new paradigm of the boundary delimiting of urban development, and in the end, the urban development boundary is delimited by multi-angle complex thinking combined with the resource conditions and the development orientation of the urban and rural areas (Figure 2). In addition, considering the “Land conservation and intensive utilization policy” in China, in the process of model optimization, we incorporate key concepts emphasized in European urban research, particularly existing urban land reuse and density regulation, to address urban sprawl mitigation. Specifically, a “Built-up Area Renewal Coefficient” is added, and an “Inward Development Priority Principle” is introduced, prioritizing the use of existing renewable land.
This paper establishes the connection between these two processes. This connection relies on both a theoretical framework of how cities are expanding and a method of controlling this expansion. The resulting UDB delineation is a “Four-Dimensional Design” of a UDB, which includes the following dimensions: (1) land demand in urban areas for economic development; (2) the so-called “reverse thinking”, which focuses on resource protection; (3) the carrying capacity of resources and the environment; (4) urban growth resistance. The resulting line derived as the intersection of the four dimensions constitutes the boundary within which a city can develop and which a city needs to control in a sustainable manner.

3.2. Detailing the “Four-Dimensional” Design

Each of the four dimensions (i.e., predicting total land demand, the delineation of the environmental protection priorities, the urban carrying capacity, and urban growth resistance) are further detailed in the following subsections.

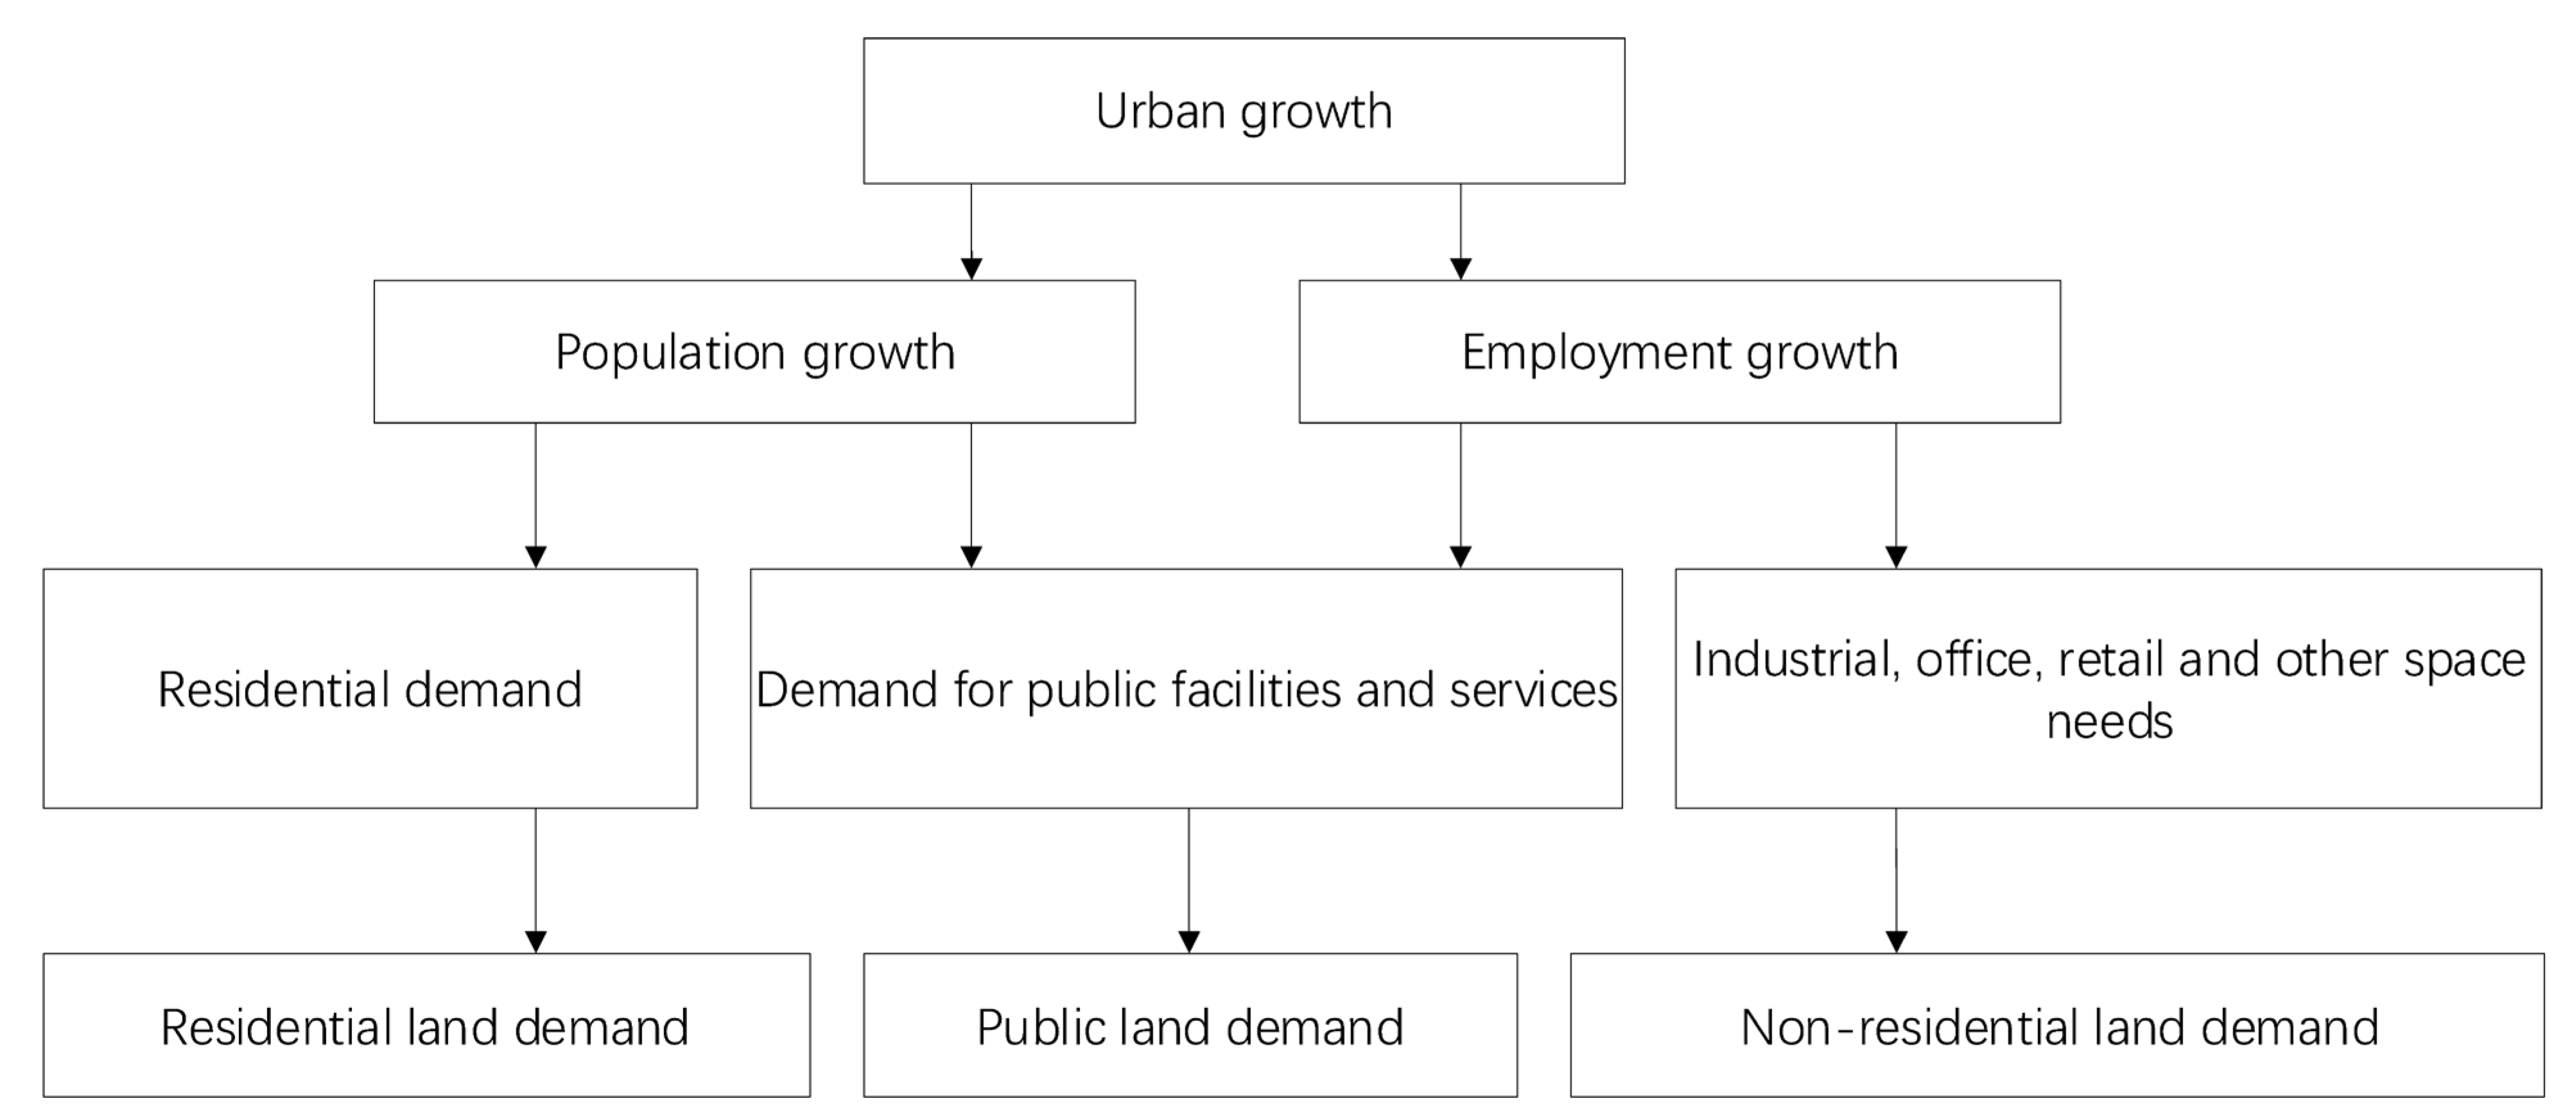
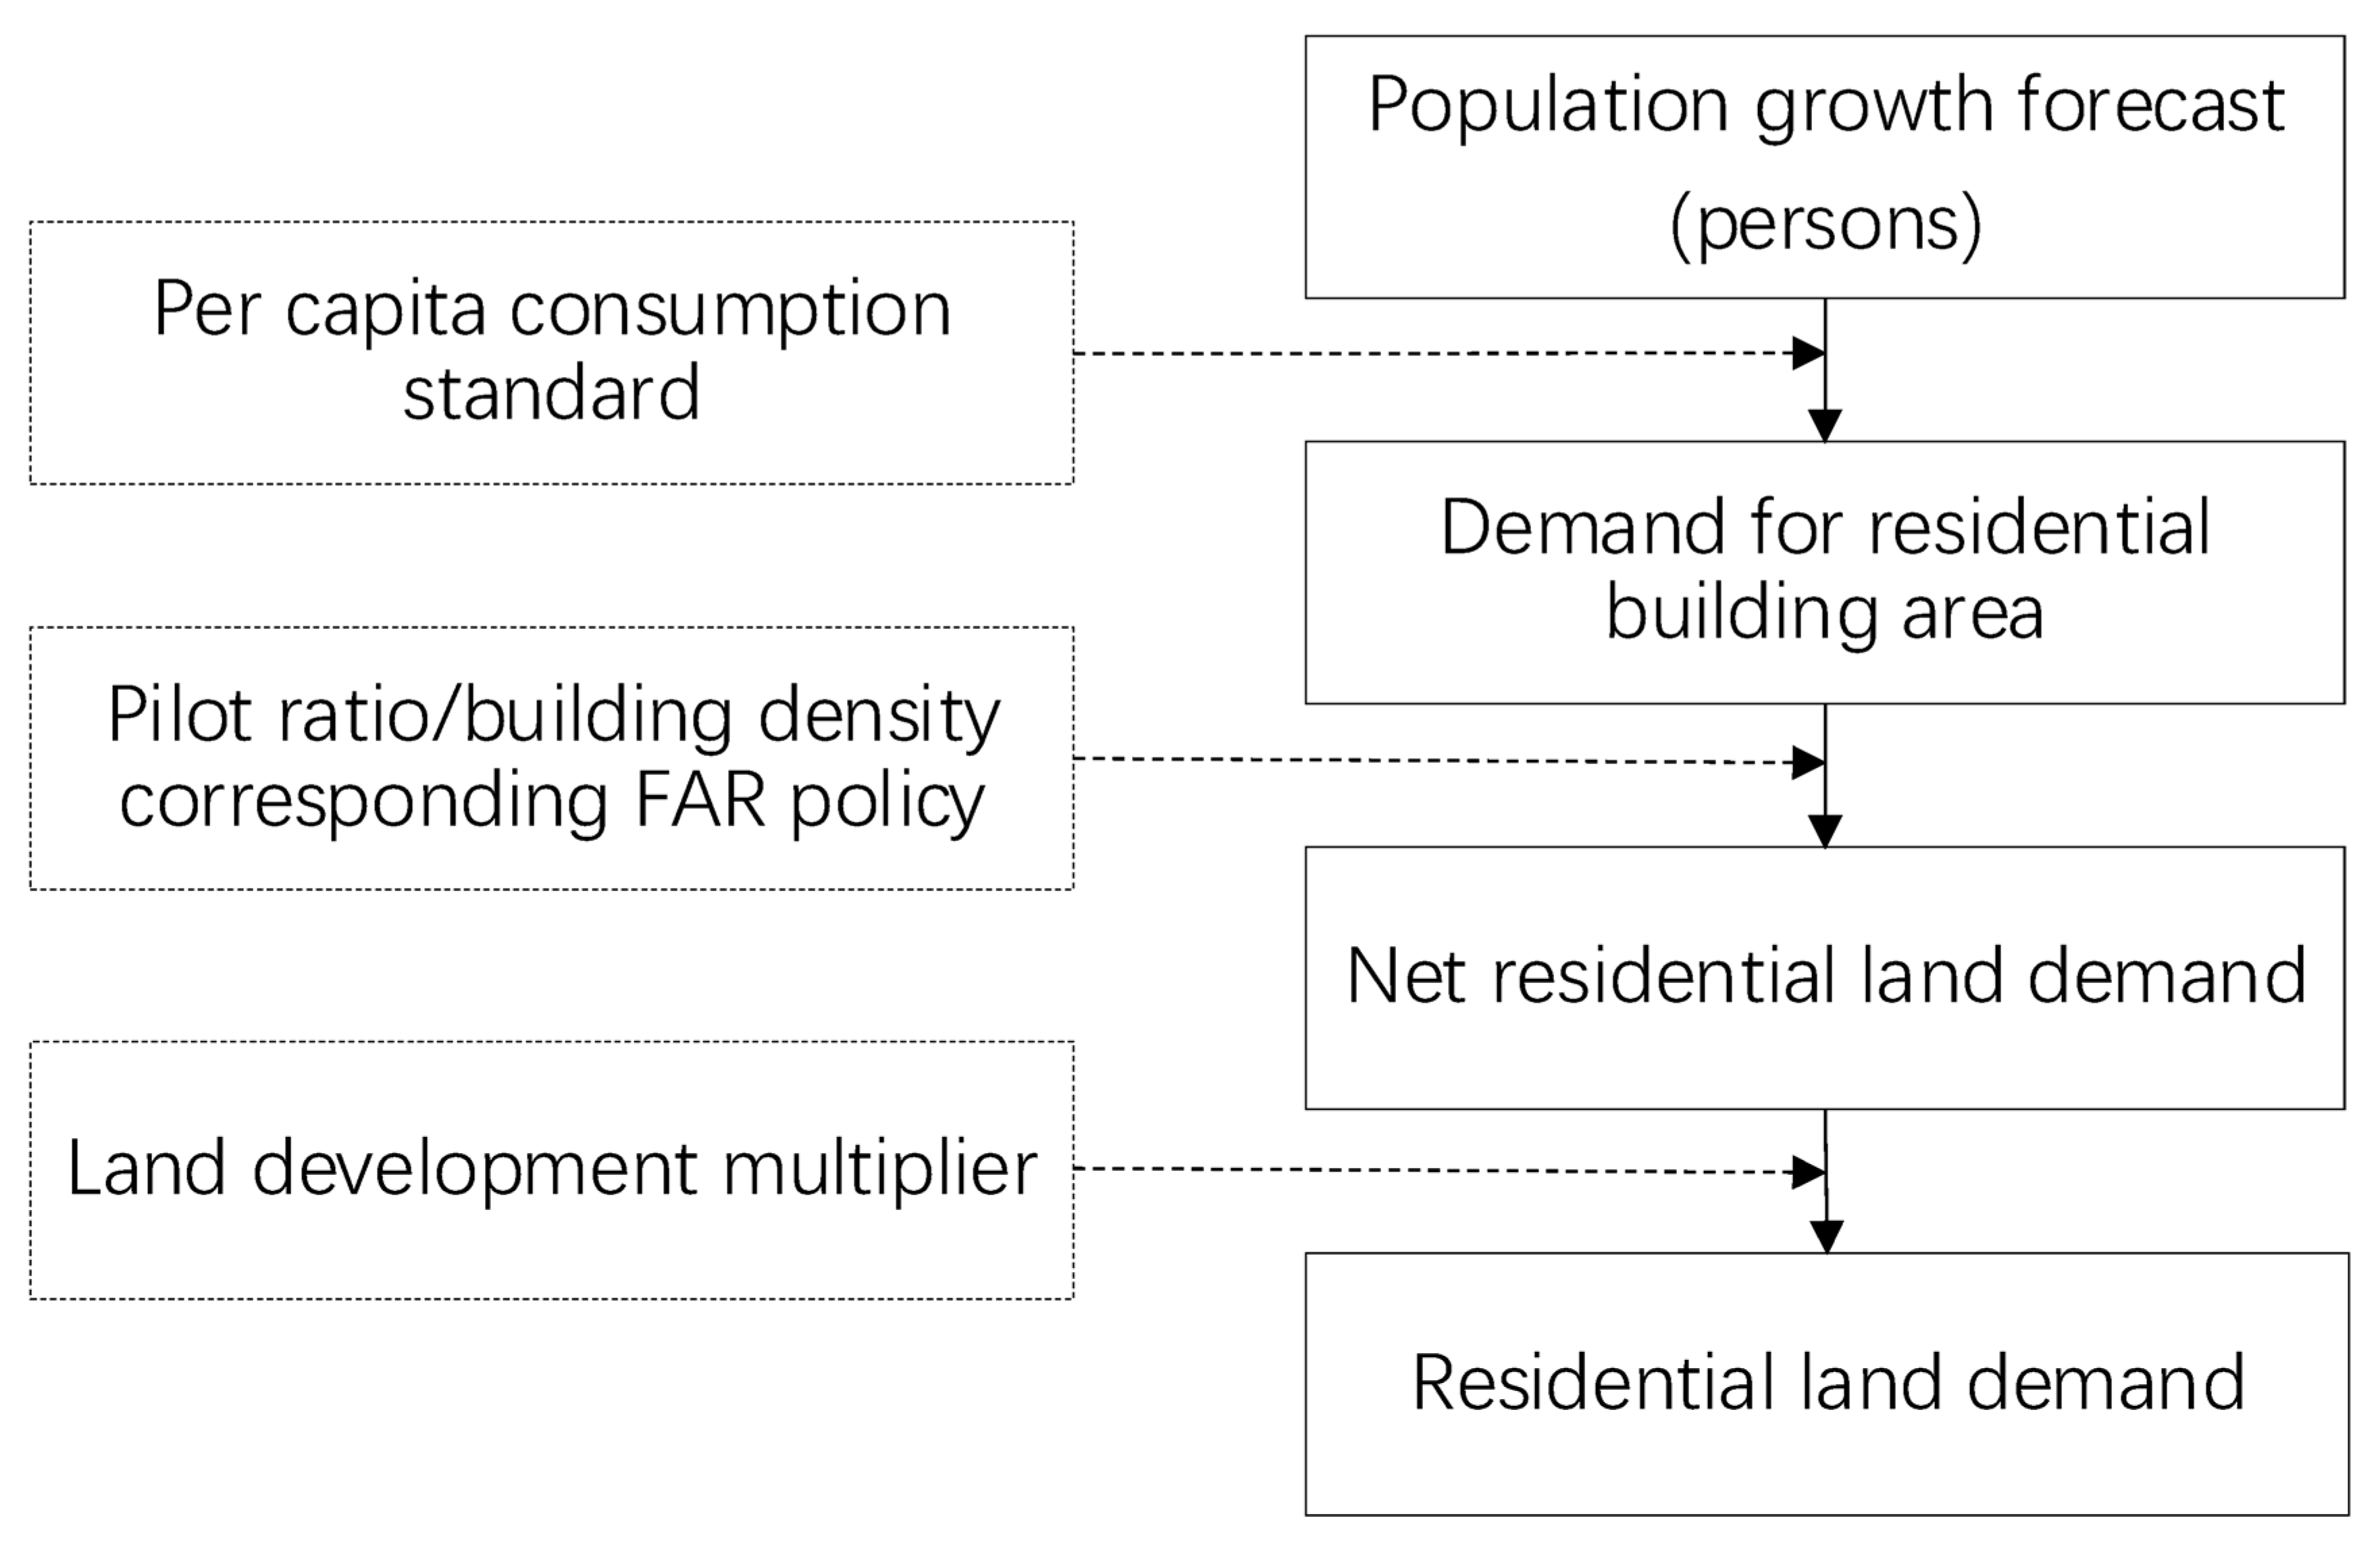
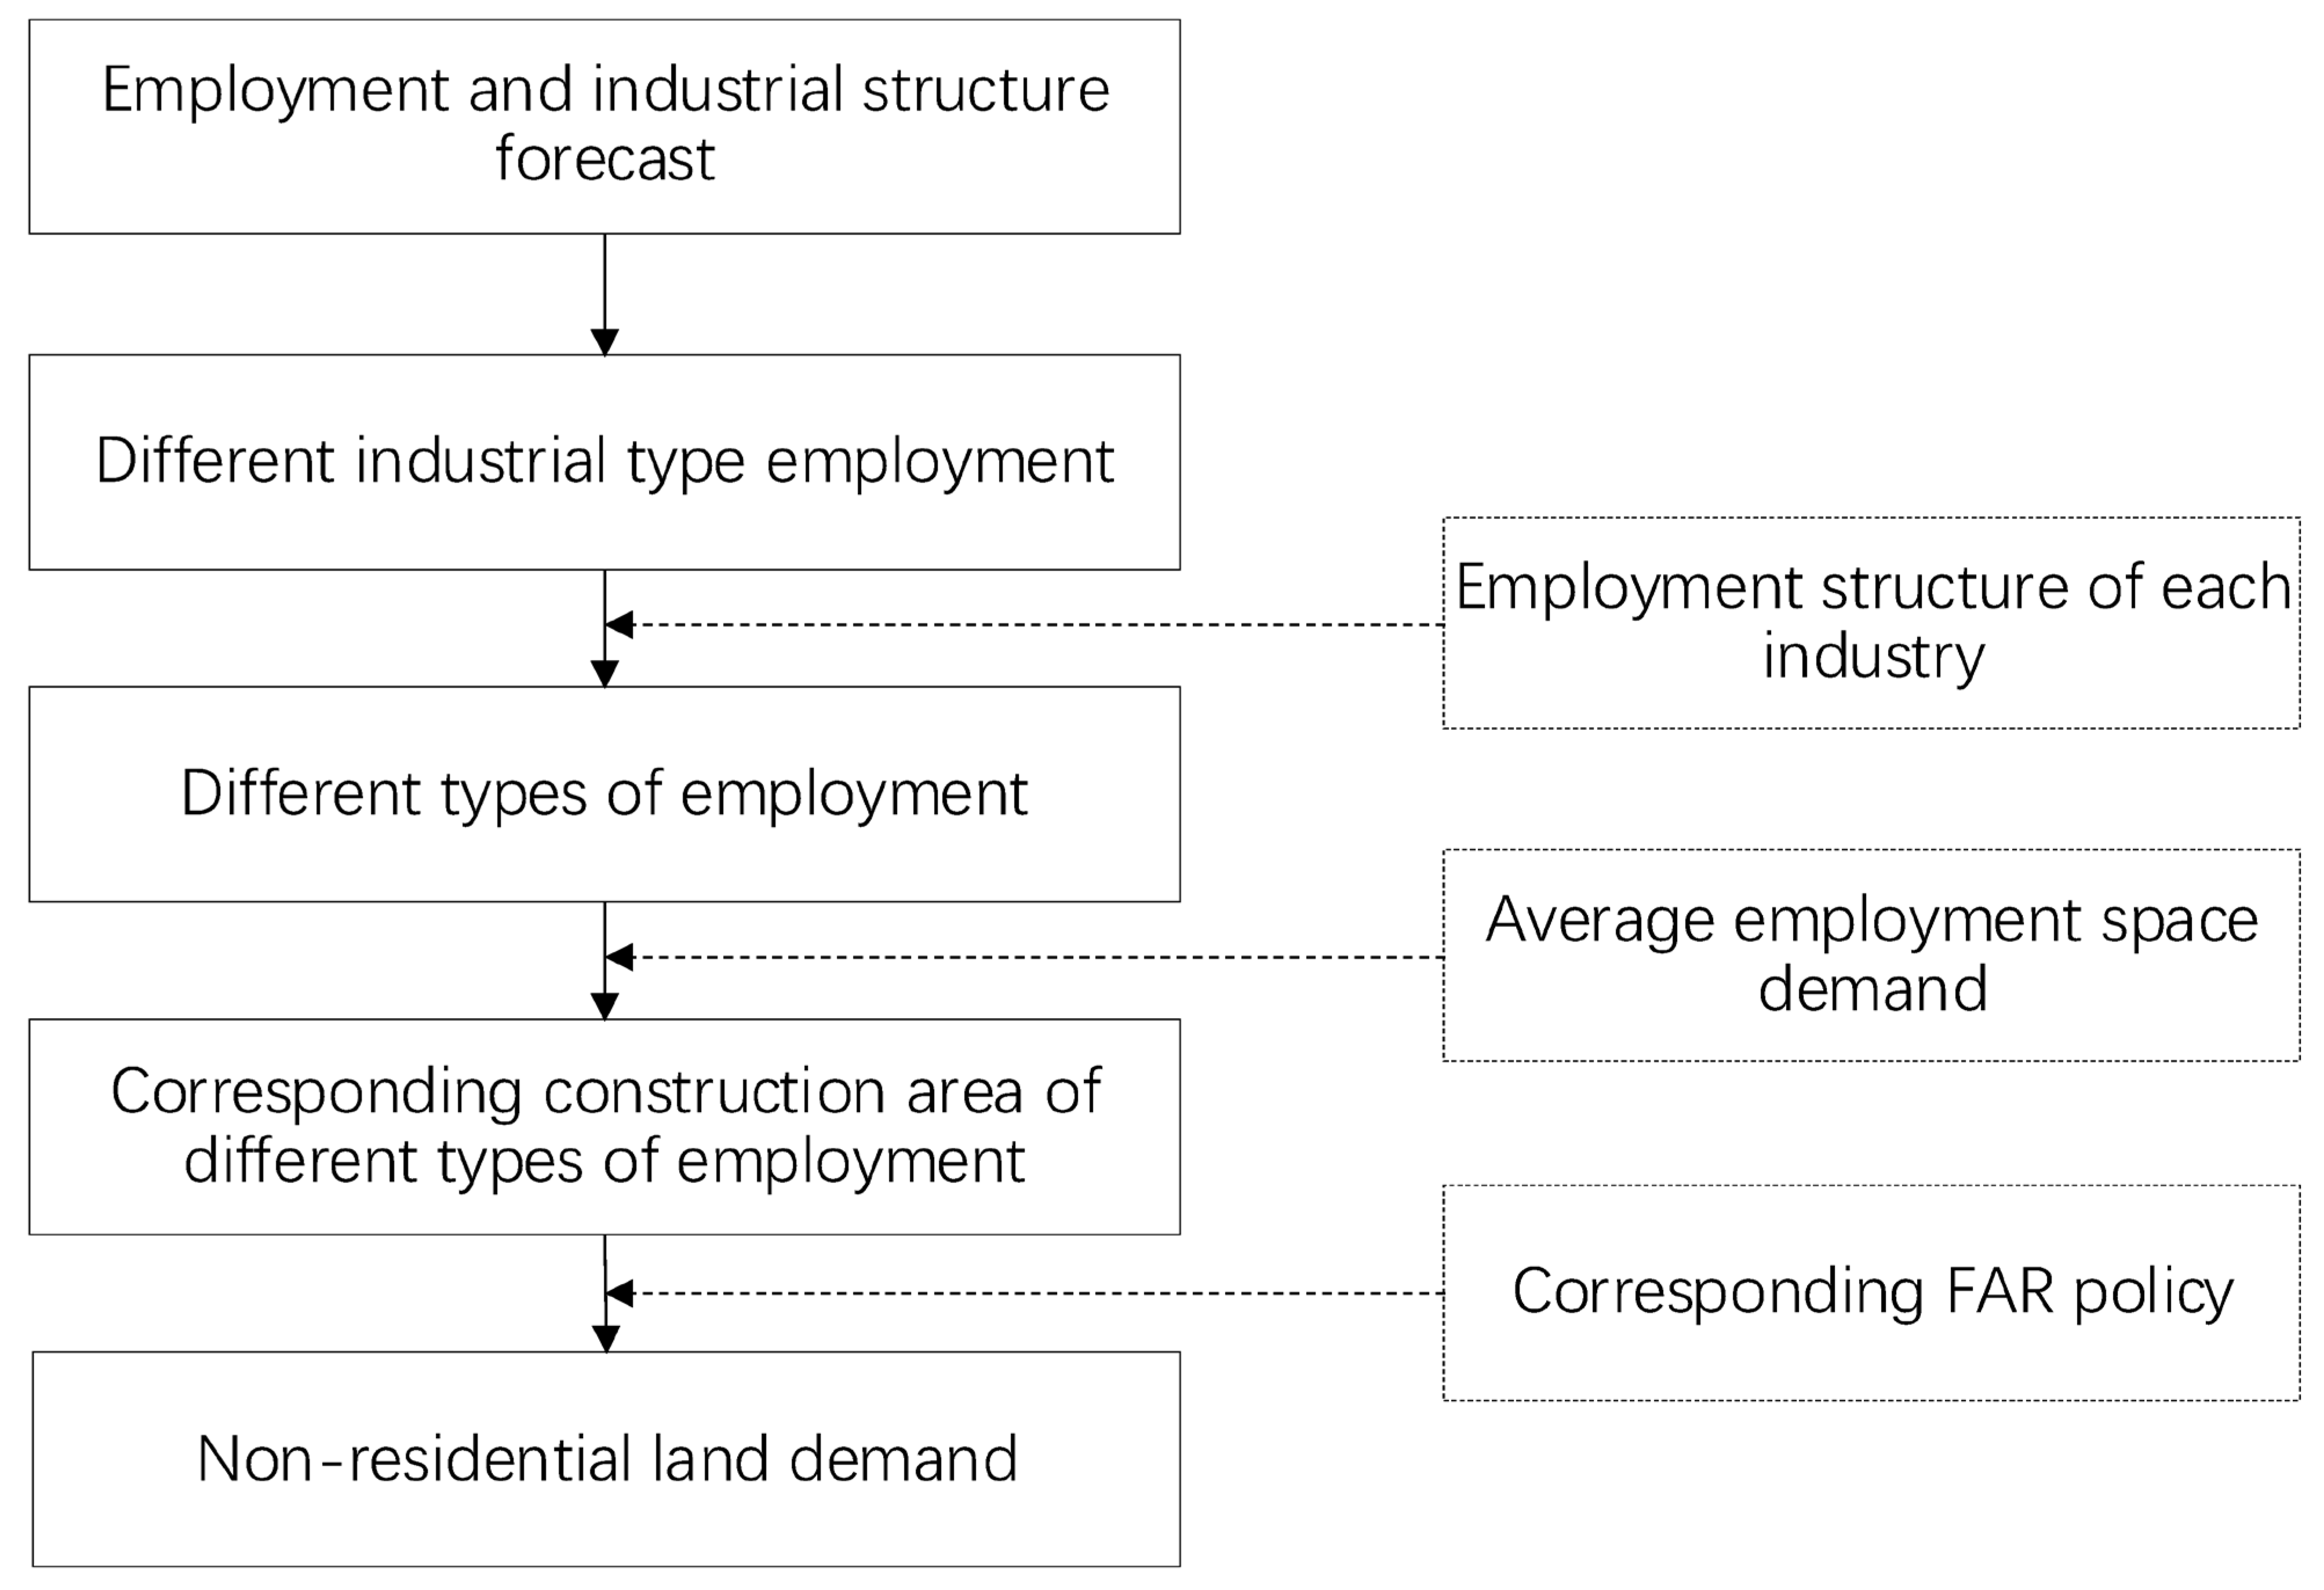
3.2.1. Predicting Total Land Demand

Urban expansion is obviously strongly related to the demand for construction land, which again depends on estimates for population and economic growth. In contrast to many other prediction methods, such as trend extrapolation and the shift–share method, we calculate land demand with a method, which can predict the requirements and changes in three types of land use (residential, non-residential, and public) based on the forecasts of spatial population increases. The assumption is that population growth leads to a demand for residential land and, at the same time, to economic growth, leading to a demand for non-residential land. This increase also increases the demand for public land necessary for infrastructures supporting both residences and economic activities. Figure 3 depicts these relations schematically.
Based on Figure 4, we can derive the following formula: Total LD = RD + PD + ND, where LD represents land demand (km2), RD represents residential land demand (km2), PD represents public land demand (km2), and ND represents non-residential land demand (km2). Each of these factors needs to be calculated.
  • Residential land demand (RD).
The residential land demand reflects the size of residential land in the future. First, we predict the population size based on current demographic statistics, and then we calculate the housing demand by considering housing consumption standards. Then, according to the relationship between the construction areas of different residential types and the proportion of the land area (closely related to the pilot ratio and building density), the net land demand of a residential area is calculated. Finally, we obtain the residential land demand, considering the land development multiplier, which represents the ratio of additional land needed for infrastructure or other extra usage. Usually, families are classified according to their income, their household members, and the head of the household’s age, since different types of families have different housing demands. For simplicity’s sake, and given the experienced data availability constraints, in this paper, we just took residential demand into consideration. Figure 5 presents the calculation process schematically.
In calculation terms, residential land equals RD = P × Cs × Pr × Lm, where P is the predicted population (persons), based on existing population data; Cs is the per-capita consumption standard (m2/capita), determined in a residential area planning and design norm, Pr is plot ratio/building density according to corresponding FAR policy, and Lm is the land development multiplier, referring to the ratio of additional land needed in construction, because of the ancillary street area and the loss of construction efficiency due to the corner and irregular shape plots.
  • Non-residential land demand (ND).
Urban economic growth is accompanied by an increase in demand for industrial and commercial land use. On the one hand, the expansion of existing city companies and enterprises needs more land; on the other hand, new companies also need to take up more land. Similar to residential land demand analysis, non-residential land demand analysis starts from employment.
We use a non-aggregated analysis method, subdividing non-residential land further and combining it with employment types. For example, machine processing requires more space than retail industries or financial services. In addition, the land-use intensity differs per sector. Office buildings can be built very high, whereas processing workshops tend to be restricted by available pipelines, which cannot be vertically expanded. With this differentiation, the accuracy of land demand is improved. Practically, we first forecast the economic growth (output and employment) according to the employment structure of different industries. Secondly, the corresponding construction area is connected to the average construction land demand per industry type. Finally, with the building density per industry type, the non-residential land demand is calculated (Figure 6).
This equation is ND = Eijk × SD × Ci × Pr, where Eijk represents the different types of employment in different industrial types and various domains. For each domain, there is a different space requirement, which will be presented in a conversion table from yearbooks from diverse cities. SD represents the average employment space demand, Ci represents the corresponding construction area of different types of employment, and Pr is again a plot ratio according to the corresponding FAR policy.
  • Public land demand (PD) analysis.
The public land in this study refers to space providing services for urban residents and enterprises, such as schools, hospitals, parks, piers, etc. The size of other supplementary public spaces, such as streets, is estimated for both residential and non-residential land. Alongside the city expansion comes an improvement in people’s living standards and, therefore, the demand for public land of higher quality is also rising. This makes the public land demand complex. Hence, we simplify it by assuming a certain fixed ratio of the required public land compared to the sum of the residential and non-residential land. This ratio usually correlates to topographic features. However, for our study, we assumed a ratio of 50%. In other words, if PD = ND + RD, we can simplify the total land demand LD as LD = ND + RD + PD = 2ND + 2RD.

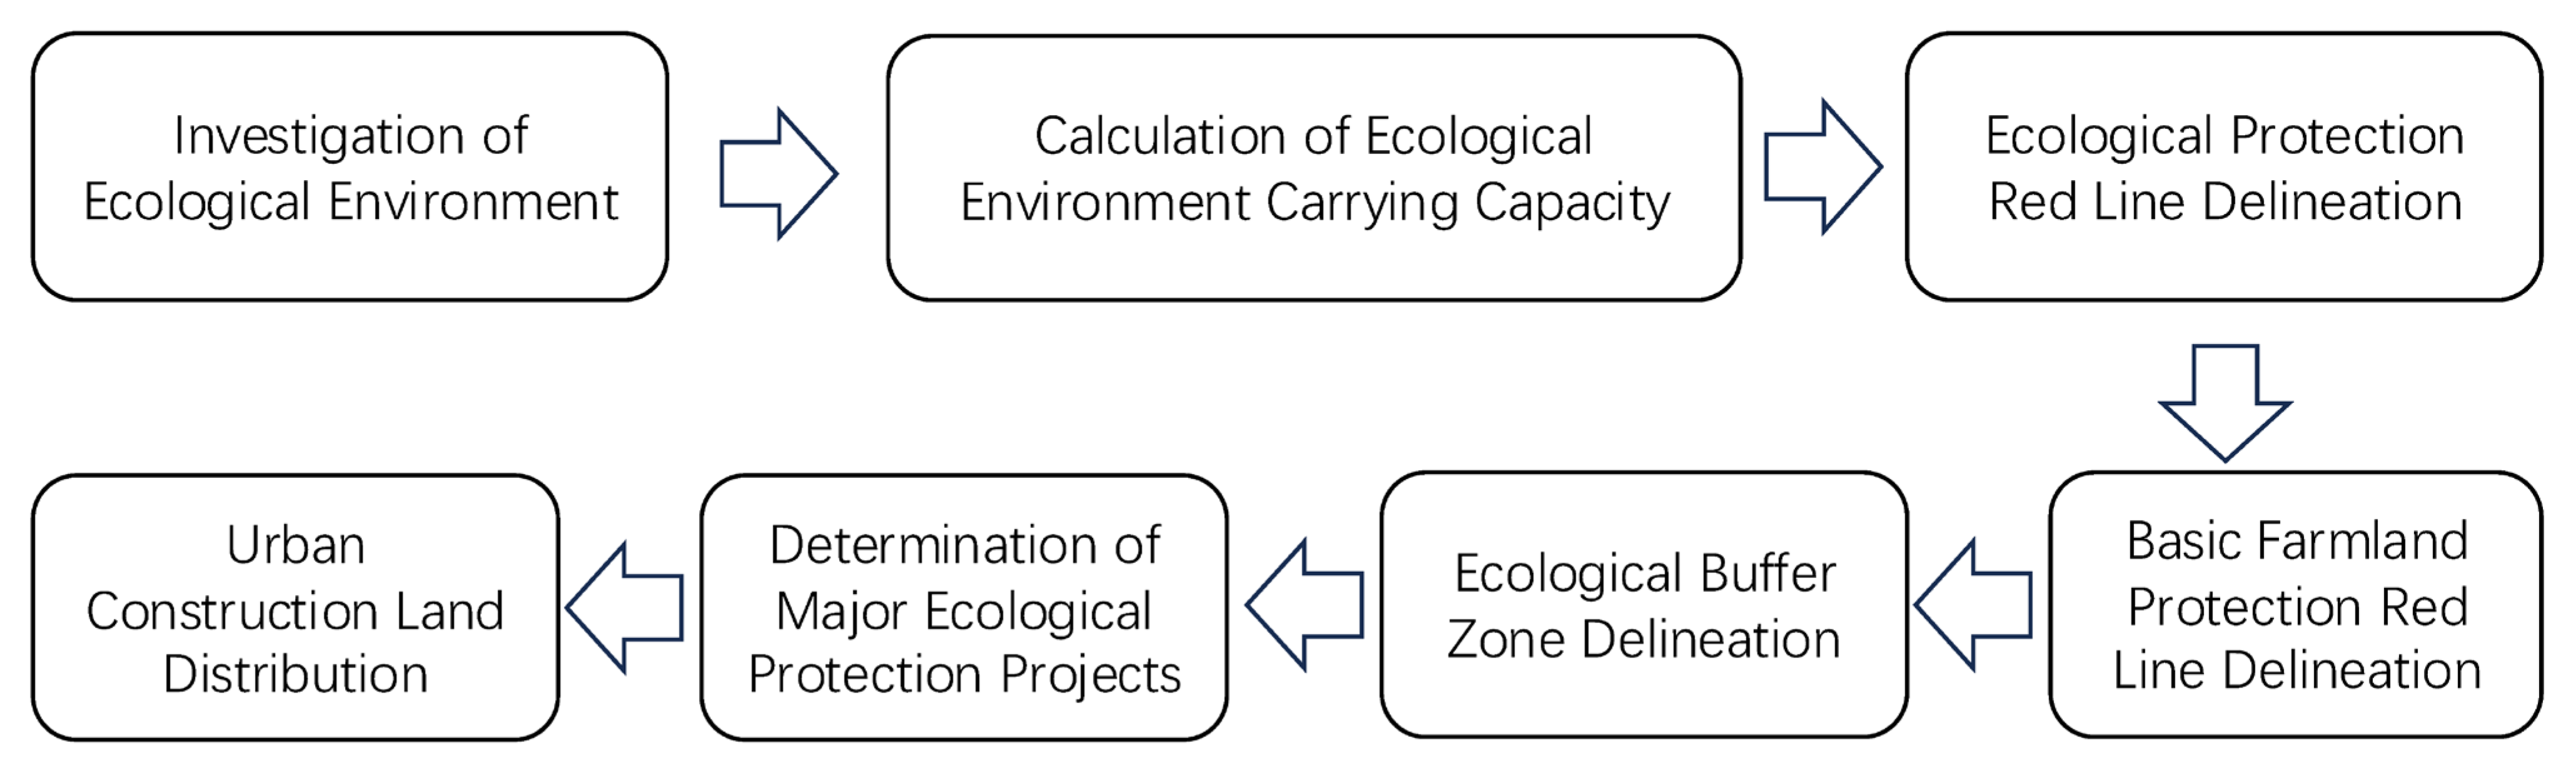
3.2.2. Delineation of Environmental Protection Priorities

The theory and methodology of “Anti-planning” [35] advocates for performing urban planning from an ecological view, reducing intervention. It uses the method of superposition to overlap the flood control system, the biological protection system, the cultural heritage system, the leisure system, etc. Practically, this is achieved using GIS. All types of areas are collected and overlaid in ArcGIS. The combined polygons represent the restricted areas in square kilometers within the administrative boundaries. Figure 7 shows the delineating process for environmental protection priorities.
Areas that require environmental protection are specifically delineated in order to prevent any urban expansion or encroachment on these areas. There are mainly two parts, namely those areas which need to be secured for ecological purposes, for drinking water resources, to maintain wetlands, and to secure historical sites, to delineate mineral-intensive areas, to preserve nature, and to prevent construction after geological disasters, as well as areas that need to be conservated for history protection purposes. In sum, these areas should be strictly designated outside the UDB (Table 2). Figure 6 describes the process of delineating “Environment Protection Priority” areas.

3.2.3. Soil and Water Resources Carrying Capacity

The concept of carrying capacity refers to the maximum population size that an environment can sustain indefinitely, given the availability of essential resources such as food, habitat, water, and other necessities. To determine the urban carrying capacity, we draw on foundational theories, including those of Malthus (1766–1834), who proposed the idea of limited resources and their influence on population growth, as further developed by [36,37]. The urban carrying capacity specifically refers to the land size and land type required to support an urban population and its socio-economic activities within a defined period and predefined goals. This concept is rooted in a complex system integrating social economy and ecology, involving factors such as population growth, ecosystem health, and land clearing rates.
In the context of China’s economic development, rapid growth has come at the expense of natural resources, particularly the excessive consumption of cultivated land and water resources. This has led to a series of critical issues, including water shortages, air pollution, and ecological degradation, significantly weakening the carrying capacity of the natural environment. Consequently, the sustainable development and utilization of soil and water resources have emerged as fundamental challenges in urban planning and development.
The FAO’s 1993 report further emphasizes that resources can be categorized into natural and social resources, with land, water, and environmental resources being key components of natural resources. Building on this, and guided by the Buckets Effect theory, we selected land and water resources as the primary components for estimating the urban carrying capacity. This approach provides a robust framework for understanding and addressing the resource constraints that shape urban development.
First, the land carrying capacity (LC—in number of persons) is calculated as L C = A B F E P , where A is the administrative size of the city (in km2), BF is the basic farmland area within the urban administrative boundary (km2), E represents the ecological land area (in km2), and P is the construction land per capita, which can be looked up in addendum (m2 per capita) and revised according to individual circumstances.
Secondly, the water resource carrying capacity (WC) is calculated as W C = W t W i , where Wt (m3) represents the total reasonable utilization capacity in the area, and Wi (m3) shows the total water consumption in the area. When WC > 1, the water resource is in a reasonable loading range, when WC = 1, it is in a critical state, and when WC < 1, it means that the water resource carrying capacity is overloaded.

3.2.4. Minimum Cumulative Resistance of Urban Growth

Urban spatial expansion is primarily driven by the demand for urban construction, which often competes with ecological demands and is constrained by physical boundaries. These competing interests lead to land-use and cover changes, particularly the transformation of ecological land into energy-intensive construction land. To model this transformation process, we employ the minimum cumulative resistance model (MCR) [38,39,40]. This model assumes that urban expansion tends to occur in directions where there is the least resistance from competing interests and physical boundaries.
The MCR model quantifies the cost of transitioning from “source” areas (ecological land) by assigning different resistance values to various land types. In essence, it measures the effort required to overcome resistance during urban expansion. This approach not only captures the potential trends of urban growth but also identifies the intrinsic factors influencing regional urban expansion. By analyzing these factors, the MCR model provides valuable insights into the dynamics of land-use change and the trade-offs between urban development and ecological preservation.
In this model, there are three main factors, namely source, distance, and landscape medium characteristics. The resistance value MCR is calculated through M C R = f m i n n = j m = i D i j × R i , where Dij represents the distance a target cell goes within space i, from any point in the space to the source j. Ri is the resistance coefficient of the reachability of space element surface i.
The meaning of the resistance coefficient (Ri) is that, when a space in the urban landscape is reserved for ecological purposes, urban expansion cannot take place in this direction, even though the ecological services may not exist yet. However, once allocated as an ecological region, the space has ecological value. According to the theory of ecosystem services, the total ecological value can be represented as E S V = i m j n E S V i j A i , where ESV is the total value of the regional ecosystem services; ESVij is the value coefficient of the jth ecological service of the ith ecosystem, and Ai is the area of the i-type ecosystem. Using these values, it is possible to calculate the resistance coefficient Ri for the ith ecological land using formula R i = A V E R E S V i t i = n t = m E V S i t , where ESVit is the ecosystem service value during t (time), m is the sum of t, and n is the total land type of ecosystem.
Ecological resistance is, however, also dependent on the type of ecological service provided. We divided the ecological land into four types, namely water and wetland, forest, grassland, and cultivated land. Each type of land has its “ecosystem service function value” and coefficient, with which a table of resistance coefficients was obtained and used for further MCR calculations.
With the resistance coefficient, we obtain a value for all points in the administrative area, which can be represented as a map with color gradations, indicating in which directions the expansion will face the highest and lowest resistance once it is growing. Or, in other words, in which directions the city is most likely to grow. Introducing the resistance coefficient of different ecological land into ArcGIS, the minimum cumulative resistance surface of urban space can be calculated using the cost-distance module and spatial weights matrix of ArcGIS spatial analysis. The output of this part will be a map, which shows the resistance value of the land with colored gradation showing the possible urban expansion process. It would firstly overcome low-resistance land and then gradually overcome the high-resistance land. In the end, it would achieve a balance in which construction land and ecological land impede competition and reach a coordination level.

3.2.5. Four-Dimensional Model Summary

Table 3 shows the summary of the four-dimensional design and how each element is (spatially) calculated. In each single dimension, the conventional model can only consider a single factor. Such a parallel study may have strong conflicts due to the inconsistency of the target. But in fact, the “four dimensional” model has a conjugal relationship; the output of the final result is going to be the maximum common divisor under the finite constraint, balancing the “developing-reservation” relationship.

4. Testing the New Urban Growth Boundary Delineation Model

4.1. Study Area and Data Preparation

Guiyang, located in southwest China, is the capital city of the Guizhou Province, with a population of more than 4.69 million residents. The city lies in a wide karst valley basin with an elevation of around 1000 m, which is why the city is scattered in its distribution. The total area of Guiyang City is 8034 km2, while the area available for urban planning is 3064 km2.
Documents and data from 11 government departments were collected, including the existing land-use plans, urban plans, yearbooks of various periods with all the basic economic data and population data, etc. A spatial statistical analysis technique in the ArcGIS package was adopted, and we imported land-use data from diverse years into ArcGIS, thus obtaining the land-use type and its area.

4.2. Application of “Four-Dimensional” Model

4.2.1. Construction Land Demand

  • Residential land demand.
The population input was based on population forecast results from data from the Statistics Bureau in Guiyang, and the population in Guiyang City in 2020 and 2030 was expected to be 5.1 million and 6.3 million. We assumed that the average living area per capita was 35 square meters (using “Guiyang Urban Planning Master Plan 2011–2020”, as well as “2020 we live in what kind of house-China’s comprehensive well-off society in the study of living goals” from the Ministry of Construction Policy Research Center). The urban development multiplier was estimated at 1.1, which was based on international experience (Norman City), reflecting that the actual consumption of residential land is 1.1 times the theoretical consumption due to corner losses. When Guiyang’s Urban Planning Policy, combined with the actual situation of residential land, was taken into account, the average pilot ratio was 2.2. Using these parameters, Table 4 derives the forecast of future demand for residential land demand (Table 4):
  • Non-residential land demand.
The non-residential demand was derived from economic forecasts on employment in different sub-industries. According to “The 12th Five-Year Plan” of Guiyang City, the distribution of industry and the demand for employment, the manufacturing sector is disintegrated into various types of non-agricultural employment increment. Table 5 depicts the expected employment changes for the period of 2020–2030.
As indicated in our model, the industry type requires different kinds of land (industrial, retail, and office). Based on the statistical expectations of Guiyang, Table 6 provides the estimates for the demands for employment floor area according to the average working space of each staff member in different types of employment.
With Table 5 and using the statistical forecasts of Guiyang City in terms of industry type increases, we could derive Table 7, showing the predicted increase in industrial land demand.
  • Public land demand
Using our formula for calculating the public land demand led to a forecast of public land demand (Table 8).
  • Construction Land Demand Synthesis
Summarizing the demand for residential land, non-residential land, and public land (Table 5, Table 7, and Table 8), the forecast for the future demand for newly increased construction land is shown in Table 9.

4.2.2. “Environment Protection” Delineation

The basic geospatial data needed for establishing the environmental protection delineation factor were collected from various government departments. Overlaying these geospatial data led to a map of the environmental protection core area and an associated buffer area, represented in Figure 8.

4.2.3. Urban Carrying Capacity

  • Land carrying capacity.
According to a Chinese building climate zoning map, Guiyang City belongs to the VA climate zone. The allowed per capita urban construction land area index would be 80–105 m2/capita. Given the “City Land Classification and Land-Use Planning and Construction Standard (GB50137-2011)” [41], land should be used more rationally and economically. Therefore, we set a target of 100 m2 per capita urban construction land. The available urban planning area in Guiyang is 3064 km2, while the basic farmland area is circa 603.76 km2, and the ecological land area is circa 890.16 km2. According to our formula in Table 1, the resulting land capacity area of Guiyang is 16.27 million people at the most.
  • Water resource carrying capacity.
Water resources in karst areas are dynamic; the system is affected by topography, water conditions, and other factors, as well as changes in hydrological and geomorphic interaction. The karst area is unique on Earth; it is difficult to reflect the change in water resources’ carrying capacity simply using regional water resource development, the utilization of water resources, or the total change degree and the level of economic development.
According to “The 12th Five-Year Plan” in Guiyang and “Planning Outline for Ecological Civilization City Construction of Guiyang”, the total water resource is 4.515 billion cubic meters, of which the available water is 1.52 billion cubic meters, so the availability is 33.6%. The annual average transit water quantity is 8.46 billion cubic meters, while the available transit water quantity is 0.34 billion cubic meters, which shows that the availability is 4.02%. So, the total amount of water resources available in the city is apparently 1.86 billion cubic meters. In 2015, the total water consumption in Guiyang was 1.51 billion cubic meters. So, in Guiyang, WC < 1, which means it is in a reasonable loading range. But since the policy of rational water resource utilization, the water consumption per unit of GDP in Guiyang has shown a generally reduced trend, which means water resources should be well taken care of; otherwise, they would soon be overloaded.

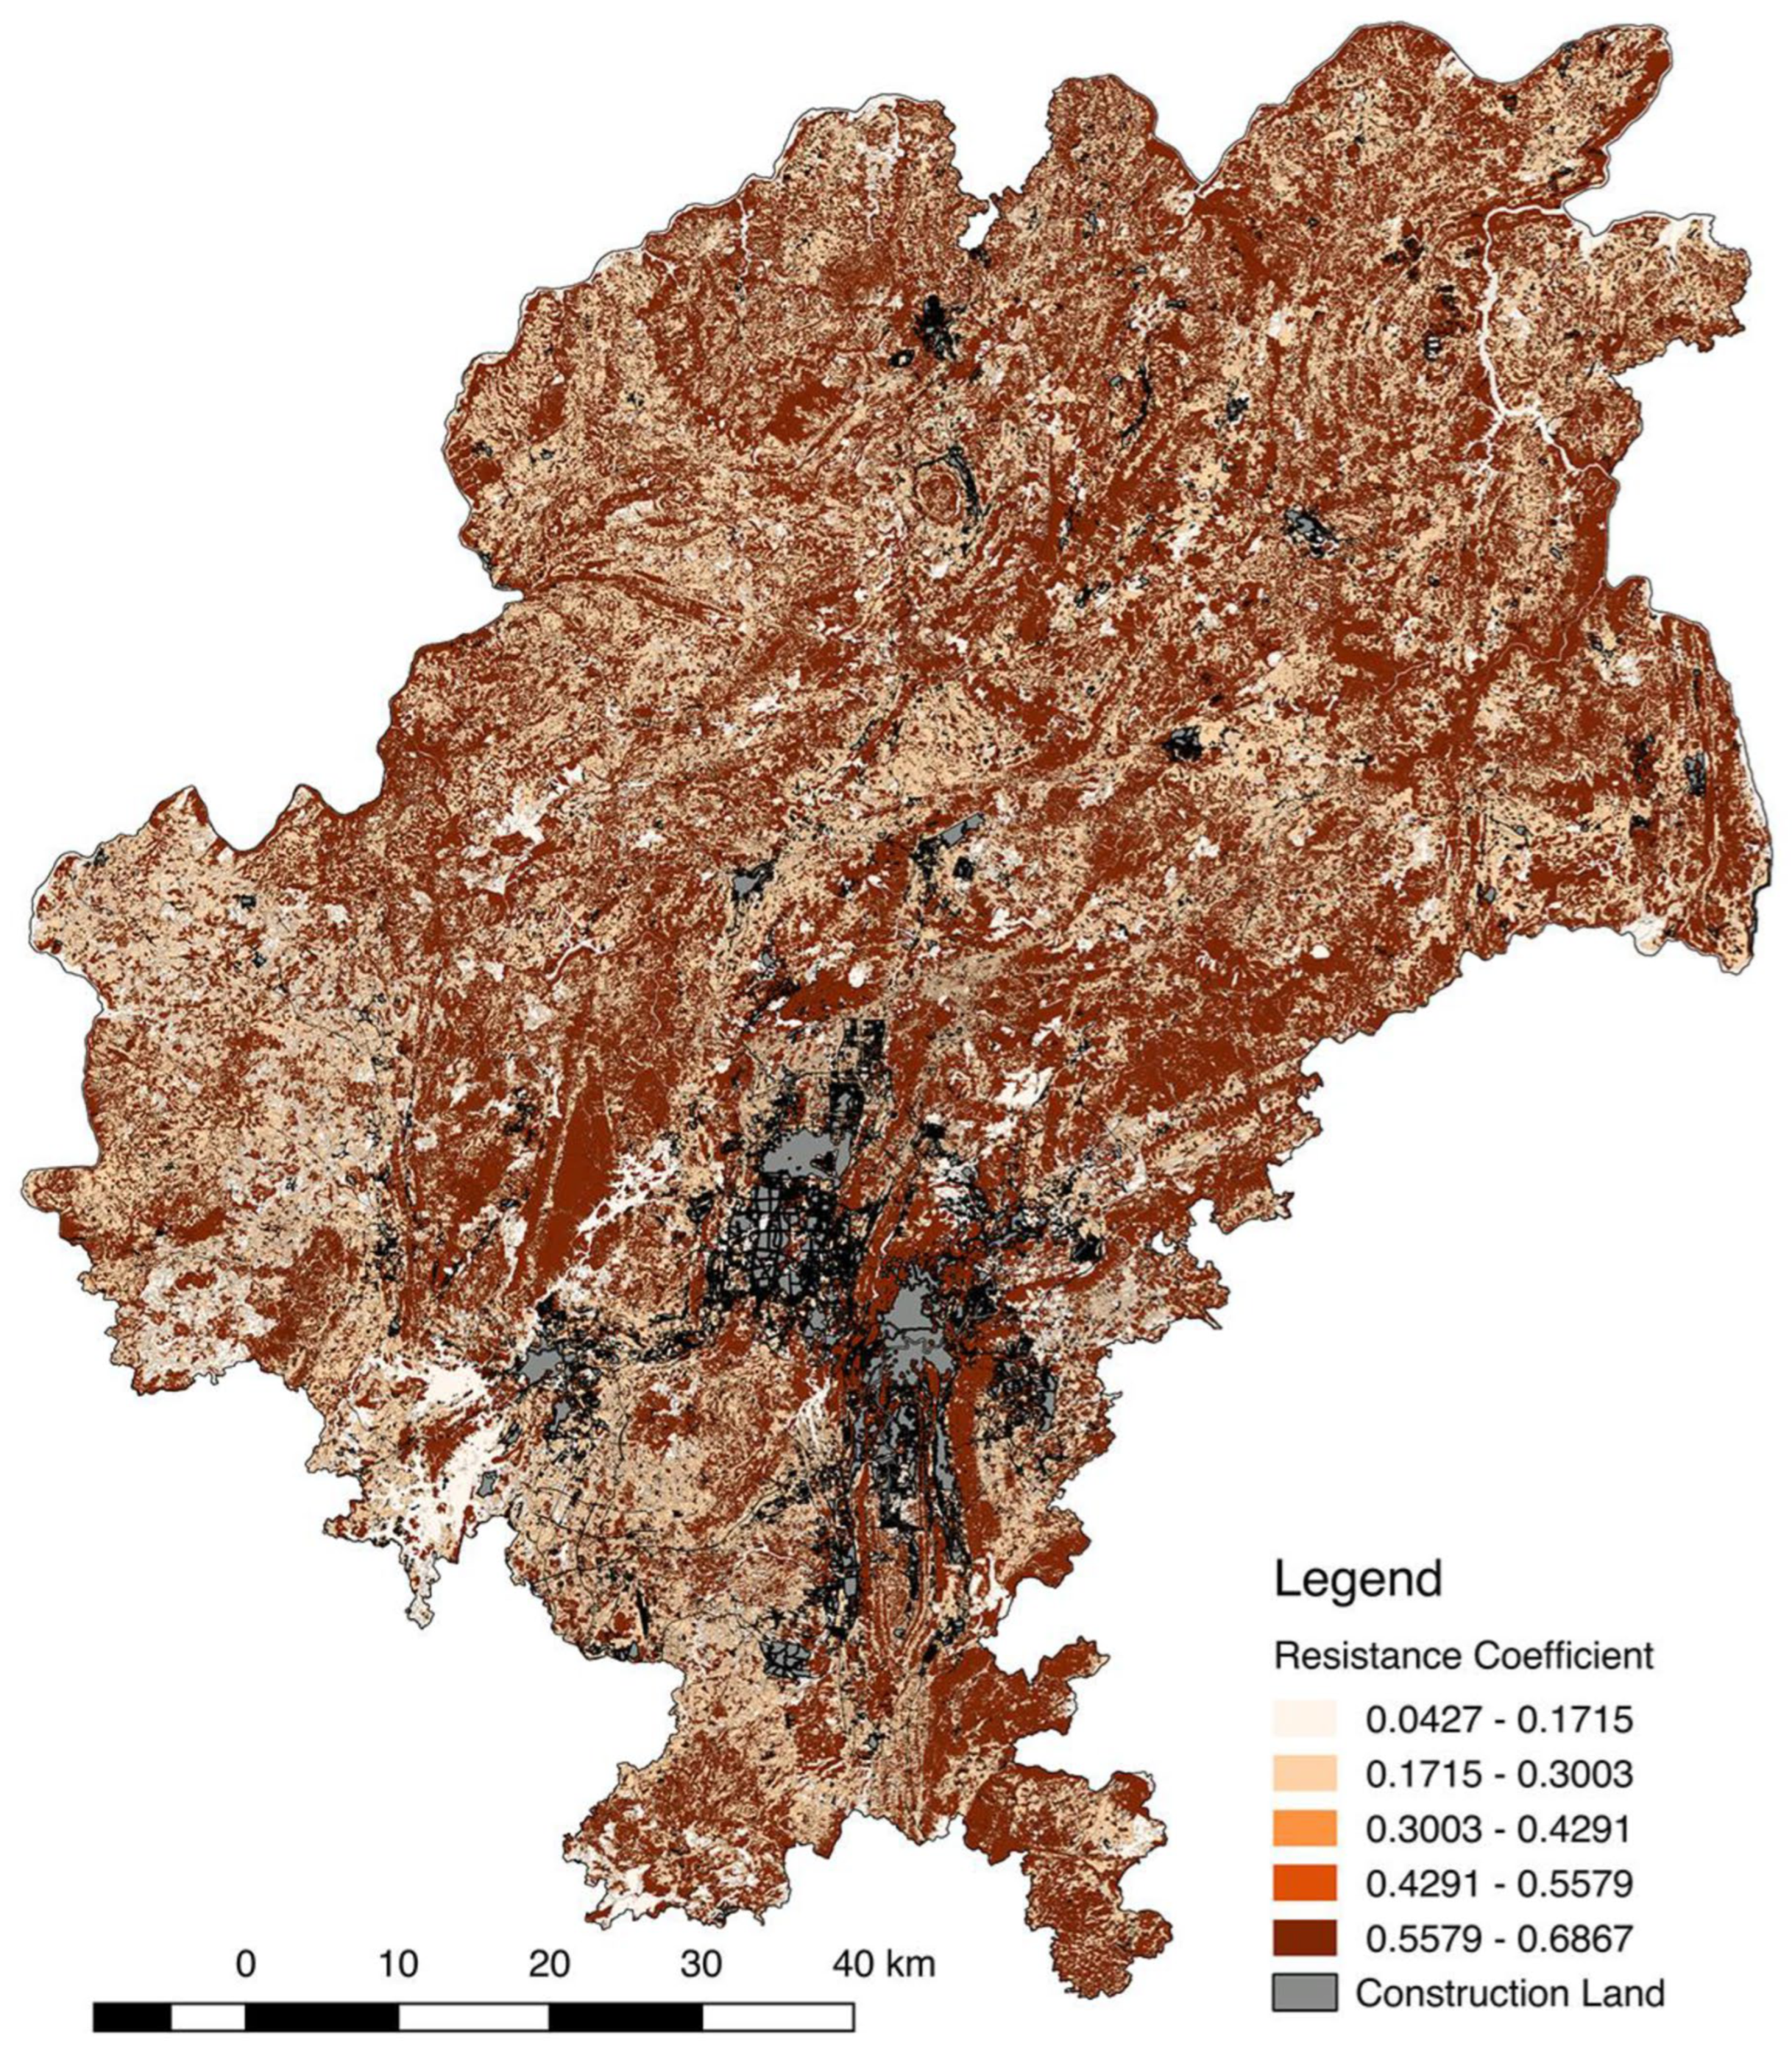
4.2.4. Urban Growth Resistance
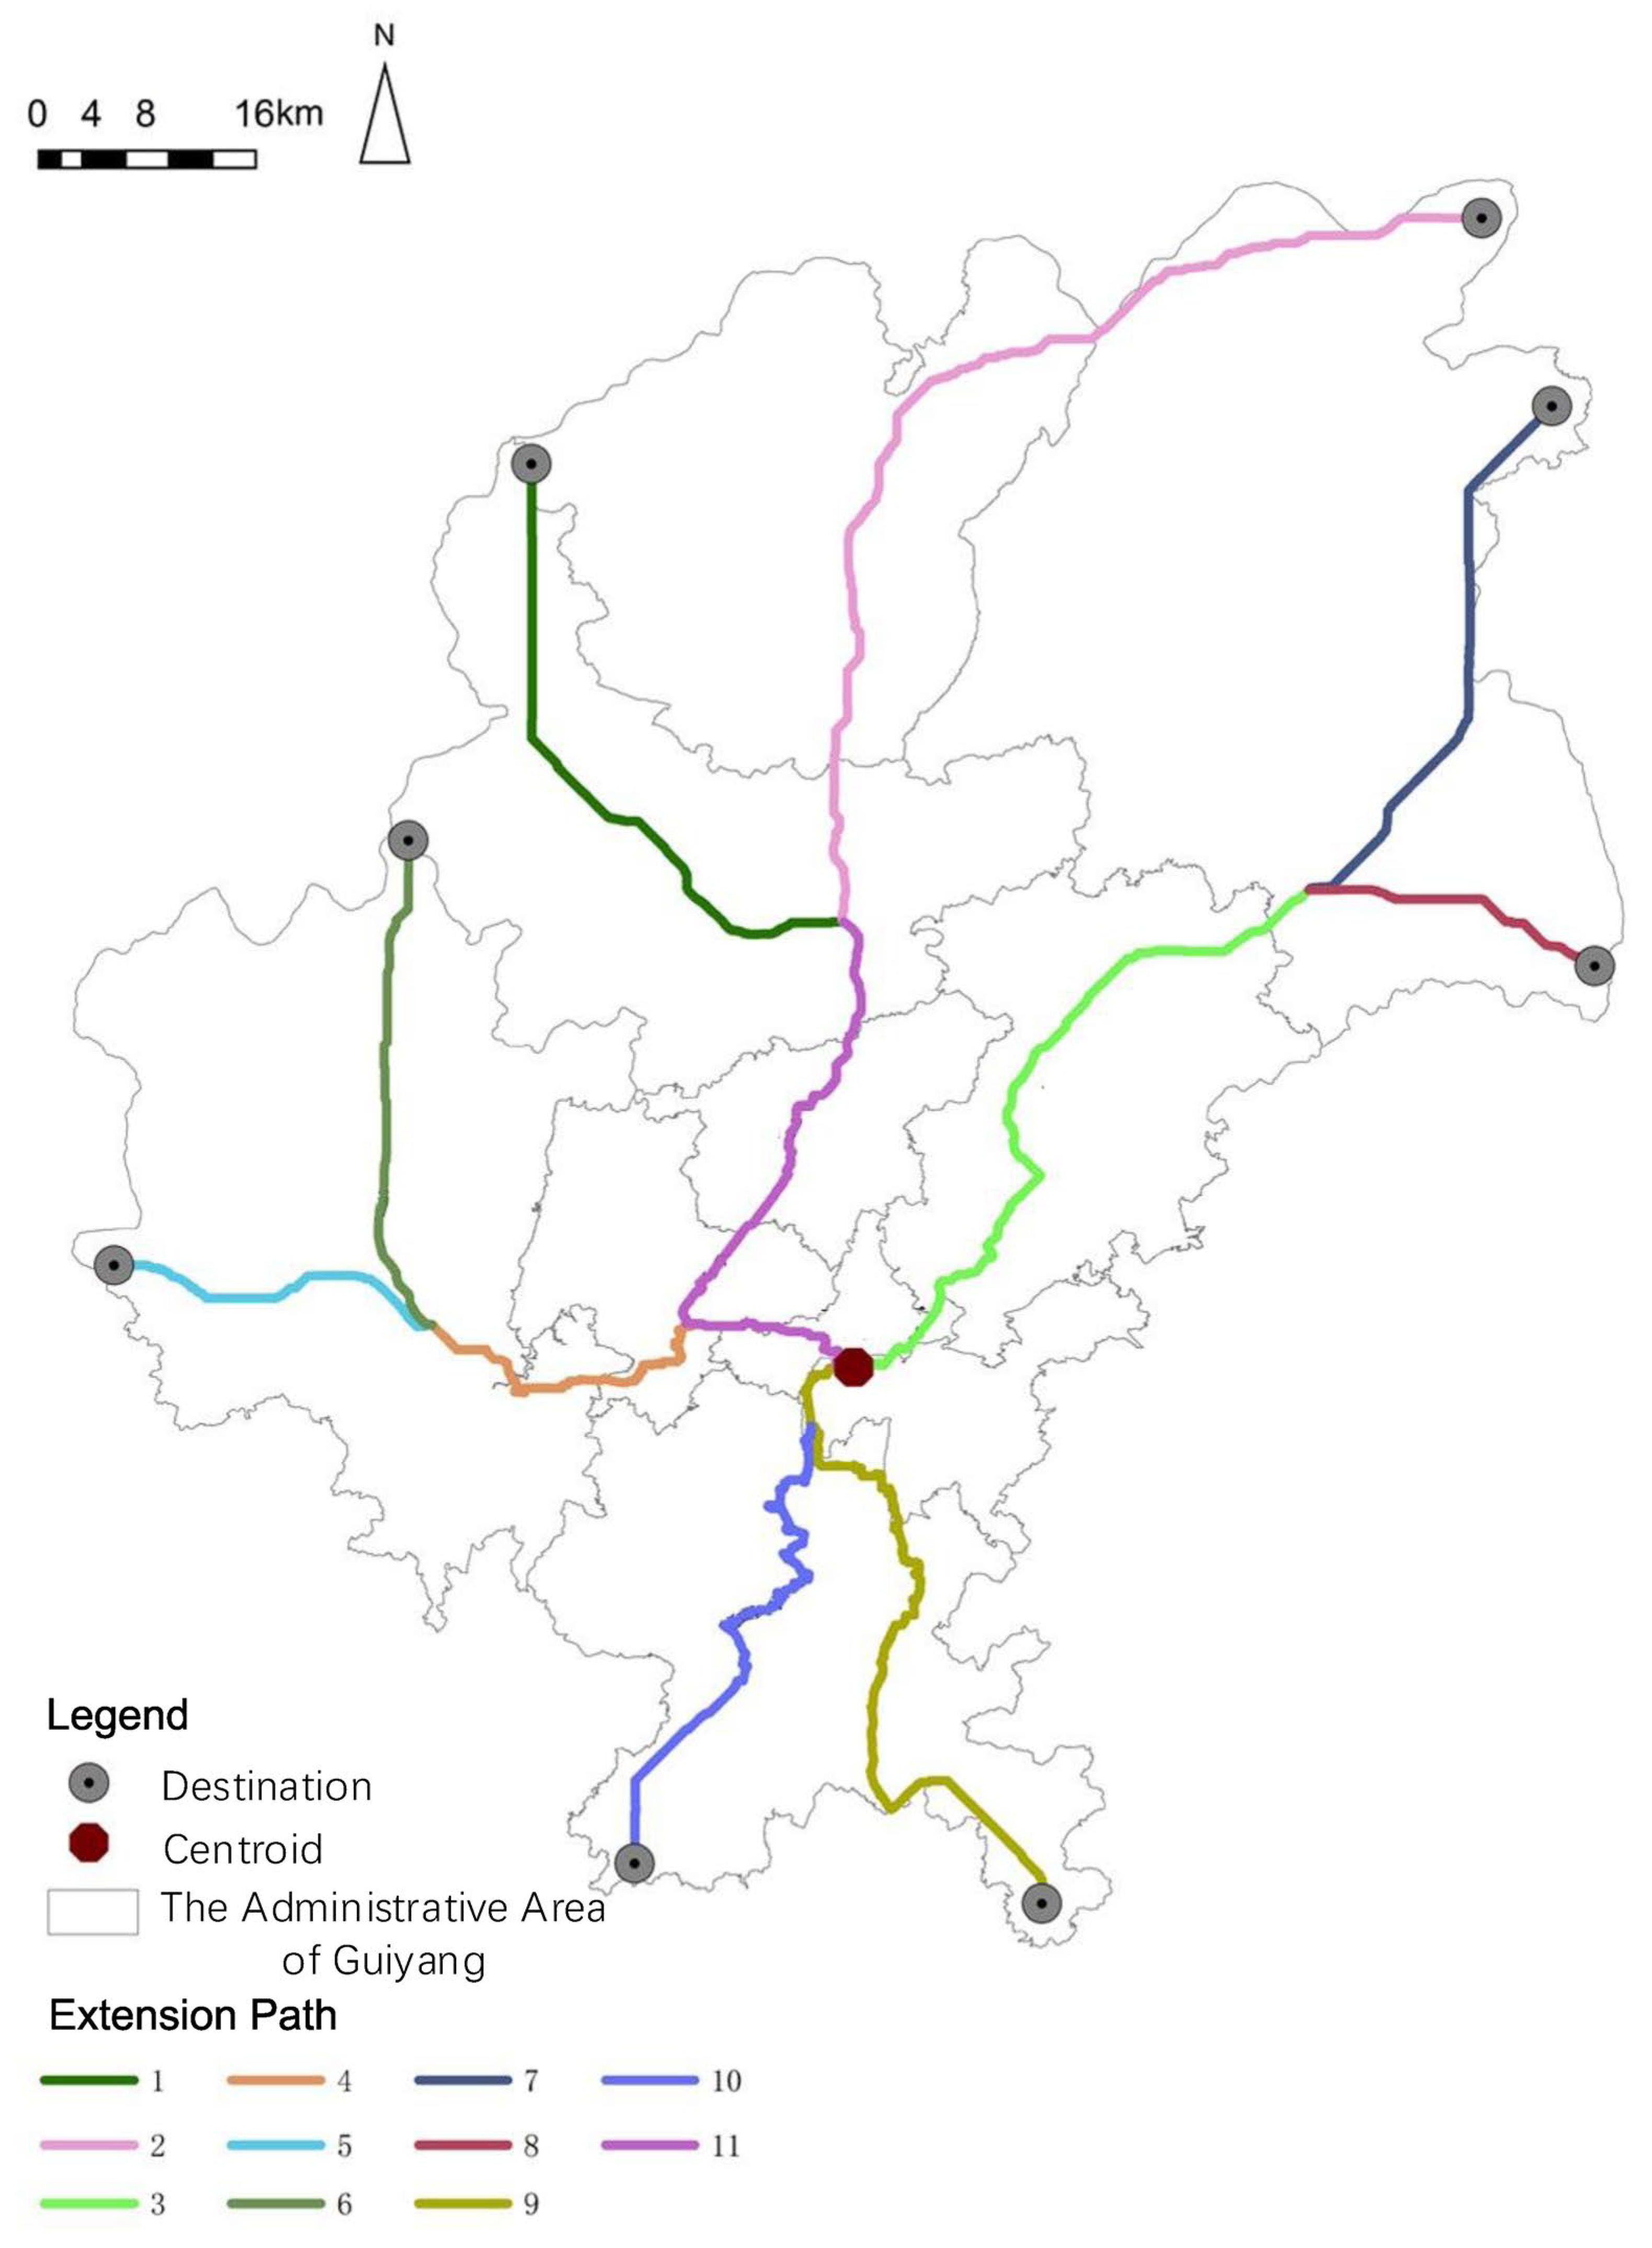
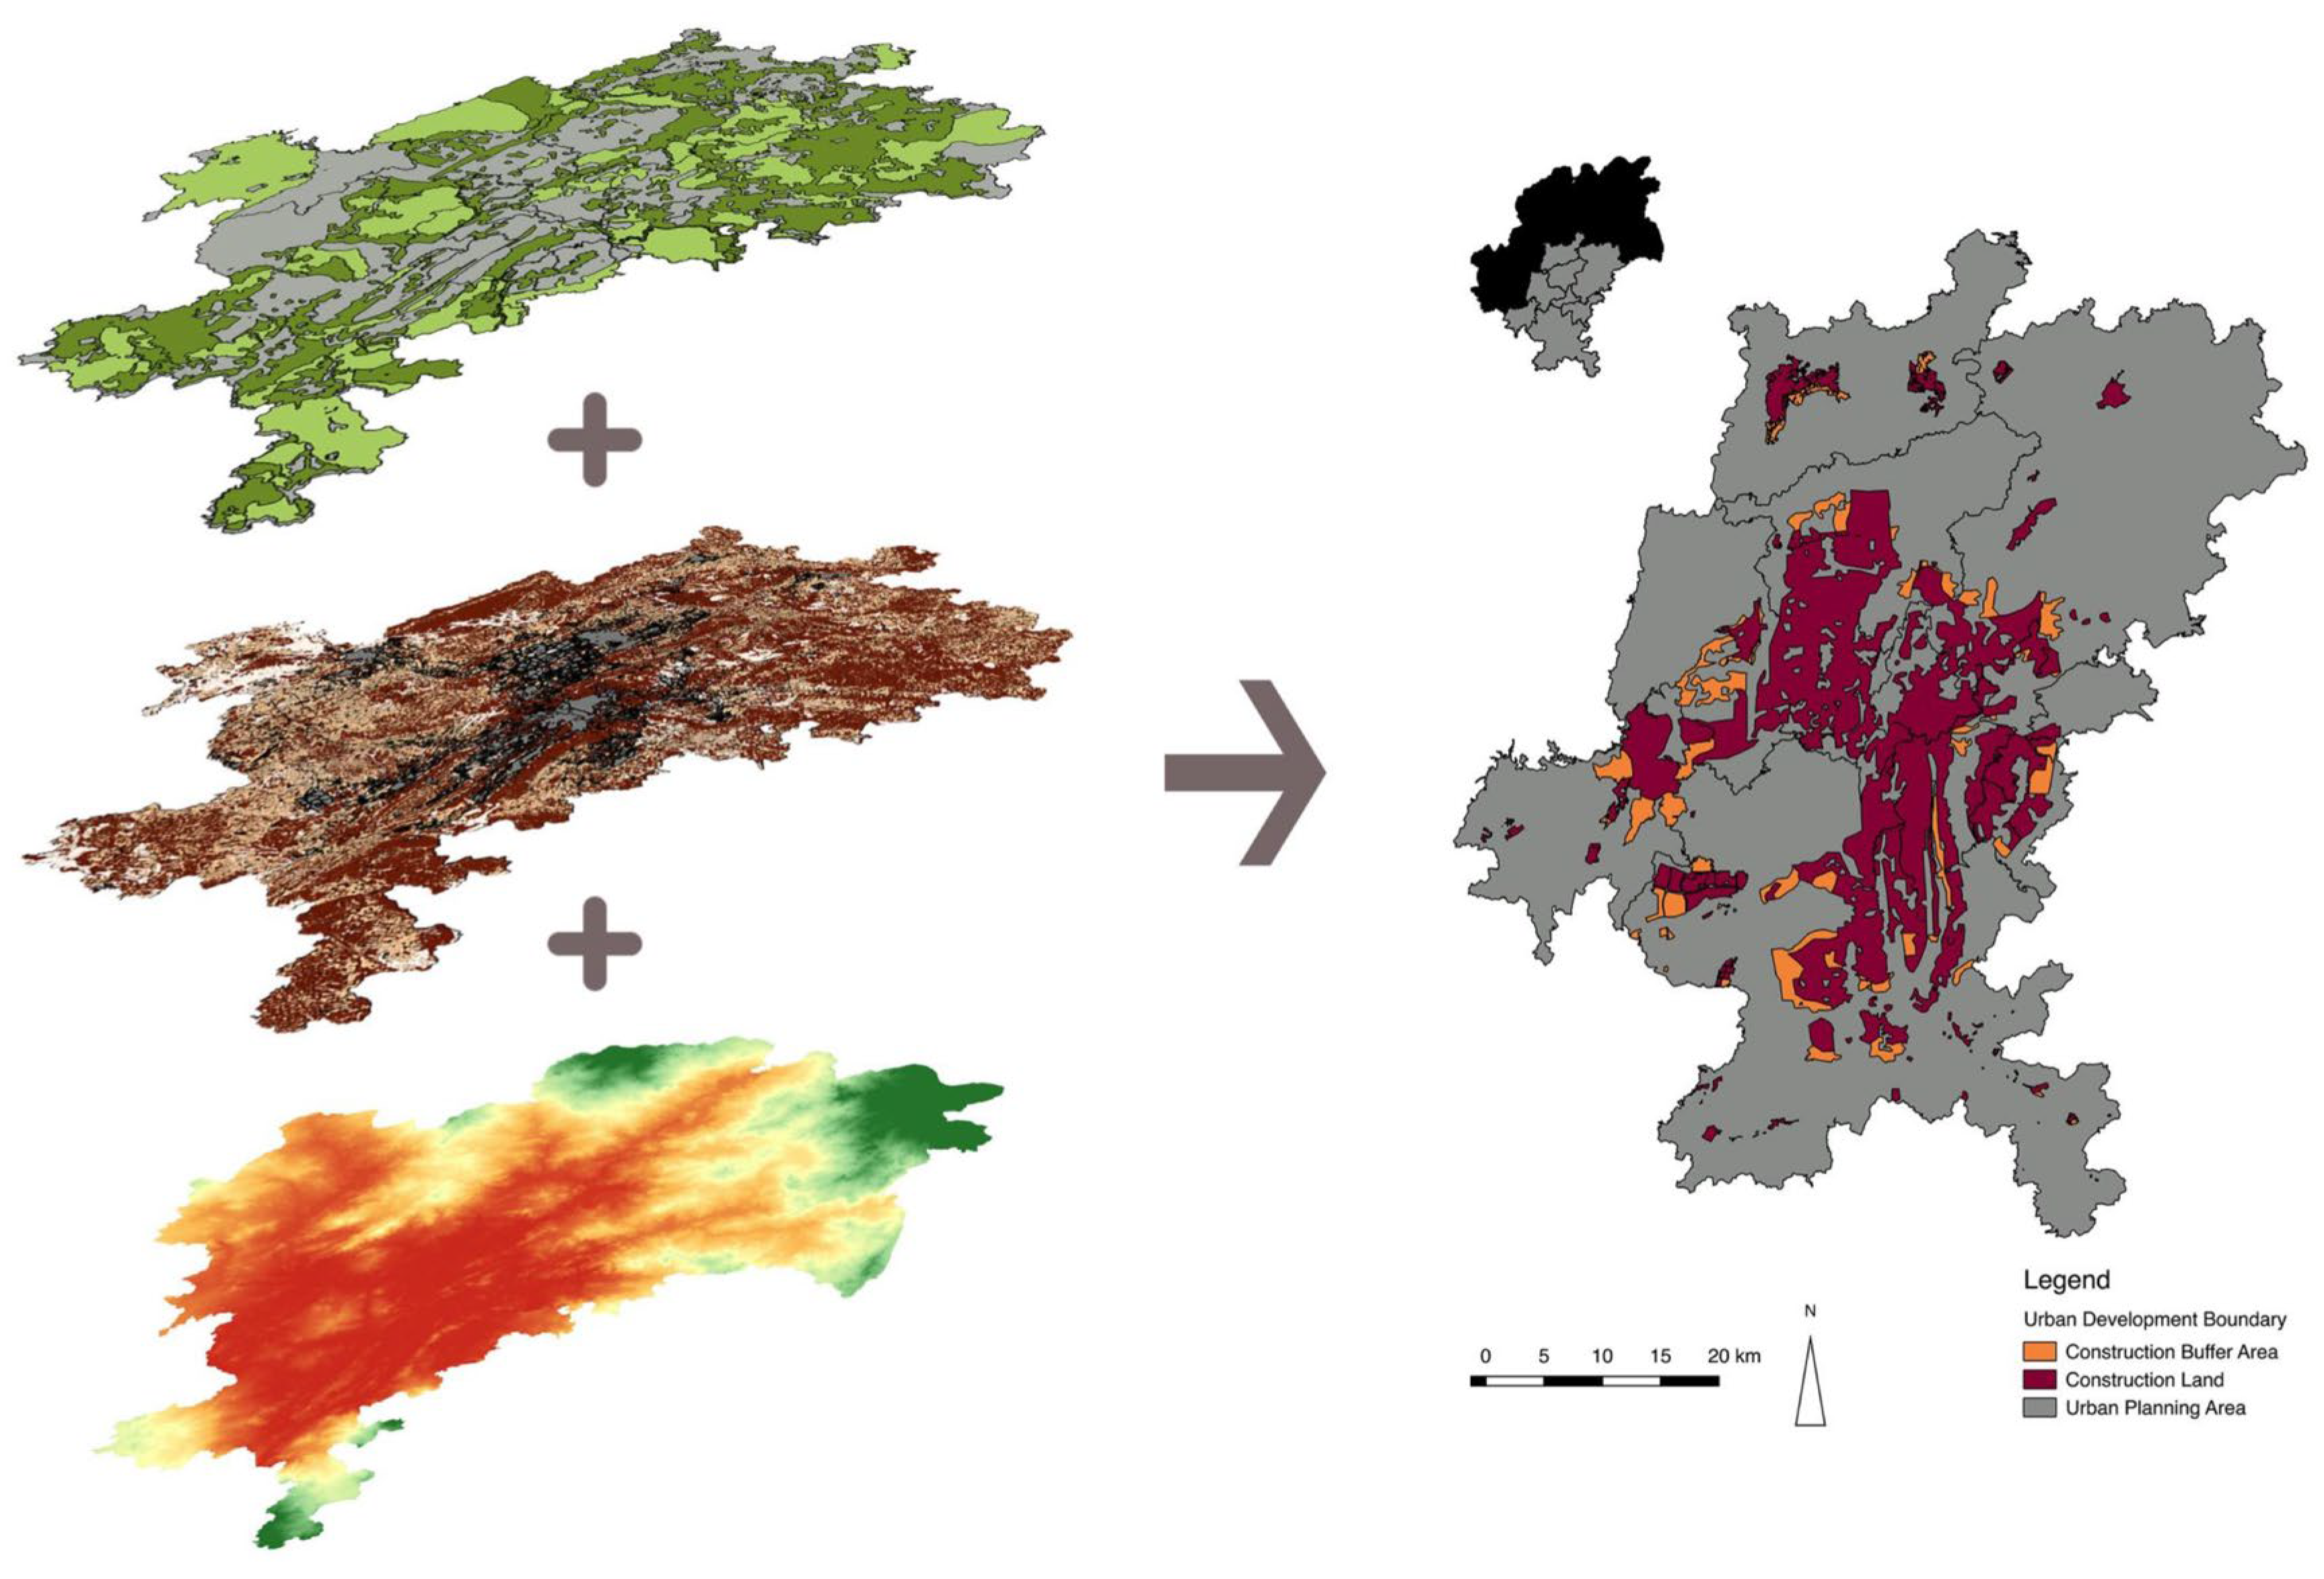
Remote sensing images from 2009 to 2014 of Guiyang and related ecological land regulations concerning ecological function enabled the selection of water and wetland, cultivated land, forest, and grassland as the main land types, which provide the Guiyang ecosystem service. Then, based on Chinese terrestrial ecosystems’ service function value coefficient, the contribution rate of ecological land’s ESV from 2009 to 2014 (Table 10) and the resistance coefficient (Table 11) were calculated.
Taking the physical middle point of the construction land in the urban planning area of Guiyang as an extension source, the utilization status map of Guiyang City planning area was set to a 30 m × 30 m grid, the resistance coefficient of different ecological land was introduced (Table 11; Figure 9), and the ArcGIS spatial analysis module spatial weights matrix was used to calculate the minimum accumulated resistance surface of the urban space. From the results, we can see in Figure 10 that the direction of urban development in Guiyang is mainly the northwest, northeast, and south, which is basically consistent with the direction of Guiyang City space development in history.
We assumed the physical midpoint of the urban built-up area as the “source” or “centroid”, the minimum cumulative cost resistance surface as the cost, and the high resistance massif of the minimum accumulated resistance surface as the remittance. Starting from the source and ending in the high resistance area, the optimization path suitable for the urban expansion of the study area was simulated, and the path was mainly extended to the low resistance value area (Figure 11). The choice of optimal path circumvents the ecological conflict zone of ecological land, which not only simulates the approach to urban space expansion but also preserves ecological land. The essence of it is to protect the ecological land. Therefore, the optimization path reflects the possible trend in urban expansion in the study area.

4.3. Result

With the combined data, Figure 12 could be derived, showing the direction in which the city would expand, given the four dimensions. Figure 9 shows that the urban planning area will expand mainly to the north, northwest, and northeast directions, where there is a lower developing resistance. Combining the results of all those four parts of the model, we got a conclusive result with an urban development boundary for the urban planning area of Guiyang City. Until 2030, the urban planning area of Guiyang would be 831.28 km2; since it is a city with many mountains, the area will be much larger than that in normally constructed cities (Table 12).

5. Conclusions and Discussion

This paper proposes and tests a novel boundary demarcation model designed to support the more equitable and sustainable governance of urban and rural spaces. The study yields the following key findings:
(1)
Theoretical framework and methodology: the established theoretical framework and methodology for the urban development boundary (UDB) delineation provide a macroscopic perspective that effectively mitigates “pancake-type” urban sprawl, making it particularly suitable for China’s urban–rural development context.
(2)
Comparative system and data platform: a comparative system for urban construction land use was developed, creating a unified data platform that facilitates boundary delineation and addresses existing expansion challenges.
(3)
Spatial game and comprehensive control: Urban expansion is characterized by a spatial game that balances economic and social benefits with environmental protection. The proposed model serves as a comprehensive spatial control tool, integrating urban carrying capacity and expansion resistance to meet development needs while safeguarding the environment. Unlike traditional approaches that rely solely on population growth predictions, this model separately forecasts residential, non-residential, and public land demands. Environmental protection is prioritized, reflecting China’s current development stage. The model first determines land conversion restrictions before assessing land demand. It also evaluates urban carrying capacity to identify the maximum population a city can sustain. The resistance coefficient, derived from the average contribution rate of ecosystem services across different periods, captures spatial and temporal variations in ecological land’s impact on urban expansion. The resulting output maps provide valuable insights into urban development directions and resistance levels, offering a rational approach to urban growth management.
(4)
Case study validation: The application of the model in Guiyang demonstrates the systematic and effective nature of its “four-dimensional” design.
However, several issues warrant further research: (1) the model currently identifies recommended development directions but lacks detailed land-use control plans; (2) managing urban development boundaries requires dynamic spatial governance, rather than static geographic delineation; (3) implementing a comprehensive set of supporting policies, including sanctions, licenses, and access mechanisms, remains a significant challenge; (4) risk identification and prevention strategies post-boundary demarcation need further exploration.
Although this study obtained some findings, some limitations still remain that warrant further research: (1) the model currently identifies recommended development directions but lacks detailed land-use control plans; (2) managing urban development boundaries requires dynamic spatial governance, rather than static geographic delineation; (3) implementing a comprehensive set of supporting policies, including sanctions, licenses, and access mechanisms, remains a significant challenge; (4) risk identification and prevention strategies post-boundary demarcation need further exploration. (5) Due to the limitation of data access, the study simplified certain aspects, which were likely not entirely descriptive of what urban growth is really all about. It might place limitations (e.g., high-quality infrastructure development, the dynamic interplay between land-use typologies, etc.) A more comprehensive analysis will be conducted in a future study. (6) Although we chose Guiyang as a case study for the validation of the model, it is still necessary to apply the model in more case studies to prove that the model is suitable in different contexts. We will examine more urban practices in future research.

Author Contributions

Conceptualization, M.W. and S.L.; methodology, W.T.d.V.; validation, Y.L.; formal analysis, H.B. and W.S. All authors have read and agreed to the published version of the manuscript.

Funding

This research was funded by the “Humanities and Social Science project of The Ministry of education of China”, grant number 23YJC630178, and the “Zhejiang Provincial Philosophy and Social Science Planning Project of China”, grant number 24NDJC321YBMS.

Data Availability Statement

The raw data supporting the conclusions of this article will be made available by the authors on request.

Acknowledgments

This research was based on the Project of UDB delineation of Guiyang City in China. Thanks are extended to the Guiyang Natural Resources Bureau for its strong support in providing data materials.

Conflicts of Interest

Author Wanchen Sang was employed by the company Zhejiang University Urban-Rural Planning & Design Institute. The remaining authors declare that the research was conducted in the absence of any commercial or financial relationships that could be construed as a potential conflict of interest.

References

  1. Normile, D. China’s living laboratory in urbanization. Science 2008, 319, 740–743. [Google Scholar] [CrossRef] [PubMed]
  2. Song, X.; Zhang, Z.; Wang, Z.; Liu, Y. Development vs. conservation in limited urban sprawl:an integrated framework for resolving the urban boundary dilemma in china. J. Geogr. Sci. 2024, 34, 1371–1393. [Google Scholar] [CrossRef]
  3. Chen, Y.; Li, X.; Wang, S.; Liu, X.; Ai, B. Simulating urban form and energy consumption in the Pearl River Delta under different development strategies. Ann. Assoc. Am. Geogr. 2013, 103, 1567–1585. [Google Scholar] [CrossRef]
  4. Jiang, P.; Cheng, L.; Li, M.; Zhao, R.; Huang, Q. Analysis of landscape fragmentation processes and driving forces in wetlands in arid areas: A case study of the middle reaches of the Heihe River, China. Ecol. Indic. 2014, 46, 240–252. [Google Scholar] [CrossRef]
  5. Deng, X.; Huang, J.; Rozelle, S.; Zhang, J.; Li, Z. Impact of urbanization on cultivated land changes in China. Land Use Policy 2015, 45, 1–7. [Google Scholar] [CrossRef]
  6. Han, N.; Hu, K.; Yu, M.; Jia, P.; Zhang, Y. Incorporating Ecological Constraints into the Simulations of Tropical Urban Growth Boundaries: A Case Study of Sanya City on Hainan Island, China. Appl. Sci. 2022, 12, 6409. [Google Scholar] [CrossRef]
  7. Wang, S.-N.; Liu, C.-G.; Sun, W. Simulation research of urban development boundary based on ecological constraints: A case study of Nanjing. J. Nat. Resour. 2021, 36, 2913–2925. [Google Scholar]
  8. Bengston, D.N.; Youn, Y. Urban containment policies and the protection of natural area: The case of Seoul’s greenbelt. Ecol. Soc. 2006, 11, 3. [Google Scholar] [CrossRef]
  9. Gordon, D.L.A.; Vipond, S. Gross density and new urbanism. J. Am. Plan. Assoc. 2005, 71, 41–54. [Google Scholar] [CrossRef]
  10. Choudhury, B.; Alam, A.; Bansal, A.K. Delineating the growth boundary of indian cities: Projection of the urban footprints. Environ. Urban. Asia 2024, 15, 76–91. [Google Scholar] [CrossRef]
  11. Wassmer, R.W.; Baass, M.C. Does a more centralized urban form raise housing prices? J. Policy Anal. Manag. 2006, 25, 439–462. [Google Scholar] [CrossRef]
  12. Wang, J. Simulation of urban growth boundary under the guidance of stock development: A case study of Wuhan city. Land 2024, 13, 1174. [Google Scholar] [CrossRef]
  13. Araby, M.E. Urban growth and environmental degradation. Cities 2002, 19, 389–400. [Google Scholar] [CrossRef]
  14. Staley, S.; Mildner, G. Urban Growth Boundaries and Housing Affordability; Reason Public Policy Institute: Los Angeles, CA, USA, 1999. [Google Scholar]
  15. McKenzie, E. Constructing the Pomerium in Las Vegas: A case study of emerging trends in American gated communities. Hous. Stud. 2005, 20, 187–203. [Google Scholar] [CrossRef]
  16. Jaeger, W.; Plantinga, A.; Grout, C. How has Oregon’s land use planning system affected property values? Land Use Policy 2012, 29, 62–72. [Google Scholar] [CrossRef]
  17. Yang, X.; Bai, Y.; Che, L.; Qiao, F.; Xie, L. Incorporating ecological constraints into urban growth boundaries: A case study of ecologically fragile areas in the Upper Yellow River. Ecol. Indic. 2021, 124, 107436. [Google Scholar] [CrossRef]
  18. Bakshi, A.; Esraz-Ul-Zannat, M. Application of urban growth boundary delineation based on a neural network approach and landscape metrics for Khulna City, Bangladesh. Heliyon 2023, 9, e16272. [Google Scholar] [CrossRef]
  19. Zhang, X.; Liu, Y.; Liu, X.; Li, J.; Liu, G.; Yang, X. Applying sleuth for simulating urban expansion of hangzhou. Int. Soc. Opt. Photonics 2009, 7471, 747104. [Google Scholar]
  20. Sakieh, Y.; Amiri, B.J.; Danekar, A.; Feghhi, J.; Dezhkam, S. Simulating urban expansion and scenario prediction using a cellular automata urban growth model, SLEUTH, through a case study of Karaj City, Iran. J. Hous. Built Environ. 2015, 30, 591–611. [Google Scholar] [CrossRef]
  21. Tayyebi, A.; Pekin, B.K.; Pijanowski, B.C.; Plourde, J.D.; Doucette, J.S.; Braun, D. Hierarchical modeling of urban growth across the conterminous USA: Developing meso-scale quantity drivers for the Land Transformation Model. J. Land Use Sci. 2015, 8, 422–442. [Google Scholar] [CrossRef]
  22. Tayyebi, A.; Delavar, M.R.; Yazdanpanah, M.J.; Pijanowski, B.C.; Saeedi, S.; Tayyebi, A.H. A spatial logistic regression model for simulating land use patterns: A case study of the Shiraz Metropolitan area of Iran. In Advances in Earth Observation of Global Change; Springer: Amsterdam, The Netherlands, 2010; pp. 27–42. [Google Scholar]
  23. Tayyebi, A.; Pijanowski, B.C.; Tayyebi, A.H. An urban growth boundary model using neural networks, GIs and radial parameterization: An application to Tehran, Iran. Landsc. Urban Plan. 2011, 100, 35–44. [Google Scholar] [CrossRef]
  24. Tayyebi, A.; Pijanowski, B.C.; Pekin, B. Two rule-based urban growth boundary models applied to the Tehran metropolitan area, Iran. Appl. Geogr. 2011, 31, 908–918. [Google Scholar] [CrossRef]
  25. Tayyebi, A.; Perry, P.C.; Tayyebi, A.H. Predicting the expansion of an urban boundary using spatial logistic regression and hybrid raster–vector routines with remote sensing and GIS. Int. J. Geogr. Inf. Sci. 2014, 28, 639–659. [Google Scholar] [CrossRef]
  26. Xu, H.; Song, Y.; Tian, Y. Simulation of land-use pattern evolution in hilly mountainous areas of North China: A case study in Jincheng. Land Use Policy 2022, 112, 105826. [Google Scholar] [CrossRef]
  27. Zhang, D.; Liu, X.; Lin, Z.; Zhang, X.; Zhang, H. The delineation of urban growth boundaries in complex ecological environment areas by using cellular automata and a dual-environmental evaluation. J. Clean. Prod. 2020, 256, 120361. [Google Scholar] [CrossRef]
  28. Ouyang, X.; Xu, J.; Li, J.; Wei, X.; Li, Y. Land space optimization of urban-agriculture-ecological functions in the Changsha-Zhuzhou-Xiangtan Urban Agglomeration, China. Land Use Policy 2022, 117, 106112. [Google Scholar] [CrossRef]
  29. Tan, R.; Liu, Y.; Liu, Y.; He, Q. A literature review of urban growth boundary: Theory, modeling, and effectiveness evaluation. Prog. Geogr. 2020, 39, 327–338. [Google Scholar] [CrossRef]
  30. Zhuang, Z.; Li, K.; Liu, J.; Cheng, Q.; Gao, Y.; Shan, J.; Cai, L.; Huang, Q.; Chen, Y.; Chen, D. China’s New Urban Space Regulation Policies: A Study of Urban Development Boundary Delineations. Sustainability 2017, 9, 45. [Google Scholar] [CrossRef]
  31. Liang, X.; Liu, X.; Li, X.; Chen, Y.; Tian, H.; Yao, Y. Delineating Multi-Scenario Urban Growth Boundaries with a CA-Based FLUS Model and Morphological Method. Landsc. Urban Plan. 2018, 177, 47–63. [Google Scholar] [CrossRef]
  32. Yi, D.; Guo, X.; Han, Y.; Guo, J.; Ou, M.; Zhao, X. Coupling Ecological Security Pattern Establishment and Construction Land Expansion Simulation for Urban Growth Boundary Delineation: Framework and Application. Land 2022, 11, 359. [Google Scholar] [CrossRef]
  33. Dai, X.; Xu, Y. Research Progress of China’s Urban Growth Boundary from Perspective of Ecological Security Pattern. J. Hunan Ecol. Sci. 2021, 8, 82–88. [Google Scholar]
  34. Song, X. Defining of Urban Growth Boundaries Under the Constraints of Ecological and Food Safety Bottom-Lines—A Case Study of Wuhan, China; Wuhan University of Science and Technology: Wuhan, China, 2022. [Google Scholar]
  35. Liang, Z.; Cheng, D.; Ren, S. The application of anti-planning theory to tourism planning. For. Inventory Plan. 2008, 33, 103–106. [Google Scholar]
  36. He, L.; Du, Y.; Yu, M.; Wen, H.; Ma, H.; Xu, Y. A stochastic simulation-based method for predicting the carrying capacity of agricultural water resources. Agric. Water Manag. 2024, 291, 108630. [Google Scholar] [CrossRef]
  37. Dadashi, R.; Esmali-Ouri, A.; Mostafazadeh, R.; Haji, K. Multi-criteria evaluation of the environmental carrying capacity (ecc) of gharesou watershed in ardabil province to optimal utilization of watershed resource. Environ. Earth Sci. 2024, 83, 131. [Google Scholar] [CrossRef]
  38. Wei, W. Land Use Optimal Allocation Based on CLUE-S and MCR Model in Shiyang River Basin; Lanzhou University: Lanzhou, China, 2018. [Google Scholar]
  39. Knaapen, J.; Scheffer, M.; Harms, B. Estimating habitat isolation in landscape planning. Landsc. Urban Plan. 1992, 23, 1–16. [Google Scholar] [CrossRef]
  40. Dai, L.; Liu, Y.; Luo, X. Integrating the MCR and DOI Models to Construct an Ecological Security Network for the Urban Agglomeration around Poyang Lake, China. Sci. Total Environ. 2021, 754, 141868. [Google Scholar] [CrossRef]
  41. GB50137-2011; City Land Classification and Land-Use Planning and Construction Standard. Ministry of Housing and Urban Rural Development of the People’s Republic of China: Beijing, China, 2012.
Figure 1. Bounded rational approach.
Land 14 00859 g001
Figure 2. Theoretical logical framework of UDB.
Land 14 00859 g002
Figure 3. Framework of “Four-Dimensional” design.
Land 14 00859 g003
Figure 4. The framework of land demand.
Land 14 00859 g004
Figure 5. Residential land demand analysis process.
Land 14 00859 g005
Figure 6. Calculation of non-residential land demand (ND).
Land 14 00859 g006
Figure 7. Ecological delineation process.
Land 14 00859 g007
Figure 8. Environmental protection map of urban planning area in Guiyang.
Land 14 00859 g008
Figure 9. Resistance coefficient map of diverse ecological land in Guiyang.
Land 14 00859 g009
Figure 10. Urban developing order of Guiyang.
Land 14 00859 g010
Figure 11. Urban extension direction of Guiyang.
Land 14 00859 g011
Figure 12. Urban development boundary of urban planning area in Guiyang.
Land 14 00859 g012
Table 1. Models widely used in UGB delineation.
Methodological TypeSpecific Examples of This Type
Cellular automata (CA) [19,20]SLEUTH
CA-Markov
Constrained CA
Hierarchical rules and logistic regression [21,22]CLUE-S
Spatial logistic regression (SLR)
Evolution trees
BP artificial neural networks (ANNs) [23]
Two-rule based spatial–temporal models [24]
Agent-based model (ABM)
Metroscope model
Table 2. Areas should be strictly prohibited outside the UDB.
Type of Ecological SpaceSpecific Area
Space with ecological functionThe core areas and buffer zones of various natural reserves, large river lakes, wetlands, mountains, forests, and other natural ecological patches, ecological environment sensitive areas, ecological environment fragile areas, etc.
Space with greater environmental riskHighly earthquake-prone areas, flood storage areas, and water- and soil-polluted areas.
Space for protection of important resources or heritageAreas such as scenic-spot protection areas, drinking water source protection areas, permanent basic farmland protection areas, important mineral reserve areas, geoparks, forest parks, important cultural relic protection areas, etc.
Other unsuitable space for urbanization developmentAn unsuitable area caused by topography, foundation, and climatic conditions.
Table 3. Overview of the “Four-Dimensional” UDB design.
Input RequirementProcess RequirementsOutput Type
(1) Land demand predictionPopulation (P), per capita consumption standard (Cs), pilot ratio/building density (Pr), land development multiplier (Lm). R D = P × C s × P r × L m
Unit:
RD—km2
P—person
Cs—m2/capita
Residential land demand (RD) in km2
Employment in various domains (Eijk), average employment space demand (SD), corresponding construction area of different types of employment (Cj), pilot ratio/building density (Pr). N D = E i j k S D C j P r
Unit:
ND—km2
Eijk—person
SD—m2/capita
Cj—m2
Non-residential land demand (ND) in km2
Equal to sum of residential land demand plus non-residential land demand.PD = ND + RD
Unit:
PD—km2
Public land demand in km2
LD = ND + RD + PD = 2ND + 2RDTotal land demand in km2
(2) “Environment Protection Priority” delineationLand cover map, public restrictions map, urban planning map, drinking water conservation map, cultural relics protection planning, forestry protection planning, map of mineral-intensive area, map of nature reserve area, map of geological disaster areas, etc.Combine (union) of all restricted areas; calculate total area and indicate the spatial location of all restricted areasA map with number of square meters within administrative boundaries on which conversion can take place within harming the environment or infringing the environmental restrictions
(3) Carrying capacity calculationUrban size of a city (A), basic farmland area within the urban administrative boundary (BF), ecological land area (E), and construction land per capita (P). L C = A B F E P
Unit:
LC—person
A—km2
BF—km2
E—km2
P—m2 per capita
Land carrying capacity (LCC): affordable number of residents and workers for the urban planning area and whole city
Total reasonable utilization capacity of water in the area (Wt), the total water consumption in the area (Wi). W C = W t W i
Unit:
Wt, Wi—m3
Water resource carrying capacity (WRCC): the result shows that if the water resource is in reasonable loading range
(4) Urban growth resistanceData base in ArcGIS models, ecosystem service function value coefficient table.
The value coefficient of the jth ecological service of the ith ecosystem (ESVij), and the area of the i-type ecosystem (Ai).
E S V = i m j n E S V i j A i
R i = A V E R E S V i t i = n t = m E S V i t
Unit:
Ai—km2
A map with color gradation to show the possibility of urban growth direction
Table 4. Residential land demand of Guiyang City and its urban planning area.
AreaIn Year 2020In Year 2030
Guiyang City10.1531.15
Urban planning area8.61529.75
Unit: km2.
Table 5. Non-agricultural employment increment in Guiyang City and its urban planning area.
Area Guiyang CityUrban Planning Area
2020203020202030
ManufacturingChemical manufacturing industry3.73.92.83.2
Machine processing industry36.639.228.232.4
Metal processing106.1113.681.893.9
Food and medicine219.4235169.3194.3
Architecture129.0141.499.5116.9
Transportation and communication142.2240.5109.7198.9
Retail and wholesale282.7714.4218.2590.7
Finance and real estate23.850.118.441.4
Other357.8761.2276.1629.4
Total1301.22299.21004.11901.1
Unit: thousands.
Table 6. Average area needed per industry type per staff member.
IndustrySquare Meters
Chemical manufacturing industry66.89
Machine processing industry27.87
Metal processing39.02
Food and medicine58.53
Architecture54.81
Transportation and communication174.19
Retail and wholesale115.20
Finance and real estate34.37
Other57.60
Table 7. Prediction of newly increased non-residential land demand in Guiyang und its urban planning area.
Area20202030
Guiyang City74.63134.22
Urban Planning Area56.93110.98
Unit: km2.
Table 8. Forecast of public land demand in Guiyang City and its urban planning area.
Area20202030
Guiyang City84.78165.37
Urban Planning Area64.51140.73
Unit: km2.
Table 9. Synthesis of construction land demand.
AreaYearResidential LandNon-Residential LandPublic LandTotal
Guiyang City202010.1574.6384.78169.57
203031.15134.22165.37330.73
Urban Planning Area20208.6256.9364.51130.05
203029.75110.98140.73281.45
Unit: km2.
Table 10. Contribution rate of ecological land’s ESV at different periods in Guiyang.
YearWater and WetlandForestGrasslandCultivated Land
20090.069553590.685963330.042804970.20167811
20100.071452890.685564410.042627080.20035562
20110.071665420.686004080.042835640.19949486
20120.071776040.686806570.042815940.19860144
20130.071859190.687512030.042691120.19793766
20140.072149770.688477670.042481870.19689069
Table 11. Resistance coefficient of diverse ecological land in Guiyang.
Land TypeResistance CoefficientResistance Classification
Water and wetland0.07140948Low
Forest0.68672135High
Grassland0.04270944Low
Cultivated land0.19915973Middle
Table 12. Result of UDB of Guiyang.
201320202030
Present ScaleUrban Development ScaleNewly Increased ScaleUrban Development ScaleNewly Increased Scale
Area549.95686.95130.05831.28281.33
Unit: km2.
Disclaimer/Publisher’s Note: The statements, opinions and data contained in all publications are solely those of the individual author(s) and contributor(s) and not of MDPI and/or the editor(s). MDPI and/or the editor(s) disclaim responsibility for any injury to people or property resulting from any ideas, methods, instructions or products referred to in the content.

