Article

Analysis of Spatial Layout Influencing Factors in National Forest Tourism Villages: A Case Study of Liaoning Province

1
Department of Public and Social Management Research, Party School of the CPC Dalian Municipal Committee, Dalian 116013, China
2
School of Architecture and Fine Art, Dalian University of Technology, Dalian 116024, China
3
UniSA Creative, University of South Australia, Adelaide, SA 5000, Australia
*
Author to whom correspondence should be addressed.
Land 2025, 14(4), 857; https://doi.org/10.3390/land14040857
Submission received: 8 March 2025 / Revised: 8 April 2025 / Accepted: 12 April 2025 / Published: 14 April 2025
(This article belongs to the Special Issue The Role of Land Policy in Shaping Tourism Development)

Abstract

:
Forests, as tourism resources with ecological and aesthetic value, play a significant role in rural development. Forest villages, which rely on forest resources, are an essential component of rural construction. Studying the spatial distribution characteristics and influencing factors of national forest villages within provincial administrative areas provides valuable insights into the sustainable development of rural tourism and the achievement of rural revitalization goals. This study examines 125 national forest villages in Liaoning Province. Based on the data on the geographical locations of the villages and their related influencing factors collected during the period from May to December 2024, spatial indices such as the nearest neighbor index, Gini index, and kernel density have been analyzed using mathematical statistics and ArcGIS spatial analysis methods. Additionally, this research investigates various factors influencing the distribution of forests and rural areas, as well as the interaction mechanisms among these factors. The results indicate the following. (1) The spatial distribution of national forest villages in Liaoning Province is clustered and uneven, with a pattern of “dense in the east and west, sparse in the middle”. (2) The number of forest villages in Liaoning Province is generally positively correlated with forest coverage, temperature, rainfall, road network density, and river network density. Conversely, it is negatively correlated with economic development level, population density, total population, and altitude. (3) Geographical exploration results suggest that economic development level and forest coverage rate are the most significant factors affecting the spatial differentiation of forest and rural areas in Liaoning Province. Interaction analysis reveals that river network density and forest coverage rate have the strongest combined effect, followed by total economic output and forest coverage rate.

1. Introduction

In recent years, China’s rapid urbanization has led to significant rural population loss. The fragmentation of rural land and severe environmental pollution have introduced various systemic ecological risks. To promote sustainable rural development and transform rural areas into regional complexes integrating tourism, ecology, and industry, the Chinese government introduced the “National Forest Countryside” strategy following the implementation of the rural revitalization strategy and the construction of beautiful villages. National forest villages have relatively high forest coverage rates and biological diversity. Rational distribution of national forest villages can not only promote the development of rural tourism, forest health, and other industries but also protect the rural ecological environment [1]. In view of this situation, the National Forestry and Grassland Administration launched a collection of “National Forest Countryside” in 2019 [2]. As of January 2025, two rounds of selection have been completed, recognizing a total of 7586 villages as national forest villages.
A forest village is an ecologically livable settlement with an excellent environment, distinctive pastoral characteristics, strong forestry presence, significant forest functions, well-developed forestry industries, a clean living environment, and effective management [3]. As a tourism resource, forests offer ecological, recreational, and health-related benefits, forming the foundation for forest village development. The construction of national forest villages promotes the sustainable utilization of forest resources, supports tourism development, and contributes to rural industrial upgrading.
A forest village is a concept of an organic combination of forest and villages and also an ecological countryside tourism site based on forest resources [4]. The concept of “national forest villages” was first proposed in 2019. Currently, the relevant departments have not yet established an effective system for collecting and monitoring tourism resource data; at the same time, local tourism development is still in the preliminary exploration stage, and large-scale standardized resource integration and evaluation data have not yet been formed. A few scholars have studied the tourism value of forest countryside from the perspective of landscape science. For example, Ahn explored the method of transforming rural forest landscape resources into tourism resources [5]. Senetra used the landscape assessment method for evaluation and concluded that both forest cover and rural landscape are key factors affecting rural tourism [6].

1.1. Literature Review

In recent years, global attention to ecotourism has continued to rise, and scholars have started to explore the relationship between the layout of cities, forests, and rural areas from the perspective of tourism resources. Some scholars believe that the village and the city are interdependent and restricted by each other, and the planning and layout of the two should be regarded as a unified whole [7]. Once the phenomenon of reverse urbanization occurs, land use, hydrology, climate, and other factors will change, which will affect the overall style of the village and the original ecological tourism resources and even lead to a decrease in food production [8]. Excessive urbanization will produce high-density land development [9,10] and excessive infrastructure construction [8], which will destroy high-quality agricultural land and ecological environment, thus weakening the sustainable development ability of rural tourism [11]. Based on the above reasons, experts believe that forests should be built in the suburbs of cities as a buffer zone connecting the city and the village, so as to promote green tourism and new ruralism to the village [12]. In 2014, some experts believed that forests and villages around cities have a high correlation with urban life because of their location characteristics. Therefore, tourism, ecology, environment, aesthetics, and other values in forest and rural areas should be valued [13]. It is necessary to rationally plan and manage forest villages to ensure sustainable urban development [14].
In the context of forest village tourism, scholars have studied the factors related to forest village protection and development from different disciplinary perspectives and believe that urban and forest villages should be different in the process of planning and protection: the construction of forest village needs to break through traditional ecological theories to plan, implement, and monitor it [15]. In the planning process, we should make full use of the river as a link between the urban landscape and the rural landscape. From the perspective of architectural culture, surveys of residents and tourists show that the protection and development of characteristic villages require public participation and joint development indicators [16]. From the perspective of spatial balance, some scholars believe that tourism activities are related to various environmental factors [17]. It is necessary to study and optimize these influencing factors and make use of the existing conditions to enable tourism to cooperate with urban planning, environmental protection, transportation, the economy, and other departments [18]. At present, many theories have been put forward to analyze the factors affecting the spatial distribution of rural tourism. For example, the concepts of land use, environmental protection, and capacity carrying are taken as the starting point to explain the coupling relationship between these concepts and rural tourism development. In terms of land use, through the prediction of regional land use, the change in land use in the future is analyzed, so as to determine the core tourist attractions in the planning area [19]. In terms of capacity carrying, a comprehensive assessment of planned land use is carried out from the aspects of economy, environment, culture, and society, so as to determine the maximum carrying capacity of a region and determine the development intensity of regional tourism [20]. In terms of ecological protection, KhaerulAmru conducted a sampling survey in Padang District of Bali, identified the environmental problems existing in the study area through descriptive analysis, and based on this, analyzed the root causes of the problems [21].
With the development of computer technology, geographic information systems (GIS) are widely used in rural land spatial analysis. Based on this, some scholars have analyzed issues such as agricultural protection [22], rural traffic [23], forest and rural landscape, and rural space accessibility [24]. Kim G W et al. used the MaxEnt model to determine the key factors of forest distribution in traditional Korean villages, including population density, forest coverage rate, precipitation, and daily temperature difference, to provide a basis for forest and rural protection planning [25]. Meng et al. [26] studied rural forest tourism in Poland and explained the impact of tourists’ behavior and motivation on the development of urban tourism spatial structure. Kearney combined GIS and CNN to conduct road detection on forest road networks in western Canada and used remote sensing technology to evaluate problematic roads after training, and the prediction accuracy was greater than 85% [27]. Wijana analyzed the tourism development potential of Kallang Assen Town in Bali based on ecological statistical analysis [28]. Some scholars have analyzed the impact of rural layout on tourism resources from different spatial scales, focusing on the spatial evolution of tourism resources [29], natural landscape [30], and rural land use [31].

1.2. Research Aim and Hypotheses

To date, the research on national forested village tourism sites is limited. Although some scholars have analyzed the spatial distribution characteristics of China’s national forest villages on a macro scale, these studies lack research on the interactions between influencing factors, making it difficult to reveal the key driving mechanisms of forest village development in different regions. This limitation makes it difficult to accurately identify the core differences among cities in forested village construction and their causes, thus affecting scientific decision-making and policy optimization. Therefore, this study aims to explore the formation mechanism of the spatial pattern of forest townships. It fills the gap of existing research in the analysis of spatial distribution influencing factors and their comprehensive effects.
Because the factors driving the distribution of forest villages are highly relevant to geographical locations [32], in the stage of geographical probe, this study draws on relevant research results [33,34,35] to explore the spatial differentiation of forest and rural tourism sites in Liaoning Province from the three most important dimensions of natural environmental conditions, social and economic level, and forest and rural tourism endowment. In terms of natural conditions, suitable temperature, sufficient precipitation, and low altitude enhance regional ecological attractiveness, especially in areas with high river network density. These factors are usually positively correlated to promote the agglomeration of tourism sites [36,37]. However, the high altitude may limit development and make the distribution tend to be dispersed. In terms of social economy, economically developed areas often have perfect infrastructure and service capabilities to meet tourism needs. However, high population density may have a negative impact on the ecology, while low population density may result in low market demand, showing non-linear effects [38,39,40]. In terms of forest and rural tourism endowments, high forest coverage rates and good road network density as rural tourism endowments directly improve regional tourism attraction and enhance transportation accessibility, thus promoting the agglomeration of tourism sites [41,42,43,44]. Therefore, the below three hypotheses were proposed:
H1: 
In the area with a suitable climate and high density of river network, the lower altitude is conducive to the concentrated distribution of tourism sites.
H2: 
Economically developed areas with moderate population density are more likely to form the agglomeration effect of tourism sites.
H3: 
Even if the ecological conditions of the area with convenient transportation are general, it can promote the density of the distribution of tourism sites.

2. Materials and Methods
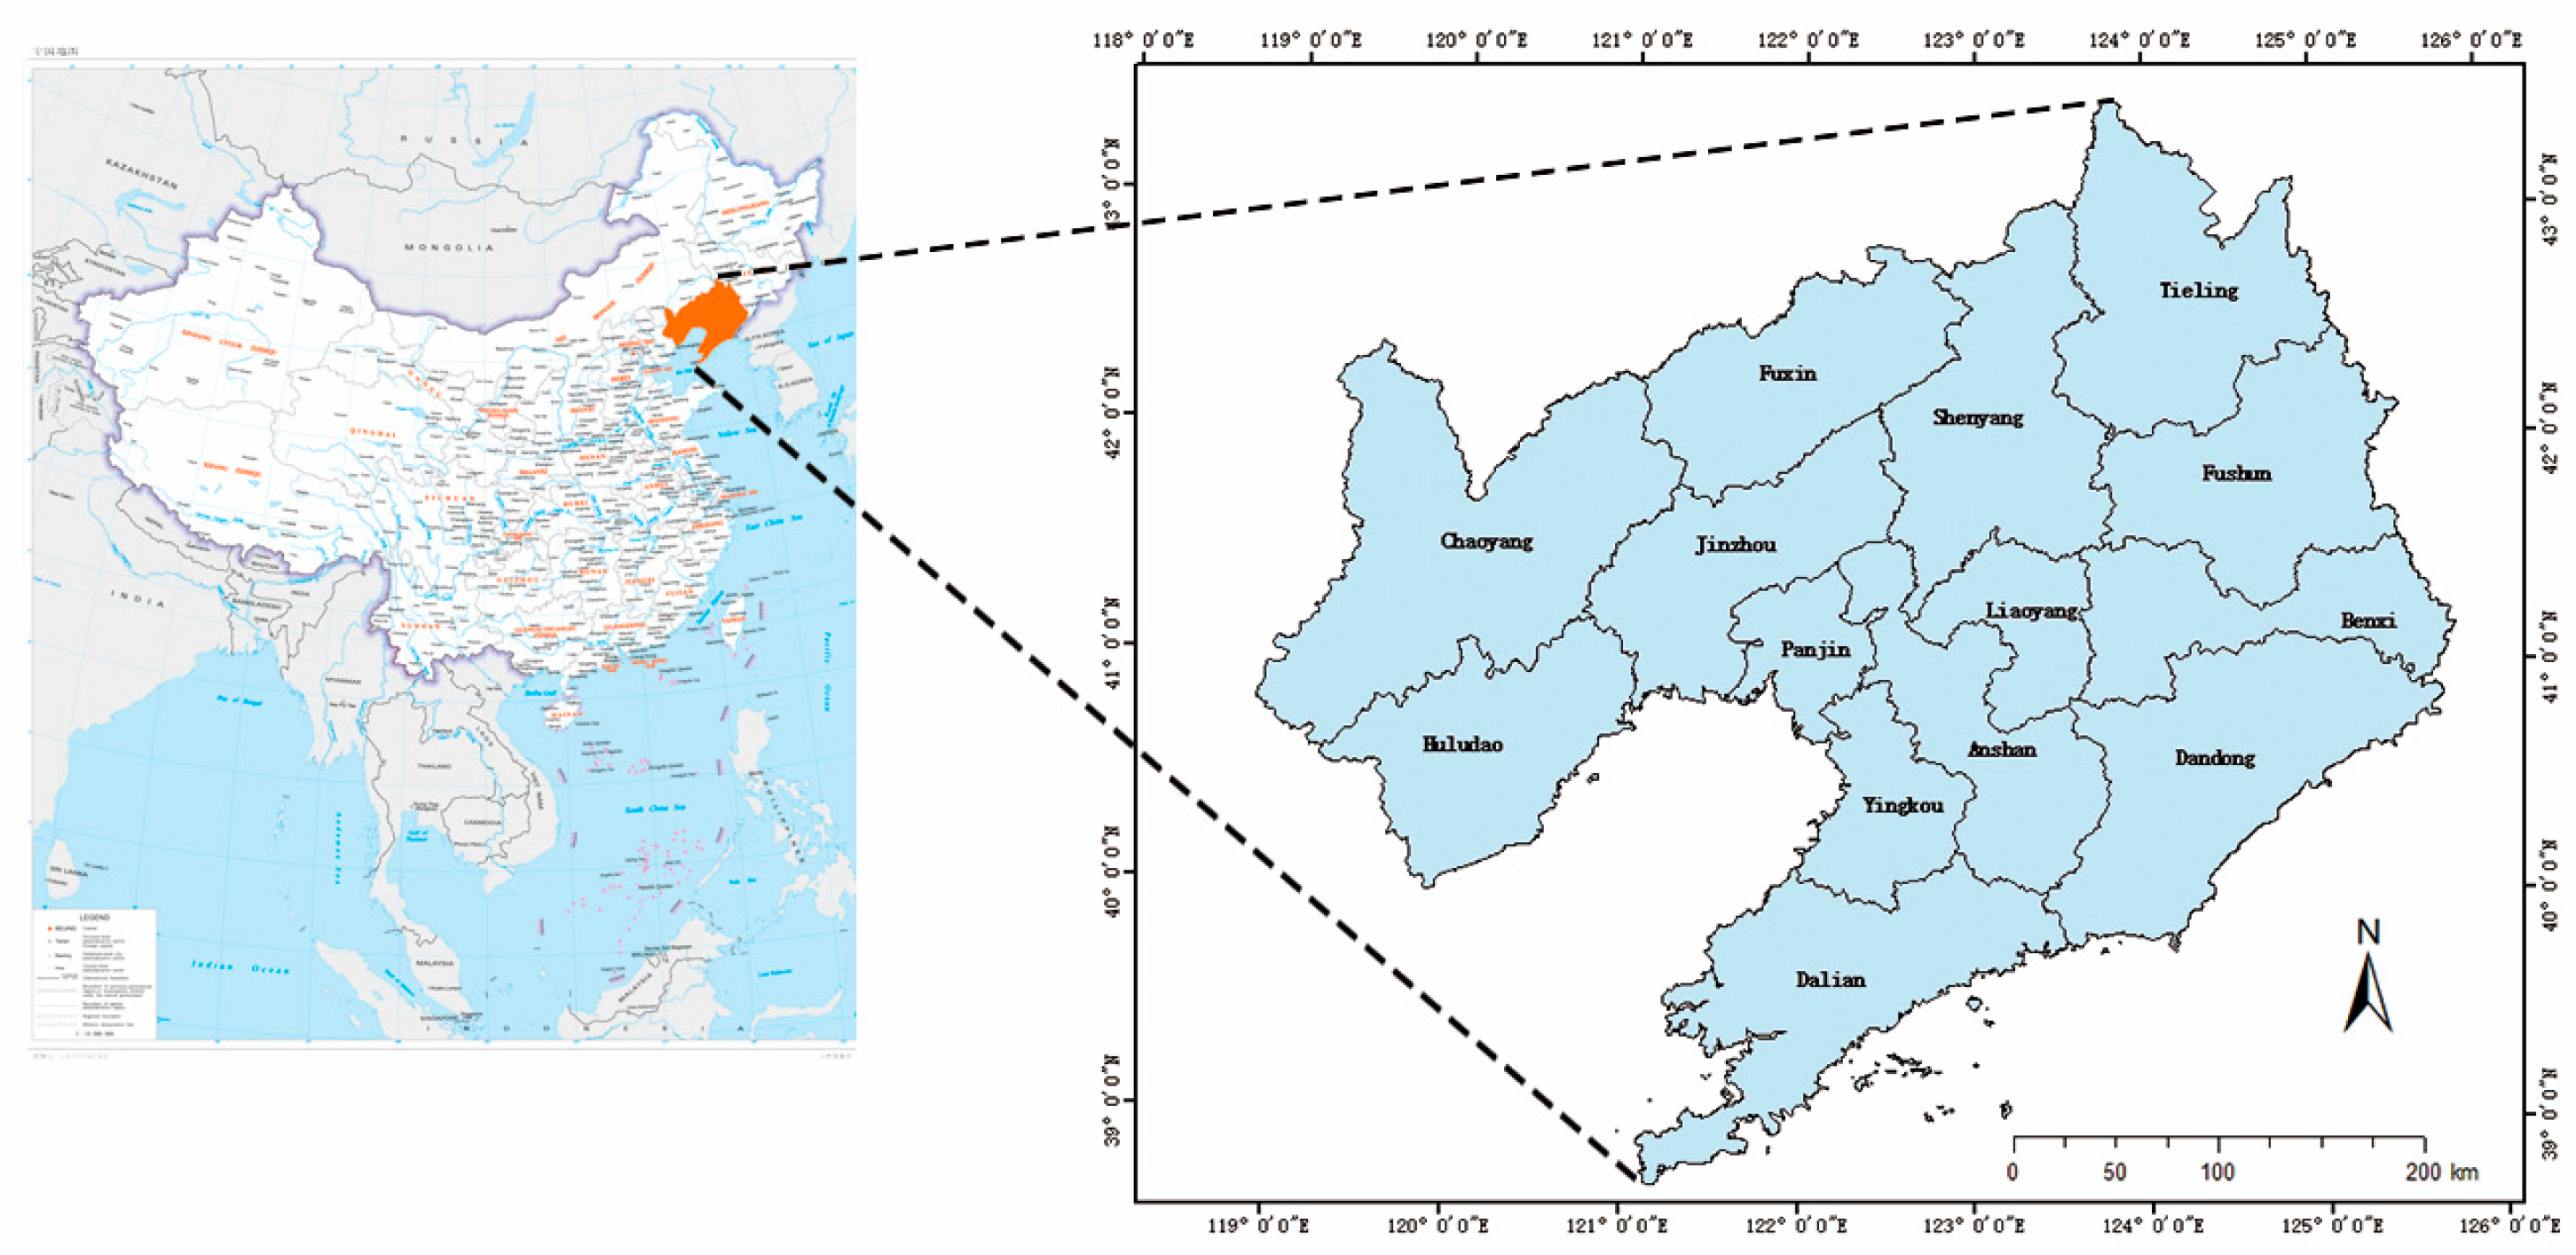
2.1. Study Area

Liaoning Province (38°43′–43°26′ N, 118°53′–125°46′ E) is located in northeast China, with a total area of 148,000 square kilometers and a population of about 42.6 million. Liaoning Province has a temperate monsoon climate with an average annual temperature of 7–11 °C and precipitation of 400–1000 mm (Figure 1).
The province has jurisdiction over 14 municipal administrative regions, including 13 prefecture-level cities, 1 sub-provincial city, and a total of 100 county-level administrative regions. With a forest coverage rate of about 40%, forest resources are mainly distributed in the mountainous areas of eastern Liaoning and the hilly areas of western Liaoning, which are closely related to the spatial layout of rural areas in the province and constitute an important basis for ecological barrier and economic development. The forest village in Liaoning province is not only the core area of agricultural production and ecological protection but also an important carrier to promoting rural revitalization. However, affected by factors such as population outflow, single industrial structure, and scattered spatial layout, some areas have problems such as idle land, weakening ecological functions, and insufficient economic development momentum. There are 125 forest villages in Liaoning Province, accounting for only 1.65% of the national total (Table 1). There is also an imbalance in the spatial distribution, and it is urgent to improve the utilization efficiency of forest resources through optimization and promote the coordinated development of ecology, economy, population, and industry.

2.2. Data Source and Processing

This study investigated 125 national forest villages in Liaoning Province and selected 9 factors including natural environment, social economy, and ecology to build the basic information database of forest villages in Liaoning Province using Python3.10 software and ArcGIS 10.2 software. Spatial analysis techniques, including the average nearest neighbor index, geographical concentration index, imbalance index, and kernel density analysis, were employed to assess the spatial distribution characteristics of these villages. Additionally, the geographic detector method was used to analyze the factors influencing the spatial distribution of national forest and rural areas, as well as their interactions.
A total of 125 villages in Liaoning province have been added to the National Forest Rural List by January 2025, according to the China Forestry and Grassland Administration (www.forestry.gov.cn, accessed on 1 December 2024). The following instructions apply. Use them as research objects. Search the village name through the Baidu map, determine the geographical coordinates of each village, and build the spatial database of forest village distribution in Liaoning province. Vector data sources of Administrative divisions, roads, and rivers of Liaoning Province and China Geographic Information Resources Directory Service System (www.webmap.cn, accessed on 5 December 2024) 1:100 geographic information data. The DEM (Digital Elevation Model) digital elevation data are used to reflect the relief features of the terrain digital elevation data that are derived from ASTER GDEM 30M data provided on the Geospatial Data Cloud website (www.gscloud.cn, accessed on 7 December 2024). Forest coverage rate, population statistics, and local economic development data are from the Liaoning Statistical Yearbook 2023, while annual average temperature and annual rainfall are from the China Meteorological Yearbook 2022.

2.3. Research Methods

2.3.1. Nearest Proximity Index

National forest villages are spatial point elements, and their spatial manifestations can be divided into random type, uniformity type, and agglomeration type [45]. The nearest neighbor index (NNI) is an index to measure the geographical features and spatial distribution pattern. It compares actual data with the nearest neighbor distance of completely random distribution to determine the spatial distribution of elements. Therefore, this study selects the nearest neighbor index for judgment [46]. Its expression is
R = r i r e ,     r e = 1 2 N / S
where N is the number of forest villages in Liaoning Province, S is the total area of Liaoning Province, re is the theoretical nearest distance, ri is the average of the actual nearest distance between villages, and R is the nearest proximity index, which determines the distribution type of fixed-point elements. When R = 1, the representation distribution is random. Where R > 1 means uniform distribution; R < 1, which means a concentrated distribution.

2.3.2. Geographical Concentration Index

The geographical concentration index is an important index to measure the concentration degree of research objects, and its expression is as follows:
G = 100 × i = 1 n X i T 2
where Xi is the number of forest villages in the i th city, T is the total number of forest villages in Liaoning Province, n is the number of cities, and G is the geographical concentration index. The value of G ranges from 0 to 100. The larger the value, the more concentrated the distribution of forest villages, and the smaller the value, the more discrete the distribution.

2.3.3. Imbalance Index

The imbalance index is a measurement method for the distribution balance of research objects in each research area, which can reflect the distribution balance of different urban forests and rural areas [47]. The expression is as follows:
s = i = 1 n Y i 50 ( n + 1 ) 100 n 50 ( n + 1 )
where n is the total number of cities, Yi is the proportion of the number of forest villages in each city in the total number of forest villages in Liaoning Province, and these proportions are arranged in the order from highest to bottom, where i represents the cumulative percentage of the i city. s is the imbalance index. The value of s ranges from 0 to 1. If s = 0, it means the distribution of forest villages is uniform; if s = 1, it means the distribution is concentrated.

2.3.4. Kernel Density Estimation

Kernel density analysis (KDE) is a function of estimating probability density [48]. KDE describes the spatial distribution density of geographic coordinates by means of non-parametric methods. The aggregation and dispersion in the study area can be identified and represented by nuclear density analysis [49]. Therefore, this method can identify the clustering trend of forest villages in cities. Its expression is
f ( x ) = 1 n h i = 1 n k ( x x i h )
In the formula, n is the total number of deep forest villages, xxi is the distance between sample point xi and valuation point x, h is the bandwidth, k is the kernel function, f(x) is the kernel density estimation, and the spatial distribution of forest villages can be intuitively seen.

2.3.5. Geographic Detector (Geodetector)

A geodetector is a statistical technique that aims to determine the extent to which a driver influences a target variable [50]. As a data spatial statistical analysis method, geodetector mainly analyzes the influence of environmental or geographical factors on specific phenomena. Its expression is
q = 1 1 N σ 2 h = 1 L N h σ h 2
In the formula, N and σ 2 represent the number and variance of forest villages, respectively, while Nh and σ h 2 represent the sample size and variance under the influence factors of Class h, and L is the classification number of influence factors of class h. The q value is between 0 and 1, and the closer the q value is to 1, the stronger the spatial explanatory power of the influencing factors to the forest village.

3. Overall Distribution and Characteristics of National Forest Villages in Liaoning Province

3.1. Distribution Type Results

The spatial distribution of 125 forest villages in Liaoning Province is represented by point elements on the map, and the ArcGIS10.2NNI method (Formula (1)) is used to calculate the distribution of forest villages in Liaoning Province. The calculated result is R = 0.7254 < 1. Where the average observation distance is 13.83 km, the expected average distance is 19.07 km, the significance level p = 0.00, and the absolute value of Z is 5.87. This value is relatively large, indicating that there is a relatively large deviation between forest village and random distribution. The results show that the spatial distribution of national forest villages in Liaoning Province is clustered. From the point of view of distribution quantity, the national forest rural distribution area is in Liaodong Peninsula and Liaodong mountain area, accounting for 70.4%, while the distribution amount is less in the middle area of Liaodong. According to the tourism data in 2023 released by the government (www.ln.gov.cn/), the annual total number of tourists received by Liaodong Peninsula accounts for 51.6% of the total number of the province, which also reflects the correlation between forest and rural distribution and tourism resources.

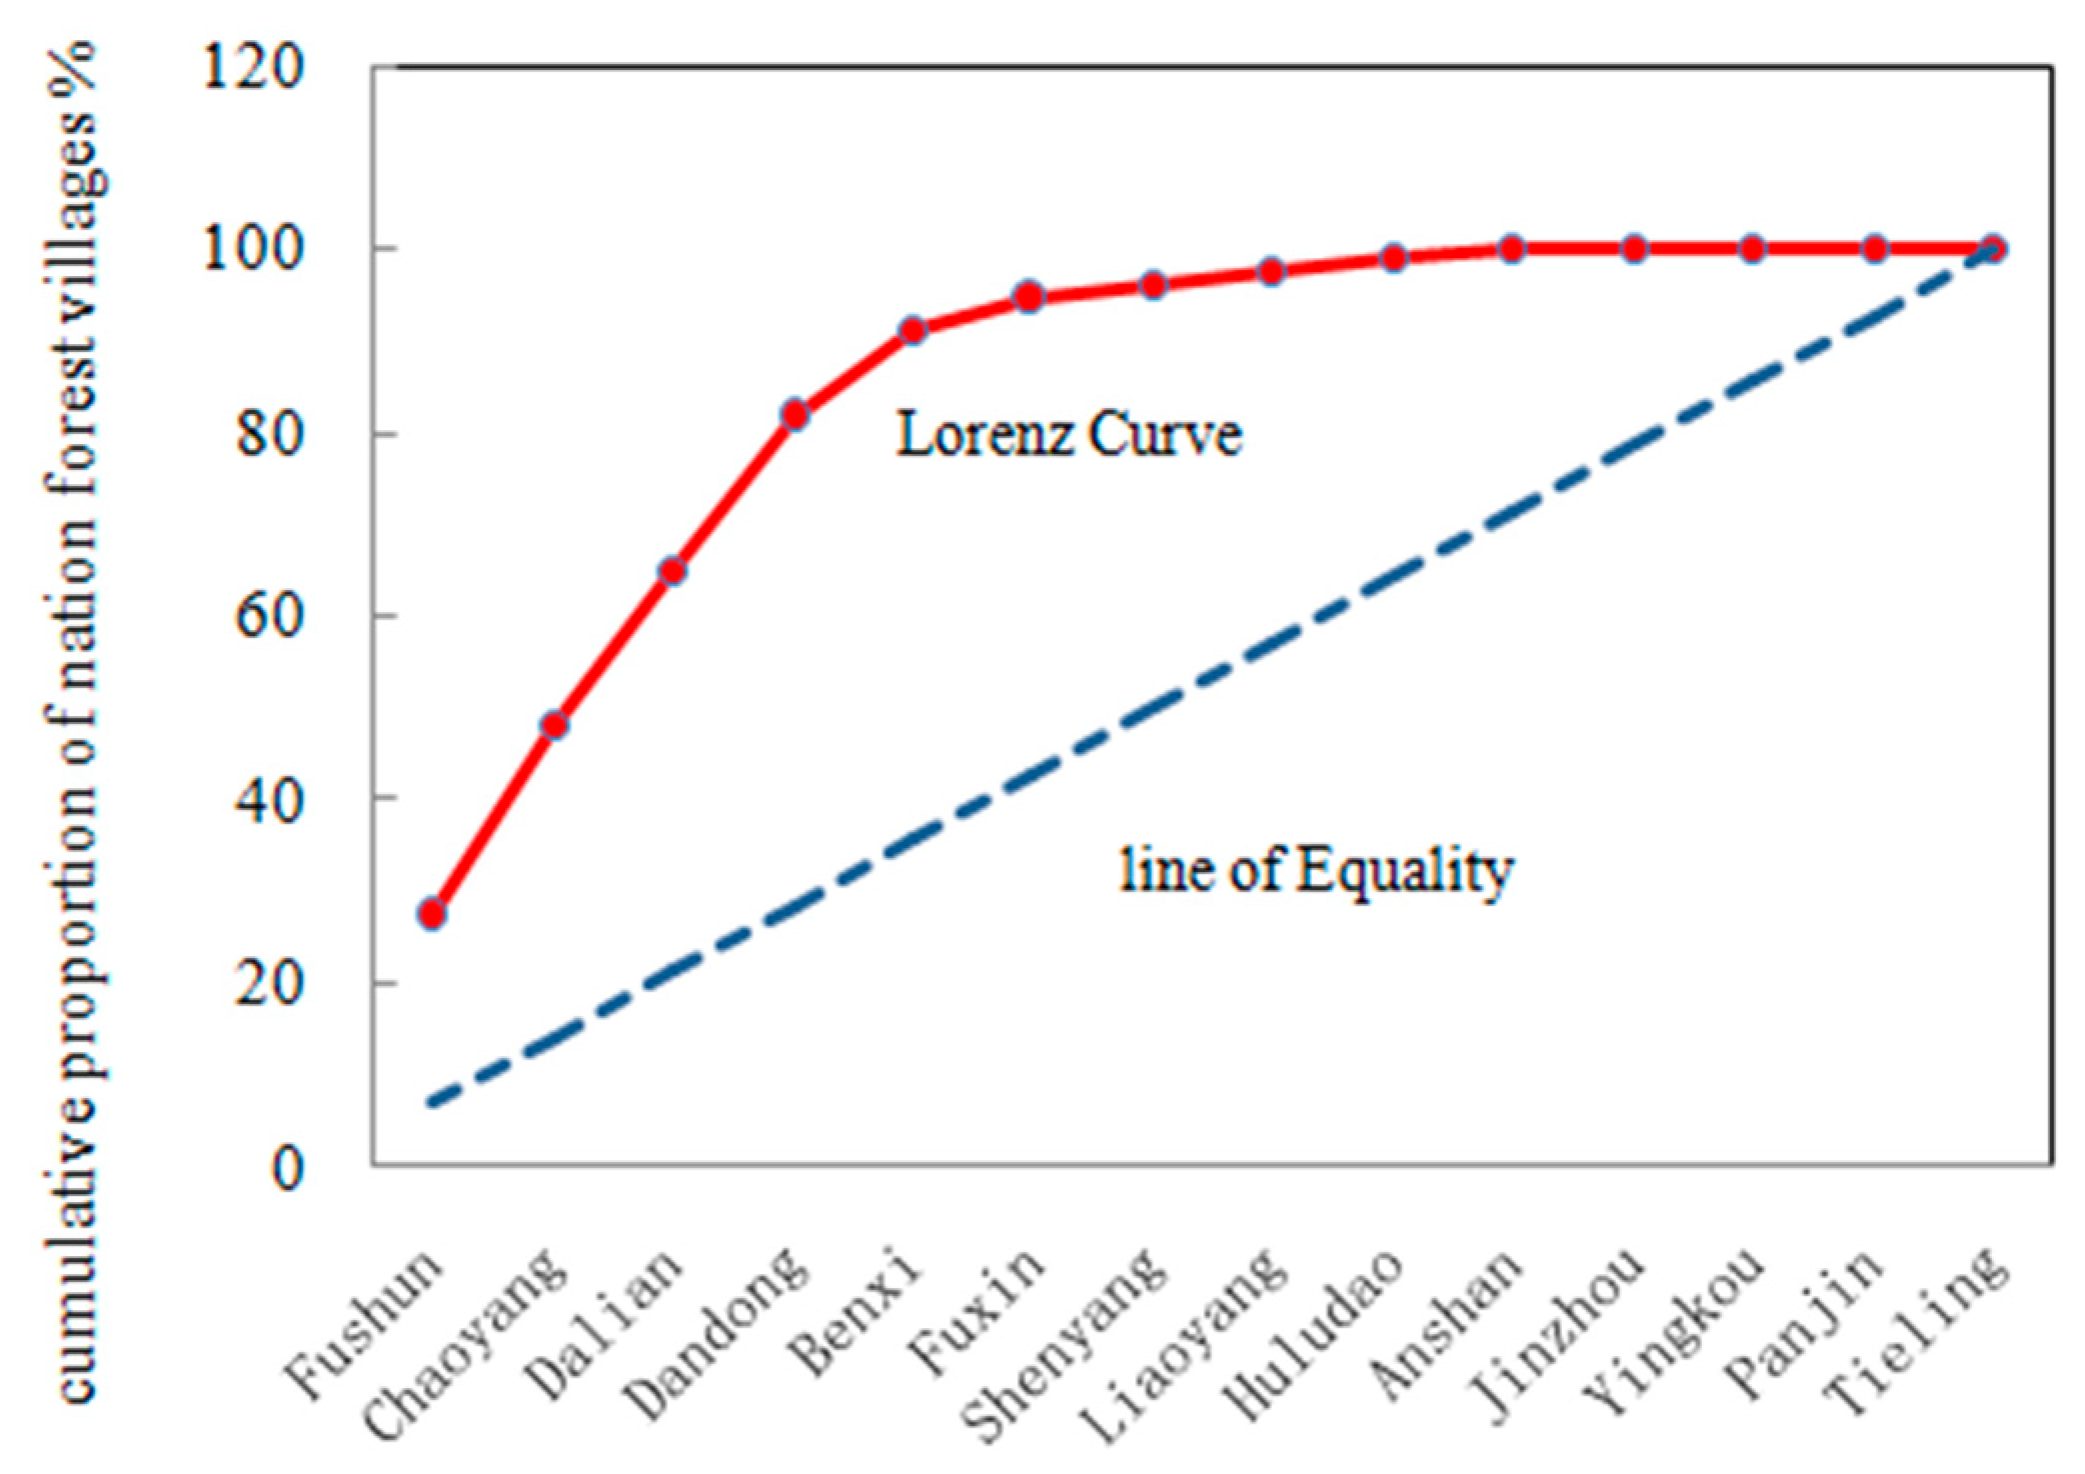
3.2. Equilibrium of the Spatial Distribution

According to Formula (2), the actual geographical concentration index of forest villages in Liaoning Province is 42.98. In the case of uniform distribution, if 125 forest villages are evenly distributed in 14 municipal administrative regions, the number of forest villages in each city is 8.9, and the geographical concentration index is 26.72. It can be seen that the actual geographical concentration index of 42.98 is greater than the uniform distribution index of 26.72, which also indicates that the overall distribution of forest villages is mainly concentrated in some cities, and there is a certain gap from the ideal uniform distribution. This result is consistent with the judgment result of distribution type, which verifies that the distribution of forest and rural areas in Liaoning Province is unbalanced.
According to the above results, the unbalanced index of forest rural distribution in Liaoning Province is further analyzed. According to the number of forest villages in each city and their cumulative percentage (Table 2), the imbalance index of forest villages in Liaoning Province was calculated as 0.692 by Formula (3). In addition to Fushun, Chaoyang, Dalian, Dandong, and Benxi, the number of forest villages in the remaining 9 cities is not more than 5, and even the number of 4 cities is 0, with a large gap. The Lorentz curve (Figure 2) obviously deviates from the average score wiring and has a large curvature, which also indicates that the distribution number of forest cities in each municipal administrative region is not balanced.

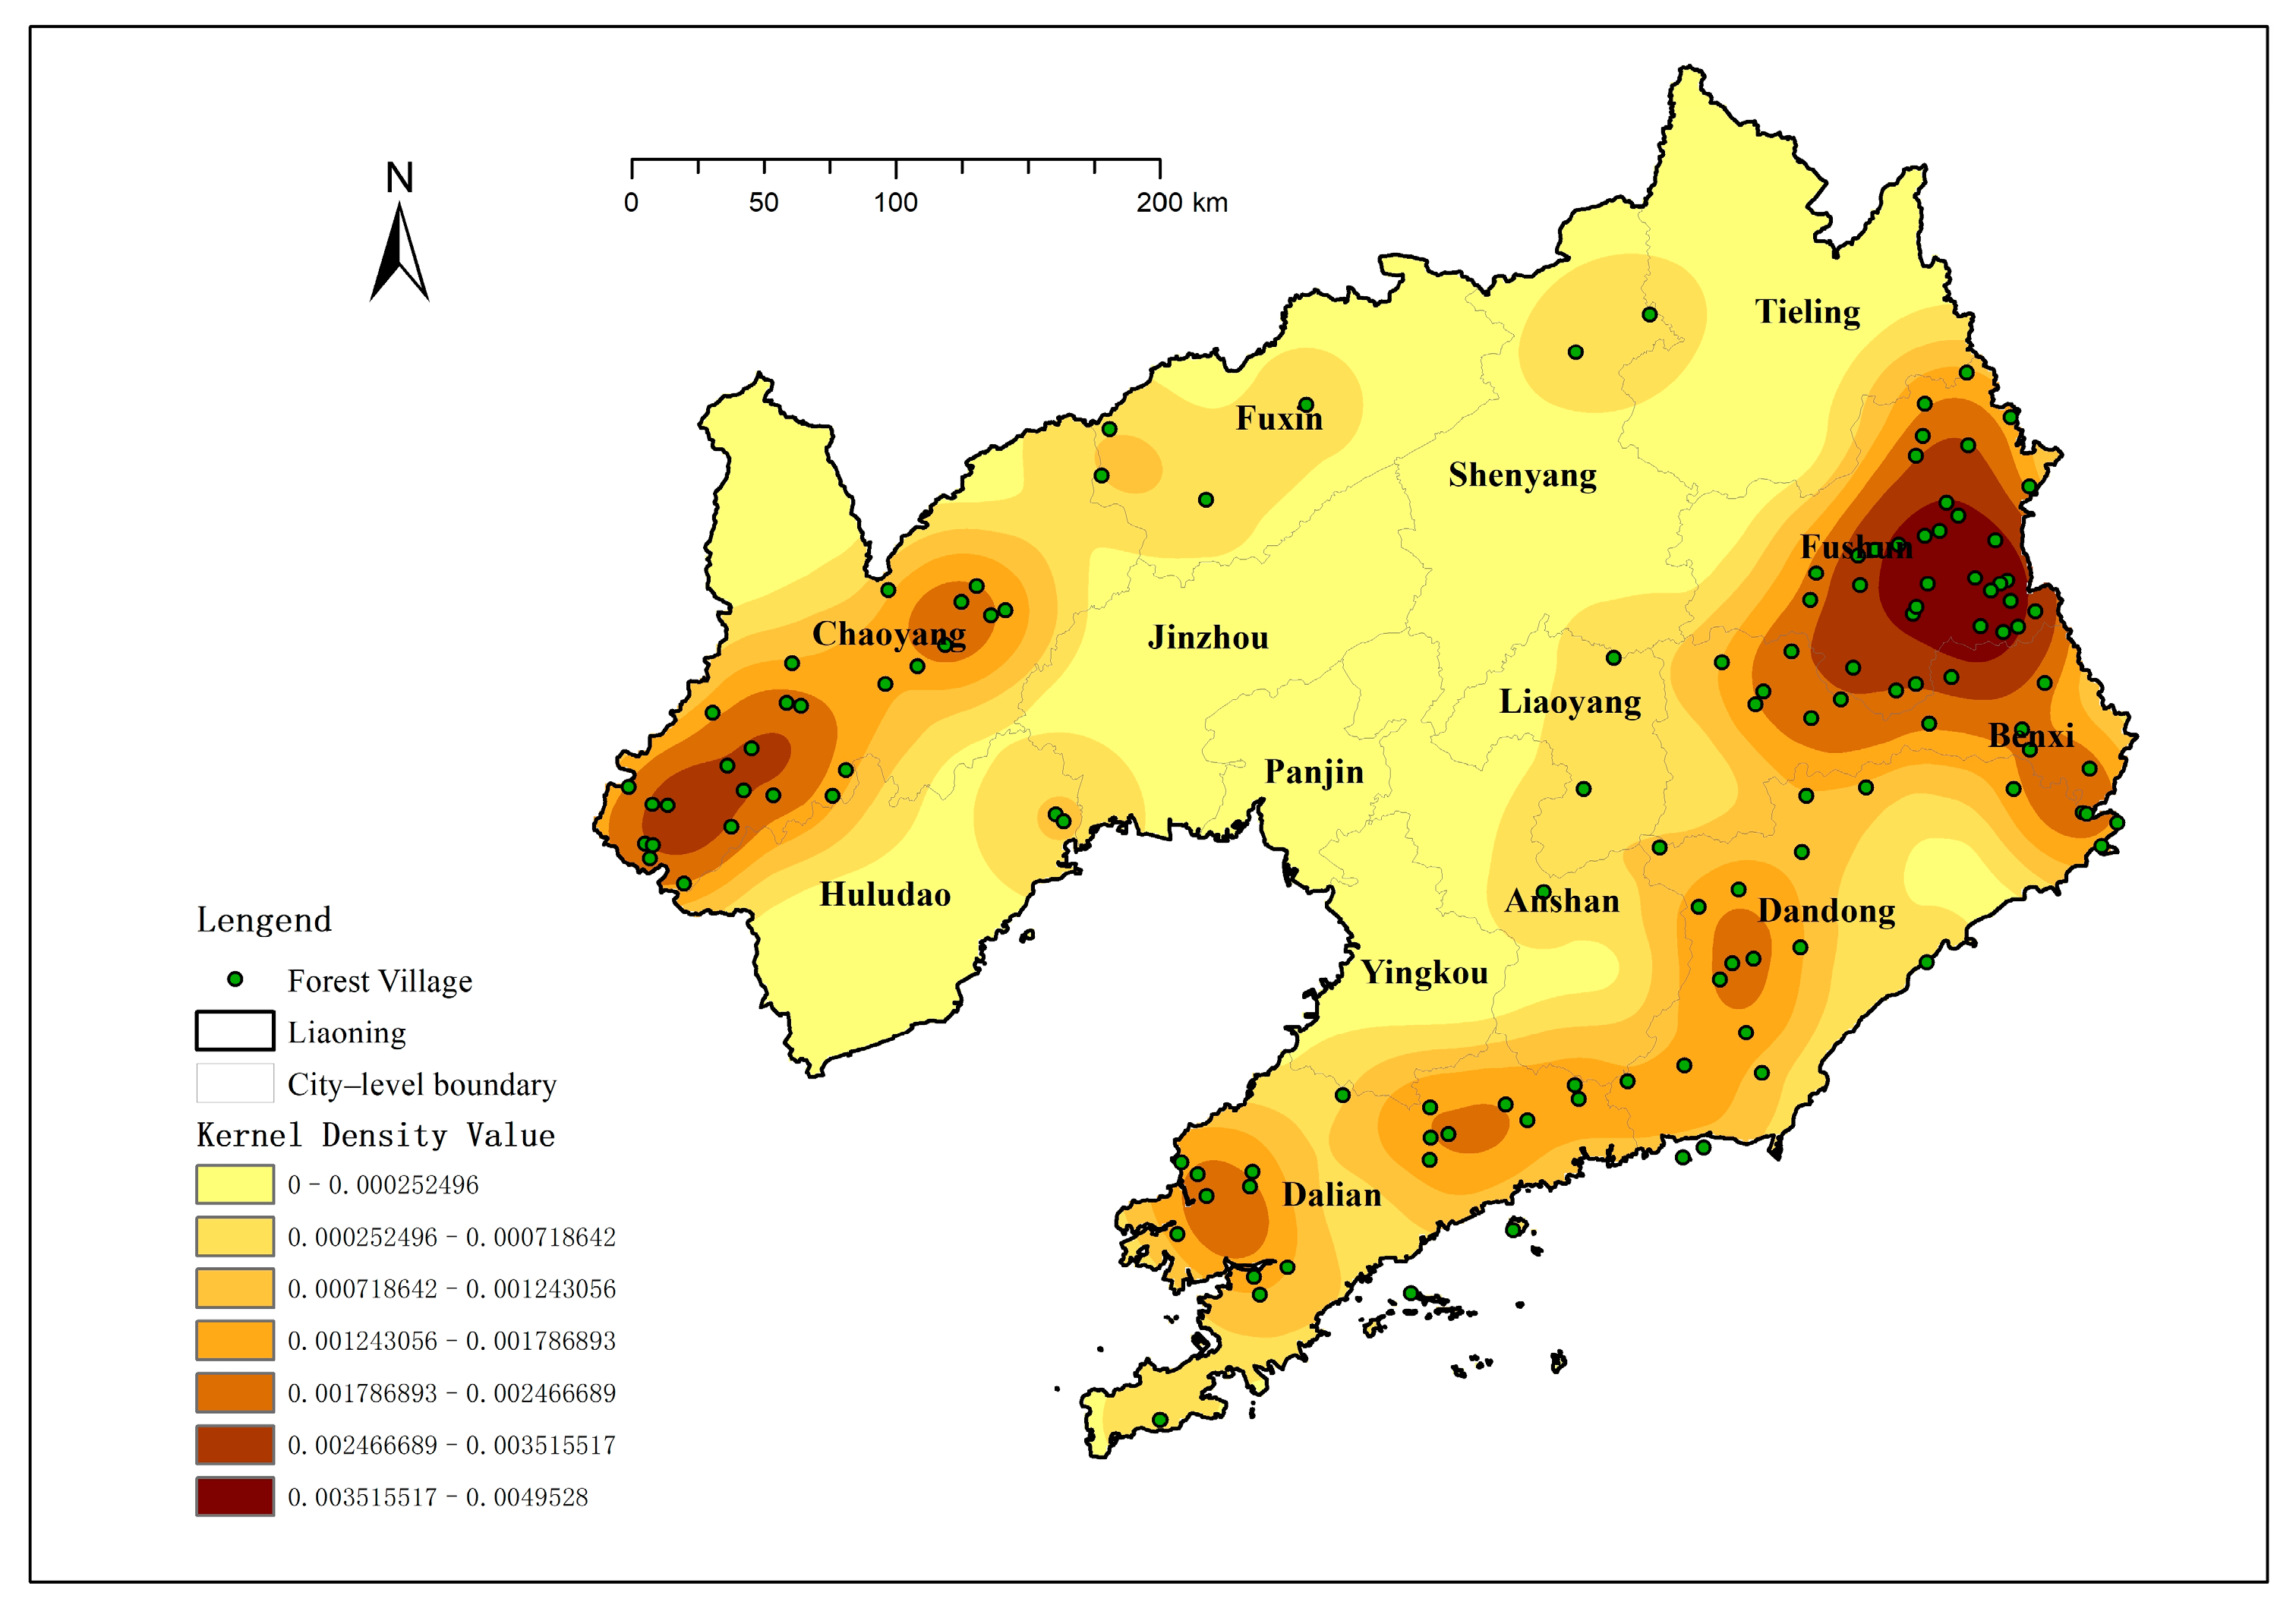
3.3. Kernel Density Analysis

The KED (Kernel Density Estimation) tool in ArcGIS10.2 “Spatial Analysis” was used to estimate the nuclear density of forest villages in Liaoning Province (Formula (4)) and the distribution of forest villages was displayed with a search radius of 50 km, as shown in Figure 3. It can be seen from the observation of its distribution characteristics that the distribution of forest villages in Liaoning Province is unbalanced, and the rural distribution presents the mode of “2 core aggregation + 1 contiguous distribution”. That is, it includes a contiguity area with a wide radiation range and high density, two single-core areas with a wide radiation range and high density, and several low-density areas. One of the contiguous districts is composed of Fengcheng in the west of Dandong City, Jinzhou, in the north of Dalian City and Wafangdian in the northwest of Dalian City. The two single core areas are Chaoyang City and Fushun City. In general, the distribution of national forest villages in Liaoning Province is mainly concentrated in the north, south, and west, while the distribution of other cities is relatively scattered and low-density.

4. Influencing Factors of the Spatial Distribution of Forest Villages in Liaoning Province

4.1. Selection of Influencing Factors

The spatial distribution of rural tourism sites is affected by terrain, river, population, and economy. Based on previous research results, combined with national forest village characteristics and data accessibility, this study extracted three dimensions of the natural environment, social economy, and forest and rural tourism endowment and analyzed their effects on the distribution of forest and rural areas in Liaoning Province. In terms of the natural environment, four indexes were selected: elevation, density of river network, temperature, and precipitation. In terms of social economy, population density, GDP, and total population are selected as three indicators. In terms of forest and rural tourism endowment, forest coverage rate and road network density were selected.

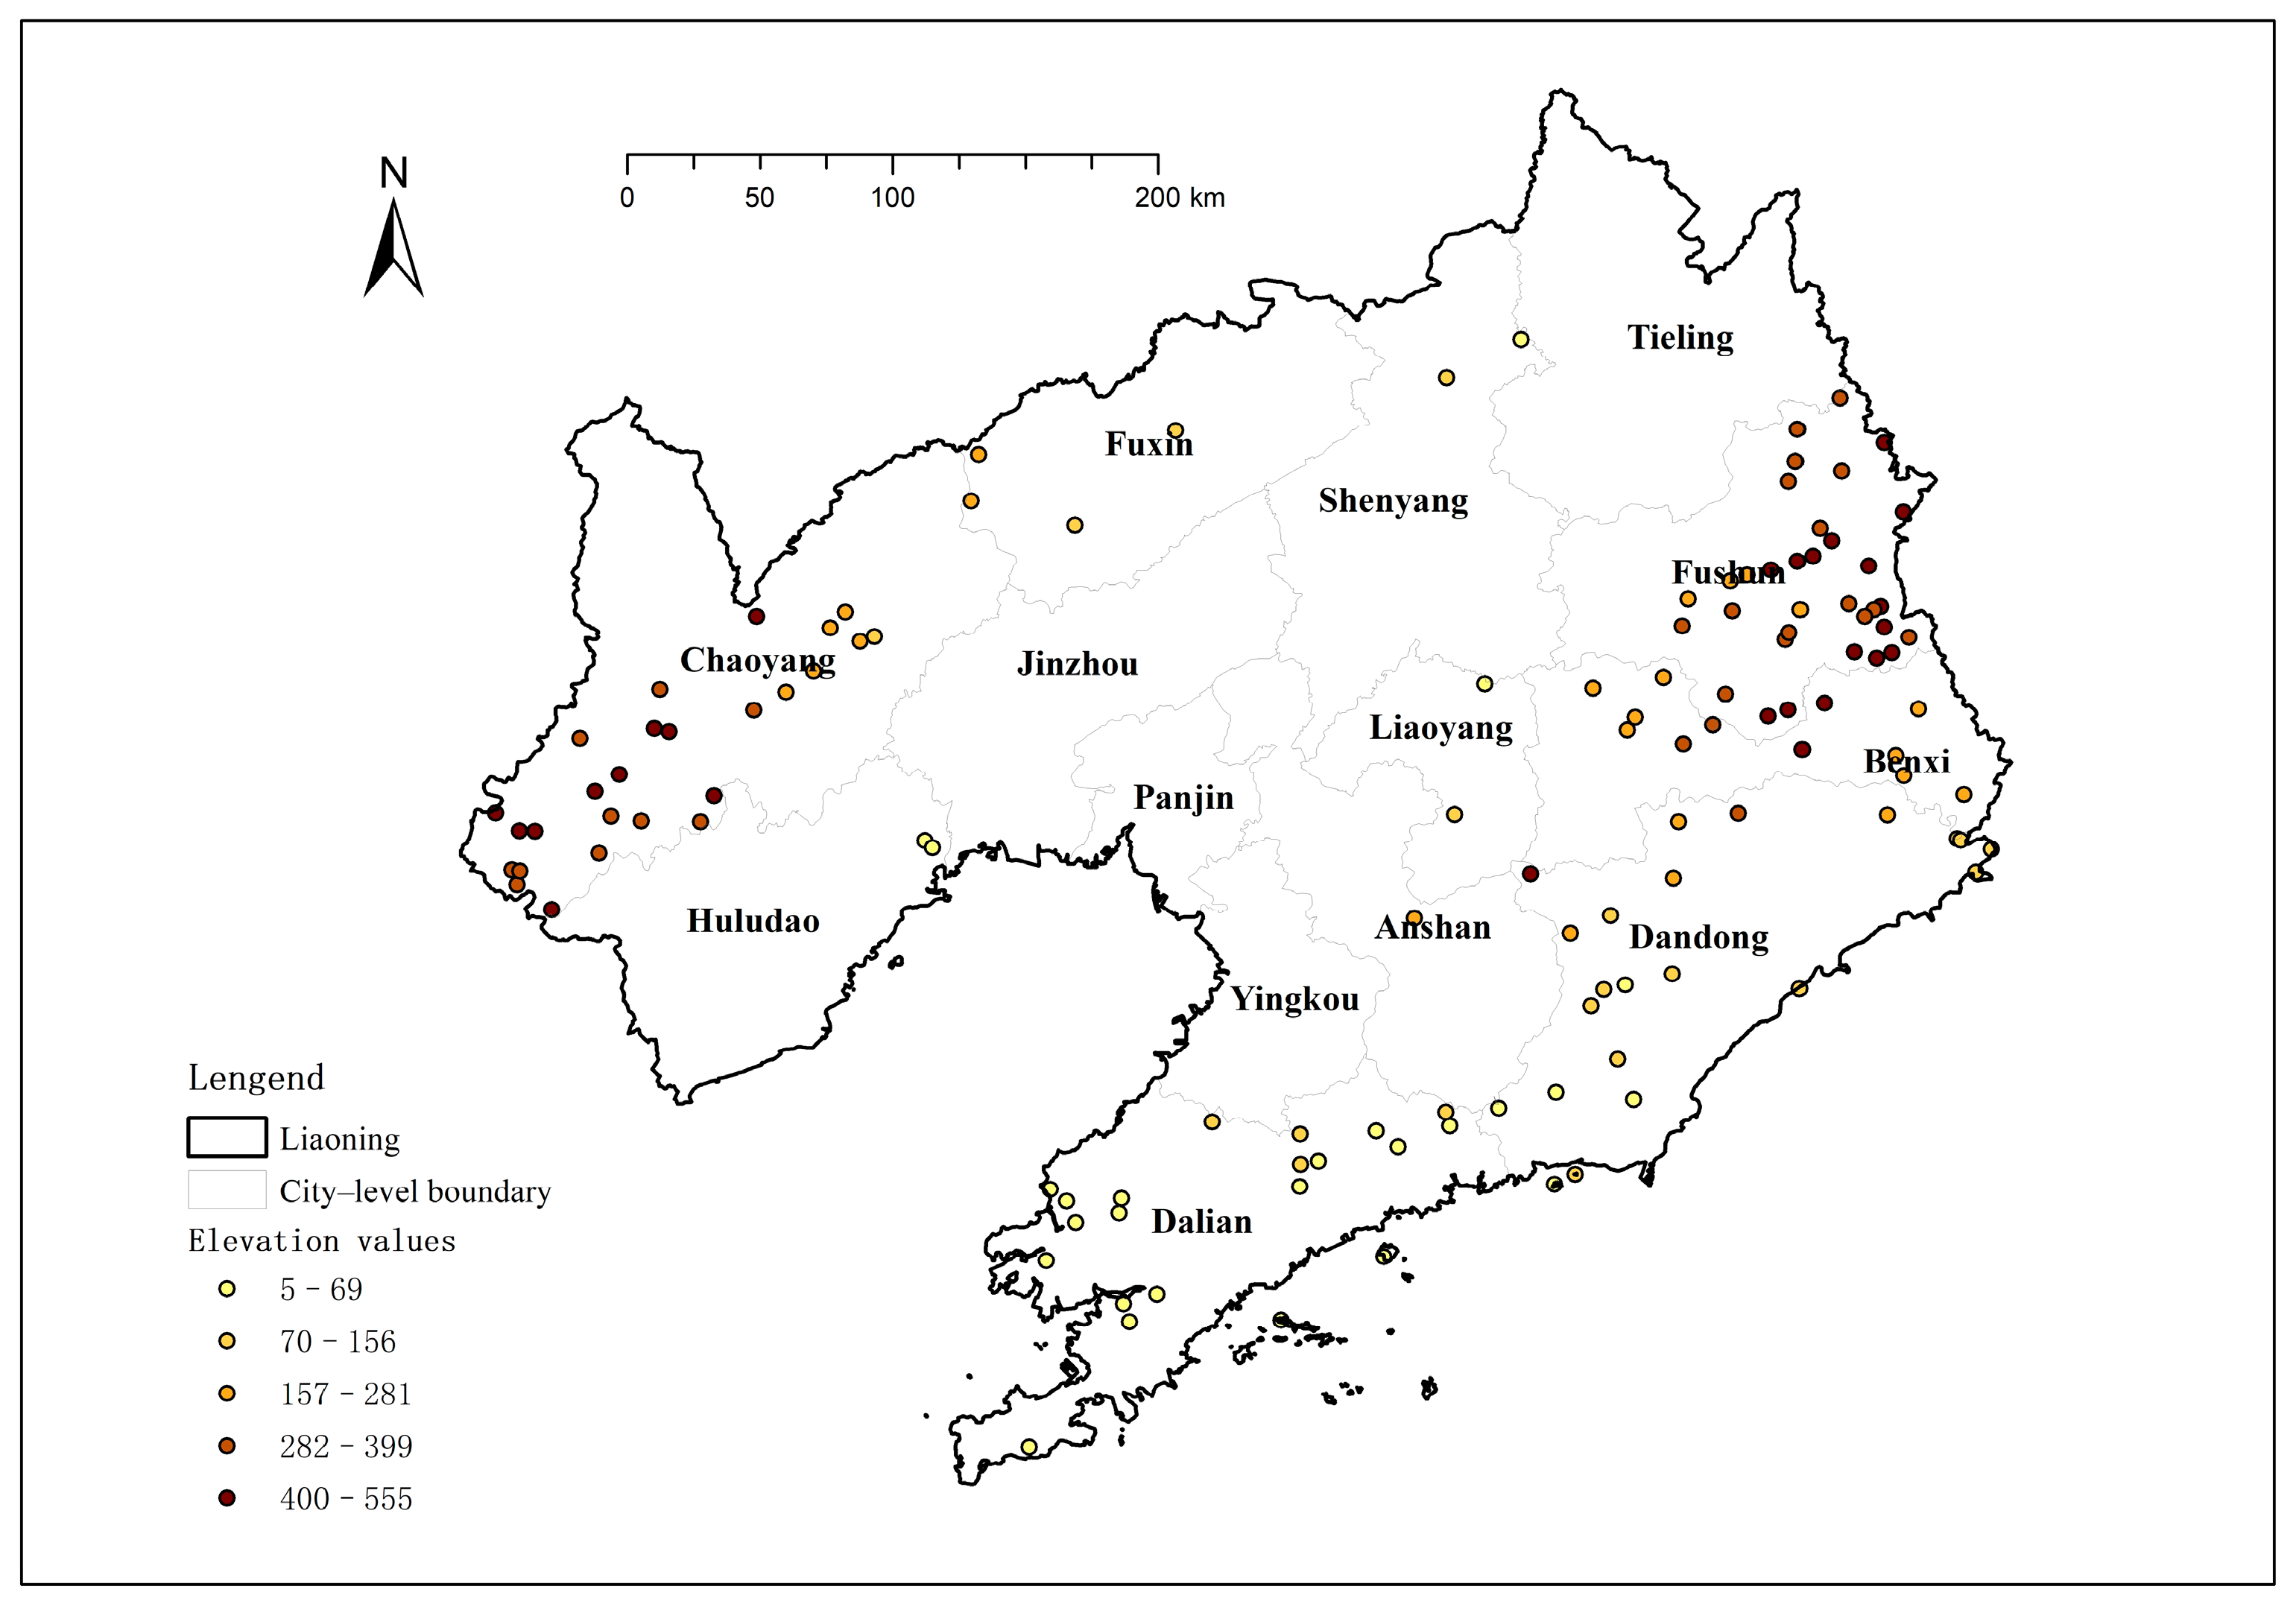
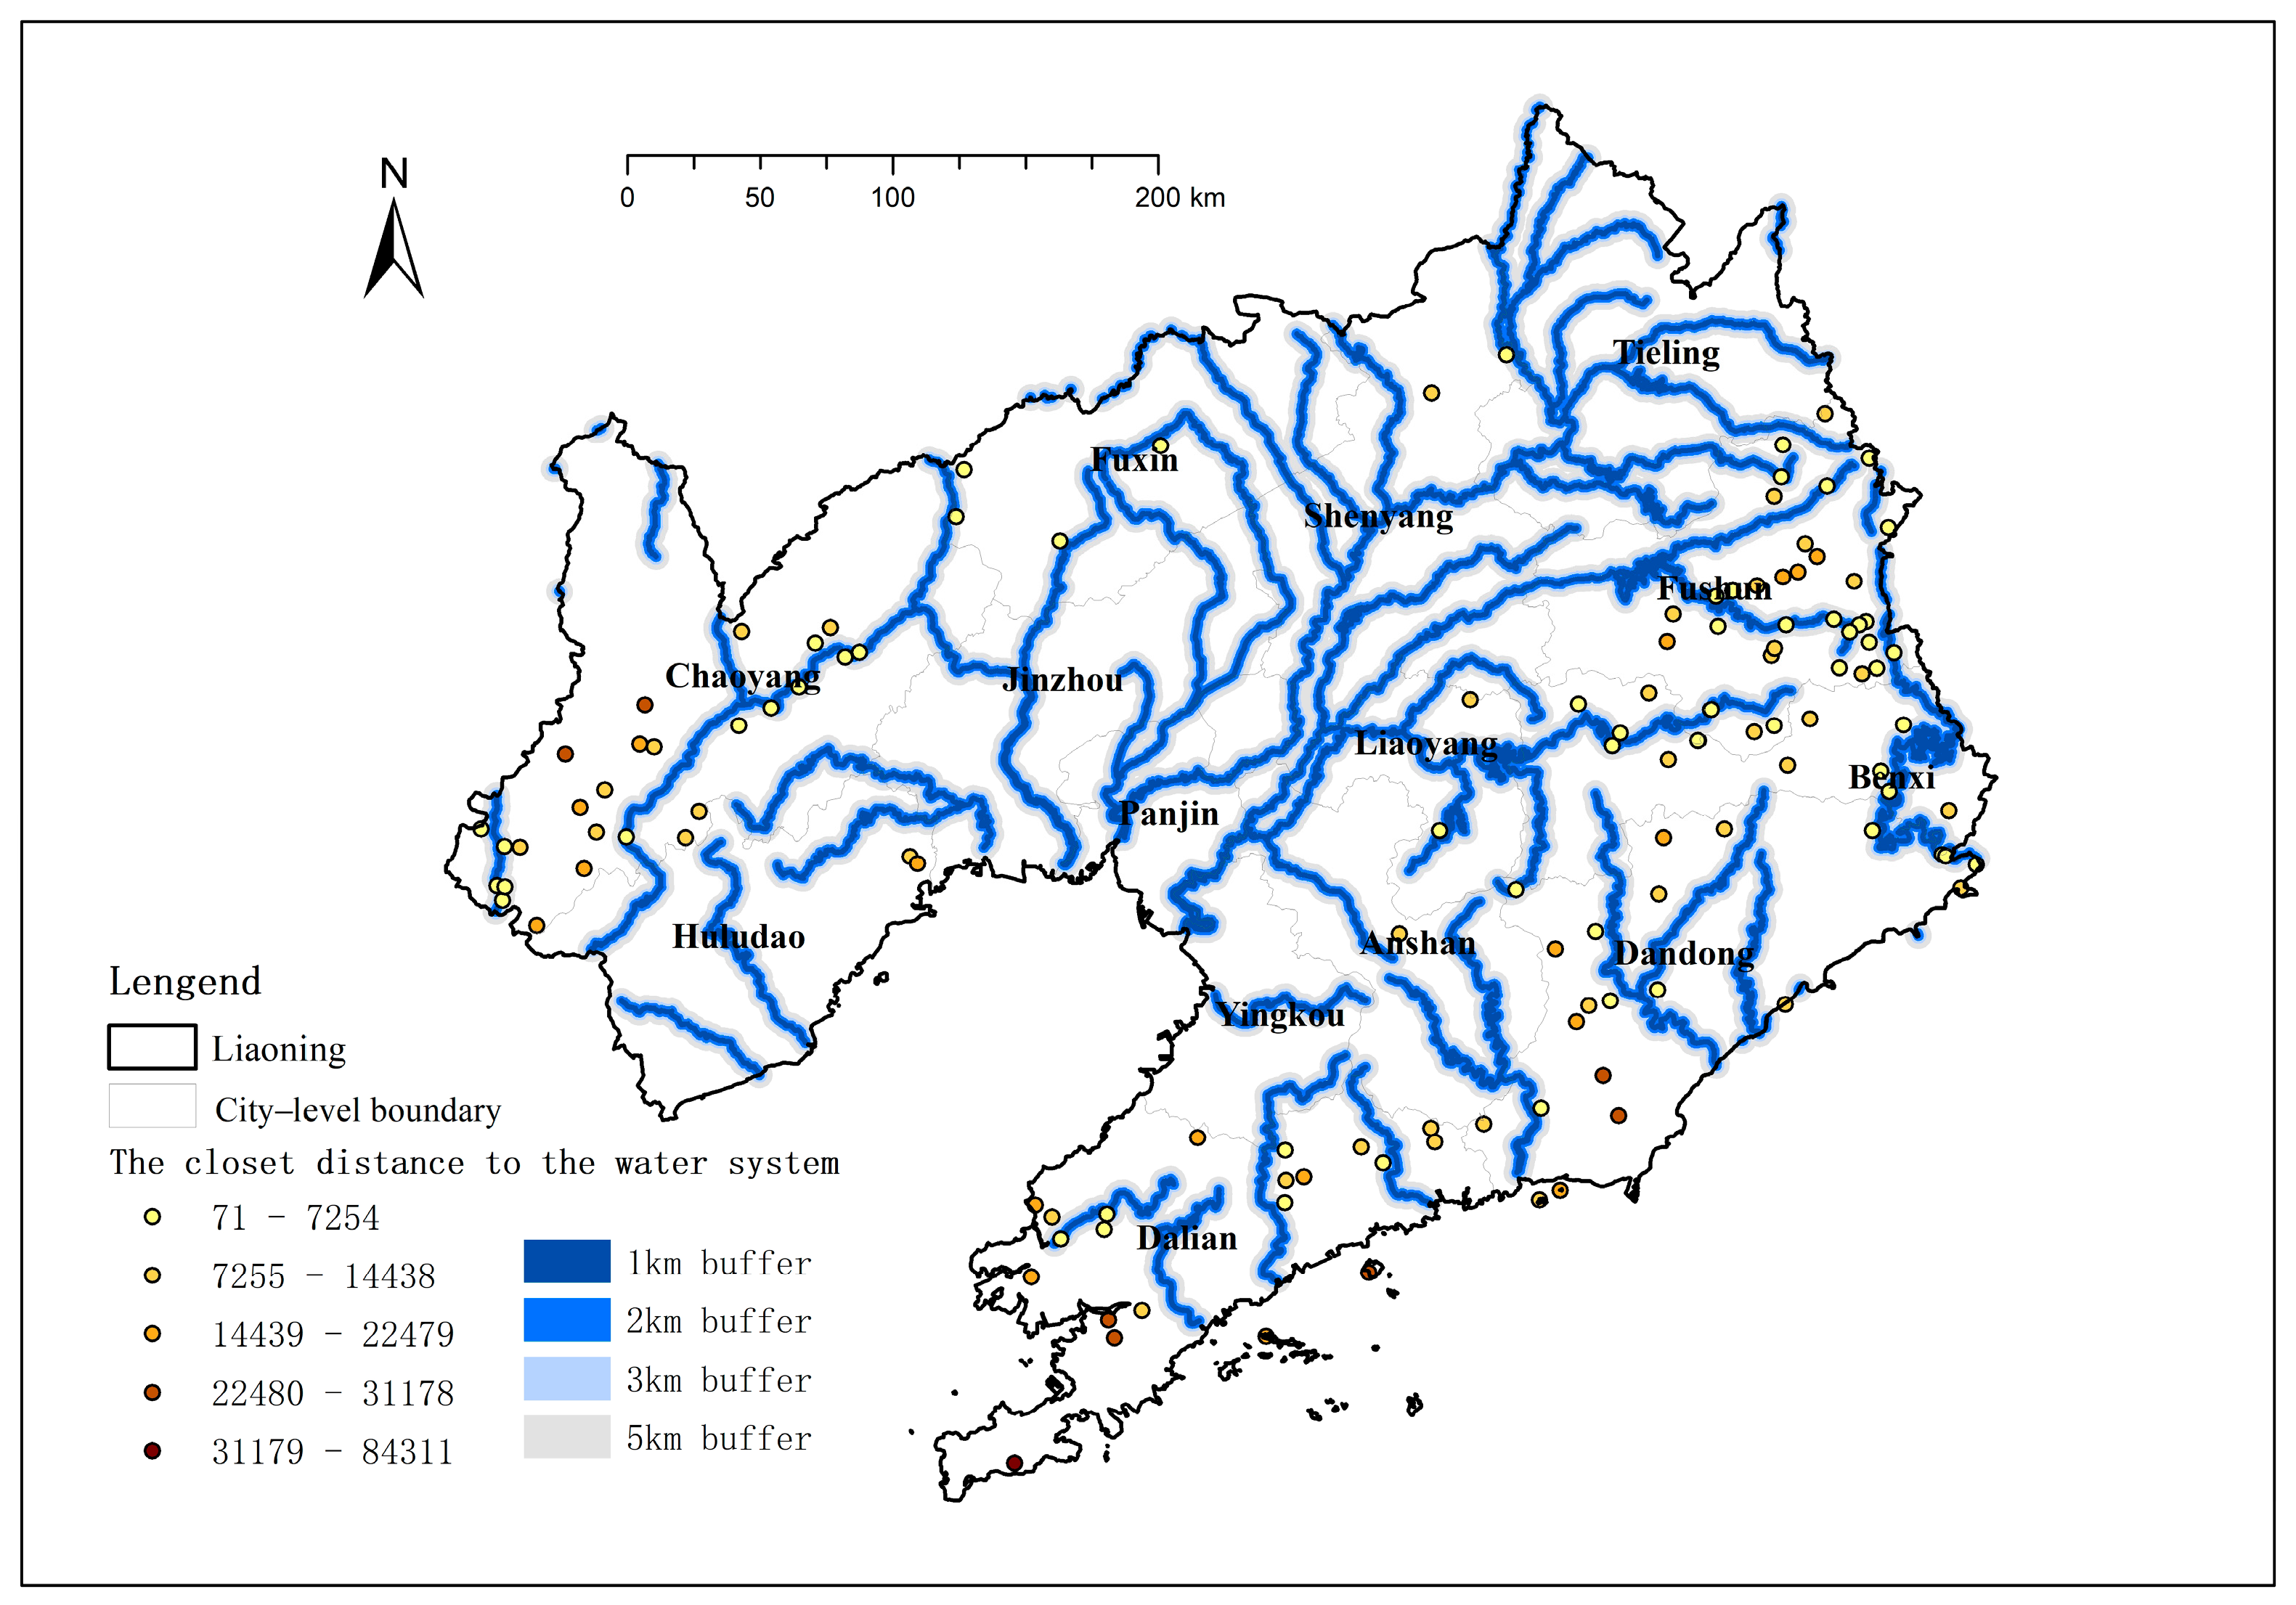
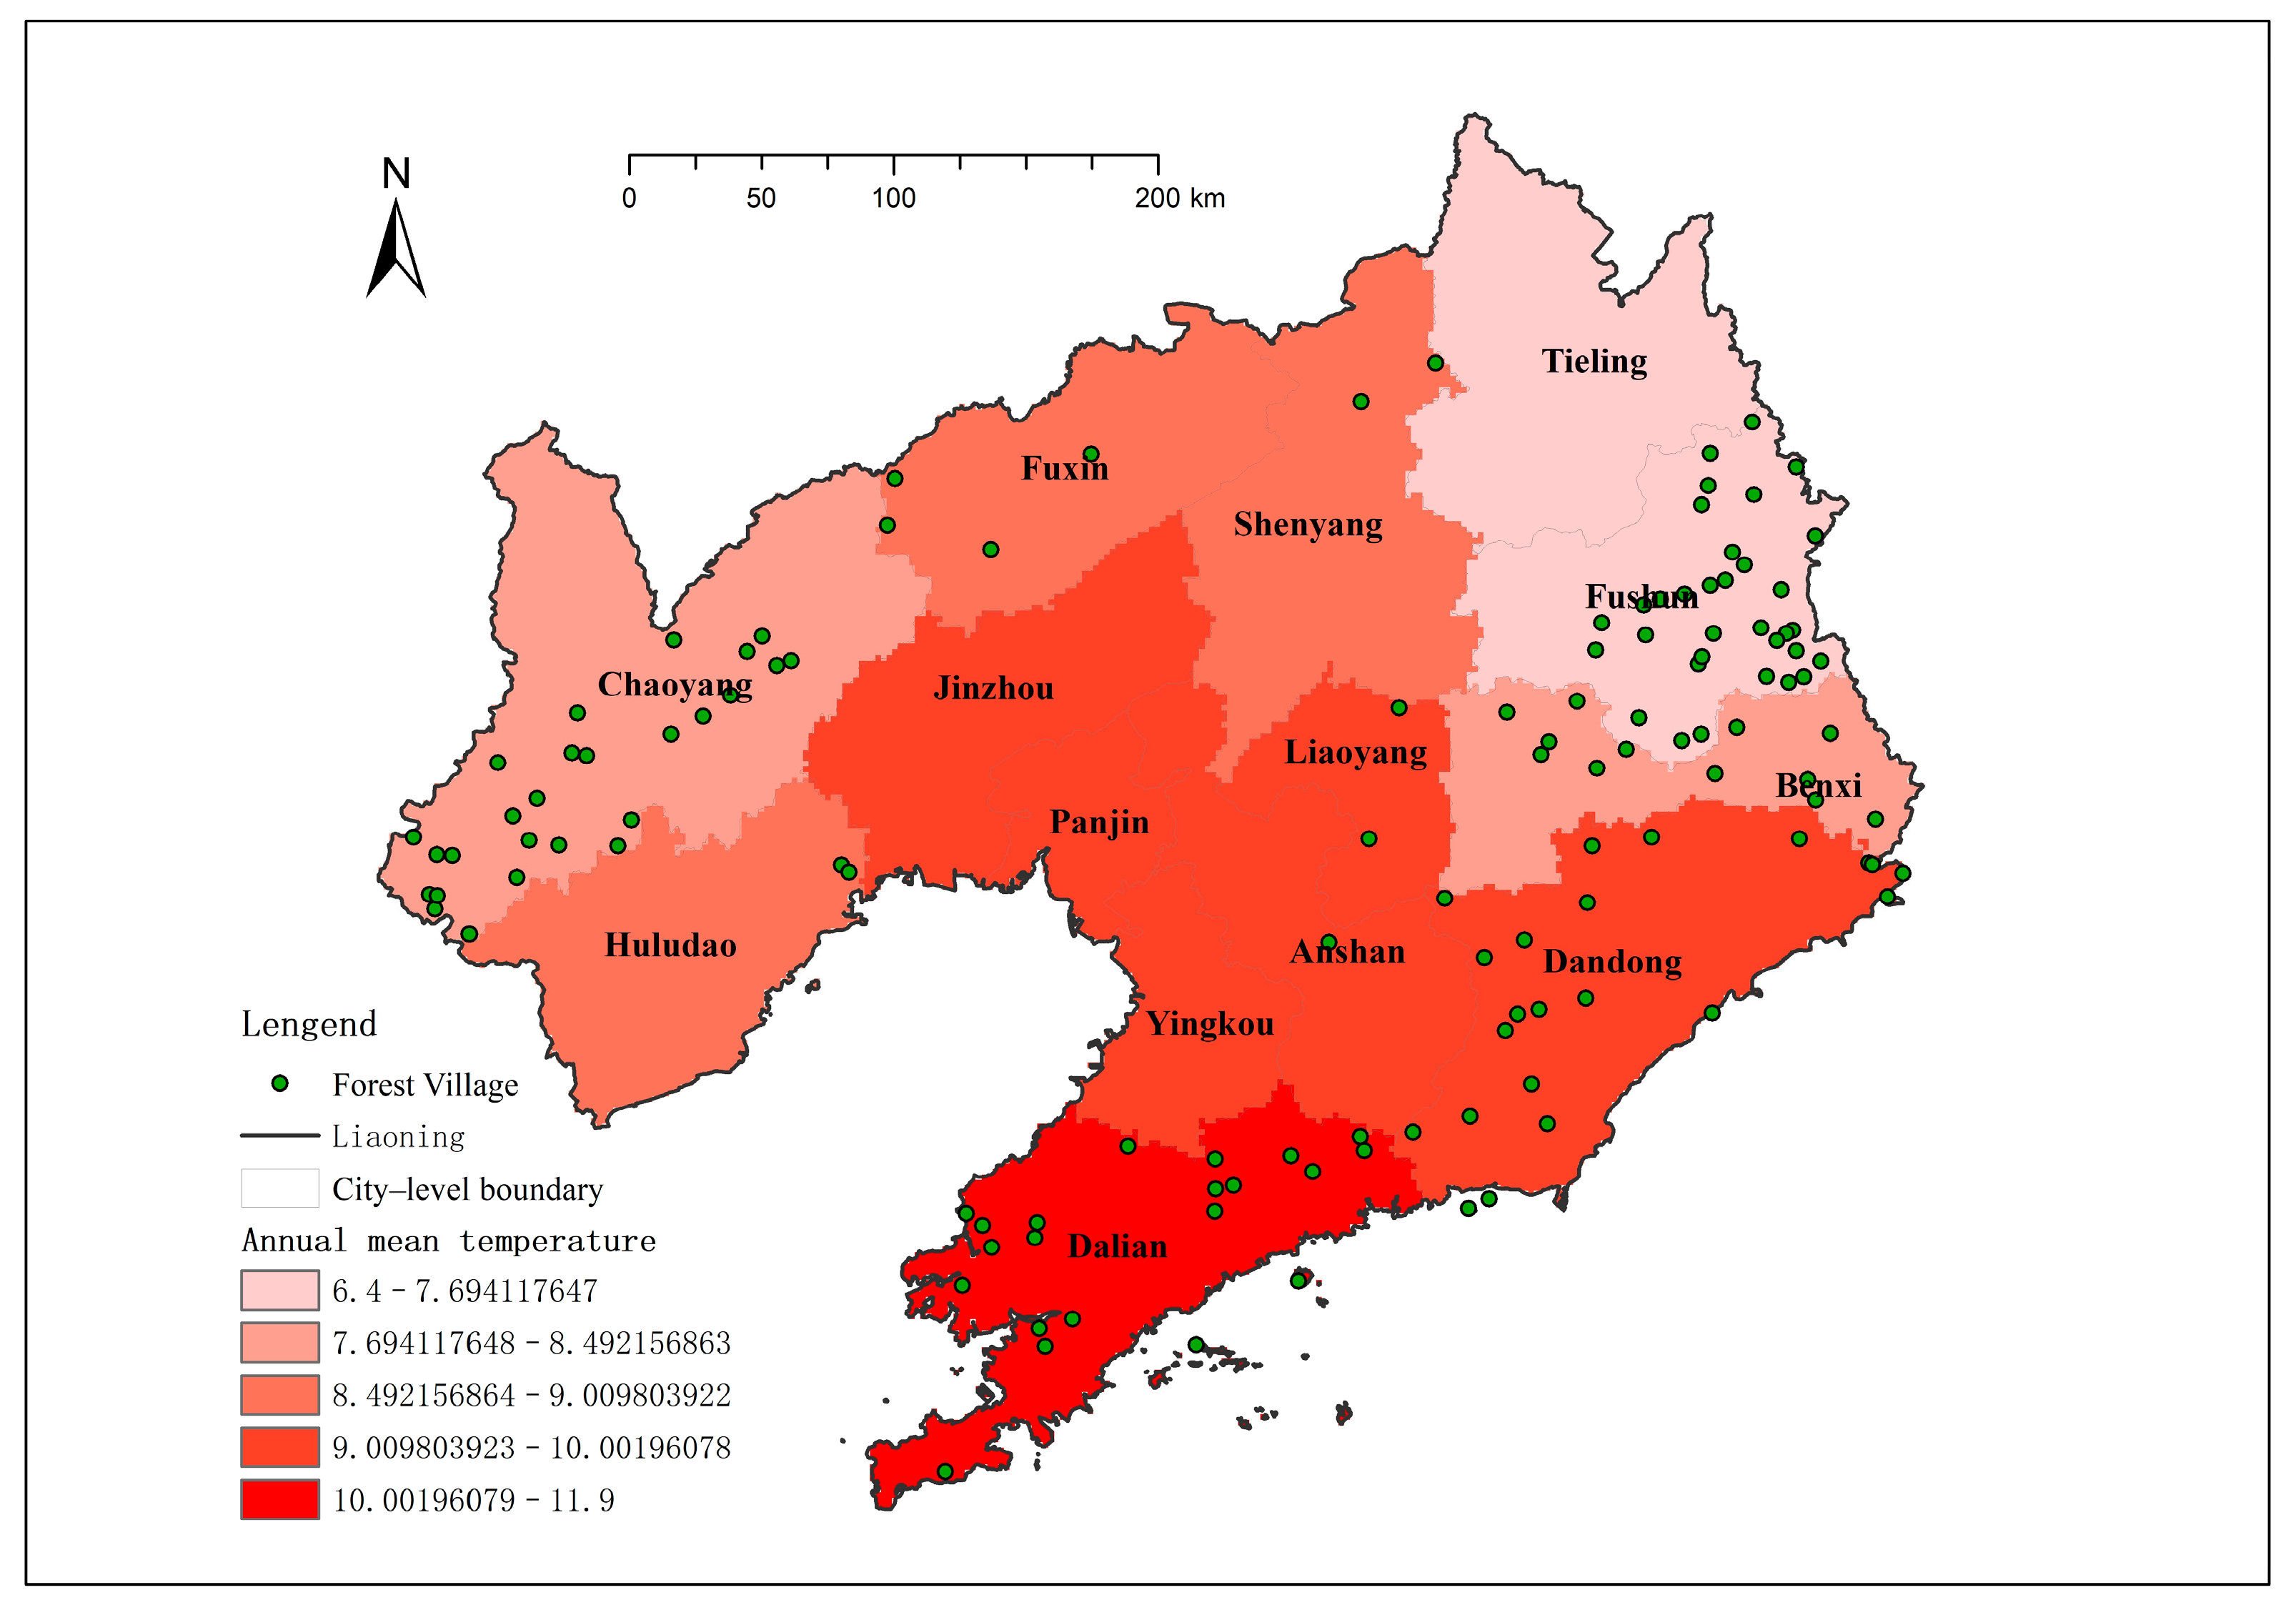
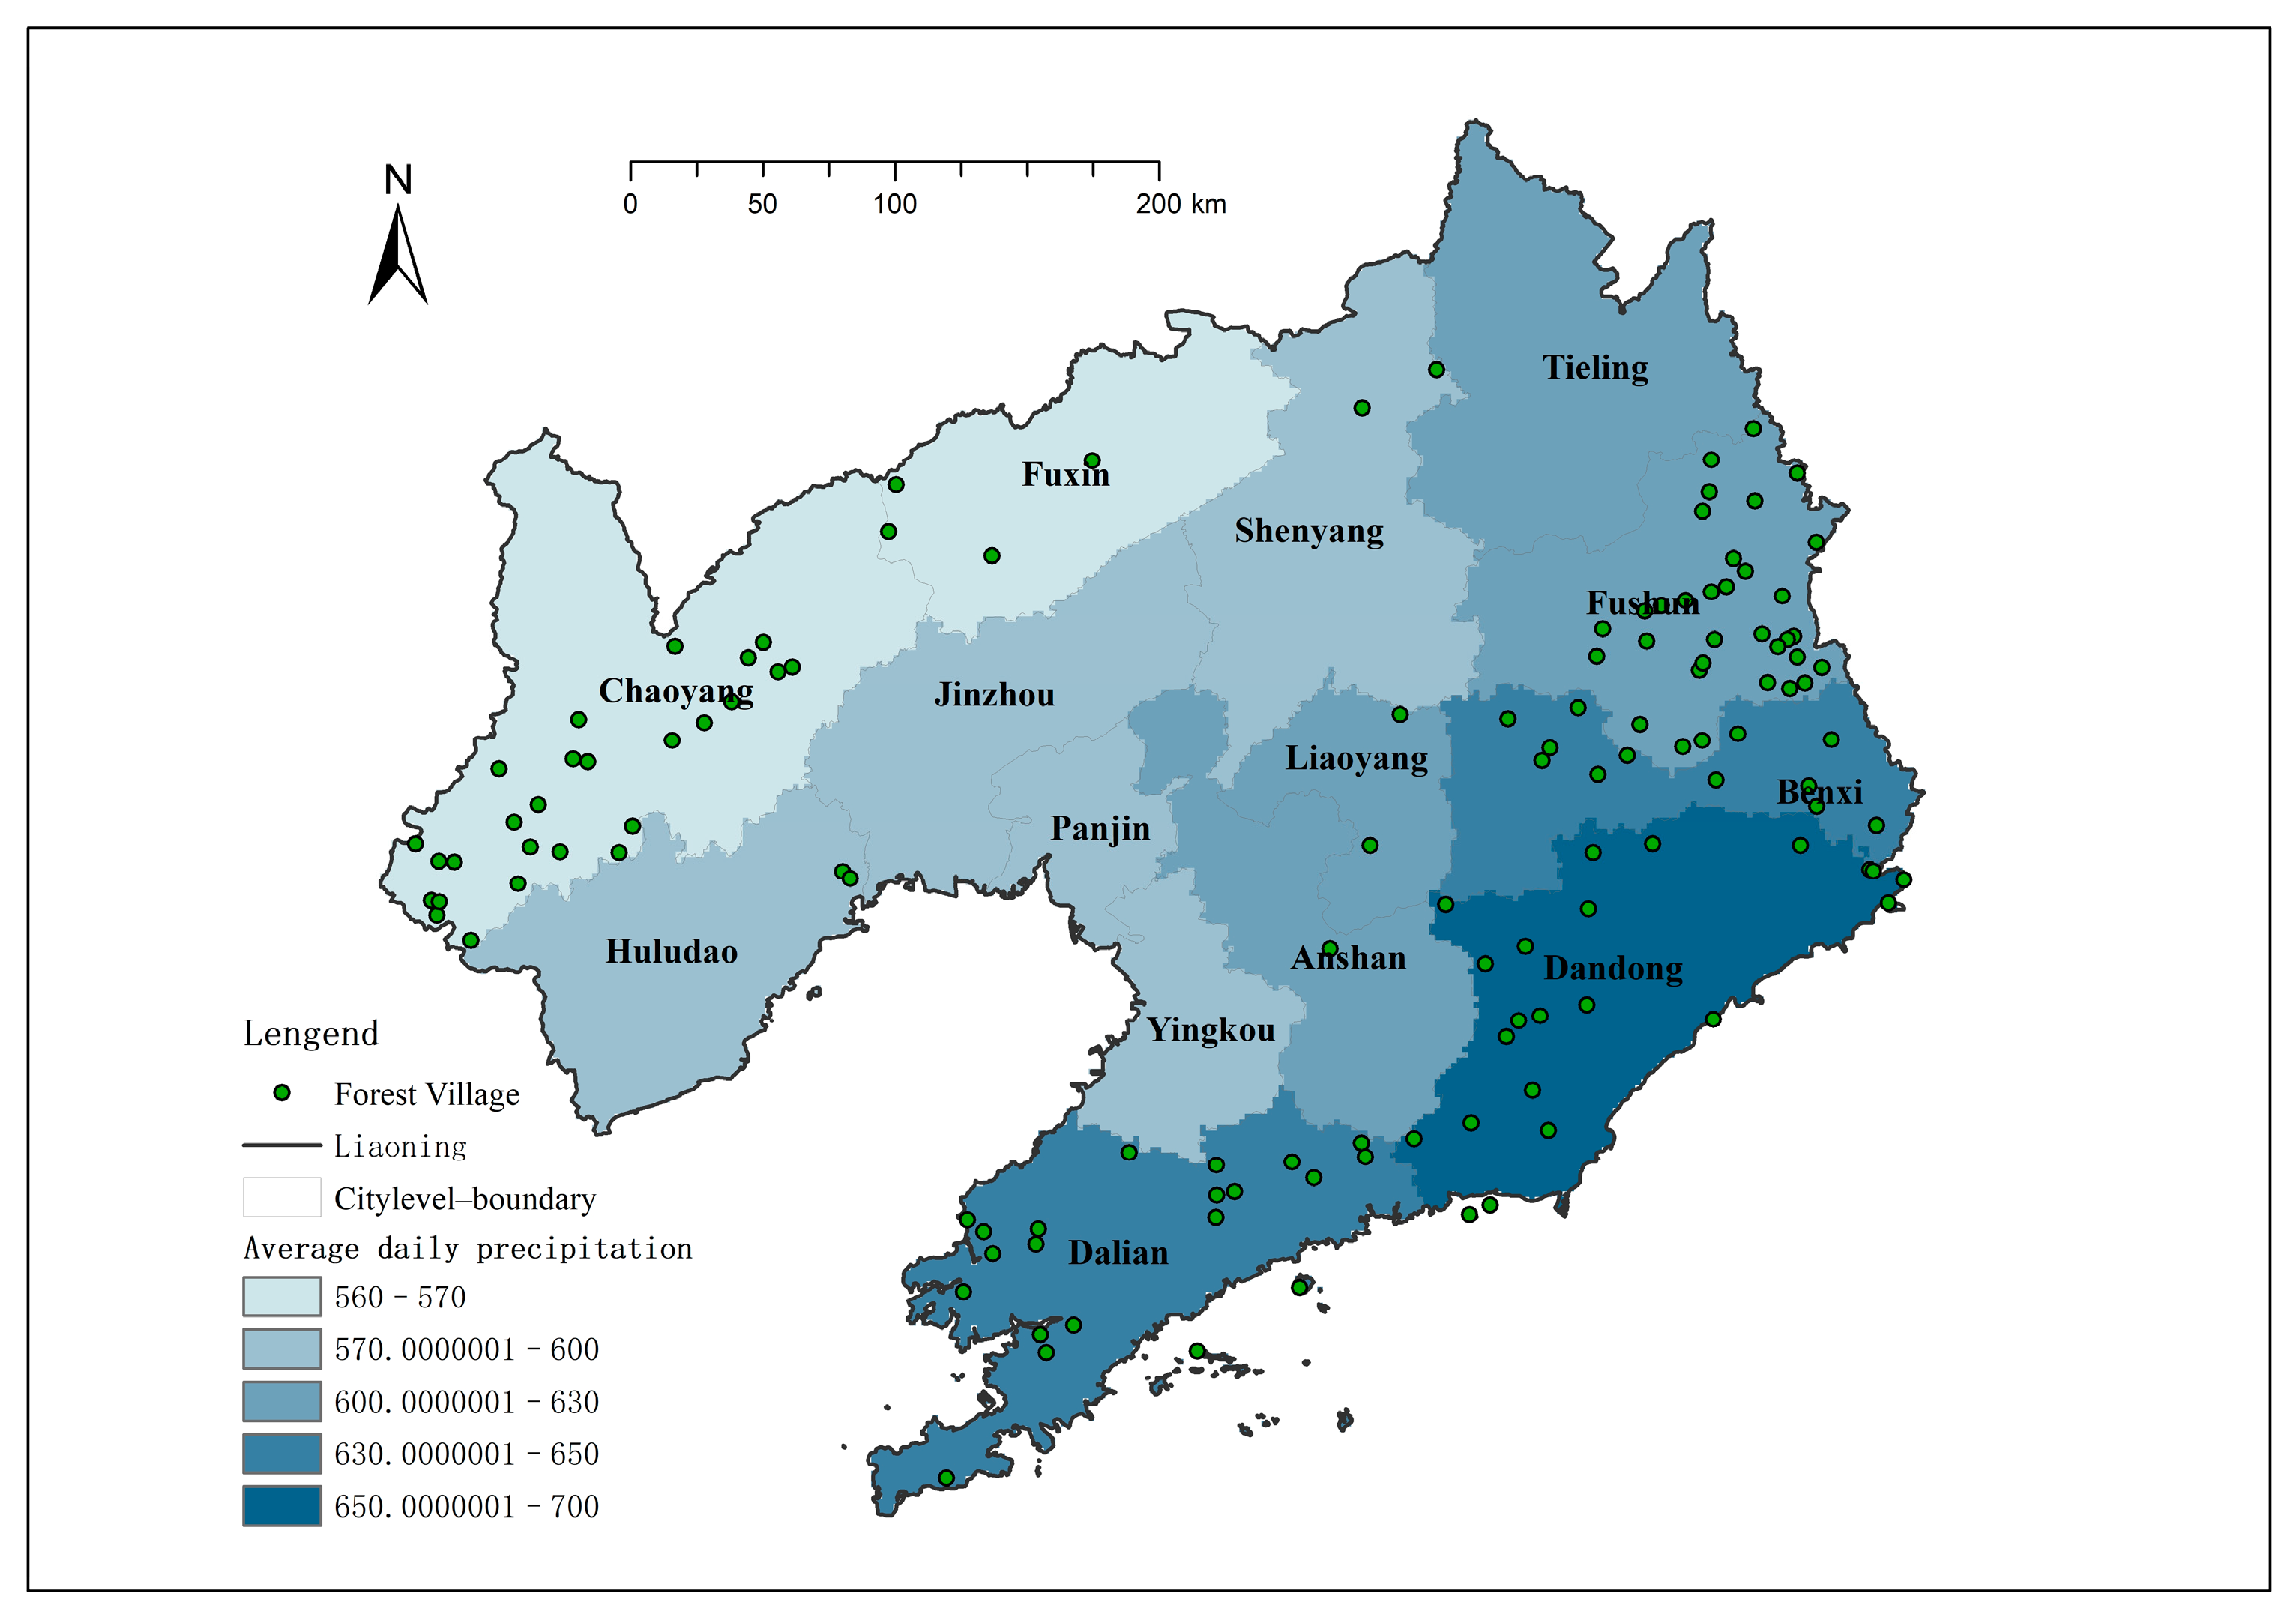
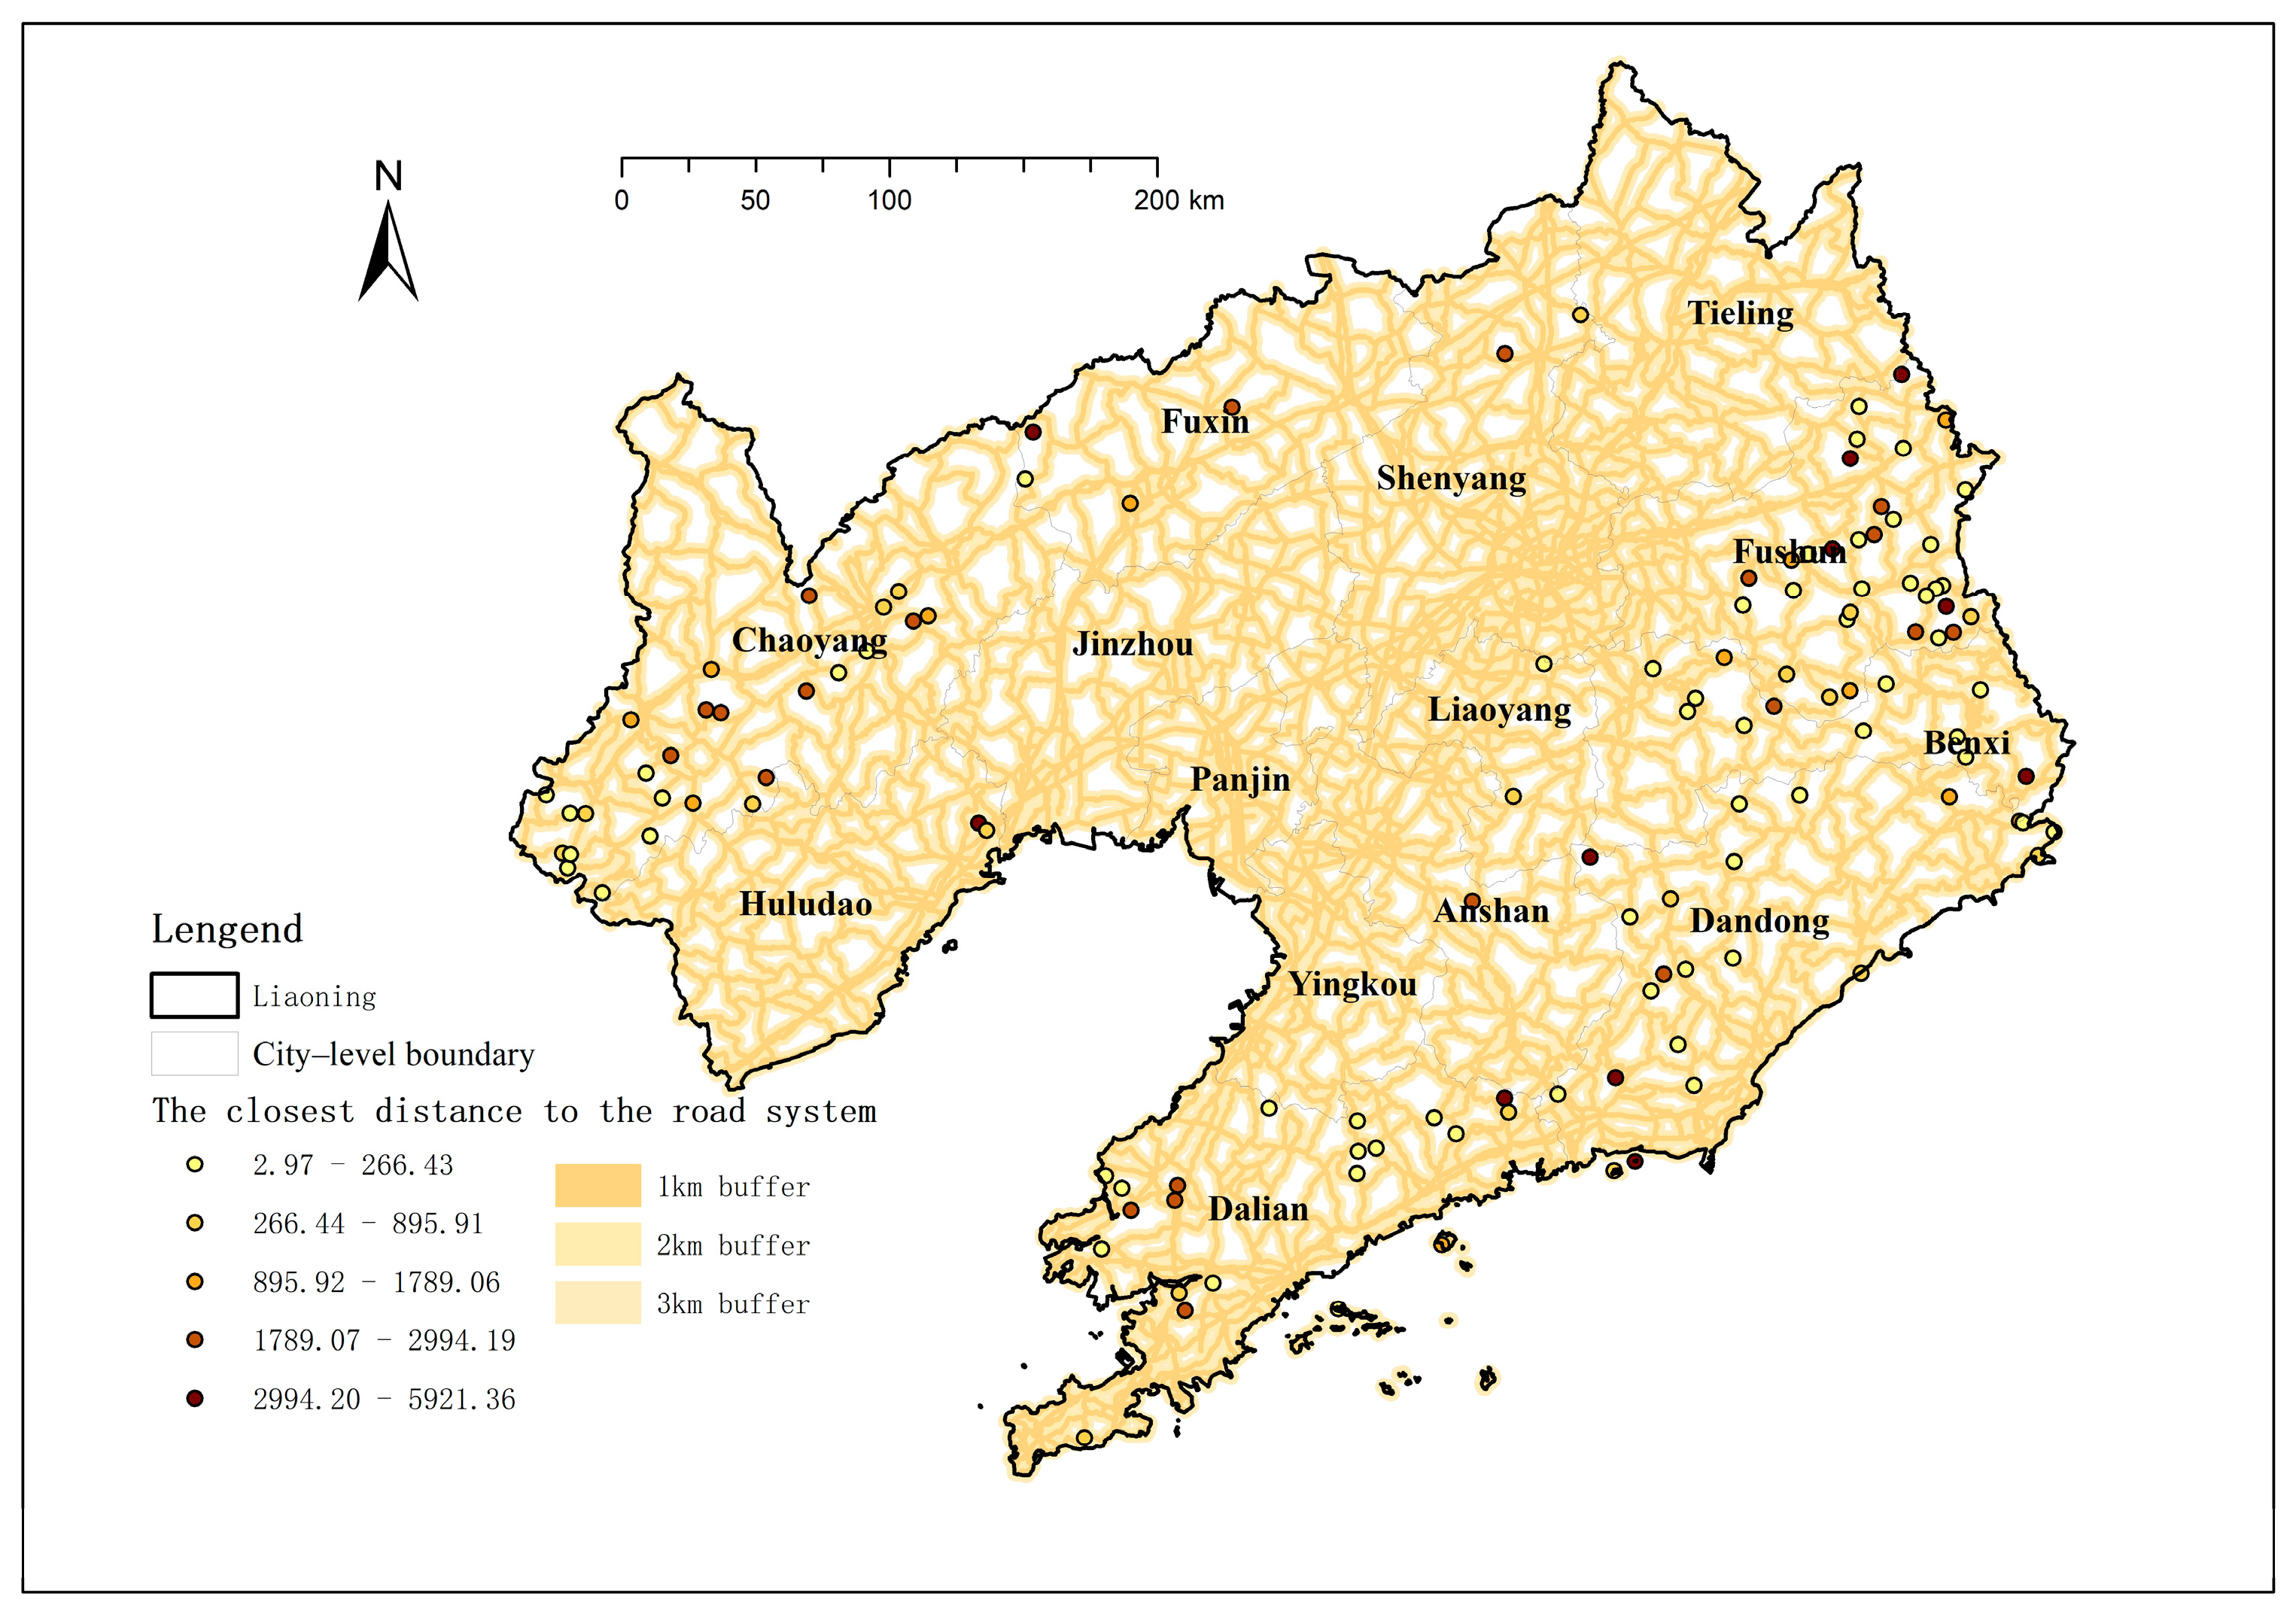
4.1.1. Natural Influencing Factors

(1) Elevation and slope
Topography is an important factor affecting land use and village distribution [51]; the climate and slope of different elevation areas have a direct impact on rural site selection, spatial layout, and landscape resource planning. In this paper, the elevation topographic map (DEM) of Liaoning Province is superimposed with the distribution of forest and rural areas. As shown in Figure 4, Liaoning Province presents a topography pattern with high elevation surrounded by mountains in the east, west, and north. The central and southern parts are plains and hilly areas with relatively low elevations. The main mountains are located in the Anshan Liaoyang junction of the Qianshan Mountains, the highest elevation of 1336 m. Located in the area of Benxi and Dandong is the remnant of Changbai Mountain, the highest elevation of 1200 m.
The spatial statistical analysis of forest villages in Liaoning Province (Table 3) shows that the average elevation of 125 forest villages is 243 m, the lowest elevation is 5 m, and the highest elevation is 555 m. Among them, there are 28 villages within 200 m above sea level, accounting for 46.4%, which are mainly located in Liaodong Peninsula and the north of Chaoyang City. There are 46 villages between 200 and 400 m above sea level, accounting for 36.8%. As can be seen from Figure 5, the distribution is relatively dispersed. There are 19 villages above 400 m above sea level, accounting for 15.3%, and their distribution is relatively concentrated, mainly located in the residual area of Changbai Mountain in Fushun and the Nurul Erhu Mountain area in Chaoyang. At the same time, through the analysis, we can see that the number of forest villages in Liaoning Province shows a trend of decline with the increase in altitude.
(2) River system
The ArcGIS10.2 was used to analyze the buffer zone of 1 km~5 km of the main rivers in Liaoning Province, and the distribution of the distance between the buffer zone and the forested village was superposed (Figure 6). Within 5 km of the buffer zone, 40 rivers were concentrated, accounting for 32% (Figure 7). This is because the proximity to the river is not only convenient for production and life but also conducive to the development of tourism resources. In the buffer zone of 5 km~10 km away from the river, the number of concentrated villages is 36, accounting for 28.8%, mainly concentrated in the Liaodong Peninsula. This is not only due to the density of the river but also because of the elevation of some villages; in order to avoid the impact of floods, the site is located at an appropriate distance from the main river. By observing the frequency distribution diagram of the distance between forest villages and river, we can see that the number of forest villages in Liaoning Province takes 13 km as the node and decreases with the increase and decrease in the distance from the river.
(3) Average temperature
The climate environment has a significant effect on the distribution of forest villages. The location of rural construction should consider climate factors, the spatial layout and construction of villages should conform to the local climate characteristics, and the tourism resources should be planned according to the natural resource endowment. As shown in Figure 8, the average temperature of Liaoning Province presents a north–south gradient decrease. The annual average temperature of the province is 9 °C, and the maximum temperature difference is 5.5 °C, with a small temperature difference. Because there is no too-high or too-low temperature, the distribution of forest villages in the province has a uniform distribution within the temperature range.
(4) Rainfall
As can be seen from the rainfall distribution in Liaoning Province (Figure 9), the rainfall in Liaoning Province is relatively moderate, with an annual rainfall of about 610 mm, showing a trend of decreasing from southeast to northwest, and the rainfall in the southeast coastal area is relatively abundant. The central plain, due to its relatively flat terrain, has slightly lower rainfall than the mountains and coastal areas. There are relatively few variations in western Liaoning and northern Liaoning. According to the distribution of forest villages, the number of forest villages with annual rainfall above 610 mm is 88, accounting for about 70% of the total. This shows that rainfall has a certain impact on the distribution of villages in Liaoning Province. Areas with more rainfall have a higher forest coverage rate, which also provides good living, ecological tourism, forest health, and other resources for forest villages.

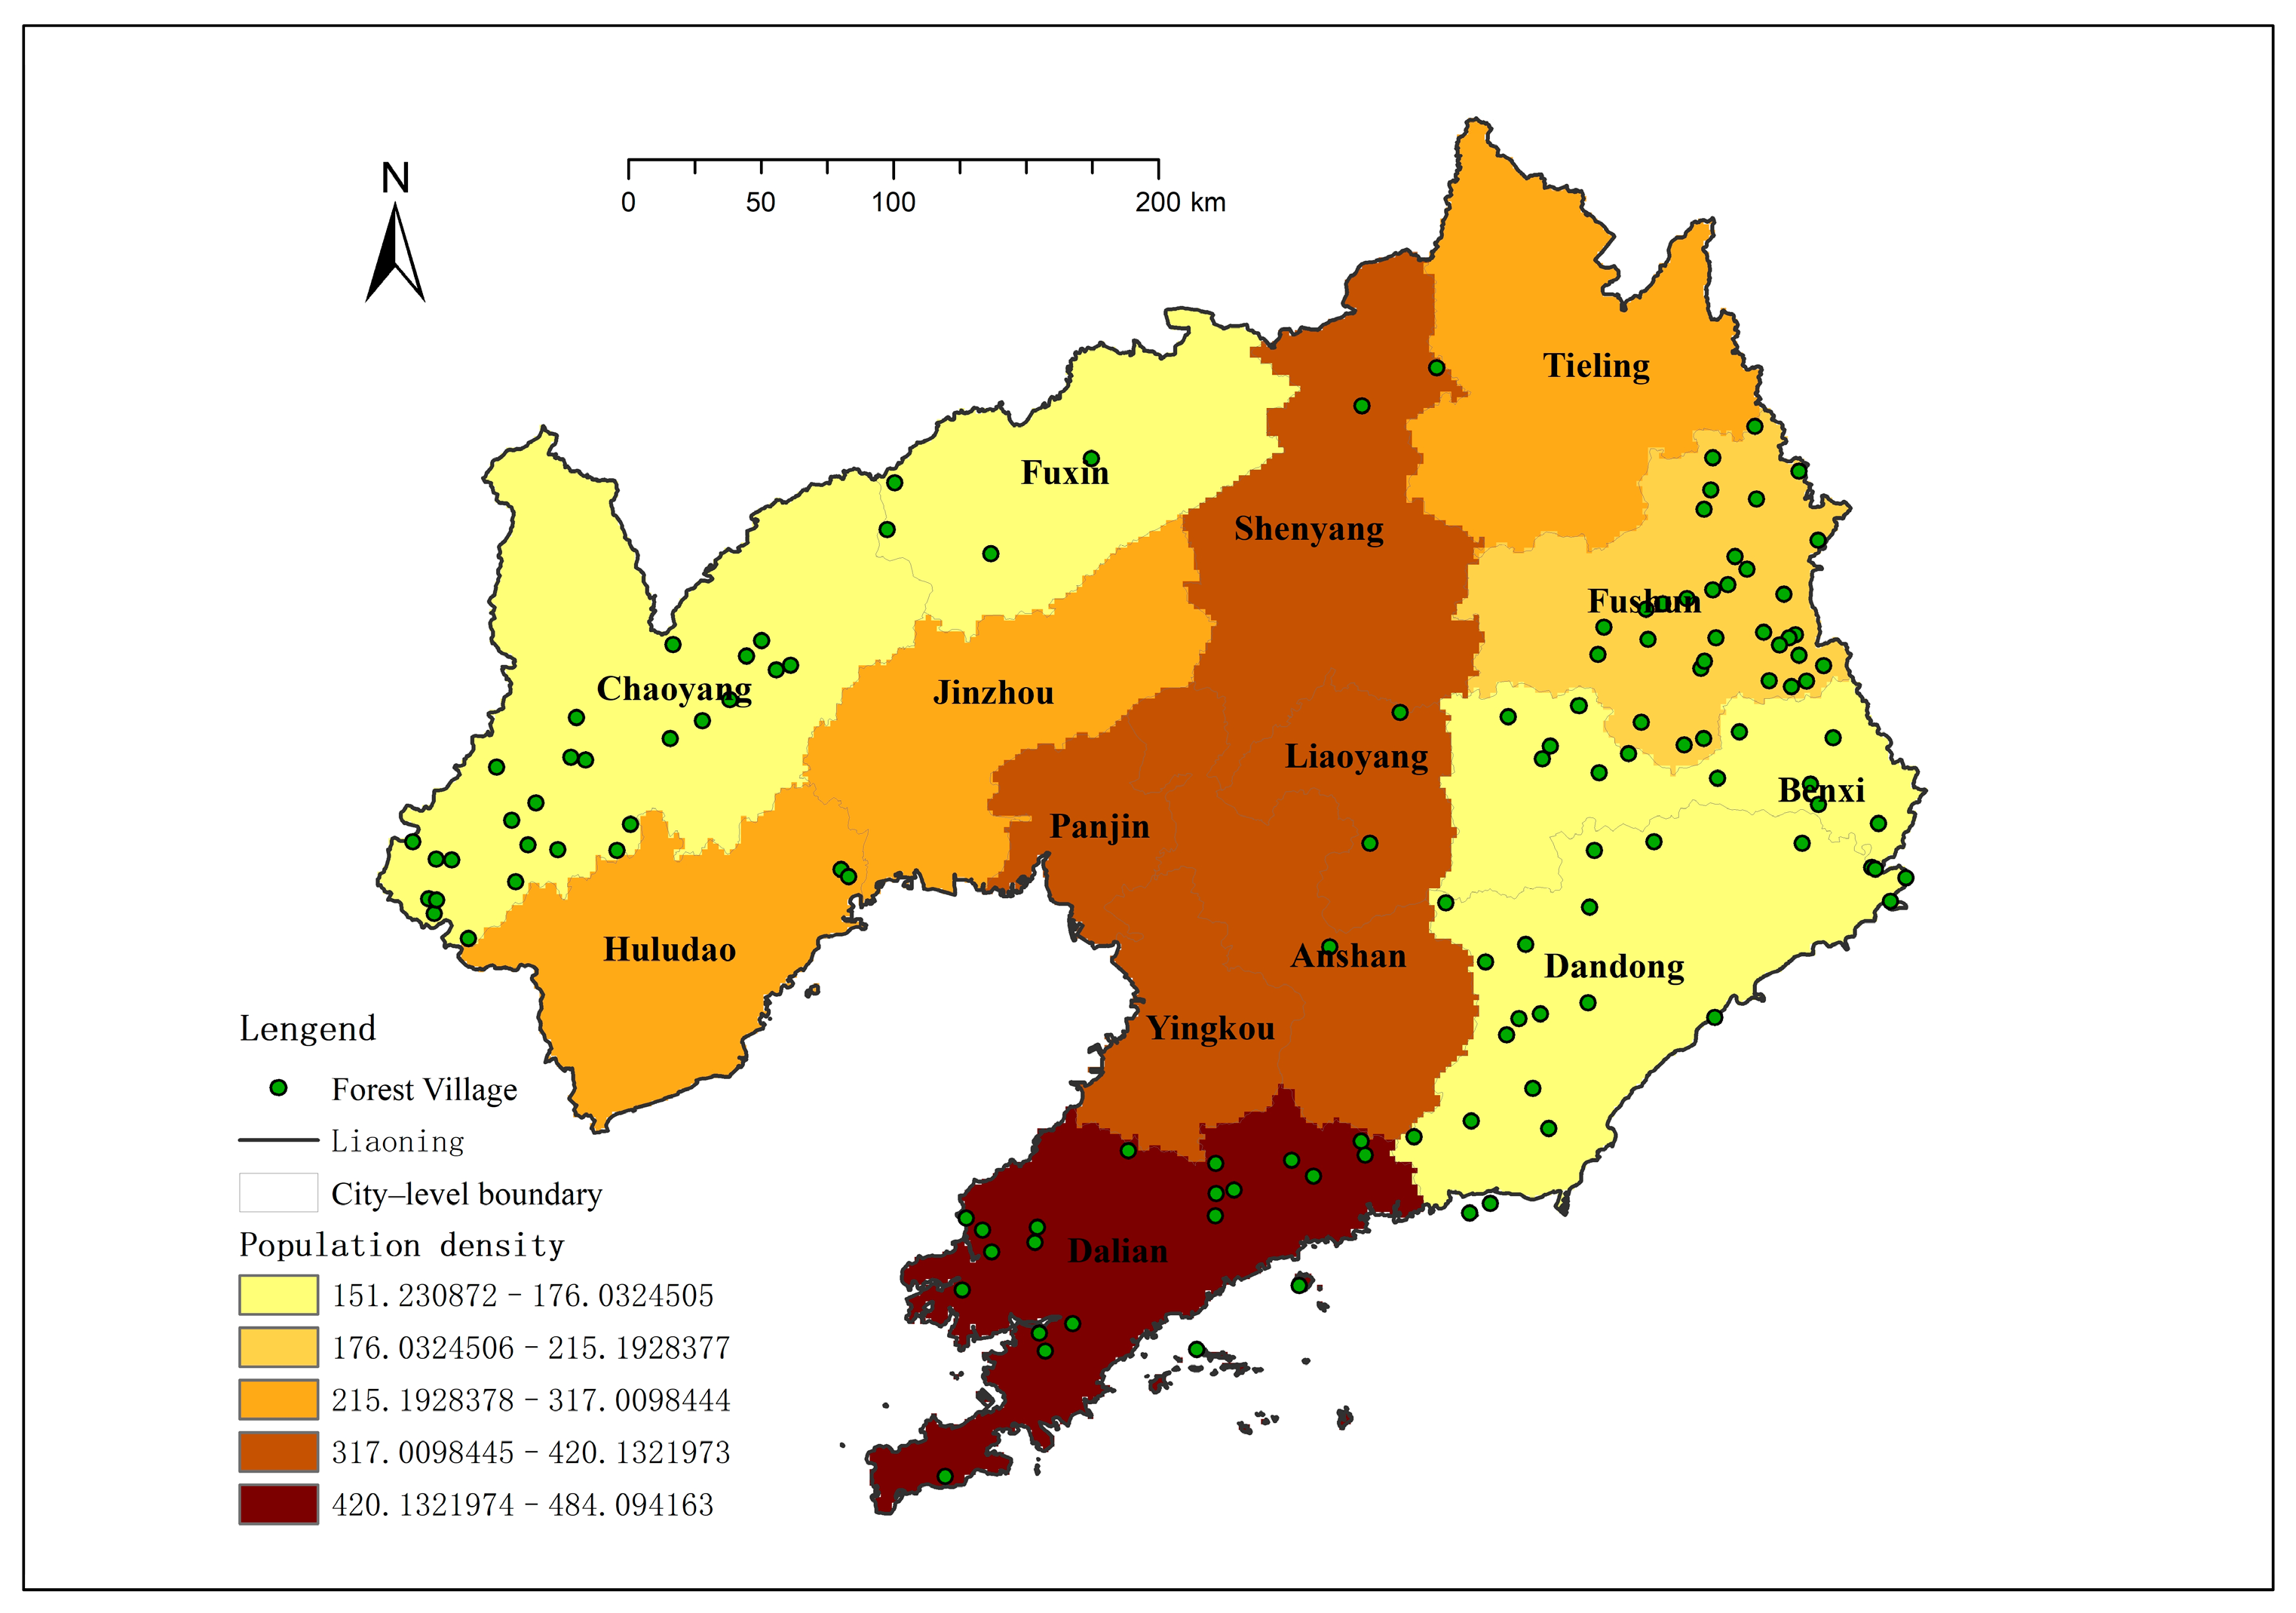
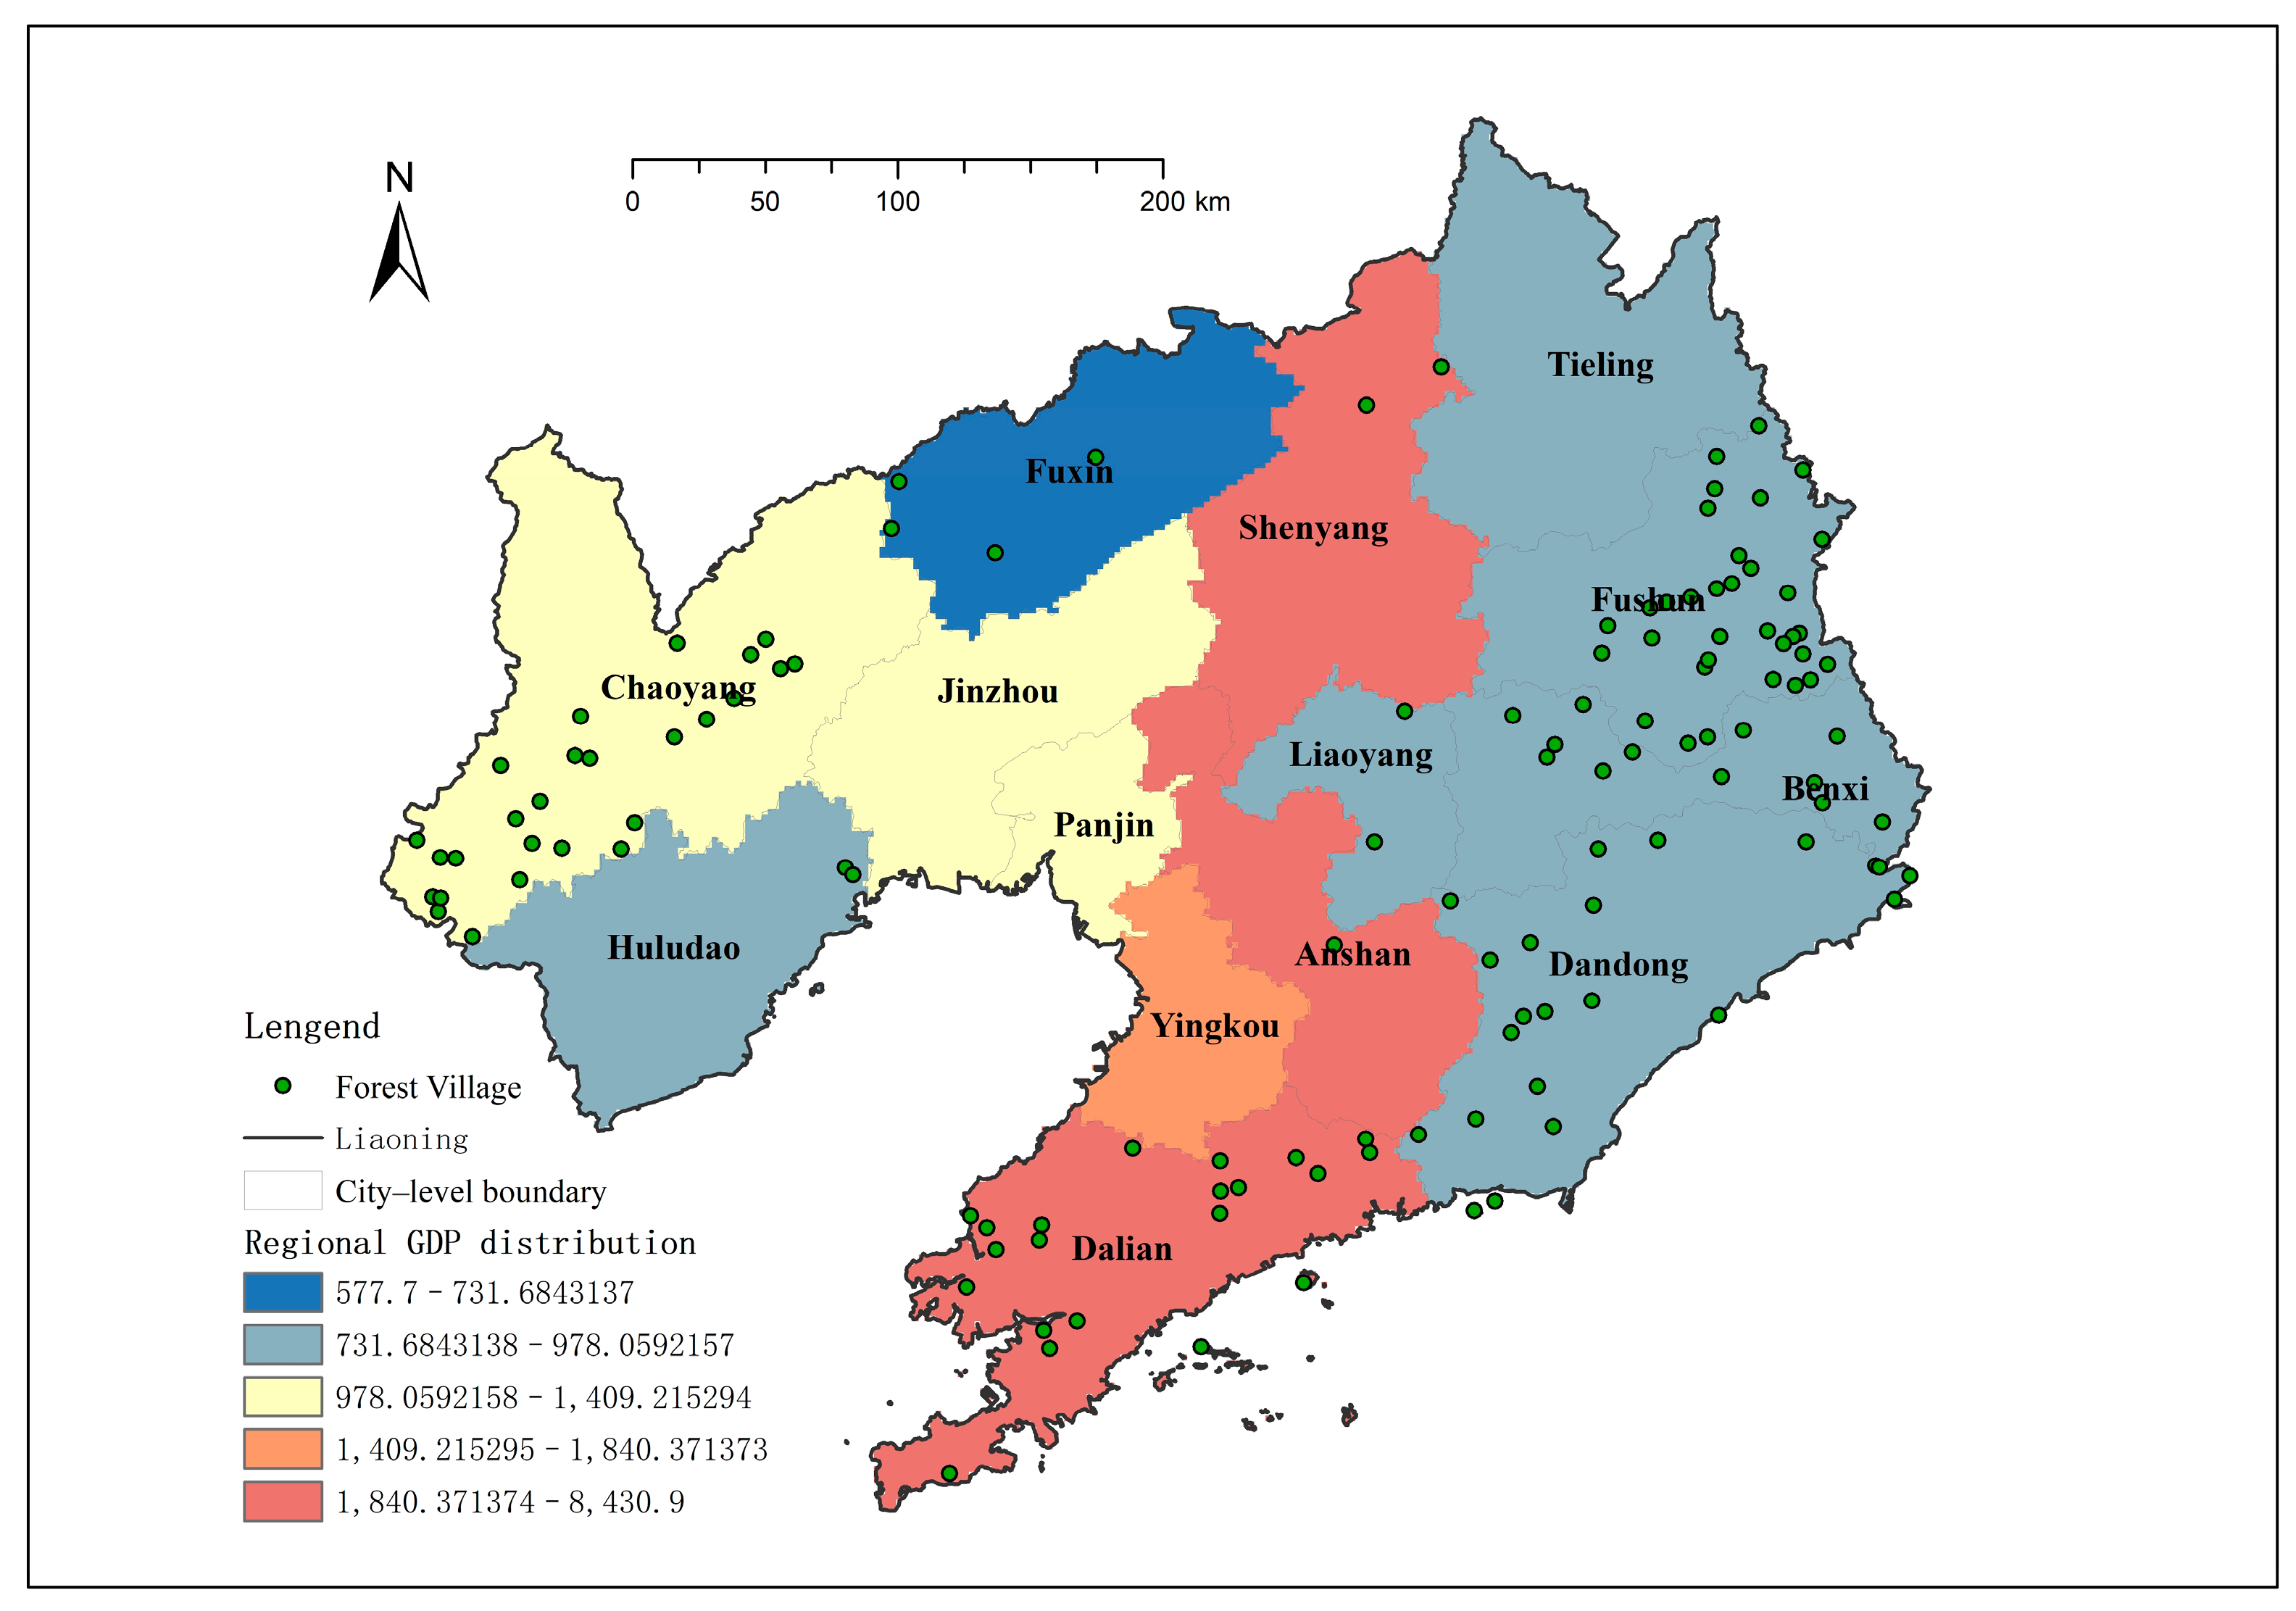
4.1.2. Socio-Economic Factors

(1) Population size
Population aggregation is the basis of rural production. Balanced population density can improve the capacity of the tourism market, promote the development of tourism resources, and thus affect the layout and development of forest and rural areas. The population density of each city is calculated according to the Statistical yearbook of Liaoning Province in 2023 and it is superimposed with the distribution of forest and rural areas. The average population density of Liaoning Province is 280 people/km2, higher than the average of 148 people/km2 in China. It can be seen from Figure 10 that the population distribution characteristics of Liaoning Province have a certain correlation with the terrain, and the population in the east and west are relatively sparse. The eastern region is mostly the remnant of Changbai Mountain, such as Benxi and Dandong. The mountainous area restricts agricultural land and urban development, and the population distribution is relatively sparse. The west is dominated by hills and plains, with low population density due to precipitation and economic reasons. It can be seen from the figure that the population density in the east and west is between 151 and 215 people/km2, but there are 97 forested villages in these regions, accounting for about 77% of the total. This also shows that the appropriate population size is conducive to the construction and development of forest villages. While a sufficient population can increase the necessary labor force, overpopulation can also put pressure on the ecological environment and limit the sustainable development of forested villages.
(2) Level of economic development
The level of regional economic development determines the protection and development of national forest villages to a certain extent and is also an important factor affecting the development of rural tourism. Based on the Statistical Yearbook of Liaoning Province in 2023, this study selected the GDP data of each city and the distribution of forest villages to superimpose, as shown in Figure 11. In the lower GDP range (731~97.8 billion CNY) and the medium GDP range (978~140.9 billion CNY), the number of forest villages is greater, 74 and 26, respectively. In the high GDP range (1409~843 billion CNY) and the low GDP range (577~73.1 billion CNY), the number of forest villages is only 24 and 4, respectively. This shows that there are more forest villages in the less developed cities, and the development of forest villages and rural tourism needs a moderate level of economic development. Due to urbanization in developed areas, forest and rural resources will be scarce.

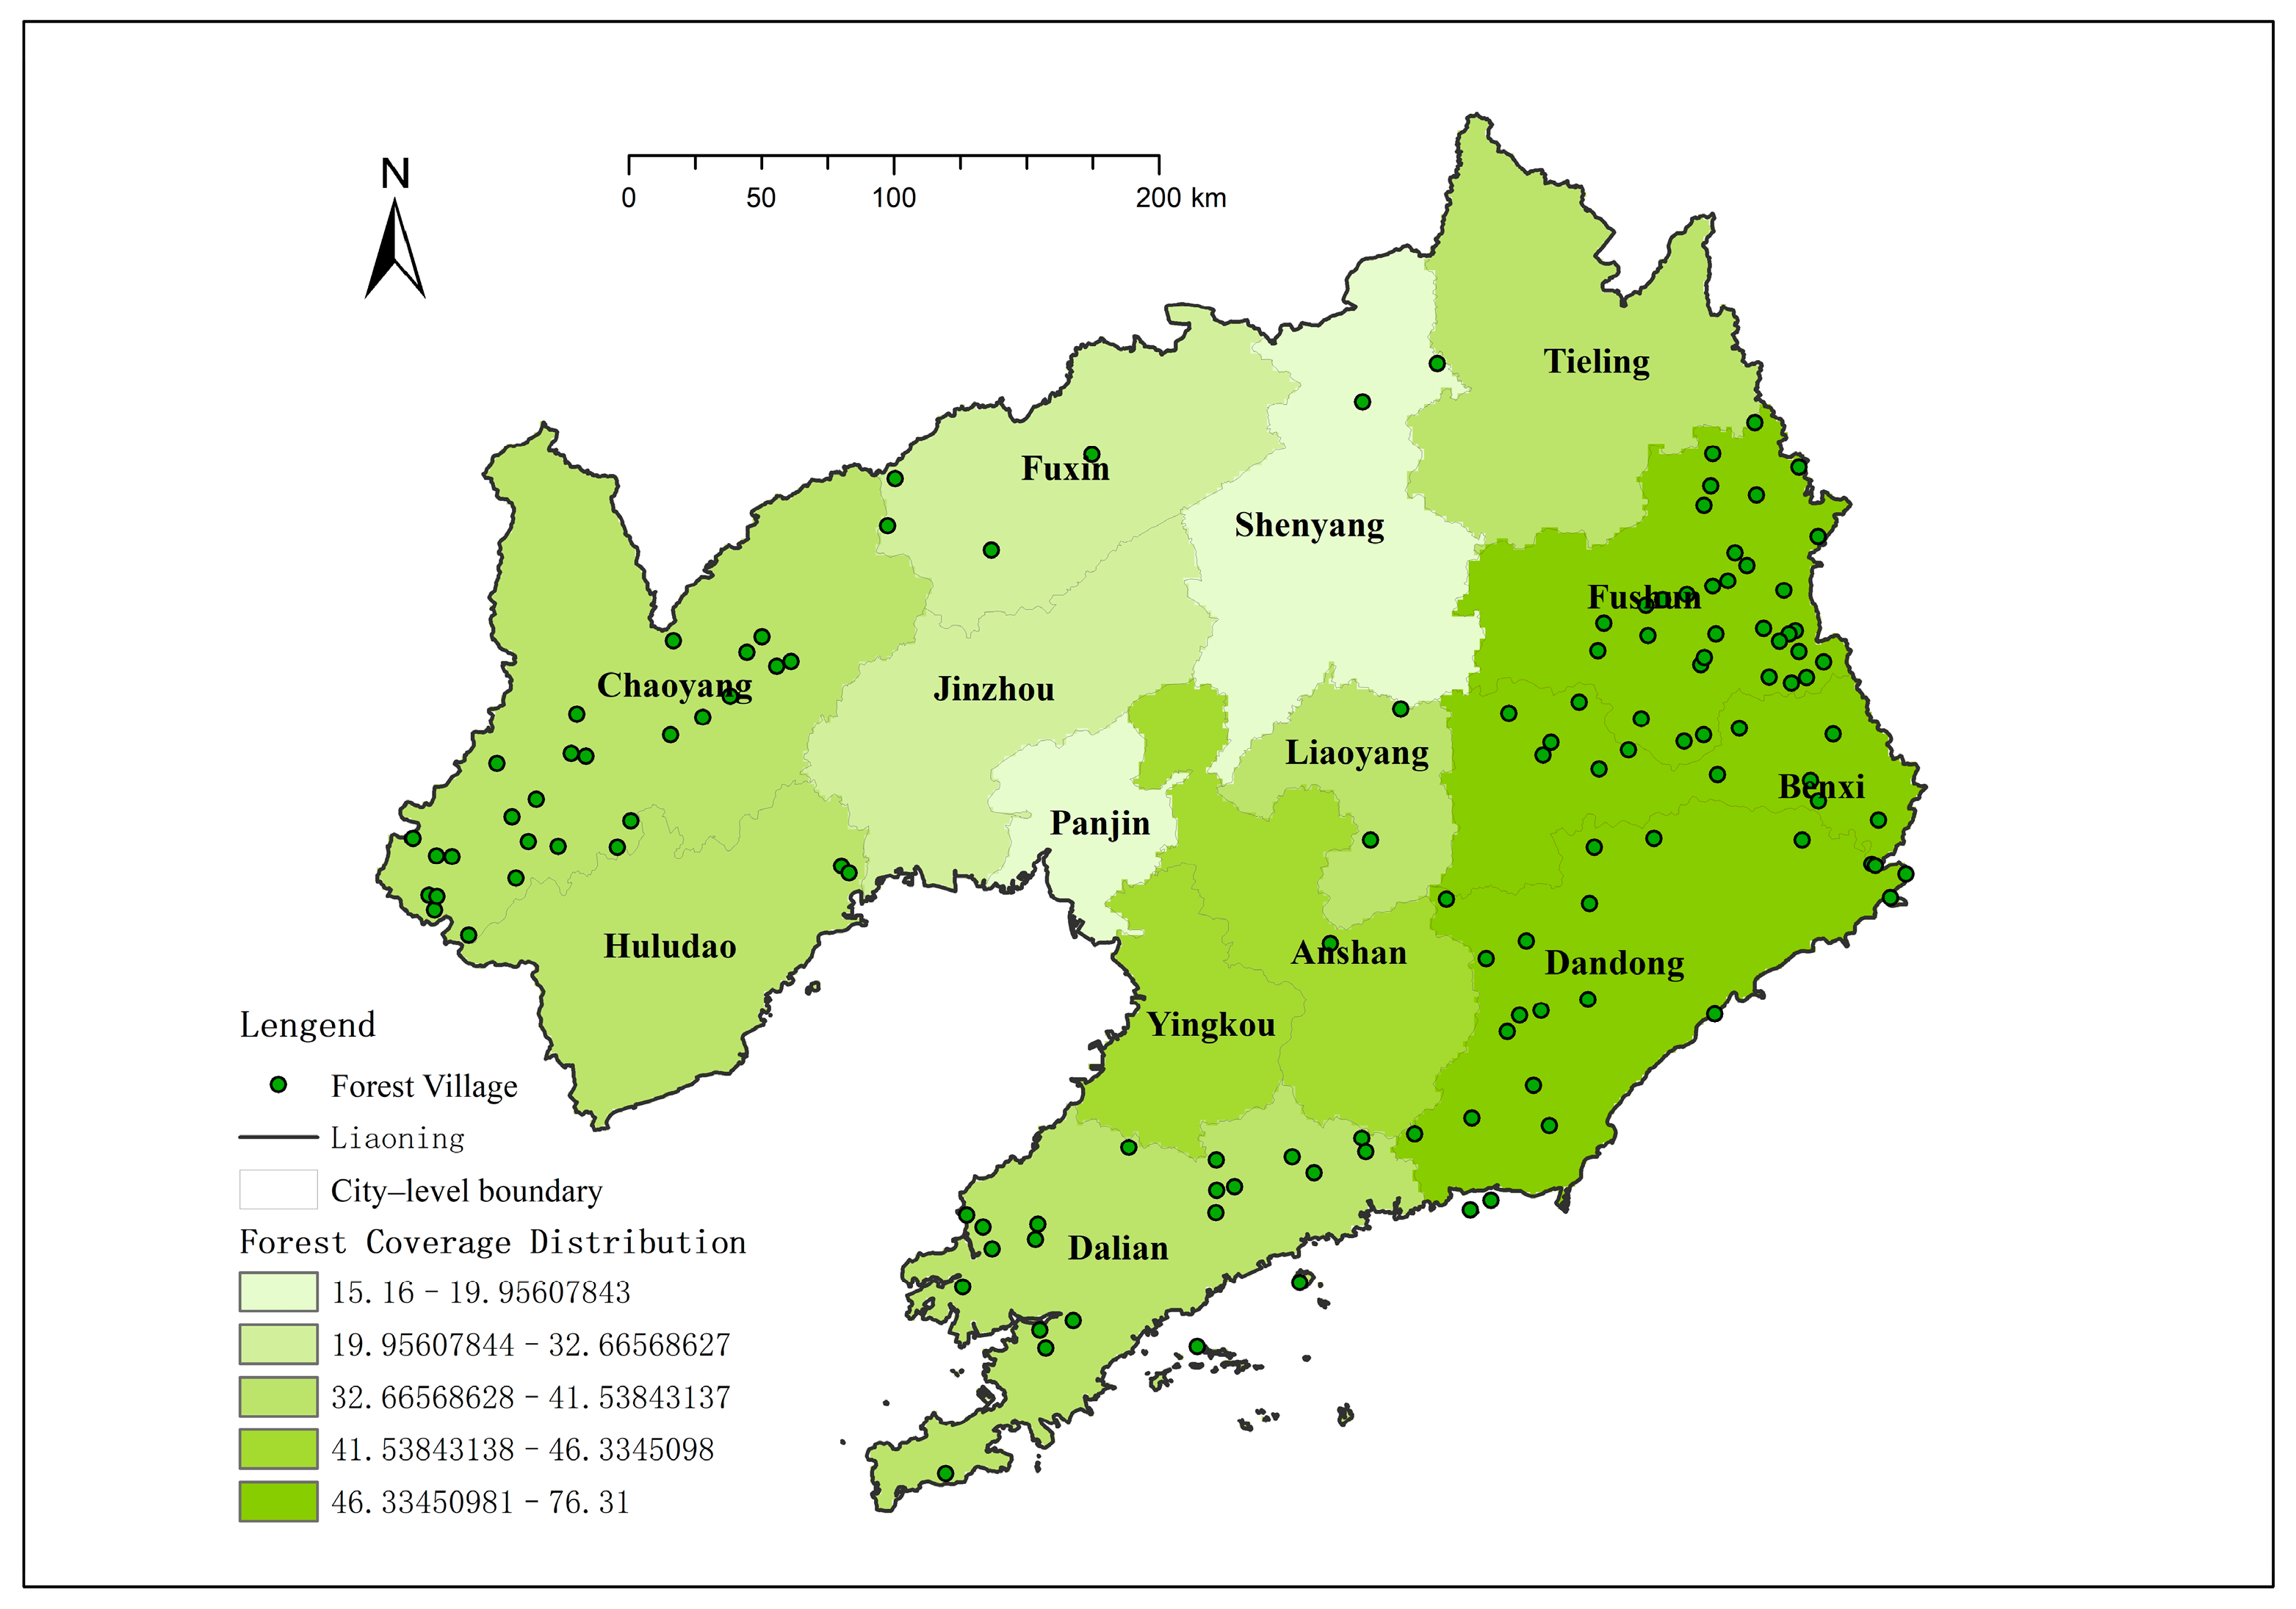
4.1.3. Forest and Rural Tourism Endowment

(1) Forest coverage rate
The national forest village is based on forest resources and developed because of its unique leisure and sightseeing value. Reasonable planning of forest resources is helpful to promote the growth of rural tourism. As an important index to measure forest resources, the forest coverage rate is worthy of in-depth analysis. According to the superposition analysis of forest coverage rate and forest villages in Liaoning Province (Figure 12), the overall forest resources in Liaoning Province are good, except in Shenyang and Panjin, and the average forest coverage rate of the province is about 40%. Forest resources are mainly concentrated in the mountainous areas of eastern Liaoning and the coastal areas of southeast China. The number of forest villages with a forest coverage rate of more than 40% is 89, accounting for 71% of the total. Although Chaoyang does not reach the average line, due to its large arable land and the implementation of the restoration project, the number of forest villages in Chaoyang is 26. In contrast, although the forest coverage rate of Yingkou and Anshan is more than 45%, the number of forest villages needs to be improved.
(2) Transportation and location.
A road is an important connection between the village and the city and between the village and the village, is an important channel of information flow [52], and is also an important infrastructure connecting the source and destination of tourists. In the process of developing rural tourism, the accessibility of forest rural roads directly affects the attraction of the area to tourists. The ArcGIS10.2 software was used to analyze the 1–3 km buffer zone of the highway network in Liaoning province, and the road distance distribution between the buffer zone and the forest village was superimposed (Figure 13). The spatial distribution of the traffic network to the forest village is reflected in different buffer zones. Figure 14 shows the distribution frequency of forest villages under different road distances. In total, 81 villages are within 1 km of the nearest road, accounting for 64.8%. More than half of the forested villages are within a 15-min walking radius of the road. According to the frequency distribution diagram of the distance between forest villages and highways, the number of forest villages in Liaoning Province takes 3 km as the node and decreases with the increase in distance from highways. Within 3 km from the highway, the number of forest villages accounts for 90%, indicating that the distribution of forest villages is highly dependent on the traffic location conditions.

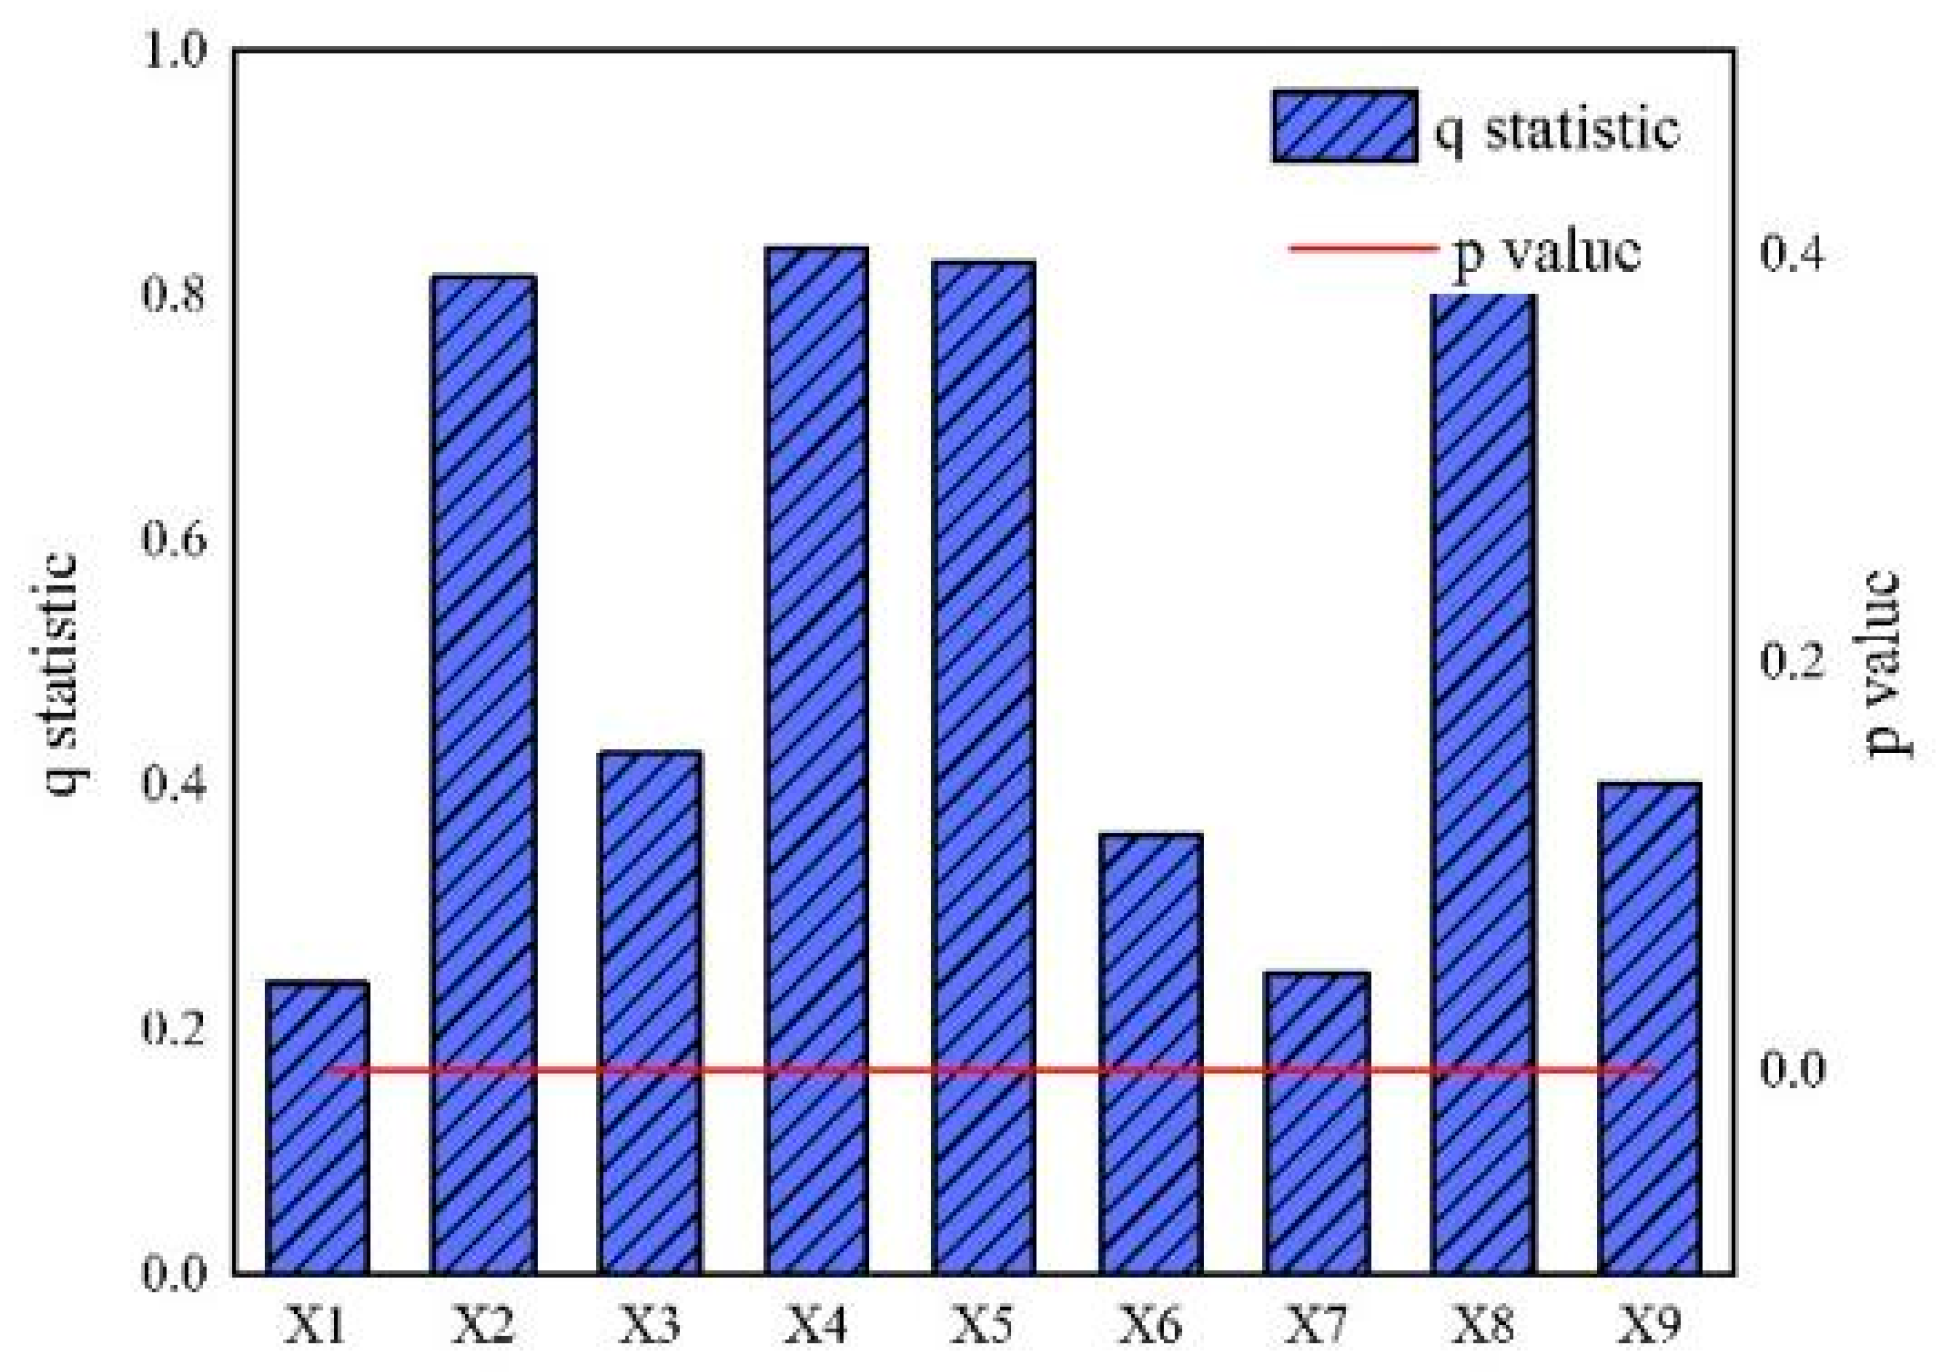
4.2. Analysis of Influencing Factors

The core density of national rural distribution in Liaoning Province (Y) was taken as the dependent variable and nine factors including elevation (X1), annual rainfall (X2), annual mean temperature (X3), economic development level (X4), population density (X5), urban total population (X6), river network density (X7), forest coverage rate (X8), and road network density (X9) were taken as independent variables. Then, they are divided into five levels by the natural breakpoint stratification method, and the geographical detector factor detection method (Formula (5)) is used to analyze the spatial differentiation and factor influence of forest villages in Liaoning Province. The results of q values of each impact factor are shown in Figure 15, which are sorted by explanatory ability as follows: X4 Economic development level (0.838) > X8 forest coverage rate (0.834) > X5 population density (0.827) > X2 annual rainfall (0.815) > X3 annual average temperature (0.426) > X9 road network density (0.401) > X6 total urban population (0.360) > X7 river network density (0.247) > X1 elevation (0.238). The p values are all 0.00, indicating that the influencing factors have a significant impact on the spatial distribution of forest villages in Liaoning Province.
According to the results, the economic development level (X4) has the greatest influence on the distribution of forest villages. The appropriate economic level provides the material basis for the village, can effectively protect the forest ecological resources, and can increase the per capita disposable income so as to stimulate the tourism demand and promote rural development. Forest coverage (X8) also plays an important role in the distribution of forest villages. This is because in the areas with rich forest resources and high coverage rates, it is often easier to form forest rural gathering areas, which provides more opportunities for the development of forest tourism resources. Population density (X5) also has a great influence on the layout of forest and rural areas in Liaoning Province because people are the main body of production, life, and tourism, and population density determines the development potential of rural tourism to a certain extent. Appropriate population density will promote the improvement in local infrastructure construction, promote the tourism consumption of surrounding residents, and attract more tourists. In the traditional sense, the river system (X9) and elevation (X1) have a great influence on the distribution of forest villages but the correlation between them and the distribution of forest villages in Liaoning Province is not strong. This is because most of the forests in Liaoning Province are located in areas with low or medium elevations, and the maximum elevation difference is 1000 m. Climate conditions such as temperature and rainfall in these areas are relatively mild, which weakens the influence of rivers and altitude on forest and rural distribution to a certain extent. Therefore, for the central region of Liaoning Province, making full use of its high forest coverage rate, the development and construction of forest villages have certain conditions and potential.

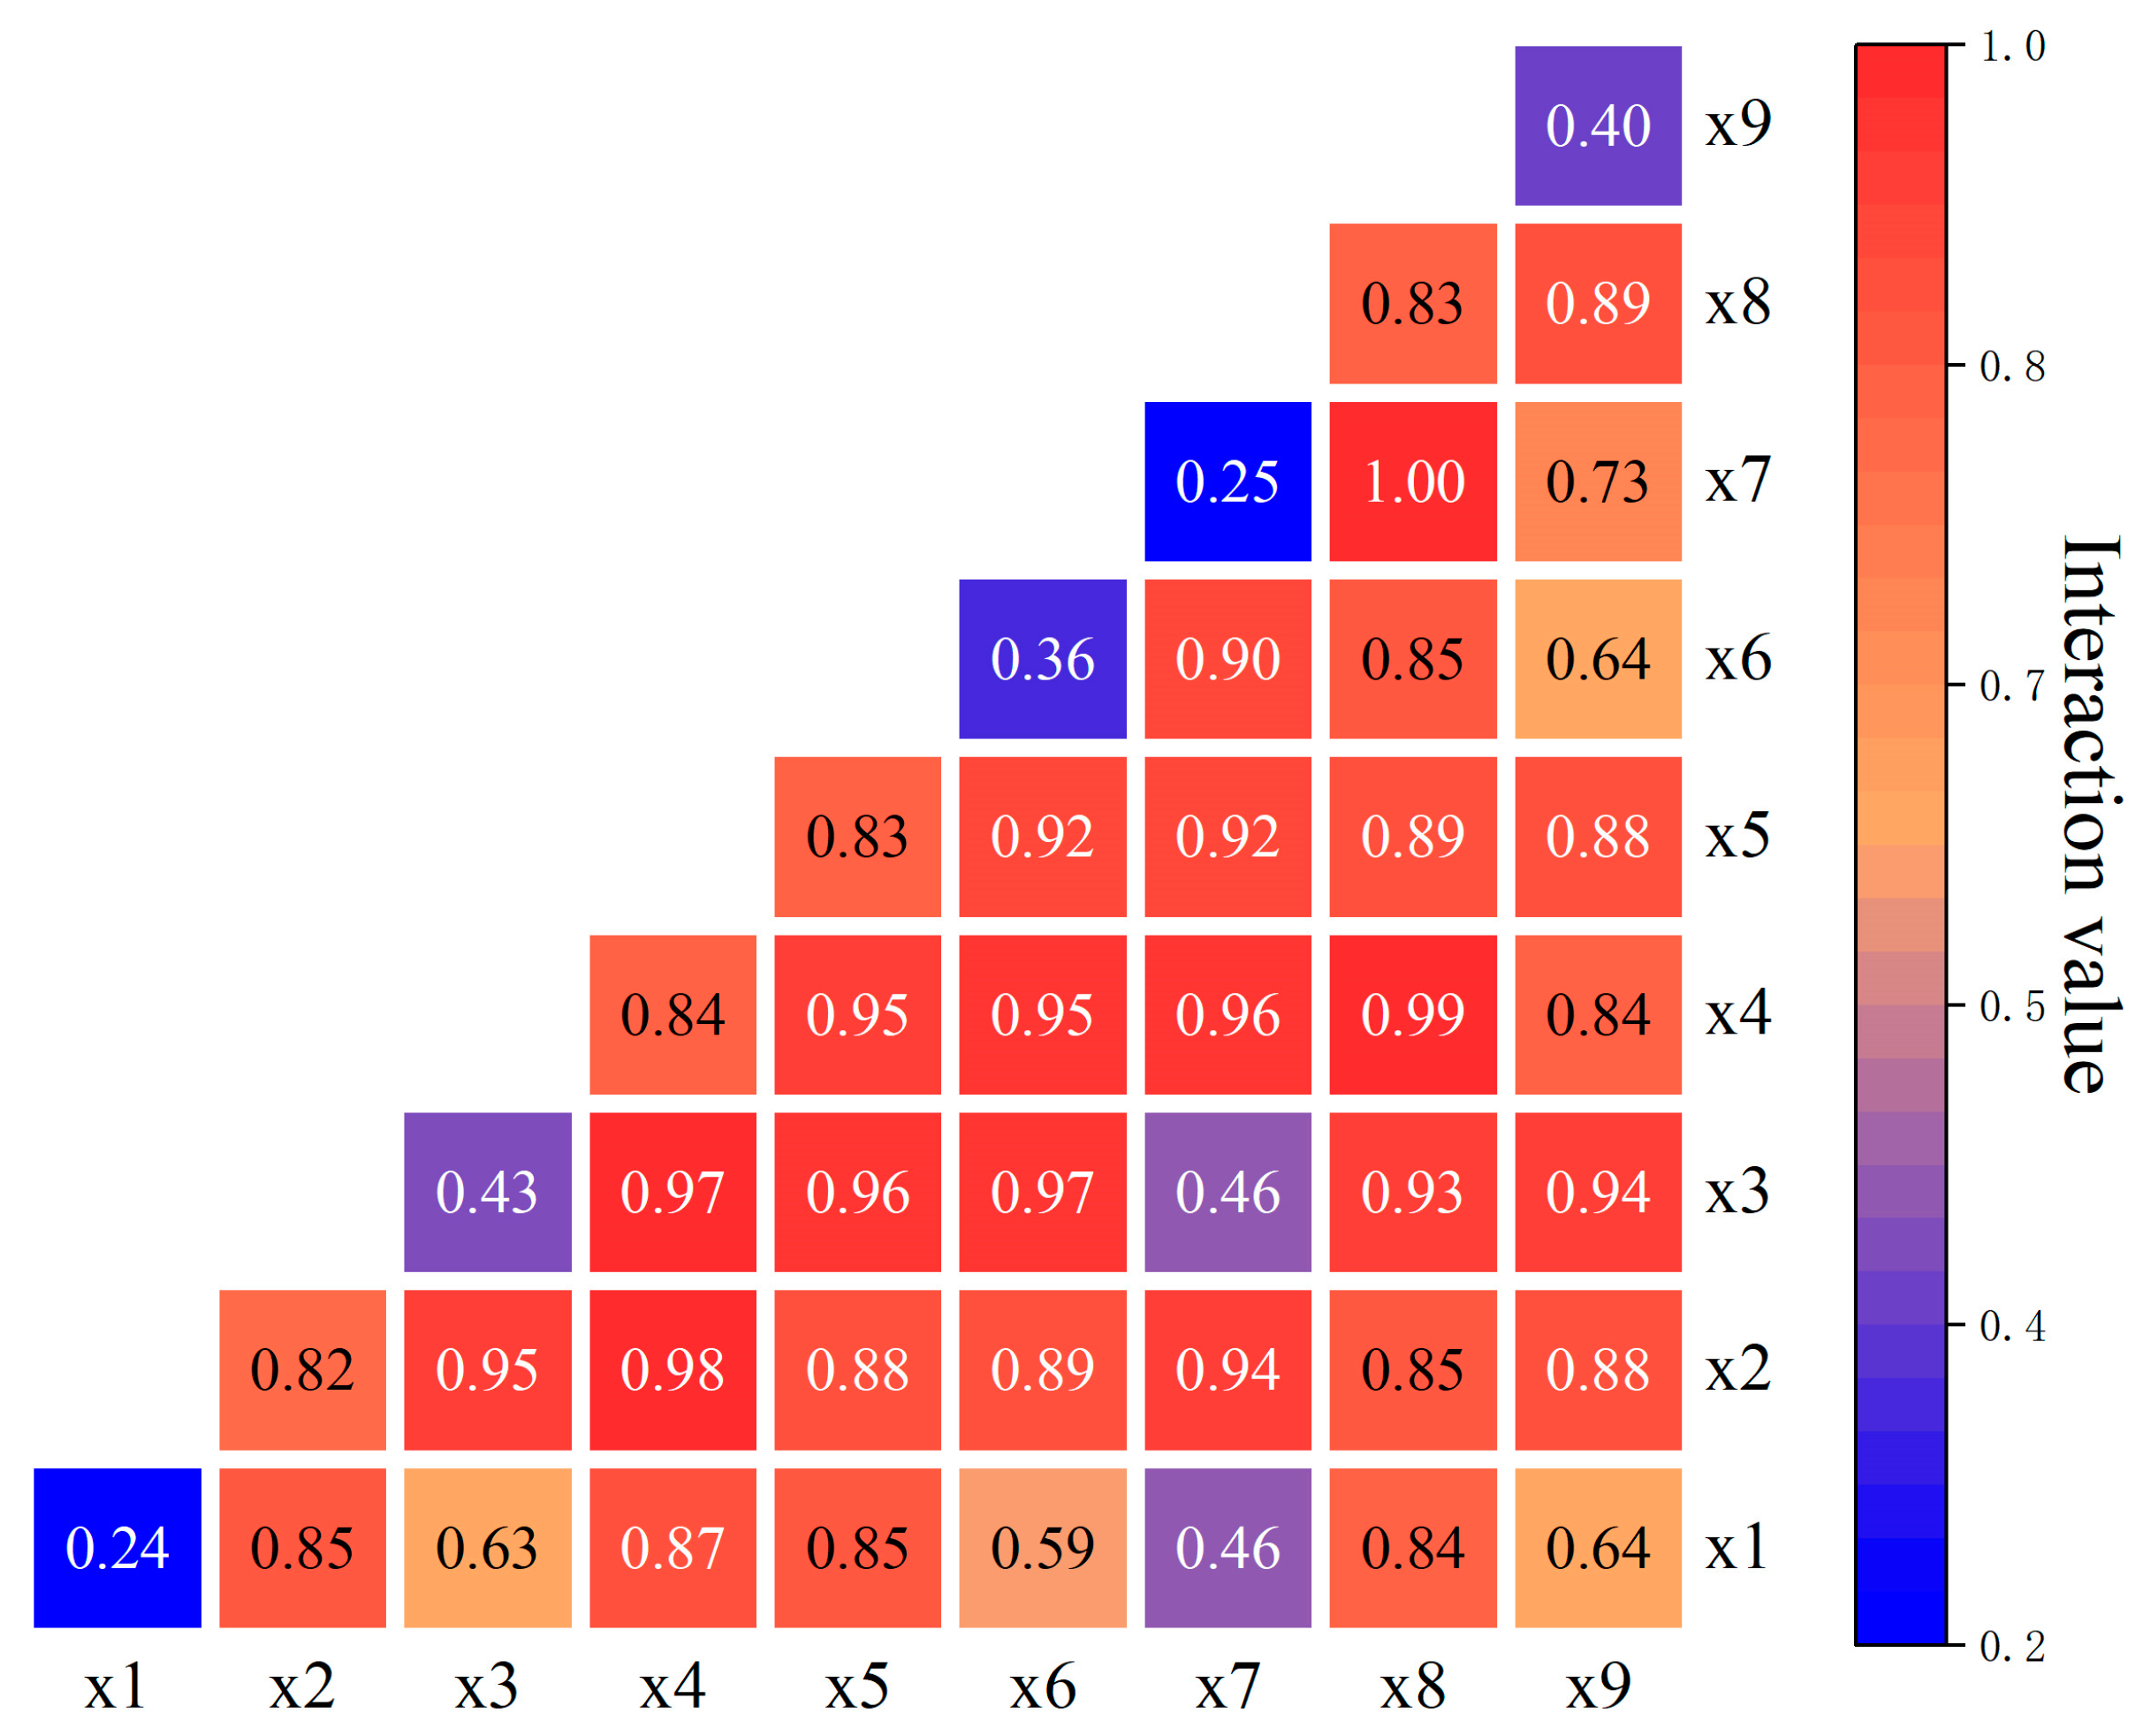
4.3. Factor Interaction Analysis

In order to evaluate the ability of the two factors to explain spatial differentiation and explore the resultant effect of each factor on the spatial layout of forest cities in Liaoning province, this paper conducted an interactive analysis of the influencing factors. The results show (Figure 16) that the interaction of multiple factors has a greater impact on the distribution of forest and rural areas than that of a single factor, and the interaction presents two types of double-factor enhancement and nonlinear enhancement. Among them, river network density (X7) ⋂ forest coverage rate (X8) (q = 1) has the most significant impact on nonlinear growth, followed by economic total (X4) ⋂ forest coverage rate (X8) (q = 0.986) and economic total (X4) ∩ annual rainfall (0.981). It shows that in addition to the key factors such as forest coverage rate and economic output value, some independent factors with low effect will produce a strong driving force after the interaction, such as river network density, urban total population, and road network density. By analyzing the results of the interaction of each factor, the cooperative driving relationship between the factors are reflected to a certain extent, providing a decision on composite factors for the next forest and rural planning.

5. Discussion and Conclusions

5.1. Discussion

This paper examined 125 national forest villages in Liaoning Province to reveal the spatial pattern of forest rural tourism sites in Liaoning Province using the spatial analysis method. Firstly, the ArcGIS10.2 software was used to analyze the distribution pattern and characteristics of forest villages in Liaoning Province by using the methods of nearest proximity index, geographical concentration index, imbalance index, and nuclear density analysis. Then, the influence factors were quantified, and the results were superimposed with the forest and rural spatial layout. Finally, the main factors affecting the spatial distribution difference between forests and villages were discussed by using the method of a geographic detector. The analysis shows that the spatial distribution of forest villages in Liaoning Province is mainly affected by natural environment factors, social and economic factors, and forest and rural tourism endowment. Among them, landform, river system, rainfall and temperature, and forest resource endowment are the internal influencing factors. Traffic location, population size. and economic development level are external factors. The study shows that the spatial distribution of forest villages in Liaoning Province is clustered, with two high-density spatial clusters located in the northeast and the west, and the medium-density zone is in the Liaodong Peninsula connected with the high-density region in the northeast.
All the factors affected the distribution of forest and rural areas, but there were significant differences in the intensity and mode of action. In terms of natural environmental factors, forest rural tourism sites in Liaoning Province are mainly distributed in areas with low altitude (X1), moderate temperature (X4), and moderate rainfall (X3), which is the same as the distribution of tourism key villages in Chengdu-Chongqing and other areas [53]. However, the degree of influence of river network density is inconsistent with working hypothesis H1 and related studies [36]. This is because compared with ordinary villages, the location decision of forest villages is more focused on the ecological environment and comprehensive natural conditions, and the degree of dependence on river network density is relatively low. In terms of social factors, the spatial distribution of forest villages is different from the spatial distribution of other traditional villages in different regions [38,39], which is also different from the working hypothesis H2. For general villages, the higher the degree of economic development, the more perfect the infrastructure often can be, thus attracting more tourists to gather and promoting the development and prosperity of the village. However, for the forest villages in Liaoning Province, the q value of economic development level (X5) is the largest in the detection results, which means that the coupling between economy and forest village distribution is the largest. Through the superposition analysis of GDP and forest villages, it can be seen that the coordination between the two is poor, and 80% of the villages are distributed in the cities with GDP below the medium range. This is mainly because forest villages need a unique ecological environment and forest resource endowment, and economically developed cities often have a higher urbanization rate. This phenomenon in turn affects the urban ecological environment, thus affecting the development of forests and rural areas. This also explains the strong coupling between population density (X6) and forest and village, but the degree of positive correlation is not high. The interaction between population density and GDP results in two-factor enhancement, that is, the two promote each other. In other words, the higher the level of economic development of the city, the more concentrated the population. The higher the total population (X7) and the higher the population density, the negative impact on the spatial layout of forest and rural areas. In terms of tourism endowments, although the influence of road network density (X9) on accessibility and tourist site agglomeration is consistent with the H3 hypothesis [42], the difference in forest coverage rate (X8) has a more significant effect on forest rural layout. This shows that forest resources not only directly enhance the regional ecotourism attraction but also become an important symbol of forest villages differently from other villages.

5.2. Research Limitations

This study adopts the spatial analysis method, different from the qualitative analysis of previous studies, and adopts the quantitative analysis, which is expected to provide new ideas for the ecological protection and tourism development of national forests. This quantitative analysis takes the forest villages of Liaoning Province as tourism sites, analyzes their spatial distribution from the perspective of geography, and identifies the relative influence degree of influencing factors. However, there are some limitations to this study. (1) It does not address the specific characteristics and attributes of each forested village, which may weaken the explanatory power of the influencing factors. (2) Since the concept of “forest village” has not been put forward long, there is a lack of data related to forest village tourism, such as the number of tourists, tourism income, infrastructure, etc., so this study only focuses on the distribution and influencing factors of a forest village as a tourism site. With the improvement in the database, the evaluation results can be more accurate.

5.3. Future Research

The next step will focus on the study of land use change in the context of forest and rural tourism development. By predicting the change in spatial layout, the interaction between them was analyzed. By improving forest and rural tourism-related data, a comprehensive evaluation system from macro to micro tourism resources, ecological landscape, and land use was established. On this basis, combined with remote sensing technology and a geographic information system (GIS), the land use change trend of forest and rural areas was accurately monitored, the future evolution of land use pattern was predicted by using a spatial analysis model, and the land development potential and ecological protection priority areas were identified. Finally, a set of scientific and reasonable forest village planning and layout schemes was proposed, which strives to find the best balance between ecological protection, sustainable tourism development, and rural revitalization and provides a decision-making basis for decision makers.

5.4. Conclusions

Existing studies mainly focus on natural or social factors such as river basin, sociocultural, ecological, and tourist behavior and lack comprehensive spatial analysis of forest and rural multi-factors superimposed within provincial administrative regions. This study takes the distribution of national forest cities in Liaoning Province as the research object, uses GIS and Python for statistical analysis, and combines a variety of models for more extensive and detailed spatial analysis. Nine influence factors were quantified, and the correlation between each influence factor and its spatial distribution was discussed. Finally, the Geo-Detector method was used to analyze the effects of different factors and their interactions, so as to more comprehensively quantify the driving effects of each factor on the spatial layout of forest city. The purpose is to provide a reference for the balanced distribution of tourism resources in the next step.
The results suggested that the balance of forest and rural tourism sites should be improved from the following aspects. (1) According to the distribution characteristics of forest resources, strengthen ecological protection in high-density areas, build ecological corridors in medium-density areas, and promote reasonable development in low-density areas through policy guidance, so as to improve the overall spatial balance. (2) Improve infrastructure construction, optimize the layout of the road network, and enhance the accessibility of forest villages to promote the development of rural tourism, and improve tourist mobility and regional linkage effect. (3) Improving the economic resilience of forest villages through the development of ecological agriculture, forest health, and other industries, optimizing the matching of population and resources, and realizing the coordinated development of ecological protection and economic growth in Liaoning Province.

Author Contributions

Conceptualization, L.Q. and R.Y.; Software, L.Q.; Data curation, L.Q.; Formal analysis, J.D.; Investigation, J.D.; Writing—original draft preparation, L.Q.; Writing—review & editing, L.Q. and R.Y.; Supervision, R.Y.; Project administration, R.Y. All authors have read and agreed to the published version of the manuscript.

Funding

This research was funded by the General Program of the National Social Science Fund of China (Grant No. 19BMZ087).

Data Availability Statement

Data will be made available on request.

Conflicts of Interest

The authors declare no conflicts of interest.

References

  1. Jin, Y.; Du, X.; Zhao, G.; Zhu, Z. Forest Village Construction in China: Practices and Development Strategy. Lin Cao Zhengce Yanjiu 2024, 4, 43–49. Available online: https://kns.cnki.net/kcms2/article/abstract?v=2Z_8GvOTliXEh29YB0ditwjxL_dwLssJHRVgAoKFd5GEmCFWBWUQolO3l93t6gL6PKJaHk9a6PL4YS7cxXcYsaupLiuuvm7ssOpnu-vv3nXtV7sVsG-WFwwyY4Jij6nuVYu044MZIk10_KIPYOgMCudI_YsYmUihdmCrGwV34sYaFJzZLxeFv3eDU-zCgaNBMj9tp_uLW7c=&uniplatform=NZKPT (accessed on 5 December 2024).
  2. National Forestry and Grassland Administration. Notice on the Evaluation and Certification of National Forest Villages (Document No. Lin Shengfa [2019] 77); National Forestry and Grassland Administration: Beijing, China, 2019. (In Chinese) [Google Scholar]
  3. Guo, Z. Research on the Coordinated Promotion of New Urbanization and Rural Revitalization Strategy. Decis. Explor. 2020, 4, 10–12. (In Chinese) [Google Scholar] [CrossRef]
  4. Zheng, Q.; Tian, T.; Yang, X. The Spatial Distribution and Influencing Factors of the National Forest Villages in China. J. Chin. Ecotourism 2021, 11, 441–454. [Google Scholar] [CrossRef]
  5. Ahn, D.; Kang, S.; Jeong, N. Plans for Turning the Culture and History of Rural Village Forest Landscape into a Tourism Resource. J. Recreat. Landsc. 2016, 10, 61–71. [Google Scholar]
  6. Senetra, A. Forests as an Important Spatial Element in Elaboration of the Esthetic Value Maps for Rural Landscapes. Sylwan 2015, 159, 757–766. [Google Scholar]
  7. Hoffmann, E.M.; Schareika, N.; Dittrich, C.; Schlecht, E.; Sauer, D.; Buerkert, A. Rurbanity: A concept for the interdisciplinary study of rural–urban transformation. Sustain. Sci. 2023, 18, 1739–1753. [Google Scholar] [CrossRef]
  8. Bren d’Amour, C.; Reitsma, F.; Baiocchi, G.; Barthel, S.; Güneralp, B.; Erb, K.-H.; Haberl, H.; Creutzig, F.; Seto, K.C. Future urban land expansion and implications for global croplands. Proc. Natl. Acad. Sci. USA 2017, 114, 8939–8944. [Google Scholar] [CrossRef]
  9. Angel, S.; Lamson-Hall, P.; Blei, A.; Shingade, S.; Kumar, S. Densify and Expand, a Global Analysis of Recent Urban Growth. Sustainability 2021, 13, 3835. [Google Scholar] [CrossRef]
  10. Marconcini, M.; Metz-Marconcini, A.; Esch, T.; Gorelick, N. Understanding Current Trends in Global Urbanisation—The World Settlement Footprint Suite. GI_Forum 2021, 12, 33–38. [Google Scholar] [CrossRef]
  11. van Vliet, J.; Birch-Thomsen, T.; Gallardo, M.; Hemerijckx, L.M.; Hersperger, A.M.; Li, M.; Tumwesigye, S.; Twongyirwe, R.; van Rompaey, A. Bridging the Rural–Urban Dichotomy in Land Use Science. J. Land Use Sci. 2020, 15, 585–591. [Google Scholar] [CrossRef]
  12. Ríos-Llamas, C.; Hernández-Vázquez, S. Counterurbanization in the peri-urban forest of Guadalajara, México. Rev. Econ. e Sociol. Rural 2024, 62, e275967. [Google Scholar] [CrossRef]
  13. Ordónez, C.; Duinker, P.N. Urban forest values of the citizenry in three Colombian cities. Soc. Nat. Resour. 2014, 27, 834–849. [Google Scholar] [CrossRef]
  14. Steenberg, J.W.; Robinson, P.J.; Duinker, P.N. A spatio-temporal analysis of the relationship between housing renovation, socioeconomic status, and urban forest ecosystems. Environ. Plan. B Urban Anal. City Sci. 2019, 46, 1115–1131. [Google Scholar] [CrossRef]
  15. Romanelli, J.P.; Piana, M.R.; Klaus, V.H.; Brancalion, P.H.; Murcia, C.; Cardou, F.; Wallace, K.J.; Adams, C.; Martin, P.A.; Burton, P.J. Convergence and divergence in science and practice of urban and rural forest restoration. Biol. Rev. 2024, 99, 295–312. [Google Scholar] [CrossRef]
  16. Bamert, M.; Ströbele, M.; Buchecker, M. Ramshackle farmhouses, useless old stables, or irreplaceable cultural heritage? Local inhabitants’ perspectives on future uses of the Walser built heritage. Land Use Policy 2016, 55, 121–129. [Google Scholar] [CrossRef]
  17. Omidvar, M. (Ed.) Designing a strategic planning model for government organizations and implementing at the Iranian Information and Documentation Center, Shiraz University, Tarbiat Modarres University and Tehran Municipal Cultural and Artistic Organization. Workshop Report. 2004. (In Persian) [Google Scholar]
  18. Roknoddin Eftekhari, A.; Mahdavi, D.; Akbari Samani, N. Providing strategic planning pattern for sustainable rural tourism development. Hum. Geogr. Res. 2011, 1, 123–146. [Google Scholar]
  19. Husnaini, A. The Effect of the Existence of Pagsan Tourism Village on Changes in Land Use, Economic, and Social Communities. Int. J. Sustain. Competit. Tour. 2023, 2, 96–103. [Google Scholar] [CrossRef]
  20. Nouri, H.; Rastghalam, M.; Amini, S. Assessment of tolerable capacity in the tourist destination of villages. J. Geogr. Environ. Stud. 2024, 5, 20–39. [Google Scholar]
  21. Amru, K.; Fahmi, S.; Ningrum, M.H.; Laksmita, A.N.; Jati, E.D. Identification of Environmental Issues on the Ecoregion of Volcanic and Fluvio-Volcanic Landform in Badung Regency. J. Sylva Lestari 2022, 10, 333–344. [Google Scholar] [CrossRef]
  22. Skog, K.L.; Steinnes, M. How do centrality, population growth and urban sprawl impact farmland conversion in Norway? Land Use Policy 2016, 59, 185–196. [Google Scholar] [CrossRef]
  23. Carroll, P.; Benevenuto, R.; Caulfield, B. Identifying hotspots of transport disadvantage and car dependency in rural Ireland. Transp. Policy 2021, 101, 46–56. [Google Scholar] [CrossRef]
  24. Reshadat, S.; Zangeneh, A.; Saeidi, S.; Teimouri, R.; Yigitcanlar, T. Measures of spatial accessibility to health centers: Investigating urban and rural disparities in Kermanshah, Iran. J. Public Health 2019, 27, 519–529. [Google Scholar] [CrossRef]
  25. Kim, G.; Kang, W.; Park, C.R.; Lee, D. Factors of spatial distribution of Korean village groves and relevance to landscape conservation. Landsc. Urban Plan. 2018, 176, 30–37. [Google Scholar] [CrossRef]
  26. Meng, Y.; Cao, B.; Dong, C.; Dong, X. Mount Taishan forest ecosystem health assessment based on forest inventory data. Forests 2019, 10, 657. [Google Scholar] [CrossRef]
  27. Kearney, S.P.; Coops, N.C.; Sethi, S.; Stenhouse, G.B. Maintaining accurate, current, rural road network data: An extraction and updating routine using RapidEye, participatory GIS and deep learning. Int. J. Appl. Earth Obs. Geoinf. 2020, 87, 102031. [Google Scholar] [CrossRef]
  28. Wijana, N.; Citrawathi, D.M.; Mulyadiharja, S.; Julyasih, K.S.M.; Dewi, N.P.S.R. Results of Ethnoecological Studies in the Prospect of Forest Tourism Development in Tenganan Pegringsingan Traditional Village, Karangasem, Bali. Balt. For. 2022, 28, BF599. [Google Scholar] [CrossRef]
  29. Meng, K.; Tang, J.; Wang, M.; Zhang, B.; Yuan, H. Analysis and Empirical Study on the Influencing Factors of Residents’ Support at the Exploration Stage of Tourism Development: A Case Study of Beigang Village in Haikou City. Trop. Geogr. 2023, 1, 1–12. [Google Scholar]
  30. Cai, X.M.; Liu, M.X.; Lin, J.H.; Ma, G.Q. Dynamic representation and formation mechanism of rural gentrification in the context of tourism development: A case study of Shangliang village, Huizhou, Guangdong. Tour. Trib. 2021, 36, 55–68. [Google Scholar]
  31. Zhu, W.C.; Peng, J.; Cheng, Q.P.; Chen, P.Y.; Zhang, R.R. Land Use Changes and Spatial Evolution of Tourism Villages: Taking Two Villages of Chuzhou City as Examples. Anhui Agric. Sci. Bull. 2017, 23, 1–4. [Google Scholar]
  32. Huang, X.; Bai, O. Spatial distribution characteristics and influencing factors of forest villages in Zhejiang Province. J. Zhejiang A&F Univ. 2022, 39, 884–893. [Google Scholar]
  33. Wang, Z.; Zhu, J.; Wu, Z. Study on the Spatial Distribution Characteristics of Traditional Villages and Their Response to the Water Network System in the Lower Yangtze River Basin. Sci. Rep. 2024, 14, 22586. [Google Scholar] [CrossRef]
  34. Kong, X.S.; Fu, M.X.; Jiang, P. The spatial pattern of rural areas with Chinese characteristics and the coordination of tourism space are optimized. Acta Geo Graph. Sin. 2023, 78, 2554–2573. [Google Scholar]
  35. Luo, R.J.; Chen, X.; Xiong, L.R. Spatial distribution pattern of national forest and rural areas in Yunnan Province and its causes. J. China Agric. Resour. Reg. Plan. 2023, 44, 146–158. [Google Scholar]
  36. Wu, C.; Chen, M.; Zhou, L.; Liang, X.; Wang, W. Identifying the spatiotemporal patterns of traditional villages in China: A multiscale perspective. Land 2020, 9, 449. [Google Scholar] [CrossRef]
  37. Wei, D.; Wang, Z.; Zhang, B. Traditional village landscape integration based on social network analysis: A case study of the yuan river basin in south-western China. Sustainability 2021, 13, 13319. [Google Scholar] [CrossRef]
  38. Li, T.; Li, C.; Zhang, R.; Cong, Z.; Mao, Y. Spatial heterogeneity and influence factors of traditional villages in the Wuling Mountain area, Hunan Province, China based on Multiscale Geographically Weighted Regression. Buildings 2023, 13, 294. [Google Scholar] [CrossRef]
  39. Su, H.; Wang, Y.; Zhang, Z.; Dong, W. Characteristics and Influencing Factors of Traditional Village Distribution in China. Land 2022, 11, 1631. [Google Scholar] [CrossRef]
  40. Chen, W.; Yang, L.; Wu, J.; Wu, J.; Wang, G.; Bian, J.; Zeng, J.; Liu, Z. Spatio-temporal characteristics and influencing factors of traditional villages in the Yangtze River Basin: A Geodetector model. Herit. Sci. 2023, 11, 111. [Google Scholar] [CrossRef]
  41. Wang, L.X.; Jiang, Q.O.; Qi, Y.J.; Zhang, B.L. Study on dual evaluation and zoning of land spatial planning in rural areas around metropolis: Taking Changping, Beijing as study case. J. China Agric. Univ. 2024, 29, 167–185. [Google Scholar]
  42. Chen, W.; Yang, Z.; Yang, L.; Wu, J.; Bian, J.; Zeng, J.; Liu, Z. Identifying the Spatial Differentiation Factors of Traditional Villages in China. Herit. Sci. 2023, 11, 5. [Google Scholar] [CrossRef]
  43. Chen, L.; Zhong, Q.; Li, Z. Analysis of Spatial Characteristics and Influence Mechanism of Human Settlement Suitability in Traditional Villages Based on Multi-Scale Geographically Weighted Regression Model: A Case Study of Hunan Province. Ecol. Indic. 2023, 154, 110828. [Google Scholar] [CrossRef]
  44. Liu, W.X.; Xue, Y.; Shang, C. Spatial Distribution Analysis and Driving Factors of Traditional Villages in Henan Province: A Comprehensive Approach via Geospatial Techniques and Statistical Models. Herit. Sci. 2023, 11, 185. [Google Scholar] [CrossRef]
  45. Wu, B.; Xiao, J. Research on spatial distribution and correlation of the historical and cultural towns(villages) in China. Econ. Geogr. 2012, 32, 6–11. [Google Scholar]
  46. Zhang, H.; Lu, L.; Zhang, D.; Yu, H.; Zhang, X. Spatial pattern and contributing factors of homestay inns in the area around Mogan Mountain. Geogr. Res. 2019, 38, 2695–2715. [Google Scholar]
  47. Chen, P.; Yang, X.; Du, M. A study on the spatial distribution of China national eco-tourism demonstration area. Ecol. Econ. 2018, 34, 132–136. [Google Scholar]
  48. Lu, X.; Kuang, B.; Li, J. Regional difference decomposition and policy implications of China’s urban land use efficiency under the environmental restriction. Habitat Int. 2018, 77, 32–39. [Google Scholar] [CrossRef]
  49. Guan, Z.; Wang, T.; Zhi, X. Temporal-spatial pattern differentiation of traditional villages in central plains economic region. Econ. Geogr. 2017, 37, 225–232. [Google Scholar]
  50. Wang, J.-F.; Zhang, T.-L.; Fu, B.-J. A measure of spatial stratified heterogeneity. Ecol. Indic. 2016, 67, 250–256. [Google Scholar] [CrossRef]
  51. Zhou, Y.; Huang, H.; Liu, Y. The spatial distribution characteristics and fluencing factors of Chinese villages. Acta Geo Graph. Sin. 2020, 75, 2206–2223. [Google Scholar]
  52. Wang, W.; Liu, Y.J.; Chen, G. Spatial Distribution Characteristics and Its Influencing Factors of Traditional Villages in the Yangtze River Delta Region. Ind. Constr. 2023, 53, 1–15. [Google Scholar]
  53. Chen, S.; Yu, X. Spatial Distribution Characteristics and Influencing Factors of Key Rural Tourism Villages in the Chengdu–Chongqing Twin-City Economic Circle. J. Chongqing Norm. Univ. (Nat. Sci. Ed.) 2023, 40, 81–94. [Google Scholar]
Figure 1. Location of the study area.
Land 14 00857 g001
Figure 2. Lorentz curve of forest village distribution in Liaoning Province.
Land 14 00857 g002
Figure 3. Kernel density map of the forest village.
Land 14 00857 g003
Figure 4. Elevation map of Liaoning City.
Land 14 00857 g004
Figure 5. Elevation distribution of forest and rural areas.
Land 14 00857 g005
Figure 6. Distribution of forested villages under river buffer zones.
Land 14 00857 g006
Figure 7. Frequency distribution of distance between forest village and river.
Land 14 00857 g007
Figure 8. Distribution of forest and village under the influence of temperature.
Land 14 00857 g008
Figure 9. Forest–rural distribution under the influence of rainfall.
Land 14 00857 g009
Figure 10. Distribution of forest villages under different population densities.
Land 14 00857 g010
Figure 11. Distribution of forest and rural areas under different GDP influences.
Land 14 00857 g011
Figure 12. Distribution of forest villages under the influence of forest resources.
Land 14 00857 g012
Figure 13. Distribution of forested villages under the road network buffer zone.
Land 14 00857 g013
Figure 14. Frequency distribution of distance between forest village and road network.
Land 14 00857 g014
Figure 15. Single factor detection results under the geodetector.
Land 14 00857 g015
Figure 16. Interaction detection results.
Land 14 00857 g016
Table 1. Number of “national forest villages” in Liaoning cities.
No.City NameNumber
1Shenyang2
2Dalian21
3Anshan1
4Fushun34
5Benxi12
6Dandong21
7Jinzhou0
8Yingkou0
9Fuxin4
10Liaoyang2
11Panjin0
12Tieling0
13Chaoyang26
14Huludao2
Table 2. Statistics of the number of forest villages in Liaoning Province.
CITYNumber of Villages
(Count)
Proportion (%)Cumulative Proportion (%)CITYNumber of
Villages
(Count)
Proportion (%)Cumulative Proportion (%)
Fushun3427.227.2Liaoyang21.697.6
Chaoyang2620.848Huludao21.699.2
Dalian2116.864.8Anshan10.8100
Dandong2116.881.6Jinzhou00100
Benxi129.691.2Yingkou00100
Fuxin43.294.4Panjin00100
Shenyang21.696Tieling00100
Table 3. Elevation distribution of forest villages in Liaoning Province.
Elevation Range (m)Number of Villages (Count)Proportion (%)
<1003326.4
100~2002520
200~3002318.4
300~4002318.4
400~5001512
>50043.2
Disclaimer/Publisher’s Note: The statements, opinions and data contained in all publications are solely those of the individual author(s) and contributor(s) and not of MDPI and/or the editor(s). MDPI and/or the editor(s) disclaim responsibility for any injury to people or property resulting from any ideas, methods, instructions or products referred to in the content.

