1. Introduction
Food production in direct proximity to urban populations—herein urban agriculture [
1]—is an essential green infrastructure and vital living system helping underpin intergenerational sustainability, food supply security and regulating life support ecosystem services [
1,
2,
3,
4]. The ongoing loss of peri-urban agricultural landscapes from urban development represents a critical challenge for urban sustainability and metropolitan planning worldwide [
5,
6,
7,
8]. As urban areas increase their population and physical footprints, they regularly encroach on agricultural lands adjacent to or interspersed within metropolitan regions [
9,
10]. Within urban contexts, agricultural land is frequently evaluated using short-term perspectives and a focus on potential quick financial returns from residential subdivisions and associated land uses. Land speculation ahead of residential, industrial, and mixed-use subdivisions can trigger a holding pattern causing agricultural land to fall fallow [
11] resulting in an accelerated process that strips agricultural capacity from cities. The prioritisation of short-term economic gains over long term sustainability can serve to justify the rezoning of urban agricultural land for urban development [
12]. This phenomenon, sometimes understood through the lens of “urban growth machine” theory [
13,
14], posits that various stakeholders, including developers, state and local governments, and consultants, form coalitions to prioritise immediate economic gains, often at the expense of long-term sustainability and the intrinsic value of land uses such as urban agriculture.
If left unchecked, urban economies that inherently rely on global investment, construction, and housing development can become trapped in a pattern of short-term economic activities, generated through property development and supply chains involving significant material use in construction sectors [
15,
16]. Moreover, globalisation and neo-liberal capital flows exacerbate this trend, with policymakers catering to related financial economic pressures rather than local sustainable developmental goals [
17,
18]. In the urban growth machine model, professional consultants generate narratives “across places that can mistakenly be taken as evidence of economic necessity” [
13]. Such narratives can promote the conversion of agricultural land for urban uses, undermining the critical role that such land plays in food security and environmental health [
19,
20].
In this paper, we analyse Sydney within this theoretical context. In doing so, we dispute the constructed notion that Sydney’s metropolitan landscape is biophysically unsuited to agriculture, thereby challenging current planning orthodoxy. To do this we ask the question “what is Sydney’s inherent biophysical capacity for agriculture?”. Our paper seeks to answer this by utilising a Critical Geographic Information System (Critical GIS) approach [
21], in which we use the best available datasets and present them for quantitative and qualitative evaluation using spatial comparisons, graphs, and a range of visual techniques. By considering inherent soil fertility and agricultural capacity, alongside questions of urban governance, we explore how these underappreciated factors interact to present a more constructive and balanced narrative around metropolitan agriculture in Sydney and its surrounding coastal regions.
The paper is structured according to four subsequent sections. The Background provides an outline of the history and planning of Sydney with respect to urban agriculture. The Methods and Materials Section outlines the approach to determining boundary areas for Sydney and the six comparison cases, as well as datasets used, and analyses completed. The Results Section visually presents the mapping and data generated, based on seven case regions, two boundary methods, four datasets, and visual results. The Discussion critically unpacks the implications of our visual results relating to Sydney’s metropolitan planning, sustainability policy, and regional identities. The Conclusion summarises the novelty and significance of findings for Sydney, NSW, and more widely. By demonstrating how agriculture can be broadly analysed and compared, we aim to generate discussion on this marginalised system as an integral component of sustainable urban planning and food supply security.
2. Background
Sydney is one of the fastest growing urban regions in the Western world and faces many of the pressures described using the growth machine theory [
22,
23]. Within the city, a combination of rapid urban growth and weak protections for agricultural land uses continues to place extreme pressure on metropolitan agricultural production [
24,
25]. Agriculture has been an integral part of Sydney’s history, stretching back to Indigenous roots and early colonial days and continuing throughout the twentieth century [
26,
27,
28,
29]. It has therefore contributed significantly to the city’s success and cultural identity. However, agriculture has also been entangled in a culture of financial speculation and has faced challenges due to tensions with alternative land uses such as housing [
22]. While some planners and urban visionaries have portrayed this shift as inevitable [
30], it has been forcibly shaped by concrete planning policies and methods that have not prioritised agriculture in the same manner as housing, transportation, and a range of other land uses [
31]. Consequently, agriculture has not been recognised as a vital “city system” within the planning of the urban future of Sydney [
22,
32].
Since 1948, nine metropolitan-scale planning strategies have been produced to guide Sydney’s development and all of them have intentionally or inadvertently marginalised agriculture. Zeunert and Freestone published a recent analysis of the nine plans based on their integration of agriculture and found that each planning vision offered urban agriculture “lip service at best, and complete disregard at worst” [
32] (p. 247). Other researchers, such as Budge [
33], have noted the marginalisation and disregard for urban agriculture in specific metropolitan plans, pointing to a range of factors driving the erosion of agriculture including urban growth ‘planned’ on key intensive food production lands [
34]; suggestions that conversion of agriculture is necessary and inevitable [
35]; highly variable engagement between planning and the agricultural sector [
35]; tensions between state and local government perspectives [
25]; corruption in political-planning processes involving rezoning of important agricultural lands [
36]; and, conflicts between top-down and bottom-up agricultural land protection policies and practices [
31].
Planning policy in Sydney has historically favoured developers, with urban development following short-term financial drivers rather than principles of sustainability, resilience, and health [
22]. Sydney’s development history is replete with examples of pro-development scandals and biassed planning policies [
37,
38]. Within this context, urban agriculture has been characterised as unviable and of marginal use so much so that planning officials have suggested “there is no place for agriculture in the Sydney region. Agriculture belongs over the Great Dividing Range, and any agricultural land in Sydney is land awaiting higher economic development” [
11]. This perspective reflects a broader trend in Sydney, where market-driven determinants have facilitated the conversion of agricultural land to what is deemed ‘higher and better uses’ [
33,
39]. In this context, land is often viewed as ‘suburbs in waiting’ [
35], reinforcing the notion that agricultural spaces are expendable in favour of urban expansion. This phenomenon mirrors prevalent global patterns of embedded power, governance, and capital systems that are oriented toward urban property development [
40]. The implications of such a planning paradigm are significant, as they not only undermine the potential contributions of urban agriculture to food security and community resilience but also perpetuate a cycle of unsustainable urban growth.
Sydney’s ninth and most recent metropolitan plan,
A Metropolis of Three Cities, and its associated district plans were released by the Greater Sydney Commission in 2018 [
30] (herein GSC, which was recast as the ‘Greater Cities Commission’ in late 2021). Zeunert and Freestone [
32] (p. 267) characterised the GSC’s strategy as a “supercharged” neoliberal approach to land use and development, accelerating the trajectories of the eight prior metropolitan plans. The 2018 strategy’s rapid population growth necessitates substantial urban development: 725,000 new dwellings by 2036 [
30]. The report claims “little change in [Sydney’s] outward spread” will result [
30] (p. 31). This is despite specifying that 81% [
41] of the earmarked 184,500 dwellings for the ‘Western City District’ will be detached housing [
30] (p. 62). Recent spatial-mapping of Sydney’s development counters this claim, demonstrating the city’s continued outward spread, with agriculture as the primary land use disappearing under urban development [
22].
Prior to their release of
A Metropolis of Three Cities, the GSC commissioned a study titled
Values of the Metropolitan Rural Area of the Greater Sydney Region [
19]. This report presented twelve ‘values’ for consideration in Sydney’s metropolitan land use planning, including
agriculture; biodiversity; water quality; air quality; mining and extractive industries; scenic landscape values; tourism and recreation; waste management; rural lifestyle; rural towns and villages; European and Aboriginal Heritage; and ‘
Other’. The report also divided Greater Sydney into five districts, each examined across the following:
agriculture; biodiversity; water quality; mining and extractive industries; landscapes; tourism; and ‘
Other’ values. The study’s agricultural analysis utilised Land and Soil Capability (LSC) and Biophysical Strategic Agricultural Land (BSAL) datasets (two of the four used in this study) to present its spatial and statistical assessment of Sydney’s inherent soil capacity and agricultural industry. Clarke’s [
19] analysis of Sydney evaluated agriculture in relation to short-term economic considerations, utilising the term ‘market (e.g., market forces, market value) in economic contexts 35 times. However, similar consideration is not given to the other 11 urban values which include biodiversity, scenic landscape values, tourism, and recreation or heritage. This one-eyed planning assessment of agriculture is consistent with the way this system has been treated in consecutive policies and plans.
Our paper therefore addresses this oversight, with regard to metropolitan agriculture, to consider it using a broader, analytic contextual lens.
3. Materials and Methods
In this paper we reflect on how urban agriculture has been diminished by uncritical mainstream Sydney planning establishment, and to do this, we apply a critical GIS method. Rather than applying spatial mapping practices to reveal a single definitive answer to the question “what is Sydney’s inherent capacity for urban agriculture?”, we use critical GIS approaches to expand current siloed thinking to catalyse debate and draw “new lines” and connections, as GIS scholar Wilson might say [
42]. Unlike conventional geographic information systems that treat spatial data as objective and neutral, critical GIS recognises input mapping and data as deeply contextual and inherently political processes [
43,
44]. By interrogating how spatial information is created and represented, critical GIS reveals how conventional mapping techniques can reproduce existing social hierarchies and power structures.
Critical GIS methodologies challenge what Pavlovskaya [
21,
45] identifies as the problematic “always-assumed alignment of GIS with quantitative research”. Instead, it uncovers deeper historical processes, power dynamics, and development patterns that shape contemporary landscapes, while embracing both qualitative and quantitative methods. This hybrid approach transforms maps from passive documents into dynamic tools for understanding historical spatial political relationships, social justice, and community empowerment, ultimately helping researchers and planners develop more equitable and contextually sensitive strategies for spatial development [
46]. In our case, we make what has been invisible visible, representing existing data to shape conversations on urban agriculture as a valuable system in our cities.
Our research builds upon Clarke’s [
19] 2017 Greater Sydney Commission study which also uses agricultural datasets to assess Sydney’s inherent land capacity for agricultural production. However, unlike Clarke et al., we contextualise and compare our study of Sydney with other relevant urban regions along the coast of NSW. We also draw on more diverse datasets and apply a greater range of analyses.
3.1. Defining and Questioning Spatial Frameworks: What’s in a Boundary?
To analyse a region’s agricultural capacity, a bounded spatial area is helpful and, in many respects, essential. The boundary area or footprint can have a significant influence on the results of the analysis and provoke alternative insights depending on how it is drawn. In relation to the agricultural landscape and urban definition of Sydney, widely varying boundaries have been used and referred to in the literature [
22]. To interrogate this variation, we completed a sieve mapping exercise [
47] overlaying and comparing ten historical boundaries that have previously been used to describe the extent of ‘Sydney’ or ‘Sydney Basin’ in the agricultural and metropolitan planning literature (
Figure 1). These vary in size, by as much as 17.5 times.
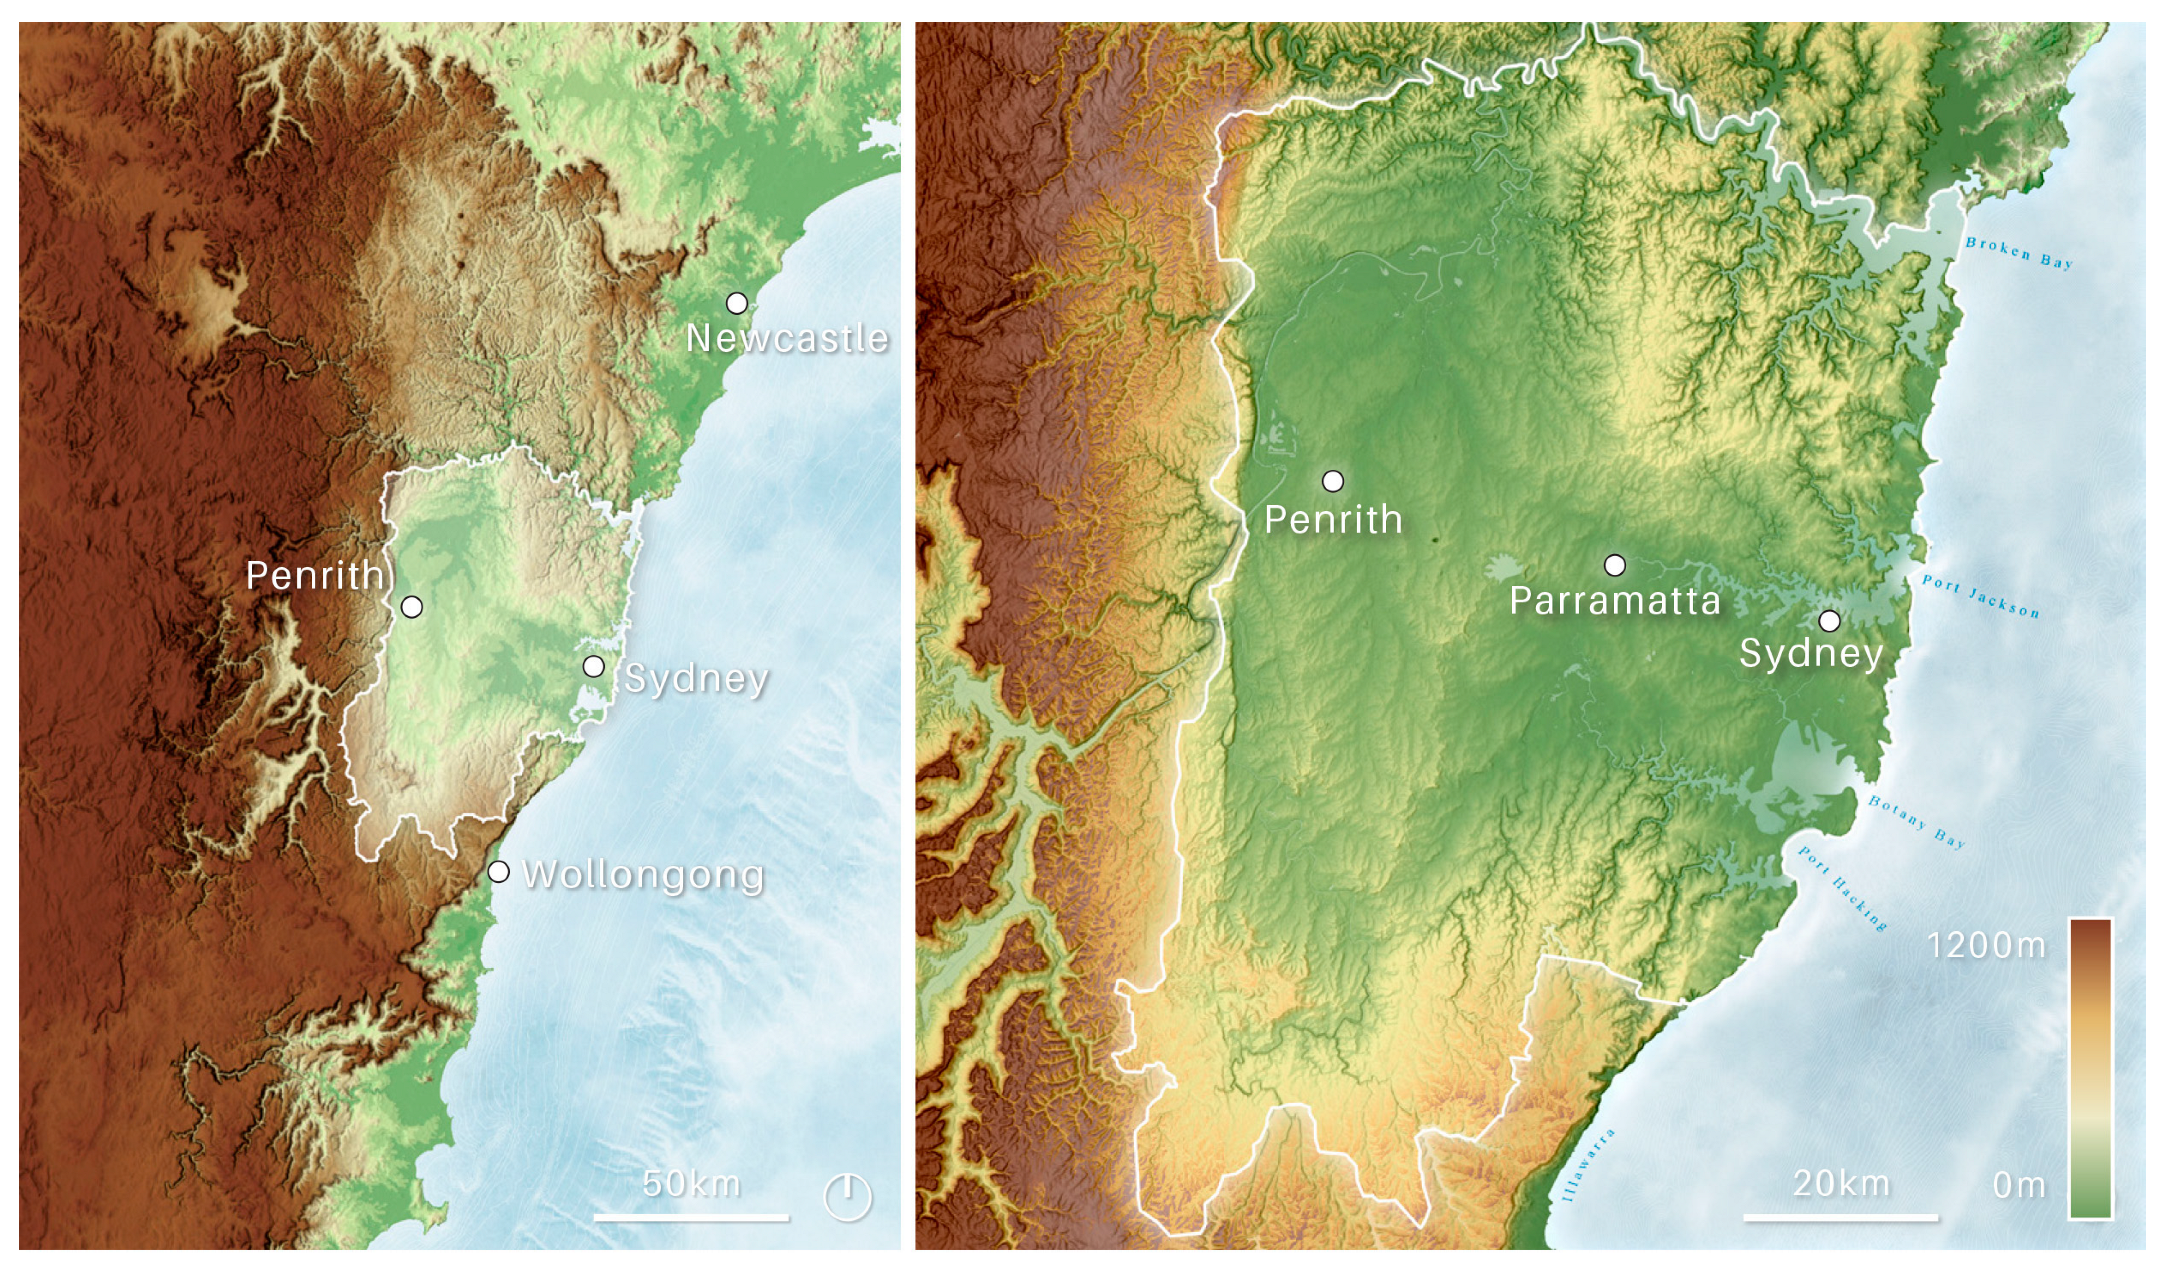
Whilst all boundaries have their utility, for our research, we select the boundary of 5340 km
2 used by Zeunert and Daroy [
22] (
Figure 2). We employ this for its usefulness in capturing Sydney’s existing agricultural areas and metropolitan municipalities (local government areas) without overreaching into neighbouring urban centres Wollongong and Newcastle (and beyond)—an issue with most boundaries shown in
Figure 1. Our selected area and boundary relate to Sydney’s topography, which has been shaped over geological time scales by water catchments and incised river valleys and is bordered by the Pacific Ocean. Although Sydney’s built form and population continue their considerable growth, its metropolitan context and local agricultural capacity remain defined and constrained by prominent geographic barriers of sandstone geology, topography, rivers, and coastline, and these are encompassed by Zeunert and Daroy’s boundary [
22].
3.2. Selecting Neighbouring Agricultural Regions as Comparison Cases
To gain a better understanding of Sydney’s inherent capacity for agriculture, six regions have been selected as comparison cases with Sydney. Our seven cases were visualised and analysed with respect to their agricultural capacity. This approach revealed the variation in agricultural capacity along the coastal region of NSW. Selected regions were all within the State of NSW for reasons of dataset availability and consistency. In selecting comparison cases, we sought geographic areas with broadly similar characteristics to Sydney. We used four criteria to select the case studies. Our criteria included coastal proximity and climate, presence of distinct local government areas, river(s) within catchment systems, and landforms including gradients permitting agricultural activities.
Based on these criteria, we selected the seven regions (
Table 1) that between them provide a relatively even sampling of agricultural areas along the eastern seaboard of NSW. Cases spanned this region from north (near the Queensland border) to south (the Victorian border) and included the Byron; Coffs; Port Macquarie; Lower Hunter; Sydney; Shoalhaven; and Bega agricultural regions (
Figure 3).
3.3. Approaches to Evaluate the Seven Regions and Their Agricultural Capacity
Drawing on critical GIS theory, we completed an exploratory spatial analysis through the application of two distinct footprints. Drawing inspiration from visual analytic landscape architecture approaches, particularly the work of Weller and Bolleter [
52], the method superimposes standardised footprints or Areas of Interest (AOIs) across different coastal contexts to reveal spatial relationships and patterns that might otherwise remain hidden. The dual-footprint approach, combining what we term method 1 and method 2, enables alternative visualisation and analysis of the datasets, creating opportunities for comparative spatial investigation and reflection.
Method 1 superimposes the Sydney Metropolitan Boundary defined by Zeunert and Daroy [
22] (
Figure 2) as a repeated unit of analysis, adjusted only for each individual case’s coastline to exclude the ocean. Method 2 individually applies the technique used to determine Sydney’s boundary. Namely, it accounts for the nexus of political boundaries of the Local and State Government Areas [
50] with local topographic conditions, water catchments, and drainage basins.
Rather than pursuing definitive conclusions, this methodology serves as a generative analytical tool that promotes critical engagement with spatial data. By maintaining consistent boundary extents and methods across different case regions, our approach facilitates the direct comparison of spatial qualities, scale relationships, and morphological characteristics. This comparative framework allows researchers to challenge conventional interpretations of urban form and spatial relationships.
3.4. Datasets Used in the Study
Four official agricultural datasets with sufficient spatial coverage were used in this research and these are listed in
Table 2 and visualised in
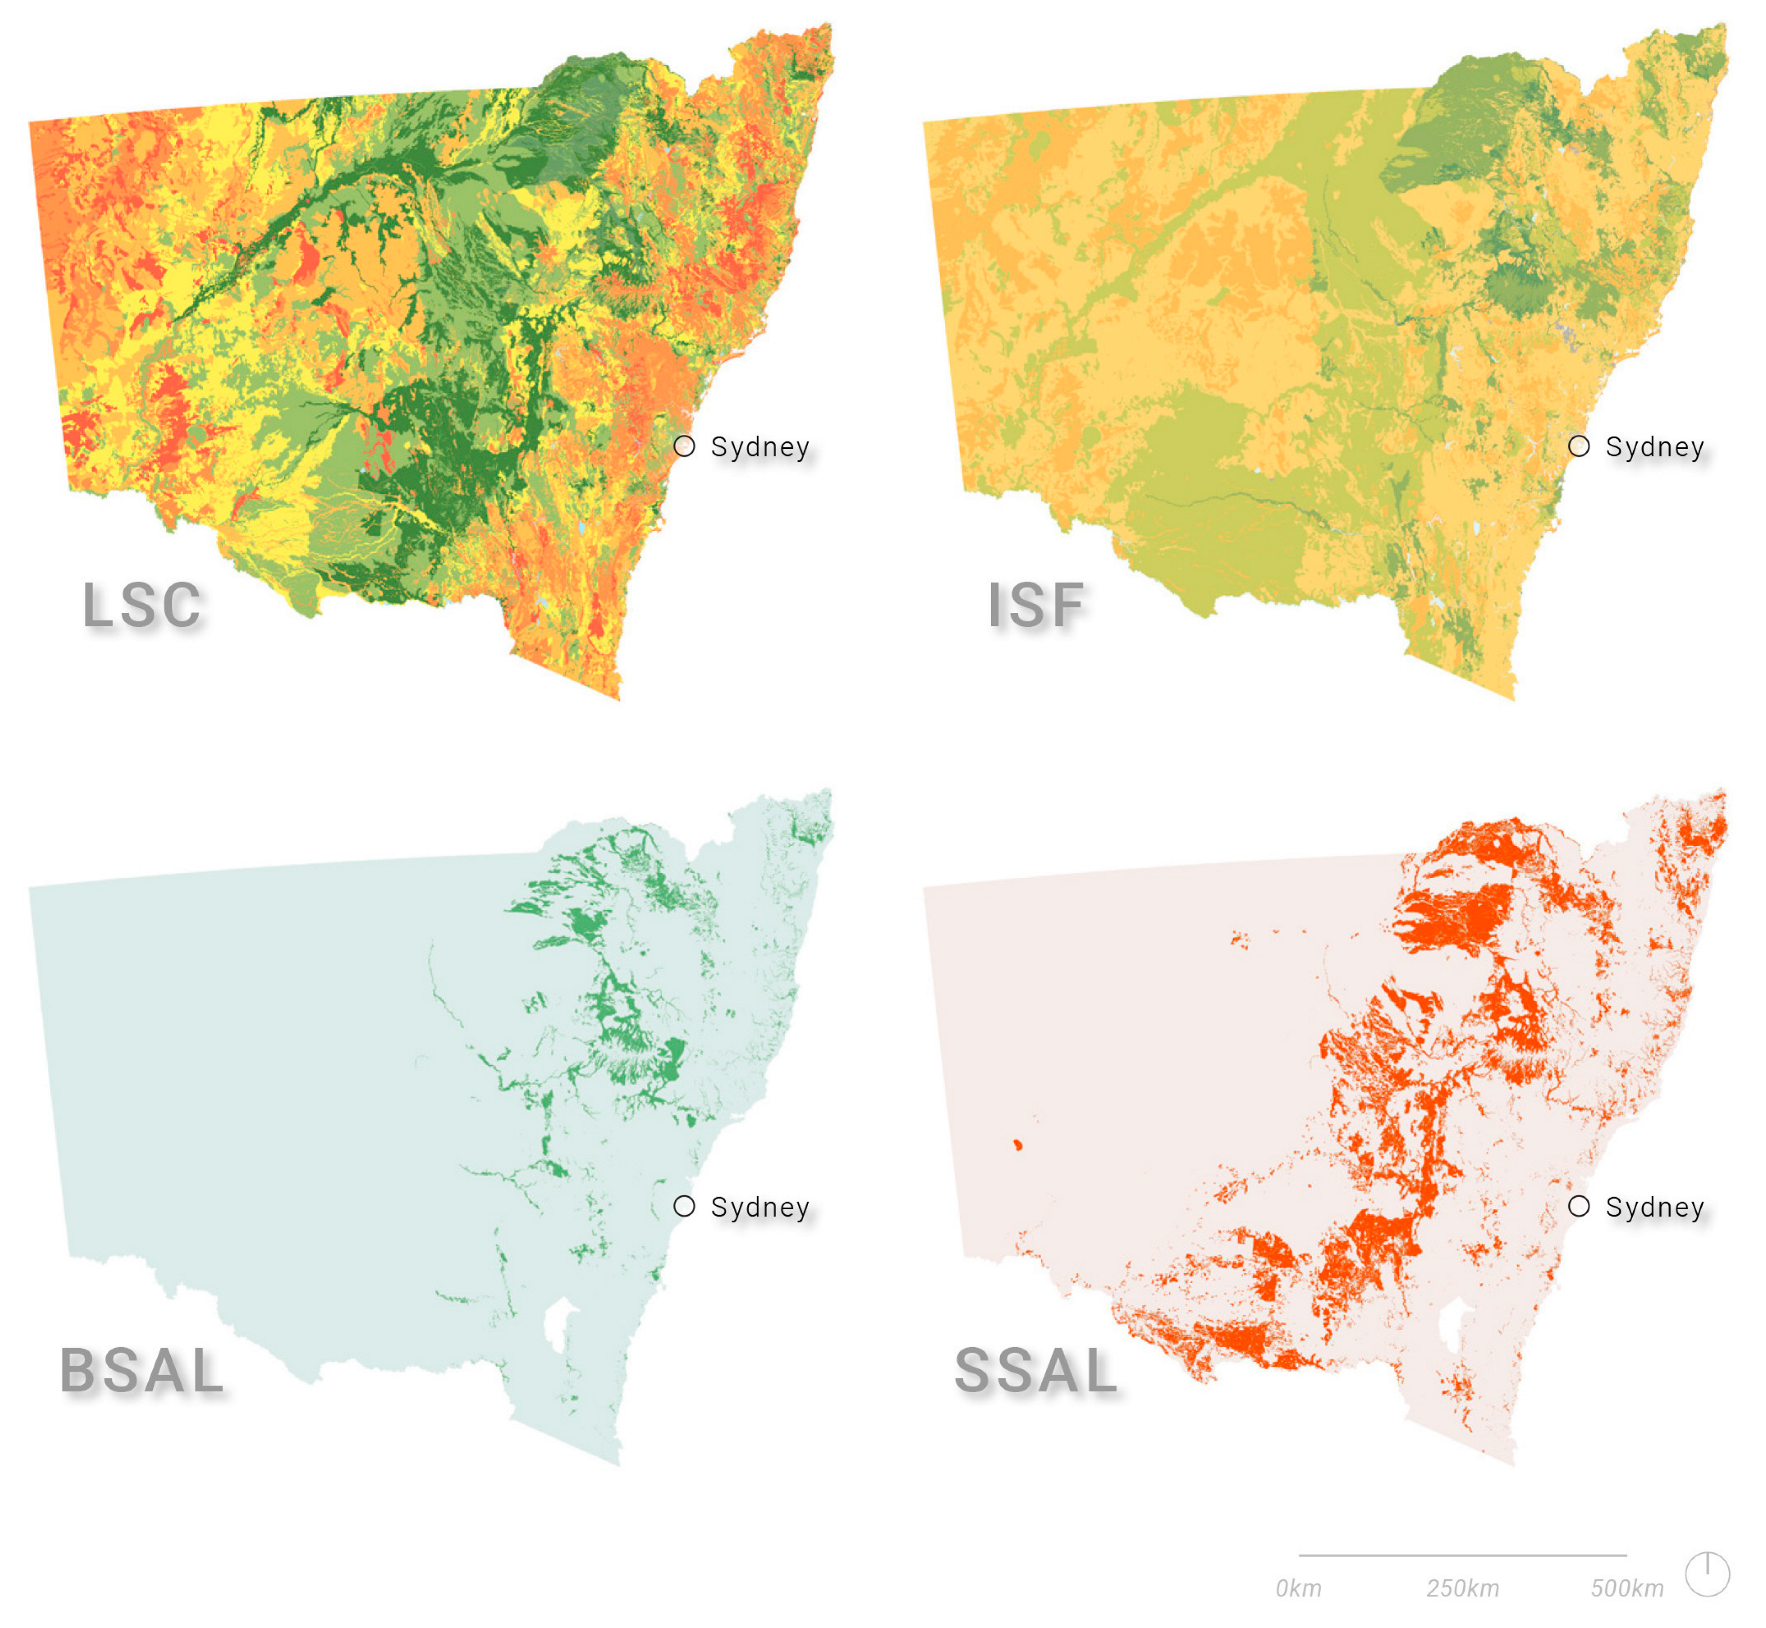
Figure 4. These are:
Land and Soil Capability (LSC);
Inherent Soil Fertility (ISF);
Biophysical Strategic Agricultural Land (BSAL); and (draft)
State Significant Agricultural Land (SSAL). These are the only viable datasets for comparing urbanised regions’ biophysically inherent agricultural capacity in NSW. LSC and ISF classify for the entire spatial extent of metropolitan Sydney and NSW (i.e., polygons providing full state land-area coverage), whereas BSAL and SSAL provide statewide coverage identifying only agriculturally significant land patches (isolated polygons). The SSAL dataset is currently in a draft state (and has been for around four years) but is useful as a comparative dataset. Datasets that did not provide sufficient coverage were excluded from the study. Each dataset was used to independently analyse all seven case studies. The four datasets were therefore applied to present four independent sets of analysis. These were the most recent datasets and all remained relevant and available as open data as suggested by their accompanying data quality statements. The four datasets use different classification approaches and convey different types of information. Their key distinctions are as follows:
Classification approach (gradient vs. binary);
Specific criteria emphasised (limitations, fertility, and productivity);
Development stage (established vs. draft);
Selectivity (comprehensive classification vs. identification of only the highest value lands);
It is important to note that LSC, ISF, and BSAL use only biophysical data, such as soil, climate, or topography, and exclude economic and social data [
53]. This aligns with our research aim of ascertaining and comparing inherent capacity only. Later in the discussion we suggest areas for further research incorporating social, economic, and infrastructural data outside the scope of this study. Our approach and method follow similar studies by others [
54,
55,
56].
Figure 4.
The four NSW agricultural datasets that provide data covering metropolitan Sydney and all of NSW: LSC, ISF, BSAL, and (draft) SSAL. LSC and ISF colour codes are shown in subsequent
Figure 5,
Figure 6,
Figure 7 and
Figure 8 and
Table 3,
Table 4,
Table 5 and
Table 6. Figure by Josh Gowers and Joshua Zeunert. Data sources: NSW Government noted in
Table 2.
Table 2.
Datasets used in this study.
Table 2.
Datasets used in this study.
| Dataset Name and Year Published | Classes | Notes |
|---|
LSC: Land and Soil Capability Mapping for NSW [57]
2008. Revised 2021 | 1—Very slight to negligible limitations
2—Slight but significant limitations
3—Moderate limitations
4—Moderate to severe limitations
5—Severe limitations
6—Very severe limitations
7—Extremely severe limitations
8—Extreme limitations | Land and Soil Capability (LSC) provides a comprehensive eight-class assessment system that evaluates land based on its capacity to sustain agricultural activities without degradation. The classification explicitly measures limitations, with Class 1 lands having minimal limitations (suitable for intensive agriculture) and Class 8 lands having extreme limitations (suitable only for conservation). |
ISF: Estimated Inherent Soil Fertility of NSW [53]
2013. Revised 2021 | 1—Low
2—Moderately low
3—Moderate
4—Moderately high
5—High | Inherent Soil Fertility (ISF) utilises a five-class system focusing specifically on the natural fertility of soils in NSW. This dataset was developed using the same baseline soil mapping as LSC but focuses exclusively on soil fertility rather than overall land capability. The classification ranges from low (1) to high (5) fertility. |
BSAL: Biophysical Strategic Agricultural Land [58]
2013 | 1—Biophysical Strategic Agricultural Land | Biophysical Strategic Agricultural Land (BSAL) employs a binary classification system (BSAL or non-BSAL). Unlike the other datasets, BSAL identifies only lands that meet specific criteria for high agricultural productivity, considering soil quality, water resources, and landforms. BSAL represents the most selective classification, identifying only lands capable of “sustaining high levels of productivity with minimal management practices”. |
SSAL: Draft State Significant Agricultural Land [59]
2021 | 1—State Significant Agricultural Land | State Significant Agricultural Land (SSAL) also uses a binary classification system but is still in draft form. SSAL builds upon previous datasets but includes additional considerations for identifying the “best agricultural lands”. Unlike the other datasets, SSAL is explicitly noted as preliminary, with acknowledgment of data constraints and variable quality. |
3.5. Data Processessing and Visual Analyses
Data preparation was completed by clipping the four datasets for the seven cases and the two boundaries for each case in ArcGIS Desktop (ArcMap) (10.8.2). This generated forty-two maps (BSAL and SSAL analyses for the two boundary conditions were completed on the same map). The results are tabulated and displayed as vertical bar graphs (total land in km2 for each classification) for all comparison maps using Adobe Illustrator 2023 and Adobe Photoshop desktop (version 24.5), also presented in tables. For the LSC and ISF, the results are also shown as proportions (percentages of each ranking of the total boundary area) in pie charts (%) and these are ranked out of seven (according to the seven cases examined), with 1 being the greatest proportion of land area and 7 the least.
The pie charts describing percentages (rather than the total land area) are used to communicate the ratio of land suitable for agriculture in each study region. The vertical bar graphs do not account for boundary variations between the cases; rather, they convey the total land area (km2) in each ranking for an individual region and dataset in isolation. Pie charts are not used for BSAL and SSAL as these datasets consist of one class only. The visual maps and graphs are set out to provide an accessible understanding of the distribution and quantity of agricultural lands described within each dataset in relation to the seven regions.
4. Results
Four sets of analyses, one for each agricultural dataset, were completed, and these are presented below. The first dataset visualised was Land and Soil Capability (LSC) [
57] and this is shown in
Figure 5 (Method 1) and
Figure 6 (Method 2) and
Table 3 (Method 1) and
Table 4 (Method 2).
The second dataset visualised is the Estimated Inherent Soil Fertility of NSW (ISF) [
53] and this is shown in
Figure 7 (Method 1) and
Figure 8 (Method 2) and
Table 5 (Method 1) and
Table 6 (Method 2).
The Biophysical Strategic Agricultural Land (BSAL) results are shown in
Figure 9 and
Table 7, with both Methods’ areas shown concurrently (Method 1—red, Method 2—blue). Similarly, the State Significant Agricultural Land (SSAL) results are shown in
Figure 10 and
Table 8.
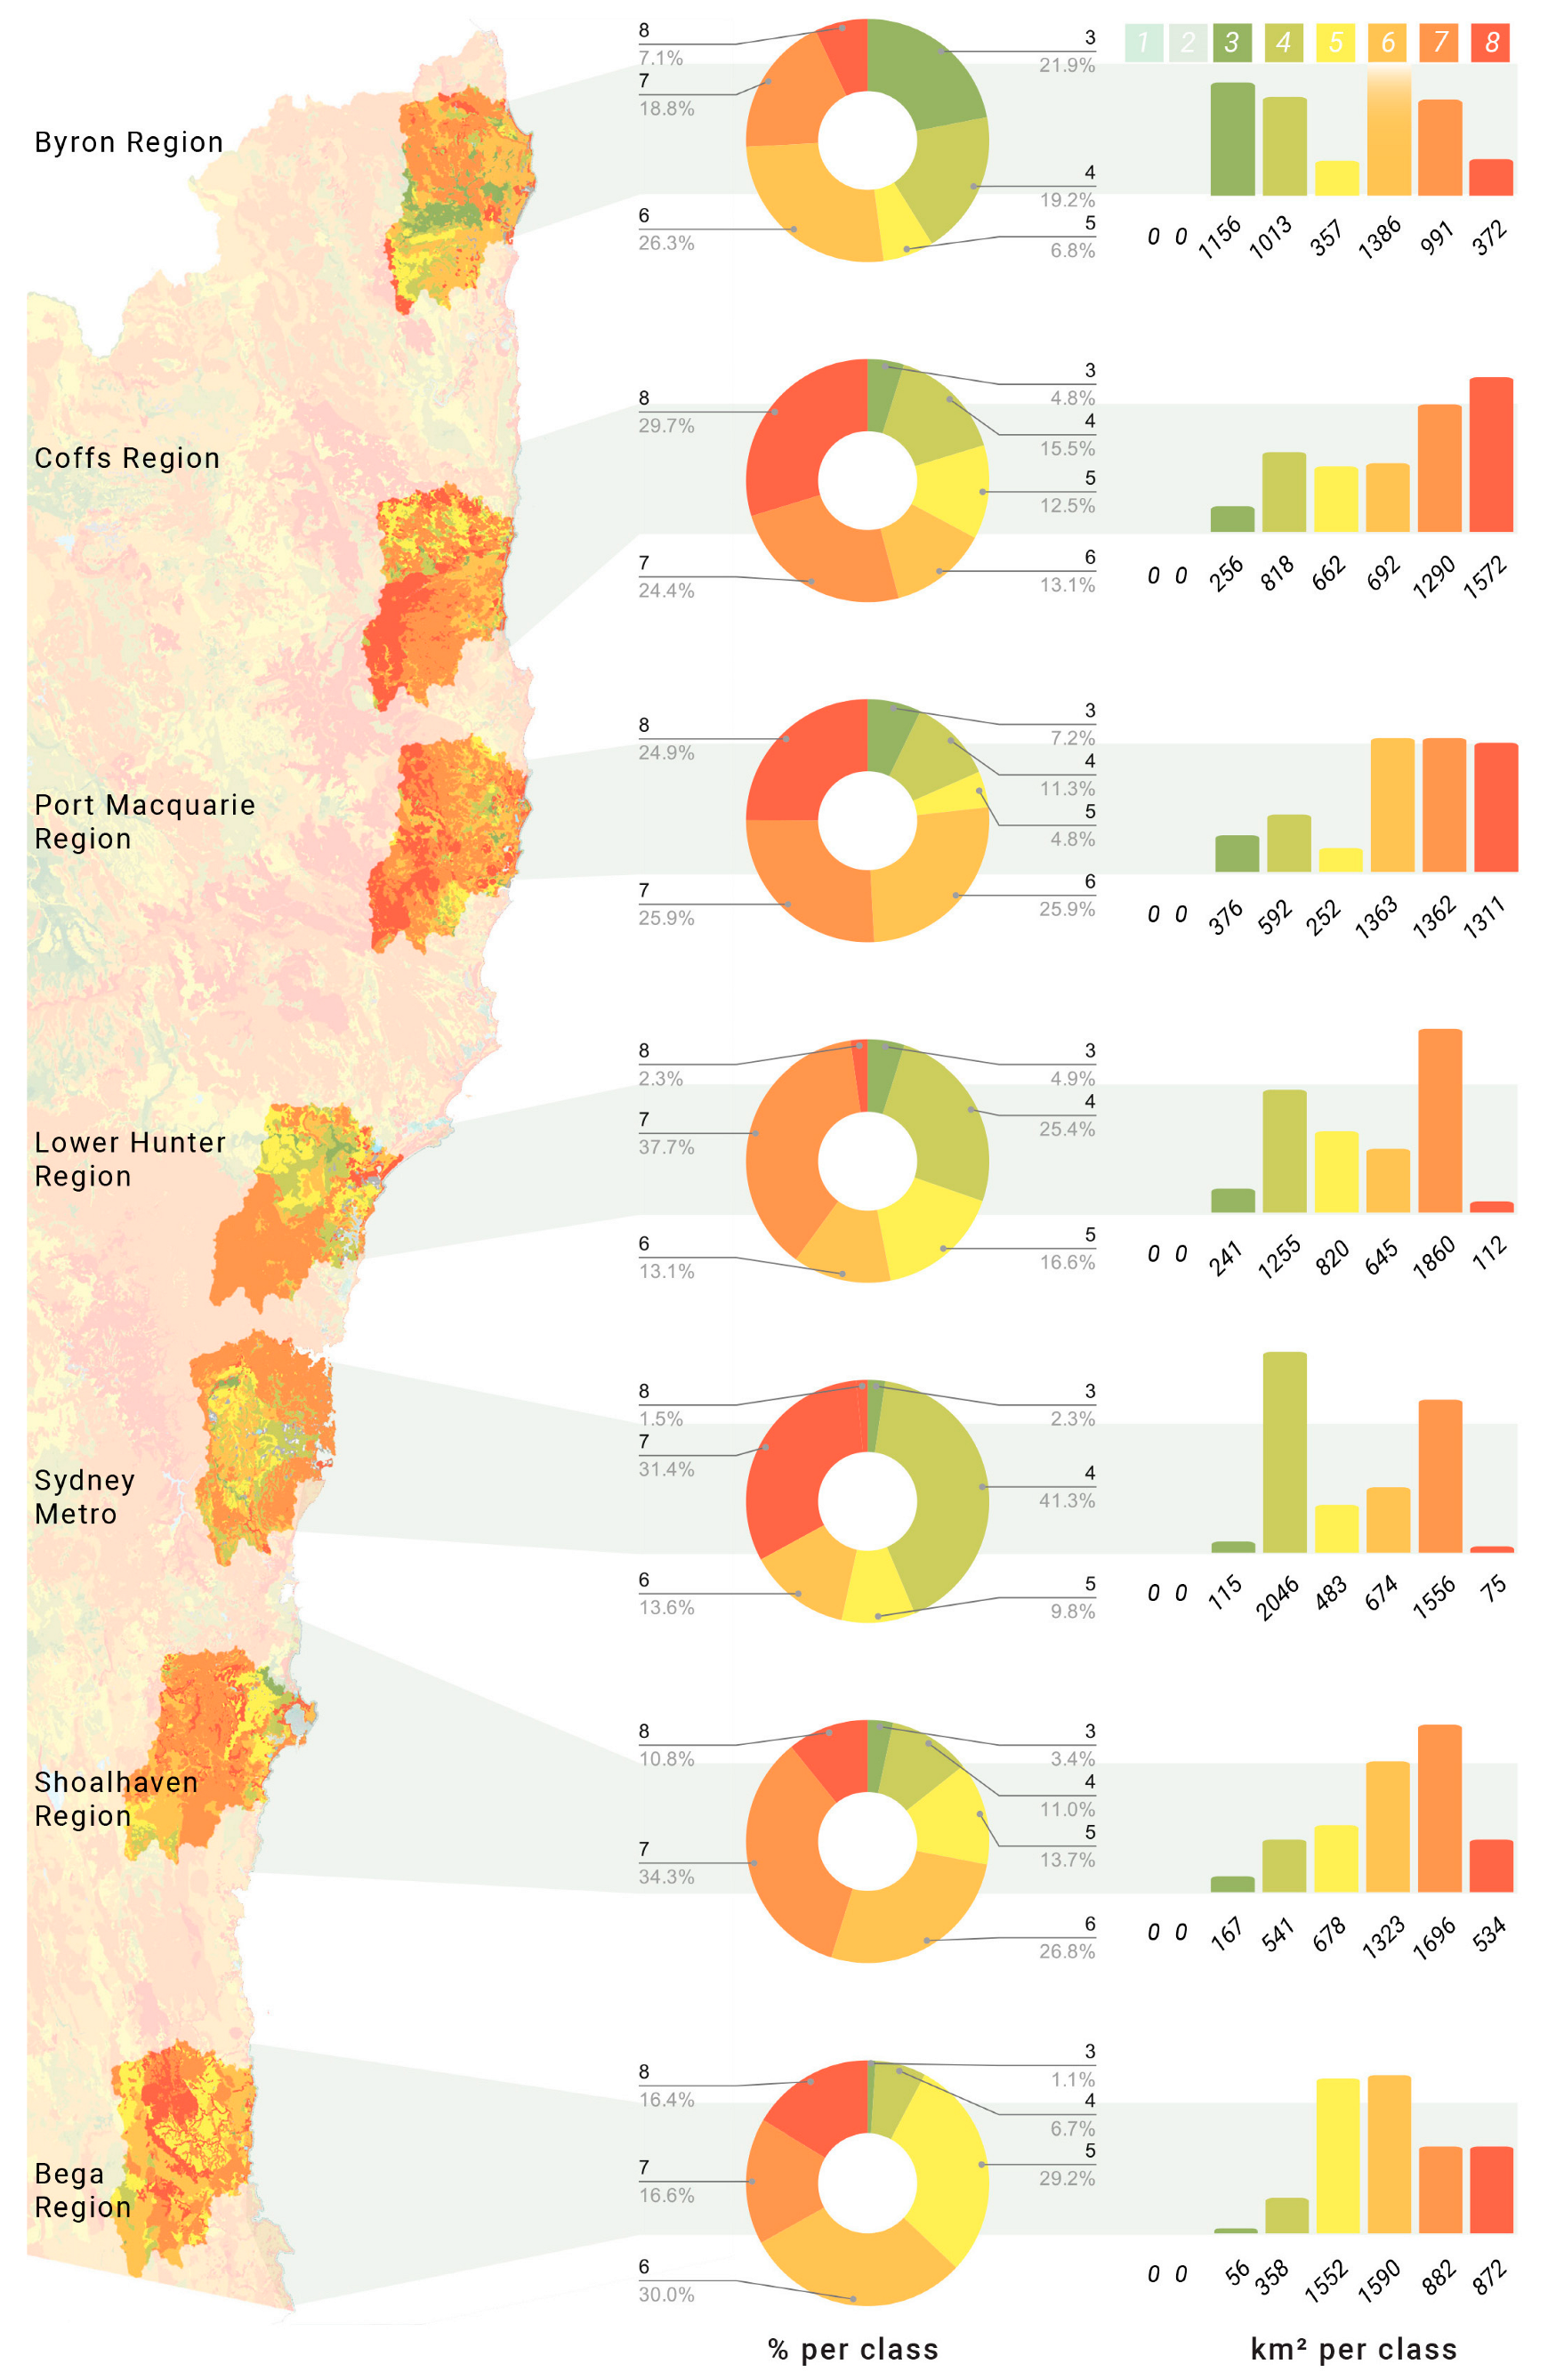
Figure 5.
Land and Soil Capability (LSC) dataset comparisons for Method 1’s boundaries, from class 1 (best) to 8 (worst). Figure by Josh Gowers and Joshua Zeunert. Data sources: NSW Government noted in
Table 2.
Figure 5.
Land and Soil Capability (LSC) dataset comparisons for Method 1’s boundaries, from class 1 (best) to 8 (worst). Figure by Josh Gowers and Joshua Zeunert. Data sources: NSW Government noted in
Table 2.
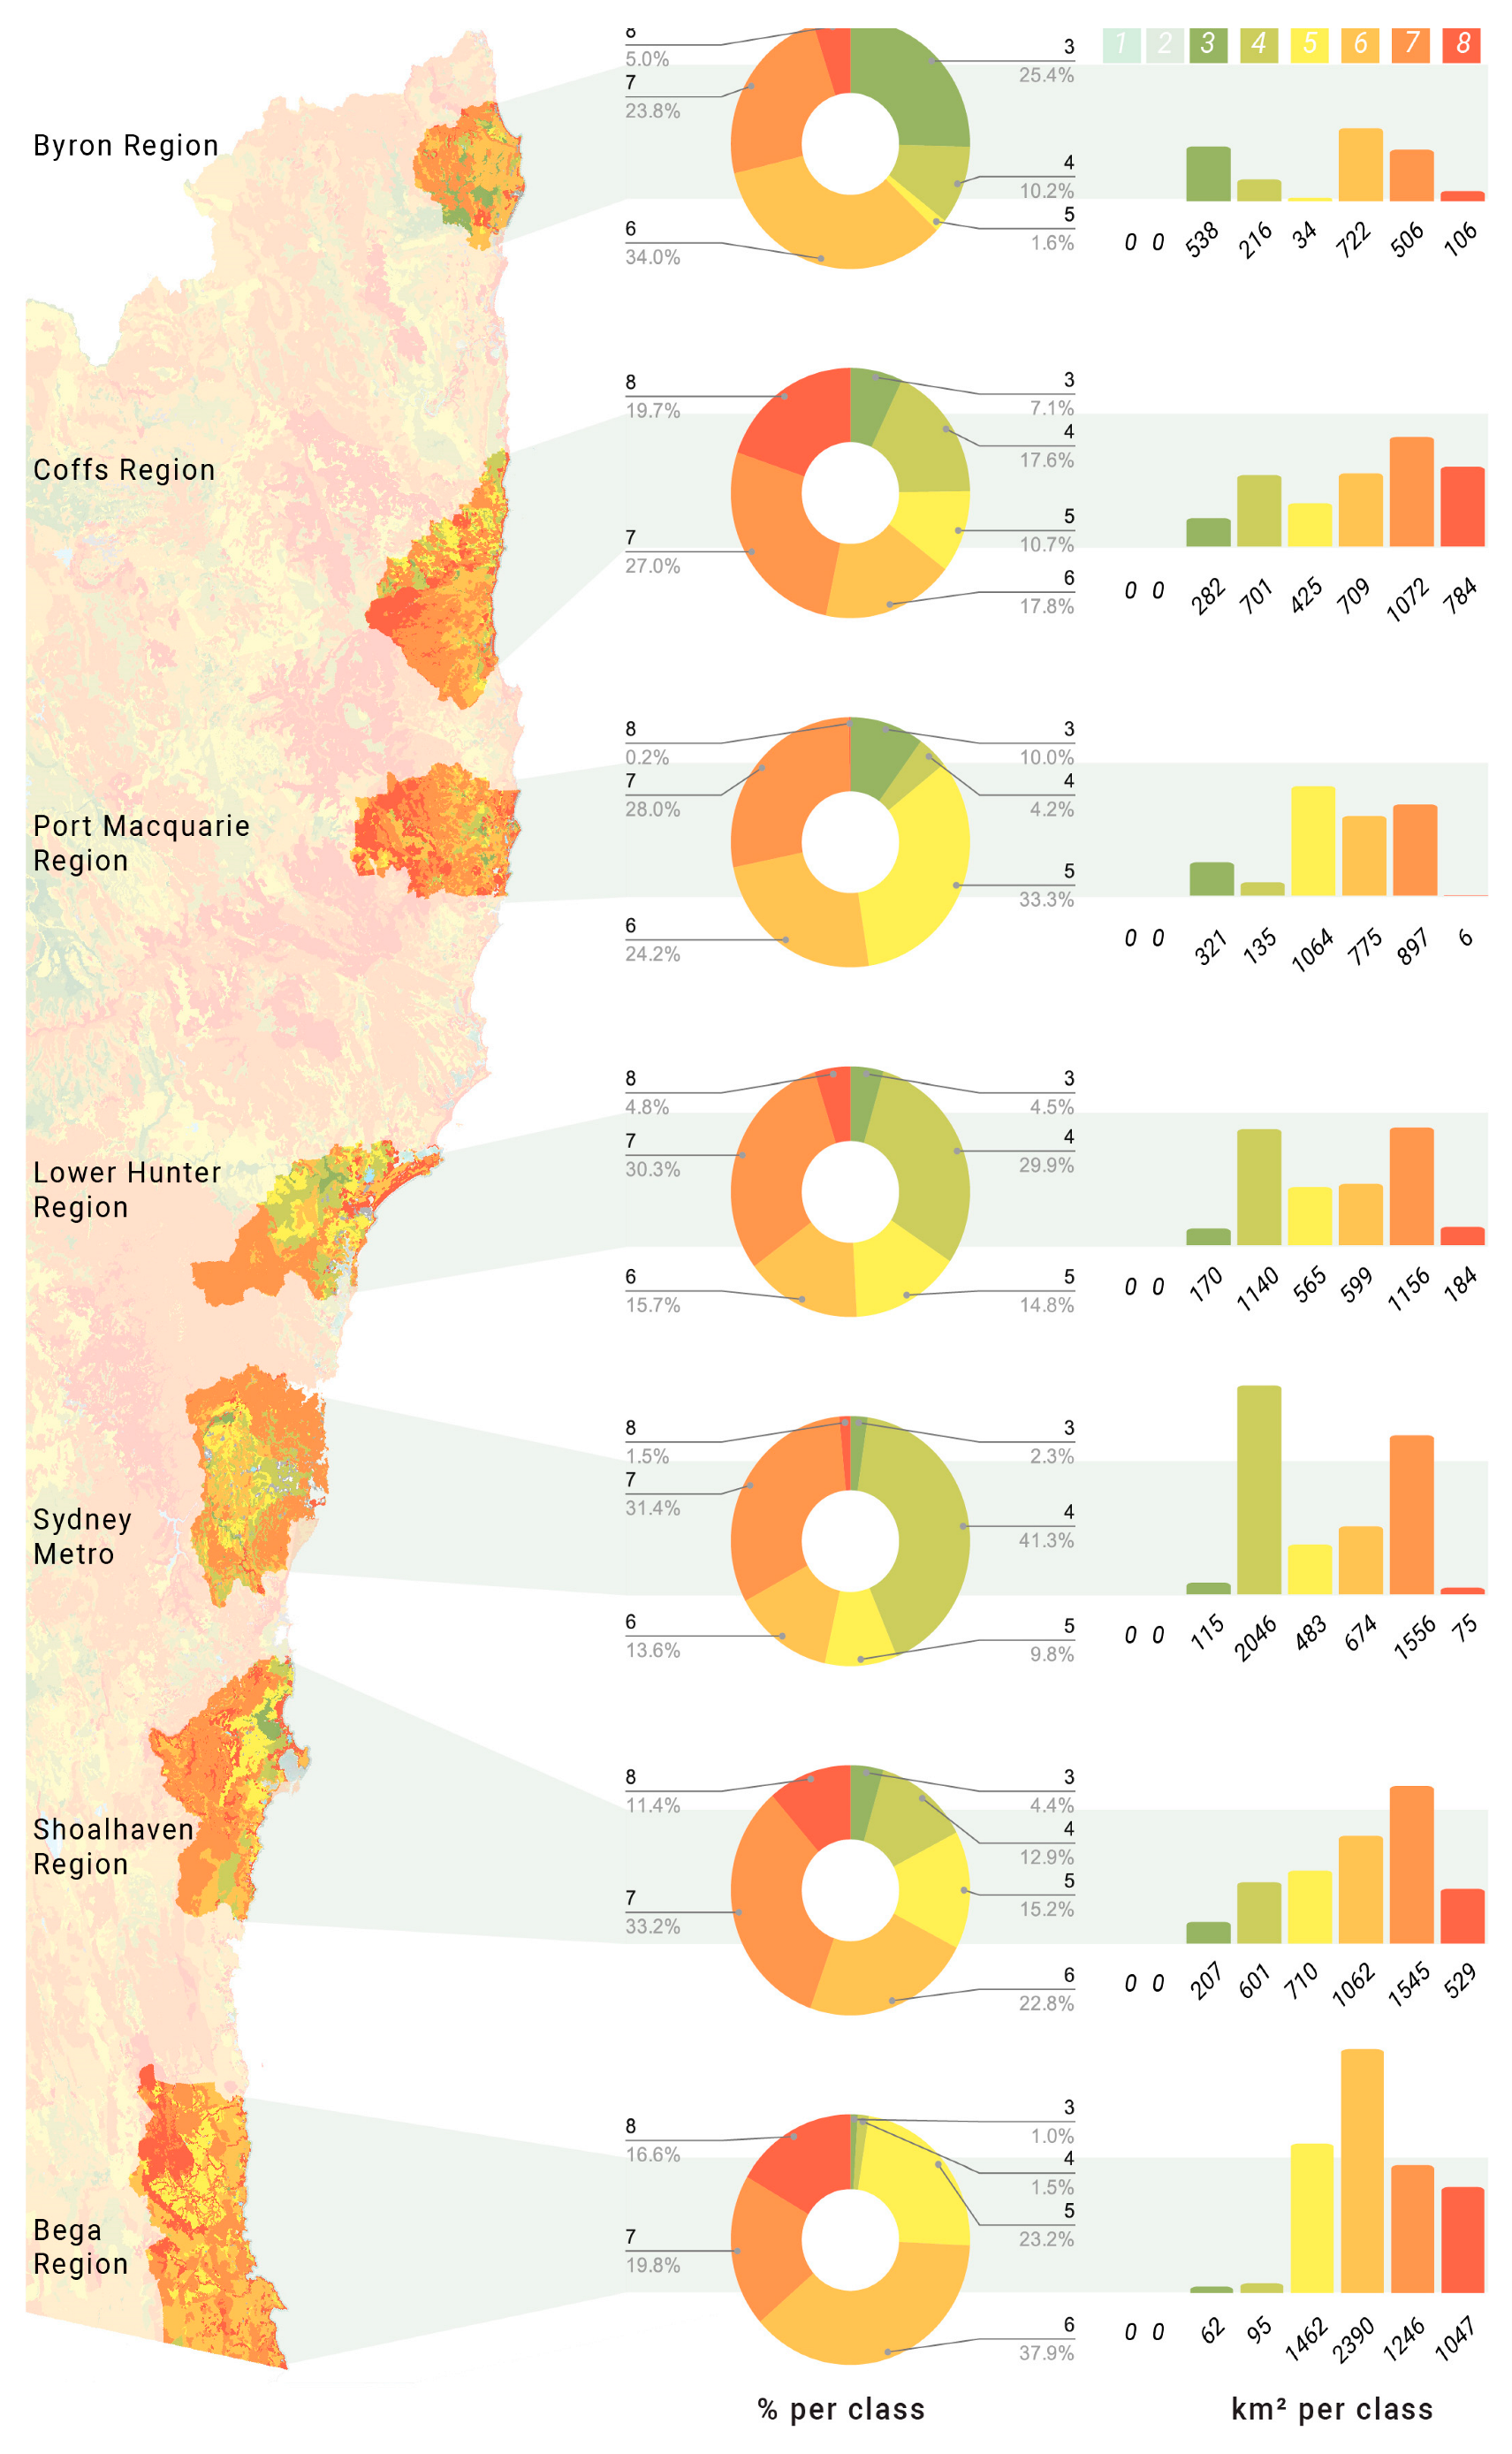
Figure 6.
This Land and Soil Capability (LSC) dataset comparisons for Method 2’s boundaries, from class 1 (best) to 8 (worst). Figure by Josh Gowers and Joshua Zeunert. Data sources: NSW Government noted in
Table 2.
Figure 6.
This Land and Soil Capability (LSC) dataset comparisons for Method 2’s boundaries, from class 1 (best) to 8 (worst). Figure by Josh Gowers and Joshua Zeunert. Data sources: NSW Government noted in
Table 2.
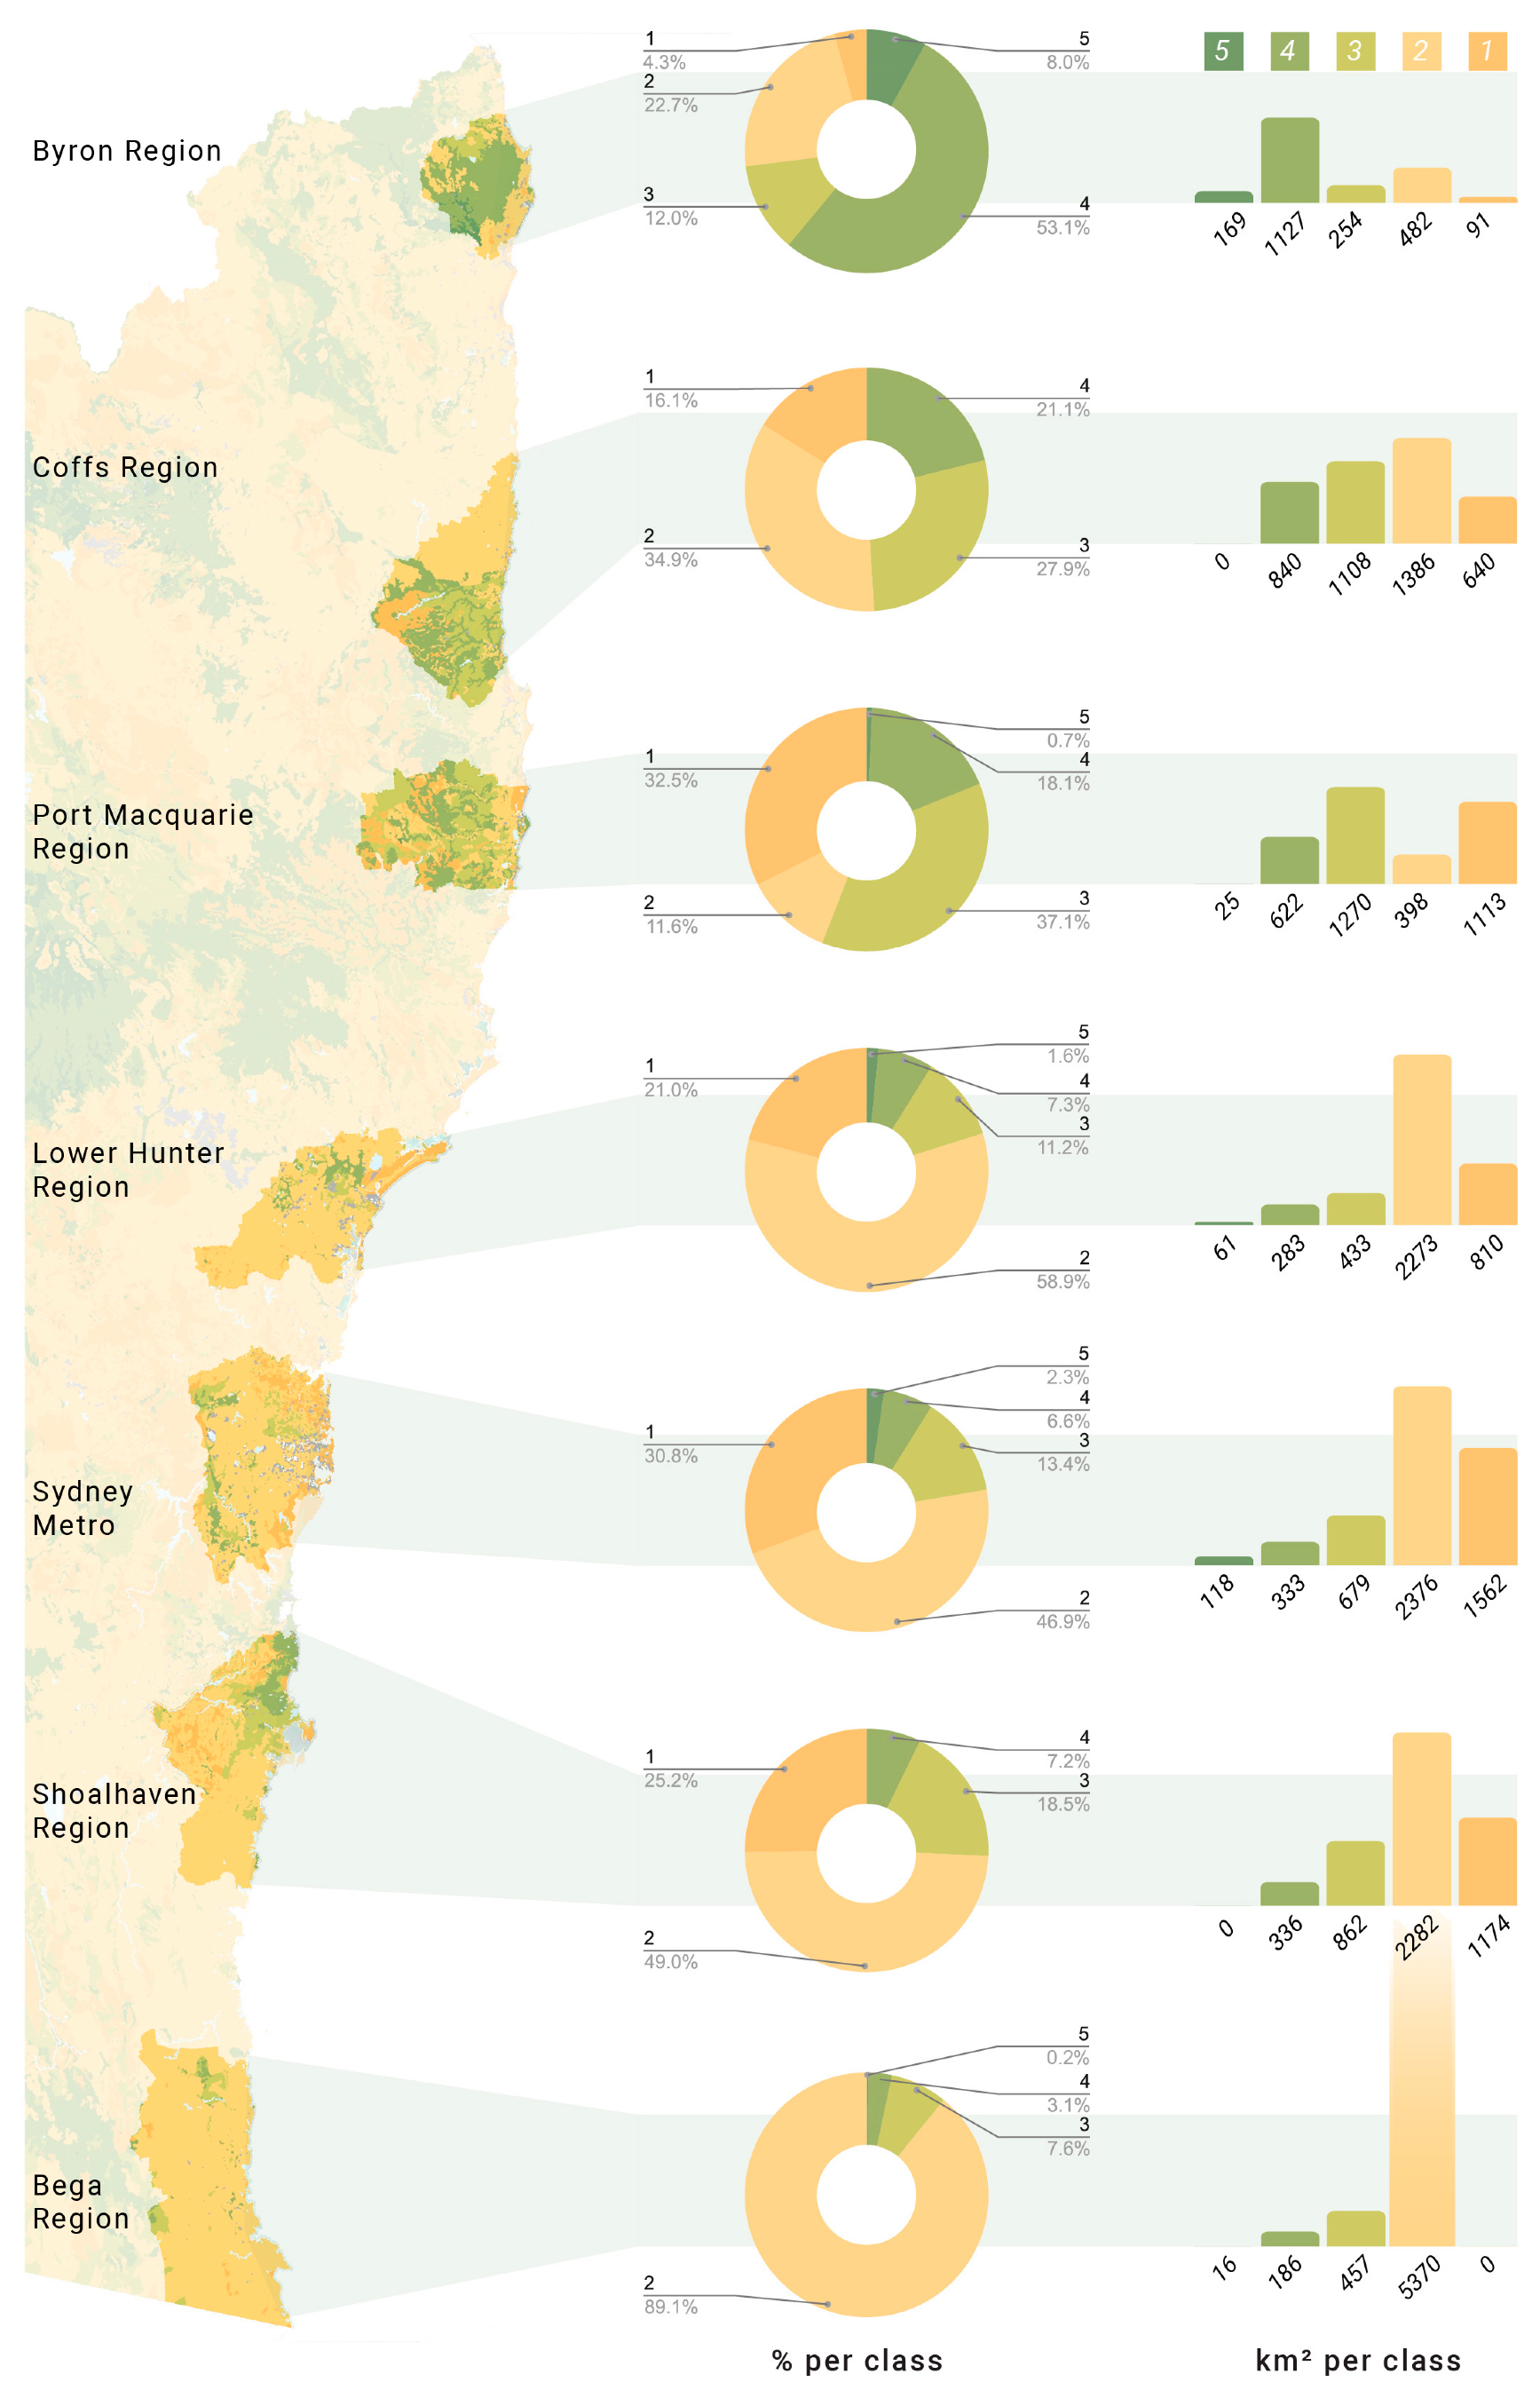
Figure 7.
Inherent Soil Fertility (ISF) dataset comparisons for Method 1’s boundaries, from Class 5 (best) to 1 (worst). Figure by Josh Gowers and Joshua Zeunert. Data sources: NSW Government noted in
Table 2.
Figure 7.
Inherent Soil Fertility (ISF) dataset comparisons for Method 1’s boundaries, from Class 5 (best) to 1 (worst). Figure by Josh Gowers and Joshua Zeunert. Data sources: NSW Government noted in
Table 2.
Figure 8.
Inherent Soil Fertility (ISF) dataset comparisons for Method 2’s boundaries, from Class 5 (best) to 1 (worst). Figure by Josh Gowers and Joshua Zeunert. Data sources: NSW Government noted in
Table 2.
Figure 8.
Inherent Soil Fertility (ISF) dataset comparisons for Method 2’s boundaries, from Class 5 (best) to 1 (worst). Figure by Josh Gowers and Joshua Zeunert. Data sources: NSW Government noted in
Table 2.
Figure 9.
Biophysical Strategic Agricultural Land (BSAL) comparisons for both Methods, as percentages of total region area, and total km
2 for each region. Figure by Josh Gowers and Joshua Zeunert. Data sources: NSW Government noted in
Table 2.
Figure 9.
Biophysical Strategic Agricultural Land (BSAL) comparisons for both Methods, as percentages of total region area, and total km
2 for each region. Figure by Josh Gowers and Joshua Zeunert. Data sources: NSW Government noted in
Table 2.
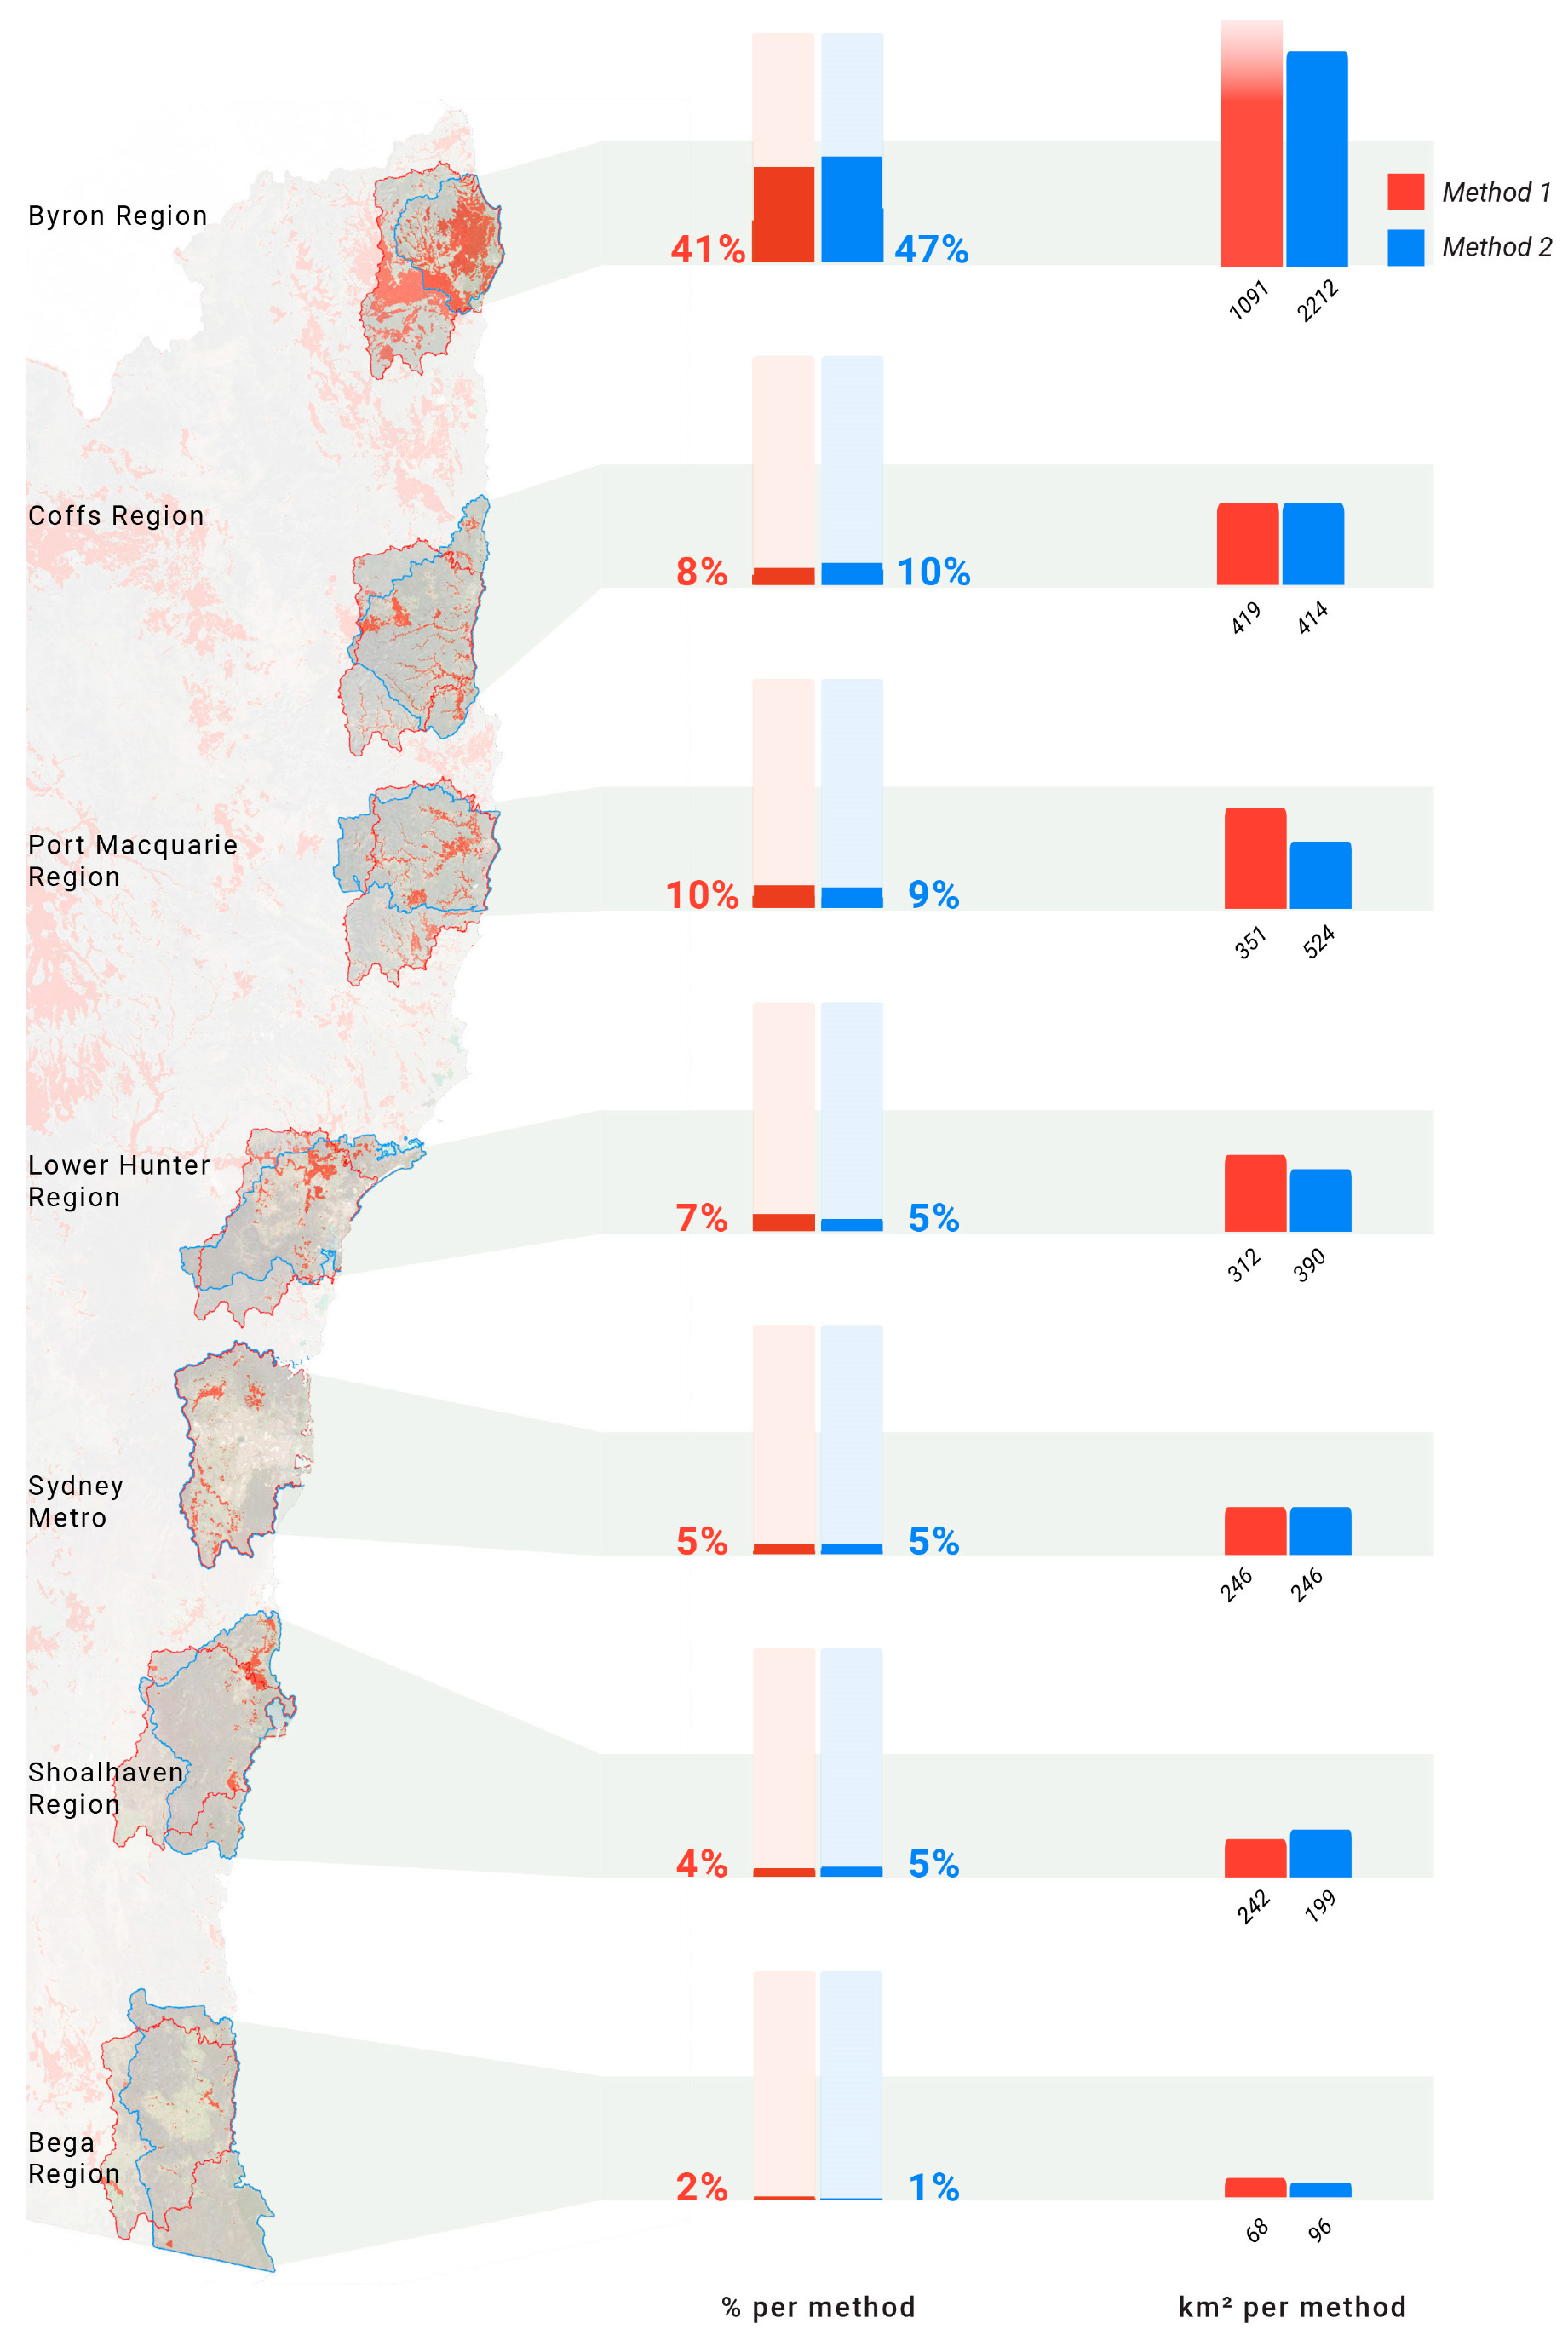
Figure 10.
State Significant Agricultural Land (SSAL) comparisons for both Methods, as percentages of total region area, and total km
2 for each region. Figure by Josh Gowers and Joshua Zeunert. Data sources: NSW Government noted in
Table 2.
Figure 10.
State Significant Agricultural Land (SSAL) comparisons for both Methods, as percentages of total region area, and total km
2 for each region. Figure by Josh Gowers and Joshua Zeunert. Data sources: NSW Government noted in
Table 2.
Table 3.
Land Soil and Capability results for Method 1’s boundaries by region (and NSW total). Each region shows three rows of data: land area for each class of land (1–8) in km2; the percentage of each class within the total area of each region (km2); and comparative rankings/7 for each region based on the percentages. Class colours correlate across all LSC figures and tables.
| Class/Case | Best
1 | 2 | 3 | 4 | 5 | 6 | 7 | (Worst)
8 | Total
km2 |
|---|
| Byron (km2) | 0 | 0 | 1156 | 1013 | 357 | 1386 | 991 | 372 | 4119 |
| % | 0% | 0% | 21.9% | 19.2% | 6.8% | 26.3% | 18.8% | 7.1% | 100% |
| Rank/7 | | | 1 | 3 | 6 | 2 | 6 | 5 | |
| Coffs | 0 | 0 | 256 | 818 | 662 | 692 | 1290 | 1572 | 5034 |
| % | 0% | 0% | 4.8% | 15.5% | 12.5% | 13.1% | 24.4% | 29.7% | 100% |
| Rank/7 | | | 3 | 4 | 4 | 5 | 5 | 1 | |
| P. Macquarie | 0 | 0 | 376 | 592 | 252 | 1363 | 1362 | 1311 | 4880 |
| % | 0% | 0% | 7.2% | 11.3% | 4.8% | 25.9% | 25.9% | 24.9% | 100% |
| Rank/7 | | | 2 | 5 | 7 | 3 | 4 | 2 | |
| L. Hunter | 0 | 0 | 241 | 1255 | 820 | 645 | 1860 | 112 | 4693 |
| % | 0% | 0% | 4.9% | 25.4% | 16.6% | 13.1% | 37.7% | 2.3% | 100% |
| Rank/7 | | | 4 | 2 | 2 | 7 | 1 | 6 | |
| Sydney | 0 | 0 | 115 | 2046 | 483 | 674 | 1556 | 75 | 4834 |
| % | 0% | 0% | 2.3% | 41.3% | 9.8% | 13.6% | 31.4% | 1.5% | 100% |
| Rank/7 | | | 6 | 1 | 5 | 6 | 3 | 7 | |
| Shoalhaven | 0 | 0 | 167 | 541 | 678 | 1323 | 1696 | 534 | 4772 |
| % | 0% | 0% | 3.4% | 11.0% | 13.7% | 26.8% | 34.3% | 10.8% | 100% |
| Rank/7 | | | 7 | 6 | 3 | 4 | 2 | 4 | |
| Bega | 0 | 0 | 56 | 358 | 1552 | 1590 | 882 | 872 | 5254 |
| % | 0% | 0% | 1.1% | 6.7% | 29.2% | 30.0% | 16.6% | 16.4% | 100% |
| Rank/7 | | | 7 | 7 | 1 | 1 | 7 | 3 | |
| NSW | 0 | 14,659 | 116,025 | 190,846 | 154,928 | 174,023 | 108,783 | 48,889 | 677,469 |
| % | 0% | 1.8% | 14.4% | 23.6% | 19.2% | 21.5% | 13.5% | 6.0% | 100% |
Table 4.
This shows Land Soil and Capability results based on Method 2 boundary areas for each region (and NSW total). Each region shows three rows of data: land area for each class of land (1–8) in km2; the percentage of each class within the total area of each region (km2); and comparative rankings/7 for each region based on percentages. Class colours correlate across all LSC figures and tables.
| Class/Case | (Best)
1 | 2 | 3 | 4 | 5 | 6 | 7 | (Worst)
8 | Total km2 |
|---|
| Byron (km2) | 0 | 0 | 538 | 216 | 34 | 722 | 506 | 106 | 2123 |
| % | 0% | 0% | 25.3% | 10.2% | 1.6% | 34% | 23.8% | 5.0% | 100% |
| Rank/7 | | | 1 | 5 | 7 | 2 | 5 | 6 | |
| Coffs | 0 | 0 | 282 | 701 | 425 | 709 | 1072 | 784 | 3974 |
| % | 0% | 0% | 7.1% | 17.6% | 10.7% | 17.8% | 27.0% | 19.7% | 100% |
| Rank/7 | | | 3 | 3 | 5 | 5 | 6 | 1 | |
| P. Macq | 0 | 0 | 321 | 135 | 1064 | 775 | 897 | 6 | 3198 |
| % | 0% | 0% | 10.0% | 4.2% | 33.3% | 24.2% | 28.0% | 0.2% | 100% |
| Rank/7 | | | 2 | 6 | 1 | 3 | 4 | 7 | |
| L. Hunter | 0 | 0 | 170 | 1140 | 565 | 599 | 1156 | 184 | 3814 |
| % | 0% | 0% | 4.5% | 29.9% | 14.8% | 15.7% | 30.3% | 4.8% | 100% |
| Rank/7 | | | 4 | 2 | 4 | 6 | 3 | 4 | |
| Sydney | 0 | 0 | 115 | 2046 | 483 | 674 | 1556 | 75 | 4949 |
| % | 0% | 0% | 2.3% | 41.3% | 9.8% | 13.6% | 31.4% | 1.5% | 100% |
| Rank/7 | | | 6 | 1 | 6 | 7 | 2 | 5 | |
| Shoalhaven | 0 | 0 | 207 | 601 | 710 | 1062 | 1545 | 529 | 4654 |
| % | 0% | 0% | 4.4% | 12.9% | 15.2% | 22.8% | 33.2% | 11.4% | 100% |
| Rank/7 | | | 5 | 4 | 3 | 4 | 1 | 3 | |
| Bega | 0 | 0 | 62 | 95 | 1462 | 2390 | 1246 | 1047 | 6302 |
| % | 0% | 0% | 1.0% | 1.5% | 23.2% | 37.9% | 19.8% | 16.6% | 100% |
| Rank/7 | | | 7 | 7 | 2 | 1 | 7 | 2 | |
| NSW | 0 | 14,659 | 116,025 | 190,846 | 154,928 | 174,023 | 108,783 | 48,889 | 808,153 |
| % | 0% | 1.8% | 14.4% | 23.6% | 19.2% | 21.5% | 13.5% | 6.0% | 100% |
Table 5.
Inherent Soil Fertility results based on Method 1 boundary areas for each region (and NSW total). Each region shows three rows of data: land area for each class of land (1–8) in km2; the percentage of each class within the total area of each region (km2); and comparative rankings/7 for each region based on percentages. Class colours correlate across all ISF figures and tables.
| Class/Case | (Best)
5 | 4 | 3 | 2 | (Worst)
1 | Total km2 |
|---|
| Byron (km2) | 433 | 1929 | 728 | 1830 | 356 | 5275 |
| % | 8.2% | 36.6% | 13.8% | 34.7% | 6.7% | 100% |
| Rank/7 | 1 | 1 | 5 | 6 | 7 | |
| Coffs | 0 | 1035 | 1037 | 1958 | 1260 | 5290 |
| % | 0% | 19.6% | 19.6% | 37.0% | 23.8% | 100% |
| Rank/7 | 6 | 2 | 2 | 5 | 3 | |
| P. Macq | 37 | 871 | 1840 | 604 | 1907 | 5259 |
| % | 0.7% | 16.6% | 35.0% | 11.5% | 36.2% | 100% |
| Rank/7 | 3 | 3 | 1 | 7 | 1 | |
| L. Hunter | 8 | 347 | 493 | 3015 | 1053 | 4917 |
| % | 0.2% | 7.1% | 10.0% | 61.3% | 21.4% | 100% |
| Rank/7 | 5 | 5 | 7 | 2 | 5 | |
| Sydney | 118 | 333 | 679 | 2376 | 1562 | 5068 |
| % | 2.3% | 6.6% | 13.4% | 46.9% | 30.8% | 100% |
| Rank/7 | 2 | 6 | 6 | 4 | 2 | |
| Shoalhaven | 0 | 272 | 803 | 2644 | 1220 | 4939 |
| % | 0% | 5.5% | 16.3% | 53.5% | 24.7% | 100% |
| Rank/7 | 6 | 7 | 4 | 3 | 4 | |
| Bega | 35 | 436 | 994 | 3474 | 370 | 5310 |
| % | 0.7% | 8.2% | 18.7% | 65.4% | 7.0% | 100% |
| Rank/7 | 4 | 4 | 3 | 1 | 6 | |
| NSW | 12,343 | 62,812 | 247,824 | 275,313 | 167,239 | 765,531 |
| | 1.6% | 8.2% | 32.4% | 36.0% | 21.8% | 100% |
Table 6.
This shows Inherent Soil Fertility results based on Method 2 boundary areas for each region (and NSW total). Each region shows three rows of data: land area for each class of land (1–8) in km2; the percentage of each class within the total area of each region (km2); and comparative rankings/7 for each region based on percentages. Class colours correlate across all ISF figures and tables.
| Class/Case | (Best)
5 | 4 | 3 | 2 | (Worst)
1 | Total km2 |
|---|
| Byron (km2) | 169 | 1127 | 254 | 482 | 91 | 2123 |
| % | 8.0% | 53.1% | 12.0% | 22.7% | 4.3% | 100% |
| Rank/7 | 1 | 1 | 5 | 6 | 6 | |
| Coffs | 0 | 840 | 1108 | 1386 | 640 | 3974 |
| % | 0% | 21.1% | 27.9% | 34.9% | 16.1% | 100% |
| Rank/7 | 6 | 2 | 2 | 5 | 5 | |
| P. Macq | 25 | 622 | 1270 | 398 | 1113 | 3428 |
| % | 0.7% | 18.1% | 37.1% | 11.6% | 32.5% | 100% |
| Rank/7 | 4 | 3 | 1 | 7 | 1 | |
| L. Hunter | 61 | 283 | 433 | 2273 | 810 | 3859 |
| % | 1.6% | 7.3% | 11.2% | 58.9% | 21.0% | 100% |
| Rank/7 | 3 | 4 | 6 | 2 | 4 | |
| Sydney | 118 | 333 | 679 | 2376 | 1562 | 5068 |
| % | 2.3% | 6.6% | 13.4% | 46.9% | 30.8% | 100% |
| Rank/7 | 2 | 6 | 4 | 4 | 2 | |
| Shoalhaven | 0 | 336 | 862 | 2282 | 1174 | 4654 |
| % | 0% | 7.2% | 18.5% | 49.0% | 25.3% | 100% |
| Rank/7 | 6 | 5 | 3 | 3 | 3 | |
| Bega | 16 | 186 | 457 | 5370 | 0 | 6029 |
| % | 0.3% | 3.1% | 7.6% | 89.1% | 0% | 100% |
| Rank/7 | 5 | 7 | 7 | 1 | 7 | |
| NSW | 12,343 | 62,812 | 247,824 | 275,313 | 167,239 | 765,531 |
| | 1.6% | 8.2% | 32.4% | 36.0% | 21.8% | 100% |
Table 7.
Biophysical Strategic Agricultural Land (BSAL) for Method’s 1 (red) and 2 (blue).
Table 7.
Biophysical Strategic Agricultural Land (BSAL) for Method’s 1 (red) and 2 (blue).
| BSAL | Method 1 | Method 2 |
|---|
| | BSAL km2 | Boundary Area km2 | % of Area | BSAL km2 | Boundary Area km2 | % of Area |
|---|
| Byron | 975 | 5293 | 18.4% | 550 | 2346 | 23.5% |
| Coffs | 245 | 5297 | 4.6% | 279 | 4264 | 6.5% |
| Port Mac | 294 | 5275 | 5.6% | 176 | 3681 | 4.8% |
| LH | 398 | 5012 | 7.9% | 289 | 5794 | 5.0% |
| SYD | 103 | 5340 | 1.9% | 103 | 5340 | 1.9% |
| Nowra | 163 | 4974 | 3.3% | 201 | 4947 | 4.1% |
| Bega | 35 | 5318 | 0.7% | 47 | 6294 | 0.8% |
| NSW | 30,945 | 810,213 | 3.8% | | | |
Table 8.
State Significant Agricultural Land (SSAL, draft dataset) for Method’s 1 (red) and 2 (blue).
Table 8.
State Significant Agricultural Land (SSAL, draft dataset) for Method’s 1 (red) and 2 (blue).
| SSAL | Method 1 | Method 2 |
|---|
| | SSAL km2 | Boundary Area km2 | % of Area | SSAL km2 | Boundary Area km2 | % of Area |
|---|
| Byron | 2212 | 5293 | 41.8% | 1091 | 2346 | 46.5 |
| Coffs | 414 | 5297 | 7.8% | 419 | 4264 | 9.8 |
| Port Mac | 524 | 5275 | 9.9% | 351 | 3681 | 9.5 |
| LH | 390 | 5012 | 7.8% | 312 | 5794 | 5.4 |
| SYD | 246 | 5340 | 4.6% | 246 | 5340 | 4.6 |
| Nowra | 199 | 4974 | 4.0% | 242 | 4947 | 4.9 |
| Bega | 96 | 5318 | 1.8% | 68 | 6294 | 1.1 |
| NSW | 94,914 | 810,213 | 11.7% | | | |
The final analysis completed is shown in
Figure 11, which shows the two highest classifications in LSC (Classes 3 and 4) and ISF (Class 5 and Class 4) and the proportions of these in each of the cases. Results are next discussed.
5. Discussion
By visualising all available datasets on agricultural capacity for urban regions along the NSW coast, various patterns are apparent. We next discuss our findings and structure these into four sections: key findings; policy and planning implications for Sydney; limitations; and finally, suggestions for further research.
5.1. Key Findings
Firstly, we can immediately see the finite and limited nature of quality agricultural land in each context, emphasising a need to appreciate the importance of conserving what is left, especially against the pressures of urban growth. In terms of inherent capacity for agriculture, Sydney possesses the highest land area of all seven cases of Class 4 LSC lands (2046 km
2 or 41.3% of total land area)—being the second highest-ranked LSC category east of NSW’s Great Dividing Range. This inherent capacity is independent of whether this land is presently reflected in productive agricultural uses or not (see
Section 5.2 and
Section 5.3). We aim to present the data so that remnant and unprotected metropolitan, peri-urban, and urban agricultural landscapes can form the basis of a new push to conserve, enhance, and expand agricultural capacity within Sydney and other urban coastal regions (see
Section 5.2). Researchers such as McDougald [
60] and others [
51] suggest there is potential to expand food production within the city of Sydney to provide as much as 15% of the required food supply through adapting current marginalised urban spaces such as street verges. However, a much better approach is to conserve and support greater use of existing agricultural lands and their soils within the metropolitan region, as well as their social ecosystems [
61] and economic structures shaping viability (see
Section 6). Soils that have already been transformed through intense urban land uses are not easily converted back into agricultural lands due to potential contaminations, fragmentation of parcels, and unsuitable adjacent land uses [
22].
Secondly, wider spatial-data contextualisation and comparison of Sydney with other NSW coastal regions reveals the city’s agricultural capacity, based on all four viable government datasets. Sydney is broadly comparable with five comparison regions: Coffs, Port Macquarie, Lower Hunter; Shoalhaven, and Bega—and undoubtedly superior to the last two. Most of these regions possess agricultural identity: Coffs (subtropical fruits); Hunter (wine), and Bega (and to a lesser degree Shoalhaven) (dairy products). As an overall appraisal, therefore, the results may be surprising in quantifying Sydney as a comparatively capable agricultural region—and indeed, a deeper historical analysis of the city reveals this rich legacy [
22,
25]. Sydney has the largest total area of agriculturally capable land falling within the highest two Land and Soil Capability classifications (Classes 3 and 4), albeit only 2.5–8% more than the Byron region, which has considerably more higher-quality Class-3 lands (19.6–23.1%), and Byron is emphatically the superior region of all seven cases and all four datasets.
Our third finding is that Class 3 LSC, Class 5 ISF, BSAL, and SSAL lands need to be given much greater emphasis and protection against urban encroachment and development (see
Section 5.2). Focusing on Class 3 LSC lands, these are classified as possessing few agricultural limitations in regards to water erosion, wind erosion, salinity, topsoil acidification, shallow soils/rockiness, soil structure decline, waterlogging, and mass movement. While Class 3 LSC lands constitute a small total proportion of the overall area of each case—Coffs 4.8–7.1%; 7.2–10% for Port Macquarie; Lower Hunter 4.9–4.5%; Shoalhaven 3.4–4.4%; Sydney 2.3%; and Bega 1%—they present precious opportunities for agricultural production in proximity to consumer bases. Despite this, areas of Class 3 lands in Sydney, such as in the Hawkesbury and Richmond regions, continue to be lost from agricultural land through rezonings for urban development [
22]. This is especially concerning seeing that these agricultural lands are frequently susceptible to flooding, which poses a significant risk for housing and other forms of habitation and urban development.
Our fourth finding is that both correlations and variations exist between the four datasets, which is consistent with their data statements [
53]. For the ISF dataset, the Byron region unsurprisingly is the clear winner. Sydney does not fare as well in the ISF as the LSC. Other case regions have larger proportions of Class 4 (moderately high) ISF lands, with Sydney ranking fifth (Method 1) and sixth (Method 2). This is clearly evident in the expression of key results in
Figure 11. Overall, however, we emphasise the importance of protecting lands in the two highest present classes from urban development—Classes 5 and 4 in ISF and Classes 3 and 4 in LSC.
Fifth, the Biophysical Strategic Agricultural Lands and State Significant Agricultural Lands (
Figure 9 and
Figure 10 and
Table 8) show the Byron region containing by far the best agricultural production lands of the seven cases, over three times any other case. BSAL and SSAL results for the other six cases are more comparable, ranging between 1 and 10% of the total area. Like the LSC and ISF, BSAL and SSAL lands are crucial for protection against urban development.
Our sixth finding is related to the lack of consideration of metropolitan and urban agriculture within policy and consultant reports at the state and national levels. Clarke’s [
19] dismissal of Sydney’s agricultural capacity—largely based on the LSC dataset—can be attributed to a narrow focus on a single urban region and a set of financial values skewed by land speculation activities [
22]. This analysis gave legitimacy for the Greater Sydney Commission to execute their concept of a third city for Sydney, the ‘Western Parkland City’ (WPC). Its 184,500 new dwellings, 81% as detached housing, continue to encroach on the Sydney region’s remnant food production lands [
22]. Much of the WPC area is beset by a range of urban growth and human-health habitability challenges including flood-prone lands, acid-sulphate soils, poor air quality, and a hot climate. The WPC is not currently well serviced by existing or planned transport networks, especially public transport [
62,
63], equating to heavy private vehicle dependence. This reflects NSW and Sydney urban planning agendas geared to transport- and embodied energy-intensive national and global food systems that eschew metropolitan-scale food production. Despite all the advantages of the area for agriculture and the disadvantages for urban habitation, the urban growth machine mentality excludes the consideration of more balanced development approaches that retain food production.
5.2. Implications for Metropolitan Sydney’s Policy and Planning
Recent official planning efforts regarding Sydney’s agricultural production capacity demonstrate selective data bias, particularly highlighted in the 2018 Sydney Metropolitan Strategy through Clarke et al.’s report [
19]. This report utilised the identical LSC dataset used in our research. This key report [
19] failed to adequately contextualise its findings, notably failing to mention the complete absence of Class 1 Land and Soil Capability (LSC) lands throughout NSW and the minimal 1.8% of the entire state classified as Class 2 (with 99.97% of this occurring west of the Great Diving Range and thus disconnected from the vast majority of the State’s population base). When considered in this light, the relative value of the Classes 3 and 4 LSC lands visualised and presented in this paper are apparent. Consequently, for the vast majority of NSW and particularly in the eastern seaboard, where the majority of the population resides, Class 4 LSC areas emerge as significant agricultural production lands proximate to consumer bases.
Our analysis reveals that Sydney possesses a significant proportion of these Class 4 lands, accounting for 41.3% of the total area (2046 km2), which is markedly higher than other regions such as Lower Hunter (25.4–29.9%), Coffs (15.5–17.6%), Byron (19.2–10.2%), Shoalhaven (11–12.9%), Port Macquarie (11.3–4.2%), and Bega (6.7–1.5%). This indicates that if agriculture is regarded as a culturally valuable practice east of the Great Dividing Range in NSW, Sydney represents a significant region for agricultural production based on its inherent capacity.
The implications of such analyses and findings are critical for future land use planning and agricultural policy, as they emphasise the importance of recognising the agricultural potential of Sydney in the context of urban development and population density, which if planned carefully, can coexist through prudent medium and high-density development models to conserve agricultural landscapes. Our central planning recommendation would be to legislate protection of Class 3 LSC (115 km
2), Class 5 ISF (118 km
2), and Class 4 ISF (333 km
2), BSAL (103 km
2), and SSAL (246 km
2) lands within metropolitan Sydney (see
Section 5.4 to ascertain their overlap), as well as existing market gardens and other spatially and nutritionally efficient food production lands. Prohibiting the rezoning of these significant agricultural lands can be supported through complementary policies such as establishing adequate buffer zones to protect them from encroachment and land use conflict. Protection for Sydney’s Class 4 LSC lands (2046 km
2) would prove very challenging due to their significant spatial area, existing variety of current activities, and significant departure from the trajectory of over seventy years of official metropolitan planning [
32] treating peri-urban agricultural land conversion as necessary in a city-growth agenda [
22,
32,
61]. A more achievable strategy would be to identify existing operational farms and existing land zoned as agricultural within the Class 4 LSC land area, as suggested in this study’s recommendations for further research below.
In the context of a rapidly growing metropolis, where land values are high, a key agricultural dynamic is the nexus of spatial efficiency, high-value products, high nutritional content, and minimised likelihood of conflicts with adjacent land uses. While poultry farming is by far Sydney’s most economically valuable activity [
19] due to industrial (and inhumane) production approaches being very spatially efficient [
64], its rank odours routinely conflict with adjacent land uses, regularly several kilometres away [
65]. Market gardening and mushroom farming are likely the two most synergistic urban agricultural activities achieving a balance of this nexus in the Sydney context [
22]. Market gardening is particularly important for its high nutritional density in fresh vegetables, herbs, and leafy greens, crucially important if refrigerated long-distance supply chains are interrupted or compromised under future scenarios, further emphasising the city’s topographically and aquatically challenging accessibility, with other significant agricultural production regions hundreds and thousands of kilometres away (
Figure 2).
5.3. Limitations
Many factors affect agricultural production dynamics and consideration of the full range of relevant factors is outside the scope of this research. Our chief limitation, which is a direct result of the dataset particulars as noted in their user guide [
66], is their orientation to broadscale and rural agricultural practices such as cropping and livestock grazing. The LSC dataset, for example, is noted as “less applicable for high intensity [agricultural] land use”, being “suitable for broadscale assessment of land capability, particularly for assessment of lower intensity, dry-land agricultural land use” [
66]. While our study’s broadscale methodological analysis and scale intentionally aligns with this dataset characteristic, it is nonetheless geared to more theoretical inherent comparative production capacity rather than actual activities ‘on the ground’.
No datasets exist geared toward intensive metropolitan and peri-urban agricultural approaches, which are particularly influenced by economic, social, and infrastructural factors due to close proximities to large consumer markets and workforces—which can both increase and decrease the economic viability of certain lands and practices. While such complexities are understandably difficult to frame and articulate in a single dataset, we suggest such endeavours might be undertaken to factor in other types of metropolitan and urban values.
5.4. Further Research to Inform Policy and Planning
To inform and develop specific policy and planning recommendations for metropolitan Sydney, we suggest that research would be beneficial in the following three key areas. These encompass strategic planning focused on soils, systematic monitoring of agricultural land use change, and developing datasets that can better quantify the value of agriculture within cities.
Firstly, future research on strategic protection of agricultural soils in metropolitan Sydney and nearby urban regions might focus on better understanding current production in relation to development pressures. Whilst our research reviews inherent capacity, it does not address current operational food production areas nor systematically identify potential risks through future development. Further research could therefore quantify remaining agriculturally zoned lands and then develop strategic zoning of agricultural soil landscapes for current and future use. Such research can be informed through global best practices identifying relevant policies from around Australia and the world. Various mechanisms, including buffer zones between urban and agricultural uses, permanent agricultural reserves, transfer of development rights programmes, and agricultural enterprise zoning, might enhance the use of high-quality soil landscapes for agricultural purposes. By developing a more nuanced understanding of soil capability in relation to urban development pressures and patterns, planners can create targeted strategies that preserve the most productive agricultural lands while accommodating desired urban growth [
67]. Carbon accounting and future climate-sensitive policies are essential to such approaches and are a key area for future research [
68].
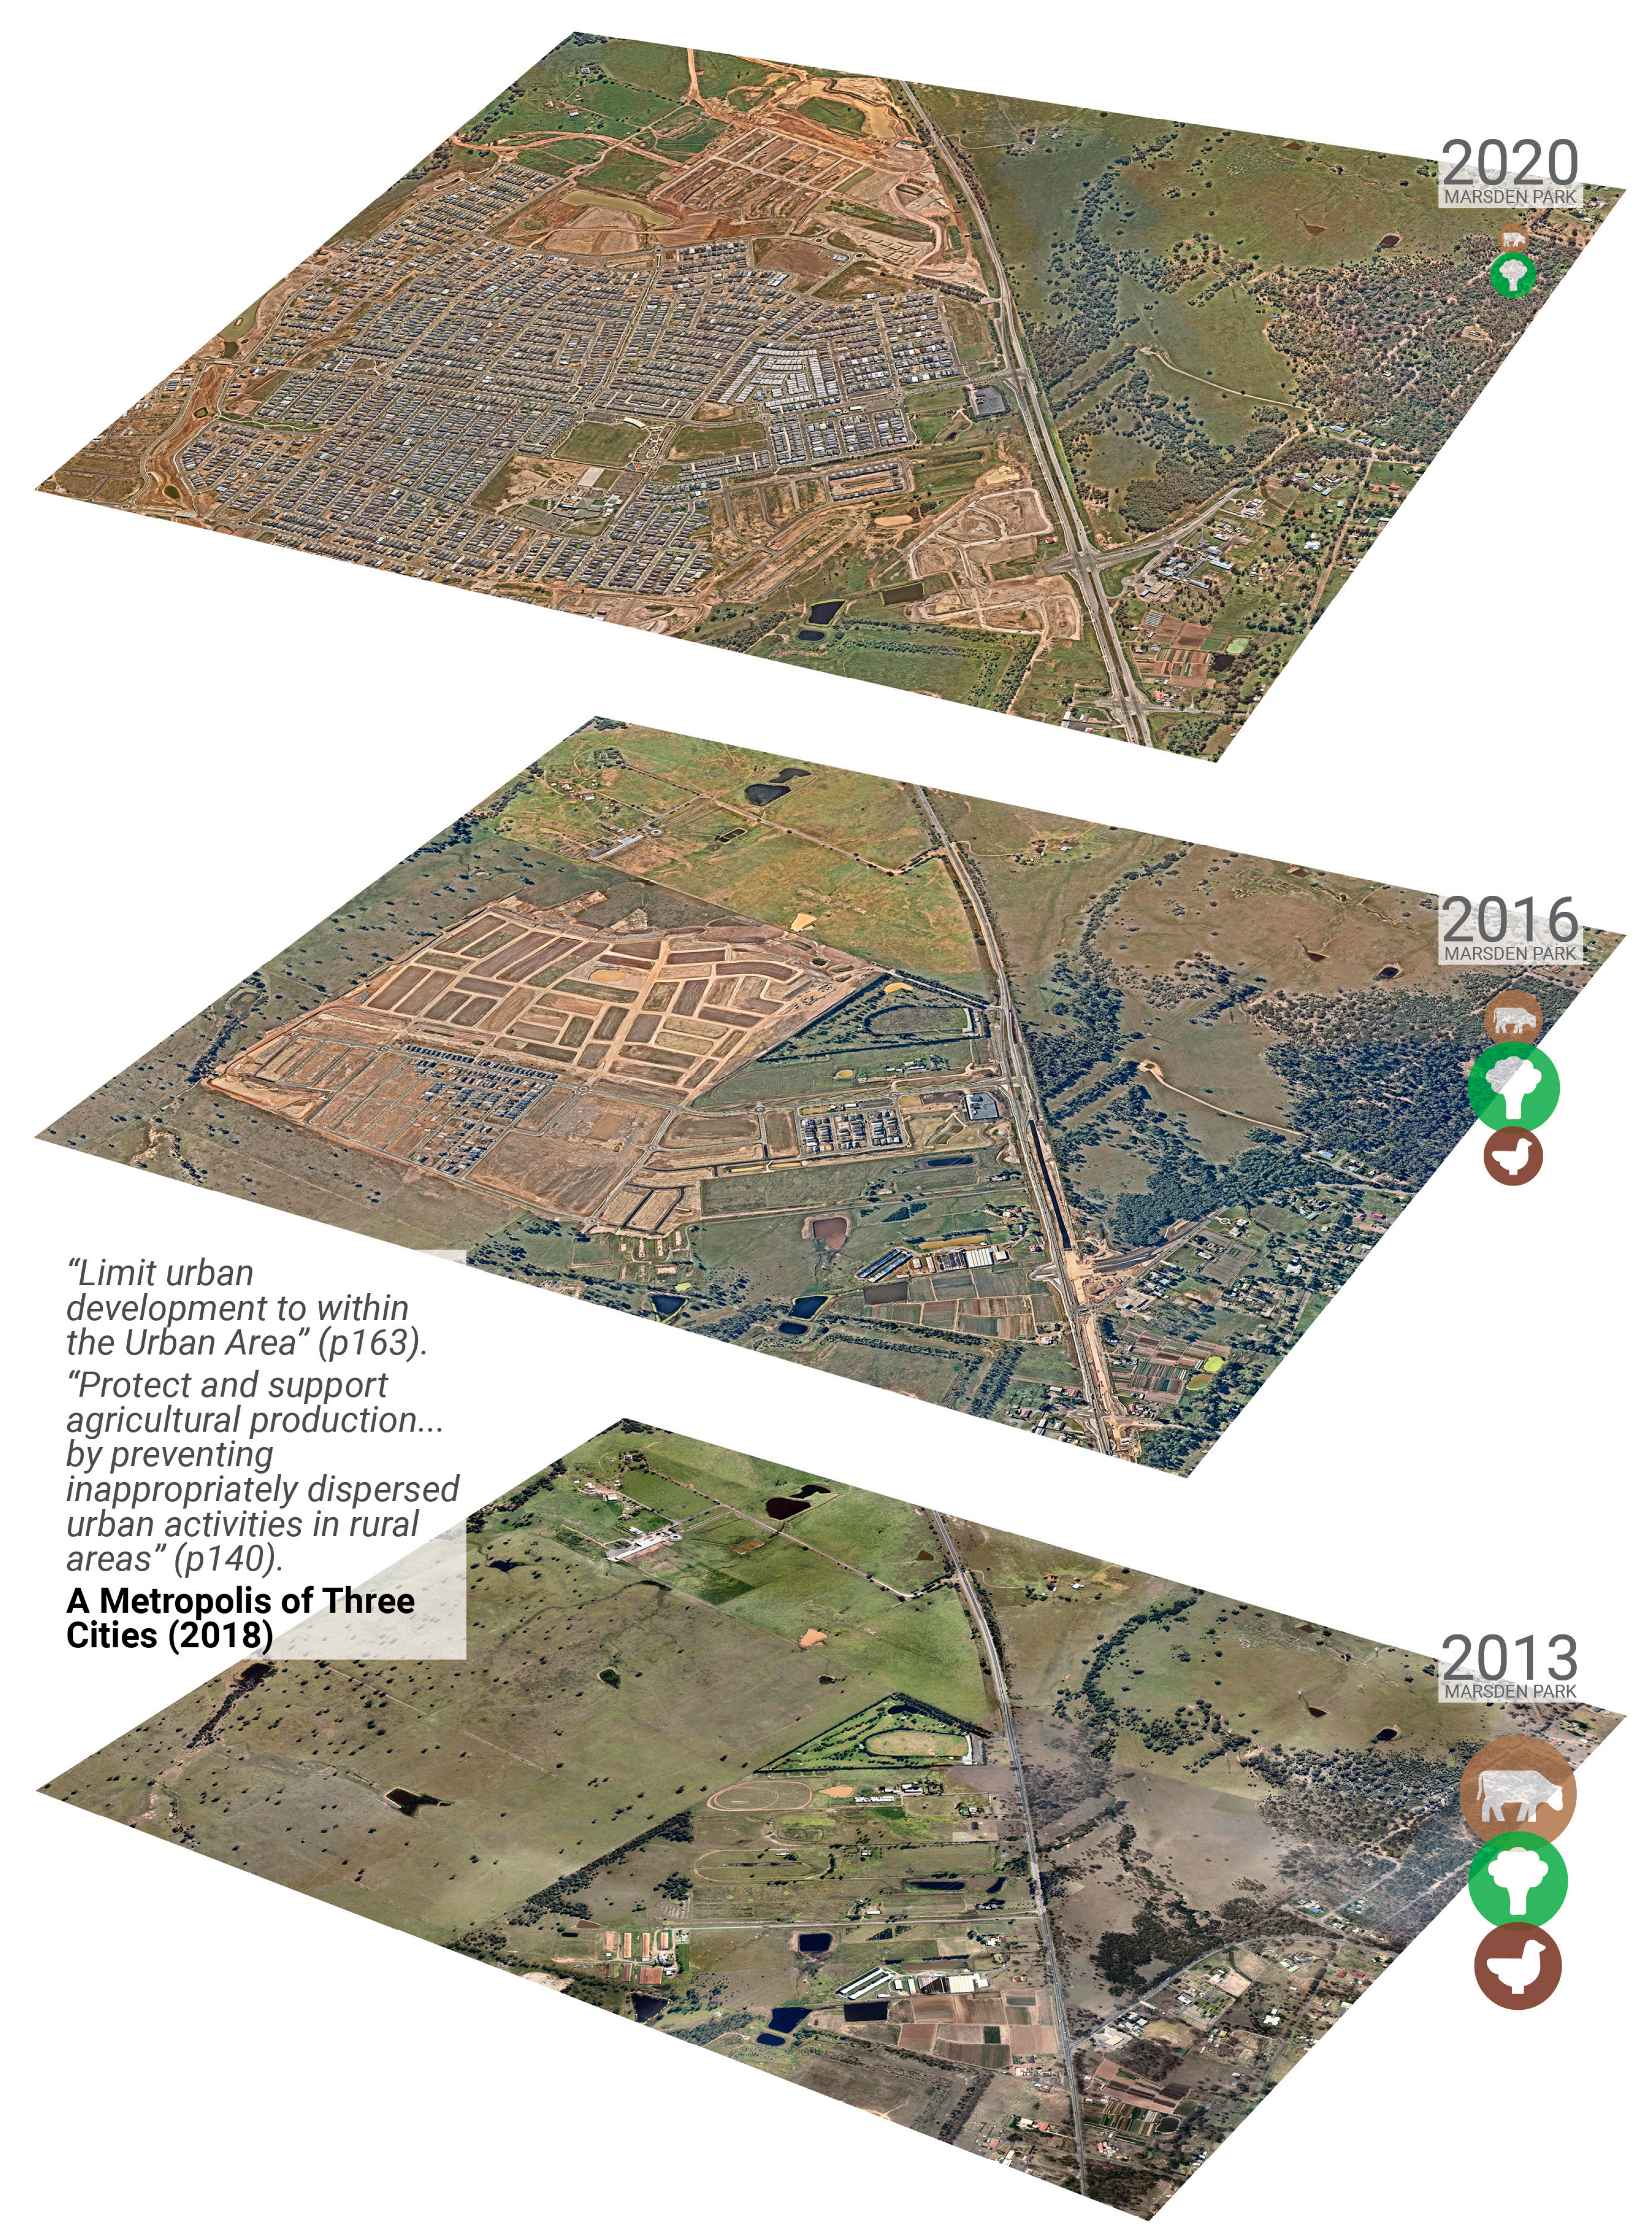
Secondly, systematic documentation of agricultural land conversion provides compelling evidence to support stronger protection policies. Using time-series aerial imagery and satellite data, researchers might establish comprehensive “before and after” comparisons that illustrate the pace and pattern of agricultural land loss in metropolitan Sydney. This documentation, building upon existing piecemeal efforts (as shown in
Figure 12), might track conversion rates, identify priority protection areas, and evaluate the effectiveness of current protection policies. These visualisations and associated open datasets [
69] can function as powerful communication tools for policymakers and the public, clearly indicating the extent of irreversible agricultural land loss and creating urgency for protective action before remaining productive soils are permanently lost to development [
70,
71,
72].
Finally, research on the socio-economic value of urban agriculture can strengthen the case for agricultural land protection [
73,
74,
75]. This research would ideally document direct economic contributions through market analysis of urban food production, including employment generation, business revenue, and supply chain impacts. Additional values communicating food security benefits, cultural heritage preservation, educational opportunities, community cohesion, and ecosystem and mental health impacts could also provide a much more comprehensive and compelling picture of urban agriculture’s multifaceted value. By quantifying these larger societal benefits, researchers help policymakers justify stronger protection measures for urban agricultural lands beyond the short-term narrow scope of urban growth engine considerations.
6. Conclusions
The global loss of farmland to urban development highlights the need for balanced land use policies that promote sustainable urban development and preserve agricultural land to ensure food security for future generations. While this is true globally, it is particularly resonant in Sydney, where recent development has seen large agricultural areas rezoned to mixed-use centres, industrial estates, and residential development [
25]. This transition has not been inevitable but manufactured through Sydney’s growth machine coalition of developers, consultants, state planners, and resulting visions and policies. Through our analysis and discussion, we have developed an evidence-based counter-narrative to this trajectory. Our findings, from critical GIS approaches, are contrary to the agricultural infertility narrative promulgated in expert and policy reports [
19]: Sydney’s land is biophysically capable of supporting agriculture, there is a significant amount of land that can do so, and this reflects a long legacy of the city [
22].
In assessing metropolitan Sydney’s biophysically inherent capacity for agricultural production, we demonstrated how datasets can either provide contextual insights or obscure understanding, as in the case of recent policy documents [
19]. Such divergent outcomes are a vital consequence of the way spatial datasets shape city growth. We used the same dataset used to inform Sydney’s most recent planning documents to draw markedly different conclusions for agriculture. While many factors beyond biophysically inherent capacity affect agricultural production dynamics—economic, social, and infrastructural [
1]—the Clarke [
19] report asserts that Sydney’s agricultural lands are inherently low-value, marginal, and unworthy of protection. Our contextualised analysis of the LSC dataset across coastal NSW—the most respected and highest quality NSW Government dataset for biophysically inherent agricultural capacity—reveals this notion as false. This makes a crucial difference, informing decision-making for long-term metropolitan planning for Australia’s largest city, as well as the agricultural interests of its inhabitants and their local food-supply security. Our research demonstrates the importance of utilising multiple datasets and case comparisons to contextualise spatial information to help avoid selective data bias and inappropriate conclusions [
76].
In metropolitan contexts such as Sydney, short-term and narrowly focused economic policies have reduced agricultural capacity and urban sustainability [
33,
77]. We posit that broader economic values and analyses need to be used to assess metropolitan agriculture as a land use—as with biodiversity conservation, drinking water catchments, natural resources, infrastructures, heritage elements, scenic qualities, parks and recreation, sports, and other land uses. Metropolitan agriculture contributes cultural, environmental, social, and strategic values extending well beyond short-term economic measures.


