Article

Long-Term Analysis and Multi-Scenarios Simulation of Ecosystem Service Values in Typical Karst River Basins

1
School of Geography and Environmental Science, Guizhou Normal University, Guiyang 550025, China
2
State Key Laboratory of Resources and Environmental Information System, Institute of Geographic Sciences and Natural Resources Research, Chinese Academy of Sciences, Beijing 100101, China
3
College of Resources and Environment, University of Chinese Academy of Sciences, Beijing 100049, China
*
Authors to whom correspondence should be addressed.
Land 2025, 14(4), 824; https://doi.org/10.3390/land14040824
Submission received: 3 March 2025 / Revised: 9 April 2025 / Accepted: 9 April 2025 / Published: 10 April 2025

Abstract

:
This study, guided by the concept hat “lucid waters and lush mountains are invaluable assets”, focuses on explicating the ecological vulnerability characteristics of the Nanpan and Beipan River Basins, a typical karst river basin in Guizhou Province. In this article, a value equivalent table was built to calculate the ecosystem service value (ESV) within the basin from 2000 to 2020. The patch landscape and urban simulation model (PLUS) was improved to forecast ecosystem changes under four scenarios in the future. The Getis-Ord Gi*statistic, a spatial analysis tool, was introduced to identify and interpret the spatial patterns of ESVs in the study area. The research indicates that: (1) from 2000 to 2020, the spatial pattern of ecosystem has significantly improved, and with a notable ESV increase in the Nanpan and Beipan River Basins, especially the fastest growth from 2005 to 2010. Forest and grassland ecosystems are the main contributors to ESV within the basin, and the spatial distribution of ESV shows a decreasing trend from southeast to northwest. (2) Under different scenarios, forest ecosystem still would have the highest contribution rate to update the ESV between 2010 and 2035. The ESV is the lowest under the cropland protection scenario, amounting to CNY 104.972 billion. Compared to other scenarios, the ESV is higher under the sustainable development scenario, reaching CNY 106.786 billion, and this scenario provides a more comprehensive and balanced perspective, relatively achieving a harmonious coexistence between humans and nature. (3) The hot spots of ESV are mainly concentrated in the southeast and along the riverbanks of the study area. Urban ecosystems are the cold spots of ESV, indicating that protecting the ecosystems along the riverbanks is crucial for ensuring the ecological security and sustainable development of karst mountainous river basins. In the future development of karst mountainous river basins, it is necessary to strengthen ecological restoration and governance, monitor soil erosion through remote sensing technology, optimize the layout of territorial space to implement the policy of green development, and promote the harmonious coexistence of humans and nature, ensuring the ecological security and sustainable development of the basins.

1. Introduction

With the rapid development of the Chinese economy, environmental protection and ecological restoration have become an important component of China’s development strategy. The ecological concept proposed by Chinese president Xi Jinping that “clear waters and green mountains are as valuable as gold and silver” emphasizes the importance of ecological environmental protection for sustainable development. It reveals the intrinsic connection between ecological environmental protection and economic development, and establishes the central role of ecological civilization construction in sustainable development. The Nanpan and Beipan River Basins in Guizhou Province, as typical karst river basins, are not only important water sources for the upper reaches of the Yangtze and Pearl Rivers, providing a large amount of clean water resources for downstream areas, but also play a key role in maintaining the quality and quantity balance of water in the two major river systems. The basin occupies a key position in the national ecological security pattern, and its ecological condition directly affects the ecological security of the entire Yangtze and Pearl River Basins and even the whole country. Therefore, it is particularly important to quantitatively evaluate the ecosystem service values (ESV) and predict its spatial dynamic changes in the typical karst river basins under different future development scenarios.
Ecosystem service values (ESV) serve as a critical method for quantifying the living environment and the diverse service capacities provided by natural ecosystems, translating these into monetary values [1]. This quantification reflects the status of environmental quality. Following the seminal research by Costanza et al. in 1998 [2], Xie Gao-di and colleagues have advanced this field by developing a dynamic assessment method based on the unit area value equivalent factor approach for China’s terrestrial ecosystems [3]. This method has emerged as a vital tool for gauging the ecological quality of China’s environment. In this study, we build upon this foundational work by applying a dynamic equivalent factor table to analyze the ESV of karst mountainous river basins. Furthermore, we integrate the PLUS (predicting land use change with scenario analysis) model to predict future ESV changes. This approach represents a novel contribution to both theoretical methods and applied research in the field. The early 21st century has witnessed significant development and depth in the study of ecosystem service values in karst river basins [4,5,6,7]. yet our work introduces a unique perspective by combining dynamic assessment with predictive modeling, which is essential for understanding the future ecological sustainability of these unique geological units. Recent studies have illuminated key aspects of ecosystem service values in karst river basins: from 1985 to 2005, a ‘V’-shaped trend in these values was observed in Southwest China’s karst region [8]. Urbanization-driven land use changes profoundly influence these values by modifying ecosystem spatial patterns [9,10,11]. Forests and shrublands are primary contributors to ecosystem service values in karst areas [12,13,14]. Moreover, environmental variables like temperature, slope, and elevation significantly affect these values, displaying pronounced spatial differentiation [14,15,16,17]. Related research underscores the importance and intricacy of ecosystem service values in karst river basins, necessitating their preservation amidst economic expansion. This study focuses on a representative karst mountainous river basin, analyzing the long-term spatiotemporal dynamics of its ecosystem service values. It investigates the basin’s ecosystem spatial evolution under varying policy scenarios. The findings offer critical insights for academic inquiry and practical applications in optimizing the spatial arrangement and management of ecosystems in karst mountainous river basins.
Land use simulation and prediction models play a crucial role in promoting regional sustainable development and optimizing territorial spatial layout [18]. They integrate research findings from multiple disciplines such as geography, ecology, and environmental science [19,20]. By scientifically predicting future land use scenarios, these models can accurately assess the ecological and environmental conditions under different development paths, promptly identify and avoid risk factors that may lead to ecological degradation, and provide decision-makers with important scientific evidence [21,22]. Research on land use simulation and prediction indicates that a variety of models have been widely applied. These models have played a significant role in the analysis of the spatiotemporal dynamics of land use change [23,24], land use prediction under multi-scenario simulations [25,26], assessment of the impact of land use change on carbon emissions/absorption [27,28], and analysis of changes in ecosystem service values (ESV) caused by land use changes [29,30]. The PLUS (patch landscape and urban simulation model) represents a sophisticated land use transformation simulation framework that operates on the fundamentals of cellular automata (CA). It incorporates a comprehensive set of driving mechanisms influencing land use dynamics, including spatial constraints and landscape configurations. The model is particularly adept at facilitating the analysis and forecasting of urban sprawl, as well as the alterations in land use patterns, and their subsequent effects on the ecological milieu [31]. Relevant research findings suggest that the model is currently widely used in land use simulation in karst regions and is suitable for simulating future ESV in karst river basins.
In light of the aforementioned considerations, this study selected the Nanpan and Beipan River Basins in Guizhou Province as the study area. These basins are selected due to their representativeness, typicity within karst river basins, strategic ecological significance, and their representation of the distinctive features of karst landscapes, making them ideal for studying ecosystem service values. Based on this, the PLUS prediction model is used to forecast the spatial evolution trend of ESVs in the basin under different development scenarios by 2035. The aim is to explore the ecological and environmental evolution mechanism of typical karst river basins under the background of ecological change policies. This study aims to provide a scientific basis for the maintenance of ecosystems and the protection of the ecological environment in karst river basins. Additionally, it offers theoretical support and reference for the protection and scientific utilization of ecosystems in similar geographical environments in China.

2. Materials and Methods
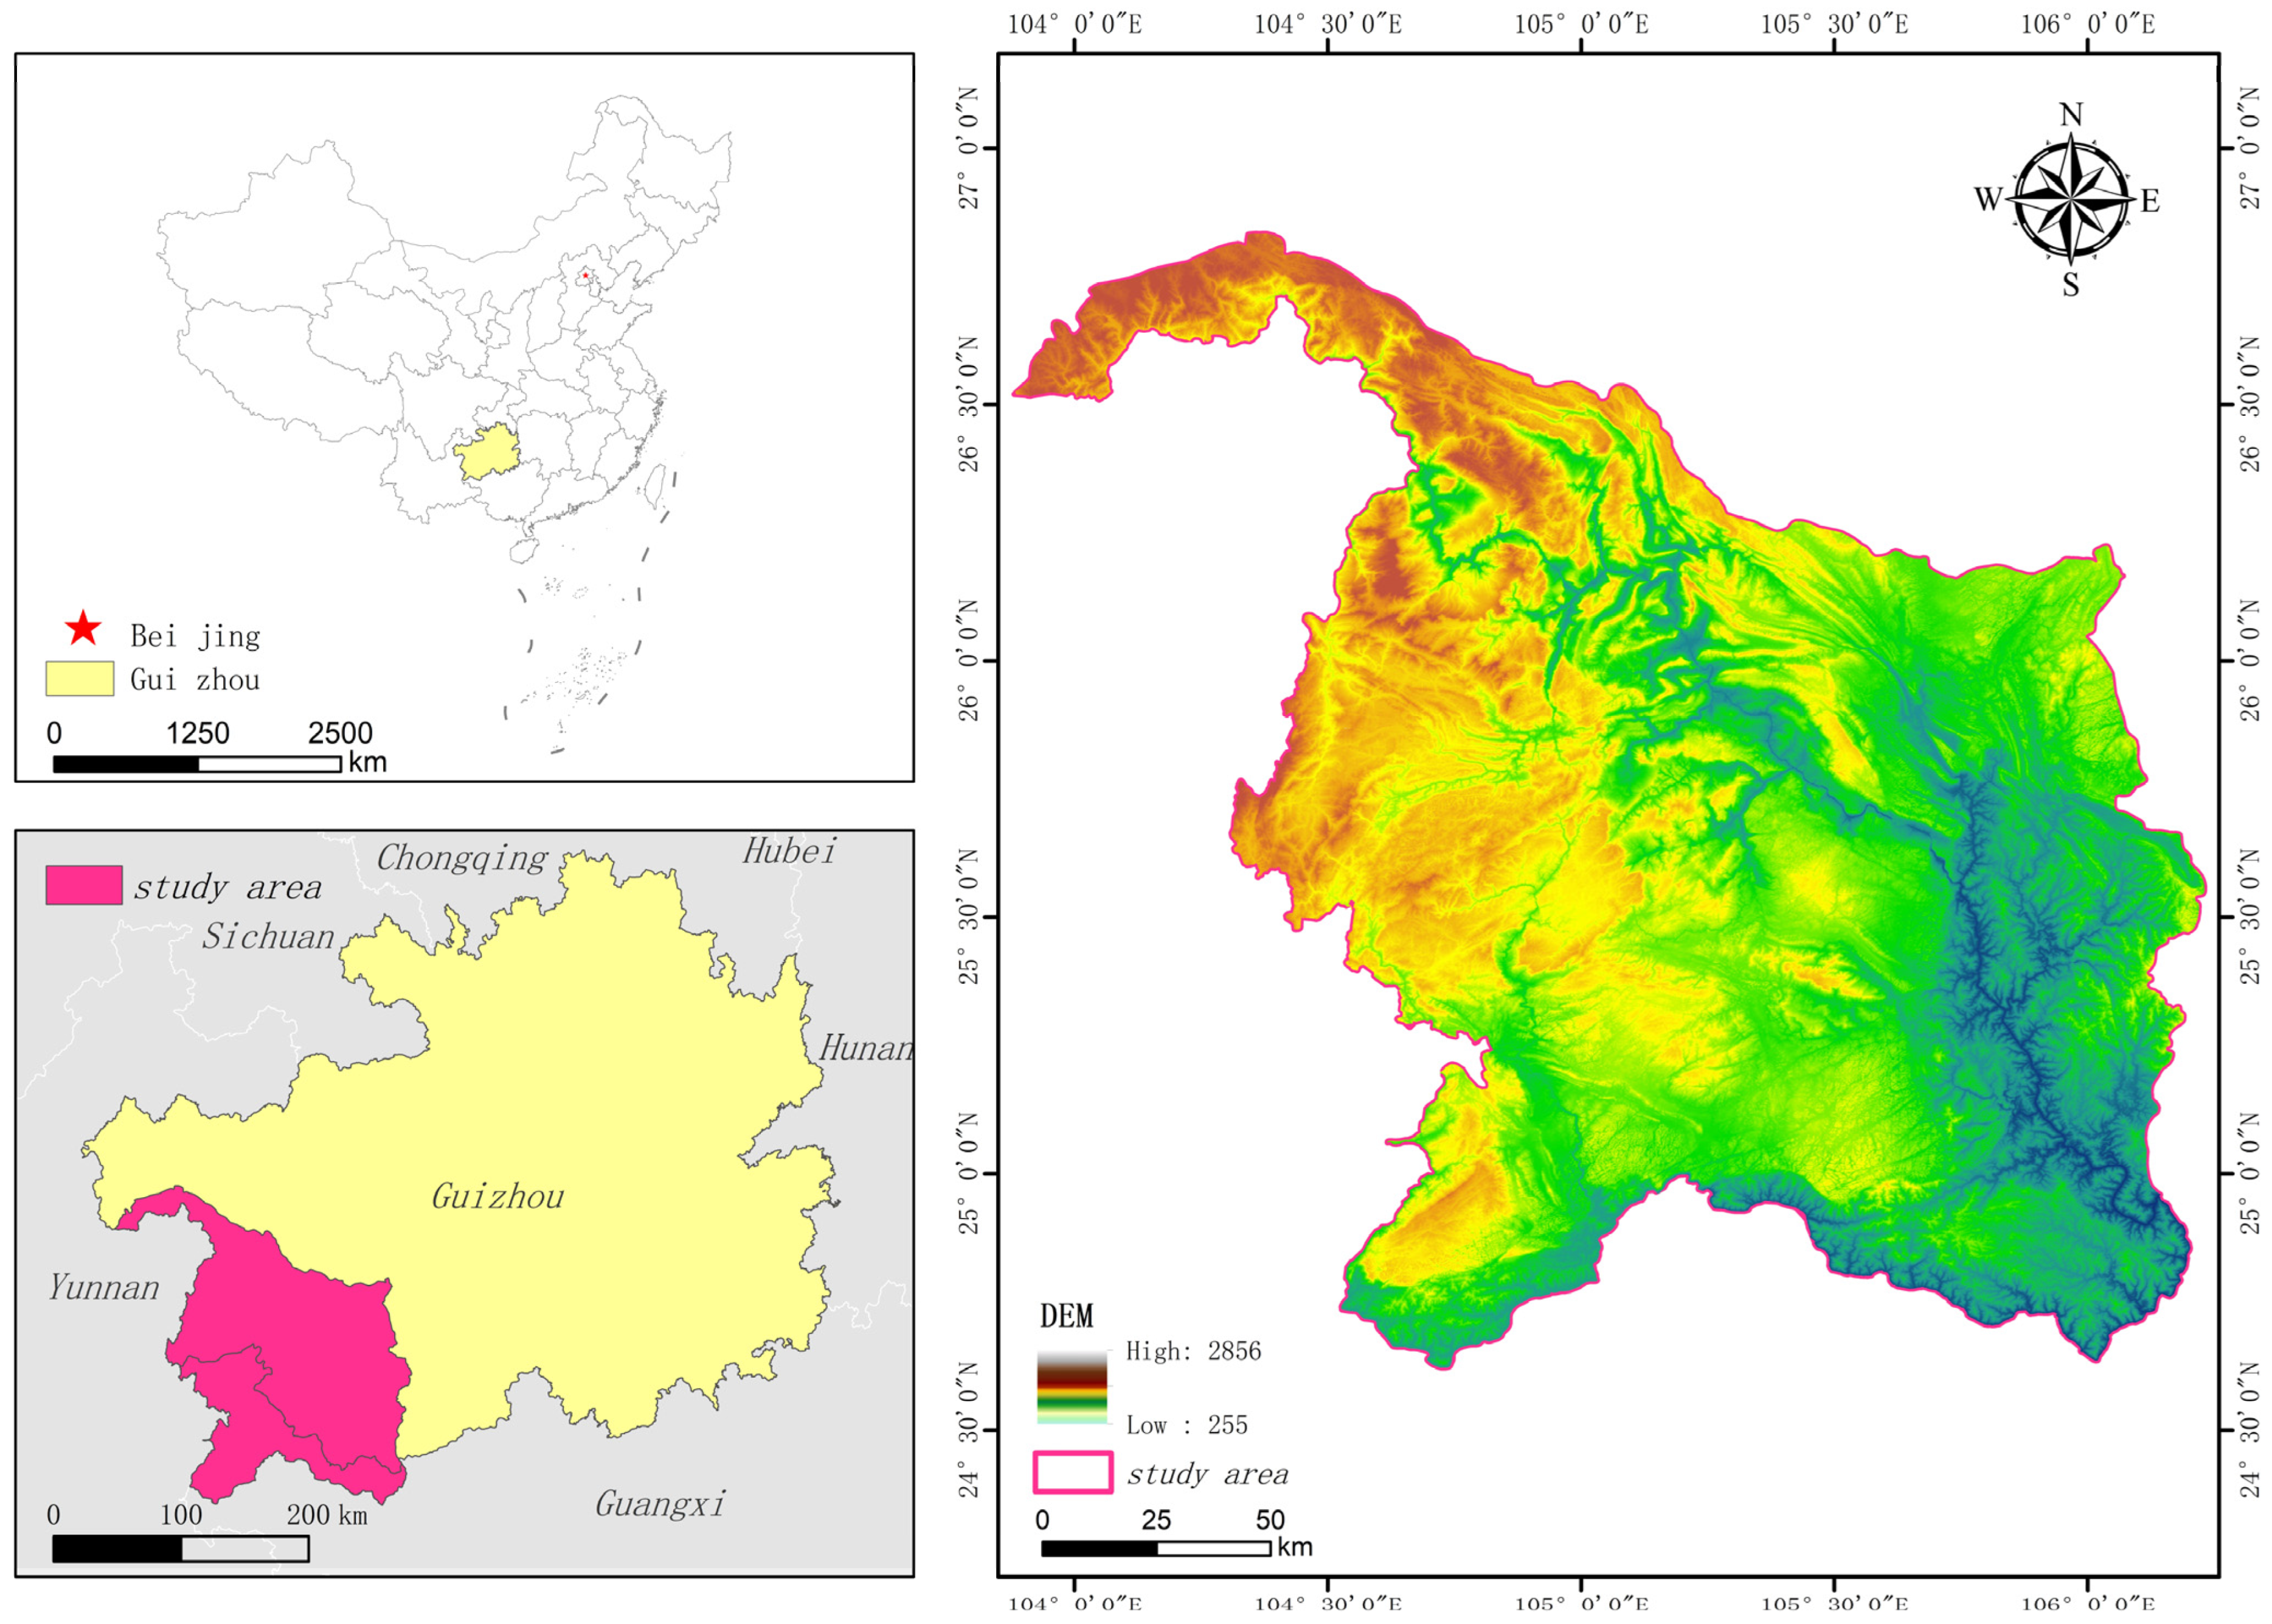
2.1. Study Area

The Nanpan and Beipan River Basins, located at 104°00′–106°00′ E and 24°40′–26°48′ N, cover an area of about 29,000 square kilometers and feature a notable elevation range from 255 to 2856 m (Figure 1), where the maximum thickness of carbonate rock layer is up to 85% of the total overburden layer, and the area with slopes over 25 degrees is about 45% of the total area [32]. They have a very fragile ecological environment, but the study area boasts rich biodiversity and a variety of vegetation types. However, even with high forest coverage, the region still faces severe ecological degradation and rocky desertification. The unique karst topography of the Nanpan and Beipan River Basins has given rise to a rich and diverse range of ecosystems, with forest ecosystems, grassland ecosystems, and agricultural ecosystems being the most widely distributed. The karstification process, which shapes the unique karst landscapes, introduces ecological microenvironments such as underground rivers and caves within forest ecosystems, thereby enhancing their biodiversity. Moreover, these karst features play a significant role in the carbon budget. The dissolution of carbonate rocks in karst areas not only contributes to the formation of these distinctive habitats but also affects carbon sequestration and release processes. The carbon stored within the karstic substrates and the associated ecosystems can impact the overall carbon cycle, thereby increasing the relevance of the value of ecosystem services provided by these landscapes.

2.2. Data Collection and Preprocessing

2.2.1. Data Collection

In conducting the long-term analysis and multi-scenario simulation prediction of ESVs in the Nanpan and Beipan River Basins, the following basic geographic data were collected and utilized in this study: land use data from 2000 to 2020, Digital Elevation Model (DEM) data, annual average temperature and annual average precipitation data, road data, and other socio-economic data. The land use data were sourced from the Resource and Environmental Science Data Center of the Chinese Academy of Sciences (http://www.resdc.cn (accessed on 13 November 2024)). This dataset has a spatial resolution of 30 m, covers a total of 11 periods from 1980 to 2020, and has been widely used in numerous research studies. Based on the “National Ecological Function Zoning”, the “National Ecological Status Survey and Assessment Technical Specifications”, and the relevant literature, and in consideration of the specific conditions of the Nanpan and Beipan River Basins, the land use data were reclassified into six major categories: farmland ecosystem, forest ecosystem, grassland ecosystem, wetland ecosystem, urban ecosystem, and desert ecosystem [33]. The DEM data were sourced from the Geospatial Data Cloud website (http://www.gscloud.cn/ (accessed on 1 November 2024)), meteorological data from the China Meteorological Network, and road data from the National Geographic Information Resource Catalog Service System (https://www.webmap.cn/ (accessed on 1 November 2024)). Additionally, other socio-economic data were derived from the “Guizhou Province Statistical Yearbook” and the “National Compilation of Cost and Benefit Data for Agricultural Products”. All data mentioned above were selected up to the year 2020. The data collection was conducted based on the most recent versions of the datasets available, adhering to standards of academic rigor. All data were resampled to a uniform pixel size of 30 m × 30 m to maintain consistency and comparability of the data.

2.2.2. Preprocessing

This study employed remote sensing imagery and Geographic Information System (GIS) data to conduct an annual spatial analysis of ecosystem distribution within the defined study area. This approach facilitated the creation of precise annual maps of ecosystem spatial distribution, ensuring data integrity and timeliness. By utilizing statistical yearbook data, the annual value of ecosystem services was calculated, establishing a solid foundation for valuation computations. A spatiotemporal analysis of ecosystem service values over multiple years was conducted to identify trends, providing a reference for subsequent scenario modeling and policy development (Figure 2).
To investigate the spatial distribution of ecosystem service values under various policies, this study utilized the PLUS (patch landscape and urban simulation) model to simulate the spatial distribution of ecosystems under scenarios of natural evolution, ecological conservation, economic growth, and sustainable development. The ecosystem service values for each scenario were quantified, and a comparative spatial analysis was conducted to elucidate the differences in value changes and their underlying determinants across different policy scenarios.

2.3. Methods

2.3.1. Assessment Model of Ecosystem Service Value

In light of the distinctive environmental and geographical characteristics of the Nanpan and Beipan River Basins in Guizhou Province, and recognizing the expansive temporal context of this inquiry in conjunction with the evolving patterns of economic progress, we have adopted the Chinese ecosystem service value per equivalent unit area, revised by scholars including Xie Gaodi [3], as a foundational reference for our analysis. We obtained the statistical yearbook data for the past 30 years in the study area. These data included the average yields (kg/ha) of major crops and cash crops—rice, wheat, corn, and peanuts—and the average planting area (ha) for related crops in the years 2000, 2005, 2010, 2015, and 2020. Additionally, we obtained the unit prices of crops for the corresponding years in the study area from the “Compilation of National Agricultural Product Cost and Benefit Data”. A table of ESV coefficients per unit area for various ecosystems in the Nanpan and Beipan River Basins (Table 1) was formulated. Using the ecological service value calculation model proposed by Costanza [2], the ecosystem service values for the corresponding years were calculated according to Equations (1) and (2).
E a = 1 7 i = 1 n m i p i q i M
In the formula, E a is the value of a standard equivalent factor [RMB/(ha)]; i represents the type of crop; m i is the average price of the i-th crop (RMB/kg); p i is the yield per unit area of the i-th crop (kg/ha); q i is the planting area of the i-th crop (ha); and M is the total planting area of crops (ha).
E S V = i = 1 n S a E a
In the formula, E S V is the total value of ecosystem services, and S a is the total area of the land type.

2.3.2. Ecosystem Scenario Simulation Model

The PLUS consists mainly of the land expansion analysis strategy module (LEAS) and the cellular automata model based on random patch seeds (CARS). Drawing on relevant research findings [34], this paper selected the PLUS. Based on the actual conditions of the study area and the availability of data, historical land use data, topographic data, traffic networks, population distribution, economic growth, and policy changes have been collected for the basin. Dozens of driving factors such as precipitation, temperature, distance from roads, distance from rivers, and GDP have been selected. According to the specific characteristics of the karst mountainous basin, model parameters have been set, including land use conversion rules, weights of driving factors, and constraints. After calibrating the model by comparing historical simulation results with actual land use change data, the land use in the study area for 2035 has been simulated. Furthermore, this model has been used to predict the types of ecosystem services in the study area under different development scenarios for 2035.
In order to deeply explore the impact of different development strategies on the value of ecosystem services within the Nanpan and Beipan River Basins, as well as the patterns of their dynamic changes, this study has set up four distinctive development scenarios based on a comprehensive consideration of existing research findings, the natural geographical characteristics of the study area, socio-economic conditions, and the current state of the ecological environment. These scenarios focus on different land use directions and ecological protection strategies, aiming to simulate and predict the potential trends in ecosystem changes in the study area by 2035. The four development scenarios established in this study include: natural development scenario, farmland protection scenario, economic development scenario, and sustainable development scenario:
(1) Natural development scenario: this scenario assumes that future land use will maintain the current trend of natural succession without any human intervention or adjustment, to assess the stability and trends in ecosystem service values under natural conditions.
(2) Cultivated land protection scenario: this scenario emphasizes the strict protection of existing cultivated land, restricting the conversion of high-quality farmland to other land types, controlling the transformation of general farmland to urban built-up land and other uses, while maintaining normal conversion of other land types. This is performed to assess the evolution of ecosystem service values within the study area under the cultivated land protection scenario.
(3) Economic development scenario: the economic development scenario is set to focus on maximizing the economic benefits of land use. It assumes that built-up land can expand intensely. Apart from areas unsuitable for construction such as water bodies where the transfer of built-up land is restricted, the scenario also controls the conversion of built-up land outwards. This is performed to simulate the land use pattern in the study area under a scenario of rapid economic development. The purpose of this scenario is to reveal the potential positive and negative impacts of economic growth on ecosystem service values.
(4) Sustainable development scenario: in this scenario, the design of the land use scenario considers the economic, social, and ecological benefits. Through rational planning, the sustainable use of land resources is achieved. It is set that water bodies and ecological protection areas within the study area are non-convertible, and a comprehensive consideration is given to the conversion of other land types. This scenario mainly simulates the evolution of ecosystem service values in the study area by 2035 under the condition of implementing protection strategies while economic development is ongoing.

2.3.3. Spatial Clustering Analysis Method of Ecosystem Service Values

Hot spot analysis is a local spatial autocorrelation indicator that uses the Getis–Ord Gi* statistic in ArcGIS software to identify clusters of high values (hot spots) and low values (cold spots) in spatial distributions. This method is used to confirm whether there are clusters of high and low values of ESV in the study area, as well as to determine the spatial locations of hot spot areas, sub-hot spot areas, transition areas, sub-cold spot areas, and cold spot areas. In the long-term analysis and multi-scenario simulation of ecosystem service value in karst mountainous watersheds, its significance lies in identifying clusters of high and low service value areas, understanding spatial distribution patterns, providing a basis for policy formulation through significance testing, analyzing trends in value changes, and offering optimized suggestions for the timing of urban green space development, thus providing important reference information for the sustainable management and decision-making of the watershed. The calculation formulas for Gi* and Z-values are as follows:
G i * = j = 1 n W i j X j j = 1 n x j
Z ( G i * ) = j = 1 n w i j x j x ¯ j = 1 n w i j s [ n j = 1 n w i j 2 ( j = 1 n w i j ) 2 ] n 1
S = j = 1 n x j 2 n 1 ( x ¯ ) 2
Gi* is the clustering index for the patch of i ; W i j is the weight matrix between patch i and patch j ; x i and x j are the attribute values of patches i and j ; n is the total number of patches; x ¯ is the mean value of all patches in the space; S is the standard deviation of the attribute values of all patches. The spatial clustering characteristics of low-value areas (cold spots) and high-value areas (hot spots) can be determined by the Gi* value. When statistically significant, a high value (Gi* > 0) indicates a clustering of hot spots (high values), while a low value (Gi* < 0) indicates a clustering of cold spots (low values). Non-significant points are not statistically significant.

3. Results

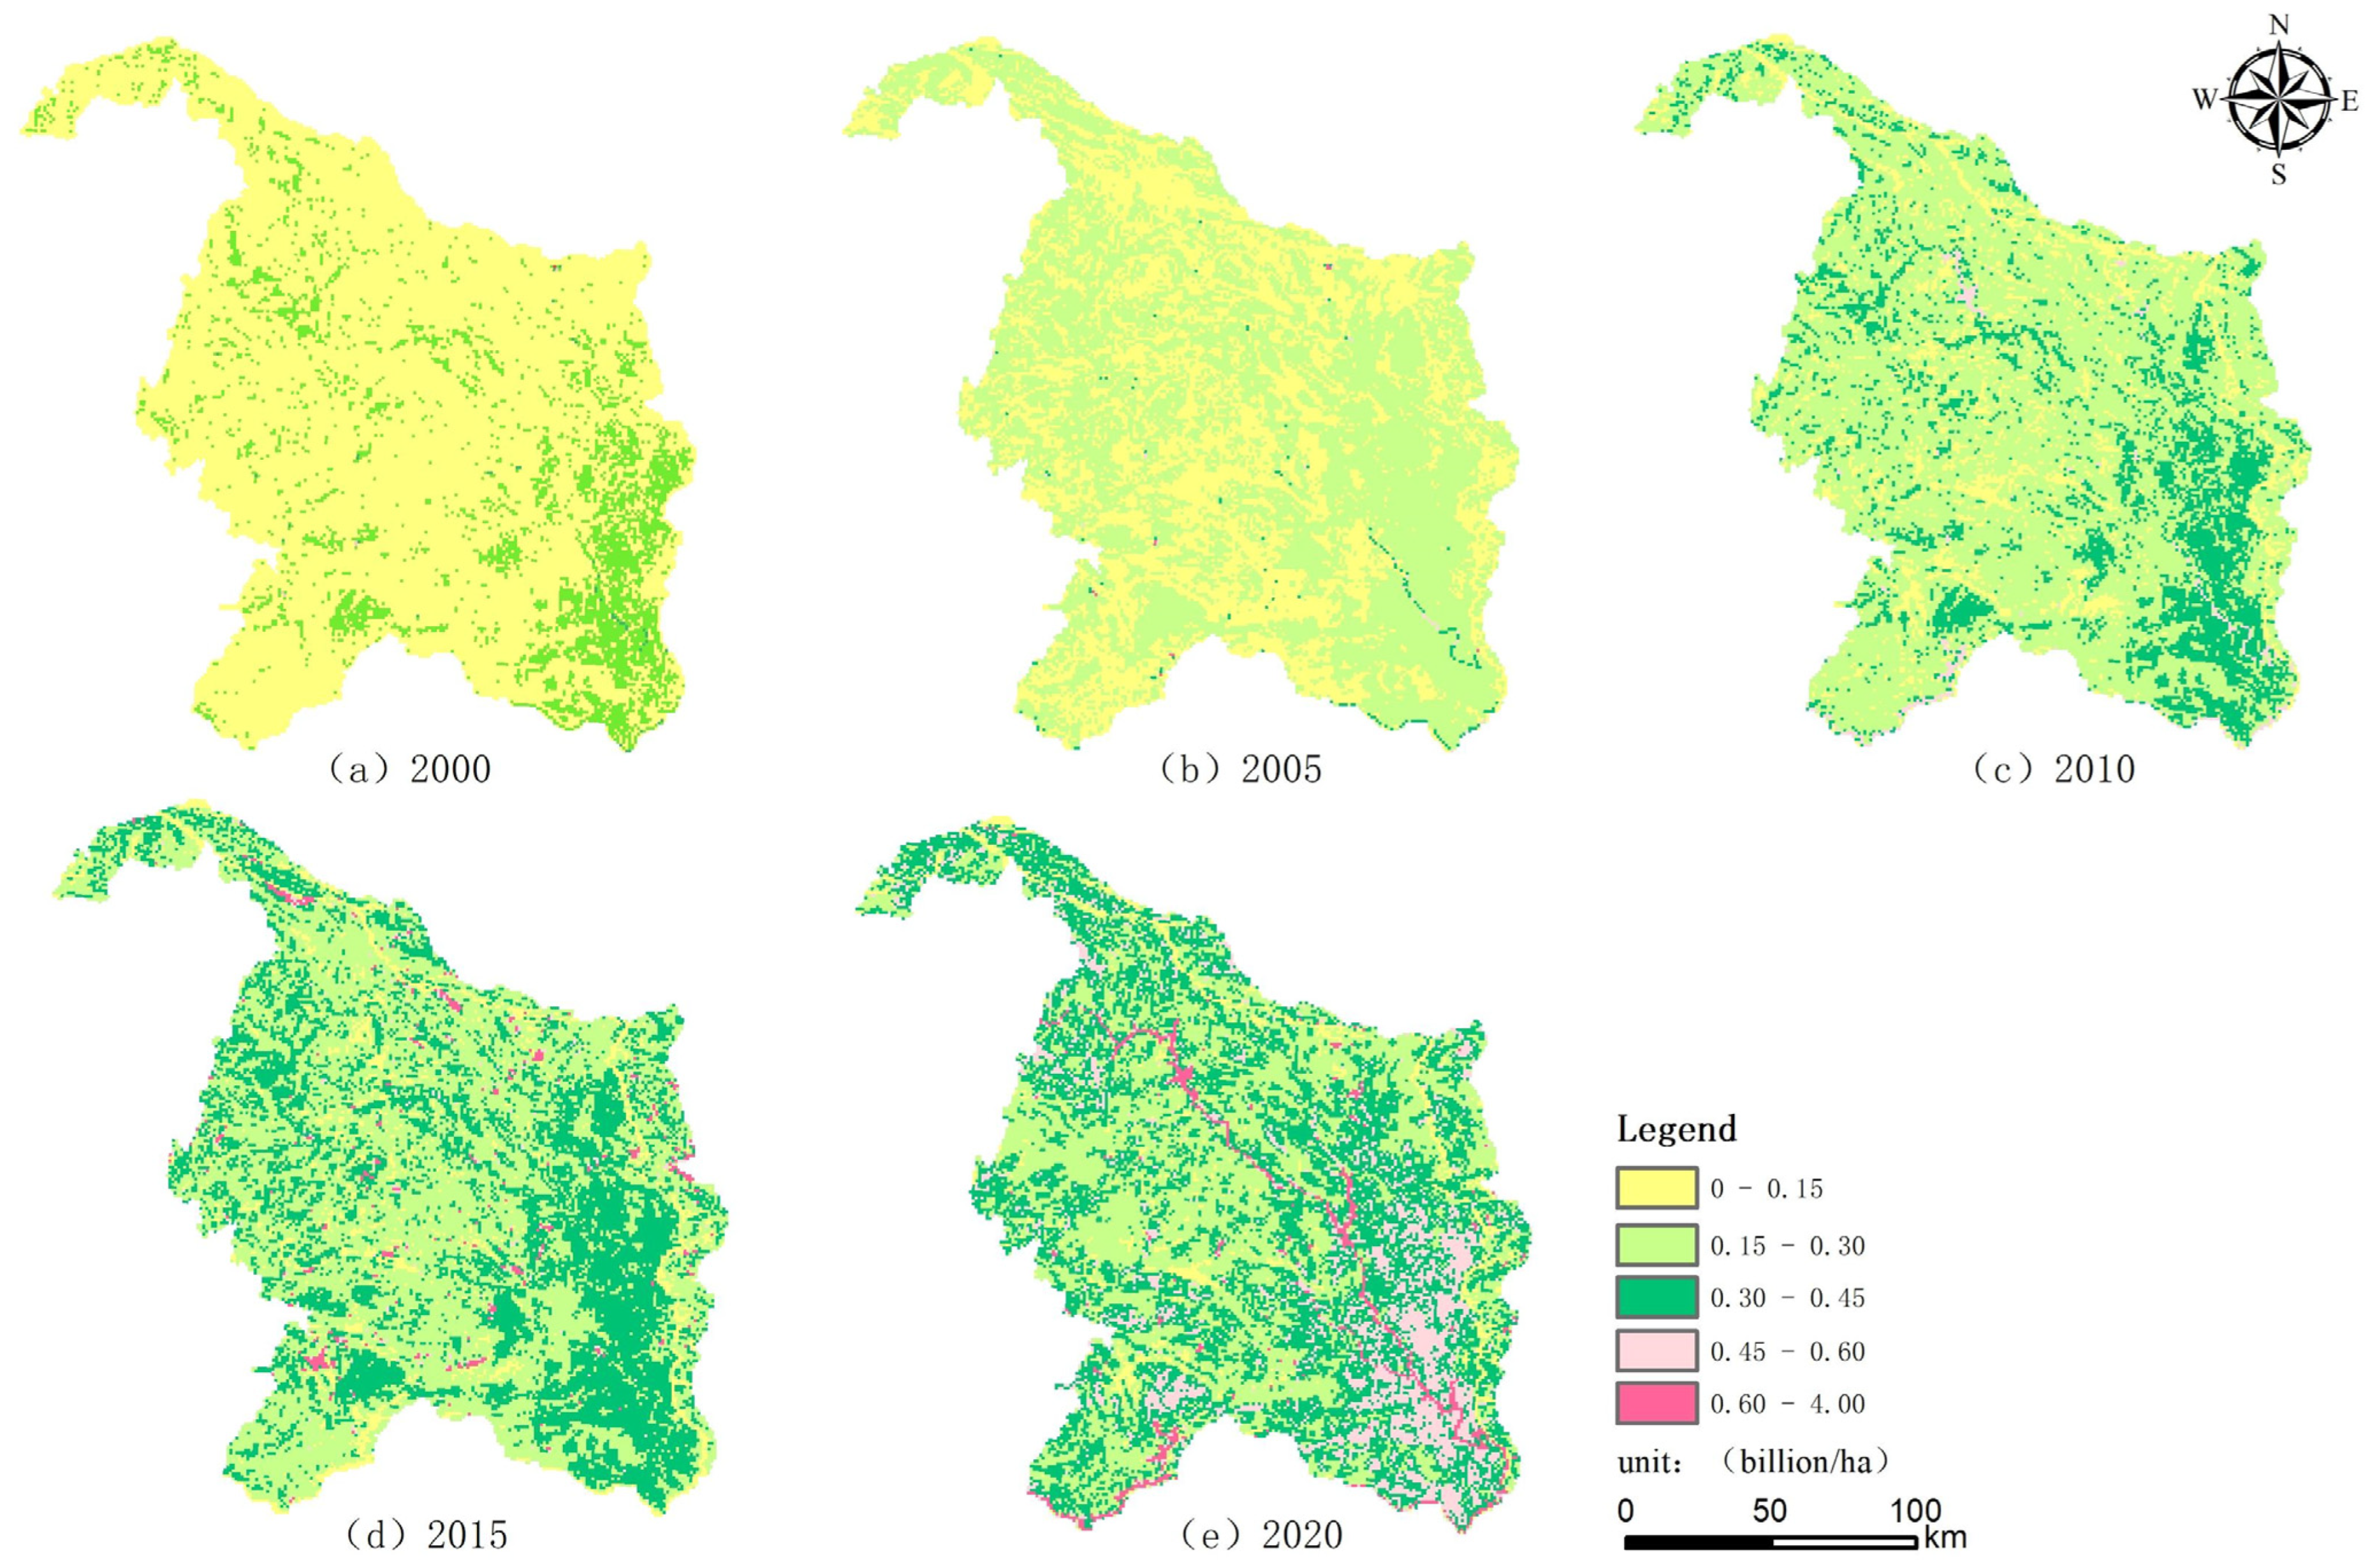
3.1. Spatial Dynamic Changes in Ecosystem Service Value in the Nanpan and Beipan River Basins from 2000 to 2020

Analyzing the data presented in Table 2 and Figure 3, it is evident that the alterations in ecosystem area within the Nanpan and Beipan River Basins between 2000 and 2020 are indicative of the efficacy of ecological conservation and management strategies. Despite experiencing minor fluctuations, the forest ecosystem maintained a general state of stability, with a slight reduction from 1343.79 103 hectares to 1241.96 103 hectares, attributable to the implementation of policies promoting the conversion of agricultural land to forested areas. A notable expansion was observed in the grassland ecosystem, which increased from 782.09 103 hectares to 867.82 103 hectares, thereby augmenting vegetation coverage and improving soil attributes. The wetland ecosystem experienced a marked expansion, growing from 5.09 103 hectares to 22.16 103 hectares, signifying the successful outcomes of conservation initiatives. Conversely, the area designated for farmland decreased, shrinking from 741.03 103 hectares to 711.37 103 hectares, as a result of the ecological transformation of marginal land. Urban areas witnessed a modest expansion, while the desert ecosystem remained largely unchanged. Collectively, these transformations have facilitated the enhancement of the basins’ ecological environment and the upliftment of ecosystem service value.
The ecosystem service value in the Nanpan and Beipan River Basins demonstrated a pronounced upward trend, influenced by concurrent changes in land use patterns and adjustments to monetary conversion rates. The period of most rapid growth occurred from 2005 to 2010, with an increment of CNY 24.01747 billion. This was followed by the interval from 2015 to 2020, which saw an increase of approximately CNY 21.96255 billion. The growth rate during the period from 2010 to 2015 was comparatively lower, with an increase of around CNY 12.37584 billion, underscoring the substantial magnitude of overall growth in ecosystem service value during the study period.
The data analysis from Table 2 indicates that the forest ecosystem is the primary contributor to the ecosystem service value (ESV) in the karst basin, comprising about 65% of the total ESV, with the grassland ecosystem contributing approximately 20%. In the karst mountainous river basin, the extensive woodlands and grasslands, marked by abundant underground rivers and karstic caverns, are vital for sustaining high biodiversity and providing essential ecological services such as carbon sequestration, hydrological regulation, and soil preservation, which significantly collectively enhance the ESV. Although farmlands and wetlands have a relatively small role in the ESV, they remain integral to the ecosystem, with agricultural lands dedicated mainly to food production and wetlands’ contribution limited by their small surface area. Land use changes, including transitions to forested areas and reforestation, have rejuvenated and expanded grasslands, thereby amplifying biodiversity and the ESV through improved conservation practices and climate regulation. However, the expansion of built-up land due to economic development has altered native ecosystems, leading to a decline in ESV. To counterbalance these negative impacts, it is imperative to prioritize the conservation of woodlands, grasslands, and wetlands to mitigate risks of soil erosion and desertification, ensuring the upkeep and enhancement of the ESV. Therefore, the regional ecosystem management strategy must focus on shifting from agricultural to forested land, protecting grasslands, and implementing sustainable forestry practices to encourage positive ecological feedback, reduce harmful effects, preserve ecosystem integrity and service value, and foster a sustainable development path that benefits both the ecosystem and community well-being.
The structure and composition of ecosystems, such as forests, grasslands, wetlands, and agricultural lands, play a pivotal role in determining the variability of regional ecosystem service values (ESV), with each ecosystem type contributing differently to ESV due to their unique attributes and spatial arrangements [35]. For example, the Amazon Rainforest’s forest ecosystem is crucial for global oxygen production and biodiversity conservation, and its carbon sequestration is vital for climate regulation, yet deforestation has led to a significant decline in ESV, impacting global climate stability and local community well-being [36,37]. Similarly, grassland degradation in sub-Saharan Africa has diminished pastoral resources, affecting the economic and food security of grazing-dependent communities [38,39]. In China’s Yangtze River Basin, wetland loss has negatively impacted biodiversity and ecotourism [40,41,42], while in India, the expansion of agricultural land has increased short-term food production at the cost of soil erosion and biodiversity loss, thus reducing ESV [43,44,45]. Recognizing and quantifying the spatial distribution of these ecosystems is essential for accurate assessment and management of regional ESV. Regional planning and ecological management must prioritize optimizing the spatial configuration of ecosystems to maximize ESV and foster sustainable development, integrating ecological, economic, and social factors to ensure the long-term viability of ecosystem services. Conservation and restoration strategies should be informed by detailed spatial analyses to enhance ESV and support ecosystem resilience in the face of environmental change.
This understanding is reflected in the spatial distribution of ESV within the study area, where the unit value of ESV exhibits a decreasing trend from southeast to northwest. The highest-value areas are predominantly located in the southeastern part of the basin. Along the Nanpan River, the terrain is characterized by gentle slopes, clear waters, and verdant orchards, occasionally punctuated by karst formations, resulting in a relatively balanced distribution of ESVs. In contrast, the Beipan River Basin, situated in the slope zone between the Yun Gui Plateau and the Qian Zhong Plateau, features a dramatic descent from source to mouth, with a total drop of 1900 m, making it the river with the greatest fall within the Pearl River system. This topography gives rise to spectacular canyons along the Beipan Riverbanks, with significant variations in elevation. Consequently, the riverbanks are predominantly occupied by forest and grassland ecosystems with higher ESVs. The ESV along the main rivers is marginally higher than in other regions, revealing pronounced spatial variations in the distribution of ESV within the basin.
Over the past few decades, with the implementation of ecological restoration projects such as the conversion of cropland to forest and grassland, and the control of rocky desertification, some of the farmland ecosystems and urban ecosystems in the southeastern part of the basin have been transformed into grassland ecosystems and forest ecosystems. Although this transformation has limited the regional economic development to some extent, on the other hand, these ecological restoration projects have enhanced the regional ESV and played a significant role in promoting the sustainable development of the basin. This is especially true in areas where karst landforms are typically developed, where historically inappropriate land use practices have led to severe rocky desertification and soil erosion. Under relevant management, the service functions of these ecosystems have been significantly improved. Alternatively, the Grand Canyon landscape in the Beipan River Basin has maintained a high level of ecosystem service value due to its unique geographical location and topographical conditions, relatively less disturbed by human activities. However, in the future, with the development of hydropower resources and the rise in tourism, this area’s ecosystem may also face new challenges. Hydropower development could alter the natural flow of rivers, affecting the health of aquatic ecosystems, while the development of tourism may bring about environmental pollution and ecological damage.
In summary, the distribution and changes in ecosystem service value in the Nanpan and Beipan River Basins are the result of the combined effects of natural geographical conditions, human activities, and climate change. In the future, how to balance economic development with ecological protection will be the key to achieving sustainable development in the river basin.

3.2. Analysis of Ecosystem Service Value (ESV) in the Study Area Under Multiple Scenarios

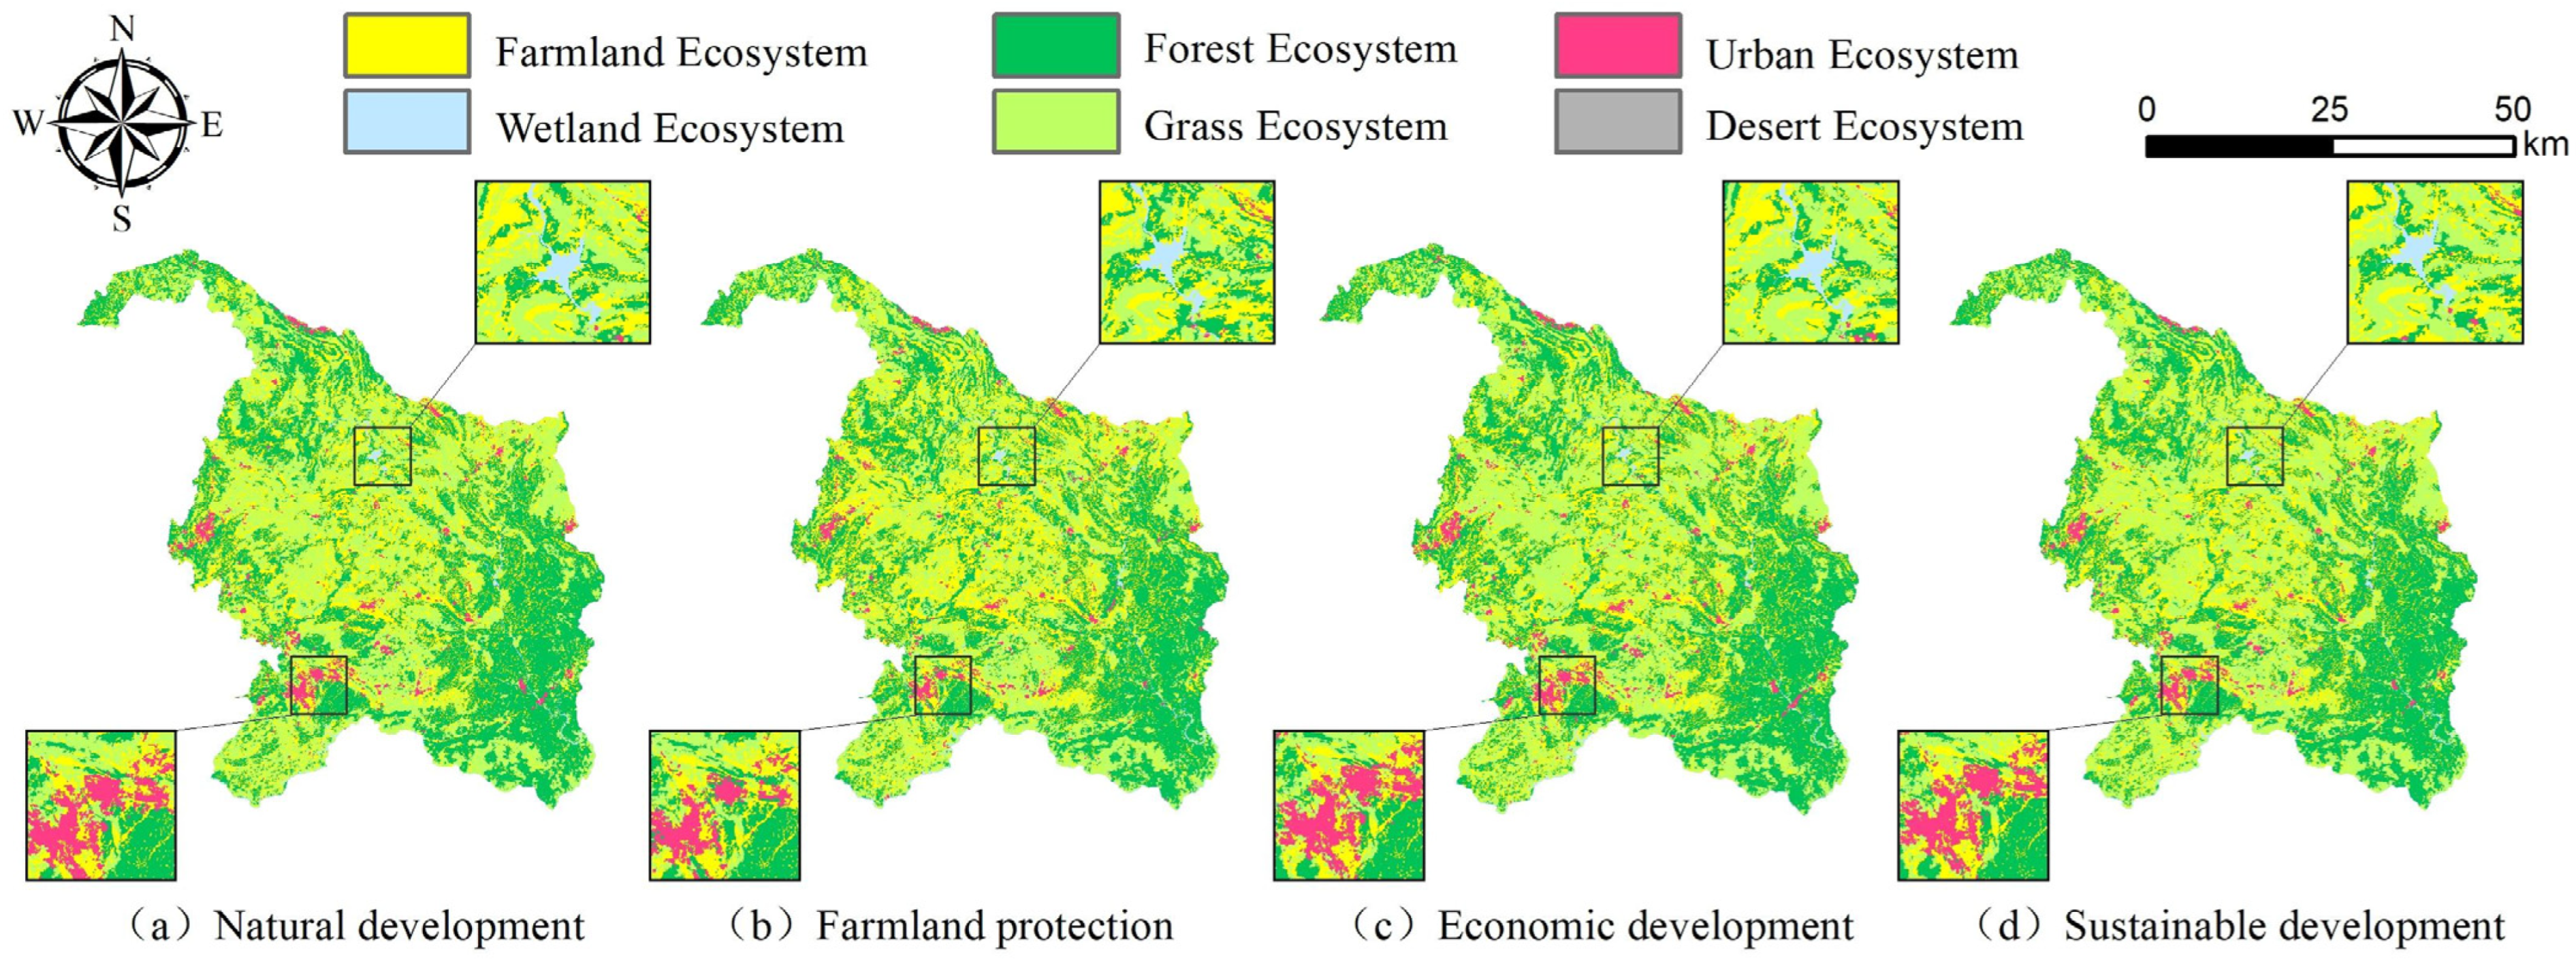
3.2.1. Spatial Changes in Ecosystems Under Multiple Scenario Simulations

To scientifically simulate the future ecosystem of karst basins and enhance the credibility of simulation prediction data, this study used land use data from 2010 as a baseline to simulate the land use conditions in the study area for 2020. The accuracy of the simulation results was verified against actual observed data using the kappa coefficient. The kappa coefficient was 0.856, and the overall accuracy of the simulation was 91.06%, indicating that the predictive results of the scenario settings have high precision and credibility. Based on this, further simulations and predictions of the ecosystem in the Nanpan and Beipan Rivers under four different scenarios for 2035 were conducted using the actual land use data from 2020.
The results show that the trends in spatial distribution changes in the ecosystem under different scenarios vary(Figure 4). In the natural development scenario, the area of the agricultural ecosystem decreases, and due to the uncontrolled expansion of the urban ecosystem, the areas of the forest and desert ecosystems also shrink. In the farmland protection scenario, the forest and desert ecosystems make the greatest contribution to land conversion, the rate of decrease in area of the agricultural ecosystem is suppressed, and the expansion trend of the urban ecosystem is controlled compared to the natural development scenario. In the economic development scenario, the expansion of the agricultural ecosystem is significantly enhanced, while the forest, agricultural, and desert ecosystems show significant shrinkage. In the sustainable development scenario, the rate of contraction of the agricultural ecosystem and the rate of expansion of the urban ecosystem both decrease and the forest and desert ecosystems maintain a high level. Among the four predefined scenarios, the expansion of the agricultural ecosystem is most significant under the farmland protection scenario, the expansion of the urban ecosystem is pronounced under the economic development scenario, and the outflow of the overall forest and desert ecosystems is most prominent. In the sustainable development scenario, the expansion of the agricultural and urban ecosystems has been balanced to some extent.

3.2.2. Change Differences in Ecosystem Service Values Under Four Scenarios

Based on Table 3, under the simulation of four different development scenarios, the forest ecosystem contributes the most to the value of ecosystem services (ESV) within the study area, reaching more than 54%.
Combining Table 1 and Table 4, the main reason is that the forest ecosystem has a relatively high proportion of area under different scenarios, and the forest ecosystem contributes significantly to regulating services. The urban ecosystem and desert ecosystem have very low ESV under different scenario simulations. By referring to Table 1 and Table 4, it can be understood that the main reason is the low equivalent value of ecosystem services for urban ecosystems, while for desert ecosystems, in addition to the low equivalent value of ecosystem services, the area constitutes the lowest proportion under all scenario simulations. Moreover, under the combined effects of factors such as the passage of time and economic development, by 2035, the area of the desert ecosystem within the study area shows a high-rate shrinkage under the four simulated scenarios.
In the context of analyzing the land types across four distinct development scenarios, the application of the Kruskal–Wallis test, followed by Tukey’s honestly significant difference (HSD) post hoc analysis, has indicated substantial variations in the ecosystem service values (ESV) among the scenarios, particularly for cultivated land and grassland. Notably, the scenario focused on cultivated land protection stands out, with significant discrepancies in ESV when contrasted with the remaining three scenarios, specifically in relation to cultivated land, forest land, and grassland(Figure 5). This underscores the profound influence of policies aimed at protecting cultivated land on ESVs. Furthermore, the ESV associated with forest land and water bodies also displays considerable differences across the various scenarios. It is important to note that the built-up land category was not amenable to statistical testing due to a uniform absence of values. Meanwhile, the differences in ESV for unused land were only marginally significant.
Under the farmland protection scenario, the total ESV of the study area is the lowest, with a specific value of CNY 1049.72 billion. The study area is a typical karst basin, and its geographical characteristics determine the vulnerability of cultivated land resources. Over-reclamation and excessive protection of farmland will lead to intensified soil erosion, which not only causes damage to natural ecosystems such as forest and grassland ecosystems but also, in turn, affects the ecological balance of the karst mountainous basin. This could further exacerbate phenomena such as soil erosion and rocky desertification within the basin. Therefore, focusing solely on farmland protection while neglecting the maintenance of other ecosystems like forests and grasslands may lead to irreparable ecological damage to the karst mountainous basin.
Additionally, under the economic development scenario, the total ESV of the study area is CNY 1065.03 billion, which is relatively higher than that under the farmland protection scenario. The transformation of ecosystems in the economic development scenario, particularly during the process of urbanization, may lead to a decrease in ESV. However, in future developments, measures such as improving land use efficiency and increasing urban green spaces may partially compensate for the loss of ecosystem service values. New ecosystem services, such as the recreational and cultural services of urban green spaces, as well as ecological compensation and restoration measures, help mitigate the negative impact of land use changes on ESV. Although the total ESV under the economic development scenario is higher than that under the farmland protection scenario, this does not guarantee long-term ecological sustainability, especially in ecologically fragile karst mountainous basins. The risk of long-term ecological damage must be prevented through sustainable land management and planning. Therefore, the economic development scenario should consider the long-term health of ecosystems and the sustainability of regional development to ensure this balance is maintained over the long term and effectively alleviate pressure on ecosystems. This is a key focus for future research and monitoring. For special regions like karst mountainous basins, development strategies must fully consider ecological vulnerability to avoid causing irreversible ecological damage.
In the simulation predictions for 2035, the total ESV of the study area reached the highest level under the natural development and sustainable development scenarios. In a state of natural development, influenced by various factors such as global climate change, including increased temperatures, atmospheric precipitation, and rising sea levels, the area of water bodies has relatively increased. As indicated by the data in Table 1, the equivalent value of ecosystem services for water bodies is the highest, so without human interference, the total ESV of the study area under the natural development scenario reached the highest value at CNY 1067.86 billion.
Under different scenarios, the sustainable development model provides a comprehensive and balanced perspective, taking into account the complex relationship between economic growth and ecological conservation. Within this framework, forest and grassland ecosystems occupy a significant portion of the landscape, with a well-distributed array of ecosystem types. In the study area, the ESV under the sustainable development scenario is similar to that of the natural development scenario, totaling approximately CNY 106.713 billion. However, achieving this goal would require addressing multiple challenges, including the coordination of stakeholders, the long-term commitment of policymakers, and the response to resistance from social development and environmental changes. Essentially, although the sustainable development scenario proposes a balanced approach from both ecological and economic perspectives, its implementation necessitates complex political strategies and active advocacy to effectively navigate the anticipated obstacles.
The above results indicate that by implementing sustainable development strategies, it is possible to achieve a win–win situation between economic development and ecological protection without sacrificing the value of ecosystem services. The importance of the sustainable development scenario lies in its emphasis on the harmonious coexistence between human activities and the natural environment, rather than simple natural development or unbridled economic development. Through the reasonable planning of land use, protection of key ecosystems, and implementation of green infrastructure measures, the sustainable development scenario can provide long-term ecological and economic well-being for the study area and beyond. Therefore, promoting sustainable development is not only a necessary means to protect the value of ecosystem services but also a key pathway to achieve the sustainability of society, economy, and environment.

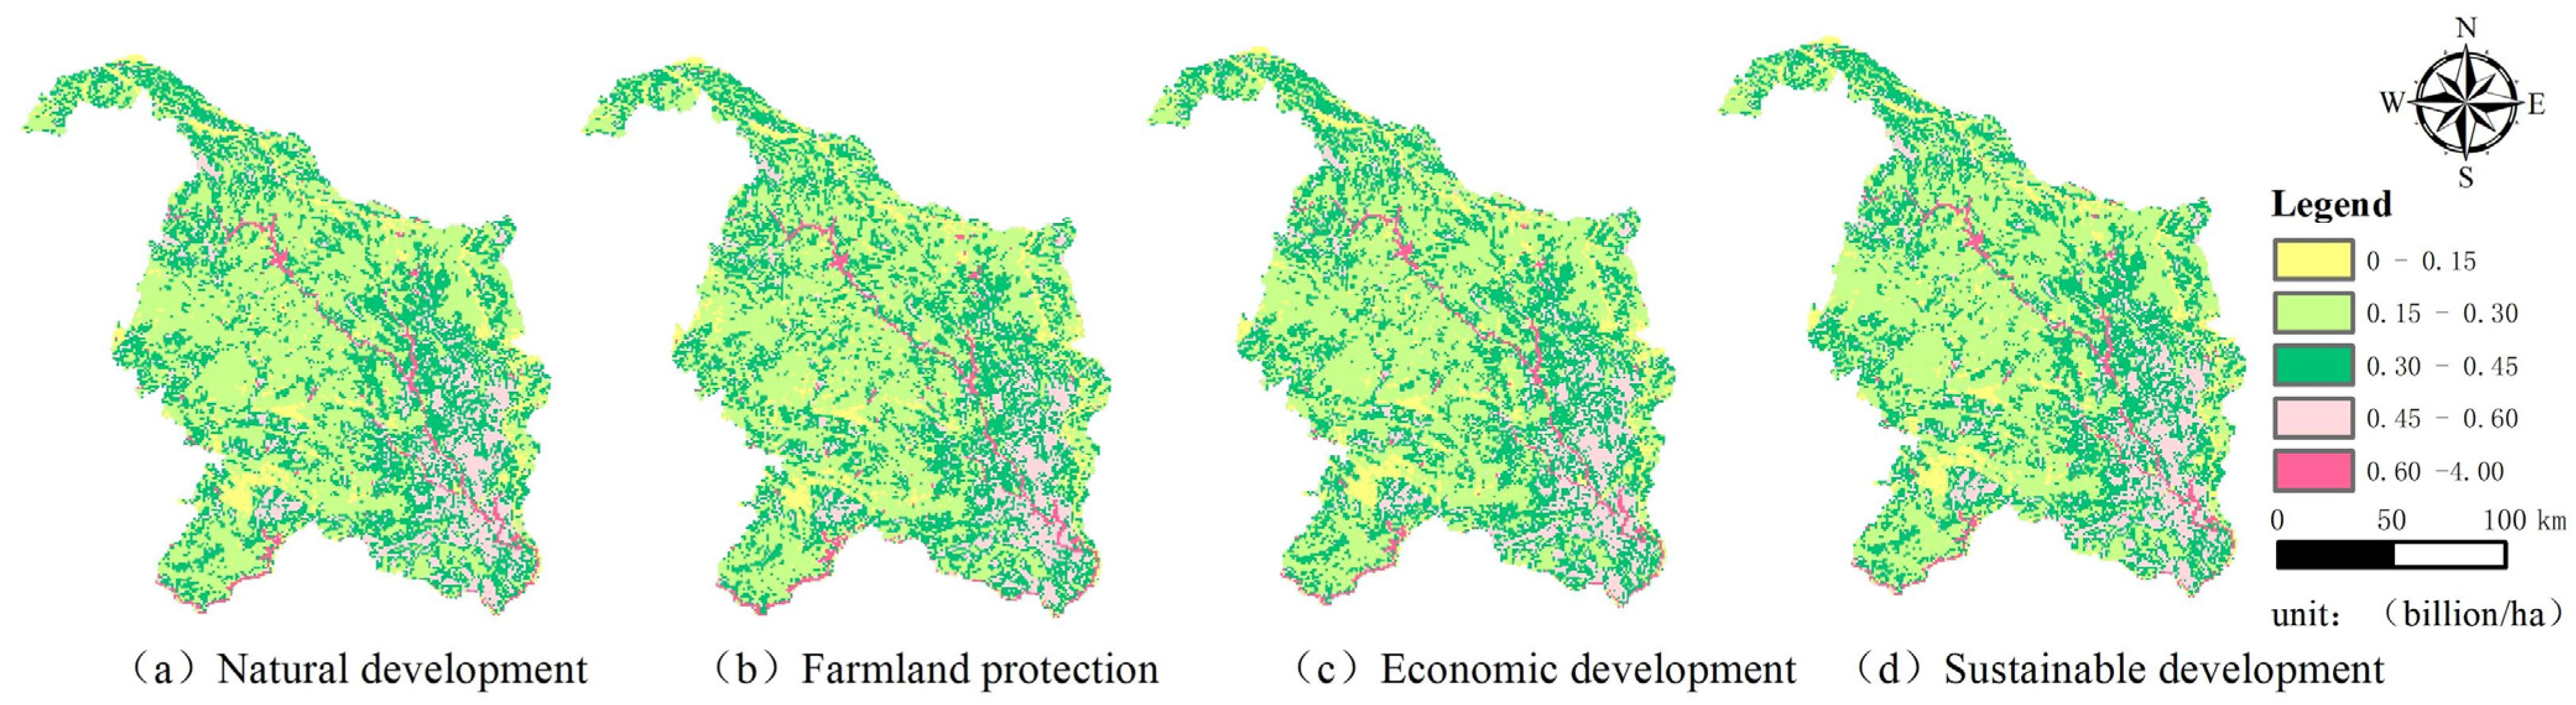
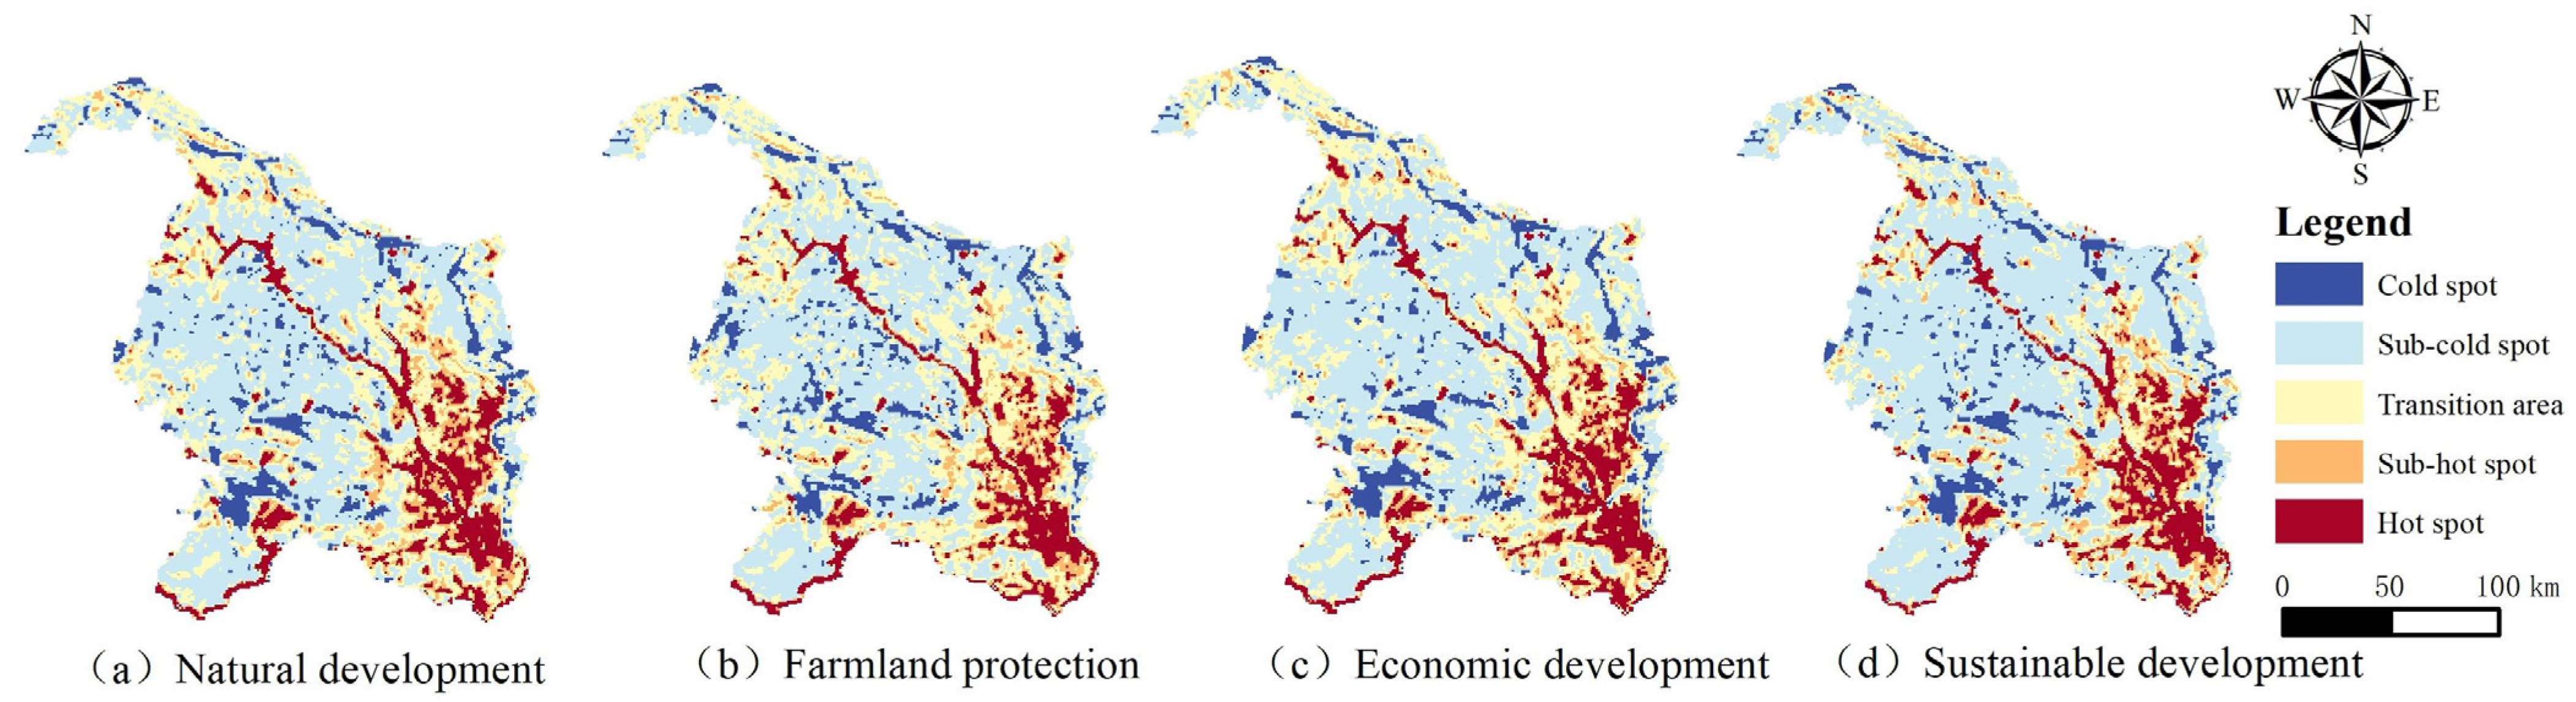
3.2.3. Spatial Clustering Analysis of Ecosystem Service Values in Different Scenarios

This study employs the hot spot analysis model to conduct a detailed spatial analysis of the ecosystem service value (ESV) in the Nanpan and Beipan River Basins under different scenario simulations for the year 2035. Drawing on methods in the existing literature, this study categorizes the spatial clustering degree of ESV into five levels using the natural breakpoint method [46], which are the cold spot area, sub-cold spot area, transition area, sub-hot spot area, and hot spot area, to reveal the spatial distribution characteristics and clustering patterns of ESV.
As shown in Figure 6 and Table 5, in the multi-scenario simulation analysis for 2035, the hot spot distribution of ESV shows significant similarity, mainly distributed in the southeastern part of the basin and along the banks of major rivers. These hot spot areas typically encompass ecosystems such as forests, grasslands, and wetlands with high ecosystem service value equivalents, which play an important role in maintaining and enhancing ecosystem service values. Conversely, areas with dense urban ecosystems generally appear as cold spot clusters for ESV, further confirming the close relationship between land use change and ESV.
In the Nanpan and Beipan River Basins, typical karst basins, their unique geological structure and geomorphological features have a significant impact on the spatial distribution of ecosystem service value (ESV). Cold and transition areas are widely distributed in the study area, while sub-hot spots and hot spots show a more concentrated distribution pattern. The spatial distribution characteristics of these areas reflect both the geographical environment’s extensiveness and the clustering of ESVs. Notably, the areas along the banks of the Nanpan and Beipan rivers have higher hot spots of ESVs. This result not only highlights the key role of wetland ecosystems in maintaining the ecological balance of karst mountainous river basins, but also indirectly reflects the importance of protecting ecosystems on both sides of the river. As is typical of karst basins, the wetland ecosystems in the Nanpan and Beipan rivers are irreplaceable in terms of soil and water conservation, climate regulation, biodiversity maintenance, and the provision of other key ecosystem services. Therefore, protecting the ecosystems on both sides of the river is very important for maintaining the ecological security of the entire basin.
At the same time, parts of the urban ecosystem show lower ESVs, revealing that in the process of urbanization, with the expansion of built-up land, there is a risk of potential degradation of ecological services. This risk is particularly prominent in karst mountainous river basins because the ecosystems in this area are inherently fragile and susceptible to external disturbances. Therefore, to ensure the sustainable development of the Nanpan and Beipan River Basins, it is necessary to strengthen the protection of ecosystems on both sides of the river, avoid excessive development and inappropriate changes in land use, and ensure the health and stability of the ecosystems within the basin.

4. Discussion

4.1. Factors Affecting the Spatiotemporal Distribution of ESVs

In the karst mountainous basin, the fluctuation in ecosystem service value (ESV) is significantly influenced by changes in land use patterns and adjustments in monetary conversion rates. This study analyzes the dynamic spatiotemporal distribution pattern of ESV in the Nanpan and Beipan River Basins from 2000 to 2020 and finds that the growth rate of ESV reached its peak between 2005 and 2010. During this period, changes in the spatial pattern of ecosystems, particularly the increase in the proportion of forest and grassland ecosystems, played a key role in the growth of ESV. The study reveals that among various ecosystems, the forest ecosystem contributes the most to ESV. The ecological environment functions and biodiversity of the forest ecosystem are vital in providing ecosystem services such as water source protection, carbon storage, and oxygen production [47,48,49]. Furthermore, this paper analyzes the spatial distribution pattern of ESV in the study area from 2000 to 2020 and under multiple scenario simulations. The results show that high-value areas of ESV are mainly distributed in forest, grassland, and wetland ecosystems, while low-value areas are mostly found in urban ecosystems. This finding aligns with the research results of scholars such as Wang Dan [50], Hu Yuxue [51], and SUN Ding-zhao [52], further confirming that the distribution pattern of ecosystems in karst regions profoundly affects the ESV. Additionally, the monetary conversion rates vary from year to year due to adjustments in market supply and demand relationships, economic growth rates, and other factors, directly impacting the price of ESV. Therefore, the distribution pattern of land use and the monetary conversion rate are direct factors affecting the ESV.
In comparison with those related existing studies, our findings could be clearly explicating the dynamic changes in ESV and its key driving force in the typical karst river basin. For instance, a study by Brander et al. in Ecosystem Services emphasized the global significance of ecosystem services and their valuation, underscoring that karst ecosystems are vulnerable and their services are highly valuable [53]. Similarly, Costanza et al. provided a comprehensive assessment of global ecosystem services and their economic value, ref. [2], which supports the idea that the monetary value of ESV can vary significantly due to ecological and geographical differences.
The variability in monetary conversion rates, as observed in our study, is a well-documented phenomenon in the international literature. Berghöfer et al. [54], in “TEEB Manual for Cities: Ecosystem Services in Urban Management”, discussed how economic factors, such as market supply and demand relationships and economic growth rates, influence the valuation of ecosystem services. This aligns with our observation that changes in the monetary conversion rate directly impact the price of ESV. Moreover, the distribution pattern of land use, as identified in our study, echoes the findings of another study by Hasan S et al. [55], in Environmental Development, highlighted the importance of land use changes in determining ecosystem service provision and, consequently, ESV. In conclusion, while our study confirms the findings of domestic scholars, it also aligns with international research, demonstrating the global relevance of the factors influencing ESV. The comparison with foreign studies not only validates our results, but also underscores the importance of considering both ecological and economic factors when assessing ESV, particularly in karst regions.
Policy guidance and economic development indirectly reshape the spatial pattern of ecosystems in the karst mountainous basin, thereby affecting the spatiotemporal distribution change in ESV. In the Nanpan and Beipan River Basins, policies such as returning farmland to forest and ecological compensation have changed the land use patterns [56,57,58], and significantly impact on the distribution of ESV. Economic development often determines the level and spatial distribution of ESV through its influence on land supply and demand relationships, value changes, and interactions with monetary conversion rates. In this study, by simulating the ecosystem distribution patterns under different policy and economic development scenarios, we further analyzed the impact of policy and economic factors on ESV. The results indicate that ESV varies under different scenarios. In the farmland protection scenario, the total ESV is the lowest, while in the economic development scenario, the total ESV increases. In contrast, the sustainable development scenario considers the balance between economic development and ecological protection by maintaining forest and grassland ecosystems and balancing different ecosystem types. Under this scenario, the total ESV is higher than in the farmland protection and economic development scenarios. In summary, the combined effect of policy guidance and economic development often acts directly on the ecosystem distribution pattern, indirectly exerting a profound impact on ESV in the karst mountainous basin.
Therefore, adopting a comprehensive land use strategy to coordinate the relationship between economic growth and ecological protection is an important means to maximize regional ESV. In land use planning and future management practices, it is necessary to deeply consider the rational planning and layout of land use to achieve the dual goals of sustainable development and ecological protection. Additionally, for the analysis of the spatiotemporal pattern of ESV in karst mountainous basins, it is recommended to further introduce other potential influencing factors and quantify their specific impacts. This will help to provide a more precise and scientific indicator system and influencing factors for the assessment of ESV and the construction of ecological civilization in karst mountainous basins. In future research, it is suggested to conduct a more in-depth calculation of the ecosystem service value of small ecological units such as karst caves and underground rivers, to achieve a more accurate analysis and assessment of the ecosystem service value of karst basins.

4.2. Outlook for Territorial Spatial Planning in Karst Mountainous River Basins

Based on the simulated results of ecosystem dynamic changes and the calculated results of ESVs under different scenarios in the Nanpan and Beipan River Basins, a typical karst basin of Guizhou province, the following prospects are proposed for the optimization of the future land spatial pattern planning in the typical karst mountainous basins:
(1) In ecologically sensitive areas of karst mountainous basins, water resources are important constraints on their sustainable development. More attention must be paid to the ecological restoration and governance of the basin, strengthening the regulation of human-induced soil erosion, and utilizing the integrated remote sensing supervision for comprehensive dynamic monitoring and evaluation of regional water resources. The pressure of cultivated land irrigation on surface water and groundwater resources in karst mountainous basins should be considered, as well as the negative effects of steep slope cultivated land and over-farming on soil erosion. Optimize the distribution pattern of cultivated land according to the actual conditions of the basin to realize the development concept that “clear waters and green mountains are as valuable as gold and silver.”
(2) Forests and grasslands are important cornerstones for maintaining the ecological security of karst mountainous basins and building ecological barriers. Through the implementation of projects such as slope cultivated land management, desertification control, returning farmland to forest, and mine restoration, as well as comprehensive ecological governance and restoration measures, the grassland and forest ecosystems have been effectively restored. For the ecological restoration of karst mountainous basins, efforts should continue to enhance the ecosystem service capacity of riverbanks and surrounding mountains, increase the ecosystem service value (ESV) of forests and grasslands, and adhere to the ecological development concept of sustainable development.
(3) In karst mountainous basins, desertification covers a wide area, the surface soil layer is thin, and some areas have prominent rock peak forests and clusters, making the ecological environment extremely fragile. Through the implementation of projects such as returning farmland to forest and grassland, comprehensive management of desertification on both sides of rivers, and the vigorous promotion of the eco-economy and the under-forest economy, the area of oases has significantly increased. However, the prevention of soil erosion and the control of desertification remain the key and difficult points in the construction of ecological barriers in karst mountainous basins. Continuous efforts should be made to establish ecological restoration areas along the riverbanks and desertification areas, strengthen the protection of the nativeness and integrity of vegetation, and reduce the interference of human activities on the ecological environment.
(4) Against the backdrop of rapid economic development, the demand for built-up land is showing a trend of sharp expansion, but there is still room for improvement in its utilization efficiency. To reasonably regulate the scale of urban and rural built-up land and prevent its uncontrolled expansion from encroaching on ecological land, such as forests and grasslands, urban development boundaries and village construction boundaries should be clearly delineated. This strategy aims to curb the uncontrolled growth of built-up land. At the same time, efforts should be made to optimize the layout of “blue-green infrastructure,” guide the integration of green spaces with urban spaces, build an interwoven urban ecological network system, and promote the harmonious coexistence of humanity and nature.

5. Conclusions

In the context of increasing importance of the ecological environment in development, this paper deeply explores the long-term changes in ecosystem service value (ESV) from 2000 to 2020 in the Nanpan and Beipan River Basins, typical karst mountainous basins. By improving the PLUS, a clear analysis of land use patterns and the spatial distribution of ESV under different scenarios for the year 2035 was conducted. The aim was to reveal the balance path between rapid economic development and ecological protection in karst mountainous basins and to provide scientific evidence and decision-making references for territorial spatial planning and ecological protection in similar areas of China. The main conclusions are as follows:
(1) From 2000 to 2020, the Nanpan and Beipan River Basins, as typical karst mountainous basins, have seen significant improvements in the ecosystem under the guidance of economic development and policies, with a noticeable increase in ESV. ESV showed the fastest growth, with an increase of CNY 24.017 billion, from 2005 to 2010. Forest and grassland ecosystems were the main contributors to ESV, while farmland and wetland ecosystems contributed less. The spatial distribution of ESV showed a decreasing trend from southeast to northwest, with high-value areas concentrated in the southeast, especially in the forest and grassland along the riverbanks. This distribution characteristic reveals the correlation between geographical location, topographical conditions, and ESV, as well as the impact of land use types on ecosystem service value.
(2) The ESV of the Nanpan and Beipan River Basins shows that the forest ecosystem will remain the highest contributor to ESV in the future. Among the four scenario settings, the total ESV under the cropland protection scenario is the lowest at CNY 104.972 billion, reflecting that excessive cropland protection may exacerbate soil erosion and ecological damage. The ESV under the economic development scenario has increased, but attention should still be paid to long-term ecological sustainability. The sustainable development scenario achieves a win–win situation for the economy and ecology through reasonable land use planning and the protection of key ecosystems. This indicates that promoting sustainable development is a key pathway to protect ESV and achieve long-term well-being for the region.
(3) This study employed the hot spot analysis model to conduct a spatial analysis of the ESV under different scenarios in the Nanpan and Beipan River Basins for the year 2035, categorizing it into five levels of aggregation to reveal its spatial distribution characteristics. The results indicate that ESV hot spots are primarily distributed in the southeastern part of the basins and along the riverbanks, associated with high-value ecosystems such as forests, grasslands, and wetlands, while the urban ecosystem is identified as an ESV cold spot. The karst topography significantly influences the distribution of ESV, and the hot spots along the riverbanks highlight the crucial role of river ecosystems in maintaining ecological balance. The low ESV resulting from the expansion of the urban ecosystem signifies the risk of ecological service degradation during the process of urbanization. Based on these findings, the following recommendations are proposed to ensure the ecological security and sustainable development of the basins: (1) implement strict land use planning and zoning regulations to protect the high-value ecosystems along the riverbanks and in the southeastern part of the basins. (2) Develop and enforce policies that promote the conservation and restoration of forest, grassland, and wetland ecosystems to maintain their essential ecological services. (3) Integrate ecological considerations into urban planning to mitigate the negative impacts of urban expansion on ecosystem services and to promote sustainable urban development. These measures aim to ensure the effective protection of riverbank ecosystems, thereby safeguarding the ecological security and long-term sustainable development of the basins.
This study conducted a long-term analysis and assessment of the ESVs in the Nanpan and Beipan River Basins, typical karst mountainous areas in the Guizhou Province. The PLUS was improved to successfully simulate the ecosystem dynamic changes under different scenarios for both the past and the future. However, due to the feasibility of data acquisition and the inherent limitations of the model, the ESVs at different scales still require further research. Furthermore, owing to the limitations of the model itself, the simulation results may differ from actual future conditions. Future research should further expand in the following areas: firstly, assessing the ESVs of karst mountainous basins at different spatial scales to provide a more comprehensive understanding. Secondly, optimizing the model to enhance its accuracy. Additionally, considering the unique topography of karst mountainous basins, future research should explore the impact of different topographic conditions on the ESVs and conduct better integrated assessments.

Author Contributions

Conceptualization, A.L. and S.L.; methodology, A.L. and Z.F.; validation, A.L. and Z.F.; formal analysis, S.L. and A.L; investigation, S.L. and A.L.; resources, K.X., S.L. and B.F.; data curation, K.X., S.L. and B.F.; writing—original draft preparation, S.L.; writing—review and editing, A.L., Z.F. and S.L.; visualization, A.L. and Z.F.; supervision, A.L., Z.F. and S.L; project administration, A.L., Z.F. and S.L.; funding acquisition, A.L., Z.F. and S.L. All authors have read and agreed to the published version of the manuscript.

Funding

This research was funded by the National Natural Science Foundation of China (42293271 and 41971358), and the Innovation Project of State Key Laboratory of Resources and Environmental Information System (KPI005).

Data Availability Statement

The land use data were sourced from http://www.resdc.cn (accessed on 1 November 2024). The DEM data were sourced from http://www.gscloud.cn/ (accessed on 1 November 2024), meteorological data from https://www.webmap.cn/ (accessed on 1 November 2024). Other socio-economic data were derived from the “Guizhou Province Statistical Yearbook” and the “National Compilation of Cost and Benefit Data for Agricultural Products”. All relevant data generated during the study are available from the corresponding author upon reasonable request.

Conflicts of Interest

The authors declare no conflicts of interest.

References

  1. Chaikaew, P.; Hodges, A.W.; Grunwald, S. Estimating the value of ecosystem services in a mixed-use watershed: A choice experiment approach. Ecosyst. Serv. 2017, 23, 228–237. [Google Scholar] [CrossRef]
  2. Costanza, R.; d’Arge, R.; de Groot, R.; Farber, S.; Grasso, M.; Hannon, B.; Limburg, K.; Naeem, S.; O’Neill, R.V.; Paruelo, J.; et al. The value of the world’s ecosystem services and natural capital. Nature 1997, 387, 253–260. [Google Scholar] [CrossRef]
  3. Xie, G.; Zhang, C.; Zhang, L.; Chen, W.; Li, S. Improvement of the Evaluation Method for Ecosystem Service Value Based on Per Unit Area. J. Nat. Resour. 2015, 30, 1243–1254. [Google Scholar]
  4. Wang, J.; Yan, S.; Guo, Y.; Li, J.; Sun, G. The effects of land consolidation on the ecological connectivity based on ecosystem service value: A case study of Da’an land consolidation project in Jilin province. J. Geogr. Sci. 2015, 25, 603–616. [Google Scholar] [CrossRef]
  5. Pan, S.; Liang, J.; Chen, W.; Li, J.; Liu, Z. Gray Forecast of Ecosystem Services Value and Its Driving Forces in Karst Areas of China: A Case Study in Guizhou Province, China. Int. J. Environ. Res. Public Health 2021, 18, 12404. [Google Scholar] [CrossRef]
  6. Hu, Z.; Wang, S.; Bai, X.; Luo, G.; Li, Q.; Wu, L.; Yang, Y.; Tian, S.; Li, C.; Deng, Y. Changes in ecosystem service values in karst areas of China. Agric. Ecosyst. Environ. 2020, 301, 107026. [Google Scholar] [CrossRef]
  7. Han, H.; Su, Z. Research progress and prospects of karst ecosystem services. Carsologica Sin. 2017, 36, 352–358. [Google Scholar] [CrossRef]
  8. Zhang, M.; Wang, K.; Liu, H.; Chen, H.; Zhang, C.; Yue, Y. Spatio-temporal variation of karst ecosystem service value and its correlation with ambient environmental factor. Chin. J. Eco-Agric. 2010, 18, 189–197. [Google Scholar] [CrossRef]
  9. Li, S.-L.; Liu, C.-Q.; Chen, J.-A.; Wang, S.-J. Karst ecosystem and environment: Characteristics, evolution processes, and sustainable development. Agric. Ecosyst. Environ. 2021, 306, 107173. [Google Scholar] [CrossRef]
  10. Liu, W.; Zhan, J.; Zhao, F.; Yan, H.; Zhang, F.; Wei, X. Impacts of urbanization-induced land-use changes on ecosystem services: A case study of the Pearl River Delta Metropolitan Region, China. Ecol. Indic. 2019, 98, 228–238. [Google Scholar] [CrossRef]
  11. Zhang, F.; Yushanjiang, A.; Jing, Y. Assessing and predicting changes of the ecosystem service values based on land use/cover change in Ebinur Lake Wetland National Nature Reserve, Xinjiang, China. Sci. Total Environ. 2019, 656, 1133–1144. [Google Scholar] [CrossRef] [PubMed]
  12. He, S.; Wang, J.; Li, J.; Sha, J.; Zhou, J.; Jiao, Y. Quantification and Simulation of the Ecosystem Service Value of Karst Region in Southwest China. Land 2024, 13, 812. [Google Scholar] [CrossRef]
  13. Jiang, H.; Lin, J.; Liu, B.; Yue, H.; Lin, J.; Shui, W.; Gao, M.; Chen, Y. Discovering the Ecosystem Service Value Growth Characteristics of a Subtropical Soil Erosion Area Using a Remote-Sensing-Driven Mountainous Equivalent Factor Method. Remote Sens. 2024, 16, 3700. [Google Scholar] [CrossRef]
  14. Li, Y.; Cai, Y.; Fu, Q.; Zhang, X.; Wan, H.; Yang, Z. Dynamics of Land Use/Land Cover Considering Ecosystem Services for a Dense-Population Watershed Based on a Hybrid Dual-Subject Agent and Cellular Automaton Modeling Approach. Engineering 2024, 37, 182–195. [Google Scholar] [CrossRef]
  15. Pal, A.; Tiwari, A.; Dutta, S.; Rawal, A.; Kanchan, R. Dynamicity of Ecosystem Service Value Driven by Land Use/Land Cover Alteration in Vadodara City, India. Discov. Cities 2024, 1, 22. [Google Scholar] [CrossRef]
  16. Zhang, Q.; Yi, C.; Destouni, G.; Wohlfahrt, G.; Kuzyakov, Y.; Li, R.; Kutter, E.; Chen, D.; Rietkerk, M.; Manzoni, S.; et al. Water limitation regulates positive feedback of increased ecosystem respiration. Nat. Ecol. Evol. 2024, 8, 1870–1876. [Google Scholar] [CrossRef]
  17. Huang, A.; Xu, Y.; Sun, P.; Zhou, G.; Liu, C.; Lu, L.; Xiang, Y.; Wang, H. Land use/land cover changes and its impact on ecosystem services in ecologically fragile zone: A case study of Zhangjiakou City, Hebei Province, China. Ecol. Indic. 2019, 104, 604–614. [Google Scholar] [CrossRef]
  18. Wu, H.; Yang, Y.; Li, W. Spatial optimization of land use and carbon storage prediction in urban agglomerations under climate change: Different scenarios and multiscale perspectives of CMIP6. Sustain. Cities Soc. 2024, 116, 105920. [Google Scholar] [CrossRef]
  19. Jiang, C.; Chen, H. Multi-Scenario Simulation of Urban–Rural Land Use Spatial Reconstruction in Highly Urbanized Areas: A Case Study from the Southern Jiangsu Region. Land 2024, 13, 2199. [Google Scholar] [CrossRef]
  20. Liu, X.; Liang, X.; Li, X.; Xu, X.; Ou, J.; Chen, Y.; Li, S.; Wang, S.; Pei, F. A future land use simulation model (FLUS) for simulating multiple land use scenarios by coupling human and natural effects. Landsc. Urban Plan. 2017, 168, 94–116. [Google Scholar] [CrossRef]
  21. Liu, J.; Liu, B.; Wu, L.; Miao, H.; Liu, J.; Jiang, K.; Ding, H.; Gao, W.; Liu, T. Prediction of land use for the next 30 years using the PLUS model’s multi-scenario simulation in Guizhou Province, China. Sci. Rep. 2024, 14, 13143. [Google Scholar] [CrossRef] [PubMed]
  22. Gomes, E.; Abrantes, P.; Banos, A.; Rocha, J. Modelling future land use scenarios based on farmers’ intentions and a cellular automata approach. Land Use Policy 2019, 85, 142–154. [Google Scholar] [CrossRef]
  23. Ren, Y.; Lü, Y.; Comber, A.; Fu, B.; Harris, P.; Wu, L. Spatially explicit simulation of land use/land cover changes: Current coverage and future prospects. Earth-Sci. Rev. 2019, 190, 398–415. [Google Scholar] [CrossRef]
  24. Liu, M.; Luo, Q.; Wang, J.; Sun, L.; Xu, T.; Wang, E. VST-PCA: A Land Use Change Simulation Model Based on Spatiotemporal Feature Extraction and Pre-Allocation Strategy. ISPRS Int. J. Geo-Inf. 2024, 13, 100. [Google Scholar] [CrossRef]
  25. Wei, X.; Zhao, L.; Zhang, F.; Xia, Y. Multi-scenario simulation prediction of land use in Nanchang based on network robustness analysis. Ecol. Indic. 2024, 167, 112599. [Google Scholar] [CrossRef]
  26. Luan, C.; Liu, R.; Li, Y.; Zhang, Q. Comparison of various models for multi-scenario simulation of land use/land cover to predict ecosystem service value: A case study of Harbin-Changchun Urban Agglomeration, China. J. Clean. Prod. 2024, 478, 144012. [Google Scholar] [CrossRef]
  27. Jin, Y.; Li, Y.; Zhang, H.; Liu, X.; Shi, H. Evaluation of Effectiveness and Multi-Scenario Analysis of Land Use Development Strategies and Ecological Protection Redlines on Carbon Storage in the Great Bay Area of China Using the PLUS-InVEST-PSM Model. Land 2024, 13, 1918. [Google Scholar] [CrossRef]
  28. Jin, T.; Zhang, P.; Zhou, N.; Li, S. Unveiling the spatiotemporal heterogeneity and driving mechanisms of carbon storage changes in response to land use/land cover changes under different future scenarios: Insights from the GMOP-SEM model. J. Clean. Prod. 2025, 487, 144622. [Google Scholar] [CrossRef]
  29. Zhang, P.; Liu, L.; Yang, L.; Zhao, J.; Li, Y.; Qi, Y.; Ma, X.; Cao, L. Exploring the response of ecosystem service value to land use changes under multiple scenarios coupling a mixed-cell cellular automata model and system dynamics model in Xi’an, China. Ecol. Indic. 2023, 147, 110009. [Google Scholar] [CrossRef]
  30. Jiang, L.; Wang, Z.; Zuo, Q.; Du, H. Simulating the impact of land use change on ecosystem services in agricultural production areas with multiple scenarios considering ecosystem service richness. J. Clean. Prod. 2023, 397, 136485. [Google Scholar] [CrossRef]
  31. Liang, X.; Guan, Q.; Clarke, K.; Liu, S.; Wang, B.; Yao, Y. Understanding the drivers of sustainable land expansion using a patch-generating land use simulation (PLUS) model: A case study in Wuhan, China. Comput. Environ. Urban Syst. 2021, 85, 101569. [Google Scholar] [CrossRef]
  32. Zhou, L.; Zhao, Y.; Zhu, C.; Shi, C. Route selection for scenic byways in karst areas based on the minimum cumulative resistance model: A case study of the Nanpan–Beipan River Basin, China. Ecol. Indic. 2024, 163, 112093. [Google Scholar] [CrossRef]
  33. Veress, M. A General Description of Karst Types. Encyclopedia 2022, 2, 1103–1118. [Google Scholar] [CrossRef]
  34. Liu, S.; Su, H.; Cao, G.; Wang, S.; Guan, Q. Learning from data: A post classification method for annual land cover analysis in urban areas. ISPRS J. Photogramm. Remote Sens. 2019, 154, 202–215. [Google Scholar] [CrossRef]
  35. Hasan, S.S.; Zhen, L.; Miah, M.G.; Ahamed, T.; Samie, A. Impact of land use change on ecosystem services: A review. Environ. Dev. 2020, 34, 100527. [Google Scholar] [CrossRef]
  36. Brouwer, R.; Pinto, R.; Dugstad, A.; Navrud, S. The economic value of the Brazilian Amazon rainforest ecosystem services: A meta-analysis of the Brazilian literature. PLoS ONE 2022, 17, e0268425. [Google Scholar] [CrossRef] [PubMed]
  37. Boulton, C.A.; Lenton, T.M.; Boers, N. Pronounced loss of Amazon rainforest resilience since the early 2000s. Nat. Clim. Change 2022, 12, 271–278. [Google Scholar] [CrossRef]
  38. Tiba, N.; Mulungu, D.M.M.; Izdori, F. Evaluating future climate-driven changes in agricultural water resilience: Insights from CMIP6 model simulations for the Ka., River sub-basin. J. Environ. Manag. 2025, 378, 22. [Google Scholar]
  39. Musidzaramba, T.J.; Mvumi, B.M.; Nyanga, L.K.; Kadzere, I.; Kiboi, M.; Mahlangu, M.; Chingoma, G.; Mazula, M.; Macheka, L. Nutritional profile and food safety of raw and value-added food products of sorghum and millets in sub-Saharan Africa and South Asia. Cogent Food Agric. 2025, 11, 17. [Google Scholar] [CrossRef]
  40. Zhao, G.; Xiao, Y.; Xu, C.; Li, B.; Huang, Z.; Zhang, T.; Gualtieri, C. Spatial-temporal correlation-based analysis of multi-source flood coincidence risks: A case study of the middle and lower Yangtze River basin. J. Hydrol.-Reg. Stud. 2025, 58, 19. [Google Scholar] [CrossRef]
  41. Sheng, E.; Liu, B.; Peng, H.; Zeng, M.; Cai, S.; Lan, J. Hydroclimatic variations in southwestern China during the Middle to Late Holocene transition and effects on the evolution of Late Neolithic cultures in the upper Yangtze River Valley. Quat. Sci. Rev. 2025, 352, 18. [Google Scholar] [CrossRef]
  42. Bai, H.; Zhong, Y.; Ma, N.; Kong, D.; Mao, Y.; Feng, W.; Wu, Y.; Zhong, M. Changes and drivers of long-term land evapotranspiration in the Yangtze River Basin: A water balance perspective. J. Hydrol. 2025, 653, 15. [Google Scholar] [CrossRef]
  43. Thiru, B.K.; Kumar, R.; Kota, S.H. Assessing and mitigating India’s agricultural emissions: A regional and temporal perspective on crop residue, tillage, and livestock contributions. J. Hazard. Mater. 2025, 488, 18. [Google Scholar]
  44. Sow, S.; Kumar, N.; Rana, L.; Singh, A.K.; Kumar, V.; Singh, H.; Kavita; Kumar, S. Suitable Planting Material with Integrated Nutrient Management Can Enhance Productivity, Nutrient Use Efficiency and Profitability of Sugarcane. J. Soil Sci. Plant Nutr. 2025, 24, 1–24. [Google Scholar] [CrossRef]
  45. Kumar, S.; Midya, K.; Ghosh, S.; Kumar, P.; Mishra, V.N. Land use change analysis and prediction of urban growth using multi-layer perceptron neural network Markov chain model in Faridabad—A data-scarce region of Northwestern India. Phys. Chem. Earth 2025, 138, 13. [Google Scholar] [CrossRef]
  46. Peeters, A.; Zu, M.; Käthner, J.; Ünlü, M.; Kan, R.; Hetzroni, A.; Geber, R.; Ben-Gal, A. Getis–Ord’s hot- and cold-spot statistics as a basis for multivariate spatial clustering of orchard tree data. Comput. Electron. Agric. 2015, 111, 140–150. [Google Scholar] [CrossRef]
  47. Yin, Z.; Feng, Q.; Zhu, R.; Wang, L.; Chen, Z.; Fang, C.; Lu, R. Analysis and prediction of the impact of land use/cover change on ecosystem services value in Gansu province, China. Ecol. Indic. 2023, 154, 110868. [Google Scholar] [CrossRef]
  48. Xiao, J.; Zhang, Y.; Xu, H. Response of ecosystem service values to land use change, 2002–2021. Ecol. Indic. 2024, 160, 111947. [Google Scholar] [CrossRef]
  49. Liu, H.; Deng, Y.; Liu, X. The contribution of forest and grassland change was greater than that of cropland in human-induced vegetation greening in China, especially in regions with high climate variability. Sci. Total Environ. 2021, 792, 148408. [Google Scholar] [CrossRef]
  50. Wang, D.; Lan, A.; Fan, Z.; Zou, Y.; Li, W.; Wang, R. Scenario Modeling of Response of Land Use Change to Ecosystem Service Values in A Typical Karst Region. Res. Soil Water Conserv. 2024, 31, 308–315. [Google Scholar]
  51. Hu, Y.; Zhou, X.; Ao, Y.; Yuan, W.; Zhang, W.; Wang, X. Analysis of evolution and influencing factors of ecosystem service value in Guizhou Province. Sci. Surv. Mapp. 2023, 48, 120–130. [Google Scholar]
  52. Sun, D.; Liang, Y.; Liu, L. Impact of Land Use Change on Ecosystem Service Values in Guizhou Province from 2000 to 2020. Resour. Environ. Yangtze Basin 2024, 33, 547–560. [Google Scholar]
  53. Brander, L.M.; De Groot, R.; Schägner, J.P.; Guisado-Goñi, V.; Van’t Hoff, V.; Solomonides, S.; McVittie, A.; Eppink, F.; Sposato, M.; Do, L.; et al. Economic values for ecosystem services: A global synthesis and way forward. Ecosyst. Serv. 2024, 66, 101606. [Google Scholar] [CrossRef]
  54. Berghöfer, A.; Mader, A.; Patrickson, S.; Calcaterra, E.; Smit, J.; Blignaut, J.N.; de Wit, M.; Van Zyl, H. TEEB Manual for Cities: Ecosystem Services in Urban Management. 2011. Available online: https://teebweb.org/publications/other/teeb-cities/ (accessed on 10 January 2025).
  55. Wang, Y.; Zhang, Z.; Chen, X. Spatiotemporal change in ecosystem service value in response to land use change in Guizhou Province, southwest China. Ecol. Indic. 2022, 144, 109514. [Google Scholar] [CrossRef]
  56. Lechner, A.M.; Foody, G.M.; Boyd, D.S. Applications in Remote Sensing to Forest Ecology and Management. One Earth. 2020, 2, 405–412. [Google Scholar] [CrossRef]
  57. Jiao, L.; Yang, R.; Zhang, Y.; Yin, J.; Huang, J. The Evolution and Determinants of Ecosystem Services in Guizhou—A Typical Karst Mountainous Area in Southwest China. Land 2022, 11, 1164. [Google Scholar] [CrossRef]
  58. Yang, L.; Jiao, H. Spatiotemporal Changes in Ecosystem Services Value and Its Driving Factors in the Karst Region of China. Sustainability 2022, 14, 6695. [Google Scholar] [CrossRef]
Figure 1. Schematic diagram of the basin area of the Nanpan and Beipan River Basins.
Land 14 00824 g001
Figure 2. Research framework diagram.
Land 14 00824 g002
Figure 3. Spatiotemporal distribution of ESV in the Nanpan and Beipan River Basins from 2000 to 2020.
Land 14 00824 g003
Figure 4. Spatial patterns of ecosystems in the Nanpan and Beipan River Basins under different scenarios in 2035.
Land 14 00824 g004
Figure 5. ESV in the Nanpan and Beipan River Basins under different scenarios in 2035.
Land 14 00824 g005
Figure 6. Hot spot and cold spot distribution of ESV in the Nanpan and Beipan River Basins under different scenarios in 2035.
Land 14 00824 g006
Table 1. Unit price of ecosystem service value per unit area [unit: RMB/(ha)].
Primary TypeProvisioning
Services
Regulating
Services
Supporting
Services
Cultural Services
Secondary TypeFPRMPWRSGRCLEPHRSCMNCBAL
Farmland Ecosystem20001305.16289.38−1541.381051.21549.23159.451765.8614.19183.08200.7988.59
20051305.16422.16−2248.621533.54801.23232.622576.01896.00267.08292.92129.23
20101305.16595.95−3174.322164.861131.08328.383636.491264.86377.03413.51182.43
20153105.72688.6−3667.852501.441306.93379.434201.861461.52435.64477.8210.8
20203892.49863.04−4597.023135.131638.02475.555266.321831.76546.01598.85264.2
Forest
Ecosystem
2000239.18546.28283.471804.195400.751553.193062.12196.91168.311999.07876.99
2005348.92796.93413.542632.017878.82265.854467.093204.93245.542916.321279.39
2010492.571125.00583.783715.5411,122.293198.656306.084524.32346.624116.891806.08
2015569.151299.91674.554293.2112,851.523695.957286.515227.74400.514756.962086.88
2020713.331629.21845.435380.816,107.184632.249132.396552.07501.975962.032615.55
Grassland Ecosystem2000196.86286.62159.851016.562684.33885.071966.991237.8394.491122.87496.08
2005287.18418.13233.191483.003915.991291.162869.511805.79137.851638.08723.69
2010405.41590.27329.192093.515528.111822.74050.812549.19194.592312.431021.62
2015468.44682.04380.372419.006387.582106.084680.62945.52224.852671.951180.46
2020587.10854.82476.733031.808005.742639.625866.343691.71281.813348.841479.5
Wetland Ecosystem2000859.28351.398108.51243.153091.635979.5097,724.301505.95115.164582.813070.96
20051253.54512.6211,828.961813.544510.178723.11142,563.572196.931686685.564480.02
20101769.59723.6516,698.642560.136366.8912,314.18201,253.303101.35237.169437.836324.32
20152044.72836.1619,294.842958.177356.7714,228.72232,542.893583.53274.0310,905.177307.59
20202562.711047.9824,182.783707.569220.4617,833.26291,452.754491.34343.4613,667.769158.81
Urban
Ecosystem
20000.000.000.000.000.000.000.000.000.000.000.00
20050.000.000.000.000.000.000.000.000.000.000.00
20100.000.000.000.000.000.000.000.000.000.000.00
20150.000.000.000.000.000.000.000.000.000.000.00
20200.000.000.000.000.000.000.000.000.000.000.00
Desert
Ecosystem
20000.000.000.0023.620.00118.1135.4323.620.0023.6211.81
20050.000.000.0034.460.00172.3151.6934.460.0034.4617.23
20100.000.000.0048.650.00243.2472.9748.650.0048.6524.32
20150.000.000.0056.210.00281.0684.3256.210.0056.2128.11
20200.000.000.0070.450.00352.26105.6870.450.0070.4535.23
Note: The following acronyms represent the terms as follows: FP: food production, RMP: raw material production, WRS: water resource supply, GR: gas regulation, CL: climate regulation, EP: environmental purification, HR: hydrological regulation, SC: soil conservation, MNC: maintaining nutrient cycling, Bio: biodiversity, AL: esthetic landscape.
Table 2. Change trends of ESV in the Nanpan and Beipan River Basins from 2000 to 2020 (unit: 1 × 10³ ha/1 × 108 RMB).
Ecosystem Types20002005201020152020
AreaESVAreaESVAreaESVAreaESVAreaESV
Farmland Ecosystem741.0334.5727736.1450.1032728.1169.9577723.0180.2678711.3798.9735
Forest Ecosystem1343.79243.63511355.6358.54651366.64510.27241364.32588.60871241.96671.4667
Grassland Ecosystem782.0979.3632774.64114.675758.07158.4201757.33182.8706867.82262.6129
Wetland Ecosystem5.096.44875.339.855414.8434.707415.0645.368122.1683.6876
Urban Ecosystem7.106.52011.57019.43035.940
Desert Ecosystem0.60.00141.470.00510.480.00230.560.00310.460.0032
Total2879.71364.02112879.71533.18522879.71773.35992879.71897.11842879.711116.7439
Table 3. Dynamics and proportional change rates of ESV in the Nanpan and Beipan River Basins under four scenarios (unit: 1 × 10⁸ RMB).
Ecosystem TypesNatural DevelopmentFarmland ProtectionEconomic DevelopmentSustainable Development
ESVRateESVRateESVRateESVRate
Farmland Ecosystem95.61778.95%117.714911.21%94.30938.86%96.00749.00%
Forest Ecosystem578.574354.18%571.808454.47%579.706854.43%579.248754.28%
Grassland Ecosystem309.759829.01%267.302525.46%308.977129.01%310.264929.07%
Wetland Ecosystem83.90287.86%92.89568.85%82.03027.70%81.60747.65%
Urban Ecosystem0.00000.00%0.00000.00%0.00000.00%0.00000.00%
Desert Ecosystem0.00220.00%0.00220.00%0.00210.00%0.00210.00%
Total1067.86100%1049.72100%1065.03100%1067.13100%
Table 4. Ecosystem changes in the Nanpan and Beipan River Basins under different scenarios (unit: 1 × 10³ ha).
Ecosystem Types2020Natural DevelopmentFarmland Protection Economic DevelopmentSustainable Development
AreaAreaRateAreaRateAreaRateAreaRate
Farmland Ecosystem711.37687.19−3.40%846.0018.92%677.78−4.72%689.99−3.01%
Forest Ecosystem1241.961070.00−13.85%1057.49−14.85%1072.10−13.68%1071.25−13.75%
Grassland Ecosystem867.821023.5317.94%883.241.78%1020.9417.64%1025.1918.13%
Wetland Ecosystem22.1622.220.25%24.6011.00%21.72−1.99%21.61−2.49%
Urban Ecosystem35.9474.37106.93%65.9983.60%84.77135.87%69.2792.73%
Desert Ecosystem0.460.31−32.59%0.31−33.01%0.30−34.46%0.30−33.93%
Table 5. Area size and proportion of hot and cold spots in different scenarios for the Nanpan and Beipan Rivers by 2035 (unit: 1 × 10³ ha).
Ecosystem TypesNatural DevelopmentFarmland ProtectionEconomic DevelopmentSustainable Development
AreaRateAreaRateAreaRateAreaRate
Cold spot253.898.82%251.468.74%216.187.51%2528.76%
Sub-cold spot1200.7841.73%1239.4843.07%1231.3842.79%1499.2252.10%
Transition area758.0726.34%772.8326.85%741.5125.77%503.6417.50%
Sub-hot spot242.918.44%253.268.80%258.668.99%233.198.10%
Hot spot422.1914.67%360.8112.54%430.1114.95%389.7913.54%
Disclaimer/Publisher’s Note: The statements, opinions and data contained in all publications are solely those of the individual author(s) and contributor(s) and not of MDPI and/or the editor(s). MDPI and/or the editor(s) disclaim responsibility for any injury to people or property resulting from any ideas, methods, instructions or products referred to in the content.

