Article

Spatiotemporal Dynamic Evolution of PM2.5 Exposure from Land Use Changes: A Case Study of Gansu Province, China

1
School of Statistics and Data Science, Lanzhou University of Finance and Economics, Lanzhou 730020, China
2
School of Science, Inner Mongolia University of Science and Technology, Baotou 014010, China
3
School of Statistics and Mathematics, Central University of Finance and Economics, Beijing 100081, China
*
Authors to whom correspondence should be addressed.
Land 2025, 14(4), 795; https://doi.org/10.3390/land14040795
Submission received: 20 February 2025 / Revised: 28 March 2025 / Accepted: 1 April 2025 / Published: 7 April 2025

Abstract

:
Air pollution is a major trigger for chronic respiratory and circulatory diseases. As a key component of air pollution, fine particulate matter (PM2.5) exposure is largely determined by land use type and population density. However, simultaneous consideration of their spatiotemporal distribution is lacking in existing studies on PM2.5 exposure. In this paper, we first assess the dynamic evolution of land use patterns in Gansu Province, China, from 2000 to 2020, using a land use transfer matrix and dynamic degree. Population-weighted exposure (PWE) to PM2.5 is then evaluated for each land use type at provincial, city, and county levels, with seasonal variations analyzed. Spatial autocorrelation analysis is finally performed to explore the spatiotemporal evolution of PM2.5 exposure, whereas standard deviation ellipses and gravity center migration models highlight spatial distribution characteristics and shifting trends. Experimental results showed that 2010 was a turning point for annual PM2.5 exposure at the provincial level in Gansu Province, with an initial increase followed by a decrease. Construction land had the highest annual PM2.5 exposure, whereas forest had the lowest exposure (except in 2005). Exposure levels showed a seasonal pattern: higher in winter and spring and lower in summer and autumn. At city and county levels, southern Gansu indicated a continuous decline in annual PM2.5 exposure across all land use types since 2000. Exposure levels exhibited a strong spatial positive correlation, with a fluctuating spatial convergence. This study comprehensively analyzes the multi-scale differences and spatiotemporal evolution patterns of PM2.5 exposure across various land use types, contributing to provide scientific evidence and decision-making support for mitigating air pollution and enhancing coordinated air pollution control at multi-scale administrative levels.

1. Introduction

Air pollution has emerged as a transboundary environmental challenge, posing significant threats to global public health. The Global Burden of Disease (GBD) study reveals that air pollution has climbed to the second leading global mortality risk factor, up from its fourth-place ranking in 2019 [1,2]. In 2021, exposure to air pollution contributed to an estimated 8.1 million premature deaths globally, with 58% attributable to fine particulate matter (PM2.5) [3]. In response, the UN 2030 Sustainable Development Agenda prioritizes air quality improvement through Sustainable Development Goal (SDG) 3.9 (reducing pollution-related mortality) and SDG 11.6.2, which establishes population-weighted annual averages of urban PM2.5 and PM10 as key metrics for evaluating particulate matter’s health impacts on urban populations [4,5].
Confronted with deteriorating air quality from accelerated industrialization and urban expansion, China implemented stringent air pollution prevention and control policies starting in 2013, with the core objective of reducing PM2.5 concentrations, aiming to continue promoting the battle for blue skies, resulting in significant improvement in China’s overall air quality [6]. However, compared with 175 countries worldwide, China ranked first in 2019 with an annual average population-weighted PM2.5 concentration of 49.45 µg/m3, which is much higher than the global annual average of 32.3 µg/m3. Furthermore, over 90% of the days in a year exceeded the 2021 WHO daily average PM2.5 limit (15 µg/m3) [7]. Thus, reducing air pollution remains a huge challenge.
Recently, many researchers have conducted research on estimating PM2.5 concentrations in China; nevertheless, these studies have mainly focused on the national level [7,8] as well as economically developed regions such as Beijing-Tianjin-Hebei (BTH) [4], Yangtze River Delta (YRD) [9], and Pearl River Delta (PRD) [10]. Given China’s vast territory, various regions may exhibit significantly different air pollution characteristics and exposure levels owing to factors such as socioeconomic conditions, population density, emission intensities, and topography [11,12]. Therefore, it is necessary to specifically assess the levels of PM2.5 exposure in different regions.
However, the existing studies that provide in-depth analyses of long-term exposure trends in specific provinces in China are rare, especially since research in the northwestern region remains scarce. As an important ecological barrier and energy base in the northwestern region, Gansu Province faces multiple challenges, such as a per capita gross domestic product (GDP) lower than that of most other provinces and a relatively fragile ecological environment, making sustainable ecological and economic development imperative.
In addition, many studies have confirmed that different land use types are closely related to PM2.5 concentrations [13,14]. Since different land use types have varying effects on PM2.5, most current studies have focused on the simple correlation between the land use area and PM2.5 concentrations. Few scholars have approached the issue from the perspective of land use types to estimate the population-weighted exposure to PM2.5 at multiple administrative scales (i.e., province, city, and county levels) and investigated the spatiotemporal evolution characteristics of PM2.5 exposures across various land use types. This research gap limits our comprehensive understanding of the complex relationship between land use and air quality and also hinders the development of more precise and effective air pollution prevention and control strategies.
However, accurately assessing PM2.5 exposure requires a dense network of air monitoring stations. Unfortunately, there is a significant spatial imbalance in the current coverage of monitoring station networks. In a few developed countries, the relatively dense monitoring networks enable accurate characterization of ambient air pollution levels. In contrast, most countries, particularly those with economically disadvantaged rural regions, suffer from sparse or non-existent air quality monitoring infrastructure [15]. This leads to substantial populations residing beyond the effective radius of existing stations or within “monitoring blind zones” devoid of reliable particulate matter data. Thus, the spatial imbalance significantly increases the uncertainty of human exposure to air pollution, hinders our ability to accurately assess air pollution exposure, restricts the development of precise exposure assessment and intervention policies, and poses major challenges to accurate spatial PM2.5 exposure inference.
Therefore, the accurate calculation of population-weighted PM2.5 using spatially high-resolution data becomes particularly crucial. Accordingly, this study focuses on Gansu Province, China, as a representative case and integrates 1-km high-resolution land use remote sensing data, PM2.5 concentration raster data, and population raster data to establish a framework for assessing PM2.5 exposure across various land use types at the “province-city-county” level, also explores its spatiotemporal dynamic evolution. Specifically, this paper aims to address the following three key questions: (1) What are the spatiotemporal evolution characteristics and transition patterns of each land use type in Gansu Province from 2000 to 2020? (2) What are the seasonal trends and spatiotemporal patterns of population-weighted PM2.5 exposure on each land use type under different administrative units over 20 years? Which areas and land use types are at higher risk of PM2.5 exposure in different seasons? (3) What are the spatial clustering characteristics and changes in the center of gravity of PM2.5 exposure for each land use type? How do these characteristics assist in identifying high-risk land use types and regions for PM2.5 exposure? Addressing these concerns will provide a scientific foundation for the development of differentiated prevention and control strategies in the ecological barrier areas of Northwest China, thereby contributing to the implementation of SDG 11.6 and the “Beautiful China” goal at all levels.

2. Literature Review

2.1. Land Use Change Studies

Land use change, as a crucial perspective for elucidating the interplay between regional ecological environments and human activities, has garnered significant attention and in-depth research from numerous researchers in recent years. More recently, multiple comprehensive analyses of land use change characteristics across temporal and spatial scales have been conducted, which have delved deeply into the response mechanisms of various ecological and environmental issues, including ecosystem service value [16], carbon emissions [17], and air quality [18], to land use change. Such studies have not only enriched our understanding of the driving forces behind land use change but have also illuminated the multidimensional impacts of land use change on the ecological environment [19].
In assessing the scale and intensity of land use change, researchers employed a range of indicators, including the land use transfer matrix, single land use dynamic degree, integrated land use dynamic degree, and rate of land use change [20,21,22]. These indicators served as essential tools for quantifying the scale of land use type transfers, the rate of change, and the intensity of land use change. By utilizing these indicators, researchers can gain a more precise understanding of the dynamic characteristics of land use change. Additionally, to simulate and predict future trends in land use change, researchers have developed various land use simulation models. Notably, models such as the FLUS model [23], the MOP model [24], and the enhanced MOP-PLUS model [25] have been extensively utilized to simulate land use changes across diverse development scenarios.
However, it is noteworthy that there exists a notable imbalance in the regional distribution of current land use change studies. Many studies predominantly focused on the eastern or coastal regions with faster economic development [21,22], while comparatively less attention had been devoted to the northwestern regions, particularly those that were ecologically fragile [16]. This disparity in study distribution may have contributed to a lack of comprehensive and in-depth understanding of the characteristics of land-use change in these regions and its subsequent impacts on ecological environments, including aspects related to air quality, specifically PM2.5 exposure. Therefore, to fully elucidate the impacts of land use change on the regional ecological environment and gain a profound understanding of its relationship with PM2.5 exposure, it is imperative to augment research efforts on land use change in ecologically fragile regions of Northwest, China.

2.2. Air Pollution Studies

Air pollution, particularly exposure to PM2.5, has emerged as a significant environmental concern globally. Existing research on PM2.5 exposure has been comprehensive, encompassing various dimensions such as spatiotemporal distribution characteristics [26], health impacts [27], and influencing factors [28].
In terms of spatiotemporal distribution characteristics, existing studies have demonstrated substantial variation in PM2.5 exposure across different regions. Specifically, from 2001 to 2014, the population-weighted PM2.5 concentrations in the PRD region ranged from 36.1 to 51.7 µg/m3 [29]. In 2014, Beijing recorded 90 µg/m3 [30], whereas Shanghai’s levels ranged from 41.95 to 60.45 µg/m3 from 2016 to 2018 [31]. These studies underscore the complex and diverse geospatial patterns of PM2.5 exposure.
Regarding health impacts on humans, scientific research has unequivocally established a robust association between PM2.5 exposure and respiratory and cardiovascular diseases. Short-term exposure to PM2.5 has been implicated in the onset of various conditions, including ischemic heart disease, stroke, diabetes mellitus, chronic obstructive pulmonary disease, and lung cancer [1,32]. Conversely, prolonged exposure to elevated concentrations of PM2.5 has been shown to substantially elevate the risk of morbidity and mortality [33,34].
Researchers have increasingly focused on the impact of land use types on PM2.5 concentrations, with studies revealing significant differences in their regulatory effects on PM2.5 levels. Green vegetation, through mechanisms such as direct trapping by leaves, branches, and stems, as well as deposition and adsorption, effectively reduces atmospheric particulate matter concentrations [35]. However, the moderating effect varies among vegetation types. Ecological land, particularly forest and grassland, exhibits a significant negative correlation with PM2.5 concentrations due to its dense vegetation cover [36], with forests playing a more prominent role in reducing PM2.5 levels [37]. In contrast, cropland, despite being covered by crops, tends to have higher PM2.5 concentrations due to specific agricultural activities such as fertilizer application, tilling, and straw burning [38]. Notably, not all ecological land types attenuate PM2.5 concentrations; for instance, wetlands and water areas have been found to contribute to higher PM2.5 levels [39]. Conversely, construction land, characterized by high traffic and industrial activity intensity, is typically associated with elevated PM2.5 concentrations [13]. Desert areas and unused land, due to sparse ground cover and susceptibility to wind erosion, generate substantial suspended dust, further exacerbating PM2.5 levels [40]. Despite the growing attention to the influence of land use type on PM2.5 concentrations, few studies have measured PM2.5 exposure from this perspective.
Currently, studies of PM2.5 exposure at various scales have been typically conducted in isolation for different study areas, lacking spatial longitudinal comparisons within the same geographic region [4,32,41]. Furthermore, the data required for such studies pose numerous challenges. Traditional methods for obtaining PM2.5 mass concentration data are constrained by the limited number and uneven distribution of monitoring stations, impeding continuous monitoring on a broad regional scale [42]. Population data, in contrast, primarily rely on periodic censuses or sampling surveys, which are not only costly but also temporally discontinuous. More critically, the absence of raster-based spatialized PM2.5 exposure analysis in existing studies restricts the capacity to refine the spatial description and assessment of PM2.5 exposure.
Therefore, exploring the variations in PM2.5 exposure across different land use types at multiple spatial scales, such as provinces, cities, and counties, within the same geographic region has emerged as a pressing scientific issue. This is particularly critical in the ecologically fragile region of northwestern China. Such a study not only facilitates a deeper understanding of the impacts of land use changes on PM2.5 exposure but also provides a scientific rationale for formulating effective environmental protection policies.

2.3. Application of Spatial Analysis Techniques

Spatial analysis techniques are paramount when investigating the regional variations and spatial correlation properties of PM2.5 concentrations. Inequality indices, particularly the Thiel and Gini index, served as essential tools in assessing the inequality of PM2.5 concentration distributions in related research. Liu et al. employed the Thiel index to analyze the disparities in PM2.5 exposure levels between urban and rural areas in China, uncovering that urban populations face significantly higher exposure levels compared to rural areas. This revelation underscores the air quality challenges posed by urbanization and the disparities in environmental protection strategies between urban and rural settings [43]. Conversely, Bai and Liu utilized the Gini index to explore the inequality in PM2.5 exposure across China’s four major regions, demonstrating that eastern and western China exhibit more pronounced inequality [44]. These findings further emphasize the complexity inherent in the distribution of PM2.5 concentrations across diverse regions. Moreover, trend analysis techniques are pivotal in monitoring long-term trends in PM2.5 concentrations. Kan et al. employed Sen’s slope and Mann-Kendall trend test methods to evaluate the comprehensive trend of PM2.5 in China, discovering a notable decreasing trend in PM2.5 concentrations over the past two decades [14]. Additionally, spatial autocorrelation models, such as Moran’s I index, have been extensively used to assess the spatial agglomeration and autocorrelation of PM2.5 concentrations. Qi et al. conducted an in-depth study on the spatial and temporal evolution characteristics of PM2.5 concentrations in various climate zones of China from 2000 to 2018 using Moran’s I index. Their research revealed the spatial agglomeration and autocorrelation of PM2.5 concentrations across different climatic zones, providing a new perspective for understanding the influence of climate change on PM2.5 concentration distributions [26]. These studies not only offer invaluable insights into the spatial distribution patterns of PM2.5 but also furnish a precise foundation for the formulation of differentiated environmental management strategies.
However, the majority of current research on PM2.5 exposure has primarily concentrated on national, provincial, or city-level scales [7,8,30]. This focus has limited the ability to meticulously capture the micro-dynamic processes of PM2.5 transport across regions. Furthermore, the relatively sparse distribution of PM2.5 monitoring stations at the county level has hindered precise calculations of PM2.5 exposure. Consequently, this sparsity to some extent constrains our comprehensive understanding of the air pollution situation at a more microscopic level.
To address this research gap, spatiotemporal analysis methods exhibit distinct advantages. By integrating spatial autocorrelation models, such as Local Indicators of Spatial Association (LISA), with Standard Deviational Ellipse (SDE) and Centre of Gravity Migration models, it is possible to simultaneously elucidate the spatial dependence and directional diffusion characteristics of PM2.5. This integrated approach offers robust technical support for precise assessments of PM2.5 exposure at the county level and for the accurate implementation of SDG 11.6 targets.

3. Materials and Methods

The general framework of this study is shown in Figure 1. The key research contributions are three-fold as follows: (1) Using the land use transfer matrix and dynamic degree index, the spatiotemporal patterns of land use changes in Gansu Province are analyzed from both provincial and city perspectives, aiming at grasping the characteristics of the spatiotemporal evolution of each land use type, as well as their transformation patterns; (2) From the multi-scale perspectives of the province, city, and county, the seasonal variation trends and spatial-temporal patterns of population-weighted PM2.5 exposure across different land use types in Gansu Province over 20 years are calculated; (3) Spatial autocorrelation analysis, SDE, and gravity center migration model are employed to explore the spatial clustering characteristics and center of gravity shifts in PM2.5 exposure.

3.1. Study Area

Gansu Province, located in the northwest of China (92°13′–108°46′ E, 32°11′–42°57′ N), is a historically significant region along the ancient Silk Road and a modern hub for energy and raw materials in China. Spanning approximately 42.54 × 10⁴ km2, it administers 12 prefecture-level cities (i.e., Baiyin [BY], Dingxi [DX], Jiayuguan [JYG], Jinchang [JC], Jiuquan [JQ], Lanzhou [LZ], Longnan [LN], Pingliang [PL], Qingyang [QY], Tianshui [TS], Wuwei [WW], Zhangye [ZY]), and two autonomous prefectures (i.e., Gannan [GN] and Linxia [LX]). Gansu Province features all types of landforms, except for marine and island terrains, with elevations sloping from southwest to northeast (see Figure 2). Its varied climate includes subtropical monsoon, temperate monsoon, temperate continental, and highland alpine climates. The annual average temperature ranges from 0 °C to 15 °C, and precipitation is between 40 mm and 750 mm. By the end of 2020, the population of Gansu Province stood at 25.02 million, with a regional GDP of 130.72 billion U.S. dollars. Although its growth rate surpassed the national average by 1.6 percentage points, the province’s total economic output ranked 27th nationwide. According to the national ambient air quality situation from January to December 2020 published by China’s Ministry of Ecology and Environment, Lanzhou, the capital city of Gansu Province and its leading city in GDP, ranked 12th from the bottom among the 168 key national cities regarding air quality improvement (https://www.mee.gov.cn/, accessed on 15 September 2024). This indicates that Gansu Province, with its fragile ecological foundation and underdeveloped economy, continues to face severe air pollution.

3.2. Data Source and Processing

The data used in this study include land use data, PM2.5 concentrations data, and population data, respectively (see Table 1).
Land use data. Land use data were sourced from the Data Center for Resource and Environmental Sciences, Chinese Academy of Sciences (https://www.resdc.cn/, accessed on 8 June 2024), based on Landsat remote sensing image data. It was constructed by manual visual interpretation and categorized into six major categories and 25 subcategories with a spatial resolution of 30 m. In this paper, land use data in Gansu Province for 2000, 2005, 2010, 2015, and 2020 were obtained and reclassified into six categories: cropland, forest, grassland, water, construction land, and unused land.
PM2.5 concentrations data. The PM2.5 dataset was derived from the China HighAirPollutants (CHAP) [45,46]. This dataset uses artificial intelligence to fill spatial gaps in MODIS MAIAC AOD satellite products. It integrates ground-based observations, atmospheric reanalysis, and emission inventories to generate seamless ground-level PM2.5 data for China from 2000 to 2020 [47]. The data possess a spatial resolution of 0.01° and a temporal resolution of monthly intervals. The dataset exhibits high accuracy, evidenced by a coefficient of determination (R2) of 0.92 and a root mean square error (RMSE) of 10.76 µg/m³ following 10-fold cross-validation. This precision enables the dataset to accurately capture the trends in actual PM2.5 concentrations. In this study, spring is defined as March to May, summer as June to August, autumn as September to November, and winter as December of the current year to February of the following year, respectively.
Population data. A gridded population dataset was downloaded from the LandScan Global Vital Statistics Database (https://landscan.ornl.gov/, accessed on 10 July 2024). The dataset, covering from 2000 to 2020, was developed by the U.S. Department of Energy’s Oak Ridge National Laboratory (ORNL) to provide high-resolution data on the global population distribution. With a spatial resolution of 30 arcsec (approximately 1 km at the equator), this dataset has been widely applied in various fields, including environmental assessments [48], epidemiological research [49], and war impacts [50]. This study used county-level population data from the Gansu Provincial Statistical Yearbooks to correct population raster data.
In addition, in this study, ArcGIS 10.8 software was used to crop and resample the data to match the study area. The coordinate system of all the data was uniformly transformed to the Albers Conical Equal Area projection, and the spatial resolution of all the datasets was guaranteed to be 1 km.

3.3. Methods

3.3.1. Land Use Transfer Matrix and Dynamic Degree

To quantify the dynamic change characteristics of land use types in Gansu Province from 2000 to 2020, the land use transfer matrix is employed in this paper. This matrix effectively visualizes the interconversion processes among various land use types within a specific region over time. Furthermore, it reflects the direction and quantity of transitions between categories [21]. This formula is expressed as follows:
M x y = M 11 M 12 M 1 n M 21 M 22 M 2 n M n 1 M n 2 M n n
where n is the number of land use types; x and y (x, y = 1, 2, …, n) denote the pre- and post-transfer land use types, respectively; and M x y denotes the area of land use type x transferred to land use type y. In this study, ArcGIS 10.8 was used to perform raster calculations on land use data for Gansu Province, generating pixel-level change information for each category. Subsequently, the data were processed to produce the land use transfer matrix for Gansu Province from 2000 to 2020.
To quantitatively describe the intensity, rate of change, and spatial differences in land use changes for a specific land use type or the overall land use, this study introduced the single and integrated land use dynamic degree [51], which are calculated as follows:
K = S 1 S 2 S 2 × 1 T × 100 %
L = i = 1 n S i j 2 i = 1 n S i × 1 T × 100 %
where K denotes the dynamic degree of a particular land use type; S 1 and S 2 represents the areas of a specific land use type at the end and beginning of the study period, respectively; L is the integrated land use dynamic degree; S i represents the area of land use type i at the beginning of the study period; n denotes the total number of land use types; S i j is the area of land use type i converted into other categories j during the study period; and T denotes the study duration.

3.3.2. PM2.5 Exposure Calculation

Population-weighted exposure (PWE) to PM2.5 represents a key metric in health risk assessment, capable of revealing the complex spatial interactions between population distribution and PM2.5 concentrations [44]. This approach better reflects the actual health impacts more effectively than traditional PM2.5 mass concentration measures [4], which overlook differences in population density and fail to accurately capture exposure levels across different regions. The formula is determined as follows [52]:
P W E = i = 1 n P o p i × C P M 2.5 , i i = 1 n P o p i
where PWE represents the population-weighted exposure to PM2.5; n is the number of grids in the corresponding area; Popi and C P M 2.5 , i represent the population and PM2.5 concentration at grid i, respectively. The above formula quantifies the PM2.5 PWE on multiple scales (i.e., province, city, and county). Considering the seasonal influence on air quality and human activities, and their potential significant effects on PM2.5 exposure levels across different land use types, this study analyzed PWE for each land use type in different seasons, with adjustments to the Equation (4):
P W E u = i = 1 n P o p d u i × C P M 2.5 , d u i i = 1 n P o p d u i
where P W E u represents the population-weighted exposure to PM2.5 on land use type u in Gansu Province and its cities/counties at different time scales (e.g., annual and seasonal); P o p d u i and C P M 2.5 , d u i denote the population and PM2.5 concentration at grid i of land use type u within a spatial unit d at the corresponding time scale; and n is the number of grids in the corresponding area. In this study, it was assumed that land use types and population remained constant for different months within the same year for subsequent analysis.

3.3.3. Spatial Autocorrelation Analysis

Spatial autocorrelation analysis, a spatial statistical method, is utilized to investigate the interdependence between the values of an attribute across various spatial locations. This technique aims to uncover the underlying pattern of spatial distribution, specifically distinguishing whether the attribute exhibits characteristics of clustered, discrete, or random distributions. This study employed Moran’s I index for global and local spatial autocorrelation analyses of PM2.5 exposure to assess spatial clustering of PM2.5 PWE across various land use types. Specifically, the global spatial autocorrelation analysis aimed to assess whether there was a spatial correlation of PM2.5 exposure within each land use type. The calculation formula is as follows [53]:
I = i = 1 n j = 1 n w i j ( Y i Y ) ( Y j Y ) S 2 i = 1 n j = 1 n w i j
where Y i represents the PM2.5 exposure on land use type i at the province, city, and county levels of the study area; Y * is the mean value of Y i , which is Y * = 1 n i = 1 n Y i ; S 2 = 1 n i = 1 n ( Y i Y * ) ; and w i j is the spatial weight matrix. The value of global Moran’s I index ranges from −1 to 1. A value larger than 0 indicates positive spatial autocorrelation, meaning similar values tend to cluster spatially; a value less than 0 indicates negative spatial autocorrelation, meaning similar values tend to be dispersed spatially; a value of 0 indicates that the observed values are randomly distributed with no spatial autocorrelation.
Local spatial autocorrelation is a key indicator for analyzing local spatial data within a study area, reflecting the degree and significance of spatial differences between individual areas and their surrounding regions. It is calculated as follows [54]:
I i = ( Y i Y * ) s 2 j = 1 n w i j ( Y j Y * )
The local Moran’s index I i > 0 indicates that region i is spatially less different from the neighboring regions and vice versa.

3.3.4. SDE and Center of Gravity Migration Models

The SDE and center of gravity migration models are widely used in spatial analysis. These techniques are widely applied in regional economics, urban expansion, and environmental science [55,56] because they effectively reveal the spatial distribution patterns of geographic elements and their spatiotemporal evolutionary processes.
The SDE quantitatively describes the characteristics of the spatial distribution of geographical elements, such as centrality, directionality, and spatial pattern. This is achieved through the spatial range and key parameters of the ellipse, including its center, long axis, short axis, and orientation. The center of the ellipse represents the mean spatial location of the center of gravity of the data. The long axis indicates the primary direction of data distribution, whereas the short axis reflects the degree of dispersion. The orientation is the angle of rotation around the center, with 0° aligned to due north and increasing clockwise until it intersects with the long half-axis, revealing the main directional trend of the spatial distribution.
The center of gravity migration model analyzes temporal changes in the spatial position of the data by calculating the center of gravity at different times, identifying migration trajectories and dynamic changes over time [22]. Using ArcGIS 10.8 software, this study analyzed the spatial distribution characteristics of PM2.5 exposure and dynamic migration paths of the gravity center for each land use type in Gansu Province. These findings provide valuable insights for the precise identification of high-risk areas and support the development of region-specific prevention and control strategies.

4. Experimental Results

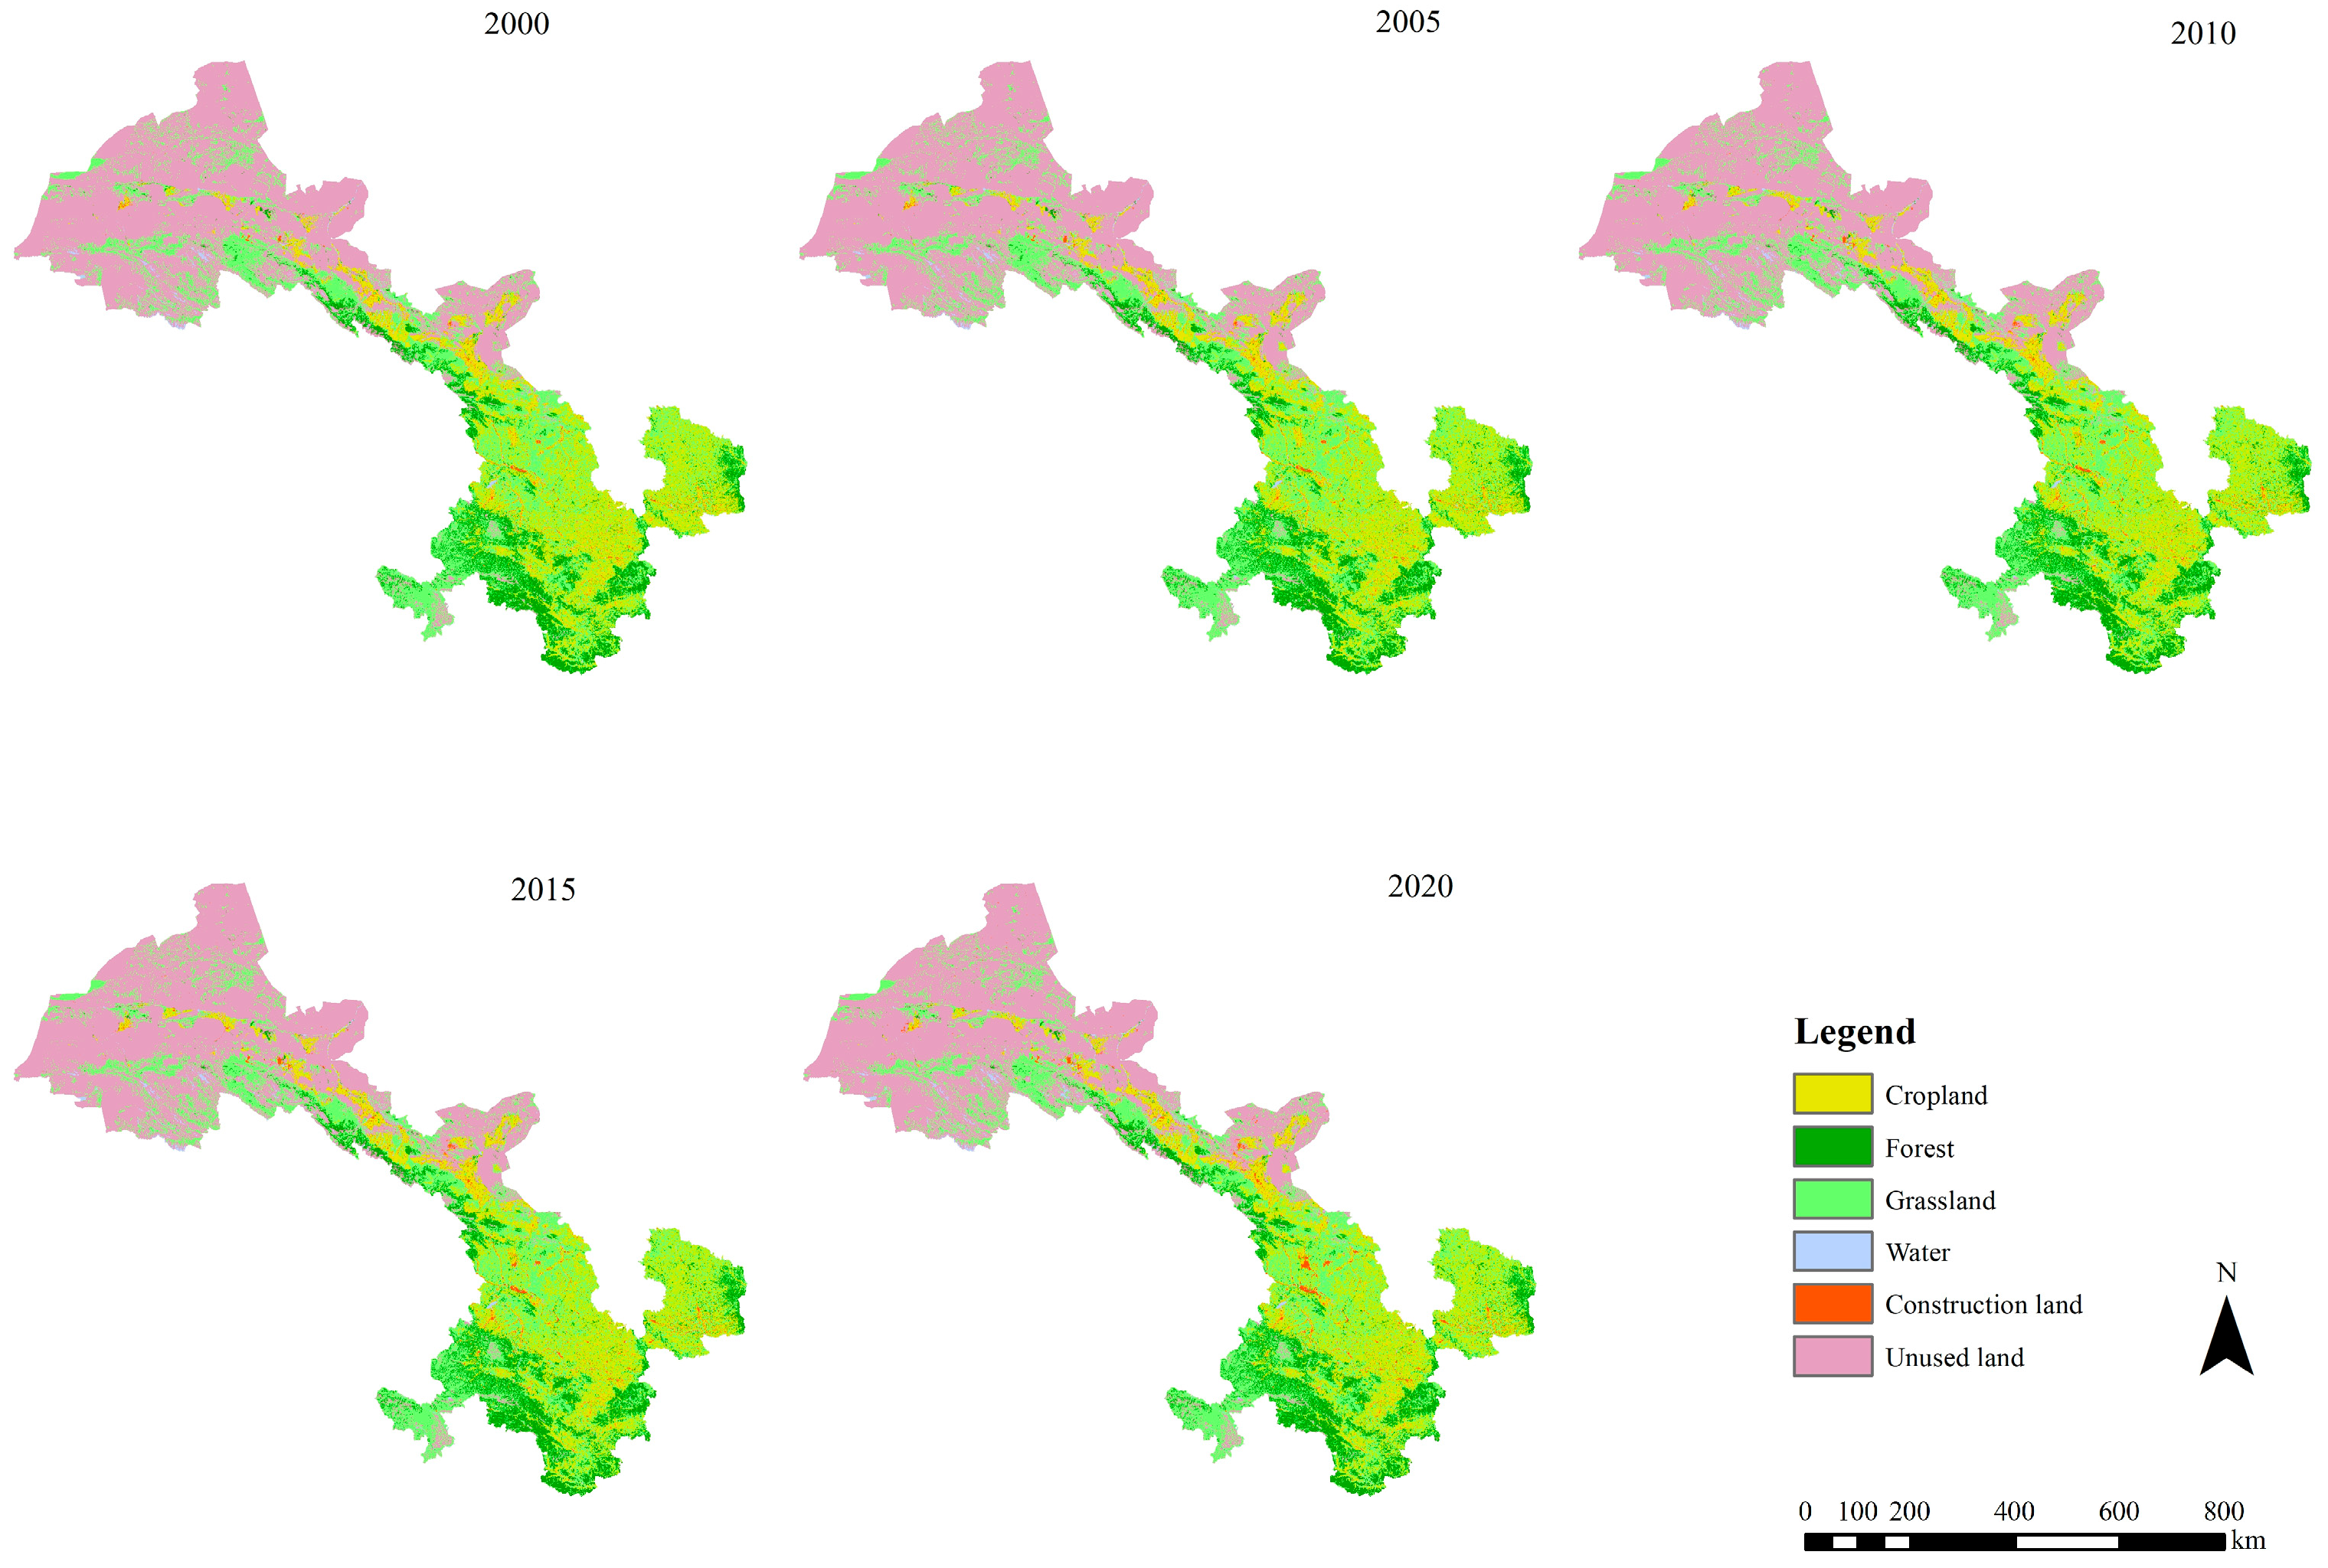
4.1. Spatiotemporal Evolution of Land Use Types

As shown in Figure 3, the land use types in Gansu Province are predominantly unused land and grassland, accounting for 73% of the total area. Croplands constituted 15%, whereas forests comprised 9%. In contrast, water and construction land represented a relatively small proportion of the land use distribution. The land use structure of Gansu Province underwent significant changes between 2000 and 2020. Notably, both cropland and unused land exhibited a declining trend, with unused land remaining the dominant land type. Specifically, the cropland and unused land areas decreased by 1729 km2 and 2727 km2, respectively. During this period, construction land expanded rapidly, whereas the areas of grassland, forest, and water generally increased, with increases of 1927 km2, 1057 km2, 916 km2, and 556 km2, respectively.
From 2000 to 2020, the most notable transition was the conversion of cropland to grassland, which covered 5168 km2, representing 68.36% of the total cropland transferred out. This was followed by the reclamation of 3437 km2 of grassland as cropland, accounting for 46.70% of the total grassland area lost. In addition, 2019 km2 of unused land was converted to grassland, whereas 1716 km2 of grassland was degraded to unused land. A total of 1652 km2 of grassland was transformed into forest land with high vegetation cover, and 1636 km2 of unused land was changed into croplands. Other significant land use changes included the conversion of 1353 km2 of cropland into construction land, 1070 km2 of forest land into low-coverage grassland, and 575 km2 of unused land into water (see Table 2).
Table 2 demonstrates a clear trend in the mutual transfer of cropland and grassland. In addition to croplands, unused land and forests were more frequently converted to grassland, with a larger area transferred. The conversion of cropland to grassland increased significantly before 2010, slowed down between 2010 and 2015, and reached 3580 km2 after 2015. At the same time, the area of grassland reclaimed as cropland before 2010 gradually increased, with smaller changes in 2010–2015, and rapidly increased by 2878 km2 during 2015–2020, which is 6.62 times the total area of grassland converted to construction land in the past 20 years. Before 2005, the mutual transfer between unused land and grasslands was relatively small; however, it increased significantly after 2005. The transfer between 2010 and 2015 was similar to that before 2005, whereas the mutual transfer area of unused land and grassland between 2015 and 2020 was 0.9 times the total transfer area in the past 20 years. The transfer between forest and grassland remained between 200 and 500 km2 until 2015, and then exceeded 2000 km2 from 2015 to 2020. Despite these, the overall mutual transfer area between the two categories has remained roughly balanced over the past 20 years. In summary, the total area of land category mutual transfers during 2015–2020 was the largest, followed by 2005–2010.
The spatial concentration of cropland conversion to grassland is particularly evident in the Yellow River region. In the PL area, grassland growth was the most significant, with a total increase of 678 km2 over 20 years, exhibiting an overall uniform expansion pattern. In 6 out of 14 cities (BY, JYG, JC, JQ, WW, and ZY), the area of cropland converted to grassland was smaller than the area of grassland converted to cropland. Among all cities, QY had the largest area of cropland converted to grassland, totaling 1213 km2, followed by PL, DX, LN, TS, and BY. Smaller areas of cropland conversion to grassland were observed in JQ and JC, totaling 28 km2 and 16 km2, respectively. Conversely, QY, LN, and BY saw more grasslands converted to croplands, with areas ranging from 400 to 600 km2.
From 2000 to 2020, the single land use dynamic degree in Gansu Province followed the order of grassland, unused land, water, forest, cropland, and construction land (see Table 3). The area of cropland decreased consistently over 20 years, showing fluctuating trends in its dynamic degree, with a more rapid decline from 2005 to 2010 and 2015 to 2020. The dynamic degree of the forest exhibited fluctuating movements, with stable growth from 2000 to 2010 and a slight decline from 2010 to 2015, during which time the movement was the least in the 20 years, and almost stagnant growth between 2015 and 2020. The dynamic degree of grasslands remained minimal throughout 2000–2020, with only a slight decrease between 2010 and 2015. Before 2005, the water area gradually decreased, then sharply increased by 251 km2 from 2005 to 2010. Between 2010 and 2015, the water area decreased slightly; however, from 2015 to 2020, it surged again by 332 km2, reaching a peak dynamic degree of 1.863%. This reflects the intensified efforts in ecological restoration and environmental protection. The dynamic degree of construction land continued to increase significantly, peaking from 2015 to 2020 (3.362%). In contrast, the dynamic degree of unused land showed the opposite trend, consistently decreasing, with its area shrinking by as much as 938 km2 from 2000 to 2005.
The fluctuations in the degree of integrated land use dynamics from 2000 to 2020 were small, with values increasing in the following order: 2010–2015, 2000–2005, 2005–2010, and 2015–2020. The negative growth trends in cropland and unused land over the past 20 years were primarily due to the large-scale conversion of cropland to grassland and construction land, and the transformation of unused land into ecological areas, such as grassland and water.

4.2. Analysis of PM2.5 PWE for Different Land Use Types

Owing to differences in population and economic scales, PM2.5 exposure varies among counties, even within the same city [44]. Focusing on the three-level spatial scales of province, city, and county in Gansu Province, China, this study integrates multi-source data and employs high-resolution imagery data with a spatial resolution of 1 km × 1 km to explore the PM2.5 PWE across different land use types in Gansu Province from 2000 to 2020, aiming to better understand of the dynamic features and regional differences in the spatiotemporal patterns of PM2.5 PWE across land use types, thereby providing a crucial basis for the accurate calculation and optimization of PM2.5 PWE.

4.2.1. Province Level
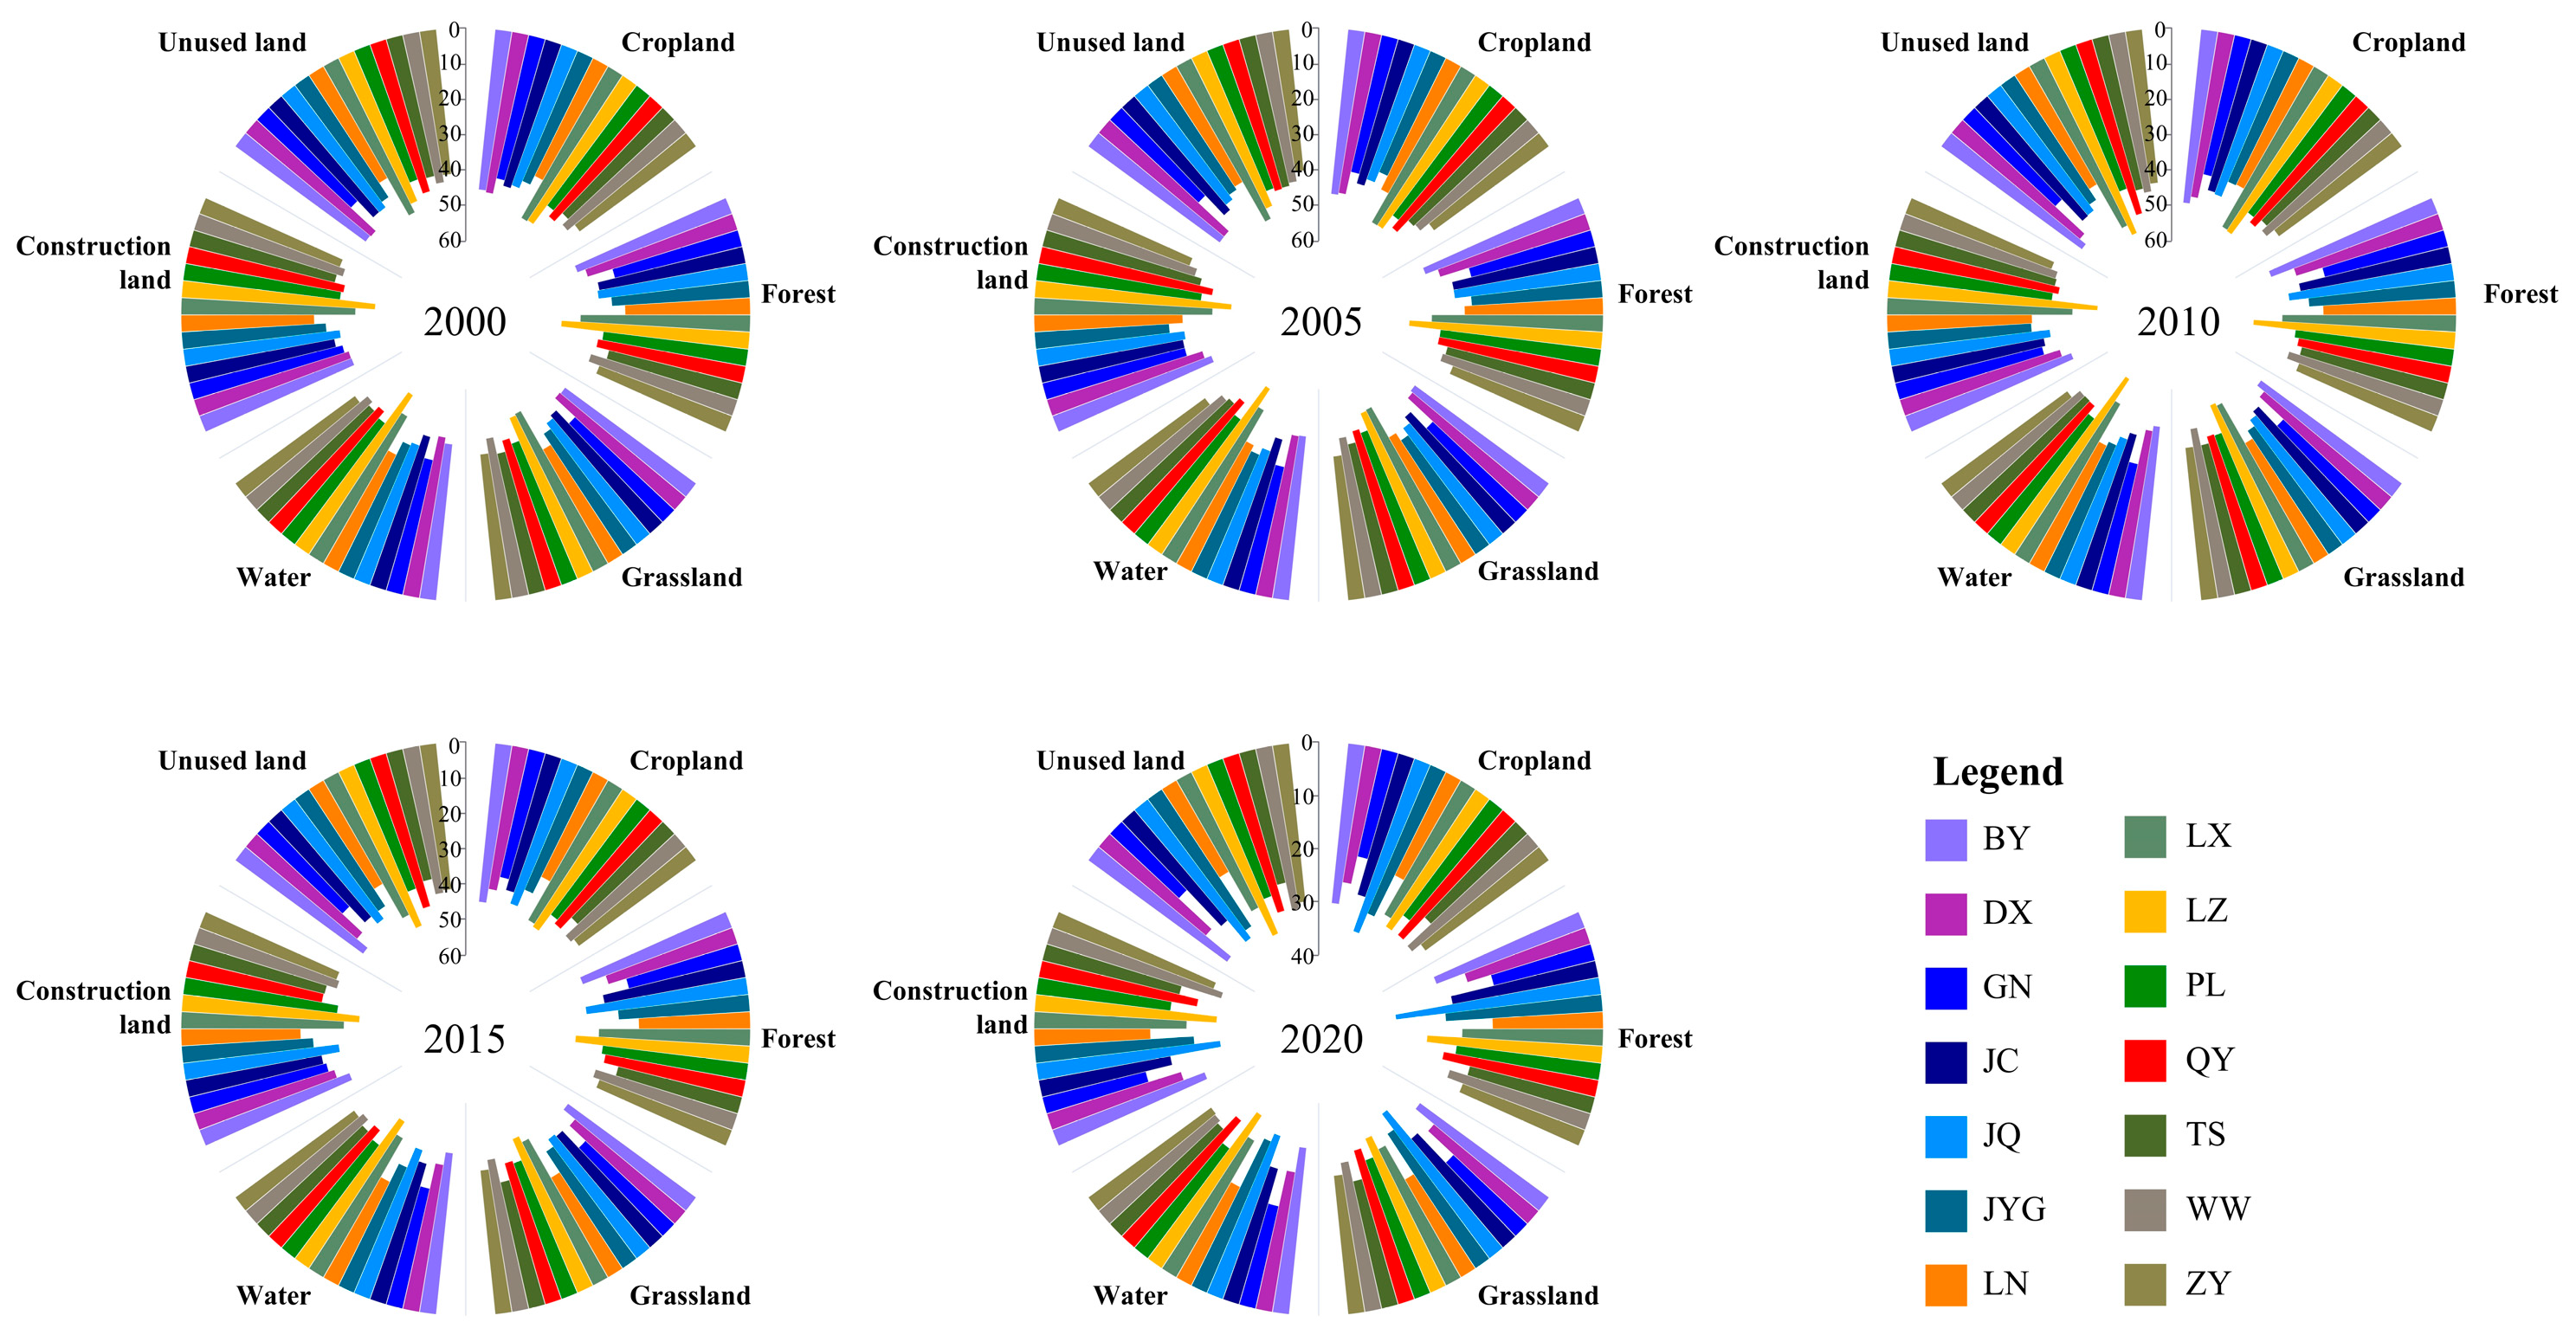
The annual and four-season PM2.5 PWE for different land types in Gansu Province from 2000 to 2020 are shown in Figure 4. PM2.5 PWE varied across diverse land use types, with annual PM2.5 exposure ranging from 26.45 µg/m3 to 51.67 µg/m3. The lowest value occurred in the forest in 2020, which was below the annual average limit of WHO Interim Target 1 (see Table 4). The highest value was found on construction land in 2010, significantly exceeding the annual average concentration limit set by the China Ambient Air Quality Standard (CAAQS, GB 3095–2012). The overall trend in annual PM2.5 exposure across all land use types showed a gradual increase, followed by a rapid decrease, with 2010 marking the turning point when the annual exposure to PM2.5 shifted from increasing to decreasing.
Construction land consistently had the highest annual PM2.5 PWE throughout the study period. Although the overall PM2.5 exposure in Gansu Province decreased after 2010 and the PM2.5 PWE on construction land declined at the highest annual rate from 2015 to 2020 (2.80 µg/m3/yr), construction land still had the highest exposure. By 2020, the PM2.5 PWE on construction land in Gansu Province (31.07 µg/m3) was slightly below the annual average concentration limit set by CAAQS, though it still exceeded the annual average limit of the WHO Interim Targets 2. Except for 2005, the forest consistently had the lowest annual PM2.5 PWE over the past 20 years, showing a slow increase from 2000 to 2005 (0.56 µg/m3/yr) followed by a steady decline in subsequent years.
The PM2.5 PWE across all land use types in Gansu Province showed significant seasonal variations. Overall, PM2.5 exposure on each land use type was highest in winter, with the peak occurring on construction land in the winter of 2010, reaching a value of 75.45 µg/m3, indicating heavy air pollution. In contrast, PM2.5 exposure across all land use types was lowest in summer, with grassland in the summer of 2020 showing the lowest value at 14.86 µg/m3, slightly below the annual average limit of the WHO Interim Targets 3. During the study period, construction land consistently had the highest PM2.5 exposure in the fall (44.18 µg/m3), whereas grassland had the lowest exposure (23.96 µg/m3). Spring PM2.5 exposure from 2000 to 2020 ranged from 25.13 µg/m3 to 57.04 µg/m3, exhibiting variability similar to that of the annual PM2.5 exposure. The minimum value occurred in the forest in 2020, whereas the maximum was in construction land in 2010, consistent with the annual exposure pattern. Overall, as illustrated in Figure 4, the distribution of PM2.5 PWE across land use types in Gansu Province followed a U-shaped pattern, with higher levels in winter and spring and lower levels in summer and fall. Construction land had the highest exposure throughout all seasons.

4.2.2. City Level

The PM2.5 PWE for different land use types at the city level in Gansu Province is shown in Figure 5. Annual PM2.5 exposure ranged from 17.81 µg/m3 (GN, 2020) to 59.80 µg/m3 (LZ, 2010). PM2.5 exposure across the 14 cities increased from 2000 to 2010 and then decreased from 2010 to 2020. Most cities with high PM2.5 exposure across different land use types were located in central and northwestern Gansu. LZ was the only city that ranked among the top three for PM2.5 exposure across all land use types at every time point during the study period. Its PM2.5 exposure on construction land was the highest from 2000 to 2015 before dropping to third place in 2020. In 2020, JQ had the highest exposure (35.12 µg/m3), followed by WW, which rose from ninth place in 2000 to second place (34.59 µg/m3). In contrast, cities with low PM2.5 exposure across different land use types were mainly concentrated in southern Gansu. Except for construction land, the PM2.5 exposure of LN and GN to land types such as cropland, forest, and grassland consistently ranked between 10th and 14th among the 14 cities from 2000 to 2020. In 2000, the PM2.5 exposure on construction land in GN was 44.85 µg/m3, the highest in the region during the study period, and ranked 7th among the 14 cities. By 2020, the PM2.5 exposure on construction land in GN decreased to 20.18 µg/m3, the lowest among the 14 cities in Gansu Province and below the annual average limit of WHO Interim Targets 2. LN had the highest PM2.5 exposure on construction land (42.22 µg/m3) in 2005, after which it declined. By 2020, this exposure was only higher than that of GN.
From 2000 to 2010, PM2.5 exposure on forest and construction land increased in 85.7% of Gansu Province (12 of 14 cities/prefectures). Among these, PM2.5 exposure on construction land in LZ, BY, and TS showed rapid growth, with an annual increase exceeding 0.4 µg/m3/yr. For other land use types, areas with increased PM2.5 exposure accounted for 92.9% of the Gansu, and only the GN among the 14 cities showed a decreasing trend in PM2.5 exposure across all land use types. In addition, forest areas in DX and construction land areas in JYG showed a slight decrease in PM2.5 exposure during the first 10 years. From 2010 to 2020, all cities in Gansu Province exhibited a decline in PM2.5 exposure across all land types, especially in areas LZ and LX, where the reduction in PM2.5 exposure exceeded 2 µg/m3/yr across all land use types.

4.2.3. County Level

Figure 6 shows the PM2.5 PWE for different land use types at the county level, with annual PM2.5 exposures ranging from 15.61 µg/m3 in Maqu County in 2020 to 62.06 µg/m3 in Anning District in 2010. The county-level PM2.5 PWE mirrored that of the city level, showing increased exposure before 2010, followed by significant decreases after 2010. In 2010, across various land use types, high-exposure areas were relatively consistent and mainly concentrated in central Gansu and along its borders with Xinjiang and Shaanxi provinces. Among these areas, PM2.5 exposure on construction land exceeded 35 µg/m3 in all districts and counties, with a mean value of 46.51 µg/m3, higher than the average exposure on other land use types. Notably, the central region of the LZ (e.g., Anning and Xigu Districts) consistently ranked among the top five areas for PM2.5 PWE on cropland and construction land. By 2020, high-exposure areas across various land use types narrowed and were primarily concentrated along the border between Gansu and Xinjiang provinces. In contrast, the distribution of districts with low PM2.5, across various land use types, mainly in southern Gansu Province, remained relatively stable throughout the study period. For instance, Wen County, located at the southernmost point of the province, consistently ranked between 82nd and 87th out of 87 counties in Gansu (including JYG) for PM2.5 PWE on cropland and construction land.
As shown in Figure 6, from 2000 to 2010, the number of districts and counties in Gansu Province with increasing PM2.5 and exposure to different land use types accounted for 83.90% to 88.50% of the total districts and counties in the province. The upward trend was particularly evident in the central and northwestern regions, especially in Xigu District (LZ), where the fastest growth in PM2.5 exposure occurred on construction land, with an annual increase of 0.68 µg/m3/yr, ranking highest. In contrast, some districts and counties in southeastern and southern Gansu slightly decreased across all land use types, with none exceeding 4 µg/m3. After 2010, all districts and counties exhibited a decline in PM2.5 exposure across all land types, especially on construction land. The average reduction in exposure was 18.42 µg/m3 per district and county over 10 years, with a standard deviation of 4.13 and a median of 18.87 µg/m3. The top five largest reductions were observed in LZ and southern LX.

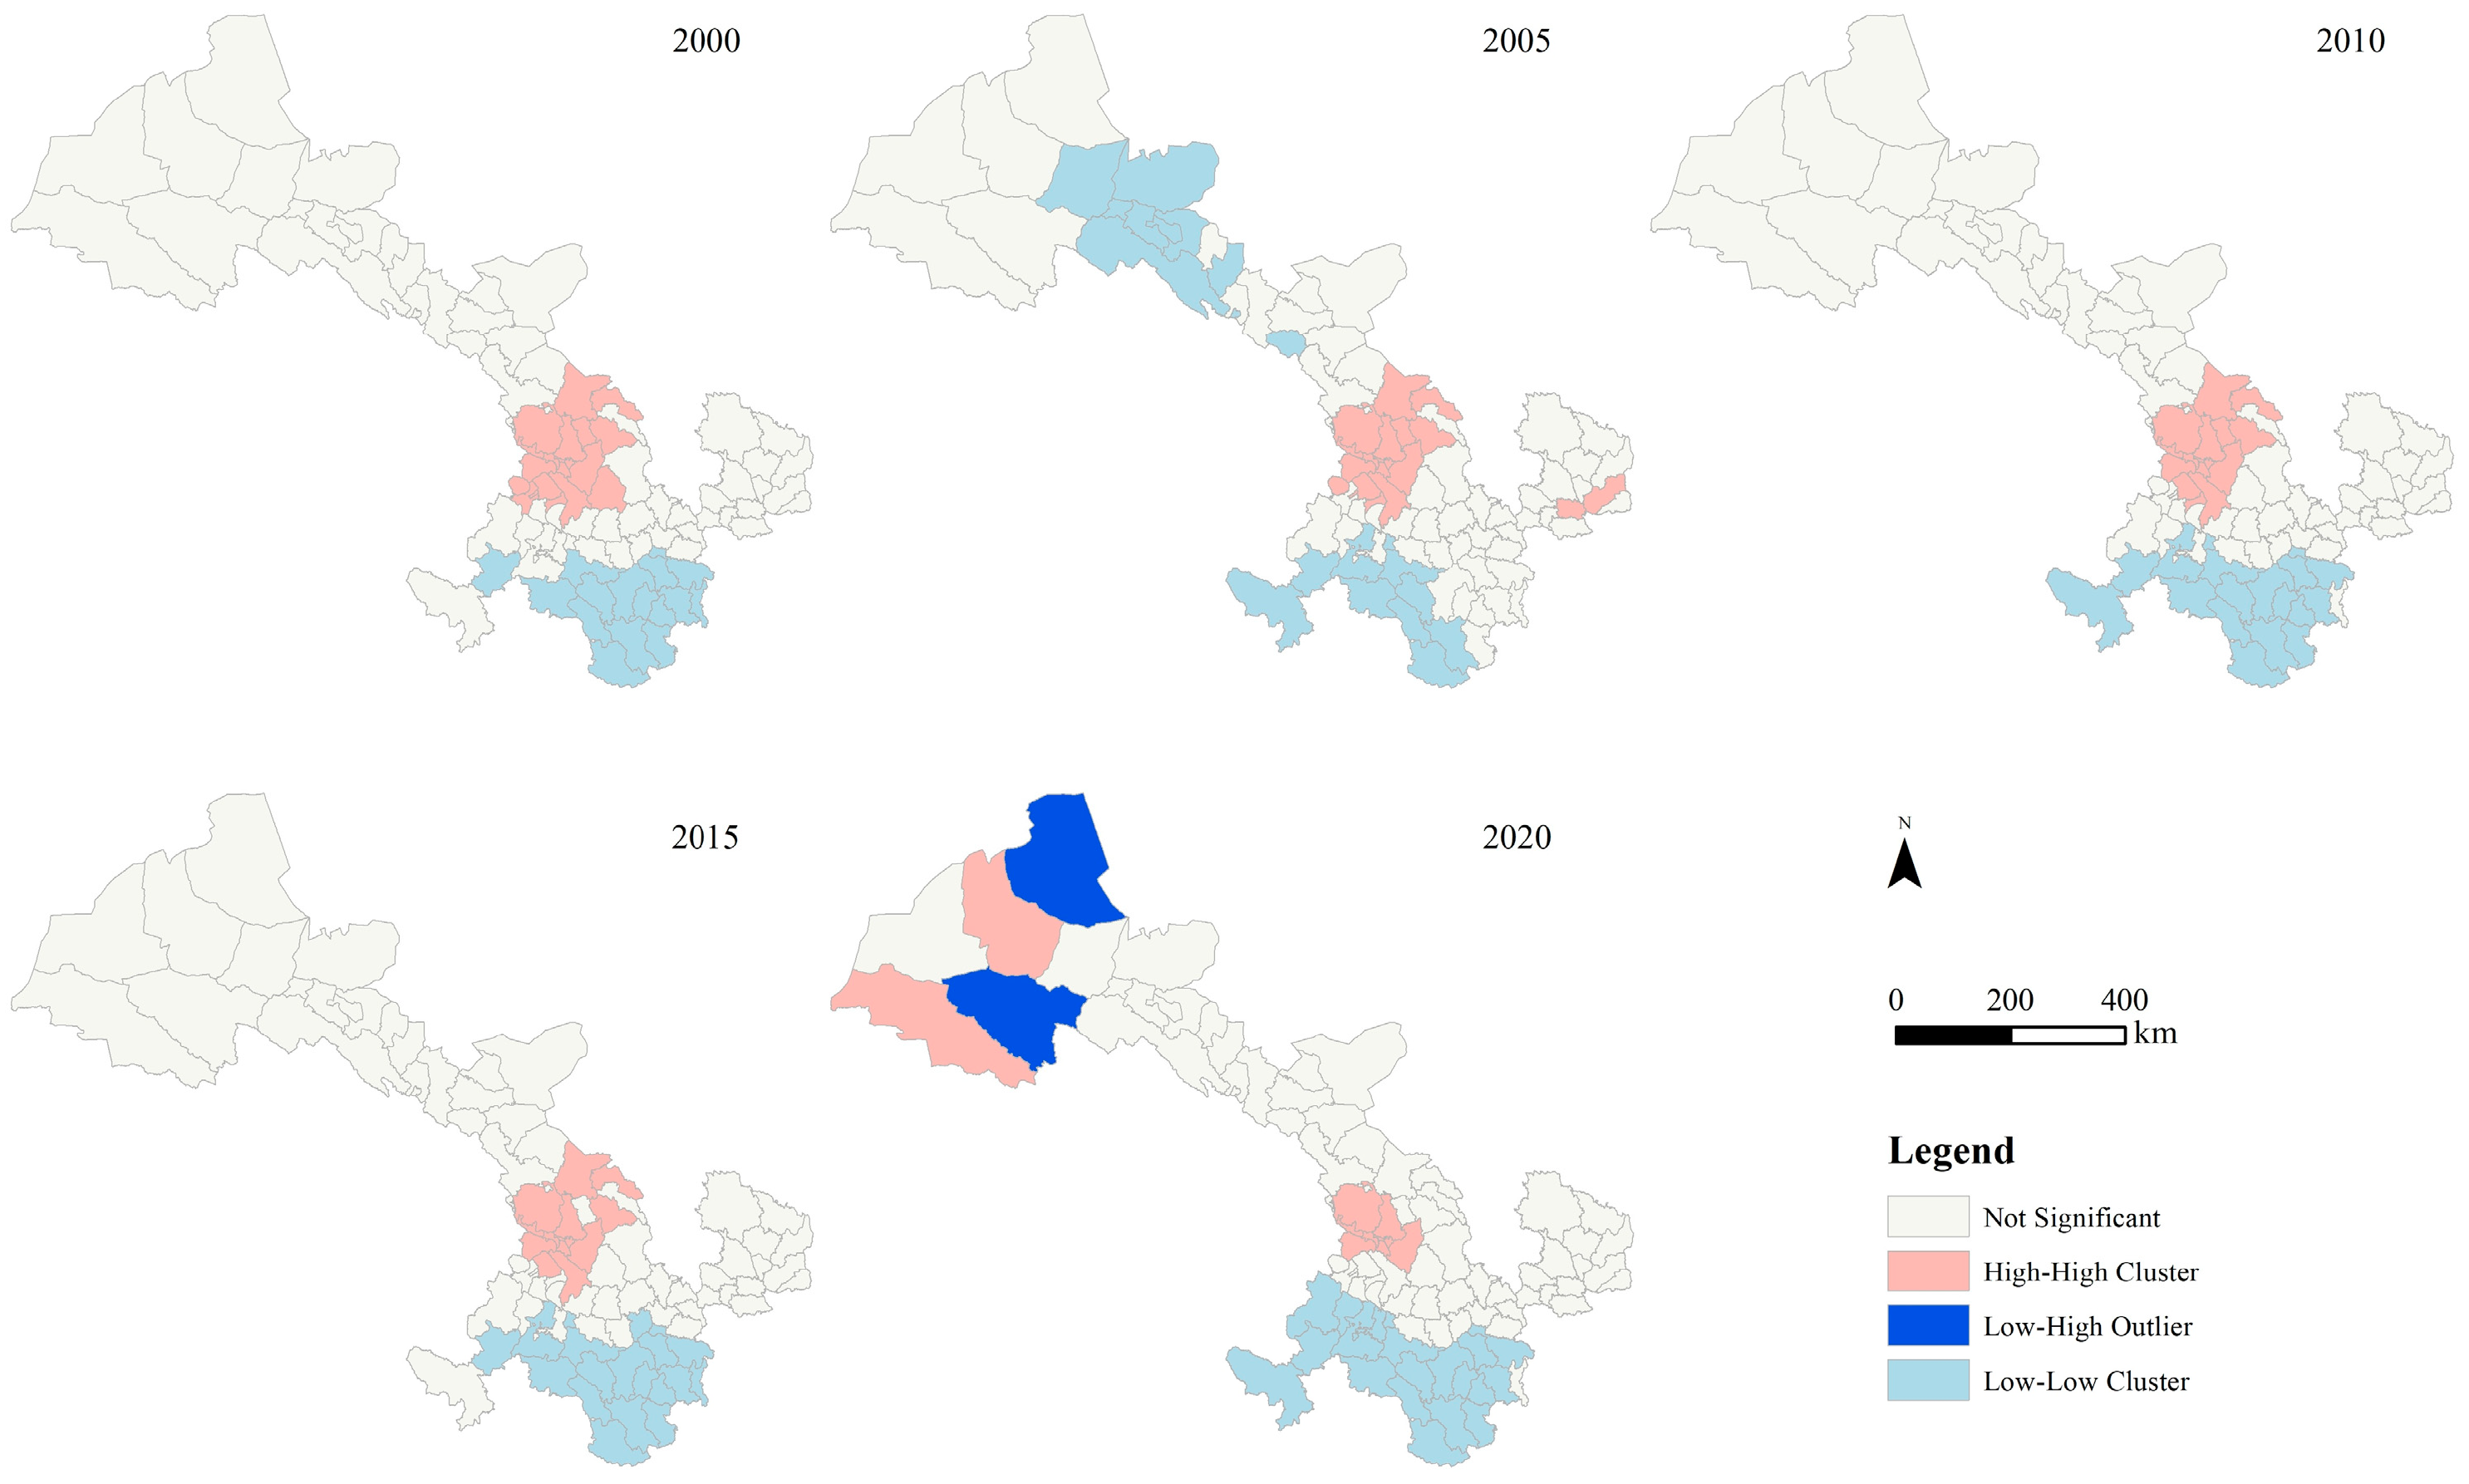
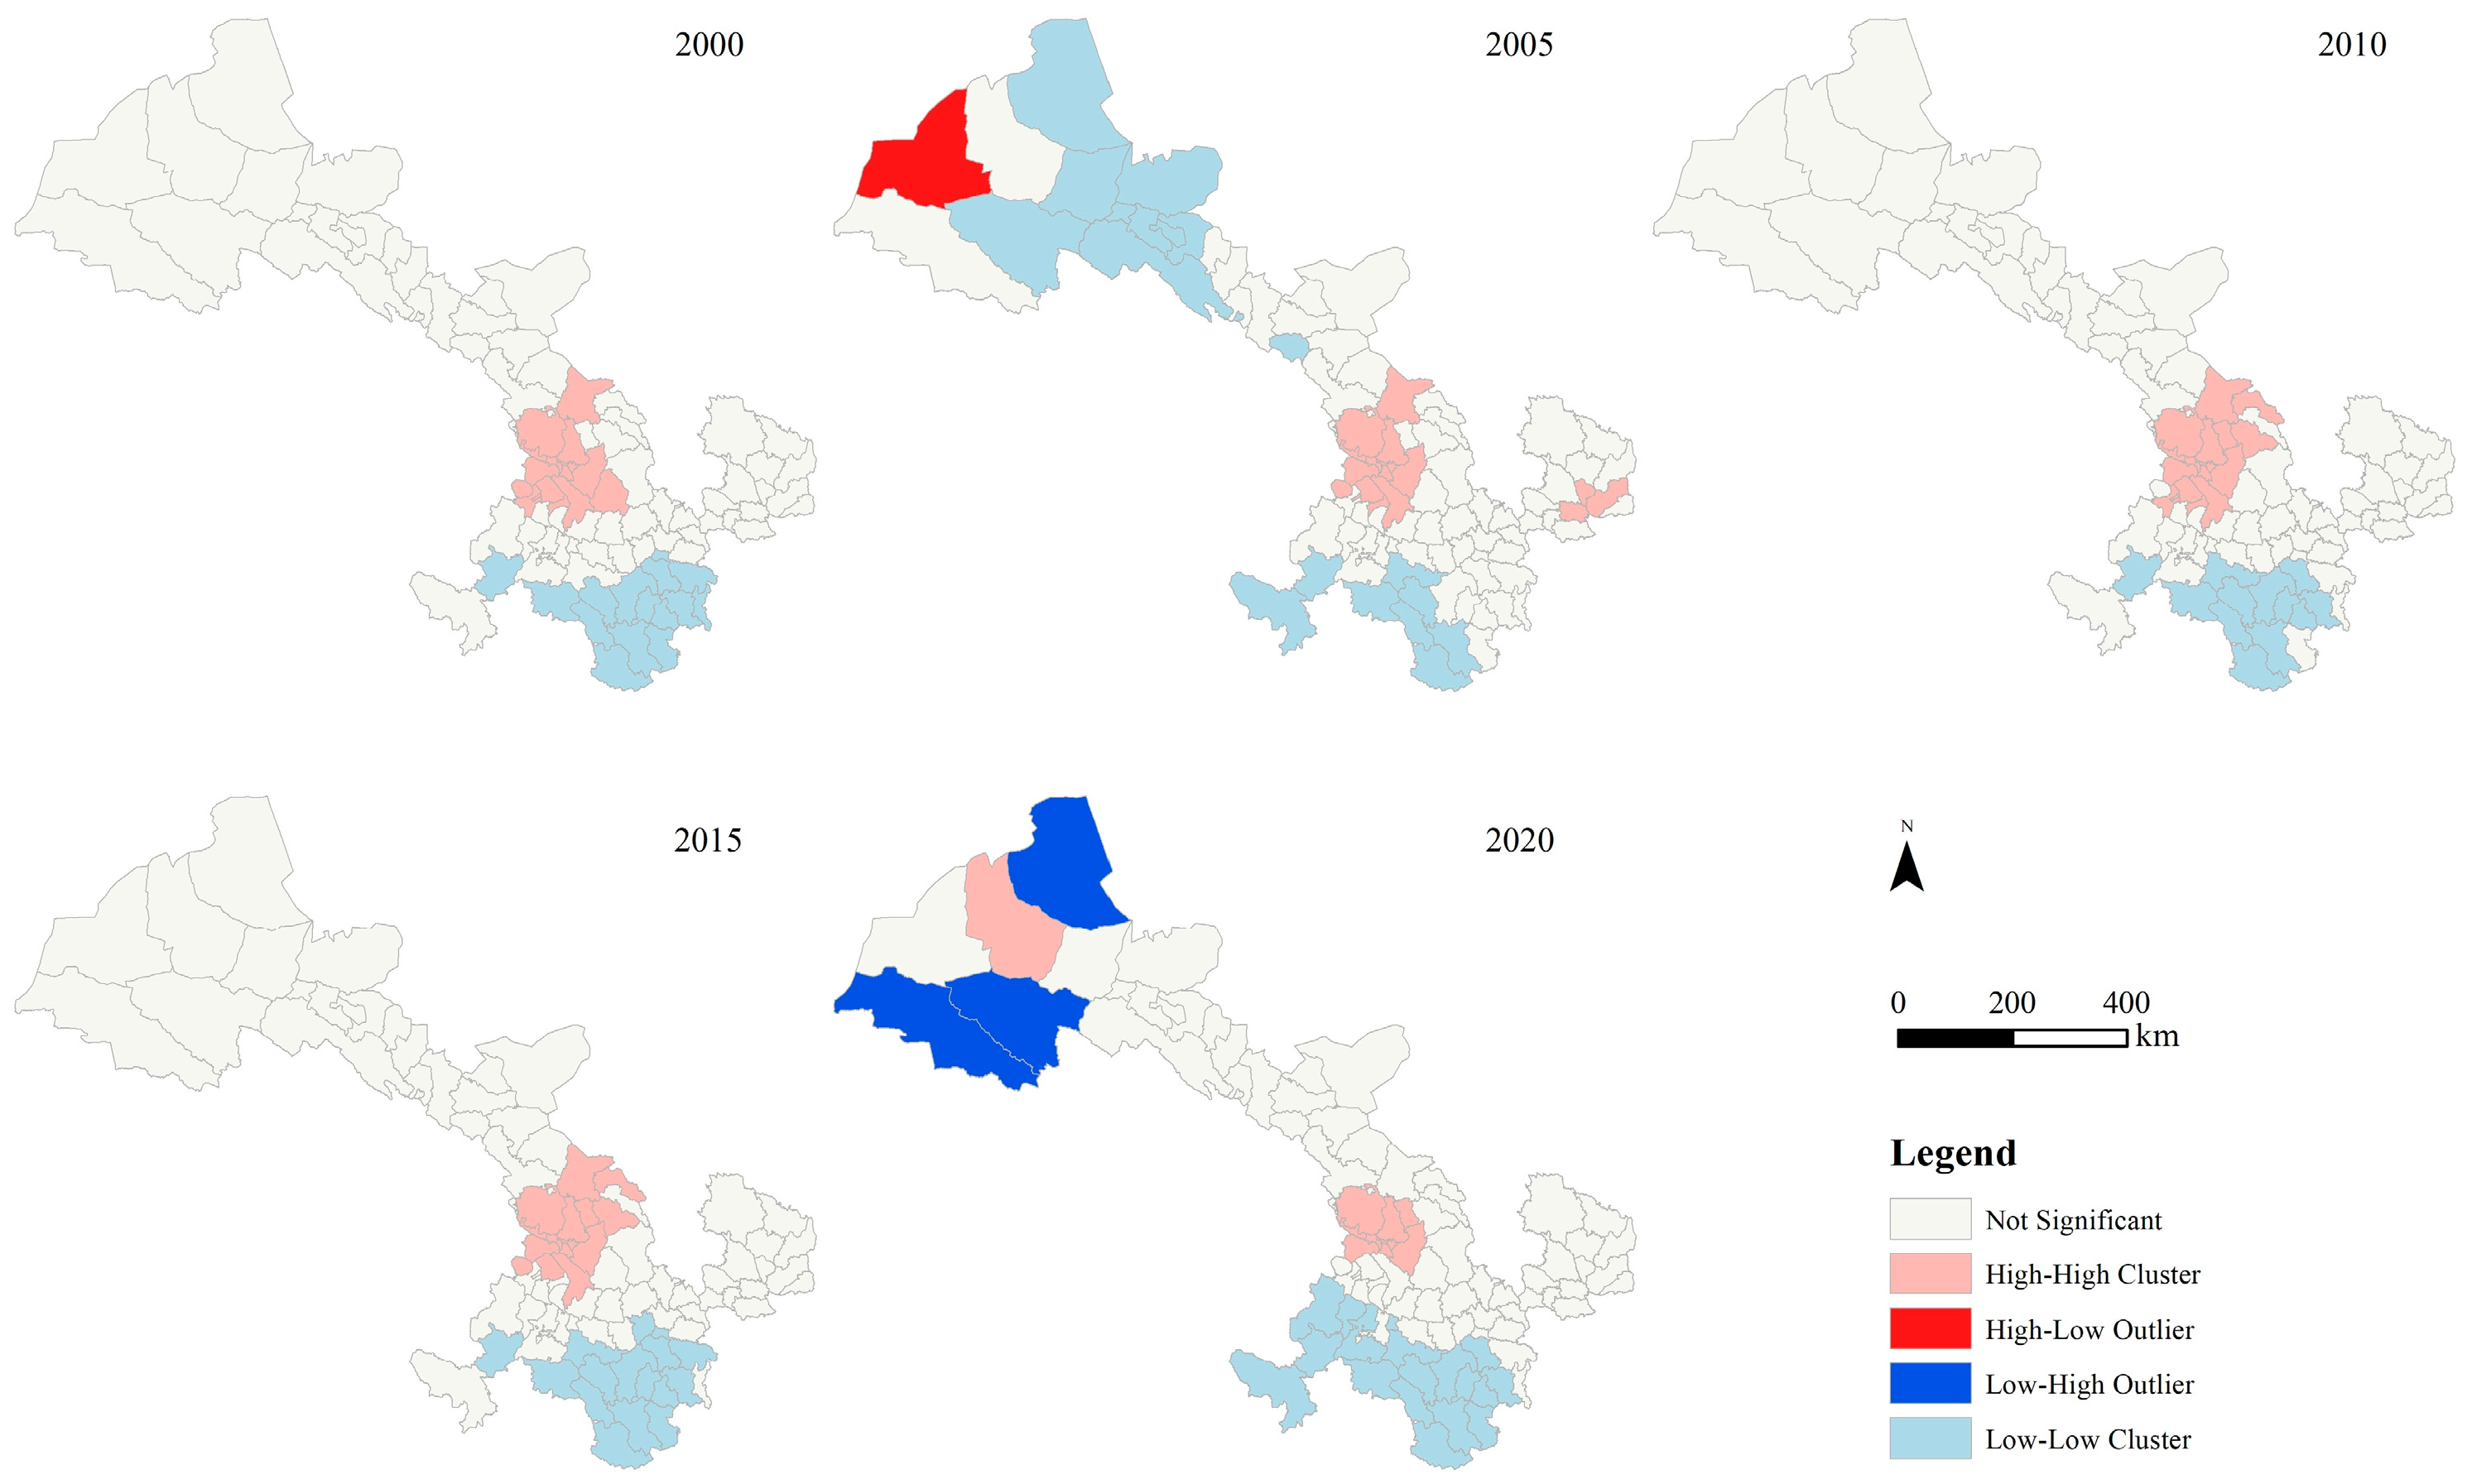
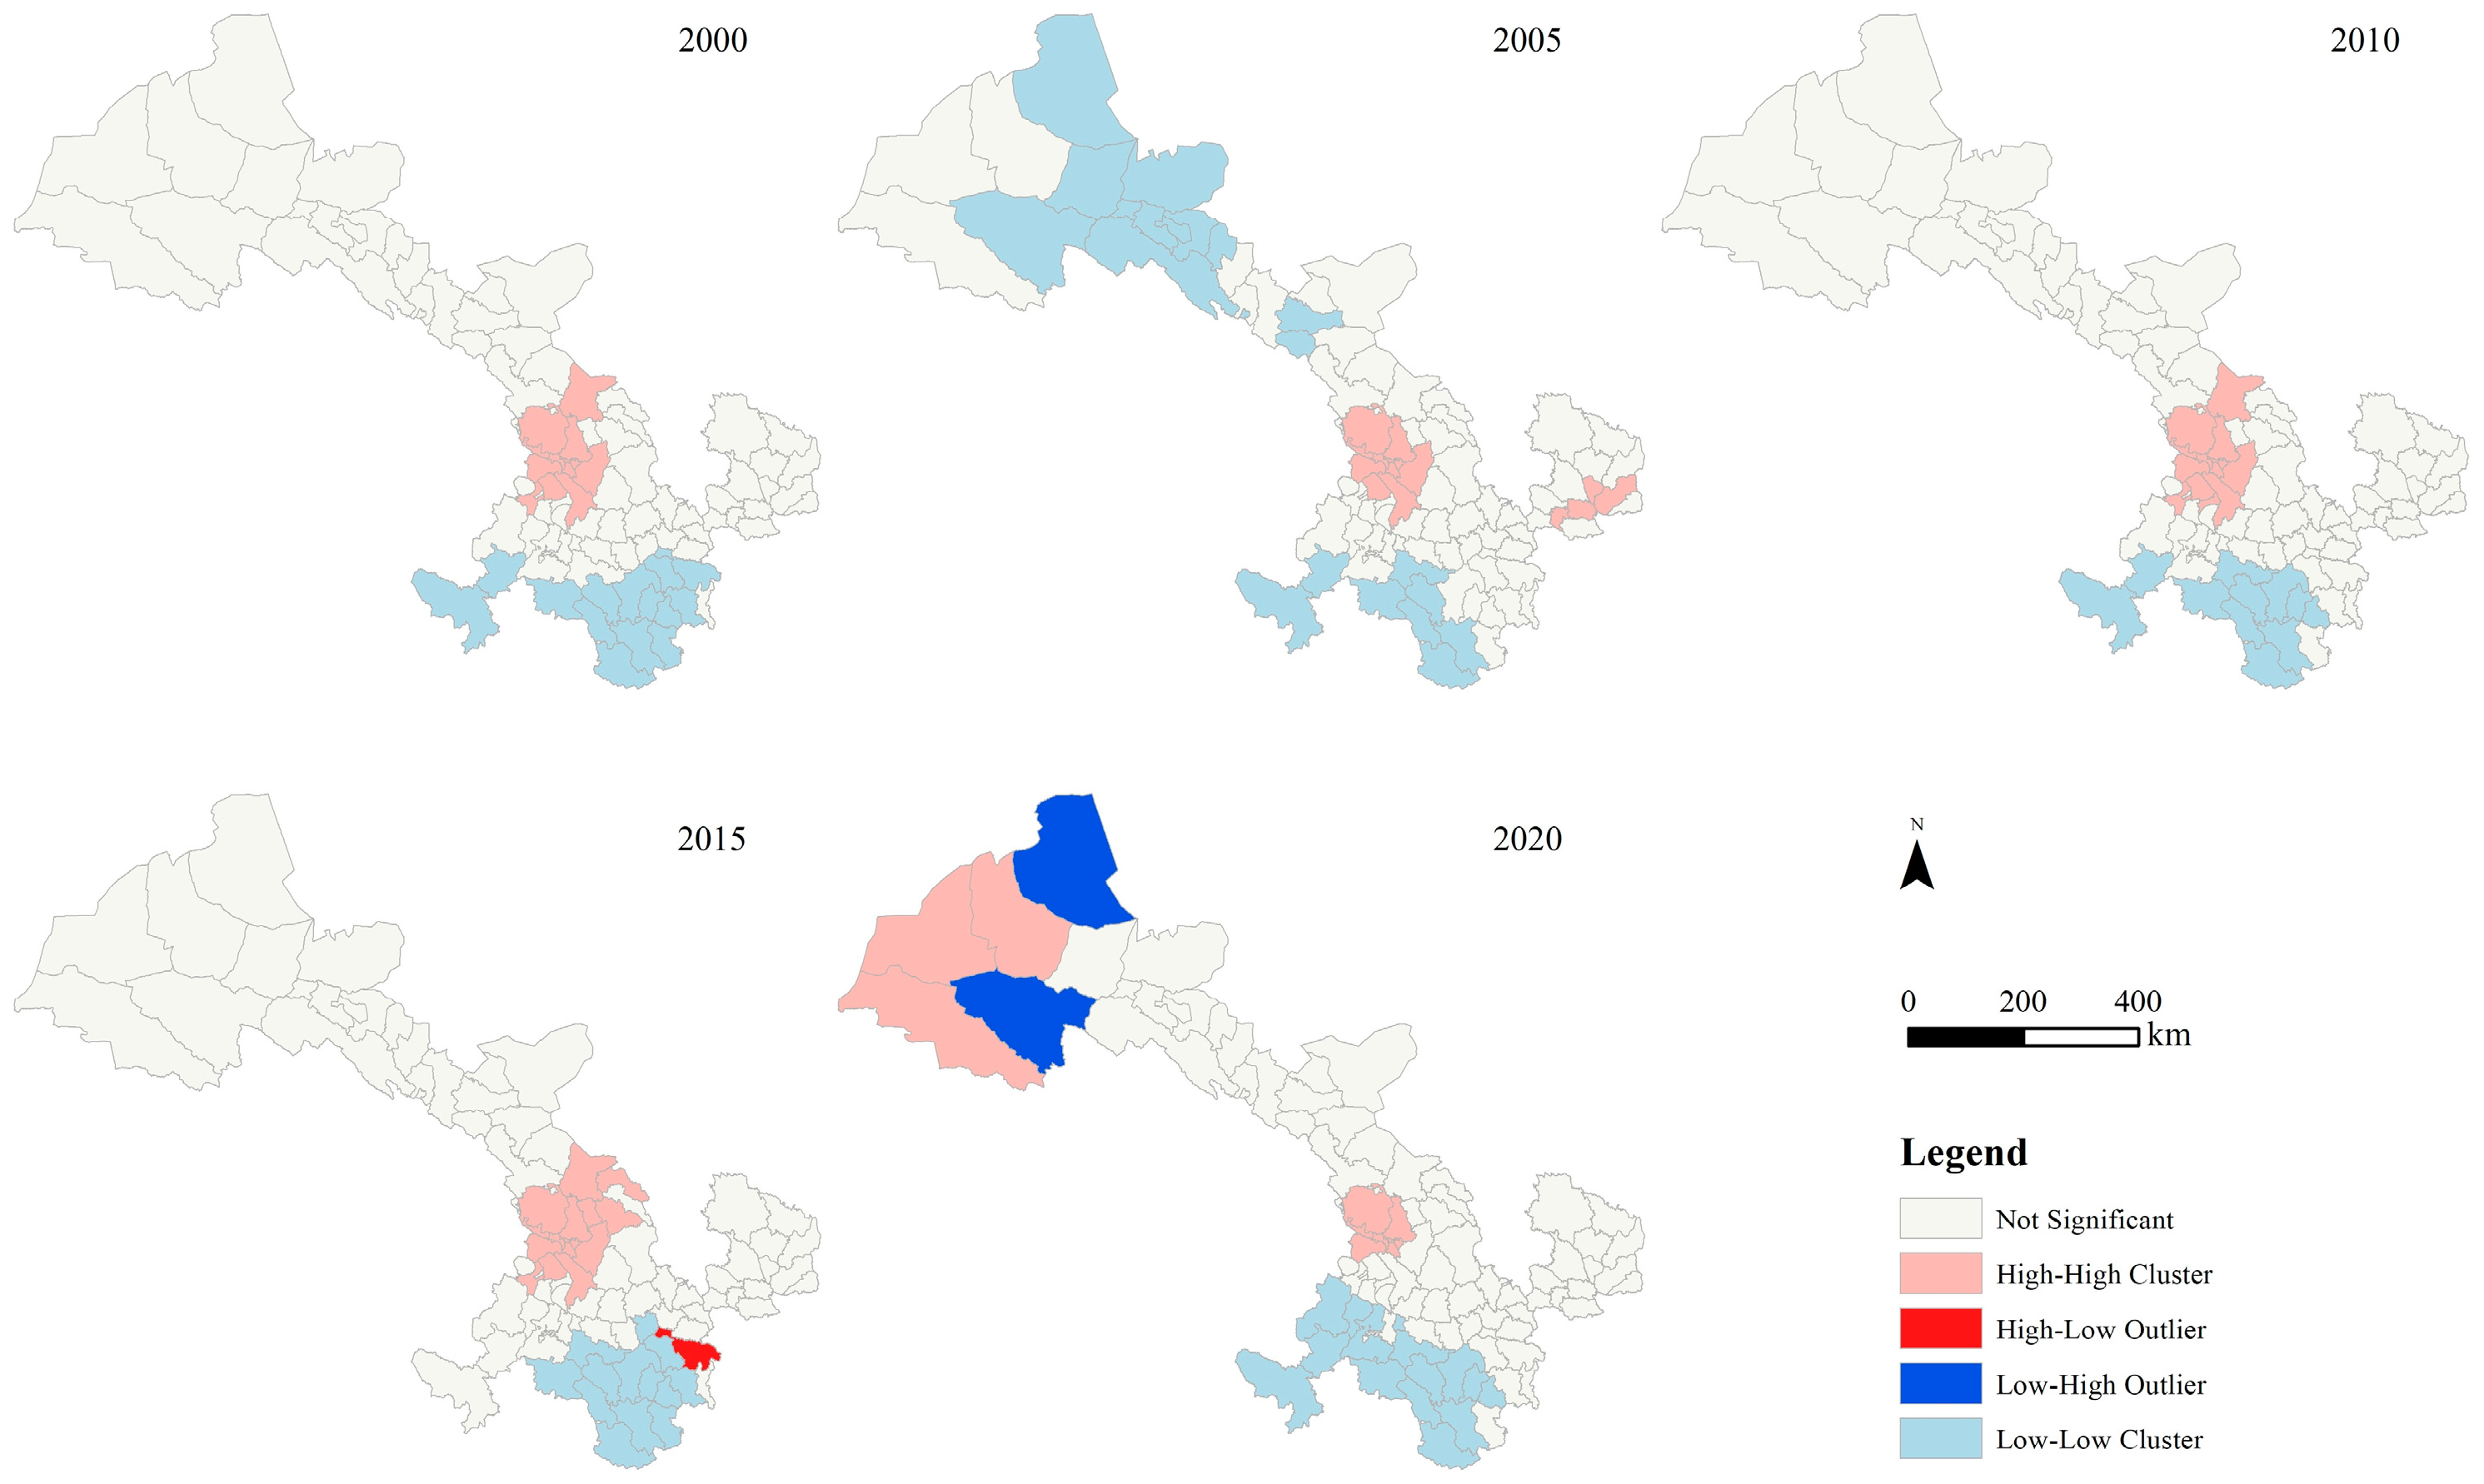
4.3. Spatial Clustering Patterns of PM2.5 PWE for Different Land Use Types

Gansu Province faces limited and unevenly distributed water resources, with unused land primarily located in northern areas such as ZY and JQ. Consequently, in some counties, the exclusion of water and unused land from land use classification results in significant gaps in PM2.5 PWE data. Since Moran’s I index depends on the average value of the data, which relies on numerical summation, these missing values can make the average value unreliable, potentially distorting results [57]. Therefore, this study calculated the global Moran’s I index for PM2.5 PWE for each land type, excluding water and unused land at the county level in Gansu Province from 2000 to 2020. ArcGIS 10.8 was used to assess the evolving spatiotemporal pattern of PM2.5 PWE across different land types in the province over the past 20 years.
During the study period, the global Moran’s I for PM2.5 PWE in cropland, forest, grassland, and construction land in Gansu Province exceeded 0.6 and passed the 0.1% significance test, indicating a high degree of positive spatial correlation. These results indicated that areas with high PM2.5 exposure for these four land use types showed significant clustering, as did areas with low exposure. As shown in Table 5, the spatial clustering of PM2.5 exposure was strongest in cropland. Moran’s I for cropland was 0.725 in 2020 and exceeded this value in all other years, demonstrating significant positive clustering. In contrast, Moran’s I for construction land was smaller, with little fluctuation over the past 20 years. The index reached a maximum of 0.736 in 2005 and a minimum of 0.644 in 2020. Moran’s I followed a similar trend in forest and grassland. From 2000 to 2015, these values remained relatively stable, fluctuating around 0.8. However, by 2020, the global Moran’s I for both land use types had fallen to their respective minimum values during the study period. Despite this decline, a high degree of positive spatial correlation persisted.
To explore the spatial distribution and clustering characteristics of PM2.5 exposure across different land use types in the counties of Gansu Province, a local spatial autocorrelation analysis was conducted using ArcGIS 10.8. The spatial correlation for various land use types (excluding water and unused land) was classified into four types: (1) high-exposure counties clustered together (high–high), (2) low-exposure counties clustered together (low–low), (3) high-exposure counties surrounded predominantly by low-exposure counties (high–low), and (4) low-exposure counties surrounded predominantly by high-exposure counties (low–high). These local spatial clustering characteristics were visualized using Local Indicators of Spatial Association (LISA) plots. A LISA plot for construction land is presented in Figure 7, with plots for other land types available in Figure A1, Figure A2 and Figure A3 in Appendix A.
The results indicated that the local spatial clustering characteristics of PM2.5 exposure to construction land in Gansu Province were primarily dominated by high-high and low-low clusters. High-high clustering was concentrated in central Gansu, including most areas of LZ, BY, northern LX, and parts of QY and PL in the eastern region of Gansu Province. In addition, high-high clustering areas were observed in eastern JQ, situated in the northwestern region of Gansu Province. Conversely, low-low clusters were concentrated in the southern part of Gansu Province, including southern LN and GN, as well as the north-central part of the province, covering certain districts and counties in JQ, JQG, ZY, and JC. In 2015, high-low clustering areas were concentrated in TS, indicating a strong spatial heterogeneity of PM2.5 PWE on construction land. For spatial distribution trends, the concentration of high-high clustering areas in central Gansu gradually contracted, whereas northwestern Gansu gradually evolved into a high-high clustering area. Simultaneously, the concentration of the low-low clustering areas in the southern part of Gansu exhibited unstable fluctuations, and the north-central part of Gansu gradually withdrew from the low-low clustering areas. Other regions remained relatively unchanged.

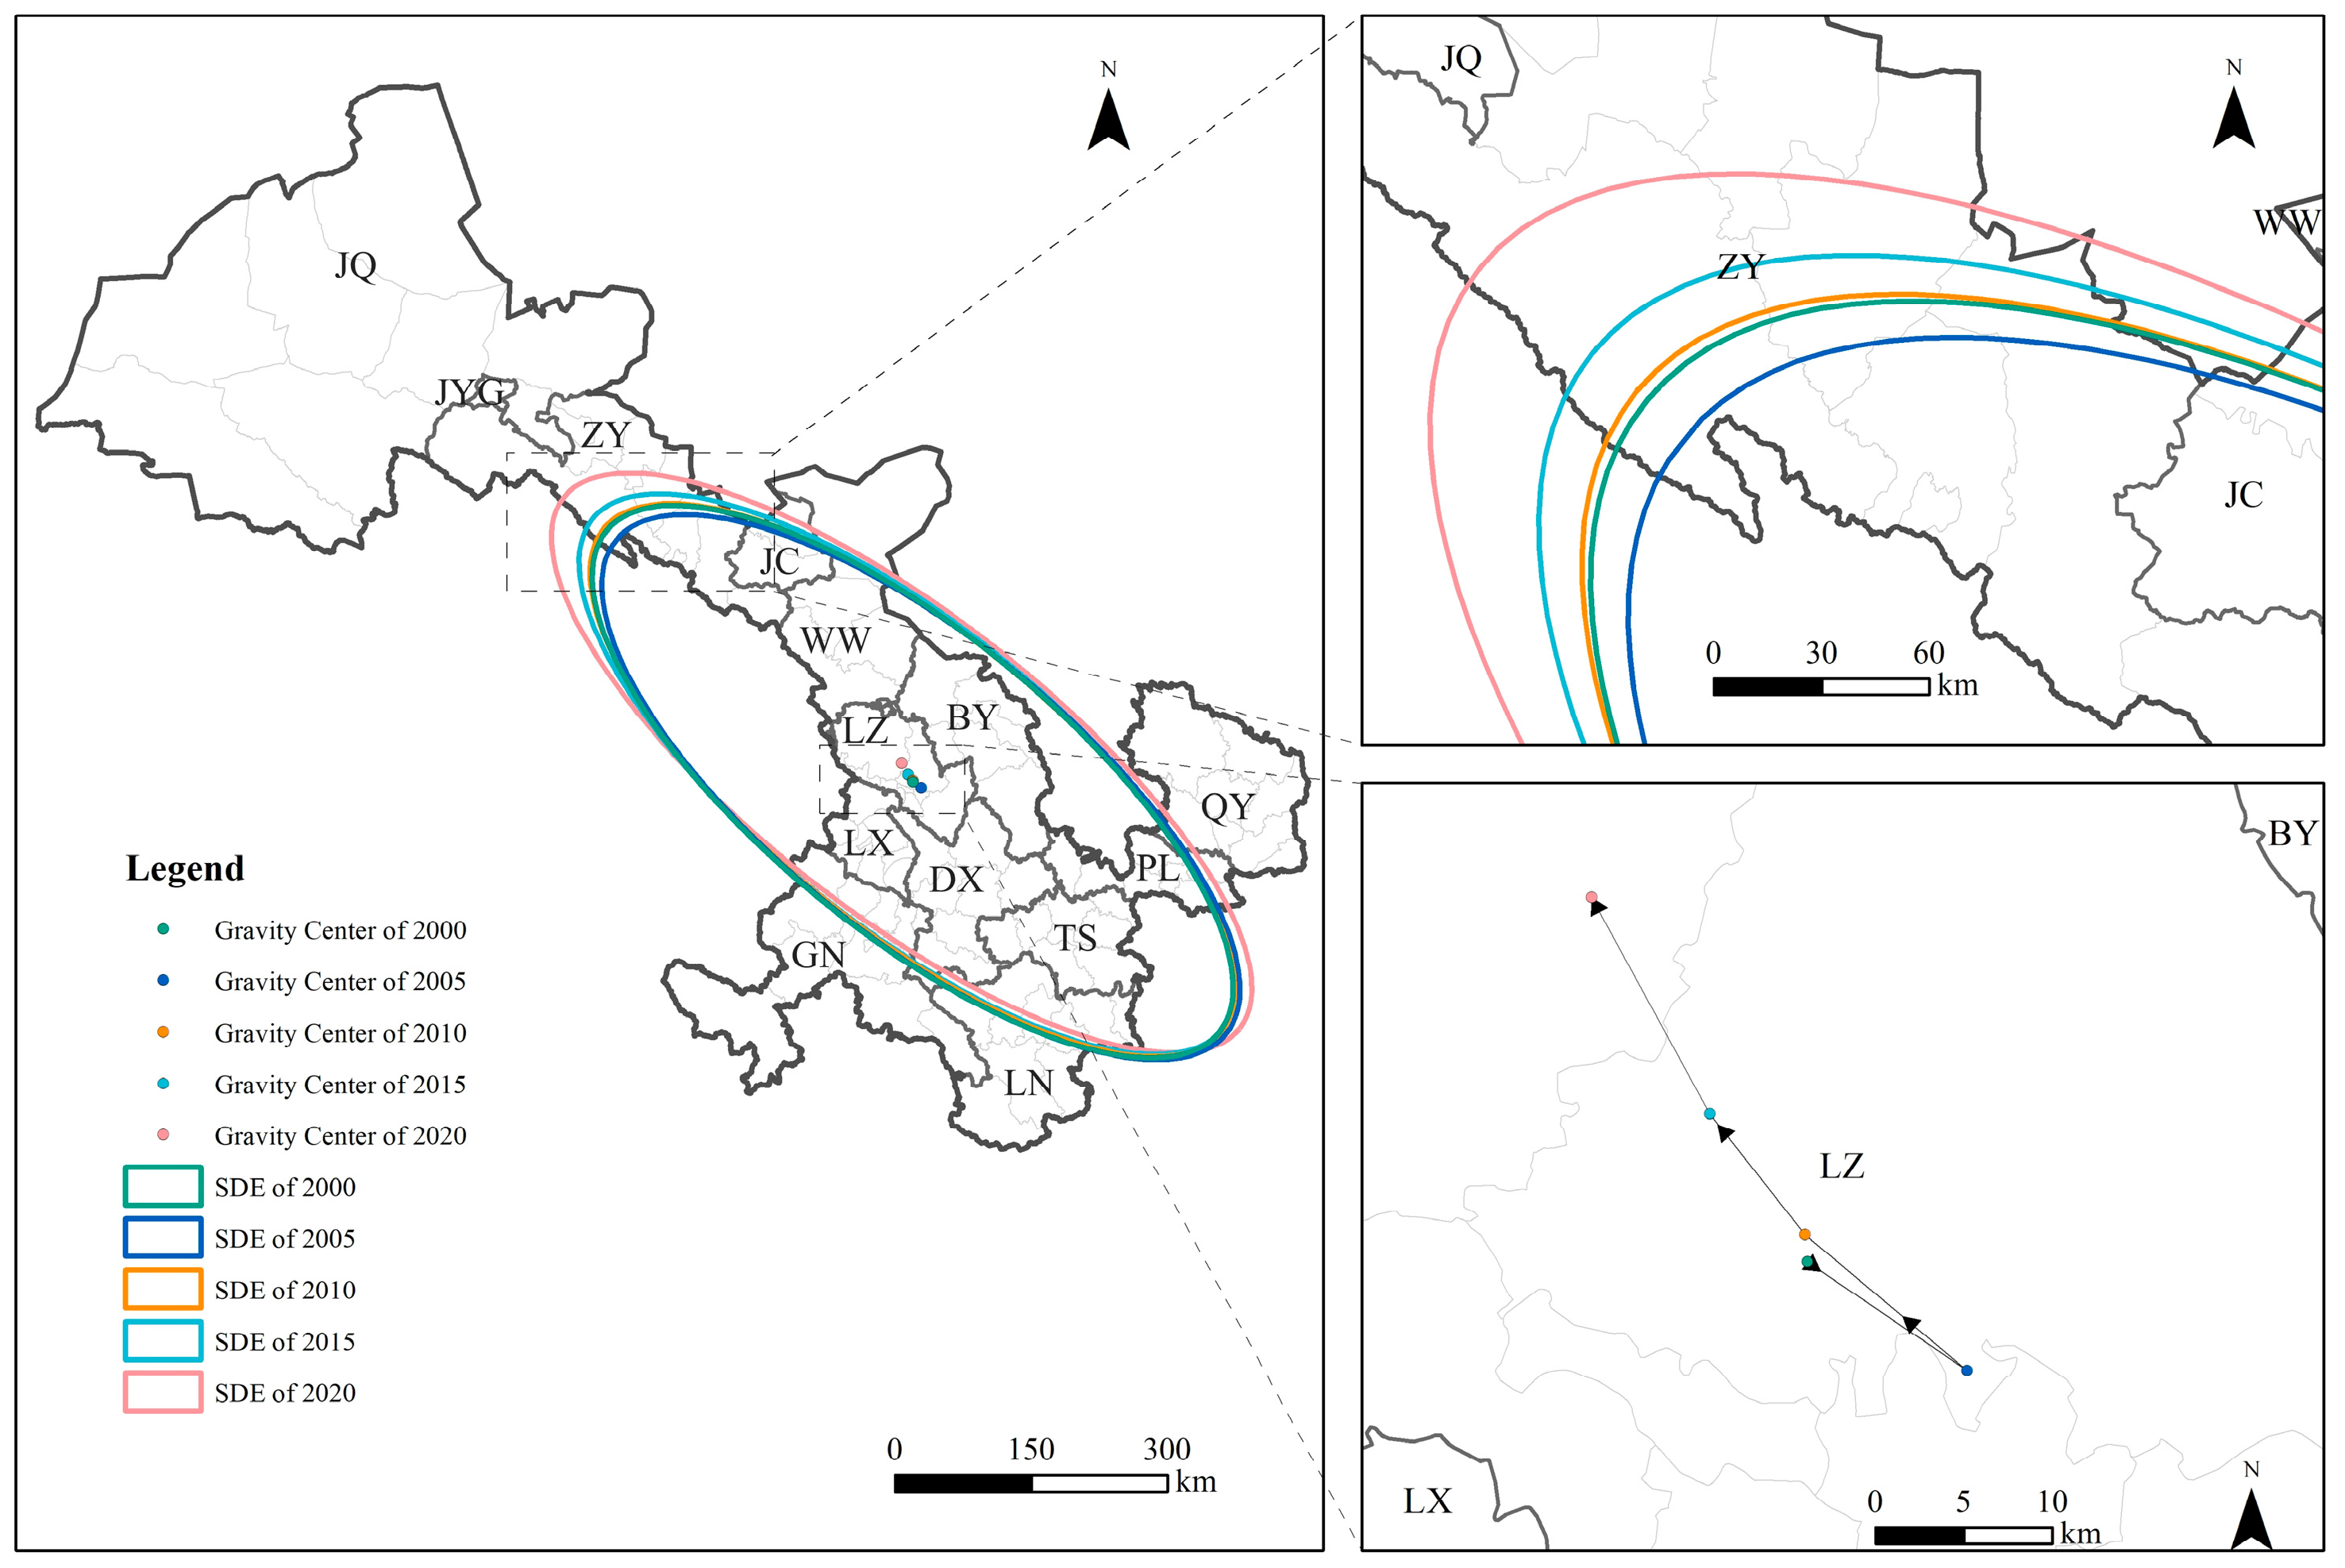
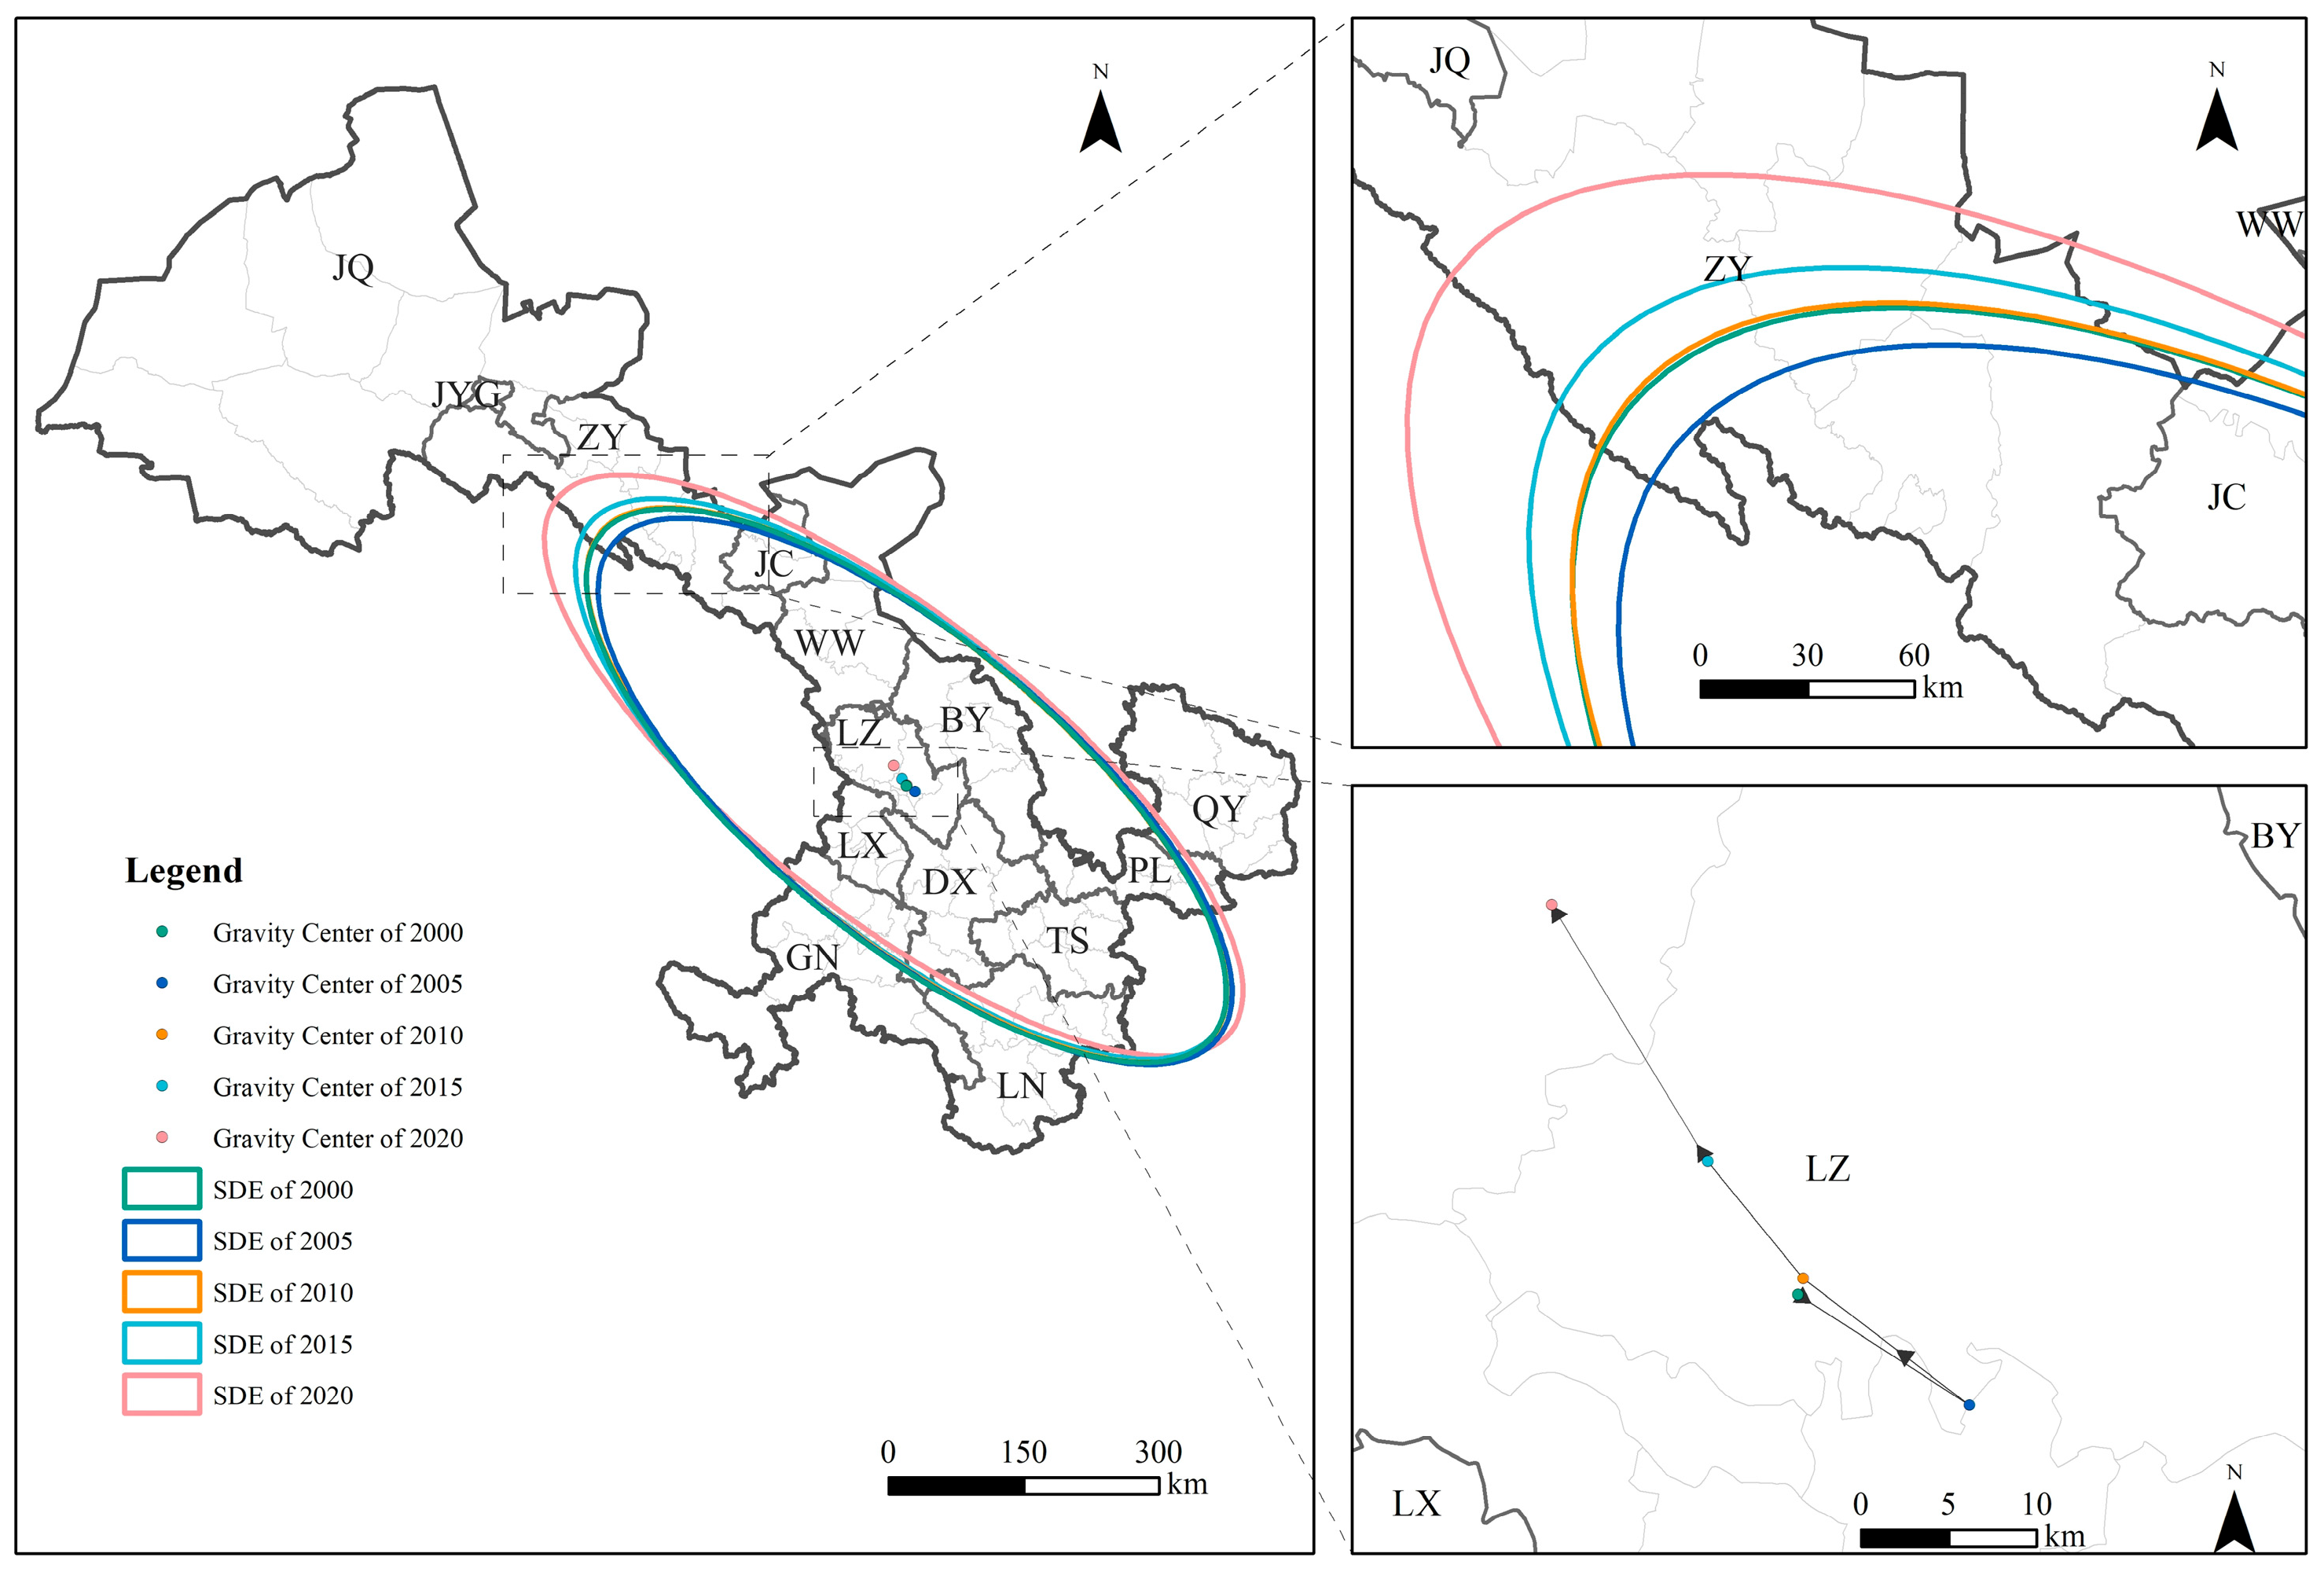
4.4. SDE and Gravity Center Migration Analysis

The SDE, center of gravity values, and spatial migration of the PM2.5 PWE across the four land use types from 2000 to 2020 are presented in this paper (see Table 6). Based on the changes in the SDE, the spatial distribution pattern of PM2.5 exposure across different land use types remains generally stable, with a tilt in the “northwest-southeast” direction. The orientation fluctuated around 129°, and the degree of tilt was relatively large. The results indicated that the range of changes in SDE distribution for each land use type was relatively consistent. From 2000 to 2005, the long half-axis slightly decreased by 4–7 km, followed by an increase from 2005 to 2020. The short half-axis remained relatively unchanged over the past 20 years, exhibiting a high degree of flatness and a directional trend. For cropland, from 2000 to 2005, the long half-axis remained relatively stable, only shortening from 470.840 km to 464.259 km. The short half-axis remained almost unchanged but was relatively shorter, approximately one-third of the long half-axis, with a tendency toward centripetal agglomeration. From 2005 to 2020, the long half-axis increased to 484.658 km, whereas the short half-axis fluctuated slightly during this period, with a difference of approximately 6 km between the maximum and minimum values. This indicated that PM2.5 exposure on cropland exhibited a centripetal distribution during this period.
The center of gravity for PM2.5 exposure across all four land use types during the study period was located near the main urban area of LZ. Its migration process could be divided into two stages. The first stage, from 2000 to 2005, was characterized by a southeastward migration. The second stage, from 2005 to 2020, shows a reverse trend, with the migration direction shifting from southeast to northwest. This shift indicated that PM2.5 exposure levels in northwest Gansu surpassed those in the southeast and southern regions after 2005 for all land use types.
Taking cropland as an example (see Figure A4, Figure A5 and Figure A6 for details of gravity center migration maps for other land use types), the gravity center of PM2.5 exposure from 2000 to 2020 varied in longitude between 103.550° E and 103.836° E and in latitude between 36.131° N and 36.379° N. The migration trajectory showed an overall center of gravity shift northwestward (see Figure 8). By 2020, the gravity center had shifted from Chengguan District in LZ to Lanzhou New Area, with the largest migration distance of 17.046 km occurring between 2015 and 2020. Regarding gravity center migration speed for PM2.5 exposure over the past 20 years, cropland recorded the highest speed during this period compared with other land use types.

5. Discussions

5.1. Land Use Change in Gansu Province

From 2000 to 2020, land use types in Gansu Province changed significantly. These changes were mainly characterized by a reduction in cropland and unused land; frequent transitions between grassland and cropland, unused land, and forest; the rapid expansion of construction land to 1.54 times its area in 2000; and increases in the areas of grassland, forest, and water. These trends were consistent with the findings of Yin et al. [16]. The deepening of the “Western Development” policy of China, the active promotion of the “Belt and Road” initiative, and the steady implementation of the strategy for “ecological protection and high-quality development of the Yellow River Basin”, provided unprecedented development opportunities and policy support in Gansu Province. A series of ecological projects, including the protection of natural forest resources, the conversion of cropland to forest and grassland, the construction of the “Three-North” shelterbelt system, the management of degraded, sandy, and salinized grasslands (referred to as the “three types of grasslands”), and the protection and restoration of key ecological function zones, have been implemented successively and are being actively promoted. These projects have curbed desertification, reduced soil erosion [19], and improved the overall ecological environment in Gansu Province, further enhancing air quality. Between 2015 and 2020, the single land use dynamic degree values for cropland and construction land in Gansu Province peaked compared with other periods. This significant change can be attributed to the development and construction booms in Gansu during this period. Notably, the implementation of the Gansu Land Consolidation Plan (2016–2020), along with continuous infrastructure improvements and advancing urbanization processes, played key roles in driving these remarkable land use changes.

5.2. Multi-Spatial Scale PM2.5 PWE for Different Land Use Types

This study used PM2.5 PWE to represent exposure, providing a more accurate measure of public risk than spatially averaged concentrations, which often underestimate actual exposure. Moreover, population-weighted PM2.5 exposure provides a more accurate estimation of public exposure risk [29,41]. Simultaneously, studies on PM2.5 exposure, which rely on traditional scattered monitoring stations, do not fully reflect pollution levels across the entire spatial extent of the study area. These studies are often confined to national or provincial scales, making it challenging to refine the analysis to smaller spatial scales, such as cities, districts, or counties [32]. Additionally, high-resolution imagery offers finer spatial resolutions and rich information, enabling precise and robust support for PM2.5 exposure calculations.
The results of the multi-spatial scale PM2.5 exposure estimation indicate that, at the province level, the annual PM2.5 exposure across different land use types in Gansu Province from 2000 to 2020 followed a pattern of “pollution first and control later”. Specifically, PM2.5, which gradually increased from 2000 to 2010, peaked in 2010, and then declined rapidly by 2020, aligning with the overall PM2.5 trends in China [27]. This trend can be attributed to the introduction of the Action Plan for the Prevention and Control of Air Pollution in the Gansu Province in 2013. Moreover, since 2010, China’s economy has gradually transitioned from rapid to high-quality development. During this period, Gansu Province optimized its industrial energy structure, reduced high-pollution industries, and promoted clean production technologies in key industrial sectors to support the growth of green industries [58]. These measures led to a significant decline in annual PM2.5 exposure across all land use types between 2010 and 2020. Notably, construction land experienced the greatest improvement in air quality. However, it still recorded the highest PM2.5 exposure among all land use types.
At the city and county levels, southern Gansu Province, including GN, exhibited a decline in PM2.5 exposure from 2000 to 2010, contrasting the provincial trend of the “pollution first and control later” process. This trend is closely related to the region’s land cover types and pillar industries. Over the past 20 years, the proportion of forest and grassland in GN has remained above 87%, with the economy primarily driven by green industries, such as ecotourism and agricultural product processing. These factors, coupled with low population density and relatively low total air pollutant emissions, have contributed to this sustained improvement. Conversely, areas with high annual PM2.5 exposure across all land use types are primarily concentrated in LZ, QY, BY, and TS in the central-eastern part of Gansu Province, and JQ in the northwest. These areas exhibited significant spatial clustering. However, the high-high PM2.5 exposure clustering areas for construction land showed a noticeable contraction trend. LZ ranked among the top three cities for PM2.5 exposure across all land use types from 2000 to 2020. As a key industrial city in northwest China, LZ has a high concentration of heavy industry, a dense population, and significant anthropogenic emissions from industrial and transportation activities. In addition, its location in a narrow river valley basin oriented from northwest to southeast creates unique topographical conditions that restrict airflow, leading to poor pollutant dispersion and ground-level accumulation [59]. BY and TS experienced rapid increases in PM2.5 exposure before 2010, mainly due to the cities’ rich mineral resources and the presence of heavy industries, such as electrical machinery, equipment manufacturing, energy, and chemical industries. Qingyang, rich in oil, coal, and gas resources, is the oil and gas chemical base of Gansu Province and the main production area of the Changqing Oilfield, with high energy consumption and significant pollution. Northwestern Gansu is heavily impacted by natural sand and dust events from the surrounding Tengger Desert, Badanjilin Desert, and Kumtag Desert, contributing to high PM2.5 exposure across all land use types [60]. Therefore, to effectively reduce PM2.5 exposure, future clean air policies should fully consider regional variations in pollution levels and population density, prioritizing areas with severe air pollution and high population density.

5.3. Multi-Temporal Scale PM2.5 PWE for Different Land Use Types

The multi-temporal scale PM2.5 PWE results indicated that from 2000 to 2020, construction land in Gansu Province had the highest annual PM2.5 PWE, whereas forest land had the lowest exposure (except in 2005). PM2.5 PWE varied significantly by land use types across seasons, following a U-shaped pattern of being high in winter and spring, and low in summer and fall.
PM2.5 exposures were notably high during the winter and spring, compared with other seasons. Specifically, the highest exposure was observed on construction land during the winter of 2010, which can be attributed to two main factors: the significant increase in pollutant emissions caused by winter heating and the lower planetary boundary layer, resulting in more static weather conditions and hindering pollutant dispersion [61]. The increased use of fertilizers and pesticides in spring, due to heightened agricultural activities, accelerates the formation of sulfate and nitrate particles, thereby elevating PM2.5 concentrations [62]. Furthermore, the relatively low temperatures in Gansu Province during spring necessitate continued heating until April each year, which exacerbates the rise in PM2.5 concentrations and increases exposure during this period. During the same period, summer exhibited the lowest PM2.5 exposure levels, while autumn recorded the second-lowest levels. This reduction is closely associated with decreased anthropogenic emissions, such as fossil fuel and biomass burning. In addition, increased rainfall in most areas of Gansu Province during summer and autumn enhances the wet deposition of atmospheric particulate matter.
A notable finding of our study was that exposure to PM2.5 on grassland during the summer of 2020 attained its lowest level throughout the entire study period. This observation underscores the significant role of grassland ecosystems in enhancing air quality during a specific season. Furthermore, upon examining data from forests in the same year, we observed striking similarities: PM2.5 exposure in forest was extremely low, merely 0.17 µg/m³ higher than that in grassland, marking the second-lowest level recorded during the study period. This finding provides further evidence of the pivotal role of both forest and grassed areas in effectively mitigating and controlling PM2.5 concentrations. Notably, our findings align with previous research by Wang et al., which also emphasizes the positive impact of grasslands and forests on maintaining air quality [36]. However, when comparing the specific contributions of grasslands and forests in reducing PM2.5 exposure, an interesting phenomenon emerged: in our study, grasslands appeared to play a more significant role than forests in effectively reducing PM2.5 exposure. This discrepancy differs from the findings of Chen et al. [37]. The inconsistency may be attributed to various factors, including differences in climatic conditions, vegetation types, and soil properties within the study area.
From 2000 to 2020, construction land consistently exhibited higher PM2.5 exposure across all seasons in each year. With continuous urban expansion, the area of construction land in Gansu Province has increased rapidly over the past 20 years. Construction land, the primary spatial carrier for human habitation, recreation, and industrial production, serves as the main source of pollutant emissions, leading to sustained high PM2.5 exposure levels. Moreover, PM2.5 exposure from construction land during the study period showed a stable spatial pattern-oriented northwest-southeast, with the center of gravity in LZ slightly shifting northwest. This distribution pattern may be related to various factors, including the geographic location and industrial layout of Lanzhou New Area. The Lanzhou New Area, located in northwestern LZ, became the fifth national new area approved by the State Council of China in 2012 and the first national new area in northwest China. Since its establishment, the region’s economic output has grown from 72.49 million USD to 4349.28 million USD. This rapid economic growth may have led to increased air pollutant emissions, affecting the distribution of the gravity center of PM2.5 exposure on construction land.

5.4. Limitations and Prospects

In this paper, we categorized land use types into six groups: cropland, forest, grassland, water, construction land, and unused land, without further subdivisions (for example, construction land was not differentiated into residential, public facility, and industrial land). In addition, the analysis relied on satellite images with 1 km spatial resolutions, leading to some missing data for water and unused land at the county level. Consequently, there may be some deviations between the research results and actual conditions. Thus, we believe that subdividing land use types into fine scales and integrating them with higher-resolution imagery or actual land survey data, alongside exploring suitable interpolation methods to address missing land use types, will be key directions for future research. These efforts will enhance the accuracy of PM2.5 exposure for each land use type. Moreover, this study focused solely on PM2.5 exposure, a typical air pollutant. However, air pollution results from a combination of various pollutants. Hence, future research could include other pollutants, such as O3, and calculate composite pollutant exposure to provide a more comprehensive assessment of human exposure risks. Finally, this study initially explored the spatiotemporal dynamics between land use types and PM2.5 exposure, but the specific association between construction land and PM2.5 exposure is yet to be deepened. Future research will focus on elucidating this relationship by examining the spatial layout and functional characteristics of construction land, as well as its interaction with environmental factors. Additionally, factors such as urban wind direction and building siting will also be taken into account, aiming to provide more precise guidance for urban planning, land use, and environmental policies.

5.5. Policy Implications

Our findings provide a scientific foundation for establishing a collaborative air pollution management system across provinces, cities, and counties in China. Based on these findings, the policy recommendations are proposed in the following three perspectives:
Firstly, national PM2.5 prevention and control targets should be decomposed into county-level administrative regions in a hierarchical manner, with county-level governments serving as the fundamental units for policy implementation. Through a target responsibility transmission mechanism, grassroots governments should be empowered to formulate differentiated air quality improvement plans tailored to the land use types, geographic characteristics, and population distribution within their jurisdictions. Furthermore, a refined management system, encompassing a “pollution source-control area-responsible body”, should be established to ensure the operability and precision of governance targets.
Secondly, building upon the existing concentration monitoring system, a comprehensive assessment mechanism for PM2.5 exposure should be established at the province, city, and county levels. This mechanism should prioritize enhancing the responsiveness of the county-level monitoring network to differences in land use types. The transition from a single-concentration assessment to a multi-dimensional evaluation encompassing the “concentration-exposure-land effect” should be achieved, providing data support for the dynamic adjustment of prevention and control strategies.
Thirdly, regional graded prevention and control strategies should be implemented. In high-risk PM2.5 exposure areas in central Gansu Province, such as LZ, BY, QY, and PL, the focus should be on promoting the green transformation of high-polluting industries, including iron and steel and chemical industries, and rational land use planning to avoid overdevelopment and ecological damage. Conversely, in areas with low-risk PM2.5 exposure, a beneficial interaction mechanism between ecological protection and economic development should be established. Leveraging wind and solar energy resources, clean energy industries should be developed to foster a sustainable development pattern characterized by “ecological protection—green energy—regional economy”.

6. Conclusions

This study analyzed the spatiotemporal changes in land use types in Gansu Province, China, from 2000 to 2020, measured PM2.5 exposure for each land use type at multiple scales (i.e., province, city, and county), and evaluated seasonal variations. Spatiotemporal analysis methods, including the global/local Moran’s I index, standard deviation ellipse, and center of gravity migration model, were used to explore the spatiotemporal distribution characteristics of PM2.5 exposure across different land use types during the study period. Experimental results demonstrated that from 2000 to 2020, Gansu Province saw significant land use changes, with faster rates of transformation observed during 2015–2020. A turning point in annual PM2.5 exposure occurred in 2010, with a provincial-level decrease thereafter, although certain cities and counties in the southern part of Gansu experienced continuous declines since 2000. During the study, construction land had the highest annual PM2.5 exposure, forest had the lowest, and seasonal variations followed a U-shaped pattern. Additionally, PM2.5 exposure exhibited a strong spatial correlation and a stable northwest-southeast distribution, with the gravity centers shifting slightly northwest during the study period.
These results are crucial for accurately identifying high-risk clustering areas of PM2.5 pollution and developing targeted, regional, and differentiated pollution prevention and control policies, effectively supporting comprehensive sustainable development. Furthermore, due to the constraints of the available county-level data, this study was limited to analyzing the spatiotemporal distribution of PM2.5 exposure across different land use types, without delving deeply into the associated social and economic factors. In the future, we intend to incorporate additional social data to comprehensively investigate the underlying causes of PM2.5 exposure in various land use types and explore optimal pollution reduction strategies.

Author Contributions

Conceptualization, S.J. and L.M.; Data curation, F.L.; Formal analysis, F.L.; Investigation, F.L.; Methodology, F.L.; Project administration, S.J. and L.M.; Resources, S.J.; Software, F.L. and S.L.; Supervision, S.J. and L.M.; Writing—original draft, F.L.; Writing—review and editing, L.M. and S.L. All authors have read and agreed to the published version of the manuscript.

Funding

This research is supported by the 2025 Gansu Province Outstanding Graduate Student “Innovation Star” Project (Grant No. 2025CXZX-862) and the Program for Innovation Research in Central University of Finance and Economics, China.

Data Availability Statement

https://www.gscloud.cn/, accessed on 8 June 2024; https://www.resdc.cn/Datalist1.aspx?FieldTyepID=1,3, accessed on 8 June 2024; https://landscan.ornl.gov/, accessed on 10 July 2024; https://data.tpdc.ac.cn/home, accessed on 10 July 2024.

Acknowledgments

We are grateful to the editors and reviewers for their valuable comments and suggestions.

Conflicts of Interest

The authors declare no conflicts of interest.

Appendix A

Figure A1. Local spatial autocorrelation of PM2.5 PWE on cropland in Gansu province.
Land 14 00795 g0a1
Figure A2. Local spatial autocorrelation of PM2.5 PWE on forest in Gansu province.
Land 14 00795 g0a2
Figure A3. Local spatial autocorrelation of PM2.5 PWE on grassland in Gansu province.
Land 14 00795 g0a3
Figure A4. Gravity center shift trajectory and standard deviational ellipse of PM2.5 PWE in forest of Gansu Province (2000–2020). Note: BY, DX, JYG, JC, JQ, LZ, LN, PL, QY, TS, WW, ZY, GN, and LX denote Baiyin, Dingxi, Jiayuguan, Jinchang, Jiuquan, Lanzhou, Longnan, Pingliang, Qingyang, Tianshui, Wuwei, Zhangye, Gannan, and Linxia, respectively.
Land 14 00795 g0a4
Figure A5. Gravity center shift trajectory and standard deviational ellipse of PM2.5 PWE in grassland of Gansu Province (2000–2020). Note: BY, DX, JYG, JC, JQ, LZ, LN, PL, QY, TS, WW, ZY, GN, and LX denote Baiyin, Dingxi, Jiayuguan, Jinchang, Jiuquan, Lanzhou, Longnan, Pingliang, Qingyang, Tianshui, Wuwei, Zhangye, Gannan, and Linxia, respectively.
Land 14 00795 g0a5
Figure A6. Gravity center shift trajectory and standard deviational ellipse of PM2.5 PWE in construction land of Gansu Province (2000–2020). Note: BY, DX, JYG, JC, JQ, LZ, LN, PL, QY, TS, WW, ZY, GN, and LX denote Baiyin, Dingxi, Jiayuguan, Jinchang, Jiuquan, Lanzhou, Longnan, Pingliang, Qingyang, Tianshui, Wuwei, Zhangye, Gannan, and Linxia, respectively.
Land 14 00795 g0a6

References

  1. Murray, C.J.L.; Aravkin, A.Y.; Zheng, P.; Abbafati, C.; Abbas, K.M.; Abbasi-Kangevari, M.; Abd-Allah, F.; Abdelalim, A.; Abdollahi, M.; Abdollahpour, I.; et al. Global Burden of 87 Risk Factors in 204 Countries and Territories, 1990–2019: A Systematic Analysis for the Global Burden of Disease Study 2019. Lancet 2020, 396, 1223–1249. [Google Scholar] [CrossRef]
  2. Brauer, M.; Roth, G.A.; Aravkin, A.Y.; Zheng, P.; Abate, K.H.; Abate, Y.H.; Abbafati, C.; Abbasgholizadeh, R.; Abbasi, M.A.; Abbasian, M.; et al. Global Burden and Strength of Evidence for 88 Risk Factors in 204 Countries and 811 Subnational Locations, 1990–2021: A Systematic Analysis for the Global Burden of Disease Study 2021. Lancet 2024, 403, 2162–2203. [Google Scholar] [CrossRef]
  3. Health Effects Institute State of Global Air 2024: A Special Report on Global Exposure to Air Pollution and Its Health Impacts, with a Focus on Children’s Health. Available online: https://repository.gheli.harvard.edu/repository/12947/ (accessed on 9 October 2024).
  4. Dong, J.; Wang, Y.; Wang, L.; Zhao, W.; Huang, C. Assessment of PM2.5 Exposure Risk towards SDG Indicator 11.6.2—A Case Study in Beijing. Sustain. Cities Soc. 2022, 82, 103864. [Google Scholar] [CrossRef]
  5. Yue, H.; He, C.; Huang, Q.; Zhang, D.; Shi, P.; Moallemi, E.A.; Xu, F.; Yang, Y.; Qi, X.; Ma, Q.; et al. Substantially Reducing Global PM2.5-Related Deaths Under SDG3.9 Requires Better Air Pollution Control and Healthcare. Nat. Commun. 2024, 15, 2729. [Google Scholar] [CrossRef]
  6. Zheng, H.; Kong, S.; Seo, J.; Yan, Y.; Cheng, Y.; Yao, L.; Wang, Y.; Zhao, T.; Harrison, R.M. Achievements and Challenges in Improving Air Quality in China: Analysis of the Long-Term Trends from 2014 to 2022. Environ. Int. 2024, 183, 108361. [Google Scholar] [CrossRef]
  7. Yu, W.; Ye, T.; Zhang, Y.; Xu, R.; Lei, Y.; Chen, Z.; Yang, Z.; Zhang, Y.; Song, J.; Yue, X.; et al. Global Estimates of Daily Ambient Fine Particulate Matter Concentrations and Unequal Spatiotemporal Distribution of Population Exposure: A Machine Learning Modelling Study. Lancet Planet. Health 2023, 7, e209–e218. [Google Scholar] [CrossRef]
  8. He, Q.; Ye, T.; Wang, W.; Luo, M.; Song, Y.; Zhang, M. Spatiotemporally Continuous Estimates of Daily 1-Km PM2.5 Concentrations and Their Long-Term Exposure in China from 2000 to 2020. J. Environ. Manag. 2023, 342, 118145. [Google Scholar] [CrossRef]
  9. Sun, B.; Fang, C.; Liao, X.; Guo, X.; Liu, Z. The Relationship Between Urbanization and Air Pollution Affected by Intercity Factor Mobility: A Case of the Yangtze River Delta Region. Environ. Impact Assess. Rev. 2023, 100, 107092. [Google Scholar] [CrossRef]
  10. Lu, X.; Chen, Y.; Huang, Y.; Chen, D.; Shen, J.; Lin, C.; Li, Z.; Fung, J.C.H.; Lau, A.K.H. Exposure and Mortality Apportionment of PM2.5 Between 2006 and 2015 over the Pearl River Delta Region in Southern China. Atmos. Environ. 2020, 231, 117512. [Google Scholar] [CrossRef]
  11. Ping, L.; Wang, Y.; Lu, Y.; Lee, L.-C.; Liang, C. Tracing the Sources of PM2.5-Related Health Burden in China. Environ. Pollut. 2023, 327, 121544. [Google Scholar] [CrossRef]
  12. Hu, Y.; Yao, M.; Liu, Y.; Zhao, B. Personal Exposure to Ambient PM2.5, PM10, O3, NO2, and SO2 for Different Populations in 31 Chinese Provinces. Environ. Int. 2020, 144, 106018. [Google Scholar] [CrossRef] [PubMed]
  13. Lu, D.; Xu, J.; Yue, W.; Mao, W.; Yang, D.; Wang, J. Response of PM2.5 Pollution to Land Use in China. J. Clean. Prod. 2020, 244, 118741. [Google Scholar] [CrossRef]
  14. Kan, X.; Liu, X.; Zhou, Z.; Zhang, Y.; Zhu, L.; Sian, K.T.C.L.K.; Liu, Q. Analysis of Spatiotemporal Variation and Influencing Factors of PM2.5 in China Based on Multisource Data. Sustainability 2023, 15, 14656. [Google Scholar] [CrossRef]
  15. Shin, M.; Kang, Y.; Park, S.; Im, J.; Yoo, C.; Quackenbush, L.J. Estimating Ground-Level Particulate Matter Concentrations Using Satellite-Based Data: A Review. GIScience Remote Sens. 2020, 57, 174–189. [Google Scholar] [CrossRef]
  16. Yin, Z.; Feng, Q.; Zhu, R.; Wang, L.; Chen, Z.; Fang, C.; Lu, R. Analysis and Prediction of the Impact of Land Use/Cover Change on Ecosystem Services Value in Gansu Province, China. Ecol. Indic. 2023, 154, 110868. [Google Scholar] [CrossRef]
  17. Huang, H.; Jia, J.; Chen, D.; Liu, S. Evolution of Spatial Network Structure for Land-Use Carbon Emissions and Carbon Balance Zoning in Jiangxi Province: A Social Network Analysis Perspective. Ecol. Indic. 2024, 158, 111508. [Google Scholar] [CrossRef]
  18. Thakrar, S.K.; Johnson, J.A.; Polasky, S. Land-Use Decisions Have Substantial Air Quality Health Effects. Environ. Sci. Technol. 2024, 58, 381–390. [Google Scholar] [CrossRef]
  19. Liu, J.; Zhang, Z.; Xu, X.; Kuang, W.; Zhou, W.; Zhang, S.; Li, R.; Yan, C.; Yu, D.; Wu, S.; et al. Spatial Patterns and Driving Forces of Land Use Change in China During the Early 21st Century. J. Geogr. Sci. 2010, 20, 483–494. [Google Scholar] [CrossRef]
  20. Liu, C.; Hu, S.; Wu, S.; Song, J.; Li, H. County-Level Land Use Carbon Emissions in China: Spatiotemporal Patterns and Impact Factors. Sustain. Cities Soc. 2024, 105, 105304. [Google Scholar] [CrossRef]
  21. Pu, J.; Shen, A.; Liu, C.; Wen, B. Impacts of Ecological Land Fragmentation on Habitat Quality in the Taihu Lake Basin in Jiangsu Province, China. Ecol. Indic. 2024, 158, 111611. [Google Scholar] [CrossRef]
  22. Gui, D.; He, H.; Liu, C.; Han, S. Spatio-Temporal Dynamic Evolution of Carbon Emissions from Land Use Change in Guangdong Province, China, 2000–2020. Ecol. Indic. 2023, 156, 111131. [Google Scholar] [CrossRef]
  23. Pan, Y.; Zhang, H.; Wang, C.; Zhou, Y. Impact of Land Use Change on Regional Carbon Sink Capacity: Evidence from Sanmenxia, China. Ecol. Indic. 2023, 156, 111189. [Google Scholar] [CrossRef]
  24. Shi, Q.; Gu, C.-J.; Xiao, C. Multiple Scenarios Analysis on Land Use Simulation by Coupling Socioeconomic and Ecological Sustainability in Shanghai, China. Sustain. Cities Soc. 2023, 95, 104578. [Google Scholar] [CrossRef]
  25. Wang, K.; Li, Z.; Xu, Z.; Wang, J.; Jia, M.; Wang, L.; Yue, X.; Duo, X. Evaluating and Simulating the Impacts of Land Use Patterns on Carbon Emissions in Coal Resource-Based Regions: A Case Study of Shanxi Province, China. J. Clean. Prod. 2024, 458, 142494. [Google Scholar] [CrossRef]
  26. Qi, G.; Wei, W.; Wang, Z.; Wang, Z.; Wei, L. The Spatial-Temporal Evolution Mechanism of PM2.5 Concentration Based on China’s Climate Zoning. J. Environ. Manag. 2023, 325, 116671. [Google Scholar] [CrossRef]
  27. Li, Y.; Li, B.; Liao, H.; Zhou, B.-B.; Wei, J.; Wang, Y.; Zang, Y.; Yang, Y.; Liu, R.; Wang, X. Changes in PM2.5-Related Health Burden in China’s Poverty and Non-Poverty Areas During 2000–2020: A Health Inequality Perspective. Sci. Total Environ. 2023, 861, 160517. [Google Scholar] [CrossRef]
  28. Han, C.; Xu, R.; Ye, T.; Xie, Y.; Zhao, Y.; Liu, H.; Yu, W.; Zhang, Y.; Li, S.; Zhang, Z.; et al. Mortality Burden Due to Long-Term Exposure to Ambient PM2.5 above the New WHO Air Quality Guideline Based on 296 Cities in China. Environ. Int. 2022, 166, 107331. [Google Scholar] [CrossRef]
  29. Lin, C.; Li, Y.; Lau, A.K.H.; Deng, X.; Tse, T.K.T.; Fung, J.C.H.; Li, C.; Li, Z.; Lu, X.; Zhang, X.; et al. Estimation of Long-Term Population Exposure to PM2.5 for Dense Urban Areas Using 1-Km MODIS Data. Remote Sens. Environ. 2016, 179, 13–22. [Google Scholar] [CrossRef]
  30. Liu, Z.; Xie, M.; Tian, K.; Gao, P. GIS-Based Analysis of Population Exposure to PM2.5 Air Pollution—A Case Study of Beijing. J. Environ. Sci. 2017, 59, 48–53. [Google Scholar] [CrossRef]
  31. Chen, B.; Lin, Y.; Deng, J.; Li, Z.; Dong, L.; Huang, Y.; Wang, K. Spatiotemporal Dynamics and Exposure Analysis of Daily PM2.5 Using a Remote Sensing-Based Machine Learning Model and Multi-Time Meteorological Parameters. Atmos. Pollut. Res. 2021, 12, 23–31. [Google Scholar] [CrossRef]
  32. Liu, M.; Saari, R.K.; Zhou, G.; Li, J.; Han, L.; Liu, X. Recent Trends in Premature Mortality and Health Disparities Attributable to Ambient PM2.5 Exposure in China: 2005–2017. Environ. Pollut. 2021, 279, 116882. [Google Scholar] [CrossRef] [PubMed]
  33. Liu, C.; Chen, R.; Sera, F.; Vicedo-Cabrera, A.M.; Guo, Y.; Tong, S.; Coelho, M.S.Z.S.; Saldiva, P.H.N.; Lavigne, E.; Matus, P.; et al. Ambient Particulate Air Pollution and Daily Mortality in 652 Cities. N. Engl. J. Med. 2019, 381, 705–715. [Google Scholar] [CrossRef] [PubMed]
  34. Zhang, Y.; Ma, R.; Ban, J.; Lu, F.; Guo, M.; Zhong, Y.; Jiang, N.; Chen, C.; Li, T.; Shi, X. Risk of Cardiovascular Hospital Admission After Exposure to Fine Particulate Pollution. J. Am. Coll. Cardiol. 2021, 78, 1015–1024. [Google Scholar] [CrossRef] [PubMed]
  35. Tallis, M.; Taylor, G.; Sinnett, D.; Freer-Smith, P. Estimating the Removal of Atmospheric Particulate Pollution by the Urban Tree Canopy of London, Under Current and Future Environments. Landsc. Urban Plan. 2011, 103, 129–138. [Google Scholar] [CrossRef]
  36. Wang, P.; Zeng, C.; Zhang, W.; Lv, T.; Miao, X.; Xiang, H. Investigation of the Spatial Effects on PM2.5 in Relation to Land Use and Ecological Restoration in Urban Agglomerations. Sci. Total Environ. 2024, 913, 169665. [Google Scholar] [CrossRef]
  37. Chen, M.; Dai, F.; Yang, B.; Zhu, S. Effects of Neighborhood Green Space on PM2.5 Mitigation: Evidence from Five Megacities in China. Build. Environ. 2019, 156, 33–45. [Google Scholar] [CrossRef]
  38. Zhao, H.; Tong, D.Q.; Gao, C.; Wang, G. Effect of Dramatic Land Use Change on Gaseous Pollutant Emissions from Biomass Burning in Northeastern China. Atmos. Res. 2015, 153, 429–436. [Google Scholar] [CrossRef]
  39. Wang, Y.; Wang, M.; Wu, Y.; Sun, G. Exploring the Effect of Ecological Land Structure on PM2.5: A Panel Data Study Based on 277 Prefecture-Level Cities in China. Environ. Int. 2023, 174, 107889. [Google Scholar] [CrossRef]
  40. Guan, Q.; Liu, Z.; Yang, L.; Luo, H.; Yang, Y.; Zhao, R.; Wang, F. Variation in PM2.5 Source over Megacities on the Ancient Silk Road, Northwestern China. J. Clean. Prod. 2019, 208, 897–903. [Google Scholar] [CrossRef]
  41. Huang, J.; Li, X.; Zhang, Y.; Zhai, S.; Wang, W.; Zhang, T.; Yin, F.; Ma, Y. Socio-Demographic Characteristics and Inequality in Exposure to PM2.5: A Case Study in the Sichuan Basin, China. Environ. Pollut. 2023, 316, 120630. [Google Scholar] [CrossRef]
  42. Chen, L.; Shi, M.; Gao, S.; Li, S.; Mao, J.; Zhang, H.; Sun, Y.; Bai, Z.; Wang, Z. Assessment of Population Exposure to PM2.5 for Mortality in China and Its Public Health Benefit Based on BenMAP. Environ. Pollut. 2017, 221, 311–317. [Google Scholar] [CrossRef] [PubMed]
  43. Liu, M.; Wang, Y.; Liu, R.; Ding, C.; Zhou, G.; Han, L. How Magnitude of PM2.5 Exposure Disparities Have Evolved across Chinese Urban-Rural Population During 2010–2019. J. Clean. Prod. 2023, 382, 135333. [Google Scholar] [CrossRef]
  44. Bai, Y.; Liu, M. Multi-Scale Spatiotemporal Trends and Corresponding Disparities of PM2.5 Exposure in China. Environ. Pollut. 2024, 340, 122857. [Google Scholar] [CrossRef] [PubMed]
  45. Wei, J.; Li, Z.; Cribb, M.; Huang, W.; Xue, W.; Sun, L.; Guo, J.; Peng, Y.; Li, J.; Lyapustin, A.; et al. Improved 1km Resolution PM2.5 Estimates across China Using Enhanced Space–Time Extremely Randomized Trees. Atmos. Chem. Phys. 2020, 20, 3273–3289. [Google Scholar] [CrossRef]
  46. Wei, J.; Li, Z.; Lyapustin, A.; Sun, L.; Peng, Y.; Xue, W.; Su, T.; Cribb, M. Reconstructing 1-Km-Resolution High-Quality PM2.5 Data Records from 2000 to 2018 in China: Spatiotemporal Variations and Policy Implications. Remote Sens. Environ. 2021, 252, 112136. [Google Scholar] [CrossRef]
  47. Wei, J.; Li, Z. ChinaHighPM2.5: High-Resolution and High-Quality Ground-Level PM2.5 Dataset for China (2000–2023); National Tibetan Plateau/Third Pole Environment Data Center: Beijing, China, 2023. [Google Scholar] [CrossRef]
  48. Kyaw, A.K.; Hamed, M.M.; Kamruzzaman, M.; Shahid, S. Spatiotemporal Changes in Population Exposure to Heat Stress in South Asia. Sustain. Cities Soc. 2023, 93, 104544. [Google Scholar] [CrossRef]
  49. Zhu, L.; Fang, J.; Yao, Y.; Yang, Z.; Wu, J.; Ma, Z.; Liu, R.; Zhan, Y.; Ding, Z.; Zhang, Y. Long-Term Ambient Ozone Exposure and Incident Cardiovascular Diseases: National Cohort Evidence in China. J. Hazard. Mater. 2024, 471, 134158. [Google Scholar] [CrossRef]
  50. Liu, Z.; Li, J.; Chen, H.; Wang, L.; Yang, J.; Plaza, A. Prediction of Changes in War-Induced Population and CO2 Emissions in Ukraine Using Social Media. Humanit. Soc. Sci. Commun. 2024, 11, 884. [Google Scholar] [CrossRef]
  51. Basu, T.; Das, A. Urbanization Induced Changes in Land Use Dynamics and Its Nexus to Ecosystem Service Values: A Spatiotemporal Investigation to Promote Sustainable Urban Growth. Land Use Policy 2024, 144, 107239. [Google Scholar] [CrossRef]
  52. Tessum, C.W.; Paolella, D.A.; Chambliss, S.E.; Apte, J.S.; Hill, J.D.; Marshall, J.D. PM2.5 Polluters Disproportionately and Systemically Affect People of Color in the United States. Sci. Adv. 2021, 7, eabf4491. [Google Scholar] [CrossRef]
  53. Getis, A.; Ord, J.K. The Analysis of Spatial Association by Use of Distance Statistics. Geogr. Anal. 1992, 24, 189–206. [Google Scholar] [CrossRef]
  54. Anselin, L. Local Indicators of Spatial Association—LISA. Geogr. Anal. 1995, 27, 93–115. [Google Scholar] [CrossRef]
  55. Chen, D.; Guo, Y.; Zhao, Y.; Zhang, J.; Liu, X.; Tong, Z.; Zhao, C. Dynamic Evolution Characteristics and Hazard Assessment of Compound Drought/Waterlogging and Low Temperature Events for Maize. Sci. Total Environ. 2024, 946, 174427. [Google Scholar] [CrossRef] [PubMed]
  56. Liang, L.; Chen, M.; Luo, X.; Xian, Y. Changes Pattern in the Population and Economic Gravity Centers since the Reform and Opening up in China: The Widening Gaps between the South and North. J. Clean. Prod. 2021, 310, 127379. [Google Scholar] [CrossRef]
  57. Chen, Y. Spatial Autocorrelation Equation Based on Moran’s Index. Sci. Rep. 2023, 13, 19296. [Google Scholar] [CrossRef]
  58. Qiao, F. Research on Driving Mechanism and Prediction of Electric Power Carbon Emission in Gansu Province Under Dual-Carbon Target. Sci. Rep. 2024, 14, 6103. [Google Scholar]
  59. Zhou, X.; Gao, X.; Chang, Y.; Zhao, S.; Li, P. The Pattern and Mechanism of an Unhealthy Air Pollution Event in Lanzhou, China. Urban Clim. 2023, 48, 101409. [Google Scholar] [CrossRef]
  60. Guan, Q.; Cai, A.; Wang, F.; Yang, L.; Xu, C.; Liu, Z. Spatio-Temporal Variability of Particulate Matter in the Key Part of Gansu Province, Western China. Environ. Pollut. 2017, 230, 189–198. [Google Scholar] [CrossRef]
  61. Wang, Y.Q.; Zhang, X.Y.; Sun, J.Y.; Zhang, X.C.; Che, H.Z.; Li, Y. Spatial and Temporal Variations of the Concentrations of PM10, PM2.5 and PM1 in China. Atmos. Chem. Phys. 2015, 15, 13585–13598. [Google Scholar] [CrossRef]
  62. Xu, W.; Zhao, Y.; Wen, Z.; Chang, Y.; Pan, Y.; Sun, Y.; Ma, X.; Sha, Z.; Li, Z.; Kang, J.; et al. Increasing Importance of Ammonia Emission Abatement in PM2.5 Pollution Control. Sci. Bull. 2022, 67, 1745–1749. [Google Scholar] [CrossRef]
Figure 1. The general framework of the study.
Land 14 00795 g001
Figure 2. Overview map of the study area (a) Location of Gansu Province in China (b) Specific location and elevation of the study area (DEM data from the Geospatial Data Cloud: https://www.gscloud.cn/, accessed on 8 June 2024). Note: BY, DX, JYG, JC, JQ, LZ, LN, PL, QY, TS, WW, ZY, GN, and LX denote Baiyin, Dingxi, Jiayuguan, Jinchang, Jiuquan, Lanzhou, Longnan, Pingliang, Qingyang, Tianshui, Wuwei, Zhangye, Gannan, and Linxia, respectively.
Land 14 00795 g002
Figure 3. Land use changes in Gansu Province, China during 2000–2020.
Land 14 00795 g003
Figure 4. Annual changes and seasonal characteristics of PM2.5 PWE for different land use types in Gansu Province, 2000–2020.
Land 14 00795 g004
Figure 5. PM2.5 PWE for each land use type at the city level in Gansu Province, 2000–2020 (unit: µg/m3).
Land 14 00795 g005
Figure 6. Spatial distribution of PM2.5 PWE for each land use type at the county level in Gansu Province, 2000–2020 (unit: µg/m3). Note: (af) denote cropland, forest, grassland, water, construction land, and unused land, respectively. The blank sections of the study area indicate missing values.
Land 14 00795 g006
Figure 7. Local spatial autocorrelation of PM2.5 PWE on construction land in Gansu province.
Land 14 00795 g007
Figure 8. Gravity center shift trajectory and standard deviational ellipse of PM2.5 PWE in Cropland of Gansu Province (2000–2020). Note: BY, DX, JYG, JC, JQ, LZ, LN, PL, QY, TS, WW, ZY, GN, and LX denote Baiyin, Dingxi, Jiayuguan, Jinchang, Jiuquan, Lanzhou, Longnan, Pingliang, Qingyang, Tianshui, Wuwei, Zhangye, Gannan, and Linxia, respectively.
Land 14 00795 g008
Table 1. Detailed data description in this study.
Data (Unit)Spatial
Resolution
Temporal
Resolution
Source
DEM (m)90 m--Geospatial Data Cloud
(https://www.gscloud.cn/, accessed on 8 June 2024)
Land use (Unitless)30 m1 yearData Center for Resource and Environmental Sciences, Chinese Academy of Sciences
(https://www.resdc.cn/, accessed on 8 June 2024)
PM2.5 (µg/m3)0.01°1 monthChina HighAirPollutants (CHAP)
(https://data.tpdc.ac.cn/, accessed on 10 July 2024)
Population (person)30 arcsec1 yearLandScan Global Vital Statistics Database
(https://landscan.ornl.gov/, accessed on 10 July 2024)
Table 2. Land use transfer matrix of Gansu for each period from 2000 to 2020 (unit: km2).
Land Use TypePeriodCroplandForestGrasslandWaterConstruction LandUnused Land
Cropland2000–200563,82824612261118150
2005–201061,990316231946488244
2010–201563,872506562629551
2015–202059,696306358094651471
2000–202057,98270251681151353222
Forest2000–20058437,4301434156
2005–201016337,648271171783
2010–20157338,2752224711
2015–202025137,0731125234968
2000–202033036,06710703269114
Grassland2000–2005766497141,298837100
2005–20101711535139,12265971506
2010–2015624245141,9692781195
2015–202028781071137,098883161630
2000–202034371652135,3471194351716
Water2000–2005163303253236
2005–20105393231254105
2010–20151121334234126
2015–2020581496326815113
2000–202075988304522101
Construction land2000–20051528035100
2005–20102308381347327
2010–201538216041821
2015–20203771912912404198
2000–2020353157110307610
Unused land2000–2005694213315232171,474
2005–2010803761359325160168,943
2010–20151801520584107170,317
2015–20205531151735411390167,497
2000–202016361532019575507167,714
Table 3. Dynamic degree of land use in Gansu Province between 2000 and 2020.
PeriodCroplandForestGrasslandWaterConstruction LandUnused LandIntegrated *
2000–2005−0.042%0.274%0.046%−0.072%1.369%−0.109%0.109%
2005–2010−0.139%0.206%0.015%1.508%2.446%−0.088%0.261%
2010–2015−0.047%−0.002%−0.008%−0.084%2.062%−0.024%0.079%
2015–2020−0.304%0.005%0.095%1.863%3.362%−0.097%0.393%
2000–2020−0.132%0.122%0.037%0.832%2.726%−0.079%0.130%
* The dynamic degree includes single land use dynamic degree and integrated land use dynamic degree.
Table 4. PM2.5 concentration limits set by the WHO and China (unit: µg/m³).
China Ambient Air Quality Standards (GB 3095–2012)WHO Global Air Quality Guidelines (2021)
Concentration
Limit Value
Concentration
Limit Value
Interim Targets 1Interim Targets 2Interim Targets 3
Annual mean355352515
Daily average7515755037.5
Table 5. The outcomes of global autocorrelation analysis within the research region between 2000 and 2020.
YearCroplandForestGrasslandConstruction Land
p ValueMoran’s Ip ValueMoran’s Ip ValueMoran’s Ip ValueMoran’s I
20000.0000.7780.0000.7960.0000.7980.0000.709
20050.0000.7650.0000.7870.0000.7750.0000.736
20100.0000.7850.0000.7870.0000.7750.0000.735
20150.0000.8160.0000.7980.0000.8340.0000.731
20200.0000.7250.0000.6200.0000.6060.0000.644
Table 6. The parameters of PM2.5 PWE standard deviational ellipse and gravity center across different land use types in the study area.
Land-Use TypeYearLong Half-Axis/kmShort Half-Axis/kmThe Coordinate of Gravity CenterThe Shift of Gravity Center
Orientation/°Center X/°Center Y/°DirectionDistance
/km
Velocity
/km·a−1
Cropland2000438.151165.971129.276103.72336.186 --
2005432.826165.465129.065103.83636.131328.88811.6282.326
2010439.342164.471129.336103.72536.194144.45611.8992.380
2015446.793165.399129.069103.66136.252131.2378.5951.719
2020475.821164.213128.133103.5536.379123.12717.0463.410
Forest2000436.713164.747129.434103.72036.201 --
2005432.754164.618129.053103.82436.147327.43610.9132.183
2010439.401163.324129.283103.71736.214141.68211.9752.395
2015447.299164.427129.114103.65336.274129.9628.7071.741
2020474.051163.858128.212103.56836.382120.30413.9872.797
Grassland2000436.713164.747129.434103.72036.201 --
2005432.754164.618129.053103.82436.147327.43610.9132.183
2010439.401163.324129.283103.71736.214141.68211.9752.395
2015447.299164.427129.114103.65336.274129.9628.7071.741
2020474.051163.858128.212103.56836.382120.30413.9872.797
Construct-ion land2000439.237165.156129.311103.72136.191 --
2005433.020164.999129.087103.84036.133328.46712.1992.440
2010438.476163.818129.417103.73936.185147.34410.4982.100
2015443.094165.085129.324103.68636.232131.0157.0361.407
2020469.764163.325128.397103.59436.359118.35016.2423.248
Disclaimer/Publisher’s Note: The statements, opinions and data contained in all publications are solely those of the individual author(s) and contributor(s) and not of MDPI and/or the editor(s). MDPI and/or the editor(s) disclaim responsibility for any injury to people or property resulting from any ideas, methods, instructions or products referred to in the content.

