Article

Evaluation of Thermal Comfort in Urban Commercial Space with Vision–Language-Model-Based Agent Model

1
Creative Computing Institute, University of the Arts London, London WC1V 7EY, UK
2
School of Architecture & Design, University for the Creative Arts, Canterbury CT1 3AN, UK
3
School of Architecture and Design, Harbin Institute of Technology, Harbin 150006, China
*
Author to whom correspondence should be addressed.
Land 2025, 14(4), 786; https://doi.org/10.3390/land14040786
Submission received: 26 February 2025 / Revised: 22 March 2025 / Accepted: 4 April 2025 / Published: 6 April 2025

Abstract

:
Thermal comfort in urban commercial spaces significantly impacts both business performance and public well-being. Traditional evaluation methods relying on field surveys and expert assessments are often time-consuming and labor-intensive. This study proposes a novel vision–language model (VLM)-based agent system for thermal comfort assessment in commercial spaces, simulating eight distinct heat-sensitive roles with varied demographic backgrounds through prompt engineering using ChatGPT-4o. Taking Harbin Central Street, China as a case study, we first validated model accuracy through ASHRAE scale evaluations of 30% samples (167 images) by 50 experts, and then conducted thermal comfort simulations of eight heat-sensitive roles followed by spatial and interpretability analyses. Key findings include (1) a significant correlation between VLM assessments and expert evaluations (r = 0.815, p < 0.001), confirming method feasibility; (2) notable heterogeneity in thermal comfort evaluations across eight agents, demonstrating the VLMs’ capacity to capture perceptual differences among social groups; (3) spatial analysis revealing higher thermal comfort in eastern regions compared to western and central areas despite inter-role variations, demonstrating consistency among agents; and (4) the shade and vegetation being identified as primary influencing factors that contribute to the agent’s decision making. This research validates VLM-based agents’ effectiveness in urban thermal comfort evaluation, showcasing their dual capability in replicating traditional methods while capturing social group differences. The proposed approach establishes a novel paradigm for efficient, comprehensive, and multi-perspective thermal comfort assessments in urban commercial environments.

1. Introduction

In recent years, the intensification of urban heat island (UHI) effects in outdoor environments has become a critical urban challenge as global urbanization accelerates [1,2,3]. The design quality of open urban spaces directly determines their capacity to mitigate heat stress and support pedestrian activities during extreme heat events [4,5,6]. Particularly in commercial streetscapes, where high pedestrian density intersects with intense solar exposure, outdoor thermal comfort emerges as a vital determinant of public space vitality [7,8]. Current urban design strategies in cold regions exhibit significant seasonal adaptation imbalances: while prioritizing winter wind protection and thermal insulation, summer-oriented environmental optimizations remain underdeveloped, especially regarding solar management strategies [9,10]. This paradox manifests in insufficient shading provisions that compromise pedestrian thermal experiences despite adequate winter protection [11,12]. Empirical evidence suggests that shaded pedestrian corridors can increase foot traffic by 40–60% during peak summer hours [13,14], demonstrating their triple benefits for public health, economic vitality, and environmental sustainability [15]. Therefore, studying the outdoor thermal comfort of commercial pedestrian streets during the summer months in severely cold regions is of significant practical importance.
Thermal comfort in commercial street environments positively correlates with commercial vitality, as pleasant thermal conditions enhance the appeal and attractiveness of commercial districts [16,17]. In China, urban building thermal designs must be adapted to regional climatic conditions. According to Guo et al. [18], the “Thermal Design Code for Civil Buildings” (GB 50176-2016) divides China into five thermal design climate zones: severely cold, cold, hot summer–cold winter, hot summer–warm winter, and temperate regions. Among these, the severely cold region covers the largest area. In northern regions, severe winter conditions pose significant challenges to thermal comfort, limiting outdoor activities and reducing engagement in shopping and leisure activities [19,20,21]. However, rising summer temperatures can improve thermal comfort, encouraging more outdoor activities, thereby increasing foot traffic and enhancing the vitality of commercial districts [22,23,24]. An example is the tropical residential project in Singapore by architect Garry van der Griend [25], which integrates public gardens, rooftop green spaces, and natural ventilation to foster residents’ connection with nature and promote environmental sustainability. Conversely, poor thermal comfort diminishes the attractiveness of commercial areas, particularly in locations with high outdoor activity, where customers may avoid heated zones [26,27]. This not only reduces foot traffic but also dampens investment interest in commercial districts, ultimately decreasing the overall vitality of the area [28,29,30].
Previous studies have demonstrated that urban thermal comfort design should account for a variety of climatic conditions, including air temperature, solar radiation, humidity, and wind velocity [31,32]. Outdoor thermal comfort (OTC) evaluation requires specialized approaches distinct from indoor assessment methods. While the predicted mean vote (PMV) index has been historically referenced in outdoor studies, its fundamental limitations for open-air environments must be acknowledged [33,34,35]. The PMV estimates the average thermal sensation of a population based on factors such as air temperature, relative humidity, wind speed, radiant temperature, clothing insulation, and metabolic rate [36,37]. Additionally, the predicted percentage dissatisfied (PPD) index estimates the percentage of people dissatisfied with a given thermal environment [38]. However, OTC is influenced by a range of factors, including physical, individual, social, and psychological aspects. Traditional methods primarily rely on comparing physical parameters with human perception [39,40]. Even in an ideal environment, individual differences, such as body mass index (BMI), physical activity history, outdoor exposure time, frequency of visits, lifestyle preferences, and environmental quality, can significantly affect thermal perception [41,42,43,44]. These factors can exert both physiological and psychological effects on thermal perception. Moreover, the data collection process must balance data resolution with respondent burden, posing challenges to both study design quality and the reliability of participant feedback [45]. Consequently, recent research has increasingly focused on combining big data and artificial intelligence techniques to more accurately assess the impact of outdoor thermal environments on human perceived comfort [46,47,48].
Recent advancements in computer vision have revolutionized urban thermal comfort assessment through street view images (SVIs), offering unprecedented opportunities for human-centric environmental analysis [49,50,51]. The thermal environment and its associated comfort levels demonstrate strong correlations with both objective urban configurations and subjective visual perceptions of streetscapes, particularly regarding visual proportions of tree canopies and spatial distribution patterns of blue–green infrastructure [52,53]. SVIs exhibit distinctive advantages in urban microclimate studies through their dual capacity to capture high-resolution 3D morphological details of built environments while maintaining extensive spatial coverage [54]. This unique combination enables the precise quantification of urban features that critically influence thermal comfort—including building geometry, vegetation distribution, and surface material properties—which often elude detection in conventional low-resolution models [55,56,57]. The integration of streetscape imagery with computer vision techniques has become a prevalent approach for large-scale streetscape analysis [58]. For instance, semantic segmentation techniques have been employed to extract information on the visual scale of vegetation, along with details such as geometry, color, composition, and texture [59,60]. Pioneering studies have further demonstrated the potential of coupling SVI datasets with crowdsourced perception surveys, establishing quantitative relationships between visual environmental parameters and human evaluations of thermal comfort, spatial enclosure, and visual complexity [61,62]. Growing empirical evidence confirms that SVI-based thermal comfort assessment outperforms traditional methods in both resolution and human perception alignment [49]. The visual nature of SVIs inherently incorporates human perspective parameters, effectively bridging the gap between physical environmental measurements and psychological comfort perception [53,63]. Building upon these scientific foundations, this study employs street view imagery as a primary data source to investigate urban thermal comfort dynamics, leveraging its dual strengths in objective environmental quantification and subjective perceptual relevance.
In addition, the emergence of vision–language models (VLMs) with advanced multimodal integration capabilities has opened new frontiers in contextual environmental analysis, particularly through their ability to synergistically process visual data and linguistic descriptors [64,65]. Recent breakthroughs demonstrate that VLMs excel not only in parsing complex spatial relationships within urban imagery but also in generating semantically rich interpretations that align with human cognitive patterns. Feng et al. [66] pioneered the application of VLMs in urban visual assessments, revealing their unprecedented capacity to decode implicit environmental attributes, including safety perceptions and spatial quality, through joint visual–textual reasoning frameworks. This multimodal paradigm proves particularly valuable for thermal comfort evaluation, given its inherent dependence on both physical environmental parameters and subjective psychosocial dimensions. Thermal comfort is fundamentally a psychological state that varies significantly across different social groups, including those with differing economic statuses, occupations, genders, and ages [67]. This suggests that intrinsic factors, such as past experiences, naturalness, expectations, duration of exposure, and the need for environmental stimulation, are also crucial in determining thermal satisfaction [68,69]. Therefore, to enhance the accuracy of thermal comfort assessments, it is essential to consider individuals’ subjective perceptions in full.
By bridging the gap between quantitative environmental features and qualitative human perceptions, VLMs could enable a paradigm shift toward human-centric thermal comfort modeling. This study leverages these advancements to develop a VLM-driven thermal comfort assessment framework that holistically integrates objective urban imagery analysis with context-aware psychosocial evaluation. Four research questions guide this study: (1) is it feasible to assess thermal comfort using VLMs? (2) Can VLM-based agents capture individual differences? (3) Are these differences spatially distinct? (4) What environmental factors contribute to the agents’ decision making?

2. Materials and Methods
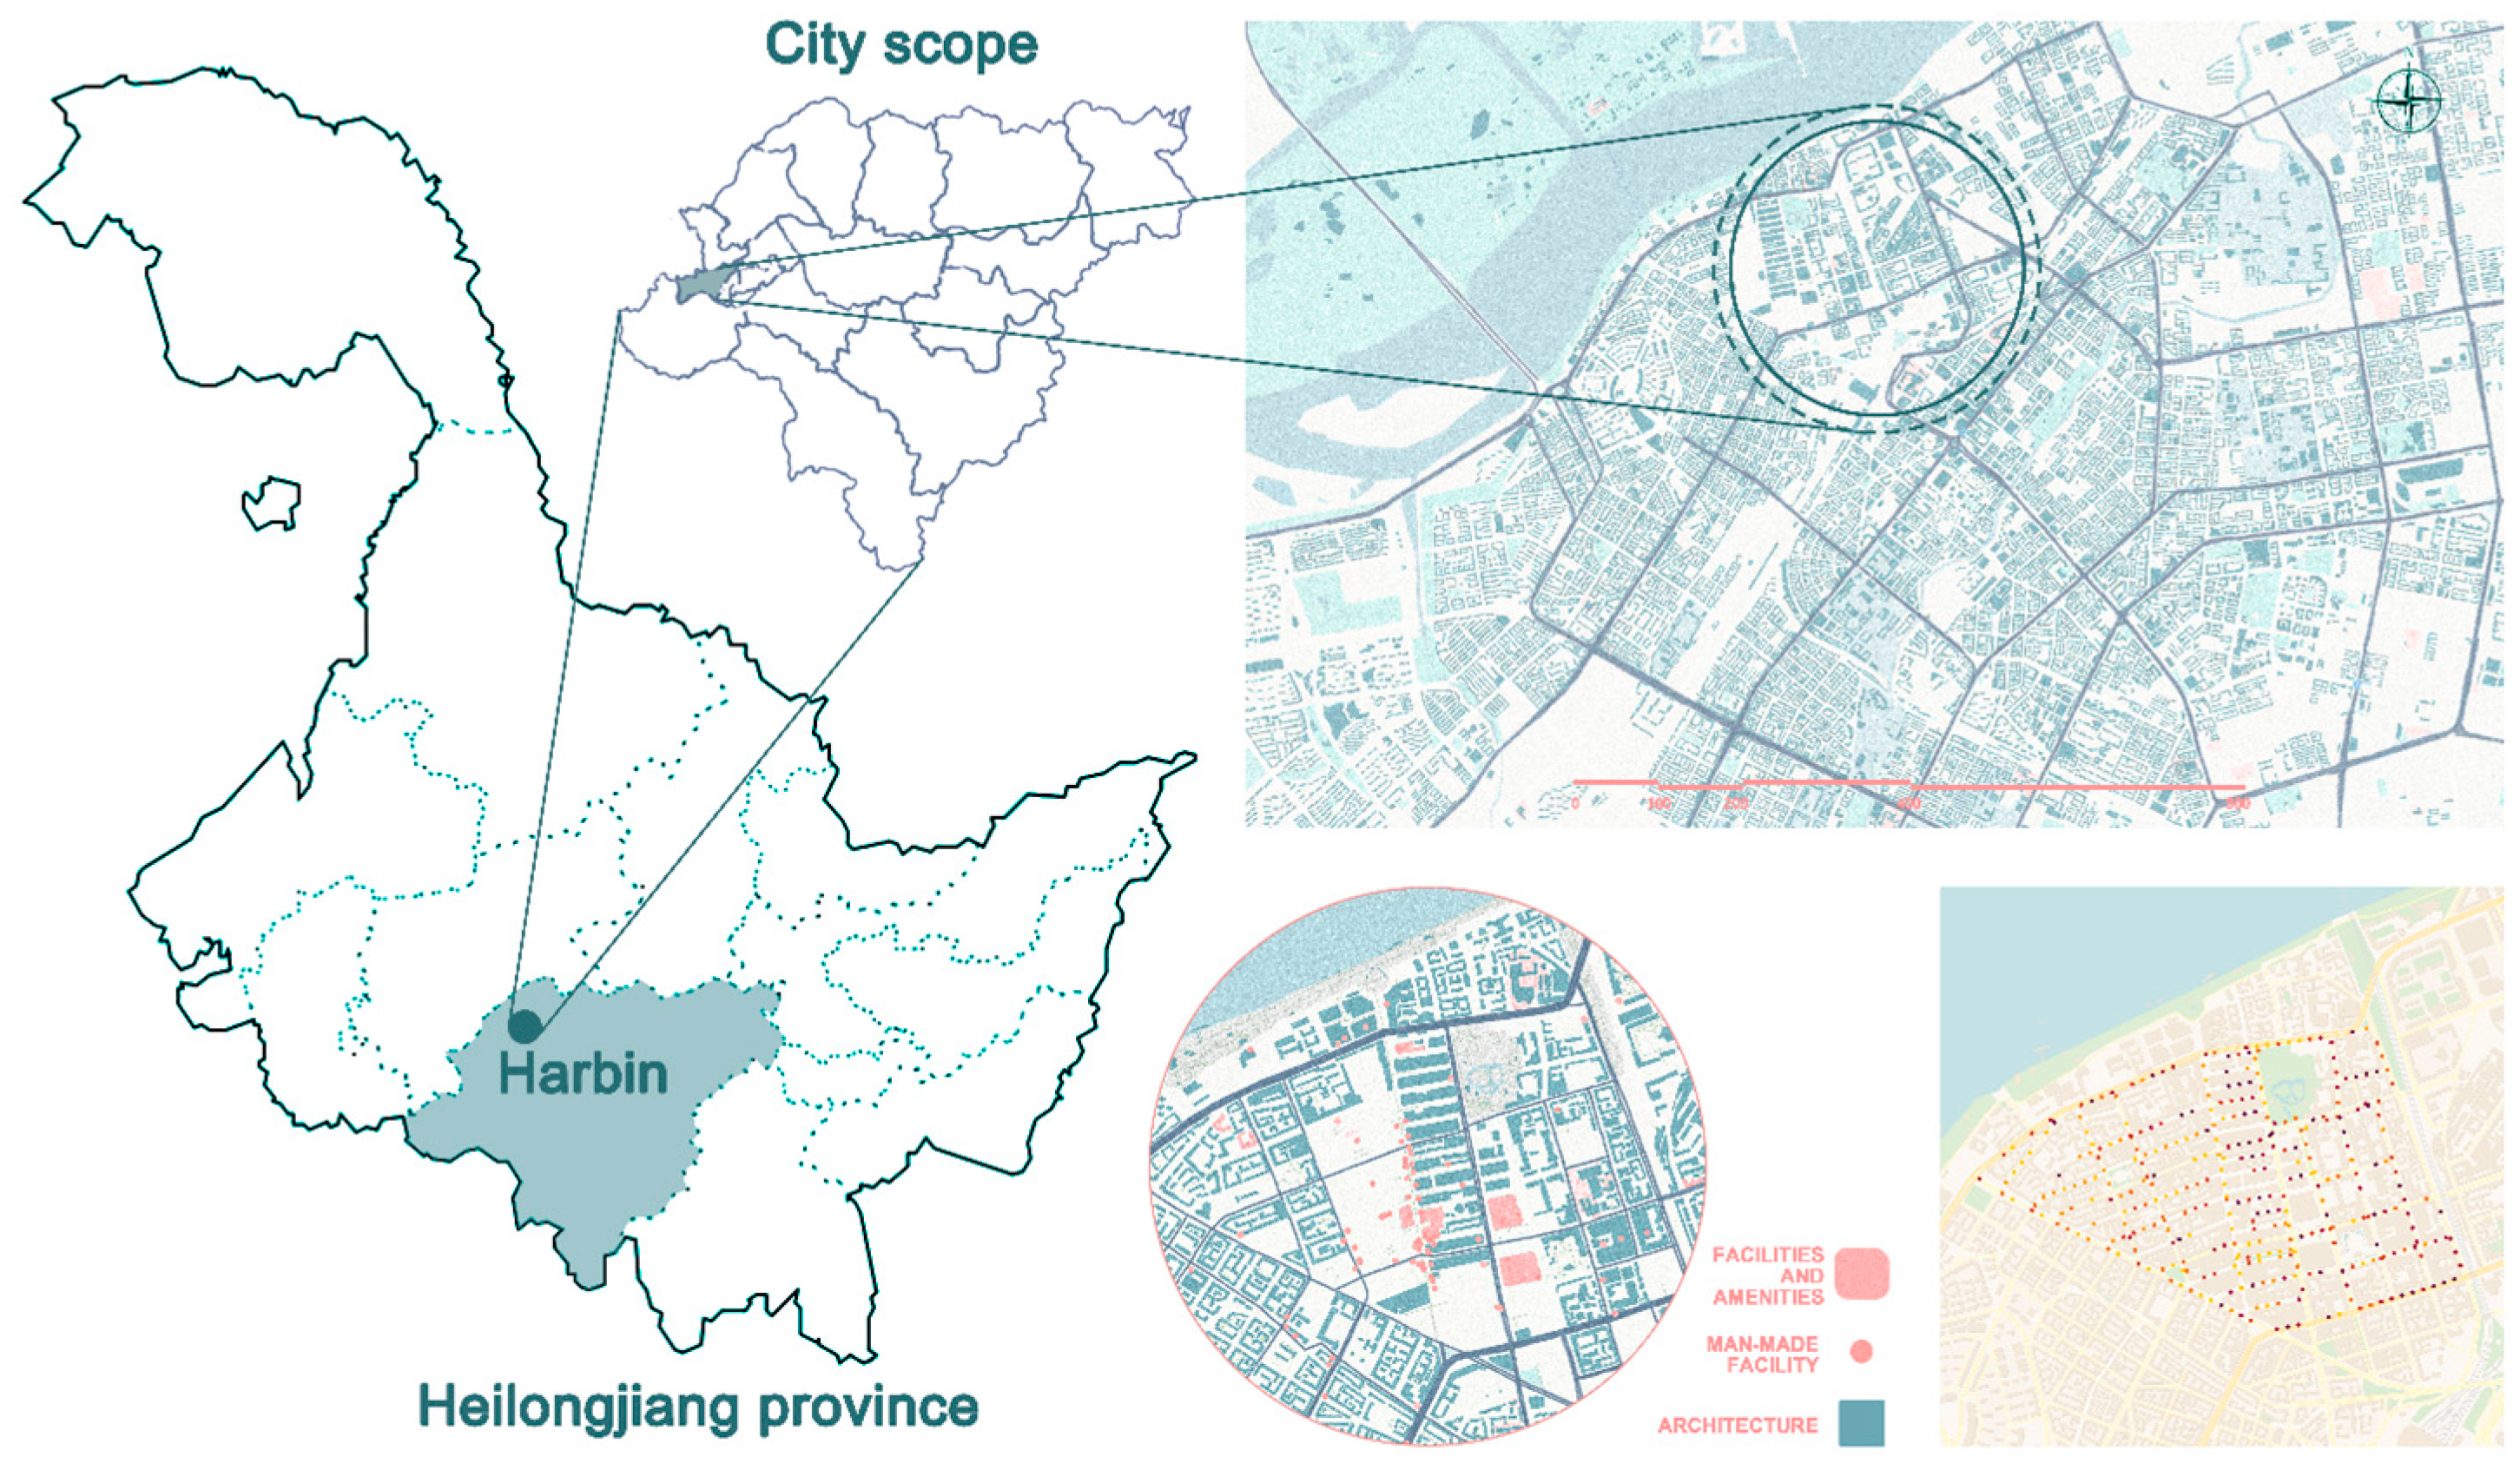
This study is structured around three core components. First, street view image data were collected from a commercial neighborhood using Baidu Maps. ArcGIS was employed to generate sampling points from which images were extracted. Subsequently, the visual environment depicted in these images was assessed using VLMs, with each image being scored for thermal comfort. This process allowed us to simulate and validate human perception, thereby evaluating the consistency between the VLMs’ results and real human experiences. We identified the language model most representative of actual human experience and integrated it with all streetscape images to conduct a comprehensive large-scale analysis. Finally, we analyzed the spatial differences in thermal comfort perception among agents, alongside variations in environmental factors. Pearson correlation coefficients were utilized to examine the relationship between different agents’ perceptions of thermal comfort and commercial vitality.

2.1. Study Area

This study focuses on Harbin Central Street, located in northeastern China (Figure 1). Harbin, the northernmost city in China, spans geographic coordinates ranging from 43°26′ to 53°33′ N latitude and 121°11′ to 135°05′ E longitude. Covering a total area of 53,068 square kilometers, the city has a population of approximately 6.94 million people [70]. As one of Harbin’s most active commercial areas, Central Avenue experiences high levels of tourist traffic. The study area encompasses the primary streets of Jingwei Street, Shangzhi Street, Nanji Street, and the northern section of Yangji Street, all renowned for their bustling commercial atmosphere and iconic buildings. However, the district faces challenges related to elevated summer temperatures and heavy pedestrian foot traffic, both of which contribute to thermal discomfort for residents and visitors alike. Additionally, the limited presence of urban greenery and landscaping reduces the area’s ability to regulate its microclimate effectively, further exacerbating thermal comfort issues.

2.2. Data Collection

ArcGIS Pro was utilized to generate sampling points at 50 m intervals within the study area, capturing their corresponding latitude and longitude coordinates. Using the Baidu Maps API, we conducted a batch crawl of street view images and randomly selected 558 representative samples for this study. The parameters for image acquisition are as follows: the vertical angle (pitch) was set to 20° and the field of view width (focal length) was set to 90°. For each sampling point, a 360° panorama was created by stitching images from four directions, with a maximum resolution of 2028 × 512 pixels. To ensure consistency and accuracy, non-summer and incomplete street view images were excluded to prevent potential bias in the study results.
The Baidu heat map leverages location data from hundreds of millions of users to visualize foot traffic density across different times and geographic areas through density analysis. Using the Baidu API, we retrieved heat map data for 11:00 AM on 8 August 2024, with a spatial resolution of 100 m by inputting the relevant latitude and longitude coordinates. The heat value of each vector point corresponds to the total number of Baidu signal responses within the specified time period and spatial range. Baidu heat map and mobile signaling data are among the most widely used dynamic location-based service (LBS) data, offering precise spatiotemporal information. These data are useful for studying the dynamic distribution of populations and enhancing the temporal resolution of gridded population density maps [71].

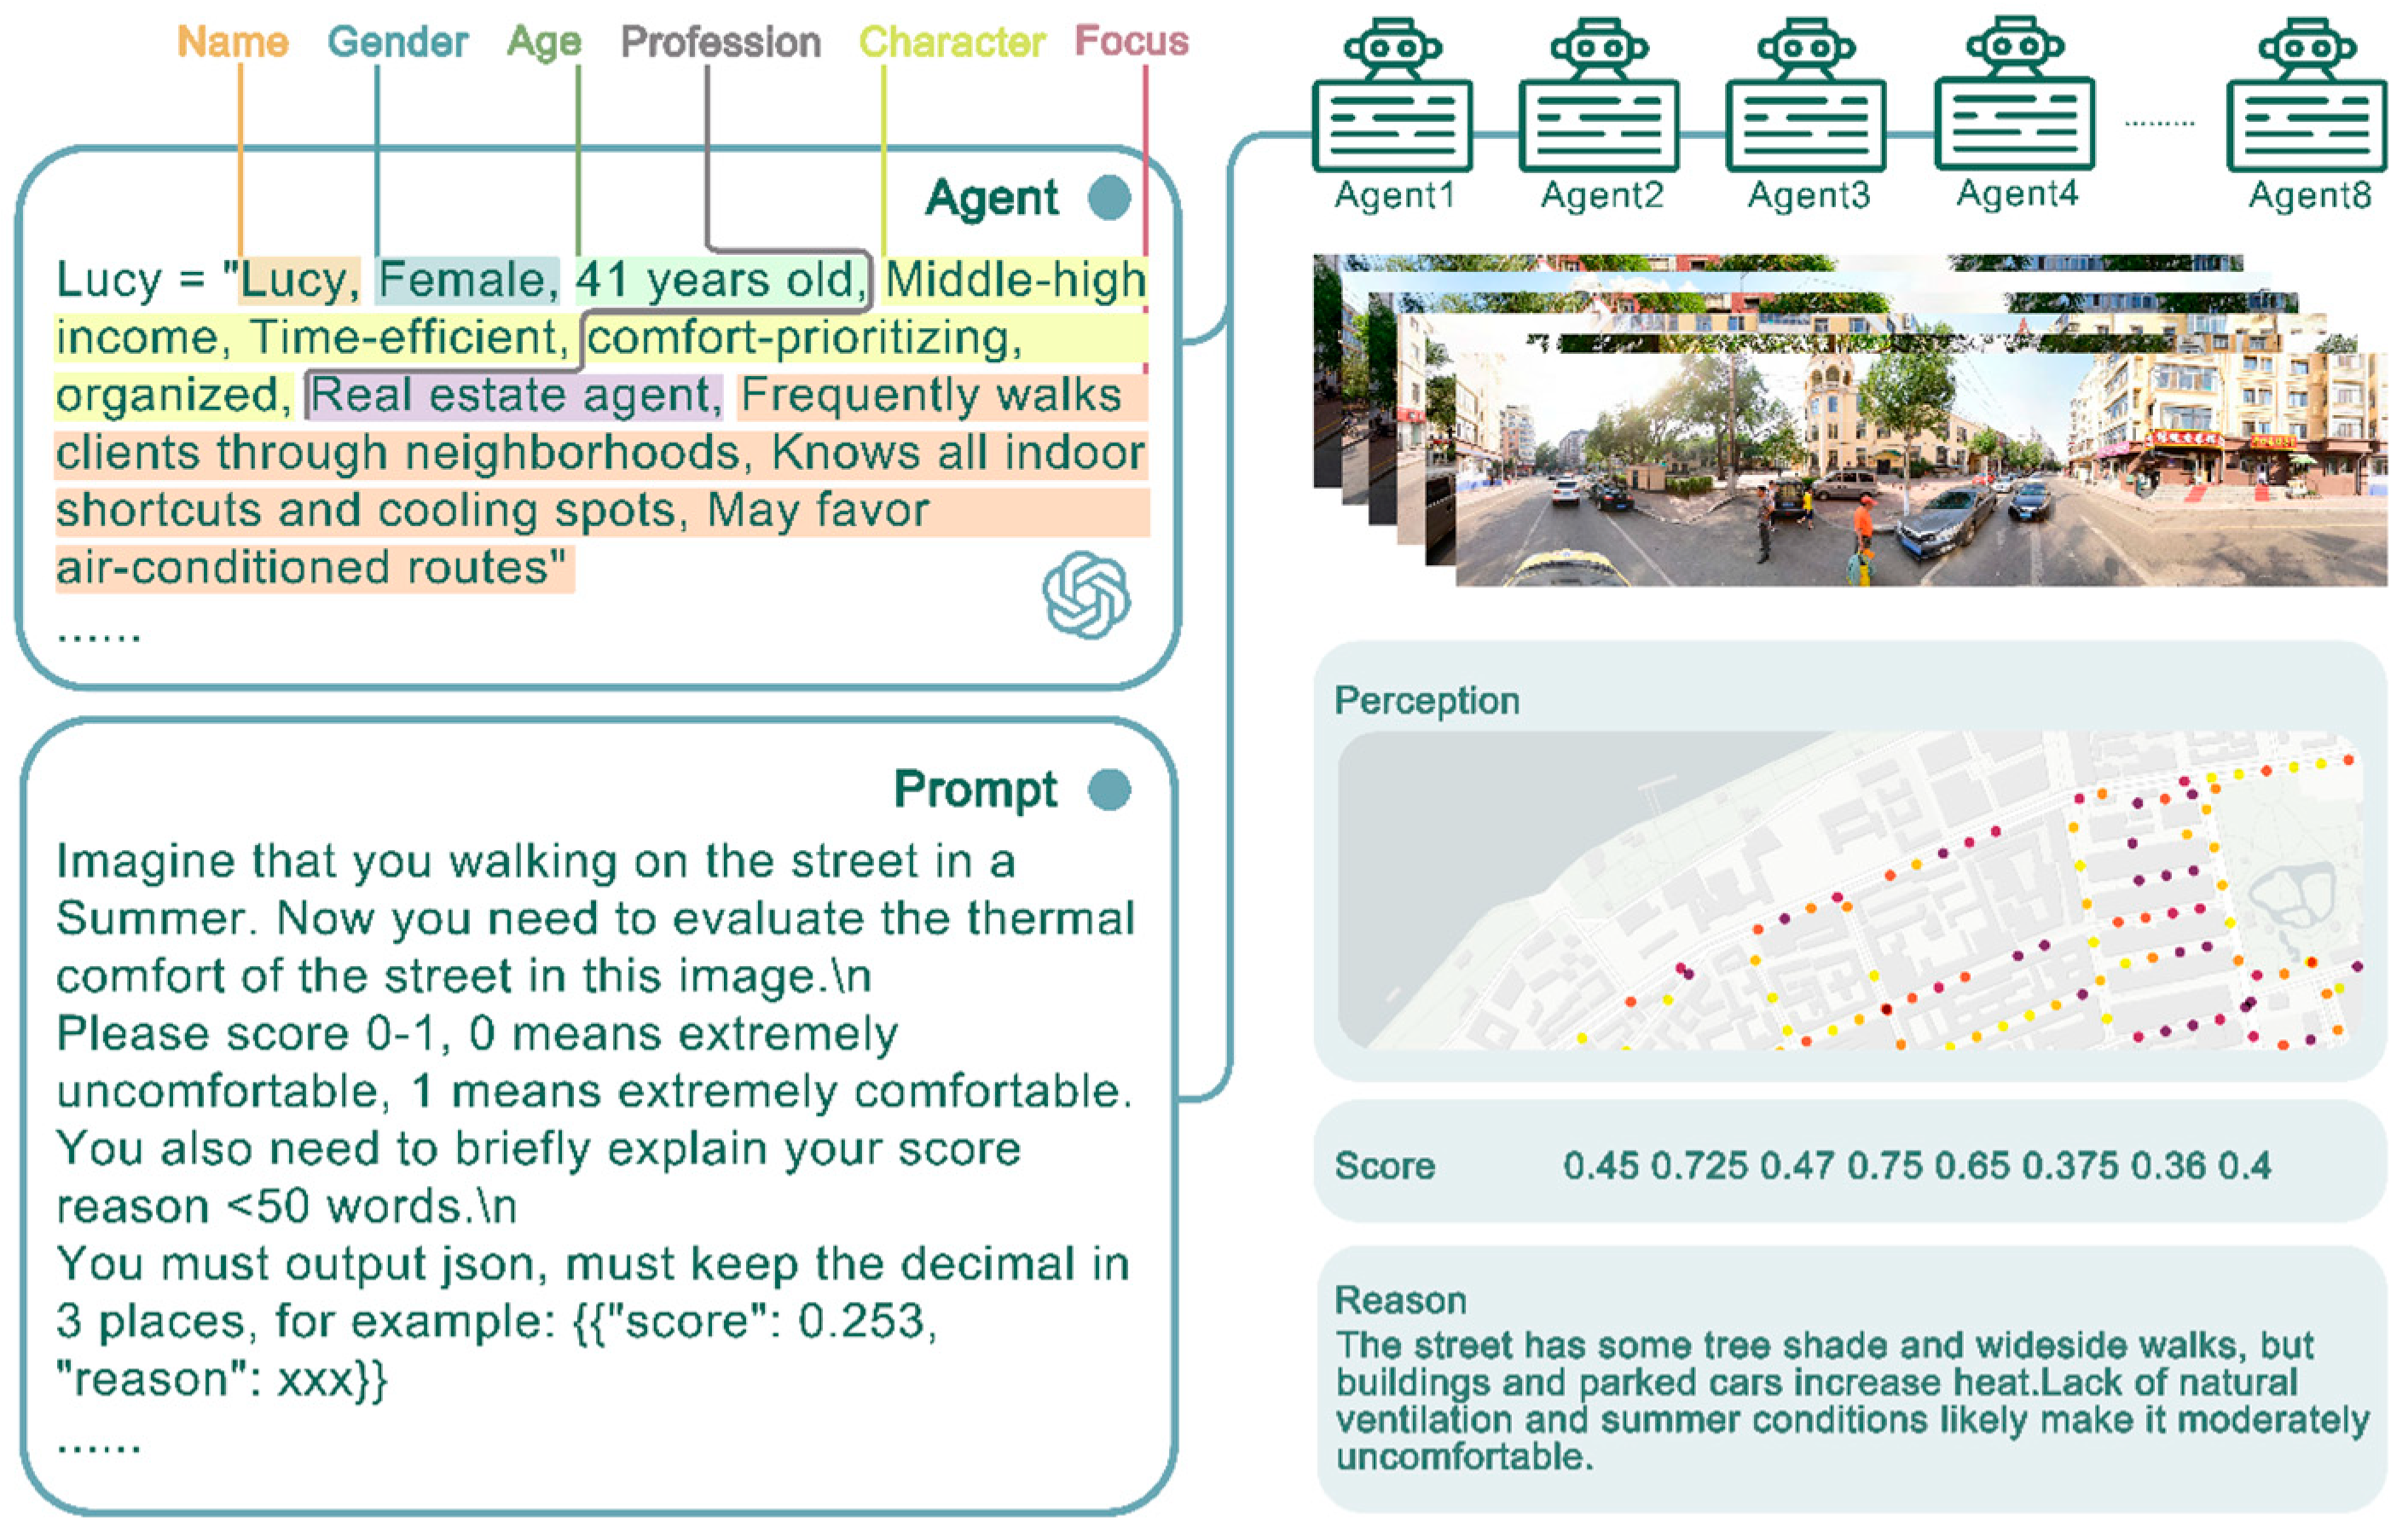
2.3. Thermal Comfort Evaluation Based on VLM Agents

In this study, we developed a thermal comfort evaluation framework based on VLMs (Figure 2). This framework integrates agents and perception by fine-tuning the VLMs through prompt engineering to simulate eight thermally sensitive characters with varying personalities, occupations, and age demographics, thus creating a diverse set of role agents (Table 1). For instance, one role agent, Lucy, is described as follows: “female, 41 years old, middle to high income, values time efficiency, prioritizes comfort, organized, a real estate agent, frequently shows clients around the community, familiar with indoor shortcuts and cooling spots, may prefer air-conditioned routes”. Each role agent assessed the thermal comfort of street images using a scale from 0 to 1, where 0 denotes extremely uncomfortable and 1 denotes extremely comfortable. The evaluation prompt was structured as follows: “At noon, you are standing beside a large shopping center street, with shade on your left. Please evaluate the urban thermal comfort in this image and briefly explain your rating”. This approach enables the VLMs to assess thermal comfort from diverse perspectives and provide explanations for their ratings.
This study further utilizes text ratings generated by VLMs in thematic analysis to explore variations in thermal comfort perceptions across different role agents. VLMs provide notable advantages over traditional thematic analysis models. Traditional models, such as latent Dirichlet allocation (LDA) and bidirectional encoder representations from transformers (BERTs), often struggle to capture nuanced meanings and contextual usage. Furthermore, these models require extensive data cleaning and preprocessing, making them labor-intensive [72]. Moreover, LDA assumes topic independence, limiting its flexibility in practical applications [73]. In contrast, VLMs can process longer contexts and generate more coherent and contextually relevant text, thereby yielding more accurate topic analysis results [74]. Applying thematic analysis using VLMs enhances the accuracy and interpretability of the results, providing a basis for understanding the thermal comfort evaluation decisions of different agents. This approach allows us to better comprehend how various factors influence thermal comfort perception among diverse role agents, thereby offering valuable insights into urban design and thermal comfort management.

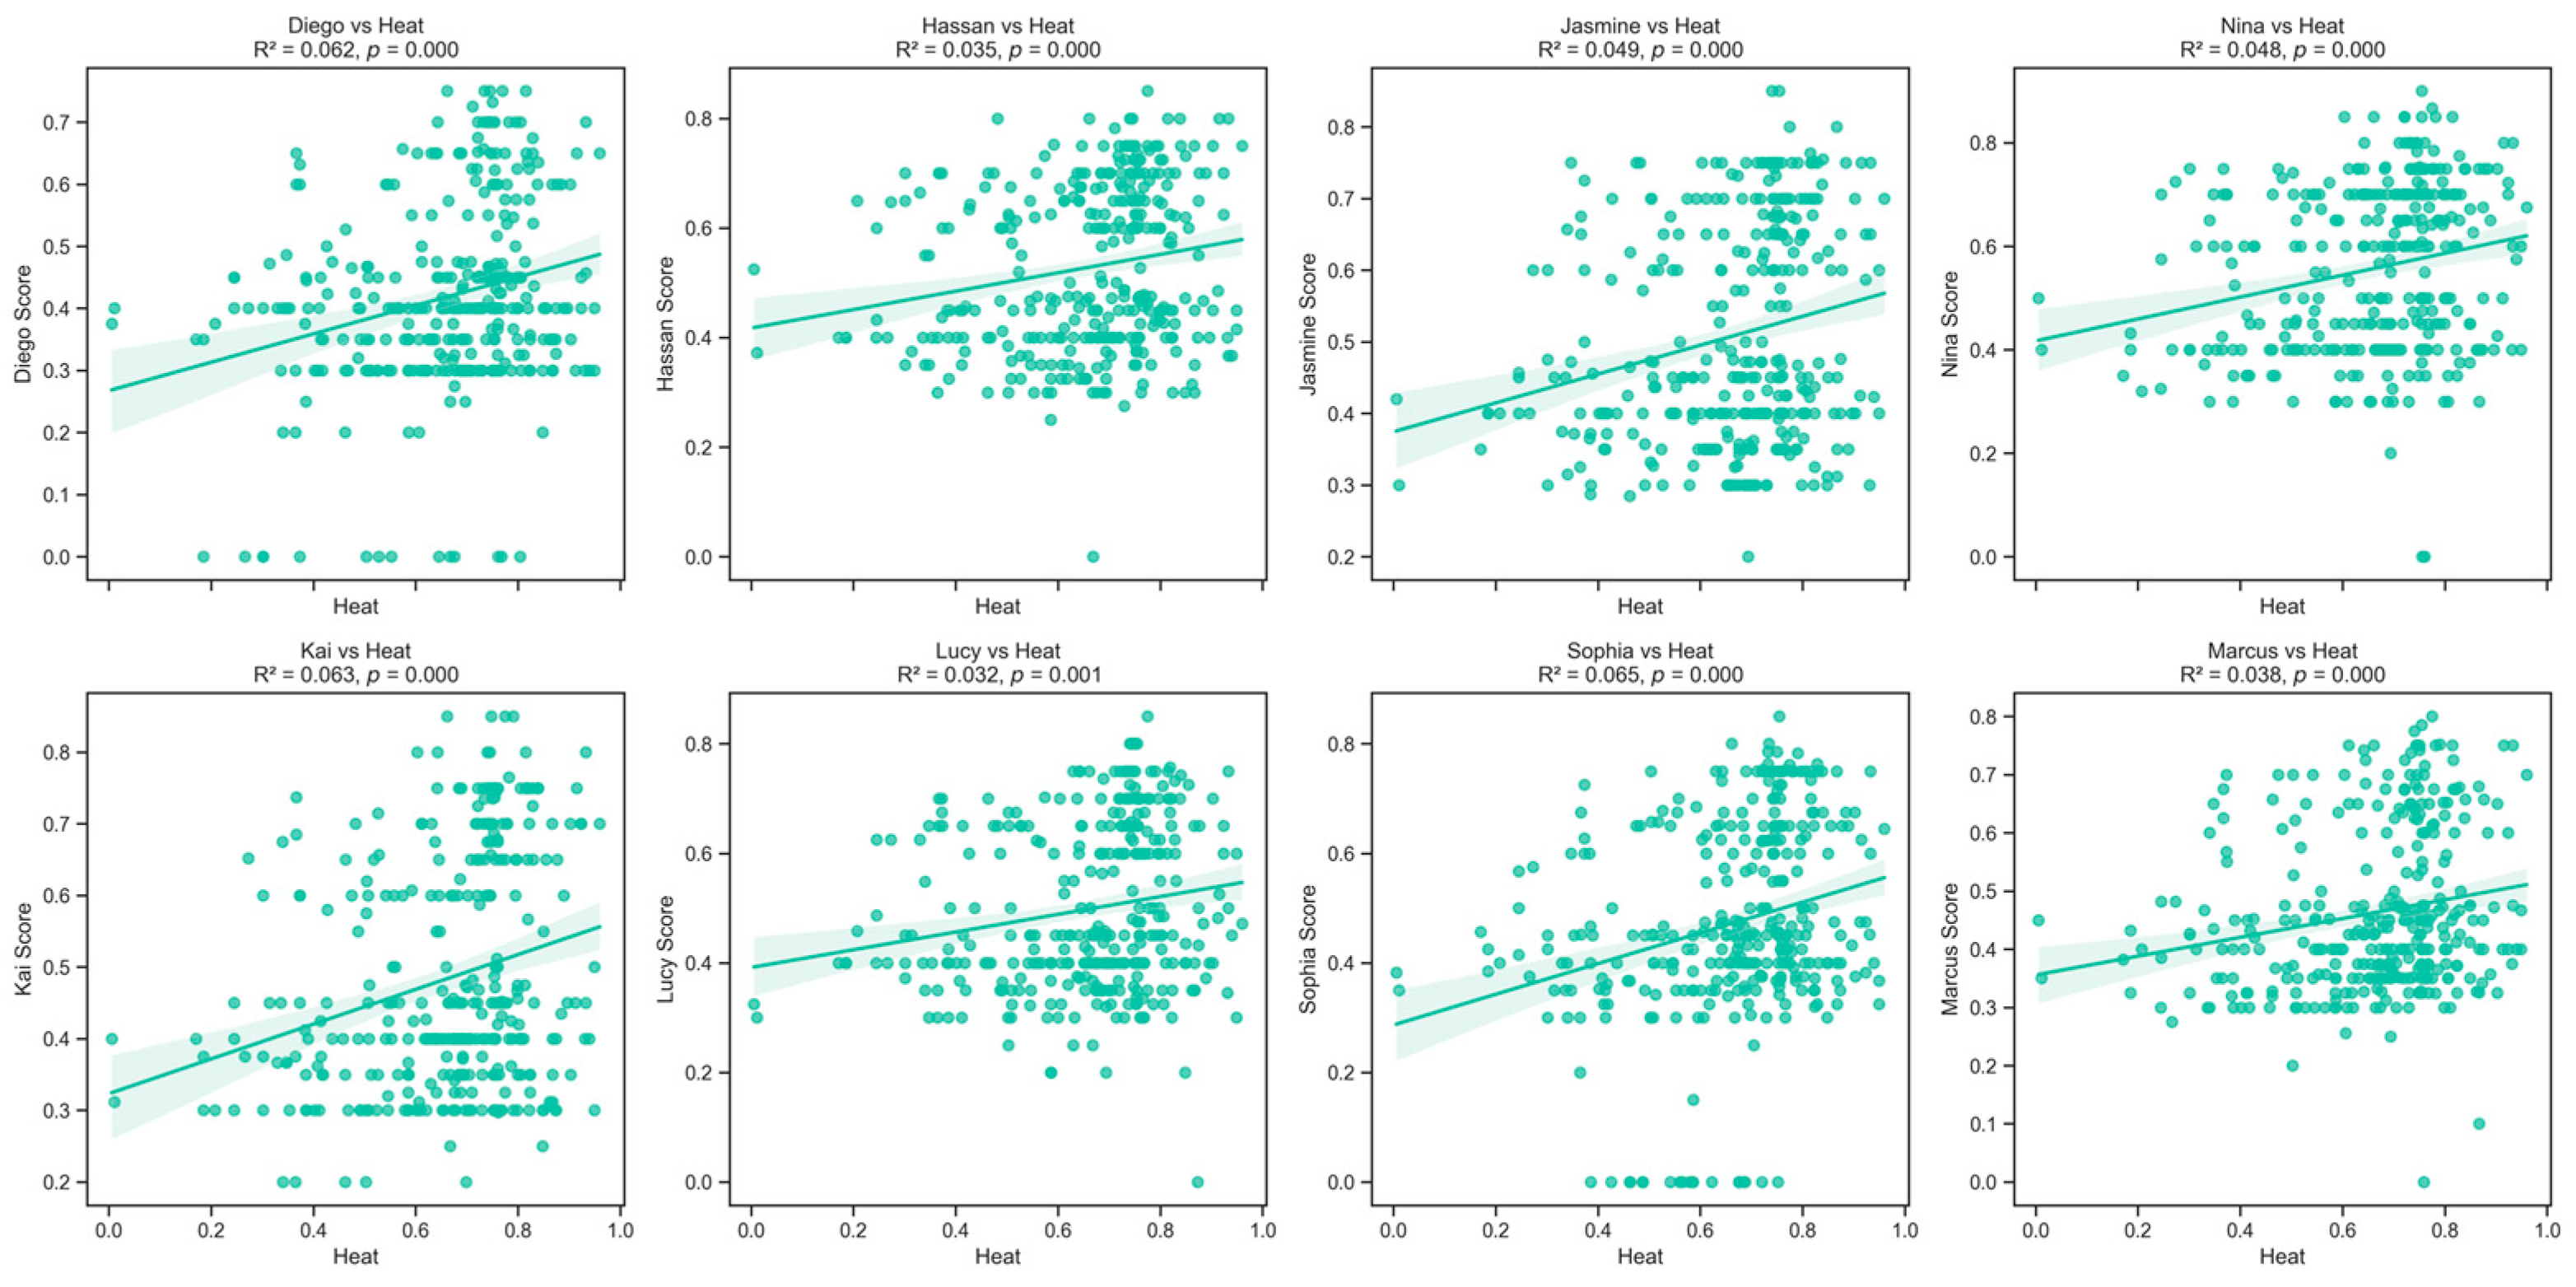
2.4. Analysis of the Relationship Between Thermal Comfort and Commercial Viability

This study explores the relationship between thermal comfort and the popularity of commercial spaces by combining Baidu heat map data with VLM-based assessments. First, thermal comfort indices in street view images were identified from a human perspective using VLMs. Subsequently, the linear relationship between thermal comfort and commercial vitality was analyzed using Pearson’s correlation coefficient. The Pearson correlation coefficient quantifies the strength of the relationship between two variables, helping to assess the impact of thermal comfort on business viability [75]. In this study, eight role agents, generated by VLMs, evaluated 558 streetscape images on a thermal comfort scale from 0 (extremely uncomfortable) to 1 (extremely comfortable). The VLM-based ratings were then analyzed using Pearson’s correlation coefficient in relation to the street vitality data from the Baidu heat map. The formula for Pearson’s correlation coefficient is as follows:
r = i = 1 n X i X ¯ Y i Y ¯ i = 1 n X i X ¯ 2 i = 1 n Y i Y ¯ 2
where X and Y represent the thermal comfort score and the commercial viability score, respectively. This analysis allowed the correlation between thermal comfort and business vitality to be quantified and assessed for statistical significance.

3. Results

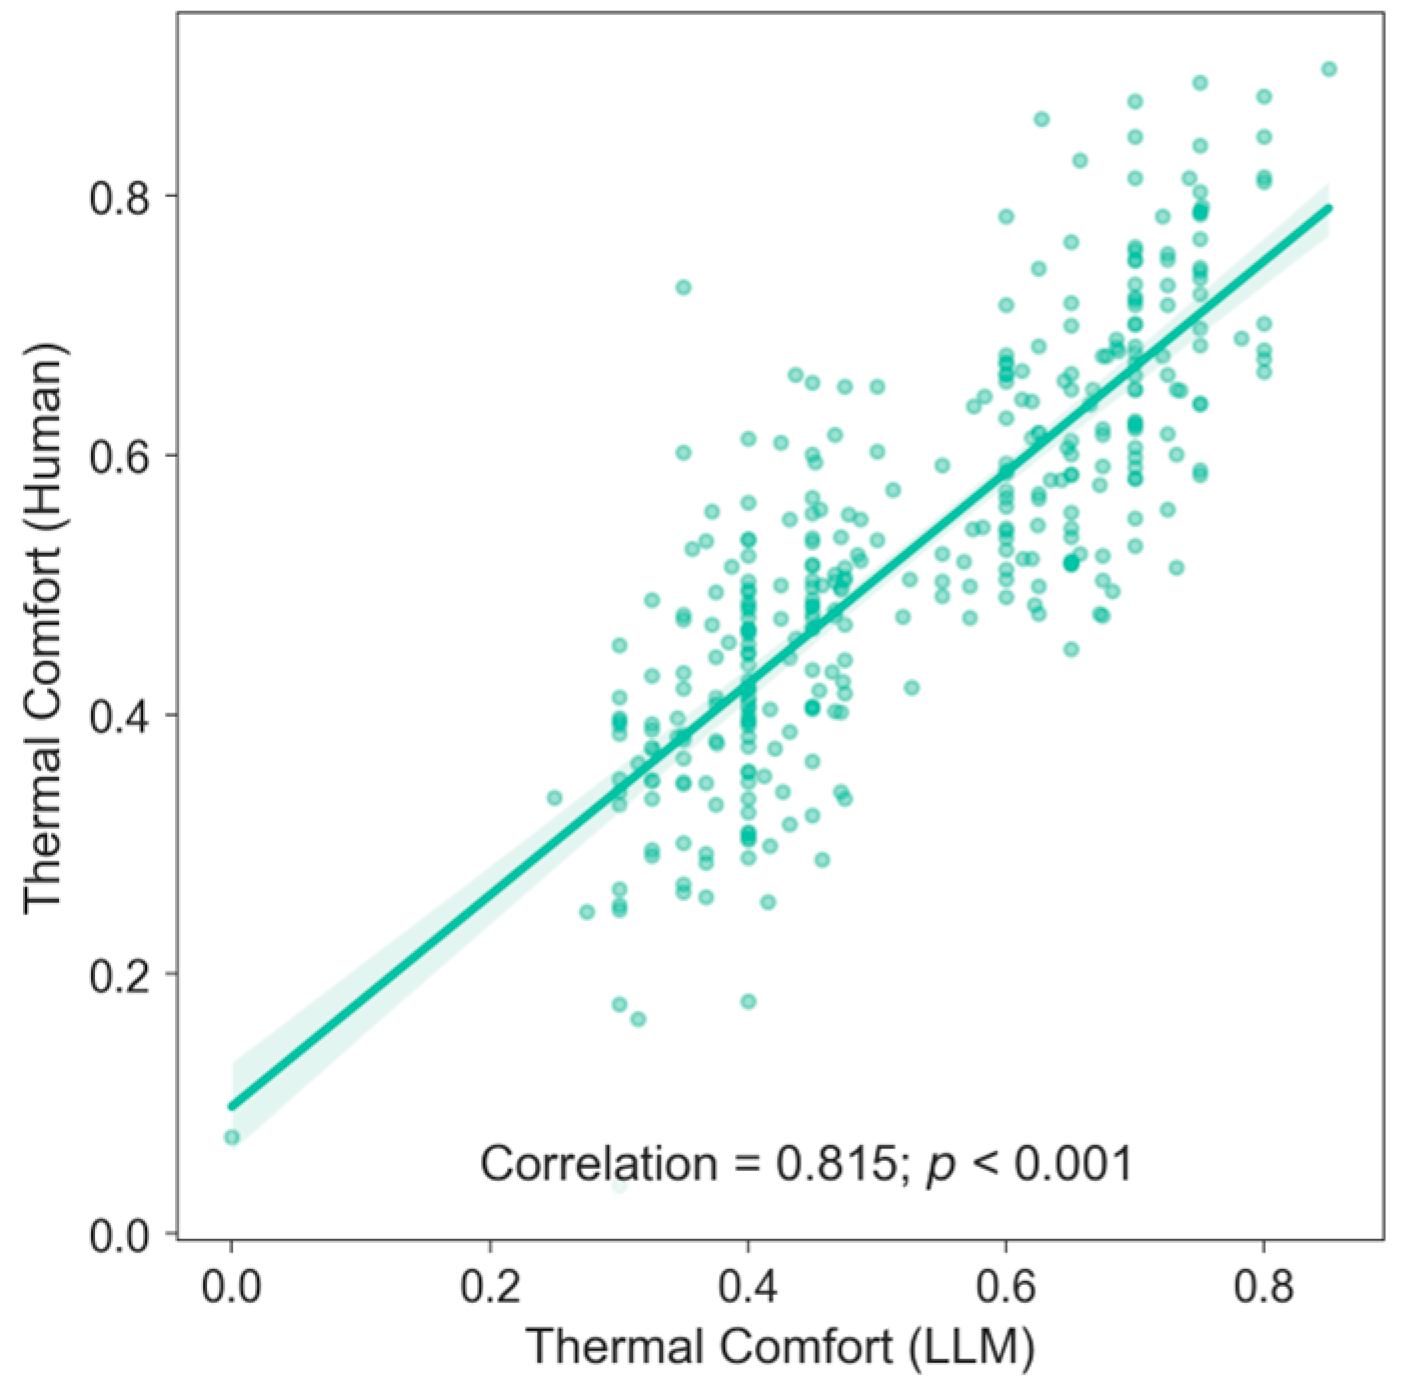
3.1. Validation of VLM-Based Thermal Comfort Assessment

To validate the accuracy of the VLM assessment results, we first conducted an evaluation without assigning any specific roles to the VLMs. Instead, simple prompts were used to allow the VLMs to score the thermal comfort of the environment based on street view images. Expert evaluations were then collected to verify the stability of using VLMs for thermal comfort assessments. Specifically, 50 experts from relevant fields (urban planning, architecture, environmental engineering, and human thermal comfort) were invited to rate a random sample of 30% of the total 558 street view images, i.e., 167 images. The five-point ASHRAE scale was employed to calculate the average thermal comfort score for each street view image. Final scores were averaged across all experts and normalized to a range between 0 and 1, where values closer to 0 indicate poorer thermal comfort conditions and values closer to 1 represent optimal comfort. The results of this study reveal a significant correlation between the VLM-based assessments and expert evaluations (r = 0.815, p < 0.001), confirming the feasibility of using VLMs to simulate human thermal comfort assessments (Figure 3).
Spatial analysis of the study area (Figure 4a) revealed that areas adjacent to Harbin Central Street exhibited the highest levels of commercial vitality, particularly Area G, which hosts several large commercial complexes and functions as a major tourist hub. The urban morphology of Harbin Central Street contributes significantly to its thermal comfort characteristics. Specifically, it features a 10.8 m wide stone pavement with a motor vehicle ban, and building heights on both sides of the street range predominantly between 13 and 14 m, with a maximum height of 24 m. The street width is approximately 24 m, resulting in a height-to-width ratio ranging from 1:2 to 1:1. According to urban design principles, this spatial configuration promotes positive external spaces, enhances natural ventilation through channel effects, and creates balanced patterns of sunlight and shade, thereby improving overall thermal comfort conditions. Further correlation analysis between thermal comfort scores and commercial viability metrics demonstrated a significant positive relationship (r = 0.187, p < 0.001), as illustrated in (Figure 4b). This moderate but significant correlation indicates that thermal comfort is one of several factors contributing to commercial vitality, alongside other urban characteristics, such as accessibility, retail mix, and cultural attractions.

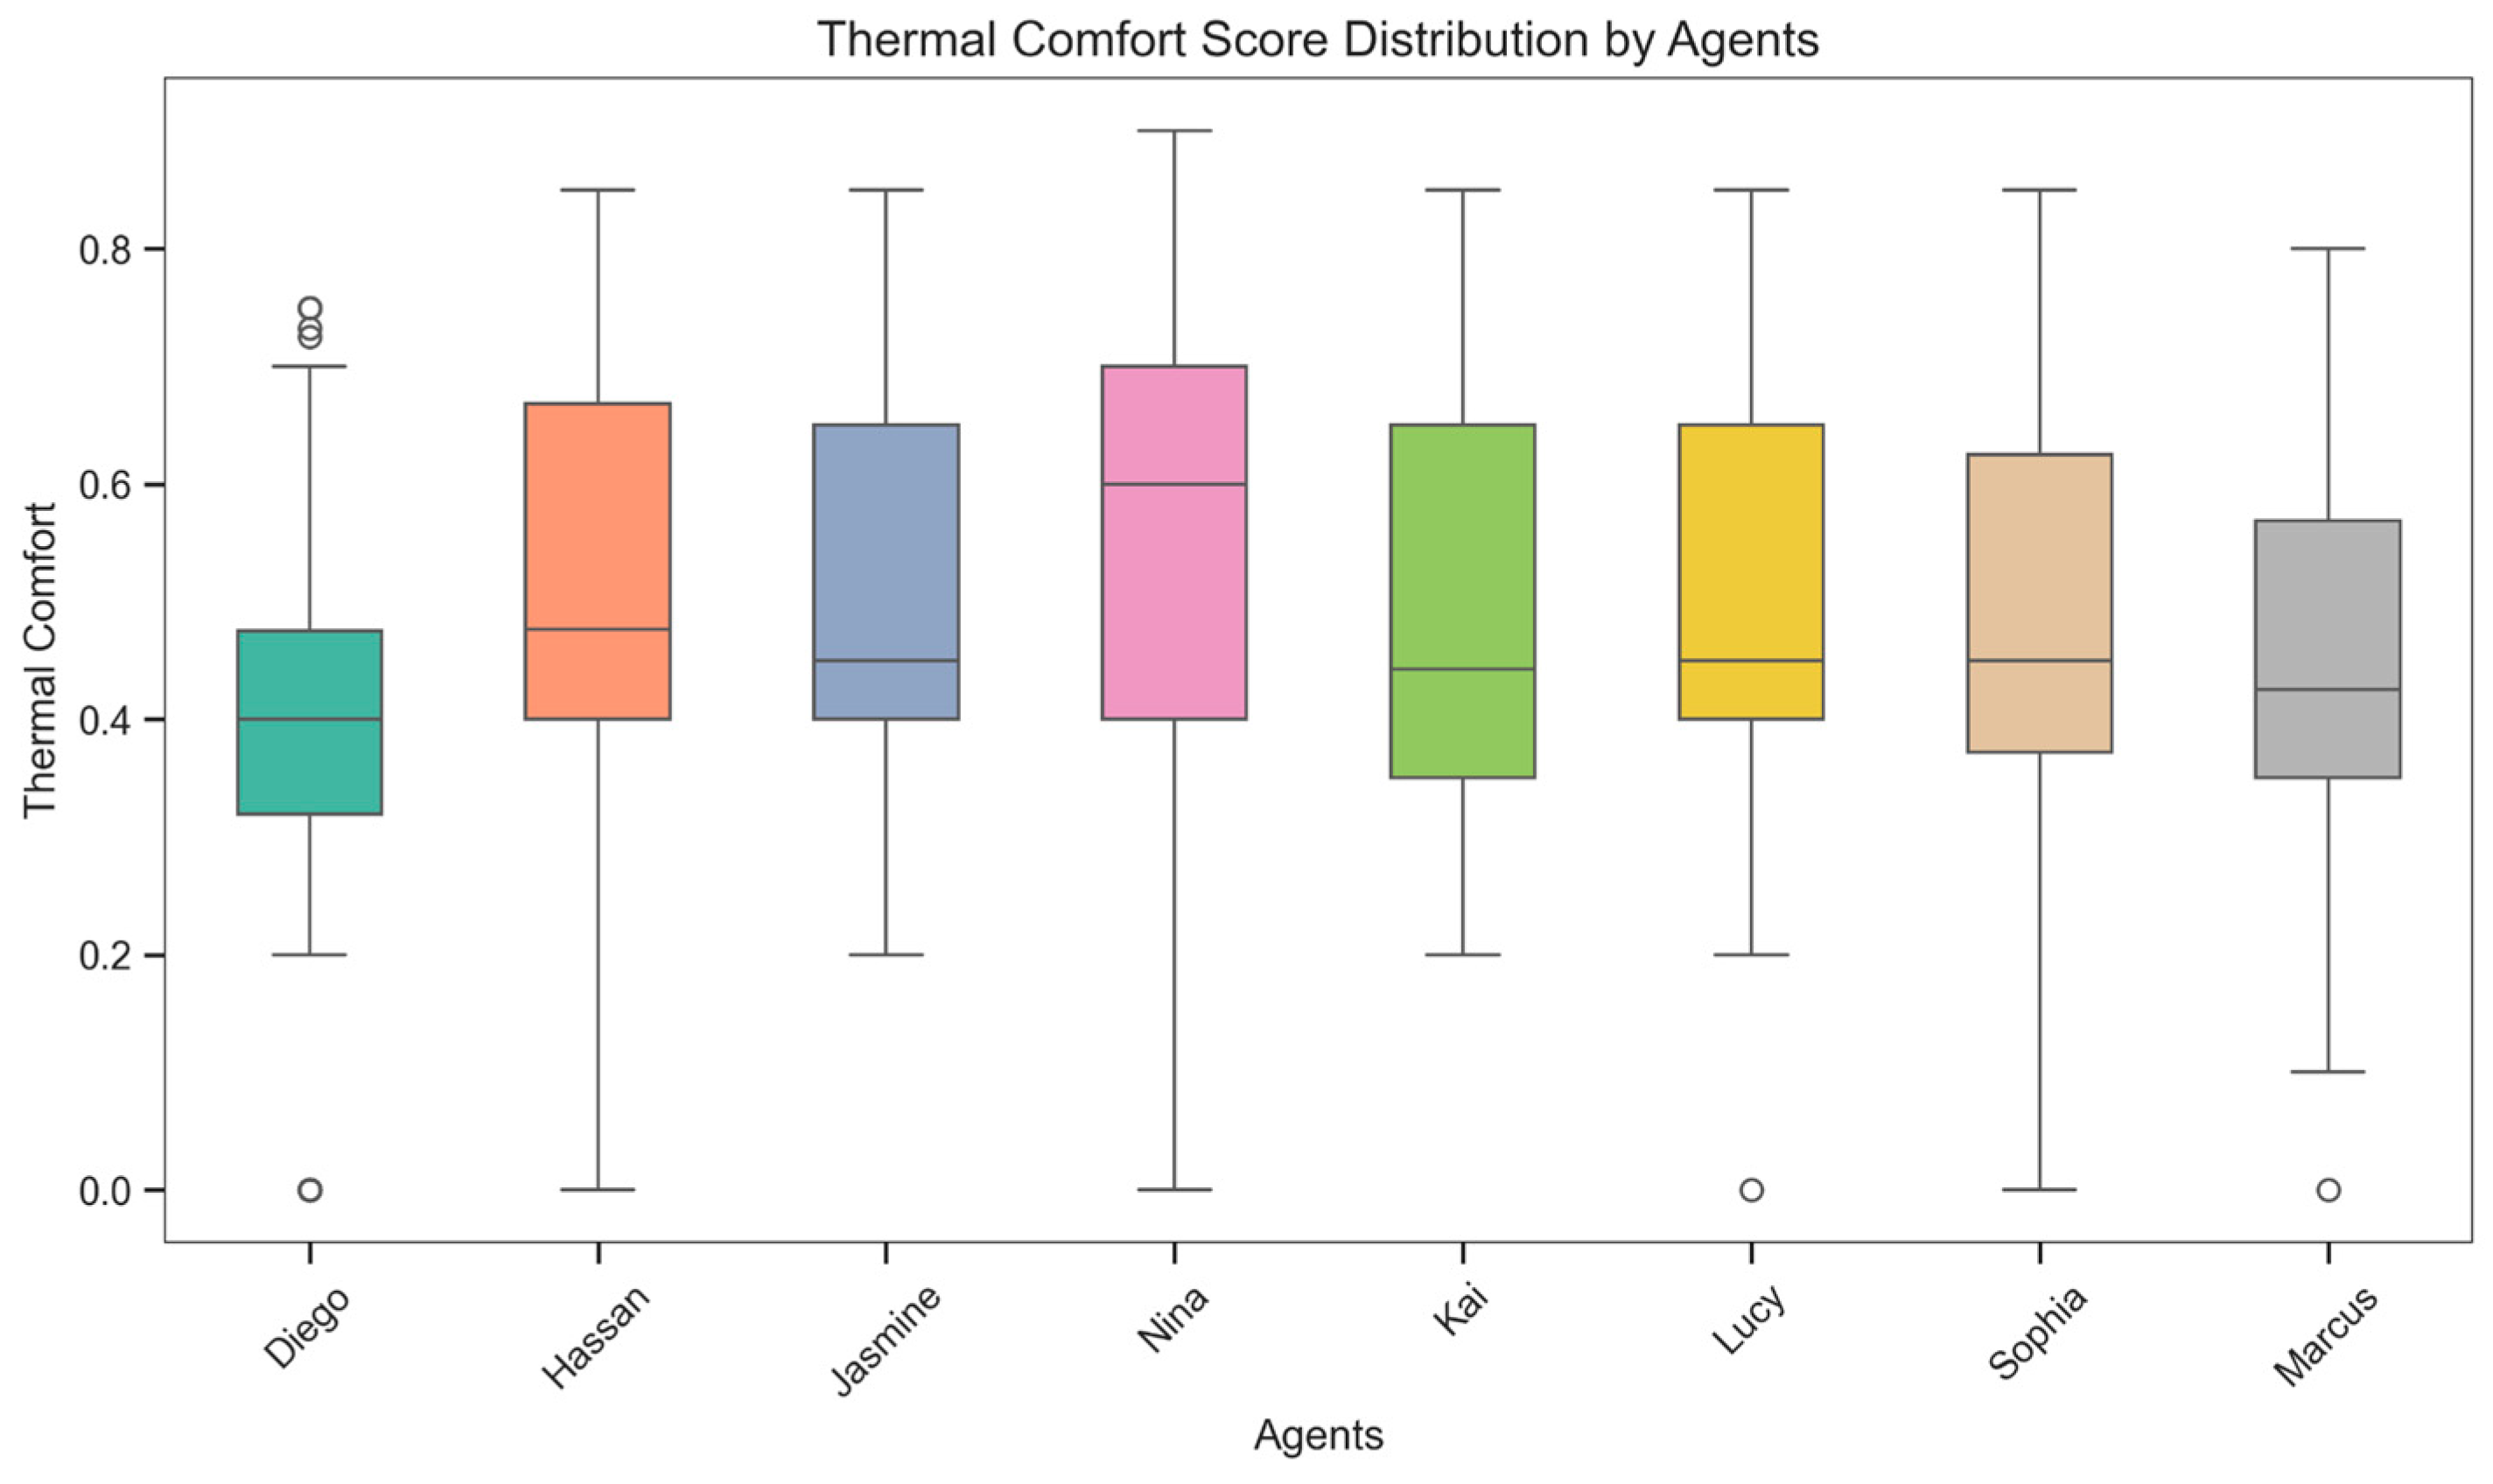
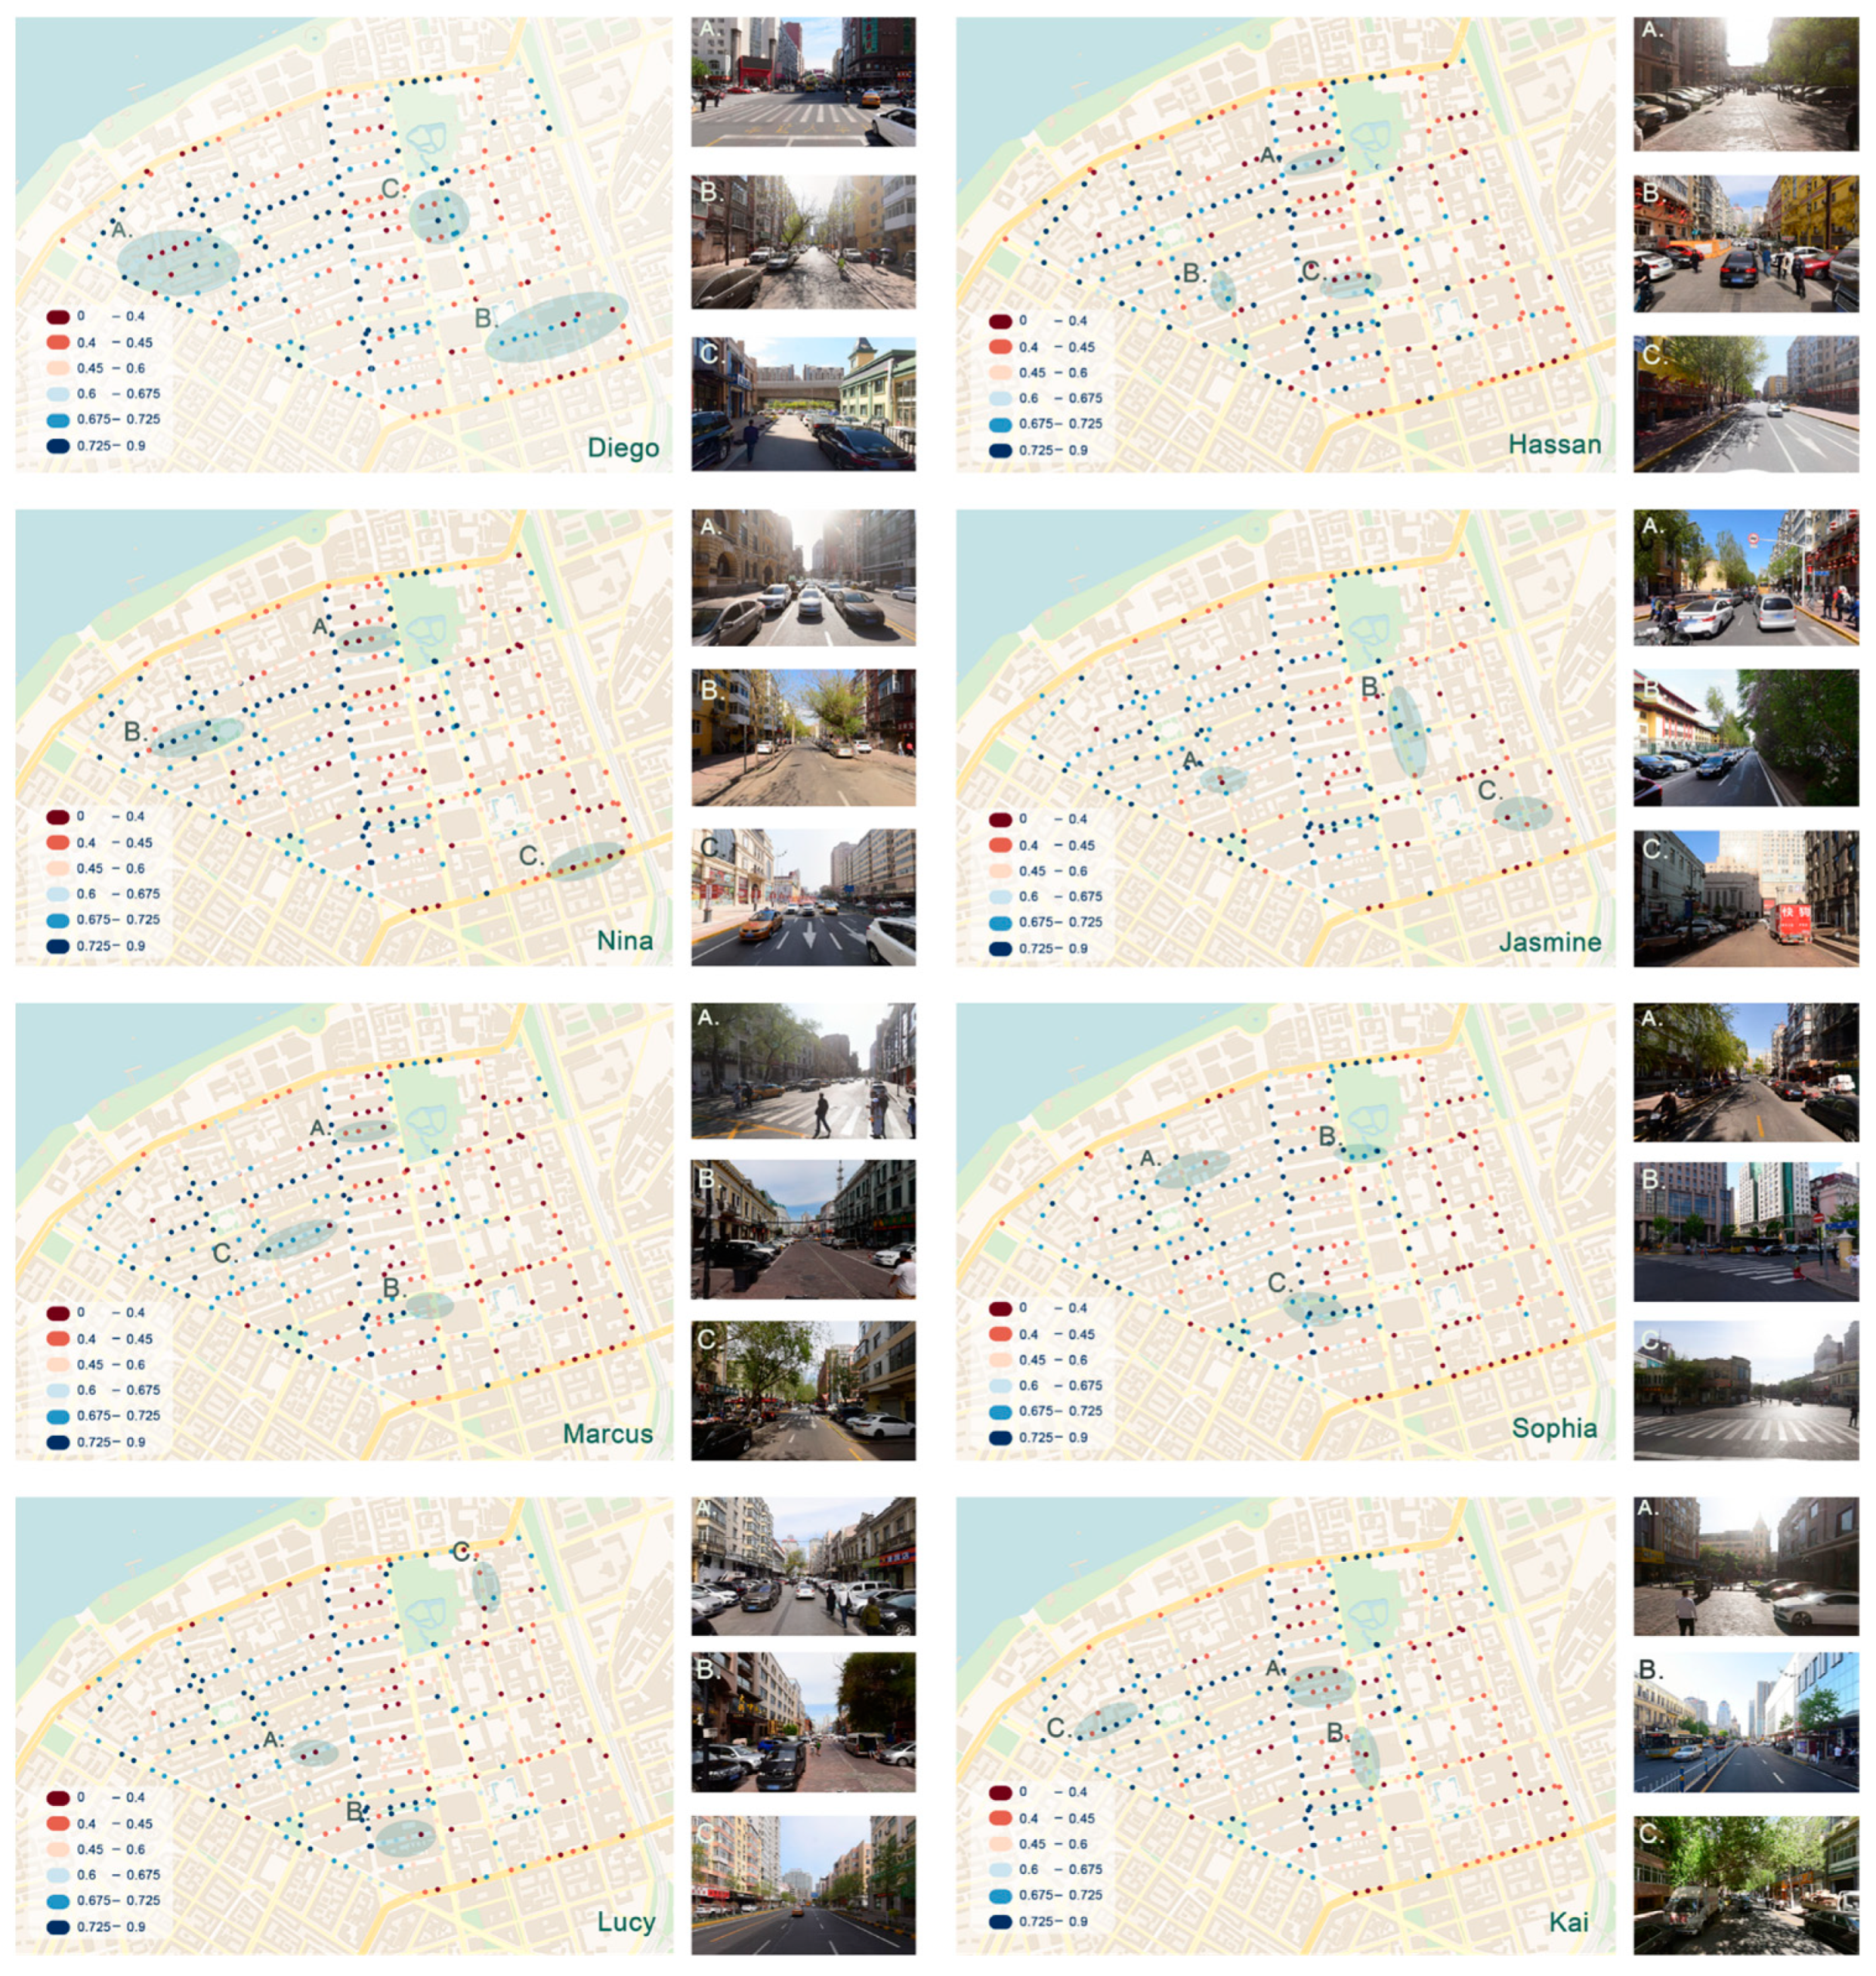
3.2. Difference in Perceived Thermal Comfort Between Agents

Building on our initial validation, we examined the capability of VLMs to model the perception of thermal comfort across different demographic groups. This study developed eight role agents with diverse demographic characteristics (as detailed in Table 1). These agents assessed the thermal comfort of the study area, and statistical analysis revealed significant differences in thermal comfort ratings among the role agents (p < 0.05), indicating that VLMs effectively capture the perceptual differences across groups (Figure 5). As shown in Figure 5, Nina (community health worker) demonstrated the highest median rating (0.6), while Diego (food delivery rider) showed the lowest median rating (0.4), which may be attributable to factors such as gender, age, or occupational background. Interestingly, four agents (Kai, Lucy, Sophia, and Marcus) exhibited similar rating patterns, all indicating a strong concern for factors such as shade, greenery, traffic, and heat exposure, despite their differing demographic characteristics. Boxplot analysis further revealed that Nina’s ratings were skewed toward the 25th percentile while Diego’s ratings exhibited a relatively symmetrical distribution. The ratings of Hassan, Nina, and Kai exhibited a broader distribution, whereas Diego’s ratings were more concentrated, suggesting different levels of sensitivity to environmental variations. Additionally, several statistical outliers were identified in the datasets (e.g., Diego, Lucy, and Marcus), indicating substantial differences in how thermal comfort was perceived by individuals in specific environments. The distribution patterns presented in Figure 5 demonstrate that our VLM-based approach successfully captures perceptual differences when modeling diverse demographic profiles. This validates its effectiveness for representing individual variations in thermal comfort assessments, thereby enhancing its applicability in urban design and human-centered environmental studies.
Regarding spatial distribution, thermal comfort within the study area exhibited significant spatial heterogeneity (Figure 6). Thermal comfort was lower in the western region, higher in the eastern region, and more favorable at the northern and southern ends compared to the central region. Specifically, thermal comfort was generally lower in Area A (residential neighborhoods) due to limited green coverage, high building densities, and heavy traffic. In contrast, thermal comfort was higher in Area B (commercial neighborhoods) due to improved building shading and the use of high-albedo materials, despite narrower roads. Area C (areas with superior greenery) exhibited the highest thermal comfort, attributed to low traffic flow, moderate shading, and an abundance of greenery. All role-playing agents unanimously rated Area C as having the highest thermal comfort due to low traffic, moderate shading, and abundant greenery.
Specifically, Diego, characterized by a lower concern for thermal comfort, prioritized practicality and adaptability. His evaluation of Area A significantly differed from those of other characters, suggesting that, despite the area’s open views, building shade might lead to prolonged periods of direct sunlight and high traffic congestion, thereby reducing thermal comfort. In contrast, the small-scale roads and building shading in Area B enhanced its thermal comfort, making it more favorable by comparison. Hassan focuses more on pedestrian flow and tends to overlook the impact of traffic. He rated Area A poorly due to its limited greenery and poor shading, while rating Area B highly because of its light-colored building surfaces and highly reflective materials, which enhance thermal comfort. Additionally, Sophia focused on the overall characteristics of large, high-end commercial neighborhoods. She rated Area A poorly due to aging buildings, limited commercial activity, and poor road planning, while rating Area B highly for its light-colored surfaces and spacious streets that enhance both thermal comfort and aesthetics. Kai was particularly concerned with the sustainability of the streets and the extent of greenery. He rated Area A poorly due to an uneven distribution of greenery, while rating Area B highly for its uniform greenery and highly reflective materials that enhance thermal comfort.
Regression analysis of the scores from the eight role agents, in conjunction with commercial viability data, revealed a significant positive correlation (p < 0.001) between thermal comfort and commercial viability across all roles (Figure 7). Although the R² values varied across agents, ranging from 0.032 to 0.065, all regression lines exhibited an upward-sloping trend, indicating that increased thermal comfort significantly influences business dynamism. These consistent findings across multiple demographic proxies strengthen the evidence for thermal comfort as an important factor in the vitality of commercial spaces. Through a VLM-based simulation of diverse demographic groups’ thermal comfort perceptions, our study highlights systematic variations in comfort evaluations while demonstrating a robust correlation with commercial vitality across all simulated profiles. The consistency of this relationship, despite the heterogeneity in thermal comfort evaluations, offers a scientific foundation for optimizing urban thermal environments and provides empirical support for prioritizing thermal comfort considerations in commercial space planning.

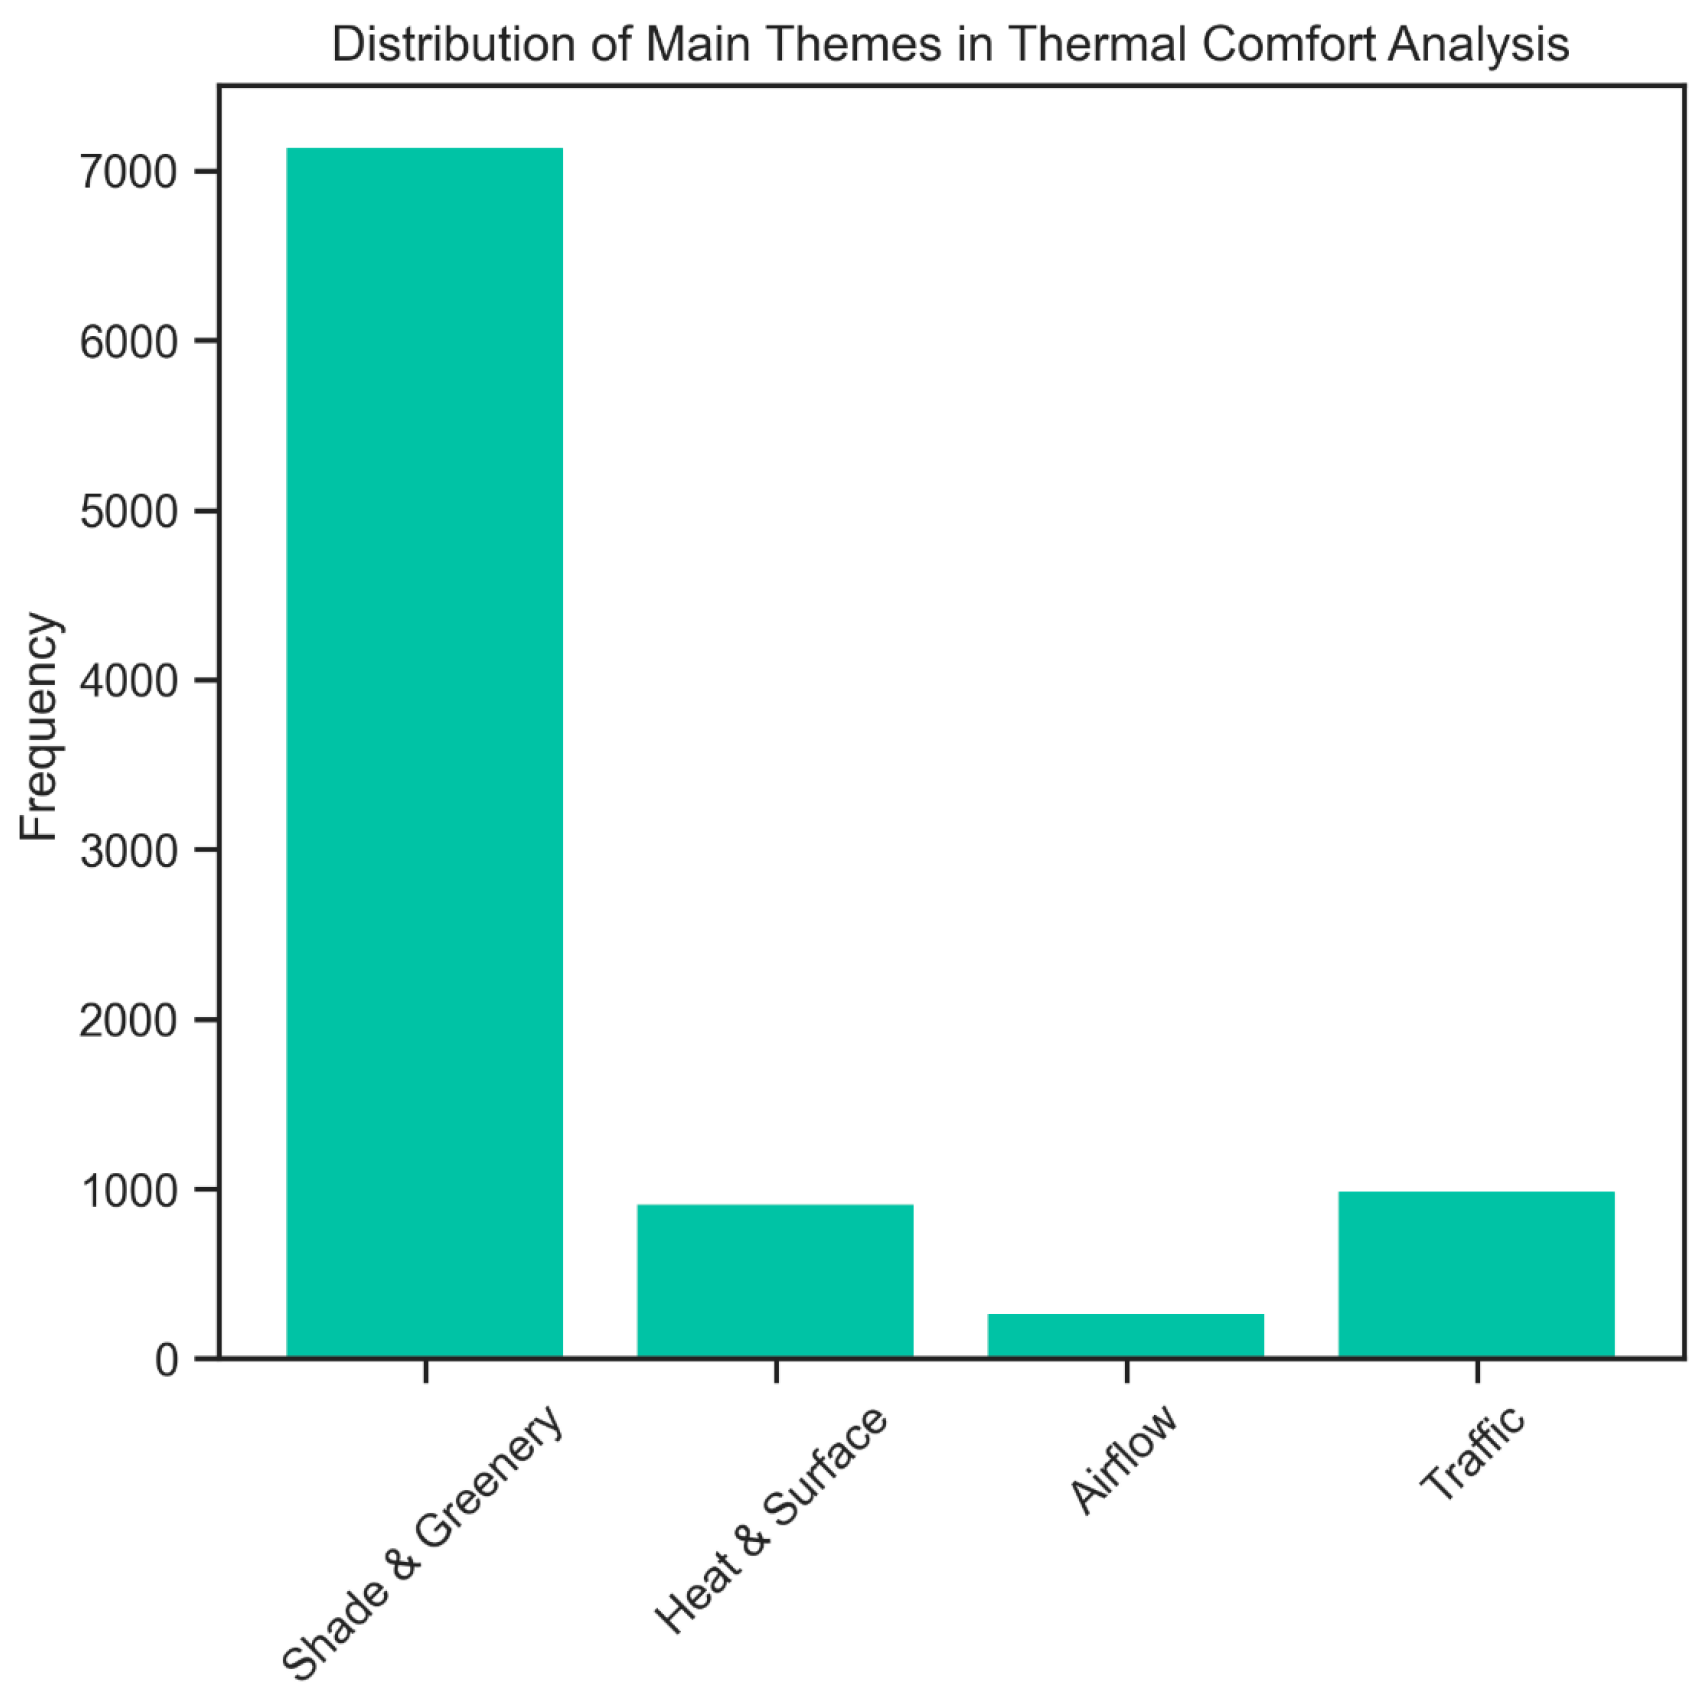
3.3. Identifying Agent Decision-Making Environment Factors

To gain a deeper understanding of the differences in thermal comfort perceptions across various role-playing agents, this study employed structured thematic analysis to systematically identify and categorize recurring themes in the thermal comfort evaluation texts generated by the VLMs. Following established thematic analysis protocols, the evaluation texts were coded and grouped into four primary themes, as presented in Table 2: “Shade and Greenery”, “Heat and Surface”, “Airflow”, and “Traffic”. Quantitative frequency analysis of these themes, illustrated in Figure 8, revealed that ’Shade and Greenery’ occurred most frequently, indicating that these factors are considered the most significant in thermal comfort perceptions. This finding aligns with established research on the moderating effect of urban greenery on thermal comfort, suggesting that vegetation elements may be more frequently identified and prioritized in VLM assessments due to their visual distinctiveness in urban environments. In contrast, ’Airflow’ occurred the least frequently among the identified themes, highlighting a key limitation of image-based assessment methods, which cannot directly capture dynamic environmental factors. Furthermore, ’Heat and Surface’ received approximately three times as much attention as ’Traffic’, suggesting that surface materials and heat reflection have a more significant impact on thermal comfort perception than traffic-related factors in the VLM evaluations.
A comparative analysis of keyword focus revealed statistically significant variations among the eight agents, as illustrated in Figure 9. In the “Shade and Greenery” theme, Jasmine (yoga studio owner) demonstrated the highest level of concern, aligning with her profile of being wellness-focused and environmentally conscious. Hassan, Kai, Lucy, and Nina exhibited similar levels of interest, likely due to their professional or intellectual backgrounds, which are closely associated with environmental awareness. In contrast, Marcus (climate researcher) exhibited the least emphasis on this theme, as his analytical background directs his attention toward technical environmental factors rather than immediate visual elements. For the “Heat and Surface” theme, Marcus demonstrated the greatest interest, consistent with his systematic approach to environmental assessment. Sophia, in contrast, displayed the least interest, reflecting her greater concern with aesthetic and functional aspects of urban spaces rather than technical thermal properties. Additionally, Jasmine exhibited the greatest concern for traffic-related impacts, while Sophia showed the least. Diego, Marcus, and Nina exhibited similar levels of attention to this theme. Their professional backgrounds, which involve regular exposure to outdoor environments, suggest that, while they acknowledge the impact of traffic, it is not their primary focus. Kai and Lucy, with their stronger emphasis on indoor environments, appeared to give less consideration to the influence of traffic on thermal comfort. The thematic analysis demonstrated that VLMs effectively captured the varying focuses of different role-playing agents in their perception of thermal comfort.

4. Discussion

4.1. Findings and Advantages of VLM-Based Agents

This study systematically validates the feasibility and efficiency of using VLM-generated agents to evaluate thermal comfort in urban commercial areas through a controlled comparative analysis between expert evaluations and VLM-based assessments of identical street view images. Traditional thermal comfort assessment methods face significant practical constraints: field surveys require substantial resources, and expert evaluations introduce potential subjective bias while remaining time-consuming and labor-intensive [76]. The emergence of VLMs has revolutionized this domain by significantly enhancing efficiency, enabling designers to rapidly collect thermal comfort data during the early stages of urban planning [65]. This approach not only facilitates the comprehensive identification of potential issues in urban street environments but also supports more informed decision making in urban design.
Beyond thermal comfort assessment, our findings suggest broader applications for VLM-based environmental evaluation methodologies. The demonstrated ability of VLMs to interpret complex environmental features suggests applications in various urban analysis domains, including visual quality assessment, safety perception, and public space evaluation [77]. By predefining role characteristics, VLMs can conduct detailed thermal comfort evaluations from multiple perspectives, effectively distinguishing perceptual differences among various role agents. This capability underscores the potential of VLMs to simulate a wide range of individual perspectives, offering a time-efficient and scientifically rigorous method for thermal comfort research in urban environments.
Furthermore, this study reveals a positive correlation between the commercial vitality of Harbin Central Street during the summer and the thermal comfort scores generated by VLMs. This empirically established relationship provides quantitative support for prioritizing thermal environment optimization in the planning and development of commercial districts. Specifically, it suggests that enhancing thermal comfort, through measures such as expanding blue–green spaces and optimizing shading infrastructure, may foster increased commercial vitality, offering actionable insights for urban planners and policymakers.

4.2. Implications for Urban Development Policy and Practice

This study demonstrates practical methodological innovations for urban development and environmental design through the integration of VLMs with thermal comfort assessment frameworks. This approach reduces data acquisition costs and provides scientifically robust, efficient data support for urban designers [77,78]. The feasibility and accuracy of VLMs in thermal comfort evaluation are validated by comparing the results of VLM-generated role–agent assessments with actual human evaluations [79,80,81]. This methodological approach offers urban planners and designers a cost-effective decision support tool for thermal environment optimization, enabling more evidence-based interventions. For instance, in commercial street planning, designers can utilize VLMs to simulate thermal comfort perceptions across diverse groups and identify areas requiring improvement (e.g., adding shade facilities or optimizing greenery), thus enhancing commercial vitality and resident satisfaction. This methodology can be extended to other urban design scenarios, including residential areas, parks, and transport hubs. The demonstrated capability to analyze street view imagery suggests the potential for integration with complementary urban data sources to provide comprehensive support for thermal environment optimization [82,83]. Furthermore, as VLM technology evolves (e.g., through the incorporation of RAG technology or multimodal data), its accuracy and applicability are expected to improve, unlocking new possibilities for sustainable urban development [84]. In conclusion, this study establishes an empirically validated approach to urban thermal comfort assessment that can inform evidence-based urban planning policies and design interventions, offering significant practical and applied value.

4.3. Scientific Contribution of the Practical Approach

Research on street thermal comfort has garnered increasing attention in recent years. However, traditional methods typically focus exclusively on measuring physical parameters, often overlooking the deeper exploration of individual perceptual differences. The primary scientific contribution of this study lies in its systematic application of VLMs to thermal comfort evaluation, providing a methodological framework for incorporating perceptual diversity into urban environmental assessment. The integration of VLMs with street view imagery analysis establishes a methodological framework that addresses both efficiency in data collection and diversity in environmental perception. As demonstrated in our results, this approach successfully captures perceptual differences in thermal comfort across diverse demographic profiles, providing semantically rich qualitative insights alongside quantitative assessments that deepen our understanding of urban thermal environments. Furthermore, through thematic and spatial distribution analyses, this study uncovers the relationship between thermal comfort and commercial vitality, providing valuable scientific evidence for optimizing urban thermal environments. These empirically supported findings contribute to a more comprehensive approach to urban environmental planning, emphasizing the importance of integrating perceptual data into the design and assessment of urban spaces.

4.4. Research Limitations

Despite the demonstrated validity of our VLM-based approach to thermal comfort evaluation, several methodological and contextual limitations warrant discussion. First, due to challenges in acquiring urban data, this study is limited to specific street areas in Harbin and does not cover a broader range of spatial types. Therefore, the generalizability of the findings requires further validation in other cities or diverse urban contexts. Second, VLMs have inherent limitations, particularly the potential for errors arising from generating role agents solely based on text prompts. Future technological developments in VLM capabilities may address these limitations through enhanced contextual understanding and reduced sensitivity to prompt variations. A fundamental limitation of our approach stems from the inherent constraints of image-based environmental assessment. While street view images effectively capture visual elements such as shading, vegetation, and surface materials, they cannot fully replicate the experiential data derived from actual human experiences. Addressing this limitation will require integrating complementary environmental data sources (e.g., meteorological parameters, thermal imaging) in future research to enhance the comprehensiveness and accuracy of thermal comfort assessments.

5. Conclusions

This study empirically validates the feasibility and effectiveness of VLMs for assessing thermal comfort from a human-centered perspective. Unlike previous research that focused primarily on the environmental impacts of thermal comfort, this study explores how new technologies can efficiently collect survey data from a designer’s perspective, offering a deeper understanding of the urban environment. By systematically integrating street view image analysis with VLMs, we demonstrate a methodological framework for thermal comfort evaluation that mitigates the high costs and information opacity typical of traditional data acquisition methods. Our approach evaluates thermal comfort in commercial spaces through demographic-specific VLM-generated agents, demonstrating the capability to capture perceptual differences across diverse population segments. Statistical analysis confirms that this approach effectively distinguishes between different demographic profiles in their thermal comfort evaluations, providing a proxy for diverse population segments. The correlation between VLM-based assessments and expert evaluations (r = 0.815, p < 0.001) indicates that this methodology is applicable across various stages of urban research, providing a more efficient and accessible tool for data extraction. The successful integration with geographic information systems demonstrated in this study suggests potential applications for thermal comfort assessment across varied urban contexts. The results of this study have significant implications for improving urban environments, as they introduce evidence-based approaches for evaluating thermal comfort and provide scientific support to assist urban planners and designers in creating more livable and sustainable cities. Future research directions include enhancing the methodology through the integration of complementary environmental data sources and addressing the identified limitations in spatial coverage and dynamic factor assessment.

Author Contributions

Conceptualization, methods, data analysis, experimentation, writing—original manuscript preparation, D.Z.; Visualization, investigation, D.Z., Z.X.; Writing—reviewing and editing, Z.X., D.Z., X.Z.; direction guidance, supervision, X.Z. All authors have read and agreed to the published version of the manuscript.

Funding

This research received no external funding.

Data Availability Statement

Conflicts of Interest

The authors declare no conflicts of interest.

References

  1. Ma, X.; Yang, J.; Zhang, R.; Yu, W.; Ren, J.; Xiao, X.; Xia, J. XGBoost-Based Analysis of the Relationship Between Urban 2-D/3-D Morphology and Seasonal Gradient Land Surface Temperature. IEEE J. Sel. Top. Appl. Earth Obs. Remote Sens. 2024, 17, 4109–4124. [Google Scholar] [CrossRef]
  2. Yuan, Y.; Li, X.; Wang, H.; Geng, X.; Gu, J.; Fan, Z.; Wang, X.; Liao, C. Unraveling the Global Economic and Mortality Effects of Rising Urban Heat Island Intensity. Sustain. Cities Soc. 2024, 116, 105902. [Google Scholar] [CrossRef]
  3. Zhang, Q.; Yang, J.; Ma, X.; Xin, J.; Ren, J.; Yu, W.; Xiao, X.; Xia, J. Influence of 2-D/3-D Urban Morphology on Diurnal Land Surface Temperature from the Perspective of Functional Zones. IEEE J. Sel. Top. Appl. Earth Obs. Remote Sens. 2024, 17, 17036–17051. [Google Scholar] [CrossRef]
  4. Liu, S.; Kwok, Y.-T.; Lau, K.; Ng, E. Applicability of Different Extreme Weather Datasets for Assessing Indoor Overheating Risks of Residential Buildings in a Subtropical High-Density City. Build. Environ. 2021, 194, 107711. [Google Scholar] [CrossRef]
  5. Qian, B.; Yu, T.; Zhang, C.; Heiselberg, P.K.; Lei, B.; Yang, L. Suitability of Heat Wave Event Definitions for Assessing Indoor Overheating in Current and Future Climate: A Case Study in China. Build. Environ. 2023, 241, 110487. [Google Scholar] [CrossRef]
  6. Kenny, G.P.; Tetzlaff, E.J.; Journeay, W.S.; Henderson, S.B.; O’Connor, F.K. Indoor Overheating: A Review of Vulnerabilities, Causes, and Strategies to Prevent Adverse Human Health Outcomes during Extreme Heat Events. Temperature 2024, 11, 203–246. [Google Scholar] [CrossRef]
  7. Zheng, P.; Wu, H.; Liu, Y.; Ding, Y.; Yang, L. Thermal Comfort in Temporary Buildings: A Review. Build. Environ. 2022, 221, 109262. [Google Scholar] [CrossRef]
  8. Hampo, C.C.; Schinasi, L.H.; Hoque, S. Surviving Indoor Heat Stress in United States: A Comprehensive Review Exploring the Impact of Overheating on the Thermal Comfort, Health, and Social Economic Factors of Occupants. Heliyon 2024, 10, e25801. [Google Scholar] [CrossRef]
  9. Mahmoud, R.M.A.; Abdallah, A.S.H. Assessment of Outdoor Shading Strategies to Improve Outdoor Thermal Comfort in School Courtyards in Hot and Arid Climates. Sustain. Cities Soc. 2022, 86, 104147. [Google Scholar] [CrossRef]
  10. Papadakis, N.; Katsaprakakis, D.A. A Review of Energy Efficiency Interventions in Public Buildings. Energies 2023, 16, 6329. [Google Scholar] [CrossRef]
  11. Zhang, A.; Li, W.; Wu, J.; Lin, J.; Chu, J.; Xia, C. How Can the Urban Landscape Affect Urban Vitality at the Street Block Level? A Case Study of 15 Metropolises in China. Environ. Plan. B Urban Anal. City Sci. 2021, 48, 1245–1262. [Google Scholar] [CrossRef]
  12. Hu, L.; Yan, J.; Zhu, Y.; Deng, J.; Chen, L.; Lu, S. Research on the Sustainable Design of Commercial Street Space Based on Importance Performance Analysis. Buildings 2022, 12, 2096. [Google Scholar] [CrossRef]
  13. Spagnolo, J.; de Dear, R. A Field Study of Thermal Comfort in Outdoor and Semi-Outdoor Environments in Subtropical Sydney Australia. Build. Environ. 2003, 38, 721–738. [Google Scholar] [CrossRef]
  14. Zheng, H.; Long, E.; Cheng, Z.; Yang, Z.; Jia, Y. Experimental Exploration on Airtightness Performance of Residential Buildings in the Hot Summer and Cold Winter Zone in China. Build. Environ. 2022, 214, 108848. [Google Scholar] [CrossRef]
  15. Baobeid, A.; Koç, M.; Al-Ghamdi, S.G. Walkability and Its Relationships with Health, Sustainability, and Livability: Elements of Physical Environment and Evaluation Frameworks. Front. Built Environ. 2021, 7, 721218. [Google Scholar] [CrossRef]
  16. Bai, M.; Hu, R.; Lian, H.; Zhou, W. Correlation Study of Commercial Street Morphology and Pedestrian Activity in Cold Region Summers under Thermal Comfort Guidance: A Case Study of Sanlitun, Beijing. Buildings 2024, 14, 1751. [Google Scholar] [CrossRef]
  17. Ghasemi, S. Investigating the Relationship between Outdoor Thermal Comfort and User Behaviour Patterns in Public Open Spaces in a Winter City: An Empirical Study of Oodi Library Plaza in Helsinki. Available online: http://www.theseus.fi/handle/10024/866784 (accessed on 23 February 2025).
  18. Guo, H.; Huang, L.; Song, W.; Wang, X.; Wang, H.; Zhao, X. Evaluation of the Summer Overheating Phenomenon in Reinforced Concrete and Cross Laminated Timber Residential Buildings in the Cold and Severe Cold Regions of China. Energies 2020, 13, 6305. [Google Scholar] [CrossRef]
  19. Davies, W.K.D. Winter Cities. In Theme Cities: Solutions for Urban Problems; Davies, W.K.D., Ed.; Springer: Dordrecht, The Netherlands, 2015; pp. 277–310. ISBN 978-94-017-9655-2. [Google Scholar]
  20. Mills, B.N. Understanding the Influence of Weather and Warning Information on Trip and Activity Decisions, Behaviour, and Risk Outcomes. Ph.D. Thesis, University of Waterloo, Waterloo, ON, Canada, 10 September 2021. [Google Scholar]
  21. Yin, Q.; Cao, Y.; Sun, C. Research on Outdoor Thermal Comfort of High-Density Urban Center in Severe Cold Area. Build. Environ. 2021, 200, 107938. [Google Scholar] [CrossRef]
  22. Eslamirad, N.; Sepúlveda, A.; De Luca, F.; Sakari Lylykangas, K.; Ben Yahia, S. Outdoor Thermal Comfort Optimization in a Cold Climate to Mitigate the Level of Urban Heat Island in an Urban Area. Energies 2023, 16, 4546. [Google Scholar] [CrossRef]
  23. Mao, Y.; Zhu, K.; Zheng, Z.; Fang, Z. Evaluation of the Thermal Comfort in Different Commercial Buildings in Guangzhou. Indoor Built Environ. 2024, 33, 391–413. [Google Scholar] [CrossRef]
  24. Zhang, Y.; Zheng, Z.; Zhang, S.; Fang, Z.; Lin, Z. Exploring Thermal Comfort and Pleasure in Outdoor Shaded Spaces: Inspiration for Improving Thermal Index Models. Build. Environ. 2024, 265, 111933. [Google Scholar] [CrossRef]
  25. Firrone, T.; Vitrano, R.M.; Fernandez, F.; Zagarella, F.; Garofalo, E. Environmental Design Principles for Urban Comfort: The Pilot Case Study of Naro Municipality. Buildings 2024, 14, 3885. [Google Scholar] [CrossRef]
  26. Nitidara, N.P.A.; Sarwono, J.; Suprijanto, S.; Soelami, F.X.N. The Multisensory Interaction between Auditory, Visual, and Thermal to the Overall Comfort in Public Open Space: A Study in a Tropical Climate. Sustain. Cities Soc. 2022, 78, 103622. [Google Scholar] [CrossRef]
  27. Ren, J.; Yang, J.; Zhang, Y.; Xiao, X.; Xia, J.C.; Li, X.; Wang, S. Exploring Thermal Comfort of Urban Buildings Based on Local Climate Zones. J. Clean. Prod. 2022, 340, 130744. [Google Scholar] [CrossRef]
  28. Yilmaz, S.; Mutlu, B.E.; Aksu, A.; Mutlu, E.; Qaid, A. Street Design Scenarios Using Vegetation for Sustainable Thermal Comfort in Erzurum, Turkey. Environ. Sci. Pollut. Res. 2021, 28, 3672–3693. [Google Scholar] [CrossRef]
  29. Speak, A.F.; Salbitano, F. Summer Thermal Comfort of Pedestrians in Diverse Urban Settings: A Mobile Study. Build. Environ. 2022, 208, 108600. [Google Scholar] [CrossRef]
  30. Liu, G.; Lei, J.; Qin, H.; Niu, J.; Chen, J.; Lu, J.; Han, G. Impact of Environmental Comfort on Urban Vitality in Small and Medium-Sized Cities: A Case Study of Wuxi County in Chongqing, China. Front. Public Health 2023, 11, 1131630. [Google Scholar] [CrossRef]
  31. Zou, M.; Zhang, H. Cooling Strategies for Thermal Comfort in Cities: A Review of Key Methods in Landscape Design. Environ. Sci. Pollut. Res. 2021, 28, 62640–62650. [Google Scholar] [CrossRef]
  32. Ji, Y.; Song, J.; Shen, P. A Review of Studies and Modelling of Solar Radiation on Human Thermal Comfort in Outdoor Environment. Build. Environ. 2022, 214, 108891. [Google Scholar] [CrossRef]
  33. Jin, Y. The Effect of Indoor Thermal and Humidity Condition on Older Occupants’ Subjective Comfort and Skin Condition in Winter. Ph.D. Thesis, Heriot-Watt University, Edinburgh, UK, 2021. [Google Scholar]
  34. Yau, Y.H.; Toh, H.S.; Chew, B.T.; Nik Ghazali, N.N. A Review of Human Thermal Comfort Model in Predicting Human–Environment Interaction in Non-Uniform Environmental Conditions. J. Therm. Anal Calorim. 2022, 147, 14739–14763. [Google Scholar] [CrossRef]
  35. Song, W.; Calautit, J.K. Inclusive Comfort: A Review of Techniques for Monitoring Thermal Comfort among Individuals with the Inability to Provide Accurate Subjective Feedback. Build. Environ. 2024, 257, 111463. [Google Scholar] [CrossRef]
  36. Laouadi, A. A New General Formulation for the PMV Thermal Comfort Index. Buildings 2022, 12, 1572. [Google Scholar] [CrossRef]
  37. Fabbri, K. The Indoor Thermal Comfort Indexes PMV and PPD. In Thermal Comfort Perception: A Questionnaire Approach Focusing on Children; Fabbri, K., Ed.; Springer International Publishing: Cham, The Switzerland, 2024; pp. 83–135. ISBN 978-3-031-52610-7. [Google Scholar]
  38. Ze Ze, C.B.; Nneme Nneme, L.; Monkam, L. PMVd/PPDd Model for Predicting Thermal Comfort in Air-Conditioned Buildings in Hot and Humid Regions of Sub-Saharan Africa. Int. J. Air-Cond. Ref. 2024, 32, 19. [Google Scholar] [CrossRef]
  39. Dzyuban, Y.; Ching, G.N.Y.; Yik, S.K.; Tan, A.J.; Banerjee, S.; Crank, P.J.; Chow, W.T.L. Outdoor Thermal Comfort Research in Transient Conditions: A Narrative Literature Review. Landsc. Urban Plan. 2022, 226, 104496. [Google Scholar] [CrossRef]
  40. Zhang, J.; Guo, W.; Cheng, B.; Jiang, L.; Xu, S. A Review of the Impacts of Climate Factors on Humans’ Outdoor Thermal Perceptions. J. Therm. Biol. 2022, 107, 103272. [Google Scholar] [CrossRef]
  41. Brocherie, F.; Girard, O.; Millet, G.P. Emerging Environmental and Weather Challenges in Outdoor Sports. Climate 2015, 3, 492–521. [Google Scholar] [CrossRef]
  42. Izzati, N.; Zaki, S.A.; Rijal, H.B.; Rey, J.A.A.; Hagishima, A.; Atikha, N. Investigation of Thermal Adaptation and Development of an Adaptive Model under Various Cooling Temperature Settings for Students’ Activity Rooms in a University Building in Malaysia. Buildings 2023, 13, 36. [Google Scholar] [CrossRef]
  43. Laezza, L.; De Dominicis, S.; Brondino, M. Reassessing Green Exercise Research: Unveiling Methodological Gaps and Pathways for Progress. Front. Sports Act. Living 2024, 6, 1449059. [Google Scholar] [CrossRef]
  44. Zhang, Y.; Chen, Y.; Su, Q.; Huang, X.; Li, Q.; Yang, Y.; Zhang, Z.; Chen, J.; Xiao, Z.; Xu, R.; et al. The Use of Machine and Deep Learning to Model the Relationship between Discomfort Temperature and Labor Productivity Loss among Petrochemical Workers. BMC Public Health 2024, 24, 3269. [Google Scholar] [CrossRef]
  45. Cuskley, C.; Sulik, J. The Burden for High-Quality Online Data Collection Lies with Researchers, Not Recruitment Platforms. Perspect. Psychol. Sci. 2024, 19, 891–899. [Google Scholar] [CrossRef]
  46. Wang, S.; Zhang, Q.; Gao, P.; Wang, C.; An, J.; Wang, L. Coupled Impact of Points of Interest and Thermal Environment on Outdoor Human Behavior Using Visual Intelligence. Buildings 2024, 14, 2978. [Google Scholar] [CrossRef]
  47. Yao, T.; Xu, Y.; Sun, L.; Liao, P.; Wang, J. Application of Machine Learning and Multi-Dimensional Perception in Urban Spatial Quality Evaluation: A Case Study of Shanghai Underground Pedestrian Street. Land 2024, 13, 1354. [Google Scholar] [CrossRef]
  48. Zhou, W.; Yang, M.; Yu, X.; Peng, Y.; Fan, C.; Xu, D.; Xiao, Q. Enhancing Thermal Comfort Prediction in High-Speed Trains through Machine Learning and Physiological Signals Integration. J. Therm. Biol. 2024, 121, 103828. [Google Scholar] [CrossRef] [PubMed]
  49. Luo, P.; Yu, B.; Li, P.; Liang, P.; Liang, Y.; Yang, L. How 2D and 3D Built Environments Impact Urban Surface Temperature under Extreme Heat: A Study in Chengdu, China. Build. Environ. 2023, 231, 110035. [Google Scholar] [CrossRef]
  50. Wei, X.; Guan, F.; Zhang, X.; Van de Weghe, N.; Huang, H. Integrating Planar and Vertical Environmental Features for Modelling Land Surface Temperature Based on Street View Images and Land Cover Data. Build. Environ. 2023, 235, 110231. [Google Scholar] [CrossRef]
  51. Ma, H.; Xu, Q.; Zhang, Y. High or Low? Exploring the Restorative Effects of Visual Levels on Campus Spaces Using Machine Learning and Street View Imagery. Urban For. Urban Green. 2023, 88, 128087. [Google Scholar] [CrossRef]
  52. Zhang, F.; Zhou, B.; Liu, L.; Liu, Y.; Fung, H.H.; Lin, H.; Ratti, C. Measuring Human Perceptions of a Large-Scale Urban Region Using Machine Learning. Landsc. Urban Plan. 2018, 180, 148–160. [Google Scholar] [CrossRef]
  53. Massaro, E.; Schifanella, R.; Piccardo, M.; Caporaso, L.; Taubenböck, H.; Cescatti, A.; Duveiller, G. Spatially-Optimized Urban Greening for Reduction of Population Exposure to Land Surface Temperature Extremes. Nat. Commun. 2023, 14, 2903. [Google Scholar] [CrossRef]
  54. Rui, Q.; Cheng, H. Quantifying the Spatial Quality of Urban Streets with Open Street View Images: A Case Study of the Main Urban Area of Fuzhou. Ecol. Indic. 2023, 156, 111204. [Google Scholar] [CrossRef]
  55. Liu, Y.; Cao, Z.; Wei, H.; Guo, P. Optimizing Spatial Distribution of Retail Shops against Neighborhood Tree Canopy Shade Using Big Data Extracted from Streetscape. Land 2024, 13, 1249. [Google Scholar] [CrossRef]
  56. Ma, H.; Zhang, Y.; Liu, P.; Zhang, F.; Zhu, P. How Does Spatial Structure Affect Psychological Restoration? A Method Based on Graph Neural Networks and Street View Imagery. Landsc. Urban Plan. 2024, 251, 105171. [Google Scholar] [CrossRef]
  57. Ogawa, Y.; Oki, T.; Zhao, C.; Sekimoto, Y.; Shimizu, C. Evaluating the Subjective Perceptions of Streetscapes Using Street-View Images. Landsc. Urban Plan. 2024, 247, 105073. [Google Scholar] [CrossRef]
  58. Shi, J.; Yan, Y.; Li, M.; Zhou, L. Measuring the Convergence and Divergence in Urban Street Perception among Residents and Tourists through Deep Learning: A Case Study of Macau. Land 2024, 13, 345. [Google Scholar] [CrossRef]
  59. Luo, J.; Zhao, T.; Cao, L.; Biljecki, F. Semantic Riverscapes: Perception and Evaluation of Linear Landscapes from Oblique Imagery Using Computer Vision. Landsc. Urban Plan. 2022, 228, 104569. [Google Scholar] [CrossRef]
  60. Chen, S.; Biljecki, F. Automatic Assessment of Public Open Spaces Using Street View Imagery. Cities 2023, 137, 104329. [Google Scholar] [CrossRef]
  61. Wang, L.; Han, X.; He, J.; Jung, T. Measuring Residents’ Perceptions of City Streets to Inform Better Street Planning through Deep Learning and Space Syntax. ISPRS J. Photogramm. Remote Sens. 2022, 190, 215–230. [Google Scholar] [CrossRef]
  62. Liang, X.; Chang, J.H.; Gao, S.; Zhao, T.; Biljecki, F. Evaluating Human Perception of Building Exteriors Using Street View Imagery. Build. Environ. 2024, 263, 111875. [Google Scholar] [CrossRef]
  63. Wu, W.; Li, L.; Li, C. Seasonal Variation in the Effects of Urban Environmental Factors on Land Surface Temperature in a Winter City. J. Clean. Prod. 2021, 299, 126897. [Google Scholar] [CrossRef]
  64. Cheng, A.-C.; Yin, H.; Fu, Y.; Guo, Q.; Yang, R.; Kautz, J.; Wang, X.; Liu, S. SpatialRGPT: Grounded Spatial Reasoning in Vision Language Models. Adv. Neural Inf. Process. Syst. 2025, 37, 135062–135093. Available online: https://proceedings.neurips.cc/paper_files/paper/2024/file/f38cb4cf9a5eaa92b3cfa481832719c6-Paper-Conference.pdf (accessed on 3 April 2025).
  65. Zhang, J.; Huang, J.; Jin, S.; Lu, S. Vision-Language Models for Vision Tasks: A Survey. IEEE Trans. Pattern Anal. Mach. Intell. 2024, 46, 5625–5644. [Google Scholar] [CrossRef]
  66. Feng, J.; Zhang, J.; Liu, T.; Zhang, X.; Ouyang, T.; Yan, J.; Du, Y.; Guo, S.; Li, Y. CityBench: Evaluating the Capabilities of Large Language Models for Urban Tasks. 2024. Available online: https://openreview.net/pdf?id=oIWN7eMhTb (accessed on 3 April 2025).
  67. Mansi, S.A.; Pigliautile, I.; Arnesano, M.; Pisello, A.L. A Novel Methodology for Human Thermal Comfort Decoding via Physiological Signals Measurement and Analysis. Build. Environ. 2022, 222, 109385. [Google Scholar] [CrossRef]
  68. Lau, K.K.-L.; Choi, C.Y. The Influence of Perceived Aesthetic and Acoustic Quality on Outdoor Thermal Comfort in Urban Environment. Build. Environ. 2021, 206, 108333. [Google Scholar] [CrossRef]
  69. Cui, H.; Wu, Y.; He, Y.; Li, N.; Li, B.; Gao, Y.; Jiang, A. Relative Thermal Pleasure Model: A Unified Framework for Understanding and Predicting Thermal Comfort in Dynamic Environments. J. Build. Eng. 2024, 87, 109020. [Google Scholar] [CrossRef]
  70. Jiang, Y.; Du, G.; Teng, H.; Wang, J.; Li, H. Multi-Scenario Land Use Change Simulation and Spatial Response of Ecosystem Service Value in Black Soil Region of Northeast China. Land 2023, 12, 962. [Google Scholar] [CrossRef]
  71. Bao, W.; Gong, A.; Zhang, T.; Zhao, Y.; Li, B.; Chen, S. Mapping Population Distribution with High Spatiotemporal Resolution in Beijing Using Baidu Heat Map Data. Remote Sens. 2023, 15, 458. [Google Scholar] [CrossRef]
  72. Fu, X.; Zhang, M.; Hao, J.; Han, P.; Zhang, H.; Shi, L.; Tang, H. What Can VLMs Do for Zero-Shot Embodied Task Planning? ICML 2024 Workshop on LLMs and Cognition. 2024. Available online: https://openreview.net/pdf?id=OE5WKiNPyx (accessed on 3 April 2025).
  73. Zhao, J.; Huang, J.X.; Deng, H.; Chang, Y.; Xia, L. Are Topics Interesting or Not? An LDA-Based Topic-Graph Probabilistic Model for Web Search Personalization. ACM Trans. Inf. Syst. 2022, 40, 51:1–51:24. [Google Scholar] [CrossRef]
  74. Qi, Y.; Li, H.; Song, Y.; Wu, X.; Luo, J. How Vision-Language Tasks Benefit from Large Pre-Trained Models: A Survey. arXiv 2024, arXiv:2412.08158. [Google Scholar]
  75. Šverko, Z.; Vrankić, M.; Vlahinić, S.; Rogelj, P. Complex Pearson Correlation Coefficient for EEG Connectivity Analysis. Sensors 2022, 22, 1477. [Google Scholar] [CrossRef]
  76. Vecellio, D.J.; Vanos, J.K.; Kennedy, E.; Olsen, H.; Richardson, G.R.A. An Expert Assessment on Playspace Designs and Thermal Environments in a Canadian Context. Urban Clim. 2022, 44, 101235. [Google Scholar] [CrossRef]
  77. Ashqar, H.I.; Alhadidi, T.I.; Elhenawy, M.; Khanfar, N.O. Leveraging Multimodal Large Language Models (MLLMs) for Enhanced Object Detection and Scene Understanding in Thermal Images for Autonomous Driving Systems. Automation 2024, 5, 508–526. [Google Scholar] [CrossRef]
  78. Li, X.; Wen, C.; Hu, Y.; Yuan, Z.; Zhu, X.X. Vision-Language Models in Remote Sensing: Current Progress and Future Trends. IEEE Geosci. Remote Sens. Mag. 2024, 12, 32–66. [Google Scholar] [CrossRef]
  79. Laurençon, H.; Marafioti, A.; Sanh, V.; Tronchon, L. Building and Better Understanding Vision-Language Models: Insights and Future Directions. Workshop on Responsibly Building the Next Generation of Multimodal Foundational Models. 2024. Available online: https://openreview.net/forum?id=iSL0FHZStr (accessed on 3 April 2025).
  80. Li, Z.; Wu, X.; Du, H.; Nghiem, H.; Shi, G. Benchmark Evaluations, Applications, and Challenges of Large Vision Language Models: A Survey. arXiv 2025, arXiv:2501.02189. [Google Scholar]
  81. Tao, L.; Zhang, H.; Jing, H.; Liu, Y.; Yan, D.; Wei, G.; Xue, X. Advancements in Vision–Language Models for Remote Sensing: Datasets, Capabilities, and Enhancement Techniques. Remote Sens. 2025, 17, 162. [Google Scholar] [CrossRef]
  82. Lyu, R.; Pang, J.; Tian, X.; Zhao, W.; Zhang, J. How to Optimize the 2D/3D Urban Thermal Environment: Insights Derived from UAV LiDAR/Multispectral Data and Multi-Source Remote Sensing Data. Sustain. Cities Soc. 2023, 88, 104287. [Google Scholar] [CrossRef]
  83. Yao, S.; Ghorbany, S.; Sisk, M.; Hu, M.; Wang, C. Leveraging Zero-Shot Learning on Street-View Imagery for Built Environment Variable Analysis. In Proceedings of the Advances in Visual Computing; Bebis, G., Patel, V., Gu, J., Panetta, J., Gingold, Y., Johnsen, K., Arefin, M.S., Dutta, S., Biswas, A., Eds.; Springer Nature: Cham, Switzerland, 2025; pp. 243–254. [Google Scholar]
  84. Wang, Y.; Chen, S.-Y.; Zhou, Z.; Li, S.; Li, H.; Zhou, W.; Li, H. ROOT: VLM Based System for Indoor Scene Understanding and Beyond. arXiv 2024, arXiv:2411.15714. [Google Scholar]
Figure 1. Study area.
Land 14 00786 g001
Figure 2. The thermal comfort evaluation framework based on VLMs.
Land 14 00786 g002
Figure 3. Validation of consistency between VLM-based thermal comfort assessments and expert ratings.
Land 14 00786 g003
Figure 4. VLM-based validation of thermal comfort evaluation results. (a) Spatial analysis of thermal comfort evaluation results; and (b) VLM-based correlation analysis between assessment results and commercial viability.
Land 14 00786 g004
Figure 5. Differences in the distribution of VLM-based thermal comfort assessment results across different agents.
Land 14 00786 g005
Figure 6. Spatial analysis of the VLM-based thermal comfort evaluation results for different agents.
Land 14 00786 g006
Figure 7. Correlation analysis of VLM-based thermal comfort evaluation results with commercial viability for different agents.
Land 14 00786 g007
Figure 8. VLM-based topic analysis of subject keywords for thermal comfort evaluation results.
Land 14 00786 g008
Figure 9. Topic frequency analysis of VLM-based evaluation results for different agents.
Land 14 00786 g009
Table 1. Details of the eight different agent roles.
NumNameAgeGenderProfessionCharacterFocus
1Diego29Male Food delivery riderLow-income, energetic, hardworking, resilientConstantly exposed to outdoor conditions, intimate knowledge of street conditions at different times, sometimes underestimates heat risks due to youth
2Hassan52Male Works outdoorsMiddle-income, practical, weather-wise, observant, street vendorExpert knowledge of local microclimate conditions, very aware of daily and seasonal patterns
3Nina60FemaleCommunity health workerMiddle-income, health-conscious, careful, nurturingExercise routine, knows all drinking fountains and rest spots, very attuned to seniors’ needs
4Jasmine38FemaleYoga studio ownerHigh-income, wellness-focused, mindful, selectiveSensitive to environmental conditions, prefers walking in nature, may avoid certain areas based on ’energy’ feelings
5Marcus45MaleClimate researcherMiddle-income, detail-oriented, systematic, analyticalProfessional temperature monitoring devices, expertise in urban heat islands, may over-rely on data and ignore subjective feelings
6Sophia32FemaleFashion-consciousMiddle-high income, fashion-conscious, sensitive to weatherWalks frequently between stores, very aware of shaded areas and air-conditioned spaces, may prioritize appearance over comfort
7Lucy41FemaleReal estate agentMiddle-high income, time-efficient, comfort-prioritizing, organizedFrequently walks clients through neighborhoods, knows all indoor shortcuts and cooling spots, may favor air-conditioned routes
8Kai25MaleUrban studies graduate studentStudent income, environmental activist, passionate, idealisticResearches green infrastructure, expert in sustainable urban design, may be overly critical of existing infrastructure
Table 2. Keyword analysis of VLM-based thermal comfort evaluation.
NumberTopicKeywords
1Shade and GreeneryShade | tree | greenery | vegetation
2Heat and SurfaceHeat | concrete | asphalt | reflect
3AirflowAirflow | ventilation | wind | breeze
4TrafficTraffic |vehicle |car | bus
Disclaimer/Publisher’s Note: The statements, opinions and data contained in all publications are solely those of the individual author(s) and contributor(s) and not of MDPI and/or the editor(s). MDPI and/or the editor(s) disclaim responsibility for any injury to people or property resulting from any ideas, methods, instructions or products referred to in the content.

