1. Introduction
Both science and intergovernmental panels bring evidence that natural resources for feeding people on earth are already beyond the threshold of sustainability, which significantly impacts the global crisis [
1]. That is why agriculture and food systems need an urgent transformation [
2,
3], particularly exerted on the Sustainable Development Goal (SDG) Agenda [
4] highlighted by the 17 SDG [
5,
6] and on various strategies encompassed by the European Green Deal [
7]. Food transition in a city-region is a fundamental transformative process towards the accomplishment of the Sustainable Development Agenda (at least 11 of the 17 SDGs) in creating and steering directional flows of knowledge, resources, and competencies between global/national and regional/local scales. Furthermore, the interdisciplinary and transdisciplinary progressively substantial literature raises acknowledgment of the complexity of these non-linear socio-ecological systems [
8,
9,
10,
11,
12]. A transformative agenda for food system transition [
13] encouraged a move away from theoretical knowledge and a prescriptive position into action [
2,
14], bearing in mind a systemic way of thinking from theory into its implementation in practice [
15,
16,
17]. This food system transition implies a cross-compliance between science, policy, and action in various strategic planning levels [
10,
18], where the regional scale develops a special role in both guiding and articulating local interventions [
19,
20]. The alignment of these three pillars is based on real-life governance experiences combining local agriculture, short supply chains, circular economy, and deliberative forums to promote democracy, food sovereignty, and food justice, which should be capable of inspiring other localities to learn and adopt similar processes of food system transformation and is likely to influence higher levels of decision-making [
2,
3,
11,
19,
21].
On the other hand, city-region socio-territorial frameworks are seen as a mesoscale in creating and steering directional flows of knowledge, resources, and competencies between the global/national and local scales [
9,
22]. The understanding of these variables in an almost unpredictable context where food systems are rooted requires a planning exercise from a territorial basis where different sectors intertwine [
23,
24]. Therefore, food system planning has been assumed as a domain for the integration of cross-sectorial policies, an innovative approach to spatial planning and regional development agendas, and an increase in new governance formats to coordinate the socioeconomic impacts [
25,
26,
27,
28]. However, an evidence-based practice between regional development and spatial planning does not occur very often because of a lack of a common language, especially the spatialization of certain phenomena and dynamics that might be relevant to support decision-making in the public sector and decision-making by private stakeholders when a strategy or plan is ready to be implemented [
29]. The main idea of a food transition strategy is, thus, to connect previously disjointed fields towards a sustainable food system as a biological–economic and socio-political systems correlation [
30].
Furthermore, beyond the complexity of systemic analysis of a food system and its dynamics for strategizing its transformation according to the sustainability transition approach, there is the complexity of converting it into practice to transform the food system effectively [
31,
32]. This complexity is even higher when considering that a food system strategy applied to a city region, as a metropolitan area, is an artificialism once a food shed does not likely correspond to administrative boundaries [
33,
34], despite the fact that it allows the clear mapping of food system resources and stakeholders to establish a more synergetic relationship between the global rhetoric of food system transformation and the realities encountered by food system actors who attempt to concretize action at the local scale, across vertical and horizontal governance domains to promote the food system transformation [
10,
32,
35,
36]. Nevertheless, city regions are raising awareness on transforming food systems for sustainable and healthy diets, shifting the idea that rural areas are being devoted mostly to resource extraction to satisfy the need for the well-being of an ever-growing population.
In the Lisbon Metropolitan Area (LMA), a Food Transition Strategy (FTS) has been developed [
37] as a priority identified by the Food Policy Network (FPN) and has been in place since 2019 [
20,
38]. This strategy includes six axes of action and concludes that the implementation of a set of Multifunctional Agrofood Parks (MAPs) can be seen as one of the main anchors for achieving a local food system transformation [
11]. The aim of the MAP is to produce healthy and affordable food based on agriculture and livestock and could integrate fish components in a sea or aquaculture context in a sustainable way, whenever possible, on land with suitable soil, climate, and healthy water, helping to raise the value of rustic land in a peri-urban or rural context, differentiating it, for example, from urban allotment gardens.
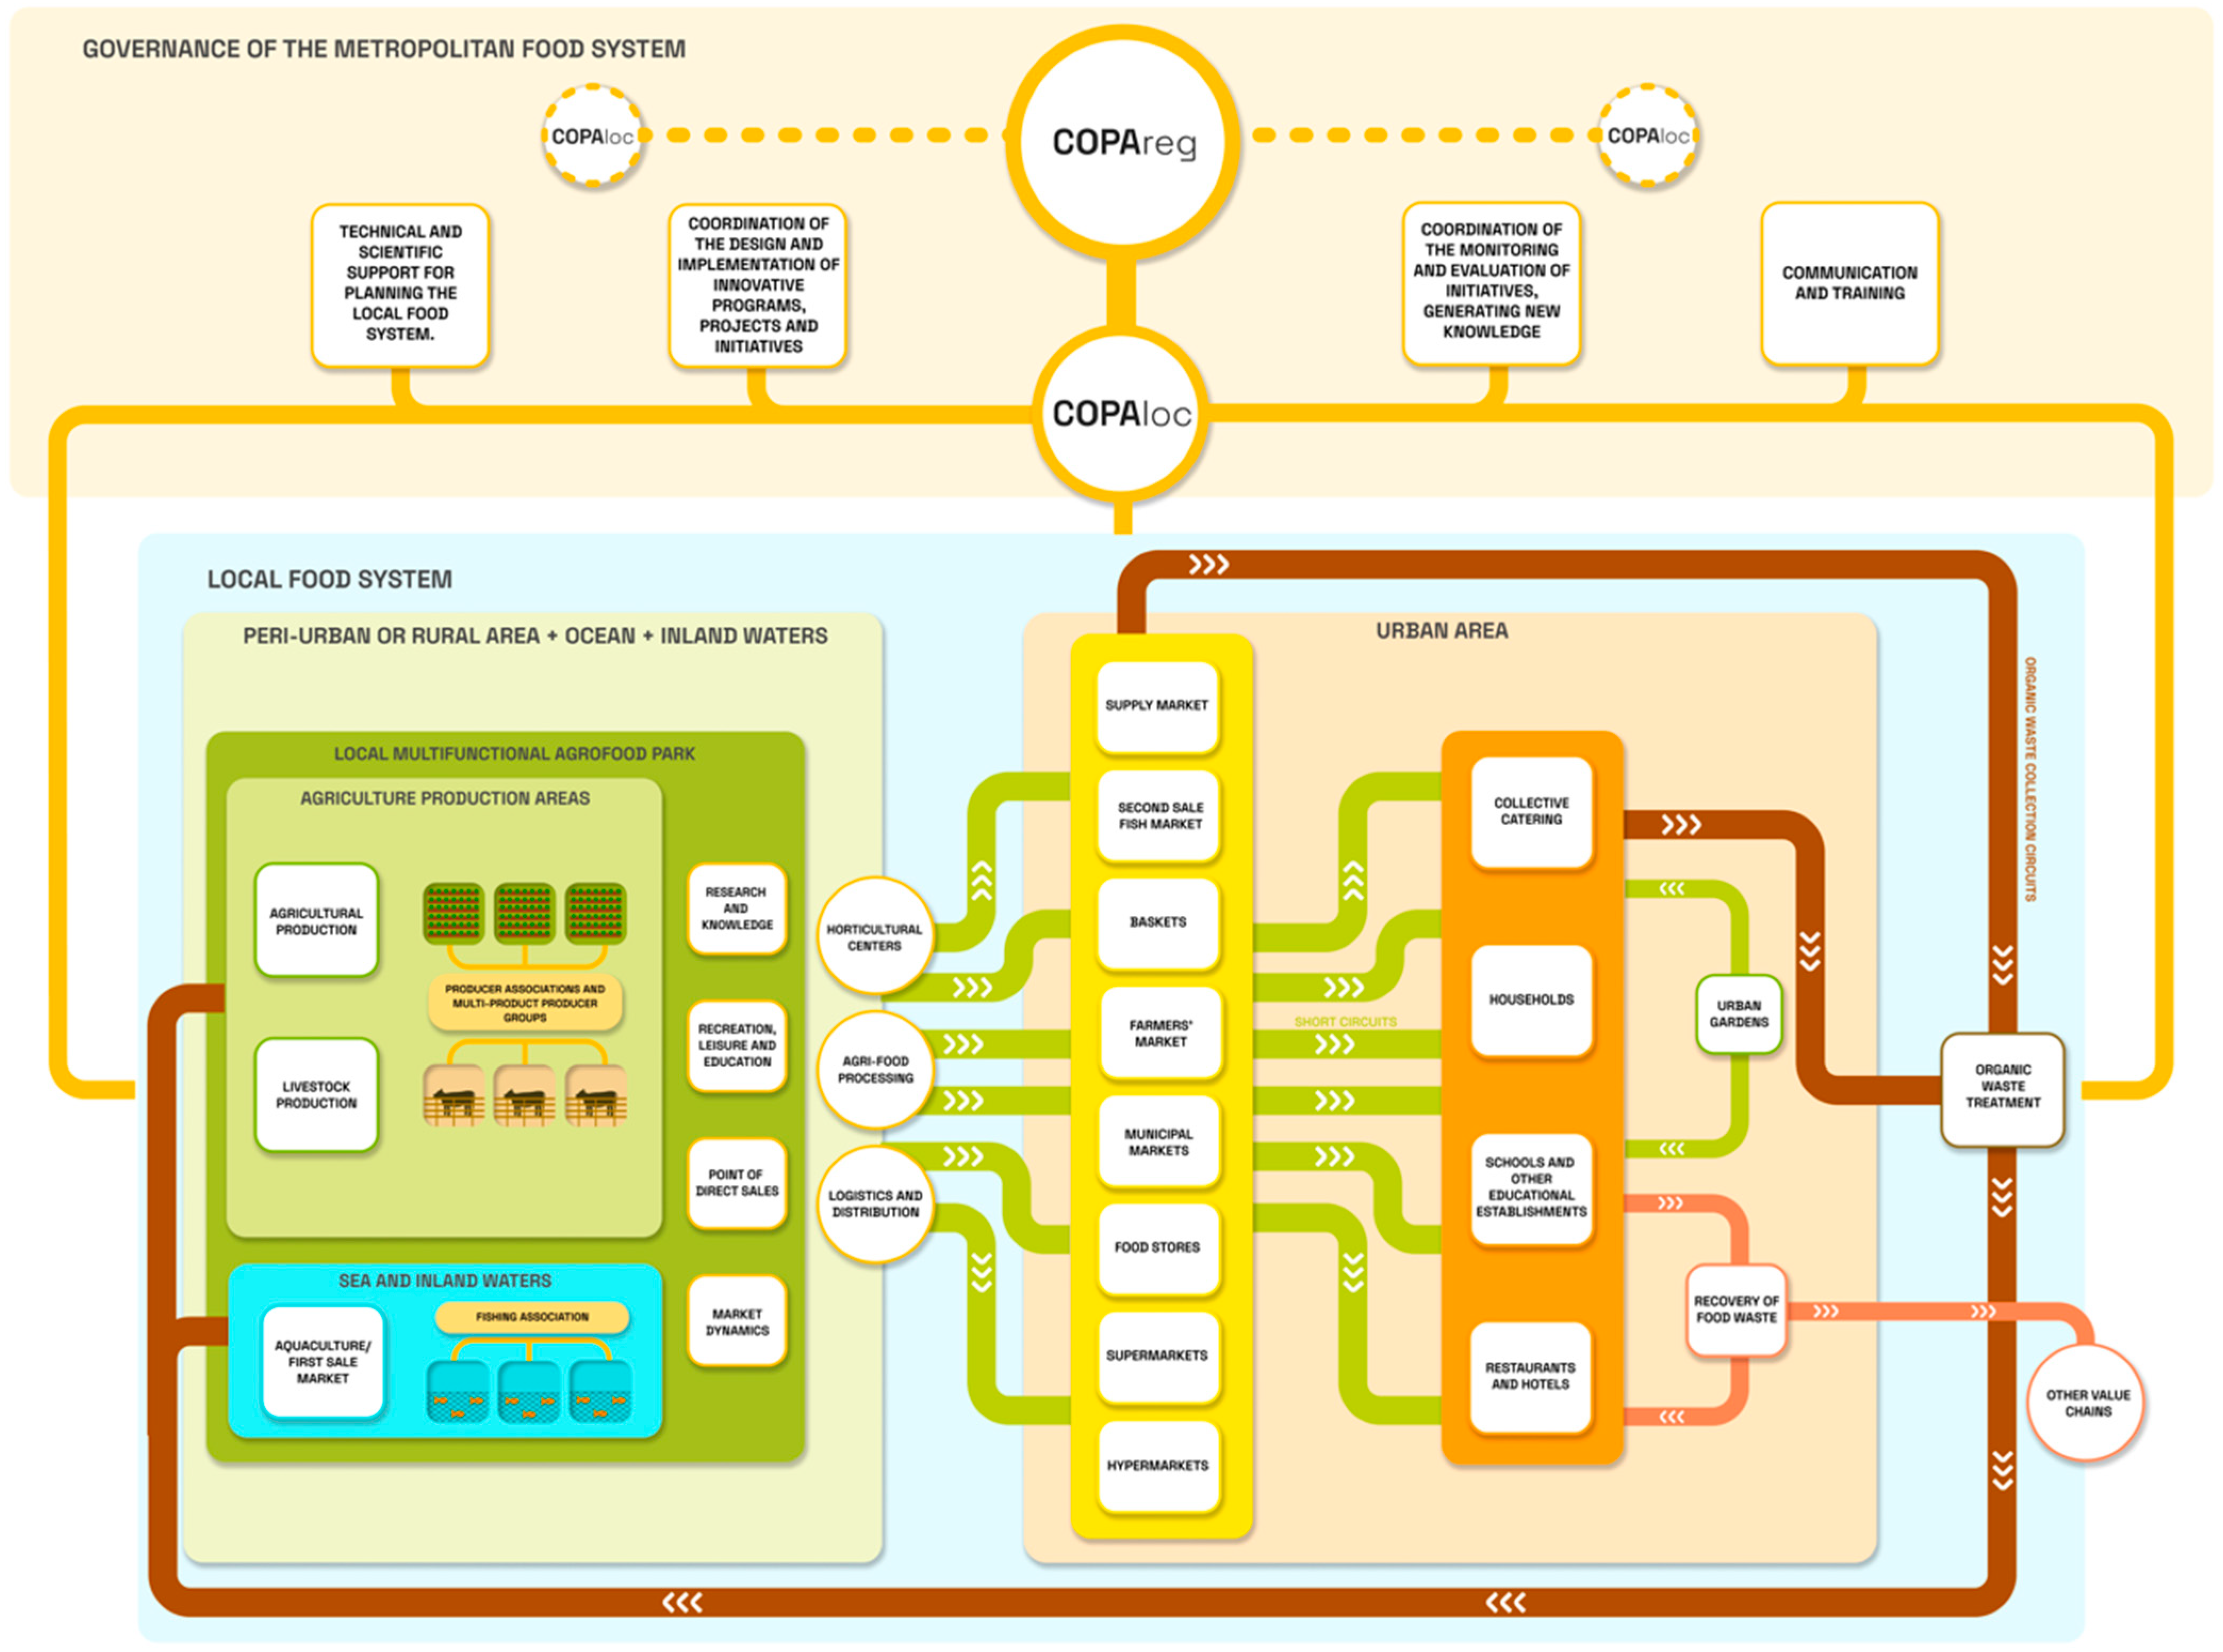
Within the FTS-LMA preparation of a thorough food system analysis and diagnosis, we started by defining a food system prototype (
Figure 1) and identifying the leverage points within which the MAP is highlighted as a concept that interlinks urban and rural spaces and where it is possible to make compatible other dimensions that are not often put together, such as the Water–Energy–Food–Ecosystem (WEFE) nexus [
3,
11,
26,
39,
40,
41].
This paper aims to describe the methodology required to set up the food transition operation in the LMA as an integrated approach to mapping the areas for the establishment of a MAP regarding the ecological suitability of soils, the socioeconomic profile of local farmers, and the willingness of local actors to collaborate and cooperate on innovative projects, programs, and initiatives with a positive impact on the metropolitan foodscape. The AHP is a particularly valuable method within this context of mapping the potential for the MAP establishment in the LMA that allows planning the food system from a local food production point of view, emphasizing the multifunctionality approach of the MAP network to contribute to regional development. In early 2025, one MAP will be ongoing, and four MAPs will be established in the LMA.
We start with a short description of how the identification of the MAP became a prior initiative considering the vision formulated by the FoodLink—Food Transition Network of the Lisbon Metropolitan Area, seen as a bottom-up initiative [
20]. Afterwards, the metropolitan food system is generally characterized, and a prototype is drawn as a conceptual representation of the necessary interlinks and flows that are indispensable to the functioning of a local, sustainable food system in which the role of a MAP is highlighted (
Figure 1). Further on, the methodology for identifying and spatializing the potential for the establishment of these multifunctional parks will be detailed [
42]. The results of this methodology will then be discussed in the timeframe 2024–2030, taking into consideration the action program of FoodLink that accompanies the FTS-LMA implementation.
The conclusions emphasize that the MAP establishment is an active way to reframe the local–global food systems debate through a resilience lens and to identify, experience, and demonstrate multiple advantages of short supply chains rather than simply argue an incontestable argument that local food is better, and fresher compared with other means of processing food. We finish opening room for forecasting the impacts of MAP implementation in the transformation of the metropolitan food systems in the current unpredictable and unstable socioeconomic, environmental, and policy global contexts.
2. The Metropolitan Food System, Its Food Transition Strategy, and the Food Policy Network
A food transition can be understood as one of the components of the transition to sustainability [
15] through a process of transforming food systems, capable of generating co-benefits for a multitude of actors and stakeholders, translated into positive impacts on the economy, health, the environment, climate, landscape, and the society.
Various international strategies and commitments recommend that this transition be fully achieved by 2030, contributing to the goal of carbon neutrality, climate adaptation, and biodiversity conservation and increasing physical and mental well-being, especially for the most vulnerable groups in the population [
7].
A strategy for the food transition thus corresponds to a strategic instrument with a territorial and intersectoral basis, which explicitly covers the planning of food systems in a systemic way, pursuing the principles of spatial planning and territorial development and cohesion.
Food system planning consists of organizing the food system in biophysical, spatial, and functional terms through a spatial planning exercise that allows for sustainable and resilient ways of supplying healthy and accessible food to a given city or city region, including three phases: (i) definition of a strategy based on a vision for a given time horizon; (ii) definition of a strategic framework and action plan, which embody the objectives to be achieved and their operationalization through interaction between the public, private, governmental and non-governmental sectors; (iii) integration of the guiding principles into territorial management instruments or other public policies, based on the articulation between policy, knowledge and action.
The FTS-LMA is thus intended to be the starting point for defining a Metropolitan Food Policy, capable of integrating various interacting policies towards a sustainable and resilient food system.
It is worth highlighting the innovative nature of the FTS-LMA, in relation to other international food system planning strategies, on at least three levels: (i) it arises from a bottom-up perspective within the scope of FoodLink, acting as a Food Policy Network (FPN) which identified the need for its development as a priority within the scope of the action plan for the 2022–2023 period and gave it an explicit orientation for action, applied to the entire region; (ii) it assumes a territorial basis and full integration into existing regional and national policies and strategies; (iii) it ensures a participatory and collaborative dimension inherent to all stages of development. A FPN is thus a fundamental collaborative way of thinking, planning, and acting in a cohesive, impactful way. It corresponds to a preliminary governance structure with a common multi-actor and multi-scale arena to leverage more deliberative and reflexive cooperation to anticipate potential major points of tensions and conflicts that may constrain power relations and mobilization in territories [
43].
To elucidate on how the LMA’s food system is shaped, it is worth referring to basic regional indicators as a set of economic activities associated with food production derived from the use and occupation of agricultural land in around 38% of its territory, i.e., 1140 km
2, whose economic value of standard agricultural production was 313 million EUR in 2019, to which must be added the revenue generated by fishing, around 51 million EUR [
44].
However, more than half of the metropolitan production system may correspond to areas with moderate or limited soil and morphological suitability for agriculture, which translates into possible constraints in terms of land use planning and environmental impact on natural resources, particularly regarding the conservation status of soil, water, and biodiversity [
44].
On the other hand, taking into account the size of the population and the environment of consumers, which could reach 21 million a year [
45], if we consider the resident and visiting population, proper management of the local food production system could result in significant gains in terms of energy along with carbon and other greenhouse gas emissions, as well as increased access to fresh, healthier and more sustainable food, generating new business models with a positive impact on the economy, since the contribution of the primary sector’s Gross Value Added (GVA) in the region is only 0.4%.
As such, the areas with agricultural use and occupation, where a total of around 200,000 registered rural properties are located, with roughly 6400 agricultural holdings on approximately 91,000 ha of Utilized Agricultural Area (UAA), with an average area per holding of 14 ha of UAA [
44], should be planned in such a way as to ensure a compromise among the solutions that best serve a region with a view toward its sustainable and resilient development.
It should be noted that the area of UAA for organic production is only 1% of the total area of the LMA, which in 2019 included 826 certified producers (animal and vegetable) and 345 in the preparation phase for certification [
44].
As such, the food supply for consumers should also be planned with a view toward selecting the crops that can best adapt to the soil and climate context, considering both changes in climate and the necessary adaptation and resilience of agricultural and fishing species, as well as the trend that has seen an increase in the specialization and professionalization of food production over the last decade.
The Relevance of MAP Within the Prototype of a Local Food System Functioning
An Agrofood Park is a concept worthwhile to planners and policymakers working on peri-urban agricultural conservation and open spaces protection and management [
46,
47,
48]. There are different typologies in various geographies over time [
49].
The aim of the MAP is to produce healthy and affordable food based on agriculture and/or livestock in a sustainable way. This means that sustainable agriculture should assure soil and climate suitability, water conservation, and the use of healthy genetic resources, be environmentally non-degrading or regenerative, and be technically appropriate, economically viable, and socially acceptable. This sustainable model of farming should also help to raise the value of rustic land in a peri-urban or rural context, differentiating it, for example, from urban allotment gardens [
41,
50] (
Figure 1).
When deemed appropriate and pressing, the MAP could integrate fish components in a sea or aquaculture context, either by installing equipment associated with its production and conservation or by integrating fish into the processing and distribution circuits in an articulated manner with land products.
The productive function of MAP should be made compatible with other functions, namely the conservation of natural capital (soil, water, and biodiversity), the promotion of ecological connectivity through green and blue infrastructure, the programming of educational and recreational activities, effectively contributing to carbon neutrality, the energy transition and the circular economy. They should also be pilot areas or living laboratories of an experimental and demonstrative nature for gathering information and building new systemic knowledge that is essential for sustainable and resilient management and the food transition.
Its planning will involve the definition of a program or plan embodied in a project that includes all dimensions of the food system, considering its articulation with the other physical, economic, social, and institutional components of the local food system and enabling its various components to be implemented.
A MAP can take on variable geometries, corresponding to an area of varying size, whether continuous or discontinuous and consider distribution criteria, mostly through short circuits and low-carbon logistics solutions, given the location of agrifood processing and distribution centers that make them accessible to a wide range of consumers, desirably committed to buying them.
The food products produced by the MAP should primarily supply school canteens and other types of public catering to guarantee healthy food for as many vulnerable sectors of the population as possible (e.g., growing children and young people, food-deprived groups, the elderly, and hospitalized patients). The establishment of annual Programme Contracts between producers and entities responsible for logistics and/or companies responsible for catering should be in line with the contracted period, as well as allowing for the financial sustainability of producers and the availability of sufficient stocks to ensure balanced, healthy, and sustainable food for the consumers involved. It is accepted that, depending on the contexts and criteria to be established within the framework of Green Public Procurement, these Programme Contracts may benefit from incentives and public funding, especially in an initial and experimental phase. However, once these priorities have been met, the procurement spectrum should consider other opportunities capable of generating added value to stimulate new investments in the maintenance and progressive expansion of the MAP network.
The MAP will be managed and promoted by producer associations or multi-product producer groups (Ministerial Order 123/2021 of 18 June) and supported by the COPAloc (Local Food Planning Councils), which integrates them into the management of the local food system.
The MAPs to be implemented in the LMA may form a Network of Multifunctional Agrofood Parks, which may be supported by the COPAreg (Regional Food Planning Council). Specific governance models and solutions are challenging to put in place in the local MAP. That is why they should be tailored and always counting on the extensive experience of regional and national bodies responsible for the agricultural sector in processes such as parceling, the promotion of associations, particularly producer organizations, the various models and problems of public or mixed companies, as well as the infrastructure of private spaces.
3. Materials and Methods
The identification of the territories that are more suitable for the implementation of MAP in the LMA implies dealing with the food system complexity analysis that often makes use of a multicriteria analysis that involves the combination of physical, economic, social, and environmental variables [
51,
52]. Hence, Geographic Information Systems (GIS) play a crucial role in processing these analyses since they provide a powerful spatial tool for efficiently creating maps to support decision-making processes [
53,
54]. The combination of GIS with the Analytical Hierarchy Process (AHP), as a multicriteria analysis, is a particularly valuable method within this context [
55,
56]. The AHP approach is a hierarchical method that allows determining the weight of multiple variables based on pairwise comparison matrices, where each variable is compared in terms of relative importance with the counterpart and in relation to the stipulated goals [
57]. According to [
58], the AHP approach is structured in three steps: First, define the criteria/sub-criteria related to the hierarchy of goals; Second, the assessment of the variable importance in the pairwise comparison matrix—in this step is used the fundamental 9-point scale measurement to express individual preferences or judgments, which were created by [
59] (
Table 1); last, in the third step, the consistency check, which consists of validating the weights established from the consistency ratio (CR) analysis, is performed.
In this methodology, we defined the criteria and sub-criteria based on the literature on land suitability assessment [
53,
60,
61] and a bottom-up evaluation with stakeholders. After drafting an initial framework based on the literature review to determine data relevant to this methodology, we held a workshop from the 6th–8th of March 2023 with technicians from municipal chambers and local development associations across the Lisbon Metropolitan Area. During this workshop, we gathered fundamental considerations from those who have an accurate knowledge of the local contexts they work in to refine previously selected data and validate their importance in mapping agrofood establishment potentialities. This was also part of the upper designated bottom-up component of the methodology once the 58 participants in this workshop were representatives of the FoodLink network.
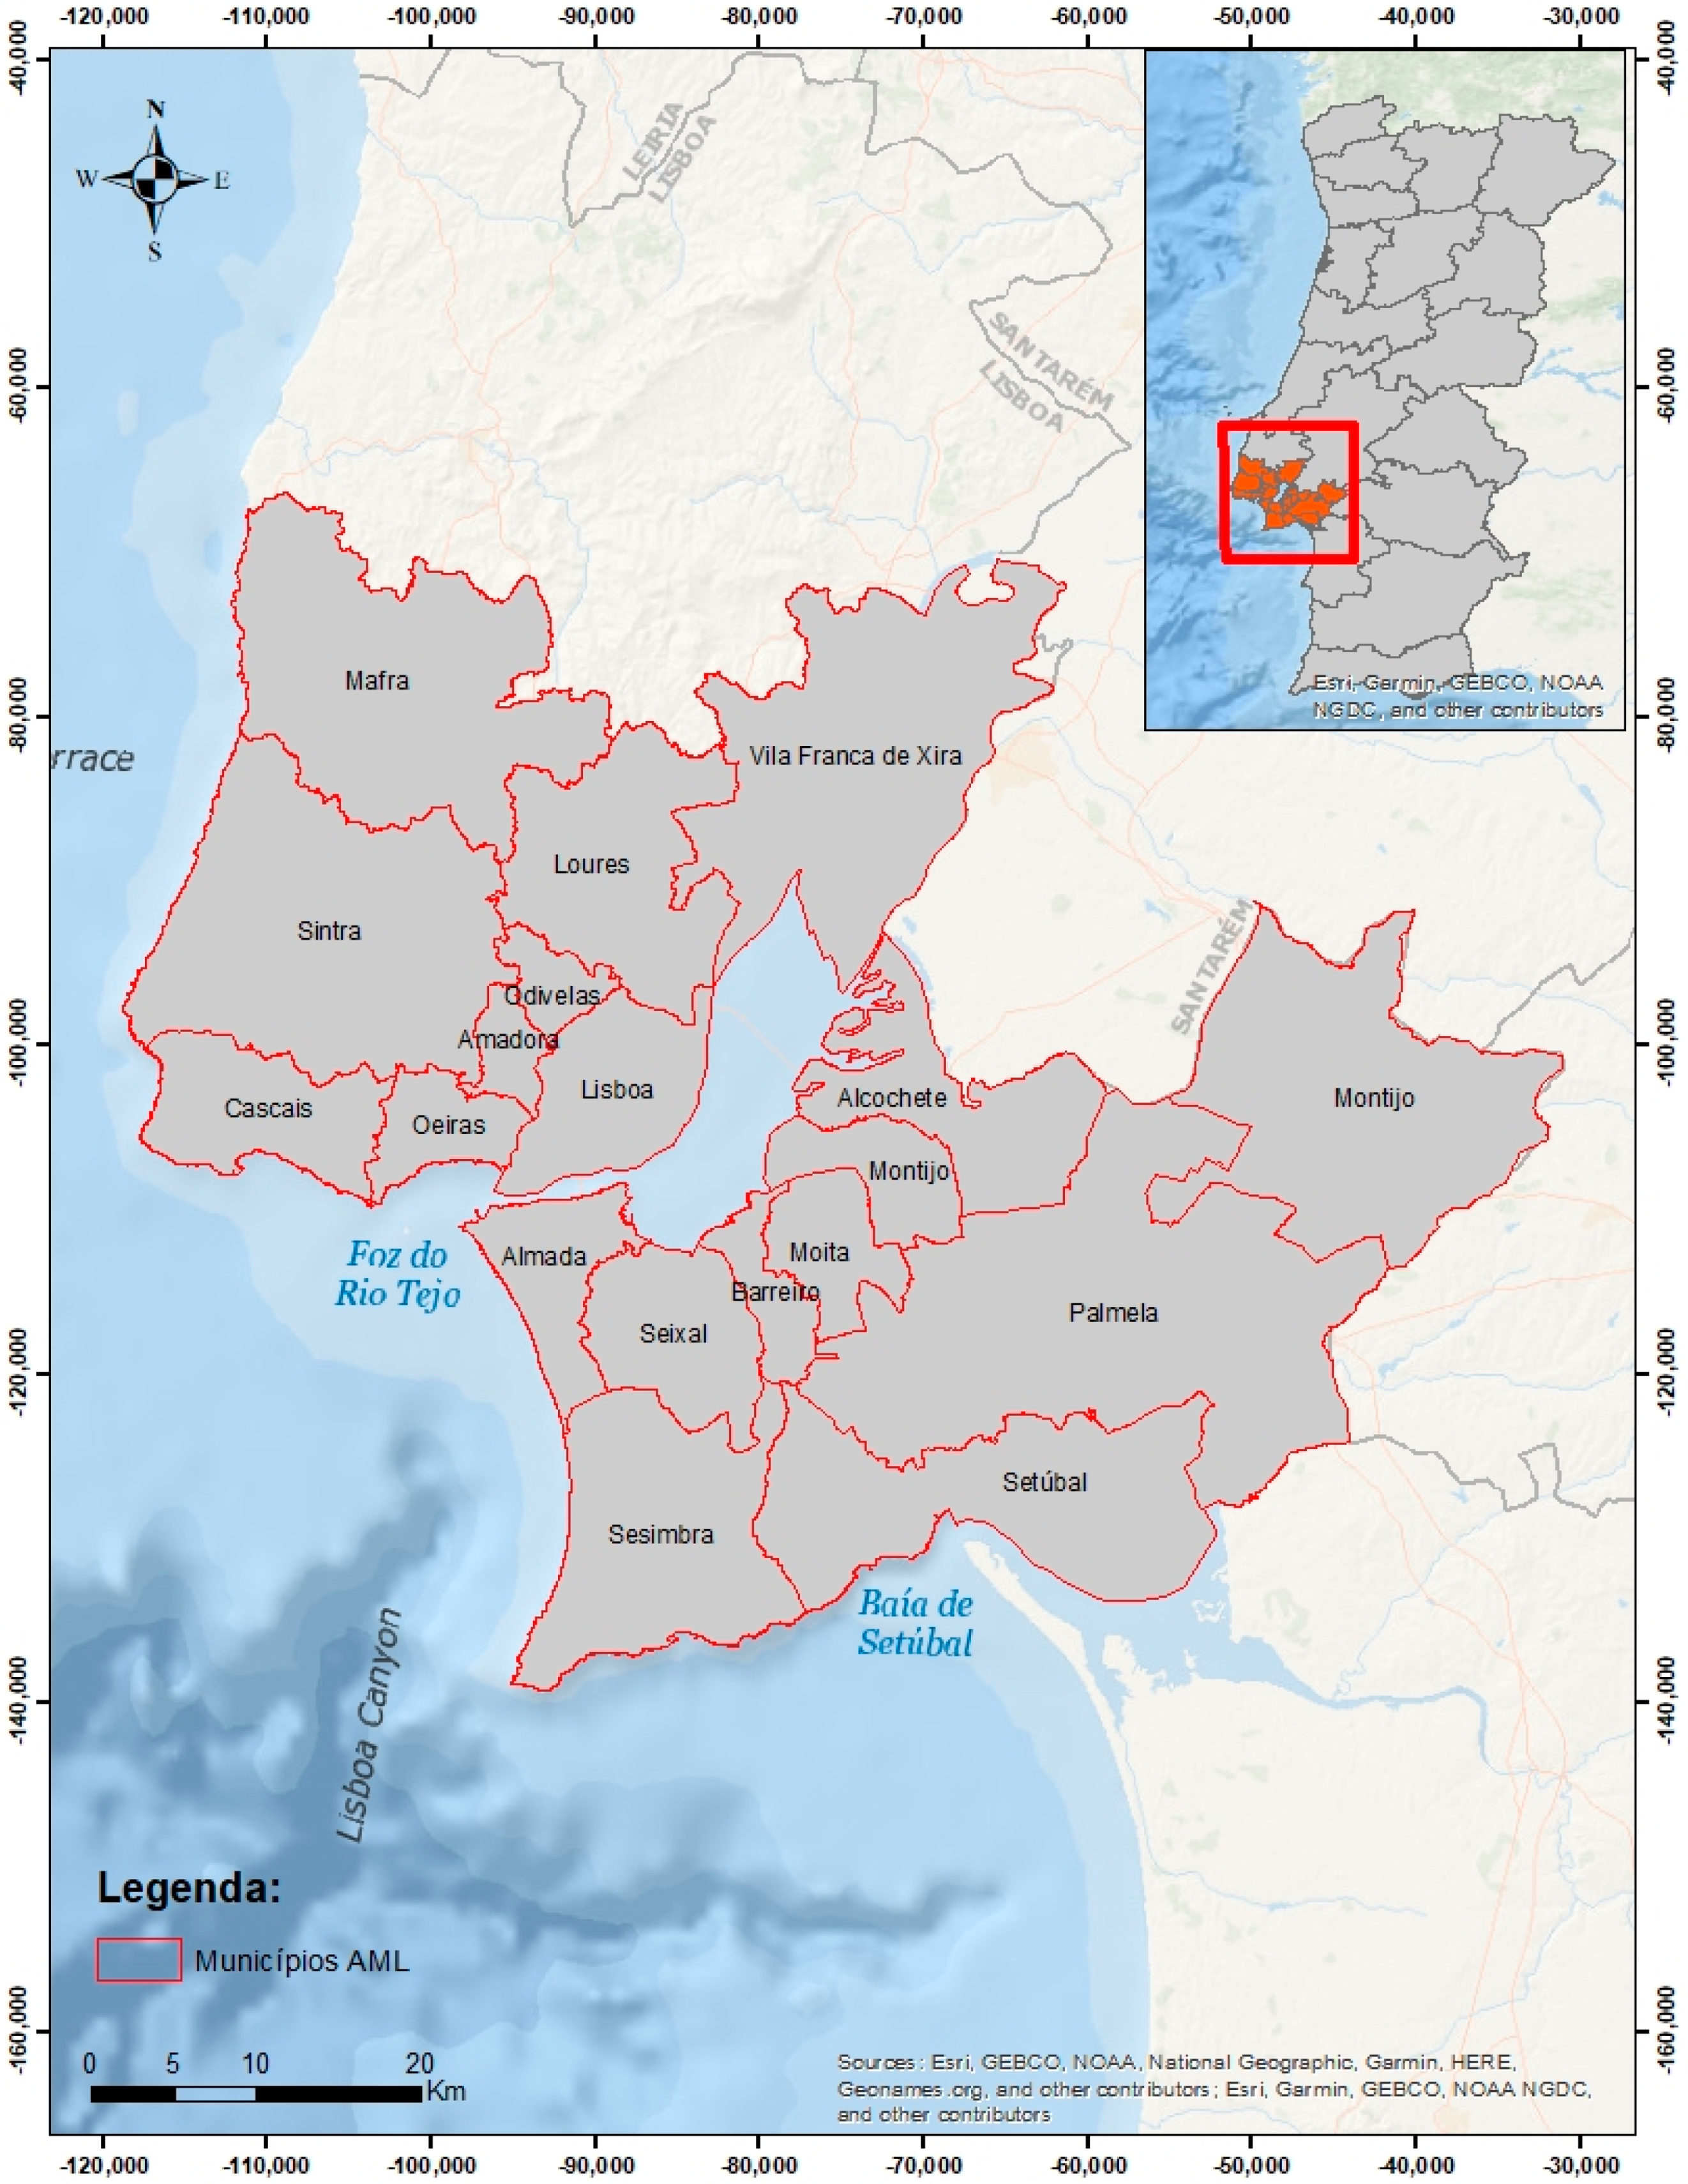
Table 2 presents the final selected data, their sources, and the rationale for their inclusion. It is important to emphasize that all data are at the municipal scale, ensuring that this information accurately represents the 18 municipalities that make up the LMA (
Figure 2). This approach prevents overgeneralization and accounts for the unique characteristics of each territory.
After defining the criteria and sub-criteria, the construction of the model began in a GIS environment—ArcGis software version 10.8 [
65]. Initially, socioeconomic data had to be transformed into spatial information in vector format, and then this information was converted to Raster format. After this, ranges were defined for each of the variables based on the Natural Breaks Jeanks method, a data grouping method whose objective is to determine the best possible arrangement for different classes. Thus, five classes were defined for each of the four socioeconomic variables. The five classes were reclassified on a scale from 1 to 5 according to their respective potential (
Table 3). This step is important to remove problems related to the units of measurement for each variable.
For environmental data, they were reclassified on a scale of 0 to 5 to indicate the most important classes for the establishment of MAP, with 0 indicating that sub-criterion cannot be counted for the establishment and 5 being the most important class (
Table 4). However, for data regarding the National Agricultural Reserve and Areas Under Urban Pressure from the LMA, we used Boolean logic to reclassify the areas; therefore, the values of 0 and 1 were assigned depending on the existence or absence of this class.
After reclassifying and harmonizing the nine sub-criteria, we employed the AHP approach with pairwise comparisons of all variables using Saaty’s method to define weights and create a map of potential MPA areas. Peers assigned importance scores on a scale of 1–9, comparing each variable to another (
Table 5). The weights were then calculated from the normalized sum of each column within the matrix [
66]. Notably, the consistency ratio of 9.2% falls within the acceptable range of >10% (Saaty 1980 [
59]), indicating consistent comparisons between the sub-criteria.
After that, we used the Weighted Linear Combination (WLC) method to identify the potential areas for the MAP. This step was made in the ArcGis software version 10.8 [
65] through the tool raster calculator using the formula in Equation (1).
where MAP is the potential areas for installing MAP, n is the number of considered criteria, W
i is the weight coefficient for criterion i (determined by AHP), and C
i is the value of the membership function for criterion i (representing the degree to which a specific location satisfies each criterion). This score ranges between 1 and 5, with 1 indicating a very low potential, 2 a low potential, 3 a moderate potential, 4 a high potential, and 5 a very high potential for MAP development. The majority filter is then applied to simplify the map by eliminating isolated patches with a value less than 4 to improve spatial coherence. Finally, the raster map is converted to vector format to calculate the areas with moderate, high, and very high potential.
4. Results
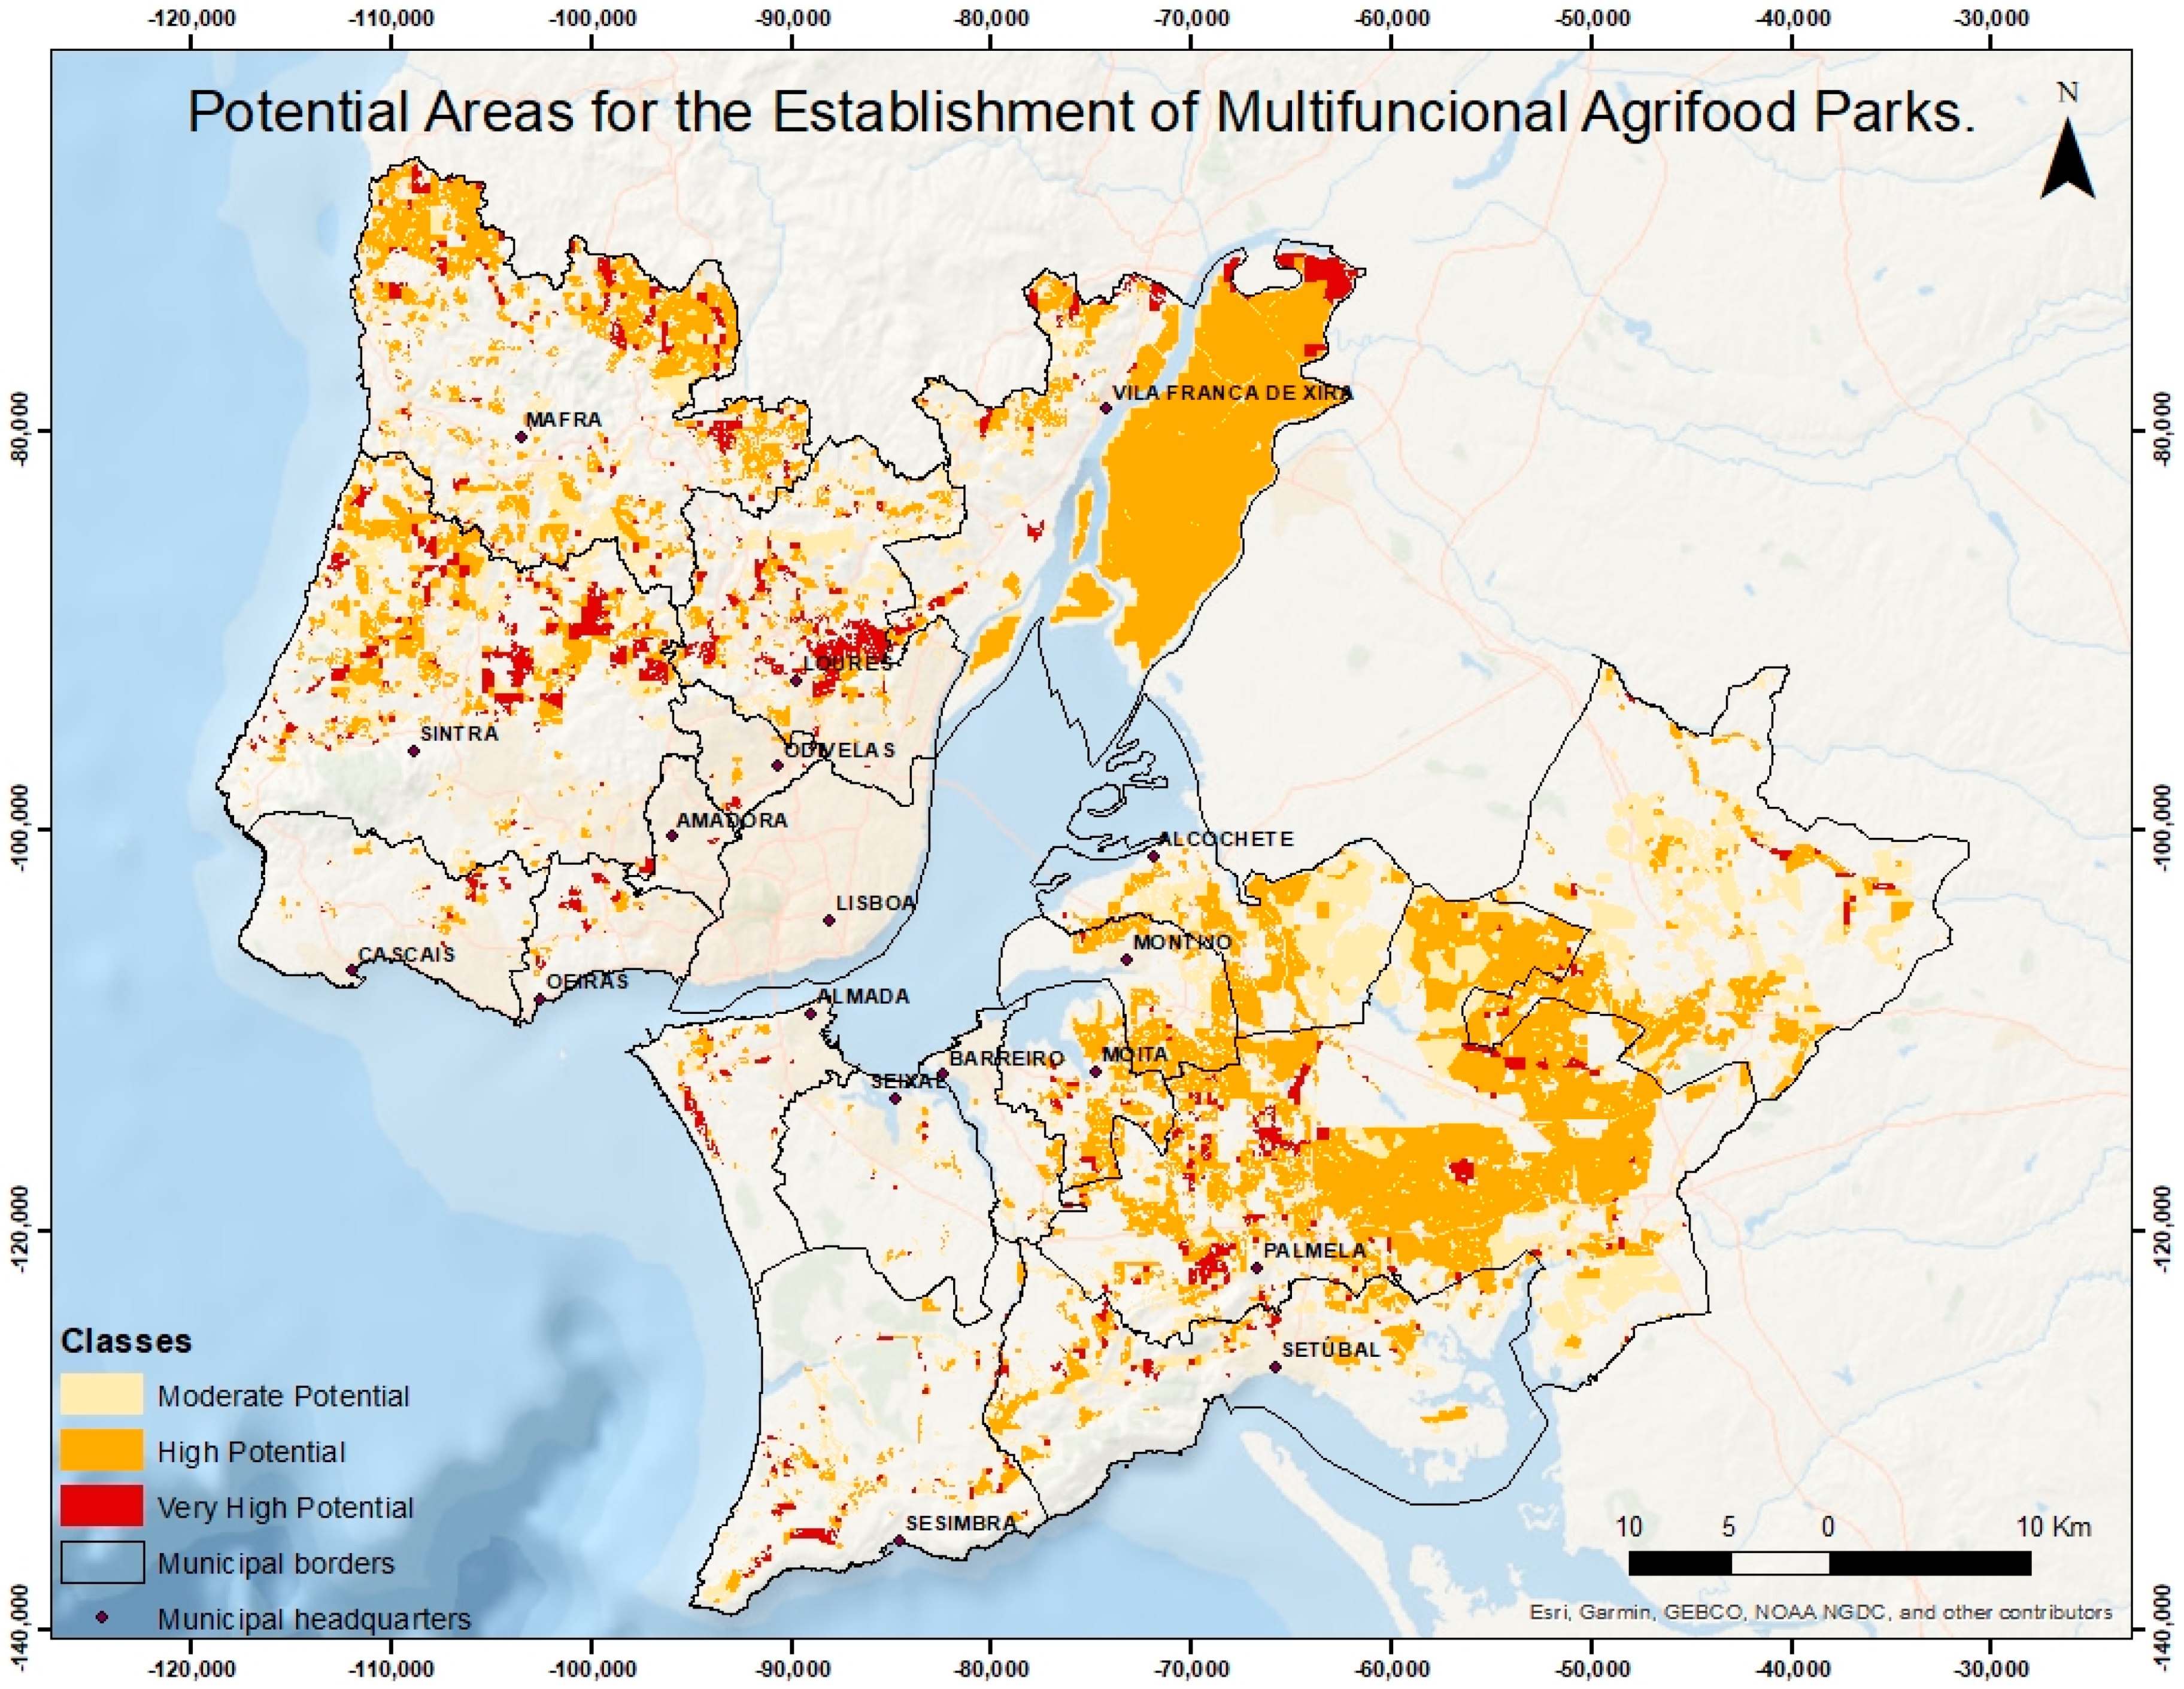
Mapping to identify the higher suitability for the MAP establishment in the LMA identified over 30% of the region with favorable conditions for establishing these parks (
Figure 3). Notably, 19.09% of this area boasts high potential, 9.67% moderate potential, and 2.88% very high potential (
Table 6).
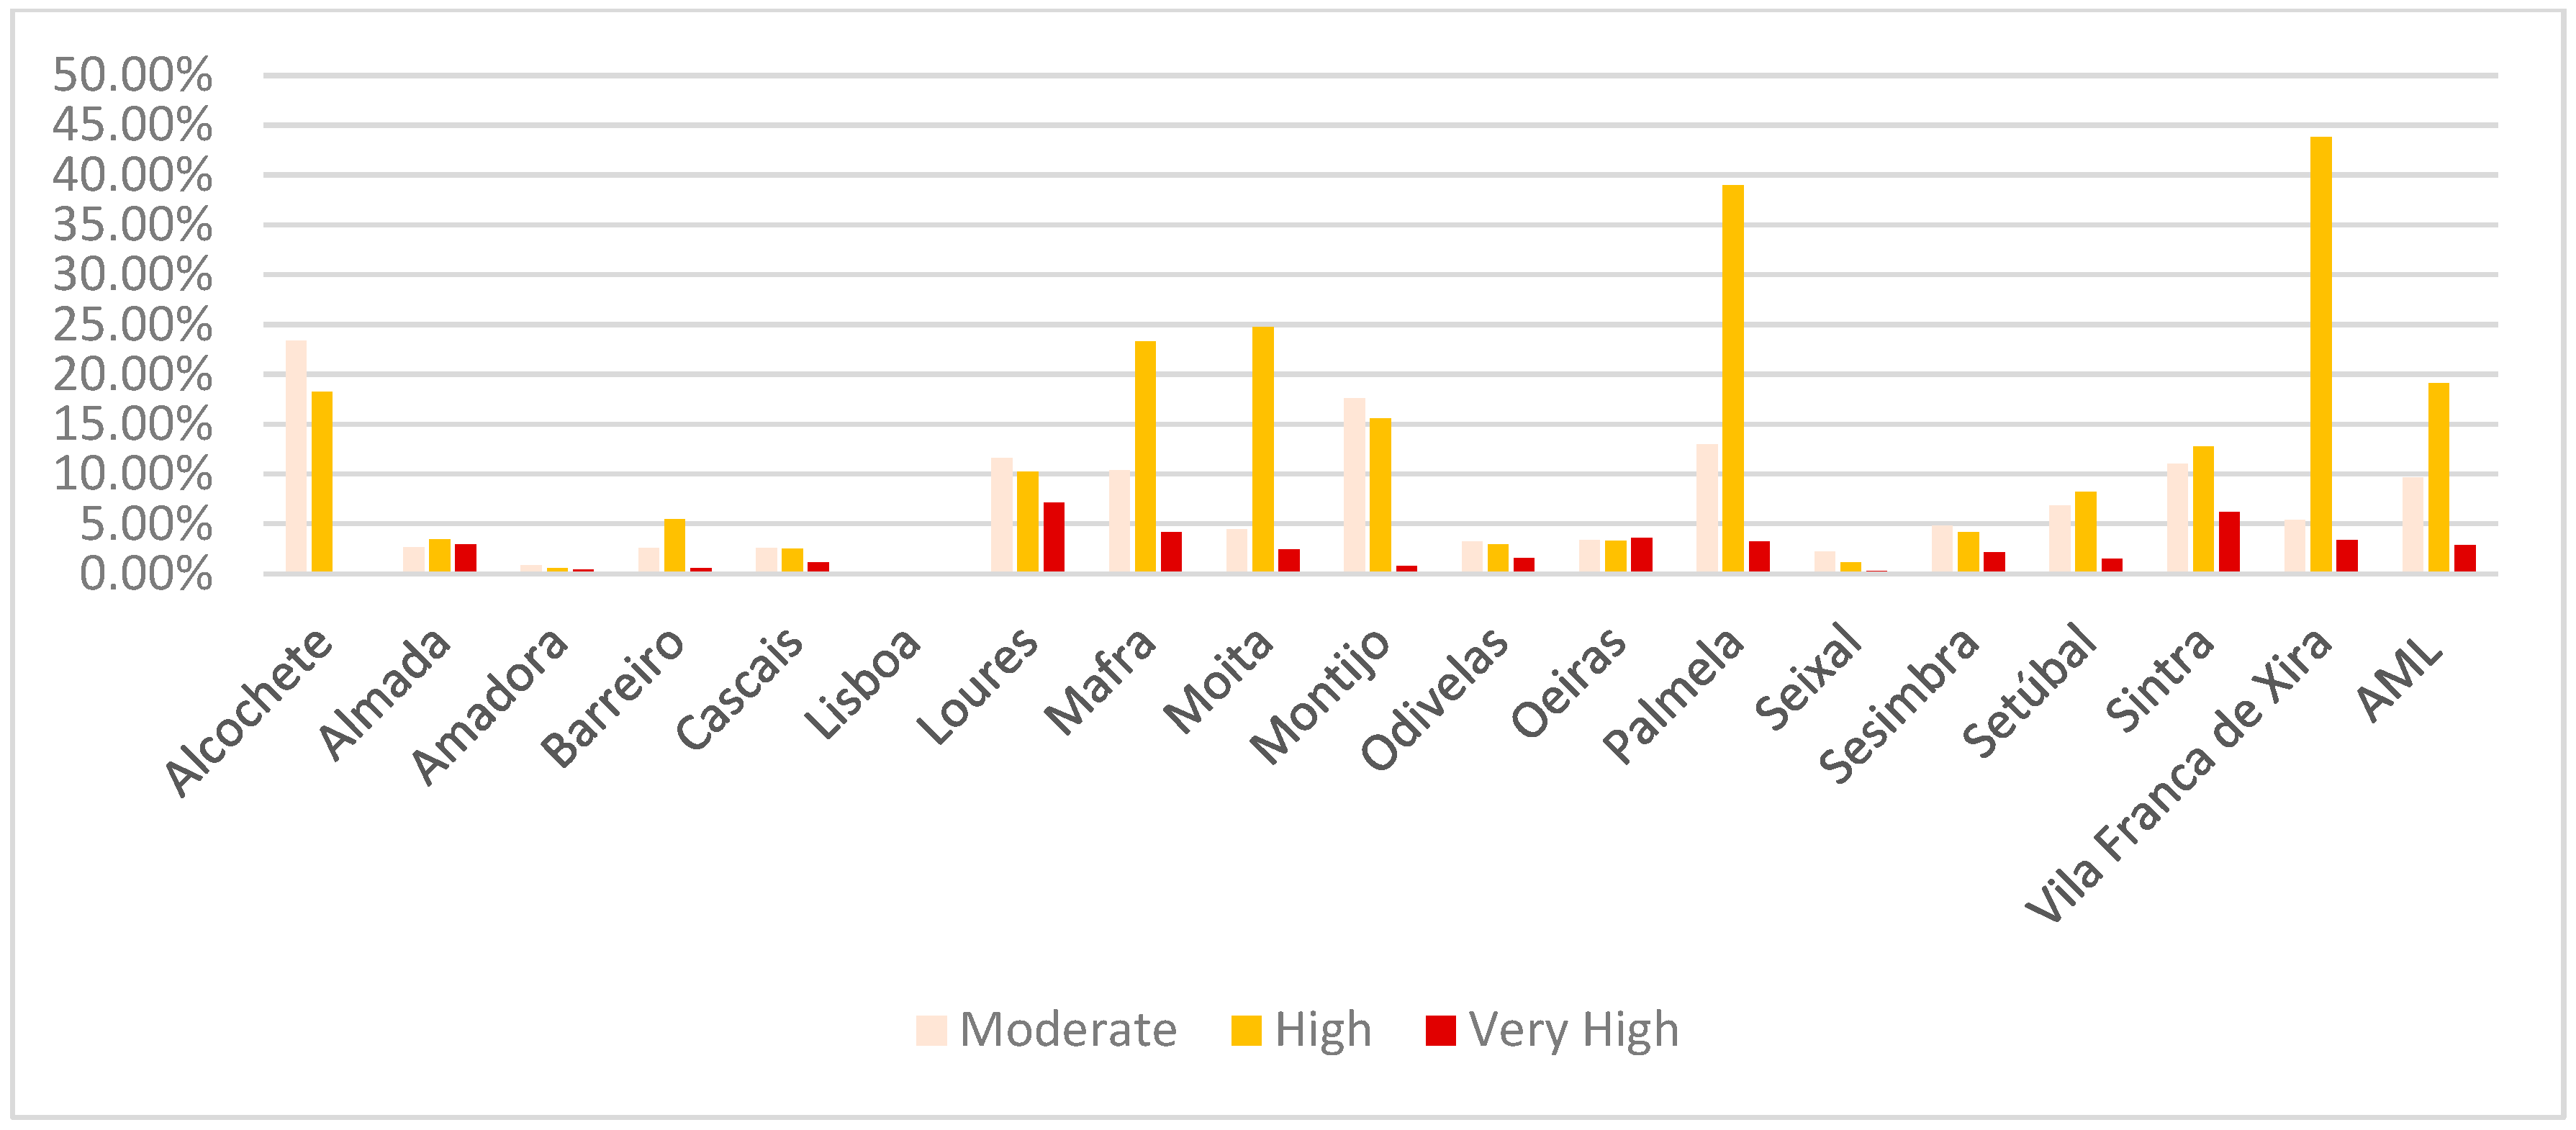
Comparing the potentials of the 18 municipalities of the LMA (
Figure 3 and
Figure 4), it is clear that Palmela and Vila Franca de Xira shine with the highest potentials relative to their total area, claiming 55.19% and 52.57%, respectively. This corresponds to systems from extensive agricultural land, abundant water resources, and proximity to Lisbon’s consumer market. Alcochete also boasts over 40% of its territory being suitable for such parks.
On the contrary, Cascais, Seixal, and Amadora exhibit the lowest potentials, with values of 6.22%, 3.64%, and 1.8%, respectively. Intense urbanization and land occupation by tourist and residential activities in a fragmented landscape limit available agricultural space in Cascais. Meanwhile, Seixal and Amadora’s high population densities and predominantly urbanized landscapes show a low rate of suitable areas for farming.
Lisbon, unfortunately, lacks the potential for a MAP, where consolidated urbanization and limited space other than punctual spots for vegetable gardens render implementing such large projects infeasible.
5. Discussion
Mapping the areas with the potential for the establishment of a MAP at the regional and local levels represents a fundamental starting point for the socio-territorial transformation of the metropolitan food system. The territorialization of this multicriteria analysis is an added value in relation to the distribution of the agricultural land, with a view toward practical action from the perspective of implementing the FTS-LMA since it shows up where the ecological suitability for sustainable food production overlaps with the capacity for intervention by the fabric of producers in each of the 18 municipalities (
Figure 3).
The analysis of the results (
Table 7) demonstrates that the viability of a MAP is directly linked to the biophysical and socioeconomic characteristics of the territory. Regions with the highest potential for implementing this model include Palmela, Vila Franca de Xira, Mafra, and Alcochete. These areas exhibit a high percentage of family farming (above 68% in most cases) and a significant proportion of small-scale properties (ranging from 50% to 74.70%). These factors create favorable conditions for the organization of MAPs, as they indicate a well-established local agricultural structure and the potential for cooperative arrangements. Additionally, the predominance of agricultural holdings with annual revenues below 25,000 EUR (above 49%) in these regions underscores the need for improvement and diversification of agricultural activities. MAPs thus emerge as a strategic alternative to enhance productivity and economic viability. However, challenges remain, particularly regarding the low educational levels of farmers in some areas, such as Mafra (13%) and Palmela (21%). This may hinder the adoption of targeted policies to improve technical skills and governance.
Alcochete stands out because of its relatively high MAP potential (41.62%), supported by a notable percentage of small-scale properties (50%) and a considerable proportion of low-income farms (49.21%). Furthermore, 40% of its farmers have education beyond basic schooling, a higher percentage compared with other municipalities. This suggests a greater capacity for adopting new agricultural models, increasing the feasibility of MAPs as a development strategy. However, its relatively low percentage of family farming (25.85%) could be a limiting factor, as the MAP model relies on the integration of small farmers.
Montijo, Moita, Sintra, and Loures also exhibit characteristics that suggest the relevance of MAP development, but they face structural limitations that may hinder large-scale implementation. In these municipalities, family farming remains at intermediate levels (between 53% and 80%), and the proportion of small-scale properties (above 55%) suggests potential for adopting this model. However, the low educational levels of farmers (ranging from 16% to 24%) may restrict the incorporation of advanced agricultural practices, highlighting the need for capacity-building and training programs. Additionally, the predominance of low-income agricultural holdings (above 71%) reinforces the importance of policies promoting product diversification and value-added agricultural chains, which are essential for ensuring greater economic sustainability in these territories. It is also important to remark that in all these municipalities, less than 45% of the total area is dedicated to agricultural activities (including agriculture, pasture, or agroforestry systems), which may affect the potential for implementing MAPs.
Conversely, municipalities with low potential for MAPs, such as Lisbon, Amadora, Cascais, and Seixal, exhibit structural characteristics that significantly hinder the adoption of this model. The most critical factor is intense urbanization, which limits the availability of land for structured agricultural activities. While some of these areas have a high percentage of small-scale properties, land fragmentation and the dominance of urban land use patterns render MAPs largely unfeasible.
Overall, the total area with potential for installing MAPs (31.64%) is lower than the area dedicated to agricultural production in 2018 (38%), where it is notably seen that less than 20% (19.09%) has a high potential for this objective. These results may suggest a reduction in the productive area or its conversion to principles of ecological suitability that guarantee the production of sustainable and healthy food, providing an area for other ecological, recreational, and educational functions. On the other hand, it is not expected that the entire area with the potential for the installation of MAP will be implemented for this purpose, which will depend greatly on the dynamics and perspectives regarding the food transition within the framework of local policies. Support and guidance for the pursuit of these projects at a municipal, inter-municipal, or sub-municipal level should thus be framed within the FTS-LMA, supported by the FoodLink network, which concentrates knowledge, capacity to integrate sectoral policies and to leverage a concrete action plan both at the regional and local level. This is the path that is being pursued. In 2023, the implementation of the first MAP run in the municipality of Almada—Parque das Terras da Costa e Mar, with the aim of enhancing the agricultural landscape in a protected area in a coastal zone and integrating farmers and fisherman from a vulnerable community. In 2024, the Action Plan for FoodLink’s activities for the three-year period 2024–2026 was defined, which includes the establishment of between one and four MAPs to be funded by European Programmes in the context of Common Agricultural Policy and the Regional Development Programmes. In the first semester of 2024, four expressions of interest were expressed by the municipalities of Mafra, Sintra, Palmela and Setúbal in accordance with the potential shown in the mapping described above, which proves its objective and usefulness in supporting decision-making and encouraging the conversion of a strategy into principles of action towards the food transition in practical and consequential terms.
6. Conclusions
The integration of multi-sectorial spatial and statistical data has been modeled and mapped, focusing on the spatialization of the territorial potential of MAP establishment in the LMA, which may shape a new perspective of the regional identity and its impact on food transition.
The results provide relevant information for planning the food system from a local food production point of view, emphasizing the multifunctionality approach of the MAP network to contribute to regional development. When better connecting the productive and consumption dimensions of the food system, not only urban and rural areas would be strongly and most proficiency interlinked but also peri-urban areas, as intermediate regions, might be recovered from peripheral uses and socially excluded surroundings they are often devoted, enhancing landscape quality, ecological connectivity amongst other provide important ecosystem services, sustainable food supply being one of the most relevant. However, it is necessary to consider that agricultural land is competing with other land uses, particularly in the context of global crises. Moreover, its market value may vary in both directions, either changing into an urban fabric laden with construction sites, industrial or commercial units, and grey or green or satisfying the local food supply when food prices rise to an unaffordable level. The specificities of the socioeconomic features of the food system in each municipality may determine both the production and governance models for the MAP to succeed; the diversity of MAPs that are expected to be established is seen as a positive trajectory from which lessons, knowledge, and experiences might be complementary towards a food system planning effectiveness. Furthermore, the analysis of the potential to establish a MAP at the landscape level was crucial to define a possible governance system that supports food production while ensuring that public goods (biodiversity and ecosystem services on which they depend) are protected and enhanced, namely by integrating MAPs on a metropolitan green infrastructure.
Yet the food-flow approach shown in
Figure 1 also includes the distribution network, which relies on the relationship between food producers (such as those organized in MAPs) and the respective consumer markets. However, since data are only available at the municipal level, the food production capacity still needs to be calculated through the assessment of the food quantity, quality, and diversity that ensures the demands of the local population that the local food system encompasses, which could also be named as foodshed self-sufficiency [
67].
The establishment of this MAP network aims to contribute to the reconfiguration of the metropolitan food system [
27,
46] and the regional ecological connectivity when incorporating the sustainable food production areas, especially the MAP, into the green infrastructure [
68,
69,
70].
Public food procurement, mostly corresponding to collective catering, particularly regarding school meals, will be an essential asset to set up the necessary commitments to ensure the integrated planning of food systems, including food production and food consumption at the local food system scale [
71].
Nevertheless, the idea is not to create an incontestable argument that ‘local food is best’ [
72] and fresher [
73] but rather to reframe the local–global food systems debate through a resilience lens [
74,
75] and to identify, experience and demonstrate multi advantages on short supply chains [
76,
77], such as the implementation of the principles of water–energy–food–ecosystem nexus in practice [
78], the local capacity to plan food supply and security in the context of crises such as pandemics [
79,
80,
81], or geostrategic conflicts, and to promote a just economy where local entrepreneurship may have the opportunity to succeed.


