Article

Assessment of Low-Carbon Utilization in Territorial Space and Identification of Its Driving Factors: A Case Study of the Yangtze River Economic Belt in China

1
Department of Land Resource Management, School of Public Administration, Sichuan University, Chengdu 610065, China
2
School of Applied Economics, University of Chinese Academy of Social Sciences, Beijing 102488, China
3
School of Management, Sichuan Agricultural University, Chengdu 611130, China
*
Author to whom correspondence should be addressed.
Land 2025, 14(4), 738; https://doi.org/10.3390/land14040738
Submission received: 3 March 2025 / Revised: 21 March 2025 / Accepted: 27 March 2025 / Published: 29 March 2025

Abstract

:
The low-carbon utilization (LCU) of territorial space represents a critical strategy for addressing climate change and promoting sustainable development, yet current assessments in this domain remain insufficient. This study develops an integrated assessment framework utilizing kernel density estimation, an optimal parameter-based geographical detector, and the Tobit regression model to analyze the spatiotemporal evolution, typology, and driving factors of the LCU of territorial space in the Yangtze River Economic Belt. The findings reveal that the LCU index in this region increased from 0.548 in 2005 to 0.569 in 2020, despite significant regional disparities. Cities are classified into eight distinct types of LCU, with over 80% demonstrating poor performance in at least one functional space, particularly in urban space where the number of cities below the average is highest. The analysis demonstrates that the LCU of territorial spaces is influenced by an integration of natural conditions, socio-economic factors, and landscape patterns. In light of these findings, this study systematically proposes policy recommendations to enhance the LCU of territorial space. This research contributes to the establishment of a scientific evaluation framework for the LCU of territorial space, providing empirical evidence to improve spatial governance policies and support sustainable development.

1. Introduction

Amidst the escalating global climate crisis, reducing carbon emissions and achieving a low-carbon transition have become an urgent, shared mission for the international community. Territorial space, as the fundamental platform for all human socio-economic activities and a major site of carbon emissions, is also crucial for realizing carbon sequestration [1]. Its development patterns and trends are intricately linked to carbon emissions and the sustainable development of the society and economy [2]. Different modes of territorial space utilization significantly affect greenhouse gas emission levels. For example, the acceleration of urbanization and industrialization has led to excessive exploitation of land resources and the inefficient spatial distribution of energy-intensive industries [3,4], resulting in substantial greenhouse gas emissions [5]. The systematic optimization of territorial space utilization patterns could enhance ecosystem carbon sequestration capacity, while reducing land use-related emissions [6].
Globally, the patterns of territorial space utilization and associated carbon emission characteristics exhibit significant heterogeneity across nations, primarily attributable to disparities in development stages, resource endowments, and policy orientations. Developed countries have progressively integrated low-carbon principles into territorial space planning and governance, achieving measurable emission reductions through strategic urban design, optimized industrial layouts, and renewable energy deployment [7,8]. In contrast, developing nations face the dual pressures of economic growth and low-carbon transition during rapid industrialization and urbanization [9]. Their territorial space development intensity has increased to meet expanding socio-economic demands, inadvertently elevating carbon emissions in major emerging economies [10,11]. Concurrently, technological and financial constraints hinder the effective implementation of low-carbon spatial planning strategies [12,13]. This divergence underscores the critical need for developing countries to accelerate the establishment of low-carbon territorial space frameworks. Such transformation represents a vital pathway for reconciling developmental imperatives with climate commitments, ultimately fostering sustainable territorial space governance systems.
As the essential carrier for human activities, territorial space has become an increasing focus of academic research, especially concerning its utilization assessment. The key themes in evaluating territorial space utilization include its structure [14,15], resilience [16], efficiency [17,18], suitability [19,20], and conflicts [21,22,23]. These studies typically follow a framework of “functional division–multiple evaluation–optimization regulation”. Initially, territorial space is categorized based on function into urban, agricultural, and ecological spaces [24,25]. Following this classification, an appropriate measurement indicator system is developed. Various methods, such as the SBM model [26], DEA model [27]), TOPSIS [28], and weight summation method [17,25], are employed to assess territorial space utilization across different geographical regions. These studies contribute to the assessment and optimization of the allocation and utilization of territorial resources. However, they often neglect carbon emission factors, hindering a comprehensive assessment of the environmental costs of territorial space utilization, which is crucial for achieving balanced economic, social, and environmental development.
In fact, with growing concerns about climate change, some studies have incorporated low-carbon perspectives into the evaluation of territorial space utilization. These investigations can be categorized into two types. The first focuses on specific categories of territorial space, particularly urban and agricultural spaces, examining the spatiotemporal variations and underlying driving factors of their LCU [29]. For instance, Wu et al. (2022) analyzed the urban land use efficiency of 91 cities in China’s Yellow River Basin under low-carbon emission constraints [30]. Kuang et al. (2020) integrated carbon emissions into a cultivated land use efficiency evaluation framework, employing a slacks-based measure model with undesirable outputs to assess the low-carbon utilization of farmland across 31 Chinese provinces [31]. The second category reflects an evolving understanding of integrated territorial space development, where scholars have begun adopting more systemic approaches to evaluate the LCU of territorial space. Zhang et al. (2023) established a carbon emission measurement methodology for territorial space and conducted a comprehensive spatial differentiation analysis of low-carbon development efficiency in Suzhou, China, considering economic, social, and ecological dimensions [32]. Chen et al. (2024) investigated the spatiotemporal characteristics of territorial space utilization efficiency in resource-based cities along the Yellow River Basin through input factors, desirable outputs, and undesirable outputs under dual carbon goals, while identifying driving factors from both natural and socio-economic perspectives [33].
While progress has been made in evaluating the LCU of territorial space, several critical aspects require further exploration. First, existing studies have not sufficiently clarified the correlation between territorial space functional types and carbon emissions, hindering the effective assessment of LCU outcomes. Second, the current research predominantly concentrates on specific space categories, like urban and agricultural areas, lacking comprehensive systemic perspectives. Regarding evaluation metrics, the selection process remains problematic, as indicator systems often prioritize quantity over precision, leading to inconsistent results due to different index choices. Presently, there is a need for a concise and targeted evaluation framework. Furthermore, while most studies emphasize natural and socio-economic drivers, few have considered the influence of landscape patterns on the LCU of territorial space.
The Yangtze River Economic Belt (YREB), a national strategic area spanning eastern, central, and western China, integrates megacity clusters, agricultural production bases, and ecological barrier zones. Its LCU of territorial space proves crucial for regional sustainability and serves as a model for China and developing countries in carbon reduction. Distinct geographical disparities also across its upper, middle, and lower reaches create spatial heterogeneity in territorial development intensity and ecological vulnerability. Therefore, this study focuses on the YREB with the research objectives to systematically evaluate the LCU of territorial space and identify its underlying driving factors, thereby providing theoretical references and practical strategies for achieving coordinated development between low-carbon transition and territorial spatial planning in large-scale economic regions. Specifically, this research aims to resolve three key questions: (1) What is the correspondence between territorial space functional types and carbon emissions? (2) How can a targeted and direct assessment framework for LCU of territorial space be constructed? (3) What are the spatiotemporal evolutionary patterns and underlying drivers of the LCU of territorial space? The main innovative aspects of this study are as follows: Firstly, we have enhanced the clarification of the correspondence among functional types of territorial space, land use types, and carbon emissions. Building on this foundation, we established a systematic assessment framework for the LCU of territorial space, focusing on three functional types: urban space, agricultural space, and ecological space. This comprehensive perspective emphasizes the integrity and specificity of LCU, addressing certain limitations present in traditional assessments. Secondly, we have implemented spatial zoning based on the distinctive characteristics of the LCU of territorial space. Previous studies rarely adopted such a spatial classification approach from an LCU perspective, and this approach allows for the precise identification of the strengths and weaknesses of regional LCU, thereby providing theoretical support and practical reference for territorial space planning. Furthermore, we combined optimal parameter geographic detectors with a Tobit model to systematically explore the driving factors influencing the LCU of territorial space from three perspectives: natural factors, socio-economic factors, and landscape pattern characteristics. Existing studies have inadequately addressed the comprehensive exploration of these drivers, particularly overlooking the role of landscape pattern characteristics, thereby neglecting the impact of territorial space development patterns on the LCU of territorial space. Our approach provides critical insights into these underexplored interactions.
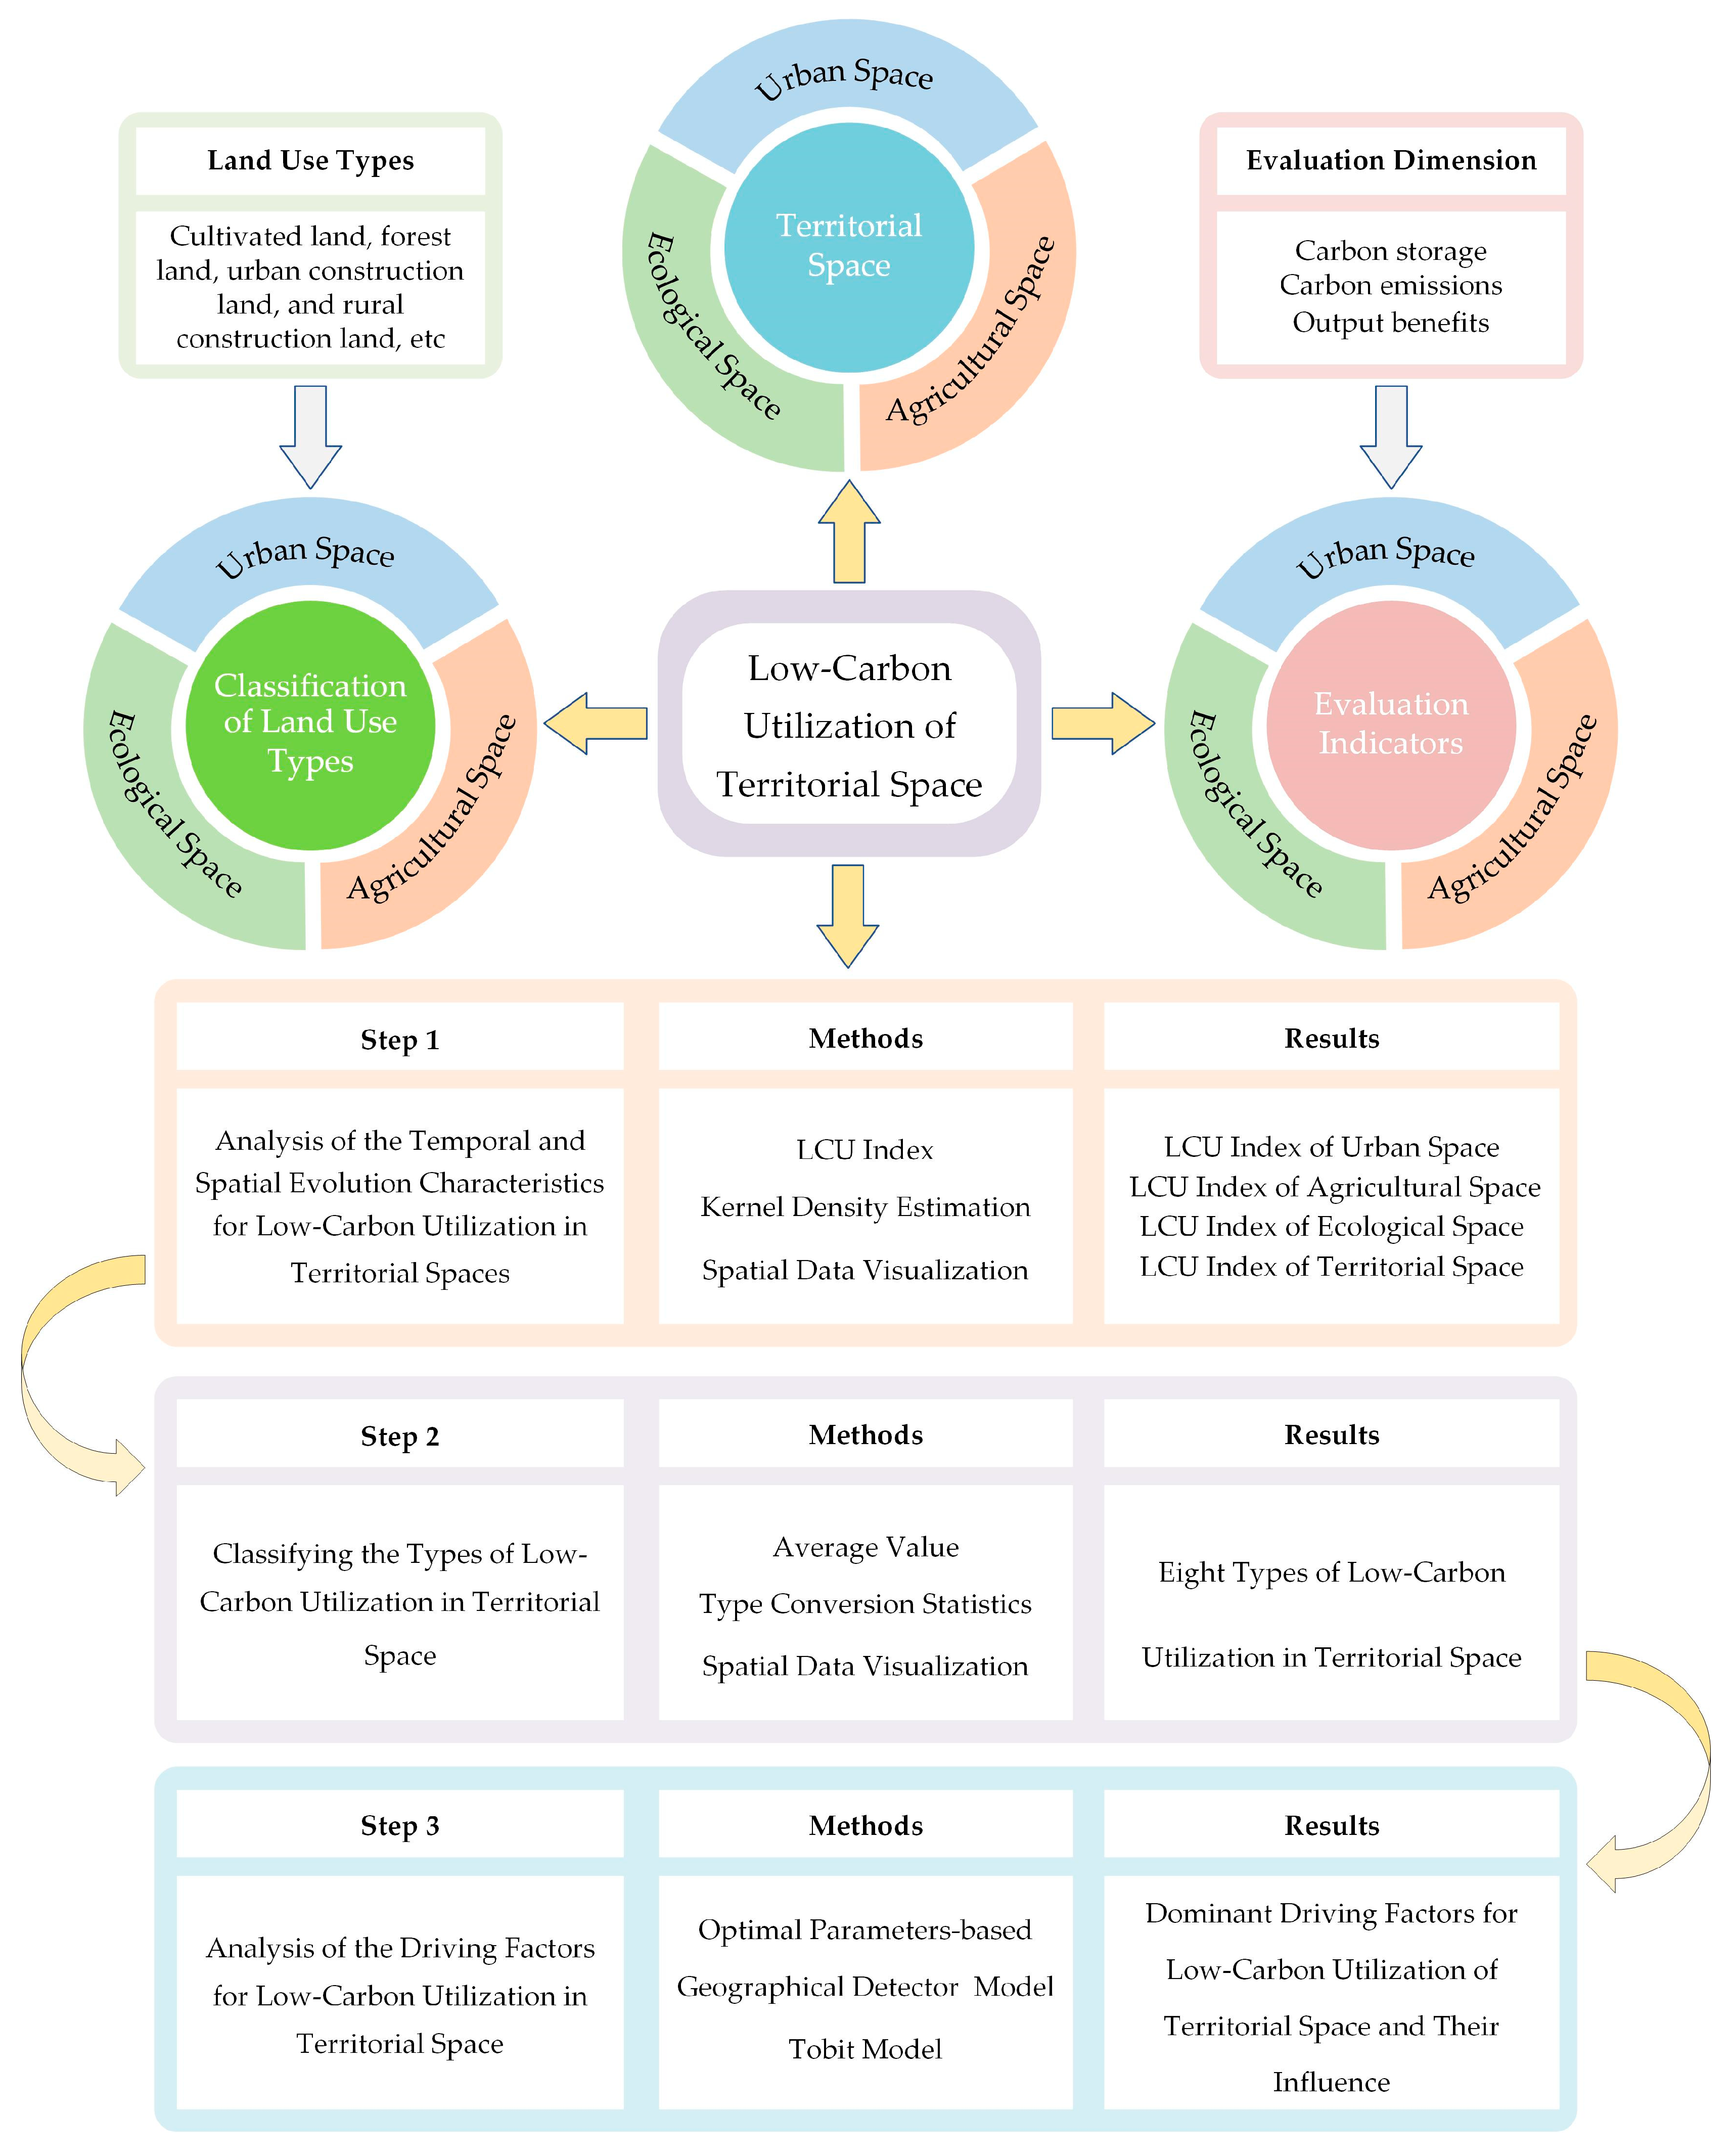
As illustrated in Figure 1, the research framework operates through three phases. First, territorial space functional zoning is established to clarify carbon emission correlations across spatial categories. A tri-dimensional evaluation system integrating carbon storage, carbon emissions, and output benefit is developed to analyze the spatiotemporal evolution characteristics of LCU. Second, territorial space is classified into distinct LCU types to inform precise development strategies. Finally, a comprehensive driver analysis is conducted across natural foundational factors, socio-economic conditions, and landscape pattern indices. This study contributes novel perspectives for advancing green low-carbon development, optimizing territorial space utilization models, and achieving sustainable development goals, offering significant theoretical and practical implications.

2. Materials and Methods

2.1. Study Area

The YREB, a pivotal economic hub in China, spans approximately 2.0523 million square kilometers, accounting for 21.4% of the nation’s total land area [16]. This region contributes over 40% of China’s population and GDP, underscoring its substantial economic vitality and growth potential. Geographically and economically, the YREB is divided into three distinct zones (Figure 2): the upper reaches (Sichuan, Chongqing, Guizhou, and Yunnan provinces), the middle reaches (Jiangxi, Hubei, and Hunan provinces), and the lower reaches (Shanghai, Jiangsu, Zhejiang, and Anhui provinces). These divisions reflect pronounced regional disparities and economic gradients across the region. However, rapid economic expansion has intensified challenges, such as tightening resource constraints and severe environmental degradation. Balancing economic development with low-carbon transition under the dual pressures of resource scarcity and environmental strain has emerged as a critical issue for the YREB and China at large [34]. Addressing these challenges necessitates a paradigm shift toward low-carbon territorial space utilization—a strategic pathway to harmonize socio-economic progress with environmental sustainability [2]. This study focuses on the YREB to explore optimized models of territorial space utilization aligned with green, low-carbon principles. By investigating spatial patterns, drivers, and evolution mechanisms of low-carbon practices in this region, the research aims to provide actionable insights not only for the YREB’s sustainable transformation but also for broader national and global efforts toward climate-resilient development.

2.2. Data Source

This study incorporated spatial and statistical data from various sources. (1) Land use data (with a resolution of 1 km), DEM data (with a resolution of 500 m), and temperature and precipitation data (with a resolution of 1 km) were obtained from the Resource and Environment Data Center of the Chinese Academy of Sciences (https://www.resdc.cn/, accessed on 1 December 2023). (2) Road network information was sourced from the National Geomatics Center of China (https://www.tianditu.gov.cn/, accessed on 1 August 2023). Socio-economic data were derived from several sources, including the China City Statistical Yearbook, China Agricultural Statistical Yearbook, and the Compilation of Cost and Income Data for China’s Agricultural Products (https://data.cnki.net/, accessed on 1 January 2022). These data included the population, GDP, grain production, and grain prices. Some missing values were supplemented using linear interpolation methods [35]. (3) Carbon emissions data were obtained from the China City Greenhouse Gas Working Group (https://www.cityghg.com/, accessed on 1 January 2024). This dataset, which provides detailed carbon emissions data across various industries in different Chinese cities, has been used widely in numerous studies [36]. As this dataset only covers detailed carbon emissions data for Chinese cities for the years 2005, 2010, 2015, and 2020, the period of study is limited to these years.

2.3. Assessment Framework for Low-Carbon Utilization of Territorial Space

2.3.1. The Correspondence Between Territorial Space Functional Types and Land Use Types

Territorial space can be functionally categorized into urban, agricultural, and ecological spaces, reflecting its intrinsic nature as a dynamic, multi-element interactive system [24,25].
Urban space primarily serves regional economic growth, industrial agglomeration, and public service provision. This subsystem supports industrial production, drives commercial and service sector development, and accommodates residential needs. Accordingly, urban space in this study encompasses land use types, such as urban construction land, industrial/mining land, residential land, and other urban infrastructure.
Agricultural space plays an irreplaceable role in safeguarding food security and maintaining social stability. Its productive functions supply food and raw materials, while generating employment opportunities for rural labor. Additionally, agricultural space serves as living and residential areas for rural populations, reinforcing social cohesion. Based on these functions, agricultural space in this research includes cultivated land and rural residential land [15].
Ecological space provides essential material foundations for human survival and development. Through synergistic interactions among forests, grasslands, water bodies, and other ecosystems, it delivers critical services, such as watershed conservation, soil-water retention, and climate regulation. Consequently, ecological space in this research includes forests, grasslands, water bodies, and unutilized land.

2.3.2. The Correspondence Between Territorial Space Functional Types and Carbon Emissions

Territorial space encompasses multifunctional zones—urban, agricultural, and ecological—each characterized by distinct carbon emission and sequestration dynamics. Evaluating low-carbon utilization through these three spatial lenses provides a precise understanding of regional carbon emission status and decarbonization priorities, serving as a robust approach to comprehensively analyze low-carbon development trends. This study adopts a sectoral reclassification methodology aligned with the IPCC Guidelines for National Greenhouse Gas Inventories and the classification framework established by China’s Greenhouse Gas Working Group. Carbon-emitting sectors are restructured into six categories based on consumption activities: agriculture, industry, services, urban residential, rural residential, and transportation. A systematic correspondence is established between territorial space functions, land use types, and carbon emission inventories through the spatial localization of consumption-driven emissions.
Urban space, as the hub of socio-economic activities, primarily contributes to emissions through industrial production, transportation, and urban residential energy use. Accordingly, emissions from industry, services, urban residential sectors, and transportation are attributed to urban spatial assessments. Agricultural space, critical for food production and rural livelihoods, generates emissions from agricultural practices (e.g., fertilizer application, machinery energy consumption, crop processing) and rural residential activities. Emissions from agriculture and rural residential sectors are thus mapped to this spatial category. Ecological space, focused on conservation and natural restoration, exhibits significant carbon sequestration capacity. While direct emissions from ecological zones are negligible, their role in carbon absorption is prioritized. Consequently, this study emphasizes ecological space’s sequestration function, excluding minimal potential emissions from assessments [33].

2.3.3. The Evaluation Indicators for Low-Carbon Utilization of Territorial Space

The LCU of territorial space represents a sustainable spatial development model that maximizes output benefits, while effectively maintaining and enhancing ecological carbon storage and significantly reducing carbon emission intensity [1]. This study seeks to construct evaluation metrics that directly reflect the LCU of territorial space. To achieve this, we prioritize indicators most relevant to low-carbon spatial practices, enabling the precise identification of evolutionary patterns and driving factors. Three core indicators—carbon storage, carbon emissions, and output benefit—are selected for their distinct roles in characterizing the tripartite attributes of territorial space utilization: natural foundation, process constraints, and efficiency objectives. Integrating these three indicators partially overcomes limitations in traditional evaluations, such as the disconnection between carbon accounting and territorial space functional types, as well as inaccuracies caused by excessive indicator selection.
The carbon storage metric focuses on the carbon sequestration capacity and carbon sink potential of land cover systems [37], revealing the ecological regulation efficiency inherent to territorial spaces. Methodologically, carbon storage density is calculated by dividing the carbon storage of territorial spaces by their corresponding functional area, allowing a comparative assessment of carbon sequestration potential across spatial types. The calculation of carbon storage adopts the carbon storage module in the Invest model, and the calculation formula is as follows:
C i = C i _ a b o v e + C i _ b e l o w + C i _ d e a d + C i _ s o i l
where C i denotes the carbon storage density of the i-th land use type. C i _ a b o v e , C i _ b e l o w , C i _ d e a d , and C i _ s o i l individually represent the above-ground biological carbon density, below-ground biological carbon density, dead organic matter carbon density, and soil organic matter carbon density of the i-th land use type, respectively. The specific parameters used for calculation are derived from related references [38,39].
The carbon emission indicator systematically traces human activity footprints in production and living spaces through an energy metabolism lens, elucidating the coupling mechanisms between territorial development intensity and carbon emission process [32]. Similarly, carbon emissions per unit area are derived by dividing total emissions by spatial area, quantifying the impacts of land use patterns and human activities on carbon output. The carbon emission data for agricultural and urban spaces are sourced from the China City Greenhouse Gas Dataset. The carbon sink for ecological space is measured using the direct carbon emission coefficient method, and the calculation formula is as follows:
E i = i = 1 n S i δ i
where E i represents the carbon sink amount of the i-th land use type. S i indicates the area of the i-th land use type. δ i is the carbon sink coefficient for the i-th land use type in the ecological space, as referenced in Zhang et al. (2022) [40].
The output benefit metric evaluates the economic–ecological synergy under low-carbon governance. Output benefit per unit area is determined by dividing the economic output by the spatial area, facilitating cross-regional comparisons of utilization efficiency. The economic output of urban space is measured using the output values of the secondary and tertiary industries. In contrast, the economic output of agricultural space is assessed based on the output value of the primary industry. For ecological space, the direct quantification of economic output is challenging. Therefore, this study, drawing on previous research, uses the ecosystem service value (ESV) as a surrogate indicator [33]. The calculation formula is as follows:
E S V i = i = 1 n S i E i k
where E S V i denotes the ecosystem service value of the i-th land use type in the ecological space. S i represents the area of the i-th land use type. E i represents the coefficient of the ecosystem service equivalent factor for the i-th land use type, as referenced in Xie et al. (2017) [41]. k represents the economic value quantity of the unit ecosystem service value equivalent factor, which is CNY 1675.45 per hectare in this study.

2.4. Calculation of the Index for Low-Carbon Utilization of Territorial Space

2.4.1. Linear Weighted Sum Method

Table 1 shows the evaluation indicators and corresponding weights for the LCU of territorial space. Based on these indicators, the original data are initially processed through maximum standardization to achieve normalization. To ensure more accurate results of indicator weights, objective methods, like the variation coefficient weight method, entropy method, and critic weight method, are employed separately to determine the weight of each indicator [35,42]. The final weight of each indicator is the average of the weights derived from these three methods. Ultimately, the linear weighted sum method is used to individually calculate the LCU indexes of urban, agricultural, and ecological spaces. Moreover, when computing the LCU index of territorial space, the LCU indexes of urban, agricultural, and ecological spaces are considered as three separate indicators and calculated following the steps outlined above. The calculation formula is as follows:
I = i = 1 n C i W i
where I represents the index of LCU in territorial space, C i is the normalized value of the corresponding indicator, and W i is the weight of the corresponding indicator. The higher the index value, the higher the level of LCU in the territorial space.

2.4.2. Kernel Density Estimation

Kernel density estimation is based on the distribution characteristics of the data, using continuous density functions to describe the stage distribution characteristics and temporal evolution patterns of variables [43]. In this study, we employ kernel density estimation to reveal the temporal characteristics and dynamic evolution patterns of the LCU the index of territorial space in the YREB. The formula of the model is as follows:
f ( x ) = 1 n h i = 1 n k ( x i x ¯ h )
k ( x ) = 1 2 π e x p ( x 2 2 )
In Equations (4) and (5), n denotes the number of cities; K(·) represents the kernel density function; h indicates the bandwidth; x i denotes the LCU index of territorial space for each city; and x ¯ represents the average LCU index of territorial space for the cities in the YREB.

2.5. Exploration Steps of Driving Factors for Low-Carbon Utilization of Territorial Space

2.5.1. Selection of Driving Factors

As shown in Table 2, this study selects 32 driving factors across three dimensions—natural factors, socio-economic factors, and landscape pattern indices—drawing on existing research to analyze their impacts on LCU of territorial space [15,33,44]. Natural factors, such as temperature, precipitation, topographic ruggedness, and habitat quality, form the foundational conditions for territorial space utilization, critically influencing urban development, agricultural productivity, and ecosystem stability. Temperature conditions regulate soil organic carbon decomposition rates and vegetation dynamics, while influencing energy consumption patterns and carbon exchange [45]. Precipitation conditions shape water resource management, agricultural productivity, and ecosystem stability, directly affecting carbon sequestration capacities [46]. Terrain ruggedness constrains land use configurations and ecological distributions, thereby mediating carbon emissions and absorption through spatial utilization efficiency. Habitat quality reflects ecosystem conditions affecting carbon storage, vegetation biomass accumulation, and emission mitigation capacity, as robust habitats enhance carbon sequestration and reduce greenhouse gas release [47].
Socio-economic factors include industrial structure, carbon emission intensity, population density, urbanization level, road network density, science and technology expenditure ratio, public budget expenditure ratio, and environmental regulation intensity. Notably, carbon emission intensity is disaggregated into agricultural and non-agricultural subsectors, while population density is differentiated between urban and rural areas. Industrial restructuring enhances resource efficiency by reducing carbon emissions and land occupation, while fostering sustainable growth through low-carbon sector transitions. Carbon intensity directly reflects economic efficiency, where higher levels correlate with elevated emissions and diminished output. Population density and urbanization present dual effects: concentrated populations intensify land pressure and ecosystem degradation but facilitate energy-saving measures and renewable technology adoption [48,49]. Road network expansion stimulates economic vitality yet risks increased transport-related emissions. Investment in science and technology and public budget expenditure can drive energy efficiency, renewable energy deployment, and infrastructure. Environmental regulations further constrain high-carbon activities, reinforcing the transition toward low-carbon territorial development.
Landscape pattern characteristics significantly influence the LCU of territorial space by mediating carbon stock dynamics and emission processes [50]. Furthermore, landscape configurations affect energy use efficiency and emission intensity. For instance, inefficient spatial layouts of urban or rural settlements may escalate energy consumption and carbon output [51]. Landscape patterns also regulate ecosystem services and carbon cycling, necessitating metrics that capture fragmentation and connectivity [52]. This study employs patch density, largest patch index, and aggregation index for six land-use categories: cropland, forest, grassland, water bodies, urban built-up areas, and rural settlements. This is because patch density reflects the overall structure and spatial configuration of the landscape; the largest patch index aids in evaluating landscape continuity and ecological significance; and the aggregation index contributes to understanding landscape connectivity and interaction potential. These three representative types of landscape pattern indices can more intuitively and scientifically reveal how landscape pattern characteristics influence the LCU of territorial space.
In summary, the 32 indicators selected in this study, which encompass natural, socio-economic, and landscape pattern dimensions, have potential impacts on carbon storage, carbon emissions, and output benefit within the LCU of the territorial space assessment system, thereby facilitating a more systematic identification of the driving factors. However, the methodological challenge lies in scientifically determining whether and how these 32 independent variables influence the target system. Existing research primarily employs two methodologies. The first involves identifying independent variables with a substantial explanatory power for the dependent variable, followed by analyzing these selected variables using relevant econometric models to ascertain the magnitude and direction of regression coefficients [53,54]. The second approach initially examines Pearson correlation coefficients between all independent variables and the dependent variable to ascertain influence directionality, followed by employing methods, like optimal parameter-based geographical detector or random forest algorithms to assess explanatory power [55,56]. Each methodology presents some advantages and limitations. This study implements the first approach, initially employing an optimal parameter-based geographical detector to identify dominant factors from the 32 independent variables, followed by Tobit regression analysis. The Tobit model proves particularly suitable given the bounded value range (0–1) of the low-carbon territorial space utilization index. This methodological combination achieves the effective dimensionality reduction in explanatory variables, while mitigating potential multicollinearity issues. Incorporating screened variables with strong explanatory power enhances result accuracy and persuasiveness. From a policy-making perspective, elucidating both the directional effects and elasticity coefficients of driving factors holds greater practical value than mere explanatory power quantification. The alternative methodology relying solely on Pearson correlation coefficients for directional determination exhibits inherent limitations, and variable importance ranking may suffer systematic bias from collinear variables, potentially compromising result reliability.
Table 2. Preliminary selection of driving factors for LCU of territorial space.
TypeDriving FactorsDescription and Source
Natural FactorsAnnual Mean TemperatureAverage annual temperature
Annual PrecipitationTotal annual precipitation
Terrain RuggednessCalculated following the method of Yang et al. (2022) [57]
Habitat QualityDerived from the habitat quality module of the InVEST model, with parameters from Zheng et al. (2022) [58]
Socio-Economic FactorsIndex of Industrial Structure AdvancementCalculated following the method of Qiao et al. (2025) [59]
Carbon Emission IntensityObtained by dividing carbon emissions by economic output
Population DensityPopulation count divided by land area
Urbanization LevelProportion of urban population
Road Network DensityTotal road length divided by land area
Investment in Science and TechnologyProportion of government budget expenditure allocated to science and technology
Public Budget ExpenditureTotal government public budget expenditure
Environmental Regulation LevelCalculated following the method of Ding et al. (2022) [60]
Landscape Pattern CharacteristicsPatch DensityNumber of patches per unit area for each patch type (Zhang et al., 2020) [61]
Largest Patch IndexArea of the largest patch divided by total landscape area (Zhang et al., 2020) [61]
Aggregation IndexMeasurement of patch proximity and connectivity (Zhang et al., 2020) [61]

2.5.2. Optimal Parameter-Based Geographical Detector (OPGD) Model

Geographical detector is effective in detecting spatial heterogeneity and unveiling their underlying driving forces. The OPGD improves the precision of the analysis results by selecting the best combination of parameters (grading method and number of breaks) for data discretization [62]. In this study, the OPGD is used to identify the dominant driving factors influencing the LCU of territorial space in the YREB. The formula of the model is as follows:
q = 1 h = 1 L N h σ h 2 N σ 2
where q represents the explanatory power of the driving factors for the spatial differentiation of LCU of territorial space, with a value range of [0, 1]. The larger the q value, the stronger the driving effect of the factor. N represents the total number of samples; σ 2 refers to the variance of the dependent variable; h denotes the number of division levels of the driving factors; N h and σ h 2 correspond, respectively, to the sample size and the variance of sample values within level h .

2.5.3. Tobit Model

The OPGD can reveal the influence magnitude of each factor on the LCU of territorial space in the YREB, but it is unable to explore the specific direction of impact of the dominant driving factors. The value range of the index for the LCU of territorial space is [0, 1], which is a constrained dependent variable. The Tobit model handles this truncated data effectively [63], enabling the precise analysis and interpretation of how each dominant driving factor specifically impacts the LCU of territorial space in the YREB. The formula of the model is as follows:
y i t = y i t * = β 0 + i = 1 n β t x i t + e i t ,        y i t * > 0              0              ,        y i t *   0     
where y i t represents the index of LCU of territorial space for city i in year t, x i t is the independent variable, β 0 is the constant term, β t is the parameter to be estimated, and e i t is the random error disturbance term.

3. Results

3.1. Spatiotemporal Evolution Characteristics of Low-Carbon Utilization of Territorial Space in the YREB

3.1.1. Low-Carbon Utilization Index of Urban Space

Figure 3a shows the kernel density curves of the LCU index of urban space. The peaks of these curves exhibit a consistent declining trend, accompanied by left tail contraction and a pronounced upward shift in the right tail. These patterns indicate a widening disparity in the LCU index of urban space across the region, with a decreasing proportion of cities characterized by a lower LCU index and a concurrent increase in the proportion of cities demonstrating a higher LCU index.
Figure 4 illustrates the value of the LCU index of urban spaces. The index for the entire YREB declined from 0.572 in 2005 to 0.554 in 2010 before recovering to 0.582 by 2020. Regional variations emerged. Upstream areas showed a sharp decrease from 0.593 to 0.539 during 2005–2010 followed by stabilization near 0.540, midstream regions experienced a gradual reduction from 0.541 to 0.528 through 2015 with minimal rebound to 0.529 by 2020, while downstream areas demonstrated sustained growth from 0.576 to 0.679 across the study period. It is worth noting that the LCU index of urban spaces in the downstream areas of the YREB is significantly higher than that in the upstream and midstream regions. Cities in the downstream areas possess a strong industrial foundation and technological innovation capabilities, resulting in a higher level of economic development [64]. While their carbon emissions are also significant, the advanced economic status provides downstream cities with greater resources and funding to drive technological upgrades and environmental protection measures for the LCU of urban space [65].
Figure 5 presents the spatial pattern of the LCU index of urban space across various cities in the YREB. Based on this index, the cities are classified into four categories: high-value range (>0.75), medium-high-value range (0.50–0.75), medium-low-value range (0.35–0.50), and low-value range (0.00–0.35). The LCU index of urban space for the YREB exhibits a trend of gradually evolving towards a spatially clustered pattern centered around a single core. The number of cities falling in the high-value range has seen an increase, and these are primarily concentrated in the downstream regions, radiating outward from core cities like Hangzhou and Shanghai. Although Chengdu in the upstream region also falls into the high-value category, it has not been able to exert a significant radiation effect on surrounding cities. Meanwhile, there has been a notable decrease in the number of cities in the medium-high-value range, while the number of cities in the medium-low-value range has increased significantly. This shift is more pronounced in the upstream and midstream regions. Although the overall level of the LCU of urban space in the YREB has improved, the disparities among various cities are also widening.

3.1.2. Low-Carbon Utilization Index of Agricultural Space

Figure 3b displays the kernel density curves of the LCU index of agricultural space. The peaks of these curves generally show a consistent downward trend, while the left tail exhibits a decrease, and the right tail clearly shifts to the right. These characteristics indicate that the disparity in the LCU index of agricultural spaces across the region is widening, with a slight reduction in the proportion of cities with a lower LCU index and a significant increase in the proportion of cities with a higher LCU index.
Figure 6 illustrates the value of the LCU index of agricultural space. Overall, the index exhibited a consistent upward trend, rising from 0.465 in 2005 to 0.491 in 2020. All subregions demonstrated continuous growth, with upstream areas exhibiting the most rapid increase, followed by midstream and downstream areas. Spatial disparities persisted, as upstream maintained the highest index values, while downstream recorded the lowest. The agricultural space in the upstream region is mainly constituted of arable land, with a relatively low proportion of rural construction land. In contrast, the downstream region has a higher proportion of rural construction land and a lower proportion of arable land compared to the upstream region, resulting in a significantly lower level of LCU in the agricultural space of the downstream region.
Figure 7 depicts the spatial patterns of the LCU index of agricultural space across various cities in the YREB. The overall spatial pattern of the LCU index of agricultural space remains stable, displaying higher values in the upstream regions and lower values in the downstream regions. However, the LCU index of agricultural space in the YREB is still generally low, with no cities reaching the high-value range. Most cities in the upstream and midstream regions have transitioned from the medium-low-value range to the medium-high-value range, resulting in a significant improvement in the LCU of agricultural space in these regions. Conversely, most cities in the downstream region fall into the medium-low- and low-value categories, exhibiting a strong tendency towards concentrated distribution. In summary, although there has been some improvement in the LCU of agricultural space in the YREB, the overall level remains relatively low, and there are distinct regional differences between the upstream and downstream areas.

3.1.3. Low-Carbon Utilization Index of Ecological Space

Figure 3c presents the kernel density curves of the LCU index of ecological space. The peaks of the kernel density curves exhibit a slight upward trend, accompanied by a moderate decline in the left tail and the largely unchanged height of the right tail. These patterns indicate a narrowing disparity in the LCU index of ecological space across the region, with a decreasing proportion of cities characterized by a lower LCU index and relative stability in the proportion of cities demonstrating a higher LCU index.
Figure 8 illustrates the value of the LCU index of ecological space. Overall, the index exhibited minimal variation, increasing slightly from 0.609 in 2005 to 0.610 in 2020. Regionally, the middle reaches have the highest index, followed by the upper reaches and then the lower reaches. The proportion of forested land in the ecological spaces of the middle and upper reaches is significantly higher than in the lower reaches [66]. Forests, as key reservoirs and sinks of terrestrial carbon, effectively absorb and sequester large amounts of carbon. Consequently, the carbon storage density and carbon sink density in the ecological spaces of the middle and upper reaches are substantially higher than those in the lower reaches. In contrast, the lower reaches have a larger area of water bodies. Due to the unique and complex nature of aquatic ecosystems, they provide relatively high ecosystem service values [41]. Therefore, the ecological space in the lower reaches surpasses that of the upper and middle reaches in terms of the intensity of ESV.
Figure 9 presents the spatial pattern of the LCU index of ecological spaces across various cities in the YREB. Overall, the spatial distribution of the index during this period remained relatively stable. Cities classified within the high-value category are dispersed, primarily concentrated in certain cities of the provinces of Zhejiang, Jiangxi, Hunan, and Hubei, located in the mid-downstream regions. The distribution of cities within the medium-high-value range is more continuous, encompassing most cities within the YREB. Cities classified within the medium-low-value range exhibit a clustered distribution, mainly concentrated at the border region of Jiangsu–Anhui and the junction of Yunnan–Guizhou. Cities categorized as low-value are also dispersed, including Ganzi and Aba in the upstream region, as well as Yancheng in the downstream region.

3.1.4. Low-Carbon Utilization Index of Territorial Space

Figure 3d presents the kernel density curves of the LCU index of territorial space. The kernel density curves demonstrate fluctuating yet predominantly decreasing peak magnitudes, accompanied by a moderate decline in the left tail and a pronounced elevation in the right tail. These patterns indicate a widening disparity in the LCU index of territorial space across the region, with a decreasing proportion of cities characterized by a lower LCU index and a significant rise in the proportion of cities demonstrating a higher LCU index.
Figure 10 illustrates the LCU index values for urban, agricultural, ecological, and territorial spaces. As depicted in Figure 10d, the LCU index of territorial space decreased from 0.548 in 2005 to 0.541 in 2010, followed by a gradual increase to reach 0.569 in 2020. Regionally, the index for territorial space in the upstream area dropped from 0.559 in 2005 to 0.532 in 2010 and then modestly recovered to 0.548 by 2020. In the midstream area, the index increased slightly from 0.597 in 2005 to 0.606 in 2020. In the downstream area, the index rose from 0.487 to 0.557 during the same period. Although the LCU index of urban spaces in the midstream region is relatively low, the indices of agricultural and ecological spaces are higher, leading to a gradual increase in the overall LCU index of territorial space. In contrast, the downstream region has a higher LCU index of urban spaces, but lower indices of agricultural and ecological spaces, resulting in a gradual decrease in the overall LCU index of territorial space. Therefore, promoting the coordinated development of LCU in urban, agricultural, and ecological spaces is essential for steadily enhancing the overall LCU of territorial space.
Figure 11 illustrates the spatial pattern of the LCU index of territorial space across various cities in the YREB. The spatial distribution of this index has gradually evolved into a dual-core agglomeration pattern from 2005 to 2020. Cities classified as high-value types exhibit a dispersal distribution characteristic, including Changsha in the midstream region and Hangzhou in the downstream region. Cities classified as medium-high-value types have the broadest coverage, exhibiting a large-scale continuous distribution, with the majority of cities within the YREB falling under this category. Cities classified as medium-low-value types show a clustered distribution, primarily concentrated at the junction of Jiangsu Province and Anhui Province, as well as the intersection of Yunnan Province and Guizhou Province. Cities classified as low-value types are relatively scattered, encompassing Ganzi and Aba in the upstream regions and Yancheng and Lianyungang in the downstream regions. In conclusion, the overall level of LCU in the territorial spaces of the YREB is relatively high; although, the degree of improvement is not substantial.

3.2. Typological Classification of Low-Carbon Utilization of Territorial Space in the YREB

Categorizing territorial space into distinct low-carbon utilization types clarifies the carbon reduction characteristics, functional roles, and developmental potential of different spatial units. This classification provides a scientific foundation for formulating targeted low-carbon strategies, enabling the synergistic advancement of sustainable territorial development and carbon emission reduction goals.
Table 3 presents the average LCU for urban, agricultural, and ecological spaces in the YREB. Based on these benchmarks, the LCU of territorial space is categorized into eight types, as detailed in Table 4. Figure 12 illustrates the classification results, including the number of cities belonging to each type and their transitions between 2005 and 2020. Cities classified under Type 1 declined from 21 in 2005 to 17 in 2020. This indicates a diminishing number of cities achieving balanced low-carbon performance across all spatial domains, highlighting systemic challenges in coordinated decarbonization. Most cities exhibit uneven performance, with weaknesses in at least one spatial dimension. Notably, Type 4 remained the most prevalent category, fluctuating around 36 cities throughout the study period. This underscores persistent bottlenecks in urban spatial decarbonization across the YREB.
Figure 13 illustrates the geographical distribution patterns of LCU types across the YREB. In 2005, most cities in the upper reaches were classified as Type 2, characterized by high LCU indices in urban and agricultural spaces but low performance in ecological spaces. Over time, these cities transitioned predominantly to Type 6, which reflects a high agricultural LCU index alongside lagging urban and ecological indices. In the middle reaches, cities were primarily categorized as Type 4, demonstrating good low-carbon performance in agricultural and ecological spaces but weaker outcomes in urban space. Downstream cities predominantly fell under Type 5, marked by a high LCU index in urban spaces but lower indices in agricultural and ecological spaces. This implies that different regions in the YREB have unique weaknesses in LCU, necessitating region-specific development plans and strategies for the LCU of territorial space.

3.3. Driving Factors of Low-Carbon Utilization of Territorial Space in the YREB

3.3.1. Selection of Dominant Driving Factors

The 32 initially selected driving factors were input into the OPGD model to calculate the impact of each factor on the LCU of territorial space in the YREB. Dominant driving factors were identified (q-value > 0.1, p-value < 0.05), and other non-significant factors were excluded. The results for the dominant driving factors are presented in Table 5.

3.3.2. Analysis of the Influence of Dominant Driving Factors

The study first conducted a multicollinearity test on the dominant driving factors. The results indicated that the VIF values among these factors were all less than 10, revealing no highly correlated relationships. Table 6 demonstrates the influence of each dominant driving factor on the LCU of territorial space in the YREB. The model has a good fit, and all explanatory variables passed the significance test.
Among the natural factors, annual precipitation and habitat quality have a positive impact on the LCU of territorial space in the YREB at the 5% and 1% significance levels, respectively. In contrast, the degree of topographic relief has a negative impact at the 1% significance level on the LCU of territorial space in this region. This suggests that improvements in precipitation conditions and habitat quality both contribute to the enhancement of the level of LCU of territorial space, while the increase in terrain ruggedness is detrimental to such an enhancement.
Among the socio-economic factors, the industrial structure exerts a positive influence on the LCU of territorial space in the YREB at a 1% significance level. Conversely, the carbon emission intensity of the primary industry, as well as that of the secondary and tertiary industries, has a negative impact at the same significance level. This is consistent with the findings of Muhammad et al. (2022) and Shokoohi et al. (2022), who both emphasize the significance of industrial structure upgrading and energy intensity reduction for low-carbon development [67,68]. This suggests that promoting the transformation and upgrading of the industrial structure and reducing carbon emission intensity can enhance the LCU of territorial space. In addition, the level of urbanization has a significant positive impact at the 10% level on the LCU of territorial space, while the density of the road network plays a significant negative role at the same level. This indicates that the migration of rural populations to urban areas helps to promote the LCU of territorial space; whereas, the disorderly expansion of the road network is detrimental to it. In developed countries, such as those in the European Union, carbon emissions tend to decline with urbanization [69]; whereas, in developing countries like Pakistan, emissions tend to increase [70]. In the case of the YREB, rapid urbanization has spurred economic growth, resulting in both a reduction in carbon sinks and an increase in carbon emissions. However, the overall level of the low-carbon utilization of territorial space has improved. Additionally, some studies suggest that urban road network density does not have a significant impact on urban carbon emissions, it may initially have a negative effect before turning positive, or it leads to a notable increase in emissions as road network density increases [71]. Nonetheless, these findings focus solely on the relationship between road network density and carbon emissions, representing only one aspect of the low-carbon utilization of territorial space. From a governmental perspective, both technological investment and public budget expenditure significantly positively impact the LCU of territorial space at the 1% level. Furthermore, the level of environmental regulation also plays a positive role at the 10% significance level. This suggests that government focus on science and technology investment, environmental regulation, and increasing public budget expenditure fosters the LCU of territorial space.
Among the landscape pattern factors, the maximum patch index of both forest and urban construction land positively influences the LCU of territorial space in the YREB at a 1% level of significance. This indicates that the expansion of large, continuous forest ecological regions and the concentrated contiguous expansion of urban construction land play a significantly beneficial role in enhancing it. Large-scale contiguous forests establish integrated ecosystems, which not only facilitate carbon emission reduction but also enhance carbon sequestration and increase carbon storage [72]. Similarly, large-scale contiguous urban spaces reduce land fragmentation, improve the efficiency of intensive land resource utilization, and thereby, contribute to energy conservation, emission reduction, and low-carbon objectives. The patch density of grasslands and rural construction lands have negative impacts on the LCU of territorial space at significance levels of 1% and 10%, respectively. This suggests that the more fragmented the distribution of grasslands and rural construction lands, the less conducive it is to the LCU of territorial space. An increase in grassland patch density indicates the further division and fragmentation of originally contiguous grassland ecosystems, resulting in decreased stability of these ecosystems, heightened vulnerability to human disturbances, accelerated grassland degradation, and the loss of carbon sequestration capacity. Furthermore, the increased patch density of rural construction land implies greater dispersion of infrastructure and transportation demand, thereby exacerbating energy consumption and carbon emissions, while also constraining the development space for eco-agriculture and sustainable agriculture. The concentration index of cultivated land exerts a positive influence at a 1% significance level, while the concentration index of water areas negatively impacts it at a 5% significance level. This suggests that an increase in the degree of aggregation among patches of cultivated land is beneficial, while an increase in the aggregation degree among water patches is detrimental. An increase in cropland aggregation promotes agricultural intensification and mechanization, thereby improving farming efficiency and agricultural output, while reducing energy consumption and carbon emissions per unit output. However, the clustering and concentration of water bodies may result in uneven regional water resource distribution. This imbalanced allocation may restrict water resource utilization for agriculture, industry, and urban sectors in certain areas, ultimately hindering the low-carbon utilization of territorial spaces.

4. Discussion

4.1. Exploring the Evolutionary Mechanisms of Low-Carbon Utilization of Territorial Space in the YREB

Territorial space, serving as the foundation for socio-economic activities and a carrier of carbon emissions, is crucial for LCU in achieving sustainable development goals. However, current research lacks a comprehensive assessment framework for LCU based on integrated territorial space functional types. Scholars typically focus on the LCU of single space types, particularly urban and agricultural spaces [29,30,31], thereby failing to provide a systematic and comprehensive understanding of the LCU of territorial space. Existing evaluation systems often prioritize indicator comprehensiveness, with some indicators more suitable as influencing factors rather than direct assessment parameters. This approach overlooks the specificity and effectiveness of indicator selection. Given that one of our primary research objectives is to accurately assess the level of the LCU of territorial space, an excess or redundancy of indicators can lead to inaccurate results. Therefore, there remains a need for a concise and targeted assessment framework. Moreover, few studies have employed quantitative methods to explore how territorial space pattern optimization impacts LCU, which could provide valuable decision-making references for future territorial space planning. Considering these limitations, this research divides territorial space into urban, agricultural, and ecological spaces. We constructed a systematic LCU assessment framework from three perspectives: carbon storage, carbon emissions, and output benefits. Additionally, we comprehensively investigated the driving factors of the LCU of territorial space from natural, socio-economic, and landscape pattern characteristics, thereby addressing gaps in current research to some extent.
Our research indicates that the LCU of territorial space is a systematic and dynamic process, characterized by significant disparities among the functional spaces in different cities. These differences reflect the varying strengths and weaknesses in LCU across different functional spaces within the cities. Through the analysis of low-carbon utilization indices for urban, agricultural, and ecological functional spaces, we confirm that, while different cities may exhibit similar overall indices for the LCU of territorial space, substantial variations exist in the LCU performance of their respective functional spaces. This imbalance in LCU among functional spaces highlights the challenges of relying solely on carbon emission control or optimization policies focused on individual functional areas, which are insufficient for achieving the overarching goal of the optimized LCU of territorial space. Consequently, the coordinated advancement of LCU across urban, agricultural, and ecological spaces emerges as a critical mechanism for progressively enhancing overall territorial low-carbon performance.
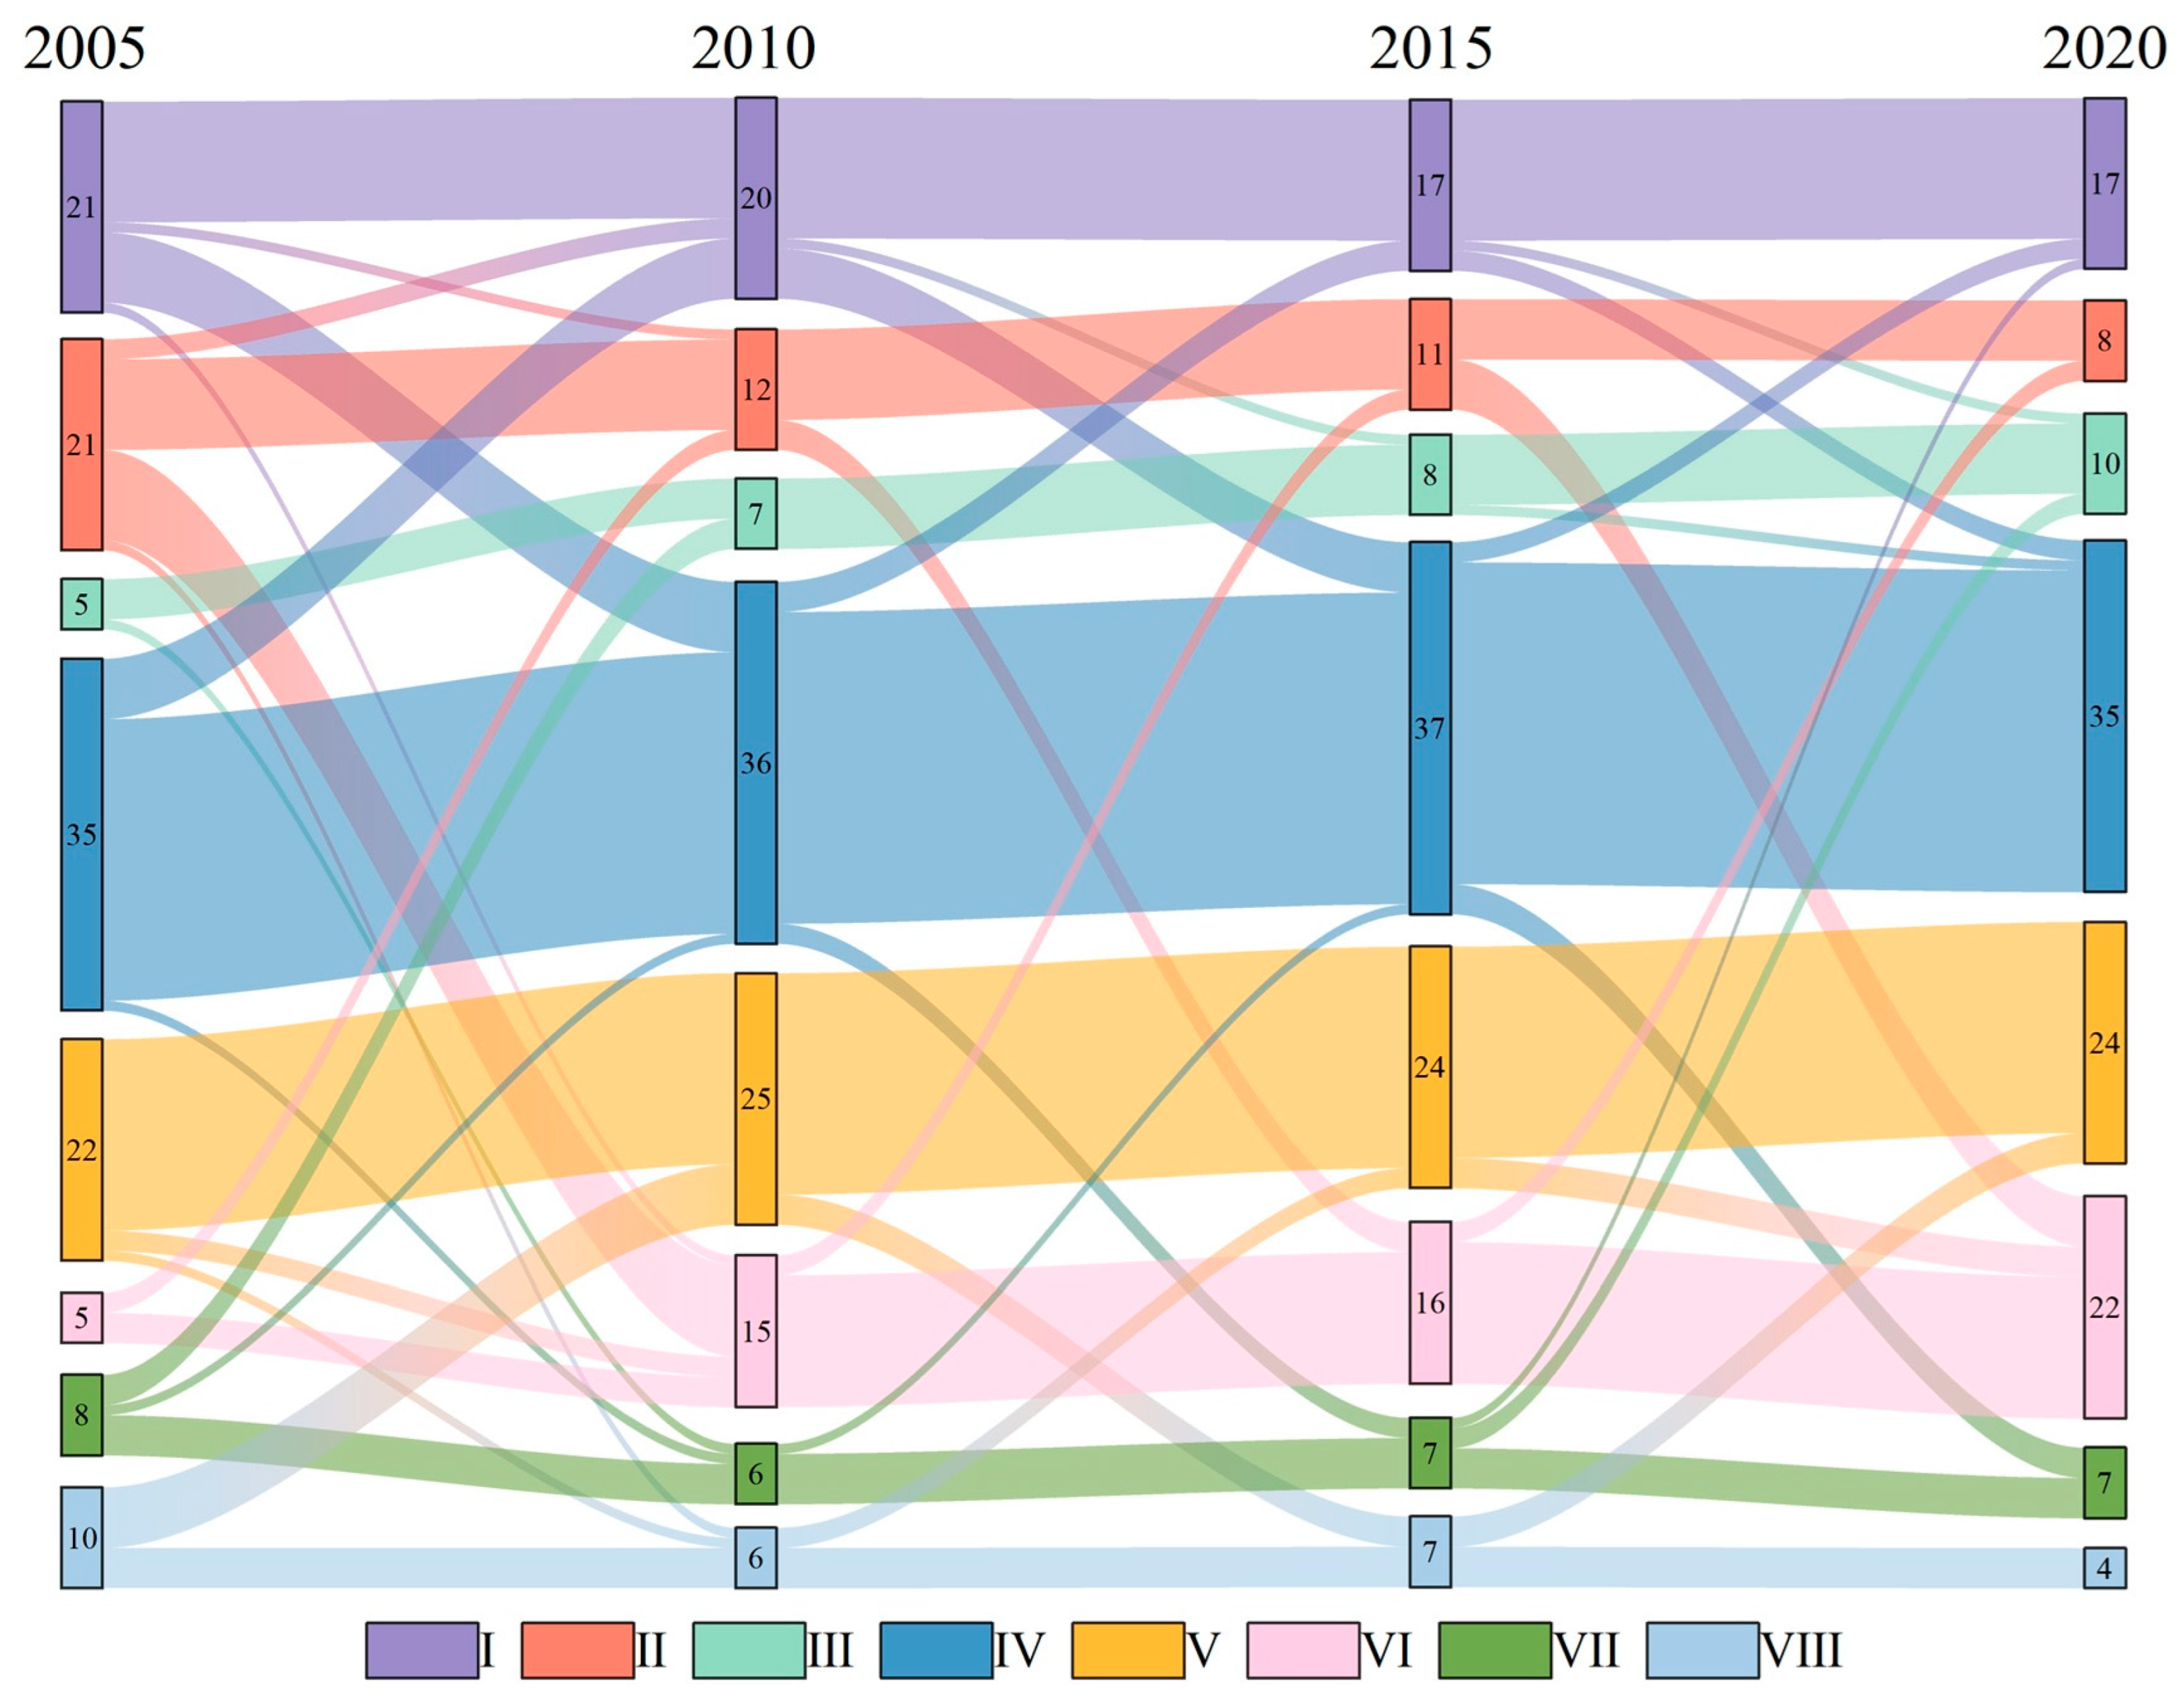
Our research categorizes cities within the YREB into eight types based on the LCU of territorial space. We found that only a few cities have achieved satisfactory low-carbon performance across all functional spaces. Over 80% of the cities exhibit poor LCU in at least one functional space, particularly in urban space, where the number of cities performing below the overall average is the highest. This trend indicates that inadequate LCU in urban space has become a significant barrier to the sustainable LCU of territorial space in the region. The underlying reasons for this situation are multifaceted. First, there are considerable regional development disparities within the YREB, with downstream areas exhibiting significantly higher economic development and technological innovation capabilities compared to the midstream and upstream regions. Second, there are marked differences in the industrial structures of cities within the YREB. Some cities still rely on energy-intensive and high-emission industries, which consume substantial energy and produce significant carbon emissions, negatively impacting LCU in urban spaces. Downstream regions also tend to transfer high-pollution, high-carbon emission industries to the midstream and upstream areas. Third, cities with relatively low economic development often lack sufficient financial and technical support to promote the development of low-carbon technologies and industries, hindering their capacity for low-carbon transformation in urban spaces. Despite the implementation of various policies and measures to foster development in the YREB, the lack of effective collaborative mechanisms among cities has made it difficult to establish a collective approach to regional low-carbon development. Consequently, many cities fall short in their LCU of urban space compared to the regional average. Connolly et al. (2022) revealed that urban households in 90 developing countries exhibit 2–9 times higher per capita carbon footprints than rural counterparts, aligning with the prevalent underperformance in urban space that LCU observed among most YREB cities to some extent [73]. These findings underscore the urgency of improving urban LCU in developing nations. Conversely, economically advanced cities, like Singapore and Copenhagen, exemplify successful urban sustainability integration through nature-centric design, offering actionable models for developing economies [74].
The dynamic evolution of the LCU of territorial space in the YREB is shaped by the interplay of natural, socio-economic, and landscape factors. Natural conditions—including topography, precipitation, and habitat quality—not only determine regional ecological carrying capacity but also indirectly influence land use patterns and carbon emission intensity. For instance, mountainous terrain may restrict urban expansion, while favorable climatic conditions enhance agricultural productivity. Socio-economic factors, such as industrial structure and technological innovation, act as critical drivers of LCU. Rapid industrialization and urbanization in the YREB have intensified energy consumption and carbon emissions. Addressing these challenges requires policies aligned with socio-economic transformation goals, including industrial restructuring and technological advancement. Landscape patterns, serving as spatial manifestations of natural and socio-economic interactions, exert significant influence on the LCU of territorial space in the YREB. The evolution of these patterns—such as urban expansion, rural settlement sprawl, farmland transformation, and ecological conservation—not only reshapes land use dynamics but also directly impacts carbon cycle processes. Consequently, low-carbon territorial spatial policies must prioritize the monitoring and optimization of landscape configurations. Rational spatial planning, which coordinates the development and allocation of functional zones (e.g., urban, agricultural, and ecological spaces), can enhance land use efficiency and carbon sequestration capacity. The strategic optimization of territorial spatial patterns is not merely a technical adjustment but a systemic pathway to achieving low-carbon land use and advancing sustainable development goals. Integrating landscape-driven insights into policy frameworks can foster synergies between human activities and ecological resilience, ensuring a balanced trajectory toward carbon neutrality.
In the YREB, Hangzhou stands out for its exemplary LCU of territorial space. Through a multifaceted approach that includes policy guidance, technological innovation, industrial transformation, and ecological development, the city has successfully achieved LCU of its territorial space, thereby providing a valuable case study for other cities and regions. In urban planning, Hangzhou has optimized its transportation system, advanced urban renewal projects, and promoted green building practices, which collectively have reduced traffic congestion and energy consumption, while enhancing the efficiency of urban energy utilization. In the industrial sector, the city has facilitated the green transformation of traditional industries, fostered the development of green low-carbon industries, and strengthened energy management, leading to significant reductions in carbon emissions in this field. Notably, Hangzhou has introduced mechanisms, such as “carbon accounts” and “carbon efficiency codes”, for enterprises to encourage energy savings and carbon reduction among industrial businesses. In agriculture, the city has promoted low-carbon farming models, developed ecological and circular agriculture, and leveraged digital technology to enhance production efficiency and resource utilization. In terms of ecological protection, Hangzhou has implemented measures to strengthen ecosystem preservation and restoration, including the improved protection of forest resources. Furthermore, through the development of green industries, such as ecological tourism, the city has achieved a synergistic development between ecology and economy.

4.2. Policy Recommendations

Building upon these findings, this study synthesizes the evolutionary characteristics and key driving factors of the LCU of territorial space in the YREB to propose corresponding policy recommendations. By aligning policy frameworks with the identified spatial evolution patterns and dominant drivers, the proposed strategies seek to enhance the coherence between regional development objectives and low-carbon governance mechanisms, thereby fostering a systematic pathway for achieving carbon neutrality in territorial spatial planning and utilization (Figure 14).
(1)
Optimizing planning and management of territorial space. Based on the natural environment, socio-economic conditions, resource distribution, and development potential of various regions within the YREB, it is crucial to identify the primary functions of each region and to clarify their dominant directions and development intensities, with an emphasis on integrating low-carbon concepts. The spatial layout of urban and rural construction land should be optimized by facilitating the redevelopment of idle and underutilized land, thereby reducing the fragmentation of rural homestead distribution. Establishing a comprehensive spatial planning system and implementing stringent land-use control measures will ensure the rational utilization of urban and rural construction land in accordance with the established low-carbon development objectives. Additionally, enhancing carbon sink capacity in urban and rural spaces can be achieved through measures such as increasing green space area, optimizing the layout of green spaces, and improving the quality of green areas, thereby promoting a balanced and stable carbon cycle. Furthermore, actively advancing comprehensive measures for land consolidation can enhance farmland aggregation, maximizing the economies of scale in agricultural production. The strict implementation of ecological land-use control systems, particularly for sensitive ecological areas such as forests and grasslands, is essential for strengthening the carbon sequestration capacity of ecosystems and facilitating a balanced and stable carbon cycle.
(2)
Promoting the green upgrade of industrial structure and strengthening the drive for low-carbon technological innovation. Given the shortcomings in the LCU of territorial space in many cities along the YREB, it is essential to focus on transforming traditional industries characterized by high energy consumption, high emissions, and low added value. This transformation should involve the introduction of low-carbon technologies and equipment to enhance resource utilization efficiency and improve the levels of clean production. The government should encourage enterprises to increase their investments in emerging industries through policy guidance and financial support, with a strong emphasis on the development of strategic emerging industries, such as energy conservation and environmental protection. By fostering technological innovation, it is possible to improve energy utilization efficiency, reduce resource consumption and pollution emissions, and promote the transition of industries toward low-carbon and green development. In terms of transportation infrastructure, investments should prioritize the construction and improvement of public transportation systems, while optimizing the layout of transportation networks to enhance road efficiency and reduce energy consumption and emissions associated with traffic congestion. Furthermore, in the energy infrastructure sector, it is essential to increase investments in renewable and clean energy sources to promote the development and utilization of new energy, such as wind and solar power.
(3)
Enhancing environmental regulation and strengthening social participation. It is imperative to strengthen environmental oversight and law enforcement, particularly focusing on the monitoring and assessment of key pollution sources to ensure their emissions comply with national and local low-carbon standards. The government should improve the environmental information disclosure system to enhance the transparency and reliability of environmental data, thus enabling the public and relevant agencies to stay informed about environmental conditions and take appropriate actions. Utilizing diversified public awareness and education methods can increase public recognition and emphasis on low-carbon development, guiding individuals to adopt green and low-carbon lifestyles and consumption patterns, such as sustainable transportation and energy conservation practices. This can foster a conducive atmosphere within society for promoting the LCU of territorial space. In this process, the government should develop incentive policies, such as low-carbon tax incentives and innovations in green financial products, to encourage public participation in low-carbon consumption and investment.
(4)
Implementing targeted policies to promote regional collaborative development. Each city exhibits unique shortcomings in the LCU of territorial space, necessitating the clarification of regional development positioning and the formulation of differentiated low-carbon strategies. For resource-based cities, the focus should be on the conservation and circular use of resources to minimize waste and enhance utilization efficiency. In industrial cities, it is essential to facilitate the transition from high-carbon to low-carbon industries, while promoting the widespread application of low-carbon technologies. In ecological cities, priority should be given to strengthening ecological protection and restoration efforts to ensure sustainable green and low-carbon urban development. Furthermore, enhancing the regional industrial collaboration of low-carbon industrial chains is crucial for promoting the complementarity and synergy of industries across the upper, middle, and lower reaches of the YREB. The upstream regions can develop clean energy and raw material industries to supply green energy and high-quality materials to the middle and lower reaches, which can leverage their port and transportation advantages to advance high-end manufacturing and service industries, thereby driving industrial upgrading and low-carbon transformation. Centering on the LCU of territorial space, it is vital to explore the design of an ecological compensation mechanism for the YREB, aimed at balancing investments and returns in ecological protection and development across regions. This mechanism would ensure that high-carbon-emitting industries and regions bear corresponding economic responsibilities, thereby mitigating the negative impacts of environmental pollution transfer.

4.3. Limitations

Although this study has explored the spatiotemporal patterns and driving factors of LCU of territorial space in the YREB from multiple perspectives and levels, contributing to the theoretical framework for low-carbon development in territorial space, several limitations remain. The period of this study is constrained by data availability limitations concerning disaggregated sectoral carbon emissions, spanning only from 2005 to 2020—a limitation that remains currently unavoidable. Given that the LCU of territorial spaces constitutes a prolonged evolutionary process, this limited timeframe may inadequately capture long-term trends in regional LCU. Future investigations should prioritize longitudinal data tracking and analysis, potentially integrating household energy consumption surveys for urban and rural residents alongside sector-specific energy consumption surveys. Such efforts could facilitate the development of extended and updated time-series datasets for disaggregated sectoral carbon emissions, thereby enhancing assessments of sustainability and stability in the LCU of territorial space. Furthermore, the current sectoral carbon emission data in China predominantly focuses on the municipal administrative level, necessitating this study’s primary emphasis on city-level analysis. However, spatial heterogeneity in the LCU of territorial space may manifest at finer geographical resolutions. Subsequent investigations could refine analytical scales by selecting pilot cities to establish county- or township-level carbon emission inventories through coordinated household and industrial energy consumption surveys. This methodological advancement would facilitate granular analyses of low-carbon territorial space utilization at sub-municipal administrative units, potentially revealing microscale spatial dynamics and influential factors that remain obscured in broader-scale studies.

5. Conclusions

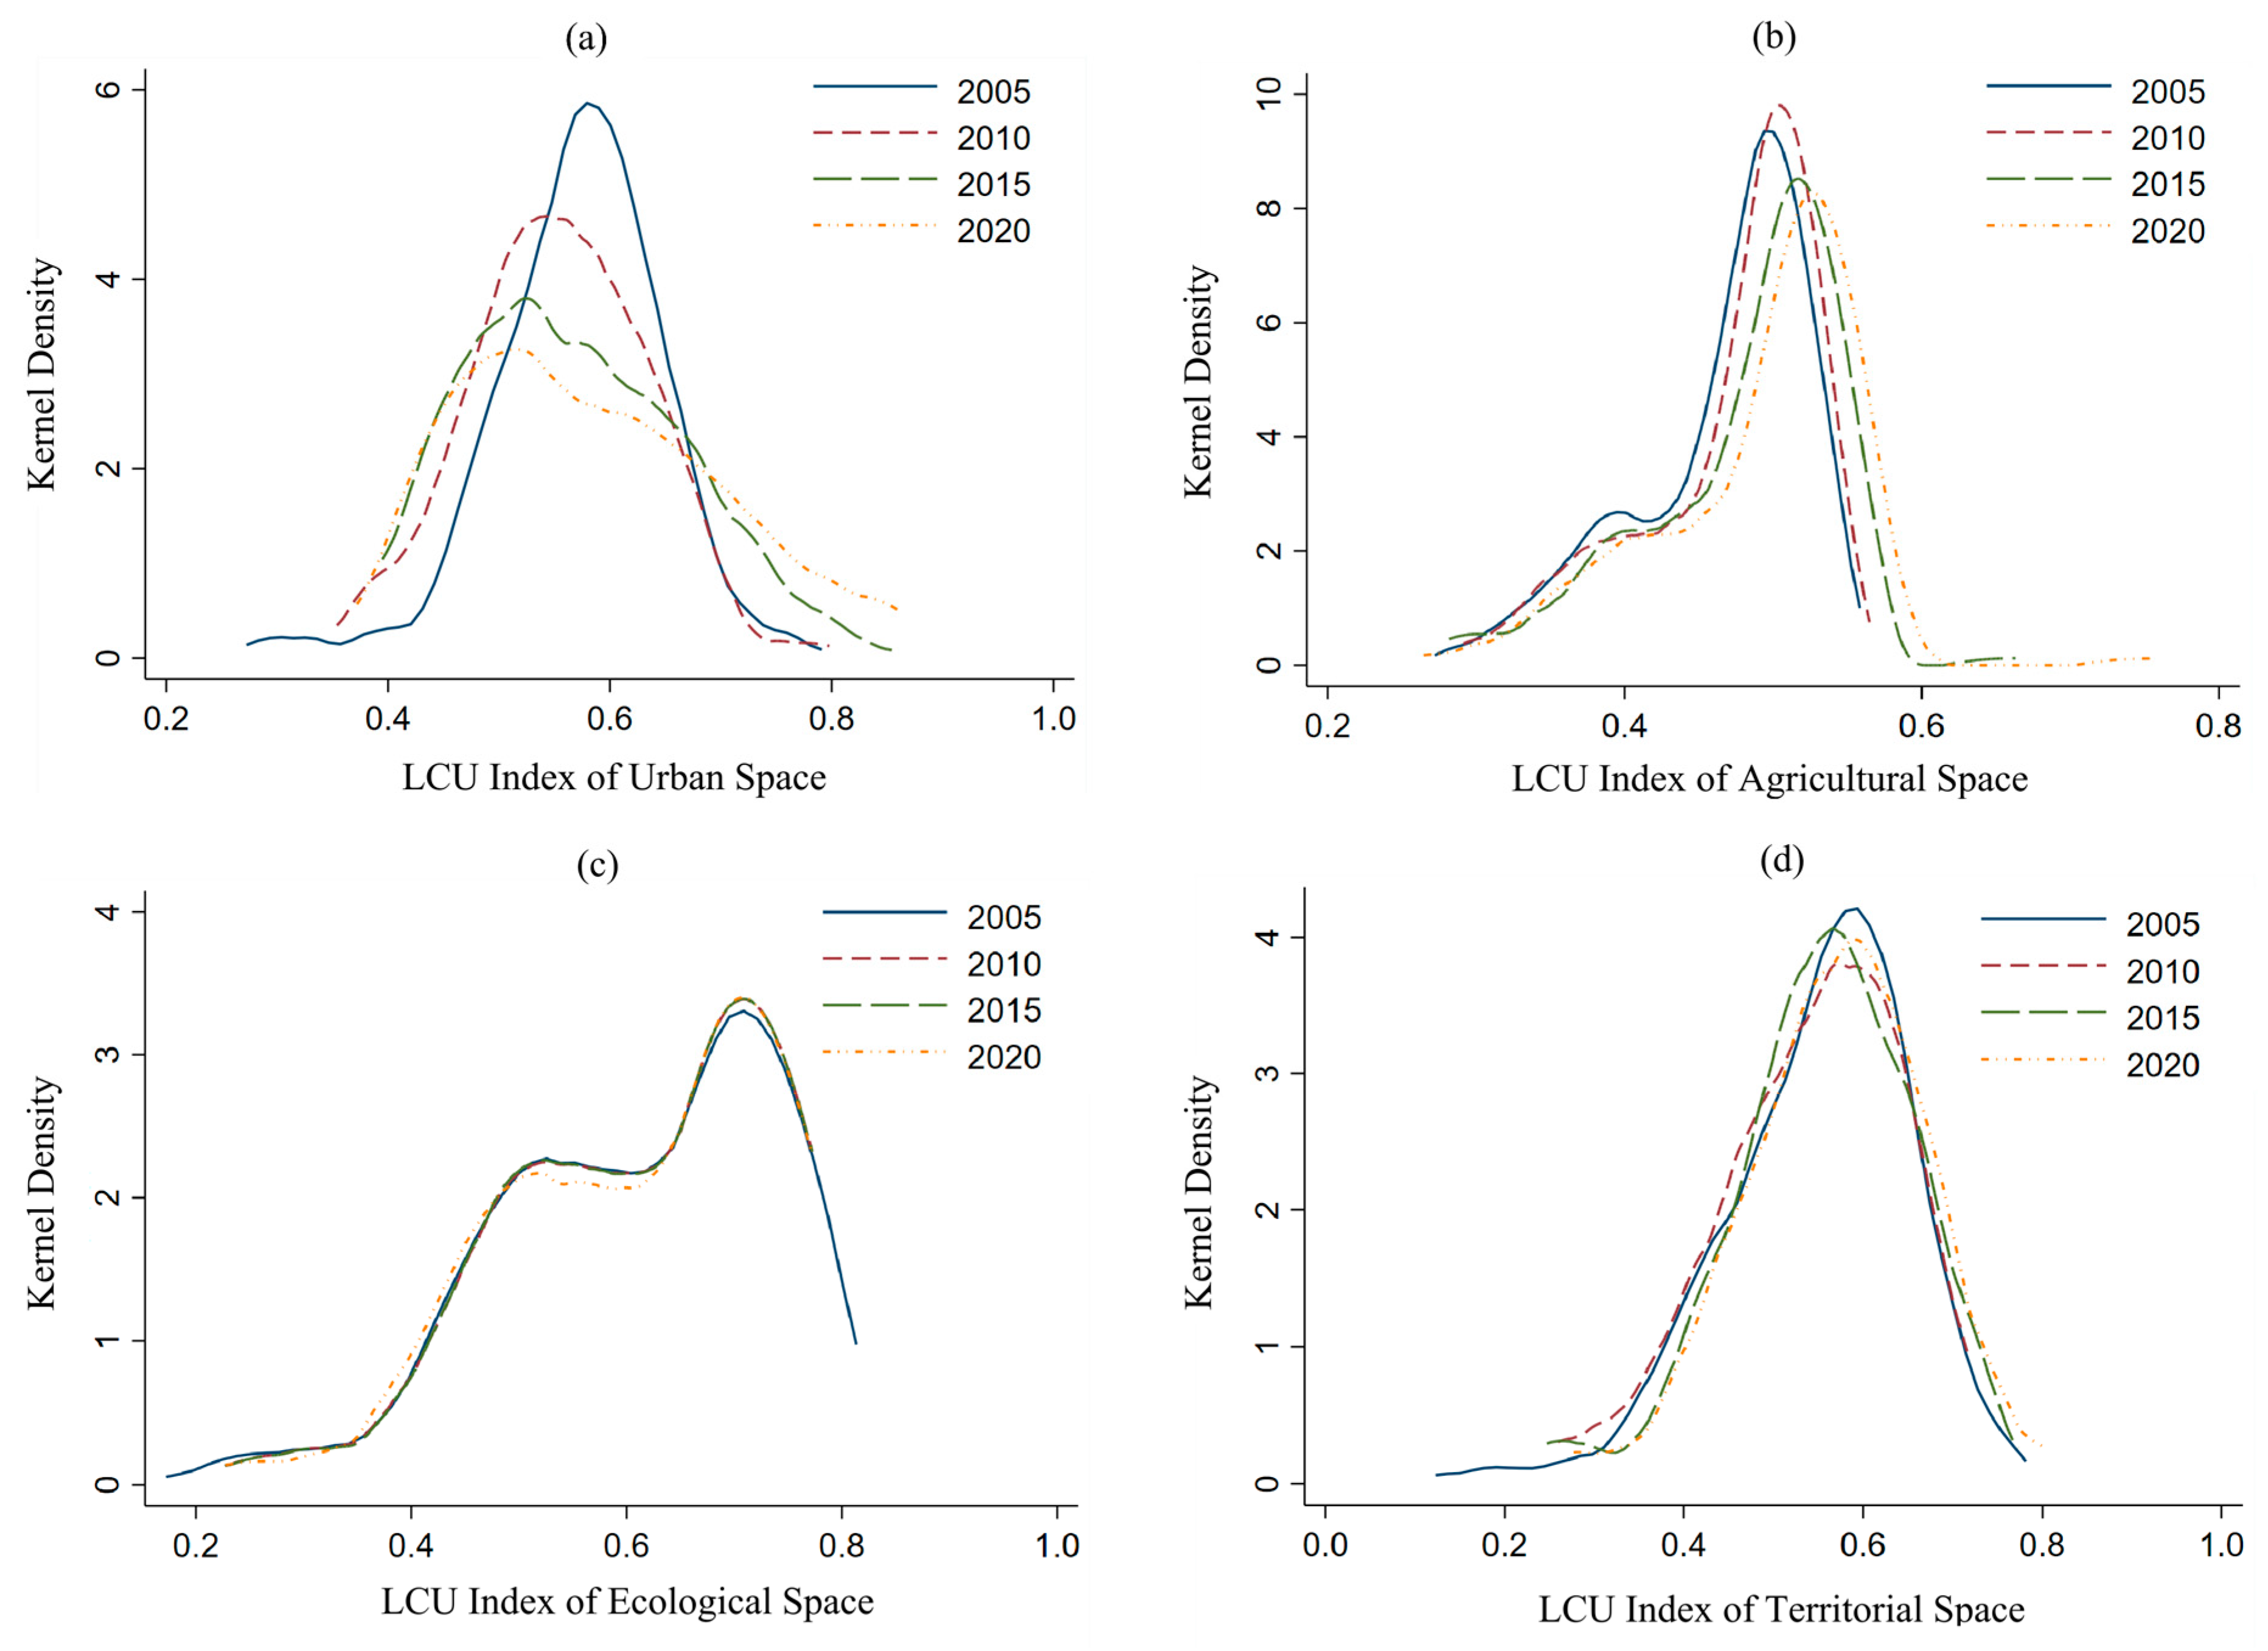
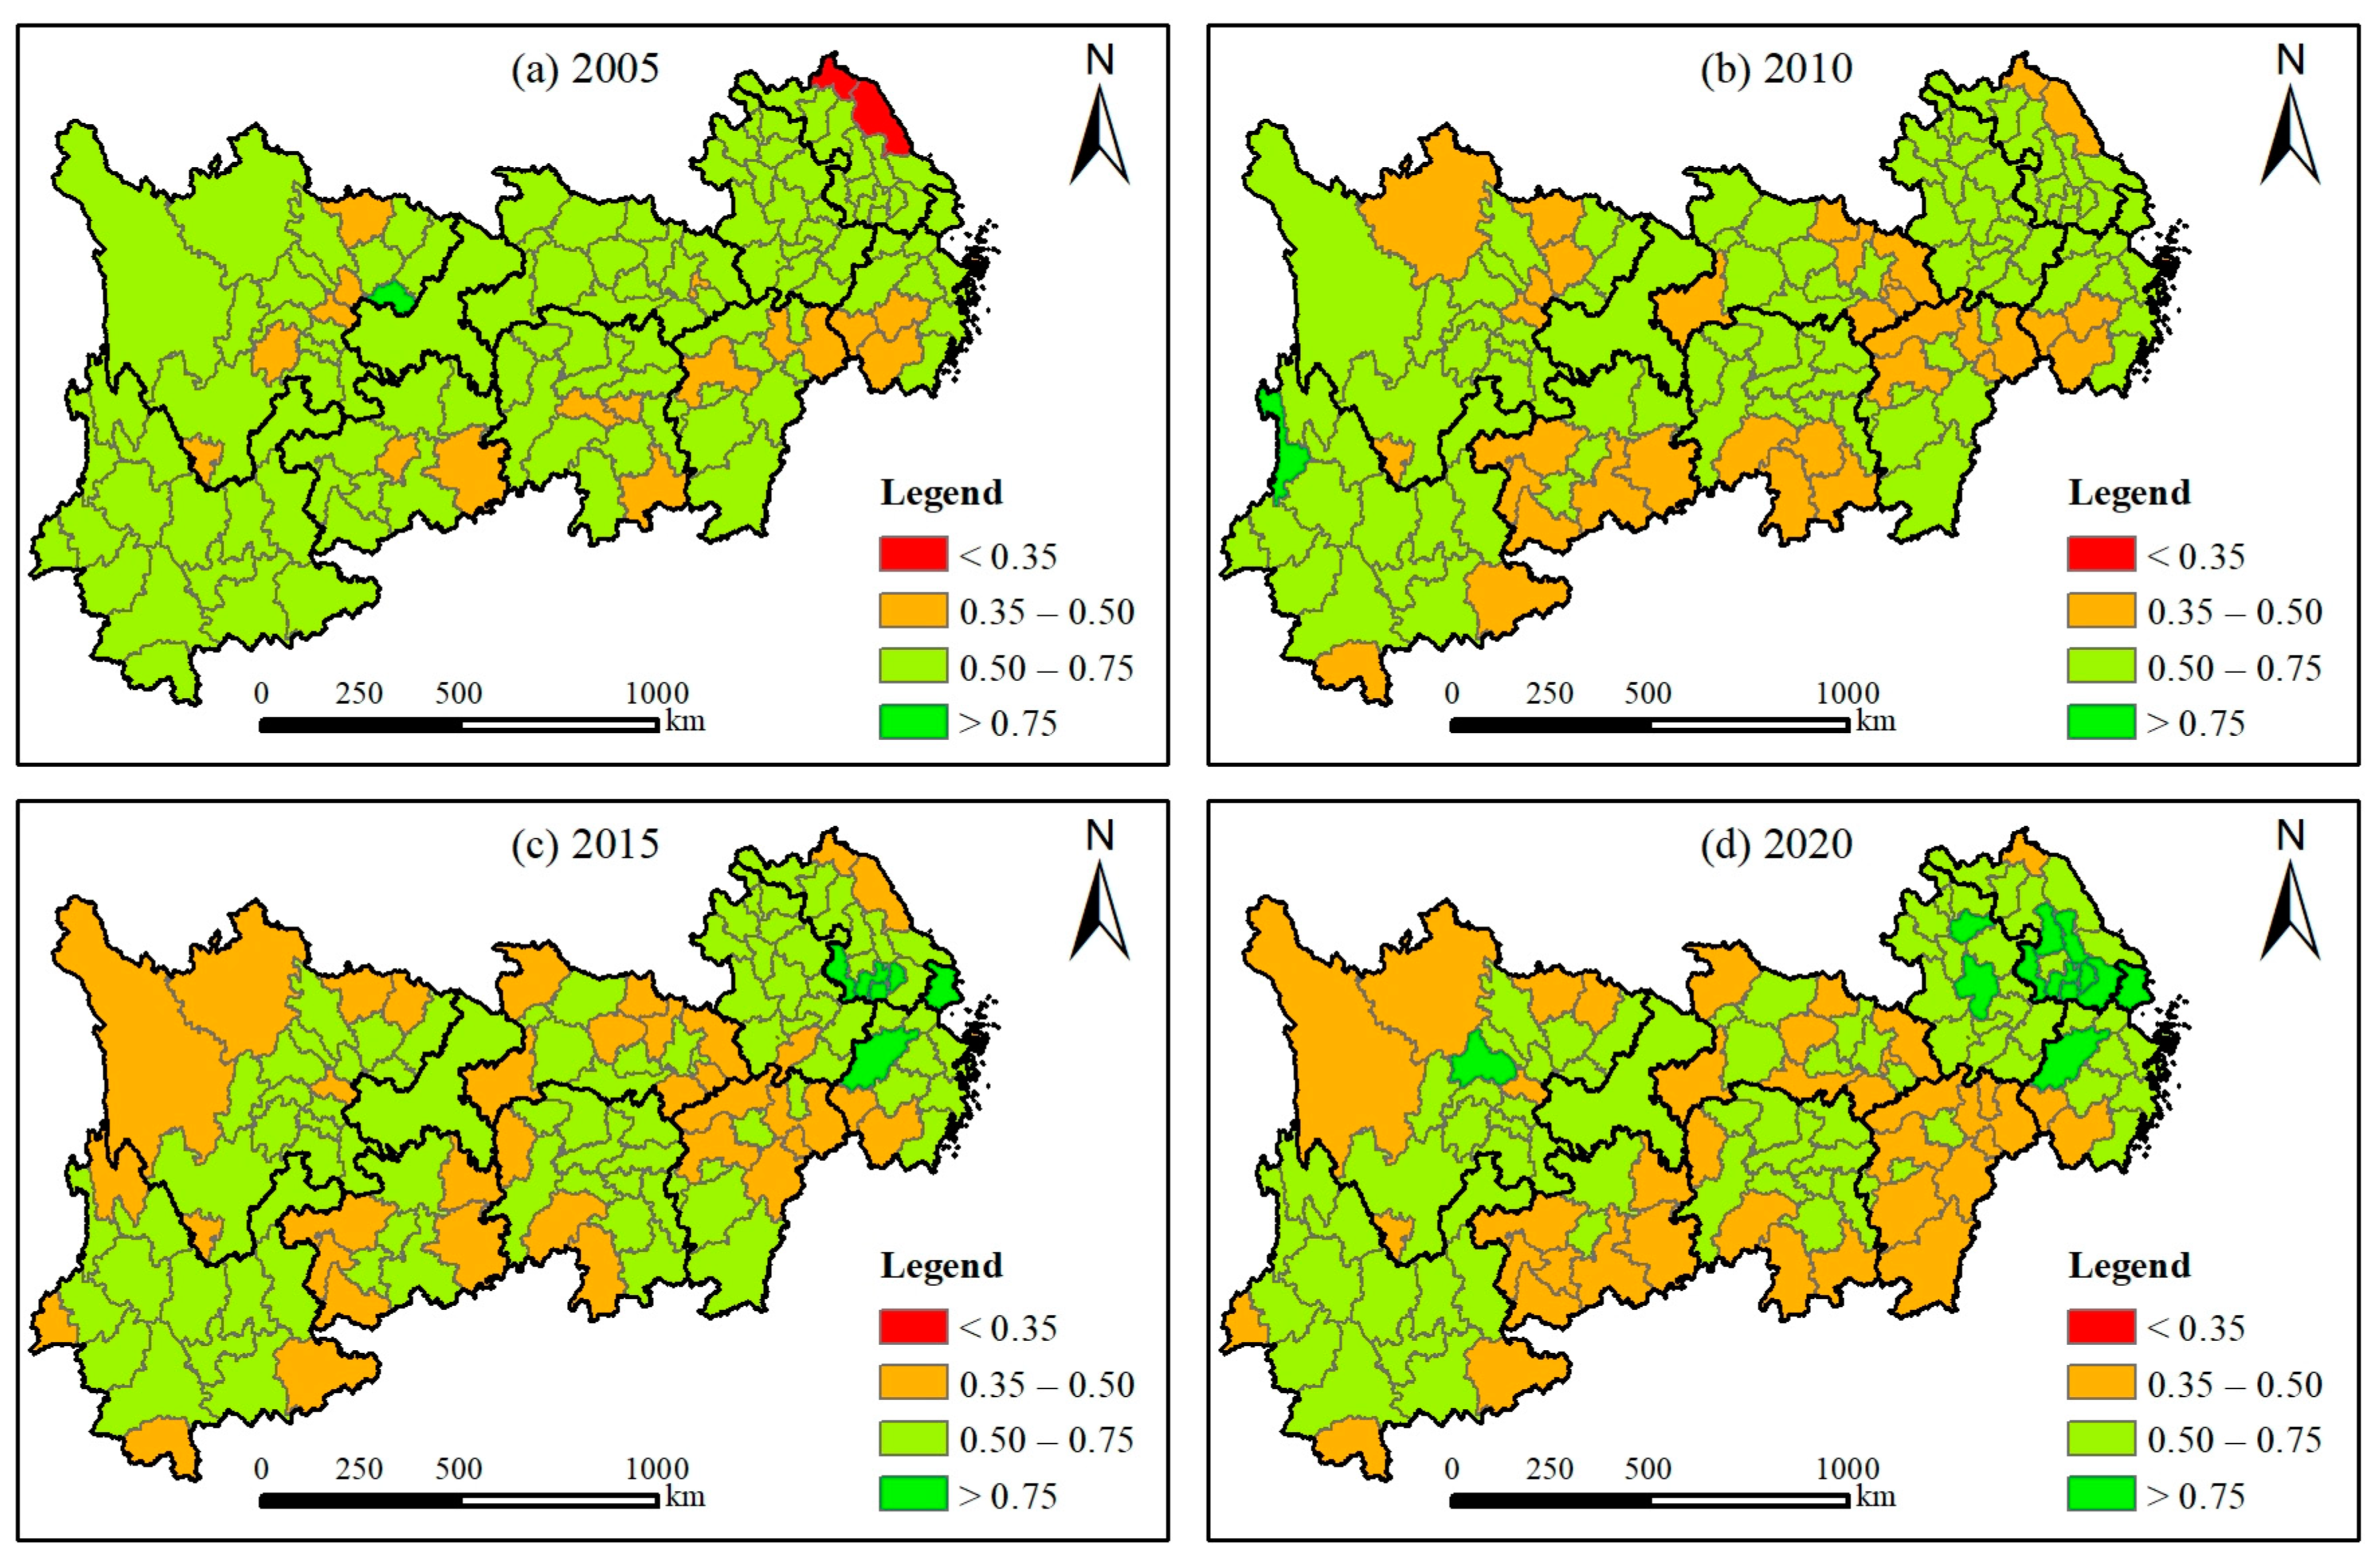
This study establishes a systematic assessment framework for the LCU of territorial space by integrating carbon storage, carbon emissions, and output benefits. By employing kernel density estimation and GIS spatial visualization, it reveals the spatiotemporal evolution patterns of LCU indices across functional spaces and territorial spaces in the YREB cities during 2005–2020, subsequently classifying them into eight distinct types. Additionally, optimal parameter-based geographical detector and Tobit regression models are employed to systematically investigate the key driving factors influencing the LCU of territorial space.
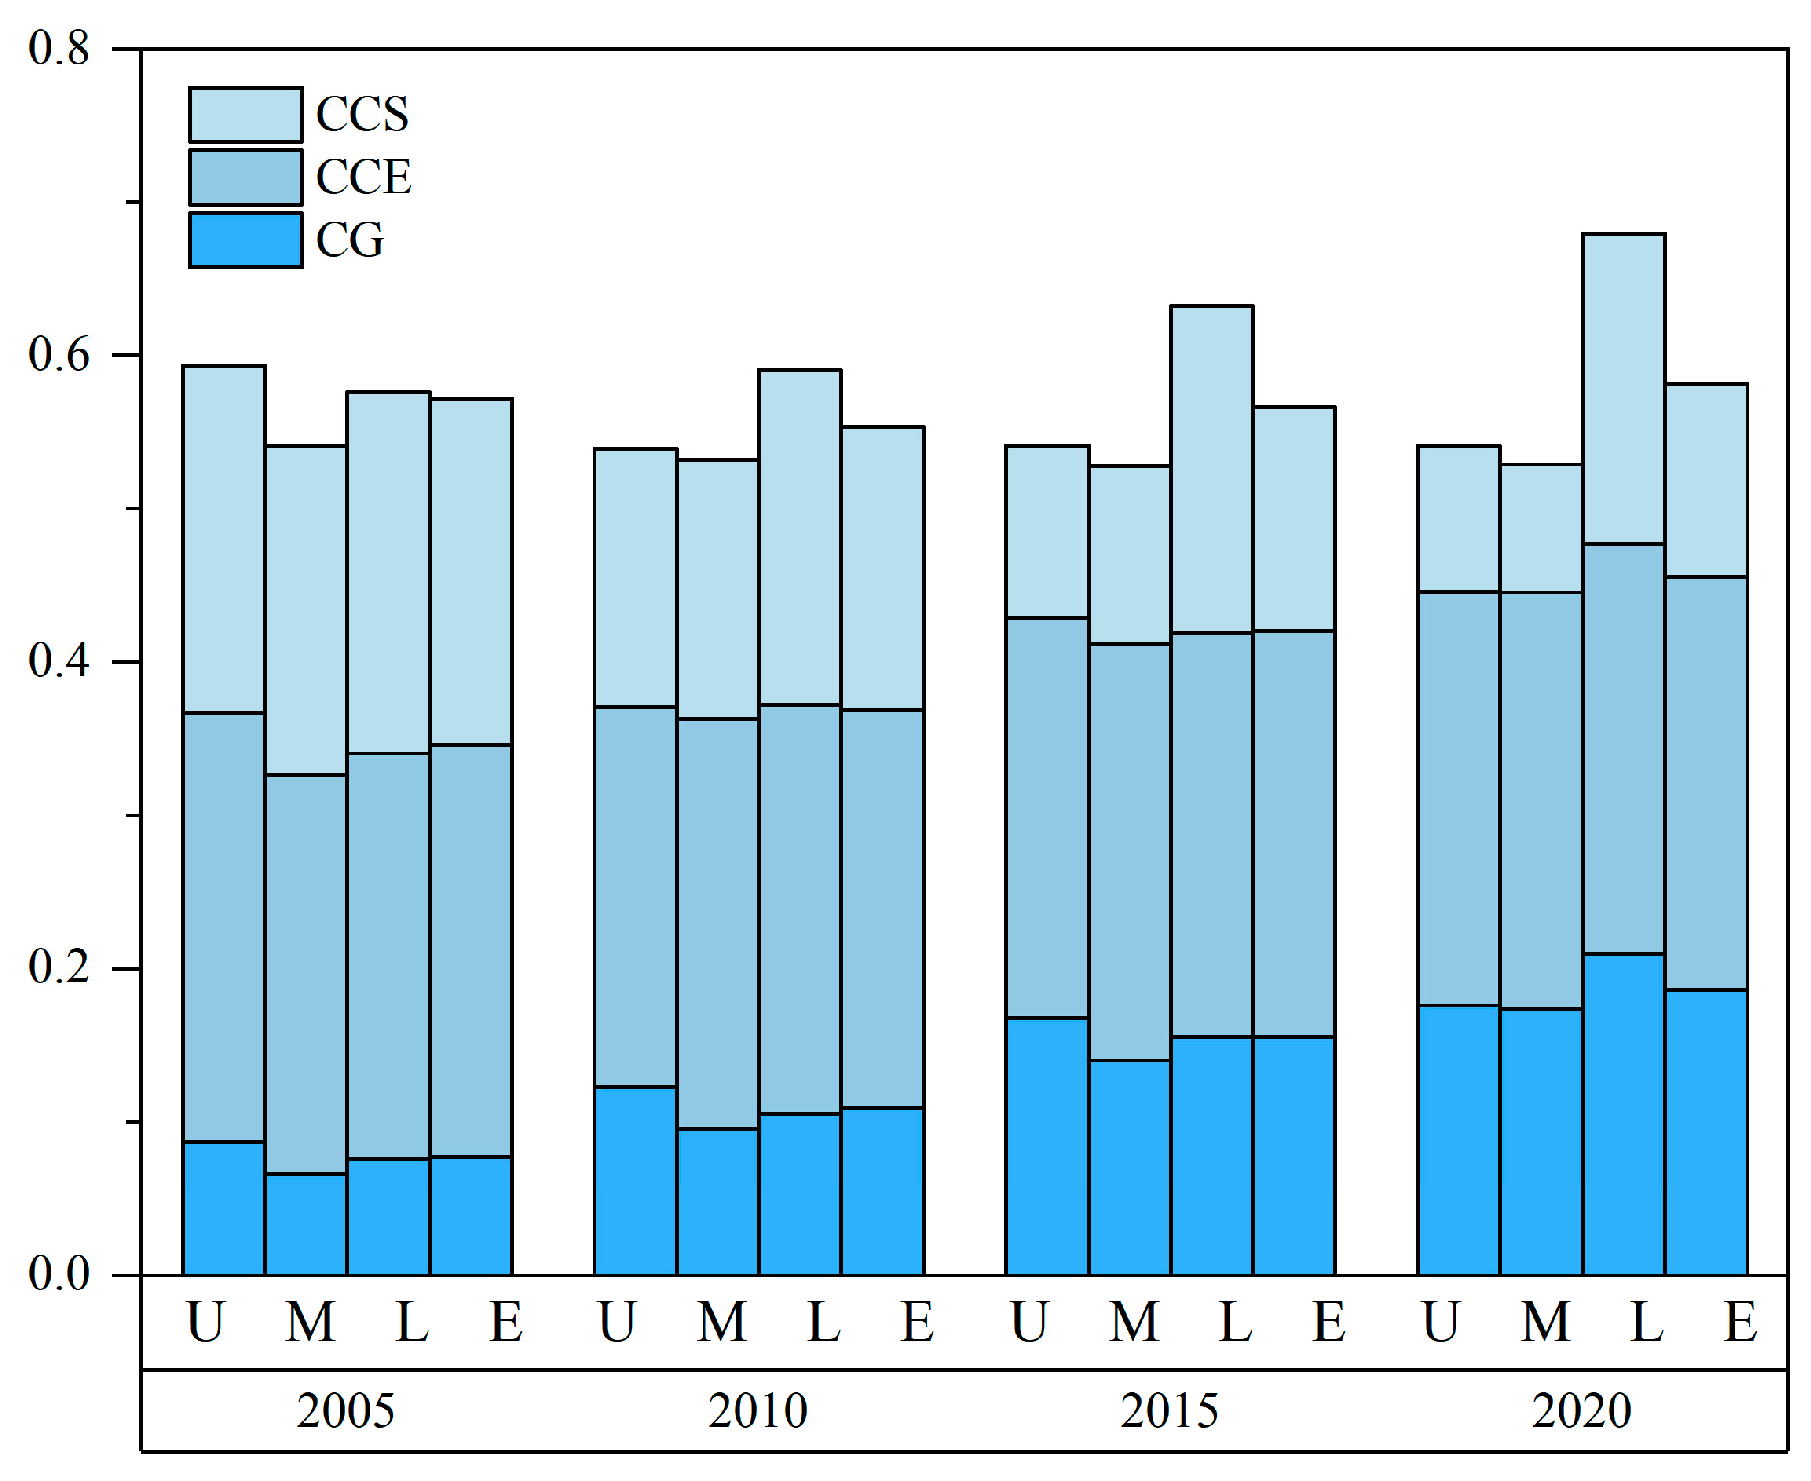
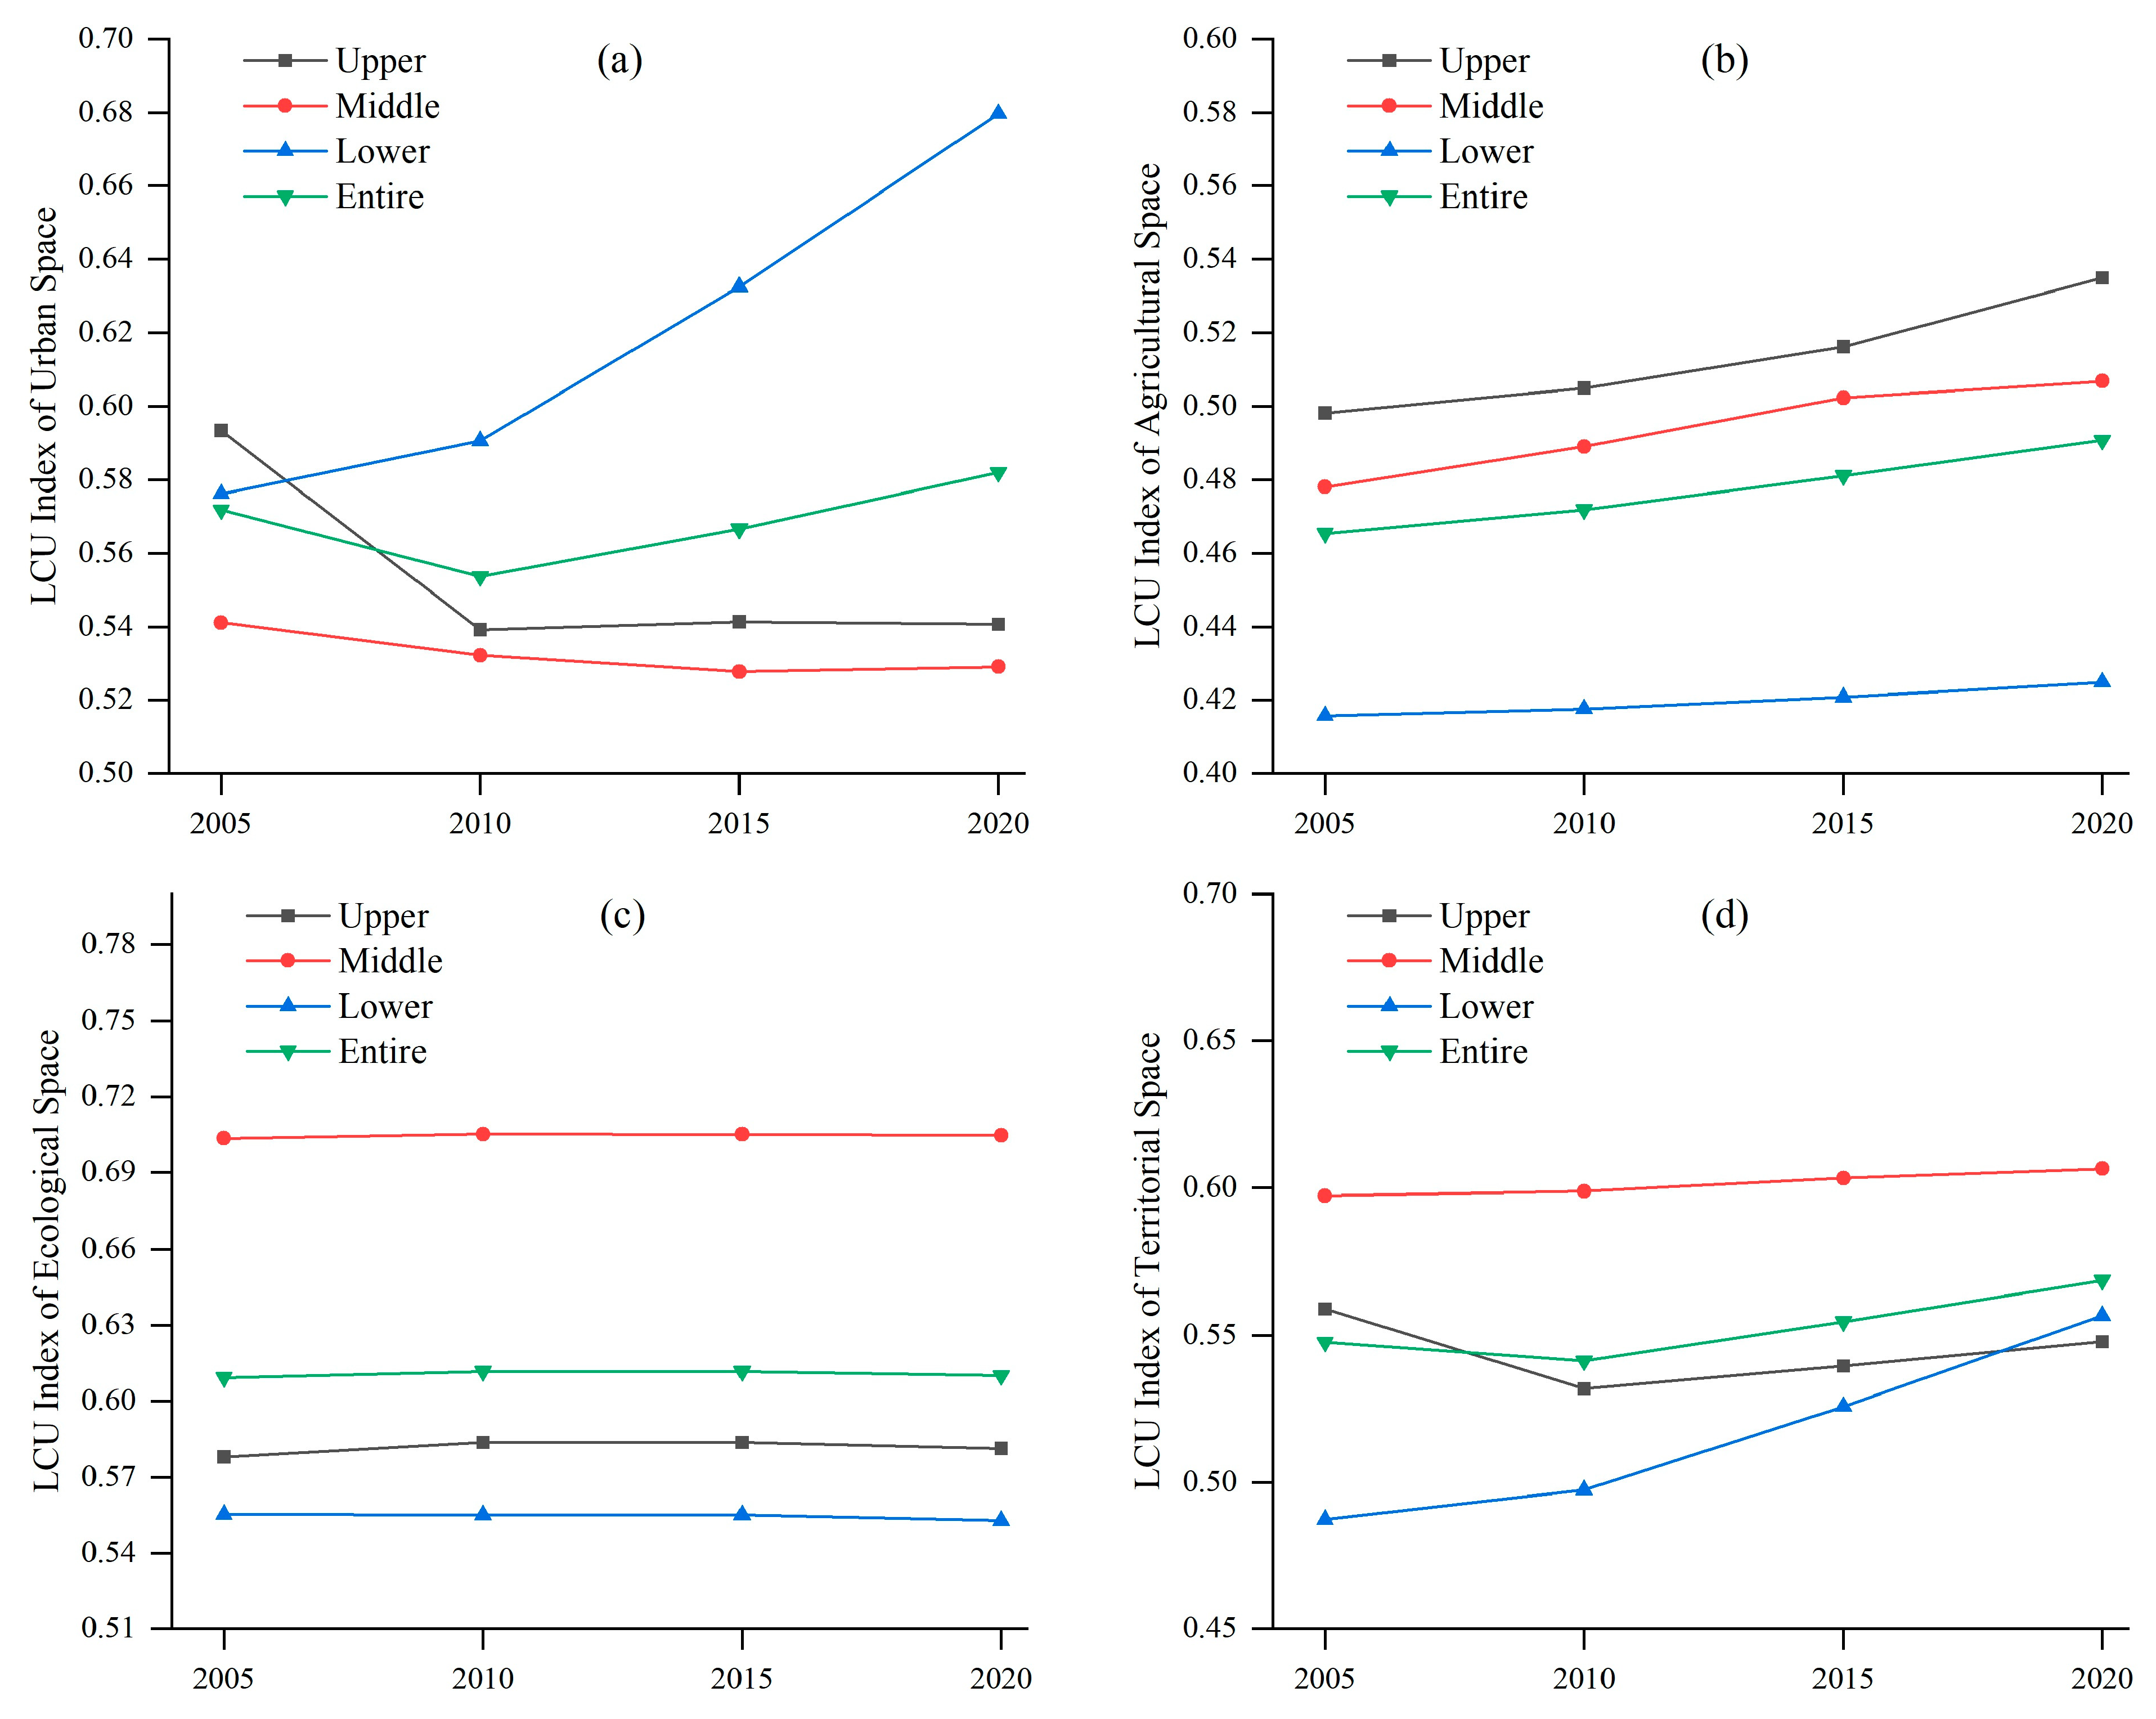
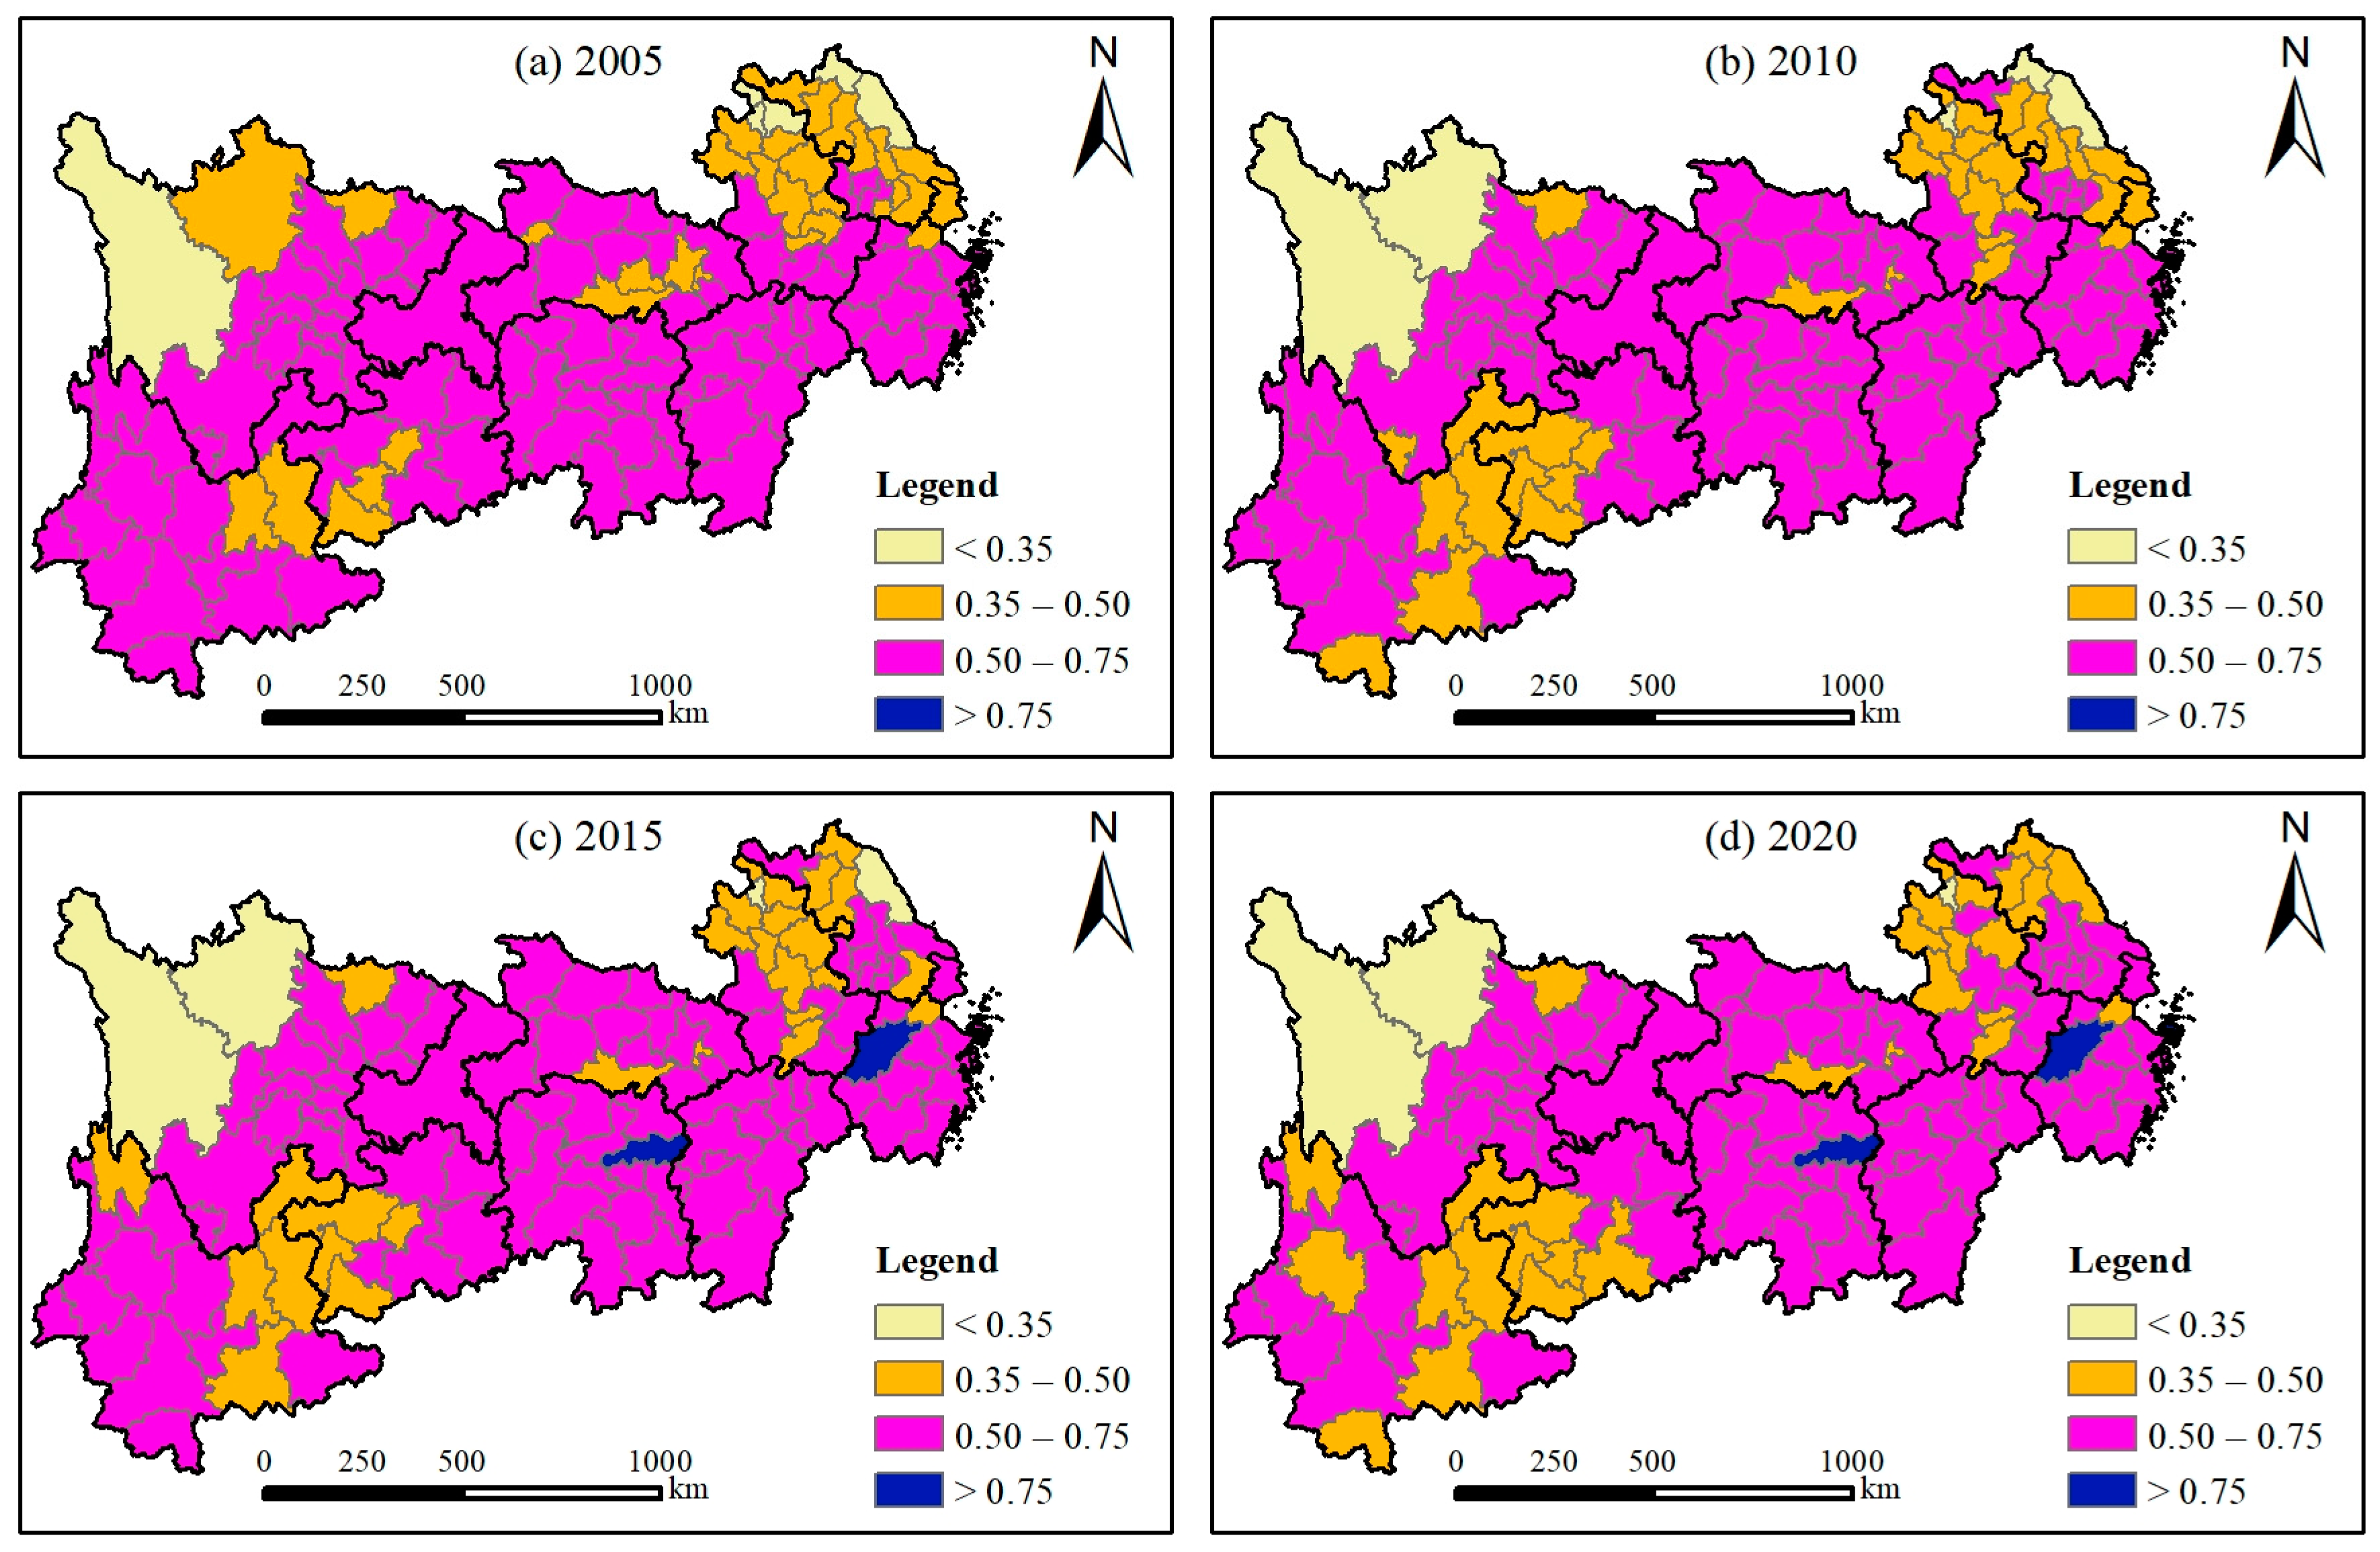
The principal findings are as follows: (1) The LCU index of territorial space in the YREB has shown an upward trend, fluctuating from 0.548 in 2005 to 0.569 in 2020. Regionally, the midstream area consistently exhibits the highest LCU index, while the downstream area surpassed the upstream area in this index after 2015. Different regions face varying shortcomings in the LCU of territorial space. (2) The cities within the YREB exhibit eight distinct types of the LCU of territorial space. Most cities demonstrate inadequate LCU in at least one functional area of territorial space. The first category includes cities that perform relatively well in LCU across urban, agricultural, and ecological spaces, with their proportion declining from 16.54% to 13.39%. Cities classified in the fourth category represent the largest group, accounting for approximately 28.35%; however, their poor performance in the LCU of urban space is a significant drawback. (3) The LCU of territorial space in the YREB is influenced by a combination of natural factors, socio-economic factors, and landscape pattern characteristics. Some factors exhibit a positive influence, while others demonstrate a negative impact.
This study also provides some insights for future research. Future investigations could apply the proposed assessment framework to evaluate LCU patterns across Asia or globally, enhancing its applicability in sustainable development contexts. Researchers may expand the analysis of driving factors by incorporating additional natural, socio-economic, and landscape pattern parameters beyond those examined here. Methodologically, while the optimal parameter-based geographical detector and Tobit regression models addressed challenges in the analysis of too many independent variables to some extent, further refinement of machine learning algorithms (e.g., random forests or XGBoost) could improve explanatory capacity for variable impact magnitude and direction. These extensions would strengthen policy-relevant insights into territorial space optimization under carbon neutrality objectives.

Author Contributions

Conceptualization, P.T. and L.C.; methodology, P.T.; software, L.C.; validation, L.C. and J.L. (Jinhua Li); formal analysis, P.T.; investigation, L.C.; resources, P.T.; data curation, L.C.; writing—original draft preparation, L.C.; writing—review and editing, L.C. and P.T.; visualization, J.L. (Jinhua Li); supervision, J.L. (Junming Li); project administration, P.T.; funding acquisition, P.T. All authors have read and agreed to the published version of the manuscript.

Funding

This research was funded by the research project of Sichuan University (H241031).

Data Availability Statement

Dataset available on request from the authors.

Conflicts of Interest

The authors declare no conflicts of interest.

Abbreviations

The following abbreviations are used in this manuscript:
YREBYangtze River Economic Belt
LCULow-carbon utilization
ESVEcosystem service value

References

  1. Wang, S.; Gao, S. Territorial space optimization and pathways for carbon emission reduction and carbon sink enhancement in China towards carbon neutrality. Econ. Geogr. 2024, 44, 163–173. [Google Scholar]
  2. Fan, J.; Wang, Z.; Zhou, D.; Guo, R.; Chen, D.; Liu, B.; Liu, H.; Qiao, Q.; Wu, J. How territorial function determines CO2 emissions in China: An approach of spatial dimension. J. Geogr. Sci. 2024, 34, 1677–1696. [Google Scholar]
  3. Hossain, M.A.; Huggins, R. The environmental and social impacts of unplanned and rapid industrialization in suburban areas: The case of the greater Dhaka region, Bangladesh. Environ. Urban. ASIA 2021, 12, 73–89. [Google Scholar] [CrossRef]
  4. Nathaniel, S.P.; Nwulu, N.; Bekun, F. Natural resource, globalization, urbanization, human capital, and environmental degradation in Latin American and Caribbean countries. Environ. Sci. Pollut. Res. 2021, 28, 6207–6221. [Google Scholar]
  5. Mahmood, H.; Alkhateeb, T.T.Y.; Furqan, M. Industrialization, urbanization and CO2 emissions in Saudi Arabia: Asymmetry analysis. Energy Rep. 2020, 6, 1553–1560. [Google Scholar]
  6. Xiong, S.; Yang, F.; Li, J.; Xu, Z.; Ou, J. Temporal-spatial variation and regulatory mechanism of carbon budgets in territorial space through the lens of carbon balance: A case of the middle reaches of the Yangtze River urban agglomerations, China. Ecol. Indic. 2023, 154, 110885. [Google Scholar]
  7. Voytenko, Y.; McCormick, K.; Evans, J.; Schliwa, G. Urban living labs for sustainability and low carbon cities in Europe: Towards a research agenda. J. Clean. Prod. 2016, 123, 45–54. [Google Scholar]
  8. Croci, E.; Lucchitta, B.; Molteni, T. Low carbon urban strategies: An investigation of 124 European cities. Urban Clim. 2021, 40, 101022. [Google Scholar]
  9. Doğan, B.; Driha, O.M.; Balsalobre Lorente, D.; Shahzad, U. The mitigating effects of economic complexity and renewable energy on carbon emissions in developed countries. Sustain. Dev. 2021, 29, 1–12. [Google Scholar] [CrossRef]
  10. He, J.; Liu, X.; Wang, X.; Li, X.; Yu, L.; Niu, B. Spatiotemporal evolution of territorial spaces and its effect on carbon emissions in Qingdao City, China. Land 2024, 13, 1717. [Google Scholar] [CrossRef]
  11. Zhang, Z.; Yu, X.; Hou, Y.; Chen, T.; Lu, Y.; Sun, H. Carbon emission patterns and carbon balance zoning in urban territorial spaces based on multisource data: A case study of Suzhou City, China. ISPRS Int. J. Geo-Inf. 2023, 12, 385. [Google Scholar] [CrossRef]
  12. Balta-Ozkan, N.; Watson, T.; Mocca, E. Spatially uneven development and low carbon transitions: Insights from urban and regional planning. Energy Policy 2015, 85, 500–510. [Google Scholar]
  13. Seto, K.C.; Churkina, G.; Hsu, A.; Keller, M.; Newman, P.W.; Qin, B.; Ramaswami, A. From low- to net-zero carbon cities: The next global agenda. Annu. Rev. Environ. Resour. 2021, 46, 377–415. [Google Scholar]
  14. Qu, Y.; Dong, X.; Su, D.; Jiang, G.; Ma, W. How to balance protection and development? A comprehensive analysis framework for territorial space utilization scale, function and pattern. J. Environ. Manag. 2023, 339, 117809. [Google Scholar]
  15. Wang, S.; Qu, Y.; Zhao, W.; Guan, M.; Ping, Z. Evolution and optimization of territorial-space structure based on regional function orientation. Land 2022, 11, 505. [Google Scholar] [CrossRef]
  16. Cui, J.; Jin, H.; Kong, X.; Sun, J.; Peng, Y.; Zhu, Y. Territorial spatial resilience assessment and its optimisation path: A case study of the Yangtze River Economic Belt, China. Land 2024, 13, 1395. [Google Scholar] [CrossRef]
  17. Dong, Y.; Jin, G.; Deng, X. Optimization of territorial space layout in China. J. Geogr. Sci. 2024, 34, 1719–1738. [Google Scholar]
  18. Jiang, H.; Chen, L. Spatial allocation efficiency and control strategy of county land resources based on main functional areas of territorial space: A case study of Ganyu, Jiangsu province. J. Nat. Resour. 2021, 36, 2424–2436. [Google Scholar]
  19. Niu, J.; Jin, G.; Zhang, L. Territorial spatial zoning based on suitability evaluation and its impact on ecosystem services in Ezhou city. J. Geogr. Sci. 2023, 33, 2278–2294. [Google Scholar]
  20. Zhang, Z.; Li, J. Spatial suitability and multi-scenarios for land use: Simulation and policy insights from the production-living-ecological perspective. Land Use Policy 2022, 119, 106219. [Google Scholar]
  21. Liu, X.; Li, X.; Zhang, Y.; Wang, Y.; Chen, J.; Geng, Y. Spatiotemporal evolution and relationship between construction land expansion and territorial space conflicts at the county level in Jiangsu Province. Ecol. Indic. 2023, 154, 110662. [Google Scholar]
  22. Meng, B.; Zhang, S.; Deng, W.; Peng, L.; Zhou, P.; Zhang, H. Identification and analysis of territorial spatial utilization conflicts in Yibin based on multidimensional perspective. Land 2023, 12, 1008. [Google Scholar] [CrossRef]
  23. Xi, F.; Wang, R.; Shi, J.; Zhang, J.; Yu, Y.; Wang, N.; Wang, Z. Spatio-temporal pattern and conflict identification of production-living-ecological space in the Yellow River Basin. Land 2022, 11, 744. [Google Scholar] [CrossRef]
  24. Zhao, X.; Li, S.; Pu, J.; Miao, P.; Wang, Q.; Tan, K. Optimization of the national land space based on the coordination of urban-agricultural-ecological functions in the Karst Areas of Southwest China. Sustainability 2019, 11, 6752. [Google Scholar] [CrossRef]
  25. Liu, Q.; Su, Z.; Huang, W. Analysis of the influencing factors of the high-quality utilization of territorial space based on the perspective of spatial equilibrium: A case study of Hunan Province, China. Sustainability 2022, 14, 12818. [Google Scholar] [CrossRef]
  26. Shi, L.; Shi, X.; Yang, F.; Zhang, L. Spatio-temporal difference in agricultural eco-efficiency and its influencing factors based on the SBM-Tobit models in the Yangtze River Delta, China. Int. J. Environ. Res. Public Health 2023, 20, 4786. [Google Scholar] [CrossRef]
  27. Zhu, X.; Li, Y.; Zhang, P.; Wei, Y.; Zheng, X.; Xie, L. Temporal-spatial characteristics of urban land use efficiency of China’s 35 mega cities based on DEA: Decomposing technology and scale efficiency. Land Use Policy 2019, 88, 104083. [Google Scholar]
  28. Zhang, L.; Zhang, L.; Xu, Y.; Zhou, P.; Yeh, C.H. Evaluating urban land use efficiency with interacting criteria: An empirical study of cities in Jiangsu China. Land Use Policy 2020, 90, 104292. [Google Scholar] [CrossRef]
  29. Yin, R.; Wang, Z.; Chai, J.; Gao, Y.; Xu, F. The evolution and response of space utilization efficiency and carbon emissions: A comparative analysis of spaces and regions. Land 2022, 11, 438. [Google Scholar] [CrossRef]
  30. Wu, H.; Fang, S.; Zhang, C.; Hu, S.; Nan, D.; Yang, Y. Exploring the impact of urban form on urban land use efficiency under low-carbon emission constraints: A case study in China’s Yellow River Basin. J. Environ. Manag. 2022, 311, 114866. [Google Scholar]
  31. Kuang, B.; Lu, X.; Zhou, M.; Chen, D. Provincial cultivated land use efficiency in China: Empirical analysis based on the SBM-DEA model with carbon emissions considered. Technol. Forecast. Soc. Change 2020, 151, 119874. [Google Scholar] [CrossRef]
  32. Zhang, Z.L.; Hou, Y.Z.; Sun, H.H. Calculation of carbon emissions and the difference of low-carbon development efficiency on city territorial space. J. Nat. Resour. 2023, 38, 1464–1481. [Google Scholar]
  33. Chen, M.; Wang, Q.; Bai, Z.; Shi, Z.; Yu, X.; Zhang, B. Spatial-temporal characteristics and influencing factors of territorial space use efficiency of resource-based cities in the Yellow River Basin based on the dual carbon targets. China Land Sci. 2024, 38, 101–112. [Google Scholar]
  34. Fu, H.; Cai, M.; Jiang, P.; Fei, D.; Liao, C. Spatial multi-objective optimization towards low-carbon transition in the Yangtze River Economic Belt of China. Landsc. Ecol. 2024, 39, 156. [Google Scholar]
  35. Yin, Q.; Chen, L.; Li, J.; Wang, Q.; Dai, X.; Sun, W.; Tang, H. Towards sustainable development goals: Coupling coordination analysis and spatial heterogeneity between urbanization, the environment, and food security in China. Land 2023, 12, 2002. [Google Scholar] [CrossRef]
  36. Duman, Z.; Mao, X.; Cai, B.; Zhang, Q.; Chen, Y.; Gao, Y.; Guo, Z. Exploring the spatiotemporal pattern evolution of carbon emissions and air pollution in Chinese cities. J. Environ. Manag. 2023, 345, 118870. [Google Scholar]
  37. Walker, W.S.; Gorelik, S.R.; Cook-Patton, S.C.; Baccini, A.; Farina, M.K.; Solvik, K.K.; Ellis, P.W.; Sanderman, J.; Houghton, R.A.; Leavitt, S.M.; et al. The global potential for increased storage of carbon on land. Proc. Natl. Acad. Sci. USA 2022, 119, e2111312119. [Google Scholar]
  38. Zhu, C.; Fan, W.; Wu, X.; Zhang, Z.; Chen, Y. Spatial mismatch and the attribution analysis of carbon storage demand and supply in the Yangtze River Economic Belt, China. J. Clean. Prod. 2024, 434, 140036. [Google Scholar]
  39. Chen, D.; Jiang, P.; Li, M. Assessing potential ecosystem service dynamics driven by urbanization in the Yangtze River Economic Belt, China. J. Environ. Manag. 2021, 292, 112734. [Google Scholar]
  40. Zhang, Y.; Dai, Y.; Chen, Y.; Ke, X. The study on spatial correlation of recessive land use transformation and land use carbon emission. China Land Sci. 2022, 36, 100–112. [Google Scholar]
  41. Xie, G.; Zhang, C.; Zhen, L.; Zhang, L. Dynamic changes in the value of China’s ecosystem services. Ecosyst. Serv. 2017, 26, 146–154. [Google Scholar] [CrossRef]
  42. Sun, Y.; Liang, X.; Xiao, C. Assessing the influence of land use on groundwater pollution based on coefficient of variation weight method: A case study of Shuangliao City. Environ. Sci. Pollut. Res. 2019, 26, 34964–34976. [Google Scholar] [CrossRef] [PubMed]
  43. Bonnier, A.; Finné, M.; Weiberg, E. Examining land-use through GIS-based kernel density estimation: A re-evaluation of legacy data from the Berbati-Limnes survey. J. Field Archaeol. 2019, 44, 70–83. [Google Scholar] [CrossRef]
  44. Zhao, J.; Zhao, Y.; Yang, X. Evolution characteristics and driving mechanism of the territorial space pattern in the Yangtze River Economic Belt, China. Land 2022, 11, 1447. [Google Scholar] [CrossRef]
  45. Haddix, M.L.; Gregorich, E.G.; Helgason, B.L.; Janzen, H.; Ellert, B.H.; Cotrufo, M.F. Climate, carbon content, and soil texture control the independent formation and persistence of particulate and mineral-associated organic matter in soil. Geoderma 2020, 363, 114160. [Google Scholar] [CrossRef]
  46. Bony, S.; Bellon, G.; Klocke, D.; Sherwood, S.; Fermepin, S.; Denvil, S. Robust direct effect of carbon dioxide on tropical circulation and regional precipitation. Nat. Geosci. 2013, 6, 447–451. [Google Scholar] [CrossRef]
  47. Bastos, J.R.; Capellesso, E.S.; Vibrans, A.C.; Marques, M.C. Human impacts, habitat quantity and quality affect the dimensions of diversity and carbon stocks in subtropical forests: A landscape-based approach. J. Nat. Conserv. 2023, 73, 126383. [Google Scholar] [CrossRef]
  48. Wassie, S.B. Natural resource degradation tendencies in Ethiopia: A review. Environ. Syst. Res. 2020, 9, 1–29. [Google Scholar] [CrossRef]
  49. Marzouk, M.A.; Salheen, M.A.; Fischer, L.K. Towards sustainable urbanization in new cities: Social acceptance and preferences of agricultural and solar energy systems. Technol. Soc. 2024, 77, 102561. [Google Scholar] [CrossRef]
  50. Hou, Y.; Wang, L.; Li, Z.; Ouyang, X.; Xiao, T.; Wang, H.; Li, W.; Nie, X. Landscape fragmentation and regularity lead to decreased carbon stocks in basins: Evidence from century-scale research. J. Environ. Manag. 2024, 367, 121937. [Google Scholar] [CrossRef]
  51. Han, F.; Huang, M. Land misallocation and carbon emissions: Evidence from China. Land 2022, 11, 1189. [Google Scholar] [CrossRef]
  52. Biswas, G.; Sengupta, A.; Alfaisal, F.M.; Alam, S.; Alharbi, R.S.; Jeon, B.H. Evaluating the effects of landscape fragmentation on ecosystem services: A three-decade perspective. Ecol. Inform. 2023, 77, 102283. [Google Scholar]
  53. Li, M.; Abuduwaili, J.; Liu, W.; Feng, S.; Saparov, G.; Ma, L. Application of geographical detector and geographically weighted regression for assessing landscape ecological risk in the Irtysh River Basin, Central Asia. Ecol. Indic. 2024, 158, 111540. [Google Scholar]
  54. Shrestha, A.; Luo, W. Analysis of groundwater nitrate contamination in the Central Valley: Comparison of the geodetector method, principal component analysis and geographically weighted regression. ISPRS Int. J. Geo-Inf. 2017, 6, 297. [Google Scholar] [CrossRef]
  55. Zhang, W.; Feng, P. Differentiation research of CO2 emissions from energy consumption and their influencing mechanism on the industrial enterprises above designated size in Chinese industrial cities: Based on geographical detector method. Nat. Hazards 2020, 102, 645–658. [Google Scholar]
  56. Béjaoui, B.; Armi, Z.; Ottaviani, E.; Barelli, E.; Gargouri-Ellouz, E.; Chérif, R.; Turki, S.; Solidoro, C.; Aleya, L. Random Forest model and TRIX used in combination to assess and diagnose the trophic status of Bizerte Lagoon, southern Mediterranean. Ecol. Indic. 2016, 71, 293–301. [Google Scholar]
  57. Yang, Z.; Hong, Y.; Guo, Q.; Yu, X.; Zhao, M. The impact of topographic relief on population and economy in the southern Anhui mountainous area, China. Sustainability 2022, 14, 14332. [Google Scholar] [CrossRef]
  58. Zheng, L.; Wang, Y.; Li, J. Quantifying the spatial impact of landscape fragmentation on habitat quality: A multi-temporal dimensional comparison between the Yangtze River Economic Belt and Yellow River Basin of China. Land Use Policy 2023, 125, 106463. [Google Scholar] [CrossRef]
  59. Qiao, R.; Zhao, Z.; Wu, T.; Zhou, S.; Ao, X.; Yang, T.; Liu, X.; Liu, Z.; Wu, Z. Unveiling the nonlinear drivers of urban land resources on carbon emissions: The mediating role of industrial upgrading and technological innovation. Resour. Conserv. Recycl. 2025, 212, 108000. [Google Scholar] [CrossRef]
  60. Ding, X.; Wu, Q.; Liu, X.; Tan, L.; Wang, J. Coupling and coordination degree of land use, high-quality economic development, and carbon emissions and influencing factors in China: An empirical study of 282 prefecture-level cities. Resour. Sci. 2022, 44, 2233–2246. [Google Scholar]
  61. Zhang, J.; Su, F. Spatial pattern of construction land distribution in bays along the coast of Vietnam. ISPRS Int. J. Geo-Inf. 2020, 9, 707. [Google Scholar] [CrossRef]
  62. Song, Y.; Wang, J.; Ge, Y.; Xu, C. An optimal parameters-based geographical detector model enhances geographic characteristics of explanatory variables for spatial heterogeneity analysis: Cases with different types of spatial data. GISci. Remote Sens. 2020, 57, 593–610. [Google Scholar] [CrossRef]
  63. Chesher, A.; Kim, D.; Rosen, A.M. IV methods for Tobit models. J. Econ. 2023, 235, 1700–1724. [Google Scholar]
  64. Ye, T.; Zheng, H.; Ge, X.; Yang, K. Pathway of green development of Yangtze River Economics Belt from the perspective of green technological innovation and environmental regulation. Int. J. Environ. Res. Public Health 2021, 18, 10471. [Google Scholar] [CrossRef]
  65. Yang, X.; Ran, G. Factors influencing the coupled and coordinated development of cities in the Yangtze River Economic Belt: A focus on carbon reduction, pollution control, greening, and growth. J. Environ. Manag. 2024, 370, 122499. [Google Scholar] [CrossRef]
  66. Wang, Y.; Zhang, D.; Wang, Y. Evaluation analysis of forest ecological security in 11 provinces (cities) of the Yangtze River Economic Belt. Sustainability 2021, 13, 4845. [Google Scholar] [CrossRef]
  67. Muhammad, S.; Pan, Y.; Agha, M.H.; Umar, M.; Chen, S. Industrial structure, energy intensity and environmental efficiency across developed and developing economies: The intermediary role of primary, secondary and tertiary industry. Energy 2022, 247, 123576. [Google Scholar]
  68. Shokoohi, Z.; Dehbidi, N.K.; Tarazkar, M.H. Energy intensity, economic growth and environmental quality in populous Middle East countries. Energy 2022, 239, 122164. [Google Scholar] [CrossRef]
  69. Wang, W.Z.; Liu, L.C.; Liao, H.; Wei, Y.M. Impacts of urbanization on carbon emissions: An empirical analysis from OECD countries. Energy Policy 2021, 151, 112171. [Google Scholar]
  70. Sufyanullah, K.; Ahmad, K.A.; Ali, M.A.S. Does emission of carbon dioxide is impacted by urbanization? An empirical study of urbanization, energy consumption, economic growth and carbon emissions—Using ARDL bound testing approach. Energy Policy 2022, 164, 112908. [Google Scholar]
  71. Lei, H.; Zeng, S.; Namaiti, A.; Zeng, J. The impacts of road traffic on urban carbon emissions and the corresponding planning strategies. Land 2023, 12, 800. [Google Scholar] [CrossRef]
  72. Chazdon, R.L.; Guariguata, M.R. Natural regeneration as a tool for large-scale forest restoration in the tropics: Prospects and challenges. Biotropica 2016, 48, 716–730. [Google Scholar] [CrossRef]
  73. Connolly, M.; Shan, Y.; Bruckner, B.; Li, R.; Hubacek, K. Urban and rural carbon footprints in developing countries. Environ. Res. Lett. 2022, 17, 084005. [Google Scholar]
  74. Shmelev, S.E.; Shmeleva, I.A. Global urban sustainability assessment: A multidimensional approach. Sustain. Dev. 2018, 26, 904–920. [Google Scholar] [CrossRef]
Figure 1. Research framework.
Land 14 00738 g001
Figure 2. The location of the YREB.
Land 14 00738 g002
Figure 3. Kernel density curves of different types of LCU indices in the YREB.
Land 14 00738 g003
Figure 4. The LCU index values of urban spaces in the upper (U), middle (M), and lower (L) reaches, as well as the entire (E) region of the YREB.
Land 14 00738 g004
Figure 5. Spatial patterns of the LCU index of urban space in the YREB.
Land 14 00738 g005
Figure 6. The LCU index values of agricultural spaces in the upper (U), middle (M), and lower (L) reaches, as well as the entire (E) region of the YREB.
Land 14 00738 g006
Figure 7. Spatial patterns of the LCU index of agricultural space in the YREB.
Land 14 00738 g007
Figure 8. The LCU index values of ecological spaces in the upper (U), middle (M), and lower (L) reaches, as well as the entire (E) region of the YREB.
Land 14 00738 g008
Figure 9. Spatial patterns of the LCU index of ecological space in the YREB.
Land 14 00738 g009
Figure 10. The LCU index values of urban space, agricultural space, ecological space, and territorial space in the upper, middle, and lower reaches of the YREB, as well as for the entire YREB: (a) The LCU index of urban space; (b) The LCU index of agricultural space; (c) The LCU index of ecological space; (d) The LCU index of territorial space.
Land 14 00738 g010
Figure 11. Spatial patterns of the LCU index of territorial space in the YREB.
Land 14 00738 g011
Figure 12. Transition of LCU of territorial space types in the YREB.
Land 14 00738 g012
Figure 13. Spatial patterns of LCU of territorial space types in the YREB.
Land 14 00738 g013
Figure 14. Optimization strategies for LCU of territorial space in the YREB.
Land 14 00738 g014
Table 1. Evaluation indicators and weights for the LCU of the territorial space.
Territorial Space Functional TypeIndicator LayerSymbolComprehensive Weight
Urban SpaceCarbon Stock per Unit Area (t·hm−2)UCS0.3
Carbon Emissions per Unit Area (t·hm−2)UCE0.288
Output Value of Secondary and Tertiary Industries per Unit Area (104 CNY·hm−2)UG0.412
Agricultural SpaceCarbon Stock per Unit Area (t·hm−2)RCS0.262
Carbon Emissions per Unit Area (t·hm−2)RCE0.264
Output Value of Primary Industry per Unit Area (104 CNY·hm−2)RG0.474
Ecological SpaceCarbon Stock per Unit Area (t·hm−2)ECS0.328
Carbon Sink per Unit Area (t·hm−2)ECE0.294
Ecosystem Service Value per Unit Area (104 CNY·hm−2)ESV0.377
Table 3. Average LCU index of urban, agricultural, and ecological spaces in the YREB.
LCU Index2005201020152020
Urban Space0.5720.5540.5670.582
Agricultural Space0.4650.4720.4810.491
Ecological Space0.6090.6120.6120.610
Table 4. Standards for the classification of LCU of territorial space in the YREB.
TypeExplanation
IThe LCU indices for urban space, agricultural space, and ecological space are all above the average.
IIThe LCU indices for urban space and agricultural space are both above the average, while the LCU index for ecological space is below the average.
IIIThe LCU indices for urban space and ecological space are both above the average, while the LCU index for agricultural space is below the average.
IVThe LCU indices for agricultural space and ecological space are both above the average, while the LCU index for urban space is below the average.
VThe LCU index for urban space is above the average, while the LCU indices for both agricultural space and ecological space are below the average.
VIThe LCU index for agricultural space is above the average, while the LCU indices for both urban space and ecological space are below the average.
VIIThe LCU index for ecological space is above the average, while the LCU indices for both urban space and agricultural space are below the average.
VIIIThe LCU indices for urban space, agricultural space, and ecological space are all below the average.
Table 5. The dominant driving factors for the LCU of territorial space in the YREB.
FactorSymbolq-Value
Annual Precipitation rain0.1635 ***
Terrain Ruggedness degree0.3961 ***
Habitat Quality hq0.3393 ***
Industrial Structure stru0.158 ***
Primary Industry Carbon Emission Intensity agc0.1926 ***
Secondary and Tertiary Industry Carbon Emission Intensity inc0.2307 ***
Urbanization Level ur0.1066 **
Road Network Density road0.1175 **
Technological Investment tech0.2573 ***
Public Budget Expenditure pub0.1175 ***
Environmental Regulation regu0.1066 **
Largest Patch Index of Forest lpiforst0.3788 ***
Largest Patch Index of Urban Construction Land lpicity0.1391 ***
Grassland Patch Density pdgrass0.1458 ***
Rural Construction Land Patch Density pdrural0.3929 ***
Cultivated Land Aggregation Index aifarm0.2106 ***
Water Body Aggregation Index aiwater0.1174 ***
Note: **, *** represent the significance level of 5% and 1% respectively.
Table 6. The influence of dominant driving factors on the LCU of territorial space in the YREB.
VariableCoefficientStandard Error
Constant Term−0.7355 **−2.38
rain0.0086 **0.0034
degree−0.0278 ***0.0095
hq0.2913 ***0.0908
stru0.1275 ***0.0327
agc−0.0164 ***0.0057
inc−0.0146 ***0.0027
ur0.0208 *0.0113
road−0.0079 *0.0041
tech0.5331 ***0.1693
pub0.0253 ***0.0071
regu0.066 *0.0365
lpiforst0.0016 ***0.0004
lpicity0.0068 ***0.0021
pdgrass−1.1593 ***0.3811
pdrural−0.2756 *0.1576
aifarm0.2015 ***0.0479
aiwater−0.0179 **0.0091
LR test of sigma_u = 0: chibar2(01) = 254.39 Prob >= chibar2 = 0.000
Note: *, **, *** represent the significance level of 10%, 5% and 1% respectively.
Disclaimer/Publisher’s Note: The statements, opinions and data contained in all publications are solely those of the individual author(s) and contributor(s) and not of MDPI and/or the editor(s). MDPI and/or the editor(s) disclaim responsibility for any injury to people or property resulting from any ideas, methods, instructions or products referred to in the content.

