1. Introduction
Population aging is one of the major challenges facing modern societies and represents an inevitable trend accompanying social development [
1]. This demographic shift is a global phenomenon affecting both developed and developing countries. According to the United Nations, the global population aged 60 and above has more than doubled over the past 30 years, and it is projected to nearly triple by 2050, reaching 2.1 billion people [
2]. The rapid aging of the population places immense pressure on healthcare systems, pension schemes, and social services while also influencing economic productivity and intergenerational relationships [
3,
4,
5]. Addressing the challenges posed by aging societies requires comprehensive strategies to ensure that elderly individuals receive adequate medical care, social welfare, and support systems, enabling them to live independently and with dignity [
6,
7].
As the world’s most populous developing country, China faces significant challenges related to population aging. According to the 2020 National Population Census released by the National Bureau of Statistics of China, the old people (aged 60 and above) had reached 264 million, accounting for 18.7% of the total population—an increase of 5.5 percentage points compared to 2010. At this rate of growth, China is expected to enter a “super-aged society” by 2035, with individuals aged 65 and above exceeding 20% of the total population [
8]. In response to these demographic changes, the Chinese government has actively aligned with the United Nations’ 2030 Agenda for Sustainable Development, incorporating “ensuring healthy lives and promoting well-being for all at all ages” (Goal 3) [
9] and “building sustainable cities and communities” (Goal 11) [
10] into its national strategic priorities. In recent years, policy frameworks such as the Medium- and Long-Term Plan for Actively Responding to Population Aging (2019) [
11] and the report from the 20th National Congress of the Communist Party of China [
12] have been issued, outlining key policy pathways for strengthening elderly care services, promoting the development of the aging industry, optimizing resource allocation, and enhancing the quality of care services.
At the regional level, aging-related challenges are particularly pronounced. The Yangtze River Delta (YRD), one of the first regions in China to enter an aging society, has experienced one of the most rapid demographic shifts, placing significant pressure on elderly care services [
13]. The YRD region, covering Shanghai, Jiangsu, Zhejiang, and Anhui provinces, spans approximately 350,000 square kilometers and is home to over 200 million people [
14]. As a region characterized by high population density and advanced economic development, the continuous improvement of economic conditions and healthcare services has led to an increase in life expectancy and a significant rise in the number of old people. Recent statistical data indicate that the proportion of the population aged 65 and above in Shanghai, Jiangsu, Zhejiang, and Anhui has reached 16.28%, 16.20%, 13.27%, and 15.01%, respectively [
15]. With the exception of Zhejiang, the other provinces have already entered a moderately aged society. However, significant disparities exist in aging patterns between urban and rural areas and among cities within the YRD region [
16,
17]. Furthermore, the escalating demand for elderly care services is exerting tremendous pressure on the regional public service system. Particularly in terms of elderly care facilities, the YRD faces structural issues such as unbalanced facility distribution, resource misallocation, and mismatches between urban and rural service demands [
18,
19]. These challenges necessitate a spatially oriented, data-driven research approach to identify the distribution patterns and dynamic evolution of elderly care facilities across different geographical areas, thereby supporting evidence-based policymaking and targeted interventions.
This study focuses on the spatial distribution and supply–demand imbalance of elderly care facilities in the Yangtze River Delta. By integrating information geography, web scraping techniques, geographic information systems (GISs), and statistical modeling, this research constructs a comprehensive dataset of elderly care facilities in the YRD region. It analyzes spatial distribution patterns, temporal trends, and the alignment of facility supply with population needs. The findings of this study not only contribute to enhancing the scientific precision of local government decision-making in elderly care service provision but also provide an analytical framework applicable to the global discourse on aging. This research offers insights into promoting equity in elderly care services and advancing sustainable urban development in the context of global population aging.
2. Literature Review
With the growing severity of population aging, elderly care facilities have become crucial components in ensuring the quality of life and well-being of old people [
20,
21]. These facilities play a key role in urban sustainable development strategies, serving not only as places for caregiving [
22], rehabilitation [
23,
24], and psychological support [
25,
26] but also directly influencing the convenience of daily life and the social participation of elderly populations [
27]. Therefore, the spatial configuration and service equity of elderly care facilities have become critical topics in the field of aging studies. Many countries are now focusing on integrating elderly care facilities into broader territorial planning strategies. Urban and regional policies are increasingly addressing the need for equitable access to care services by ensuring that facilities are strategically located to serve both urban and rural populations. The overlap between territorial planning and elderly care facility policies is particularly evident in efforts to improve accessibility, integrate services across regions, and create environments that support aging in place, all while balancing the distribution of resources to meet the growing demands of an aging population.
Existing research primarily focuses on identifying the spatial distribution characteristics of elderly care service facilities. Descriptive statistical and visualization techniques are commonly used to reveal the density, spatial clustering, and dispersion patterns of various types of facilities. Frochen et al. [
28] applied the Getis-Ord Gi* index to conduct spatial clustering and hotspot analysis, revealing significant spatial aggregation of elderly care facilities in the Los Angeles area. Huang [
29] utilized kernel density estimation (KDE) to systematically explore the spatial distribution and clustering characteristics of eight types of elderly care facilities, highlighting notable spatial imbalances in facility layouts. Tan et al. [
20] analyzed the spatial pattern of elderly care facilities in Tianjin using Moran’s I, identifying significant spatial clustering in central urban areas. Most studies widely apply Geographic Information System (GIS) techniques for spatial visualization, employing methods such as standard deviational ellipse (SDE) [
30,
31,
32], kernel density estimation (KDE) [
33,
34,
35], and Moran’s I [
20,
36,
37] to examine the spatial aggregation and evolutionary trends of elderly care facilities, providing essential technical support for optimizing facility layouts.
As research progresses, scholars have shifted from focusing solely on “spatial visualization of facility distribution” to analyzing “service accessibility,” emphasizing the spatial interactions between elderly care facilities and aging populations. Accessibility analysis has become a core research focus, with commonly used methods including Euclidean distance, network distance, and population demand-weighted models [
38,
39,
40]. Among these, the two-step floating catchment area (2SFCA) method has been widely adopted for assessing the accessibility of elderly care facilities. Cheng et al. [
41] utilized the 2SFCA method to analyze the geographic accessibility of multi-tiered healthcare services for the old people, emphasizing the importance of improving elderly healthcare accessibility in optimizing public health resource allocation. Guida and Carpentieri [
42] further refined the 2SFCA model by incorporating a distance decay function and multimodal transportation network modeling. By integrating pedestrian pathways, bus routes, and urban rail transit, they developed a more realistic accessibility evaluation system.
In recent years, with the advancement of the “aging-in-place” concept and age-friendly city initiatives, research has expanded to regional-scale analyses of service supply–demand equity. Scholars have begun examining the spatial disparities in elderly care resources across different administrative units, such as streets, communities, and districts. For example, Ellen et al. [
43] conducted a systematic evaluation of 86 types of elderly care services in Australia, assessing their effectiveness in meeting the needs of aging populations. Higgs [
44] analyzed the spatial disparities in social care service provision using the Welsh national database of residential and care home beds, focusing on localized resource allocation challenges. Sagara [
45] investigated the employment mechanisms and structural challenges faced by elderly care assistants in nursing institutions through fax surveys and questionnaires. The study found that large institutions generally provide more comprehensive training and support systems, whereas small- and medium-sized institutions suffer from workforce shortages, exacerbating structural imbalances within the elderly care service system.
Despite the theoretical foundations and methodological advancements provided by existing studies, several key gaps remain in the spatial analysis of elderly care facilities. First, most current research relies on static cross-sectional data, lacking systematic tracking and quantitative analysis of the dynamic evolution of elderly care facility distribution over time. This limitation hinders the accurate depiction of spatial changes in facility layouts in the context of urban development and demographic aging. Second, while accessibility and equity have become central research themes, the coordinated mechanisms underlying supply–demand matching remain underexplored. Additionally, in terms of data acquisition, traditional government statistical data often suffer from delayed updates and insufficient spatial resolution, limiting the real-time applicability and granularity of research findings.
3. Methodology
Given the existing research gaps in the dynamic evolution of elderly care facilities and the coordination mechanisms of supply and demand, this study focuses on the YRD region and constructs a comprehensive analytical framework integrating “spatial distribution–evolutionary characteristics–supply–demand coupling.” By leveraging web scraping and geocoding techniques, a spatial database of elderly care facilities is established. The study employs Moran’s I, nearest neighbor index, kernel density analysis, and standard deviational ellipse to analyze the spatial evolution of these facilities. Additionally, a coupling coordination model and the entropy weight method are utilized to assess the spatial matching between facilities and elderly people. The objective is to comprehensively depict the spatiotemporal evolution patterns and supply–demand equilibrium of elderly care facilities in the YRD region, thereby providing theoretical support and empirical insights for optimizing regional elderly care service systems. The research methodology consists of three main aspects.
3.1. Development of a Regional Elderly Care Facility Dataset Based on Web Scraping and GIS Technology
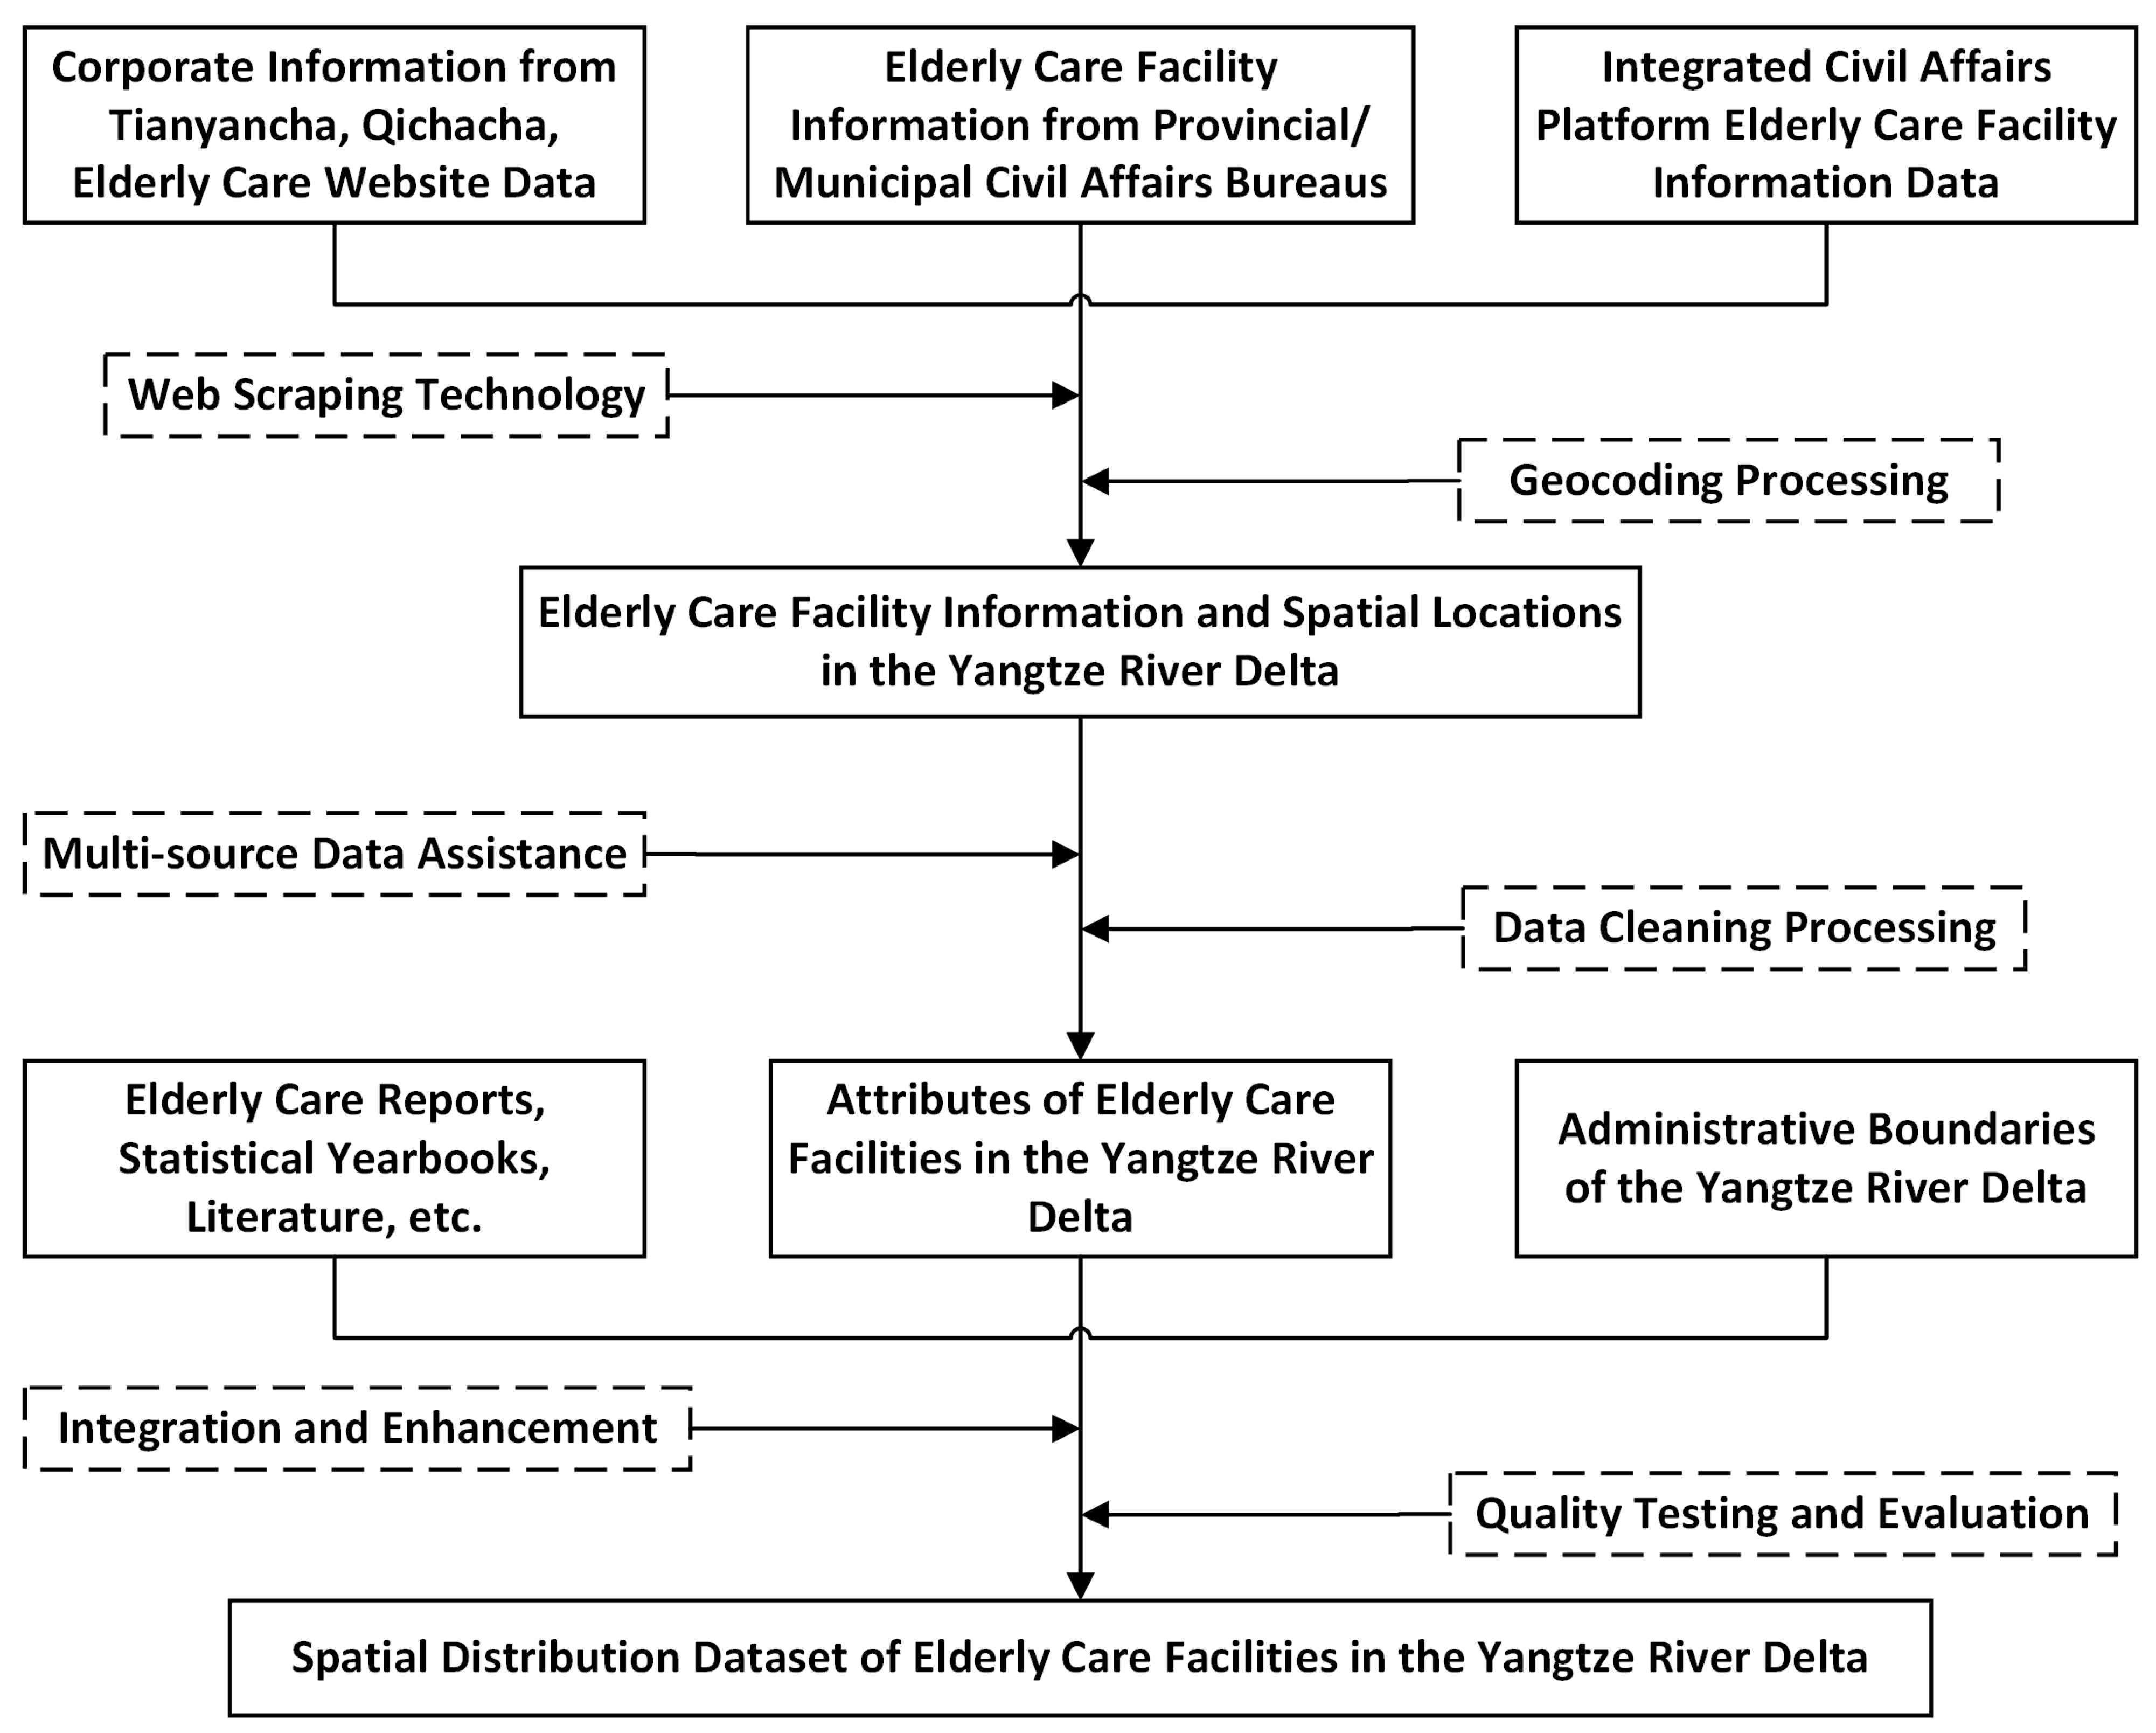
This study selected elderly care facility data published by the Integrated Civil Affairs Service Platform as the baseline dataset. Based on this, web scraping and relevant GIS analysis methods were utilized to spatially locate and enrich the attributes of the elderly care facilities, ultimately constructing a spatial distribution dataset. The dataset fields include information such as institution name, credit code, number of beds, and address. The data processing workflow is as follows (
Figure 1):
(1) Based on the elderly care facility data provided by the Integrated Civil Affairs Service Platform, the facility directory was cleaned and verified. Given the limitations in attribute information, such as the lack of time-based data, additional information was gathered from civil affairs bureaus (departments) of the three provinces and one municipality, as well as from corporate data sources like Qichacha, Tianyancha, and various elderly care websites to enrich the dataset.
(2) The enhanced elderly care facility data were then geocoded to convert the addresses into geographic coordinates, which were imported into the GIS for spatial visualization.
(3) For quality control, regional Points of Interest (POI) data products, maps, and remote sensing imagery were used, along with official data on elderly care facilities and statistical yearbooks published by provincial (municipal) civil affairs bureaus (departments), to verify the spatial locations and attribute information.
Figure 1.
Data development process.
Figure 1.
Data development process.
This study focuses on elderly care service facilities, encompassing both public and private institutional care facilities as well as community-based elderly care facilities. These facilities provide comprehensive services for people aged 60 and above, including daily living support, health care, recreational activities, and more. The types of facilities include nursing homes, elderly care homes, senior apartments/elderly apartments, care homes, dementia care institutions, small-scale community institutions, and retirement communities [
46]. Moreover, the study uses Python’s Requests and Beautiful Soup libraries for web scraping, adheres to legal and ethical standards, and complies with the requirements of the website’s robots.txt file.
The other data sources are as follows. The transportation network data were derived from the National 1:1,000,000 Basic Geographic Information Data (2021) from the National Geomatics Center of China (
https://www.ngcc.cn/, accessed on 12 July 2024). Information on elderly care facilities, related attributes, and Points of Interest (POI) data were sourced from the Yangtze River Delta Data Center (
http://nnu.geodata.cn/, accessed on 18 July 2024).
3.2. Spatiotemporal Pattern Evolution Analysis
To better analyze the distribution and evolution trends of regional elderly care facilities, this study analyzes by calculating the global Moran’s index and nearest neighbor index, detecting whether the current layout of elderly care facilities exhibits spatial clustering or dispersion within the study area and examining the evolution of distribution characteristics. Additionally, kernel density estimation is employed to analyze the development trends and characteristics of elderly care facilities at different stages, while the standard deviation ellipse (SDE) is used to observe their expansion direction and range trends (
Figure 2).
Global Moran’s Index
Global Moran’s I is used to analyze the overall spatial distribution trends of a given attribute within a specific region. It plays an important role in understanding the spatial distribution patterns and spatial interactions of geographic phenomena [
47]. This index reflects whether spatial data exhibit clustering or dispersion trends, as well as the strength and significance of these trends. Based on previous research [
48], this study uses the Global Moran’s I to analyze the spatial clustering of elderly care facilities and determine whether these facilities are clustered or dispersed in geographic space. Moran’s I value ranges between [−1, 1], where positive values indicate clustering, negative values indicate dispersion, and zero represents no spatial autocorrelation. The calculation formula is presented in Equation (1).
where
is the total number of observations,
and
are the attribute values of regions
and
,
is the mean of observed values,
represents the spatial weight between
and
,
is the sum of all spatial weights.
Nearest Neighbor Index
The nearest neighbor index (NNI) [
49] is a spatial statistical method commonly used to analyze the spatial distribution characteristics of point patterns (such as the distribution of buildings or facilities in a city or the distribution of plants and animals in nature). It is widely used in fields like geography, ecology, and urban planning. The NNI analyzes the distance between a specific point and its nearest neighboring point to determine whether the distribution tends toward randomness, clustering, or uniformity.
where
is the observed average distance between each point and its nearest neighbor, and
is the expected nearest neighbor distance for a randomly distributed set of points, calculated as:
where
is the number of points (sample size) in the study area,
is the area of the study region.
Kernel Density Estimation
Kernel density estimation (KDE) is a non-parametric spatial analysis method often used to analyze areas of spatial concentration [
50]. The kernel function can take various forms, such as triangular, quadrilateral, Gaussian, and Epanechnikov kernel [
51]. Referring to previous studies [
52], this paper uses the Gaussian kernel function to study the dynamic evolution trend of elderly care facility distribution. The formula is:
where
is the number of observations,
is the bandwidth,
is the kernel function,
is the distance from the estimation point to the observation point.
Standard Deviation Ellipse
The SDE [
53] is mainly used to quantify and visualize the spatial distribution patterns of geographic data. By calculating the center of geographic point data, distribution directionality, and dispersion (standard deviation), the spatial distribution is represented as an elliptical shape. This ellipse intuitively reflects the spatial range, trends, and directionality of data distribution. Referring to previous studies [
54], this method is applied to observe the spatial range and directional trends in the distribution of elderly care facilities. Assume there are
elderly care facilities with coordinates (
,
). The main calculation formulas are as follows:
3.3. Supply–Demand Equilibrium Analysis
Coupling Coordination Degree Model
The coupling coordination model [
55] is specifically designed to analyze the relationship between supply and demand systems, assessing the degree of matching and coordination between them. This model is widely used in fields such as ecological environment coordination [
56], tourism resource management [
57], and the layout of public service facilities [
58], making it an effective tool for evaluating balanced regional development. Drawing on previous research [
57,
59], this study uses the coupling coordination model to calculate the coupling coordination degree between the supply and demand of elderly care facilities across counties and districts. The specific formulas are as follows:
1. Calculation of the Comprehensive Evaluation Index for Supply and Demand:
where
represents the weight of each indicator (calculated using the entropy weight method),
is the j-th indicator of the i-th sample,
is the total number of indicators.
2. Calculation of development level, reflecting the overall situation of supply and demand:
where
and
represent the weights of supply and demand, generally taken as equal.
3. Calculation of the coupling degree, which measures the strength of the interaction between the supply and demand systems. A higher coupling degree indicates a more significant supply–demand relationship:
where
and
are the comprehensive evaluation functions of the supply and demand systems, respectively.
4. Calculation of the coupling coordination degree:
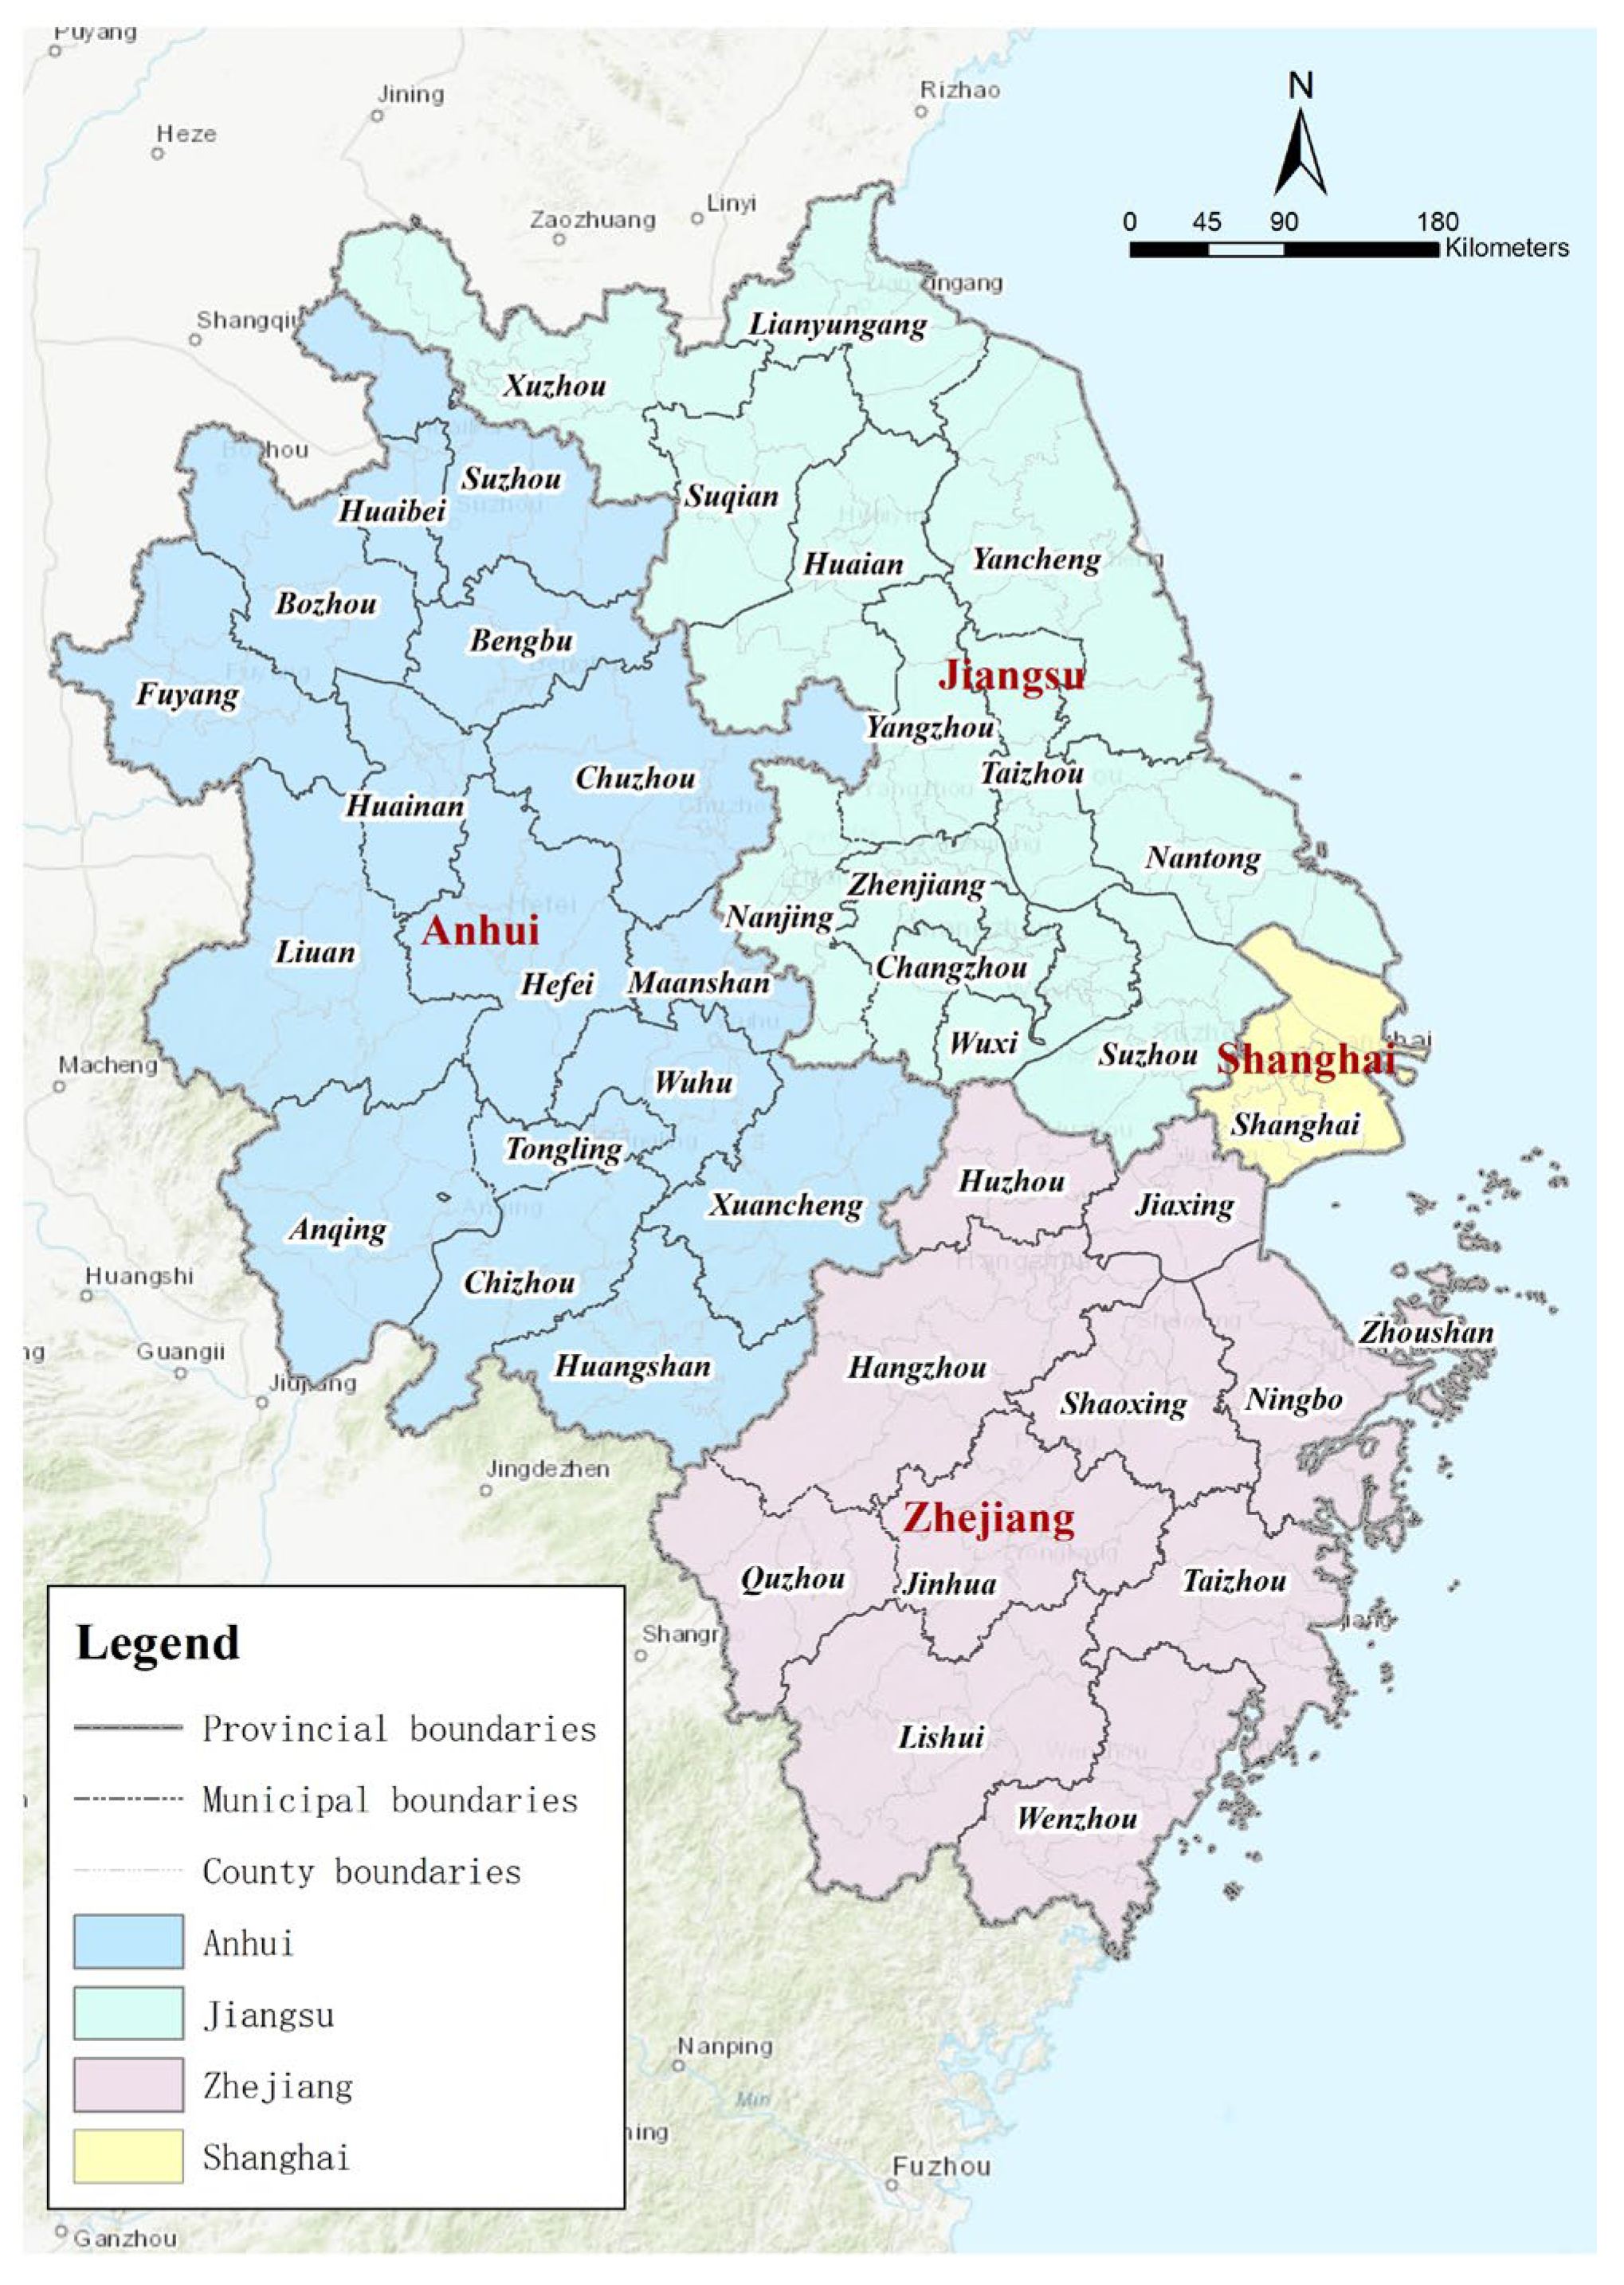
4. Study Area
The study area for this paper is located in the Yangtze River Delta (YRD) of China (
Figure 3). According to the Development Plan Outline for the Integrated Development of the YRD, approved by China’s State Council in 2019, the YRD includes Jiangsu, Zhejiang, Anhui, and Shanghai [
60]. This region consists of 41 cities, spans an area of 358,000 square kilometers, and is home to more than 200 million people. The YRD is distinguished by its advanced economy, geographical proximity, close social connections, and shared cultural heritage. As one of the most densely populated regions in China, the YRD has a significant aging population, with challenges associated with aging becoming increasingly prominent. The growing trend of population aging in recent years has resulted in a continuous rise in the demand for elderly care services, making elderly care facilities a focal point of social attention. According to the Overview of the Elderly Care Industry Development in the Yangtze River Delta Region (2021), the national strategy of YRD regional integration has encouraged the three provinces and one municipality to actively establish institutional environments conducive to the development of the elderly care industry. This strategy has fostered innovation in the sector, positioning the YRD as a leading region for elderly care industry development in China. In China’s administrative hierarchy, the highest level includes provinces and municipalities. Below this are prefecture-level cities. These cities are further divided into counties and districts. Counties are generally rural administrative units, while districts are urban subdivisions within prefecture-level cities or municipalities.
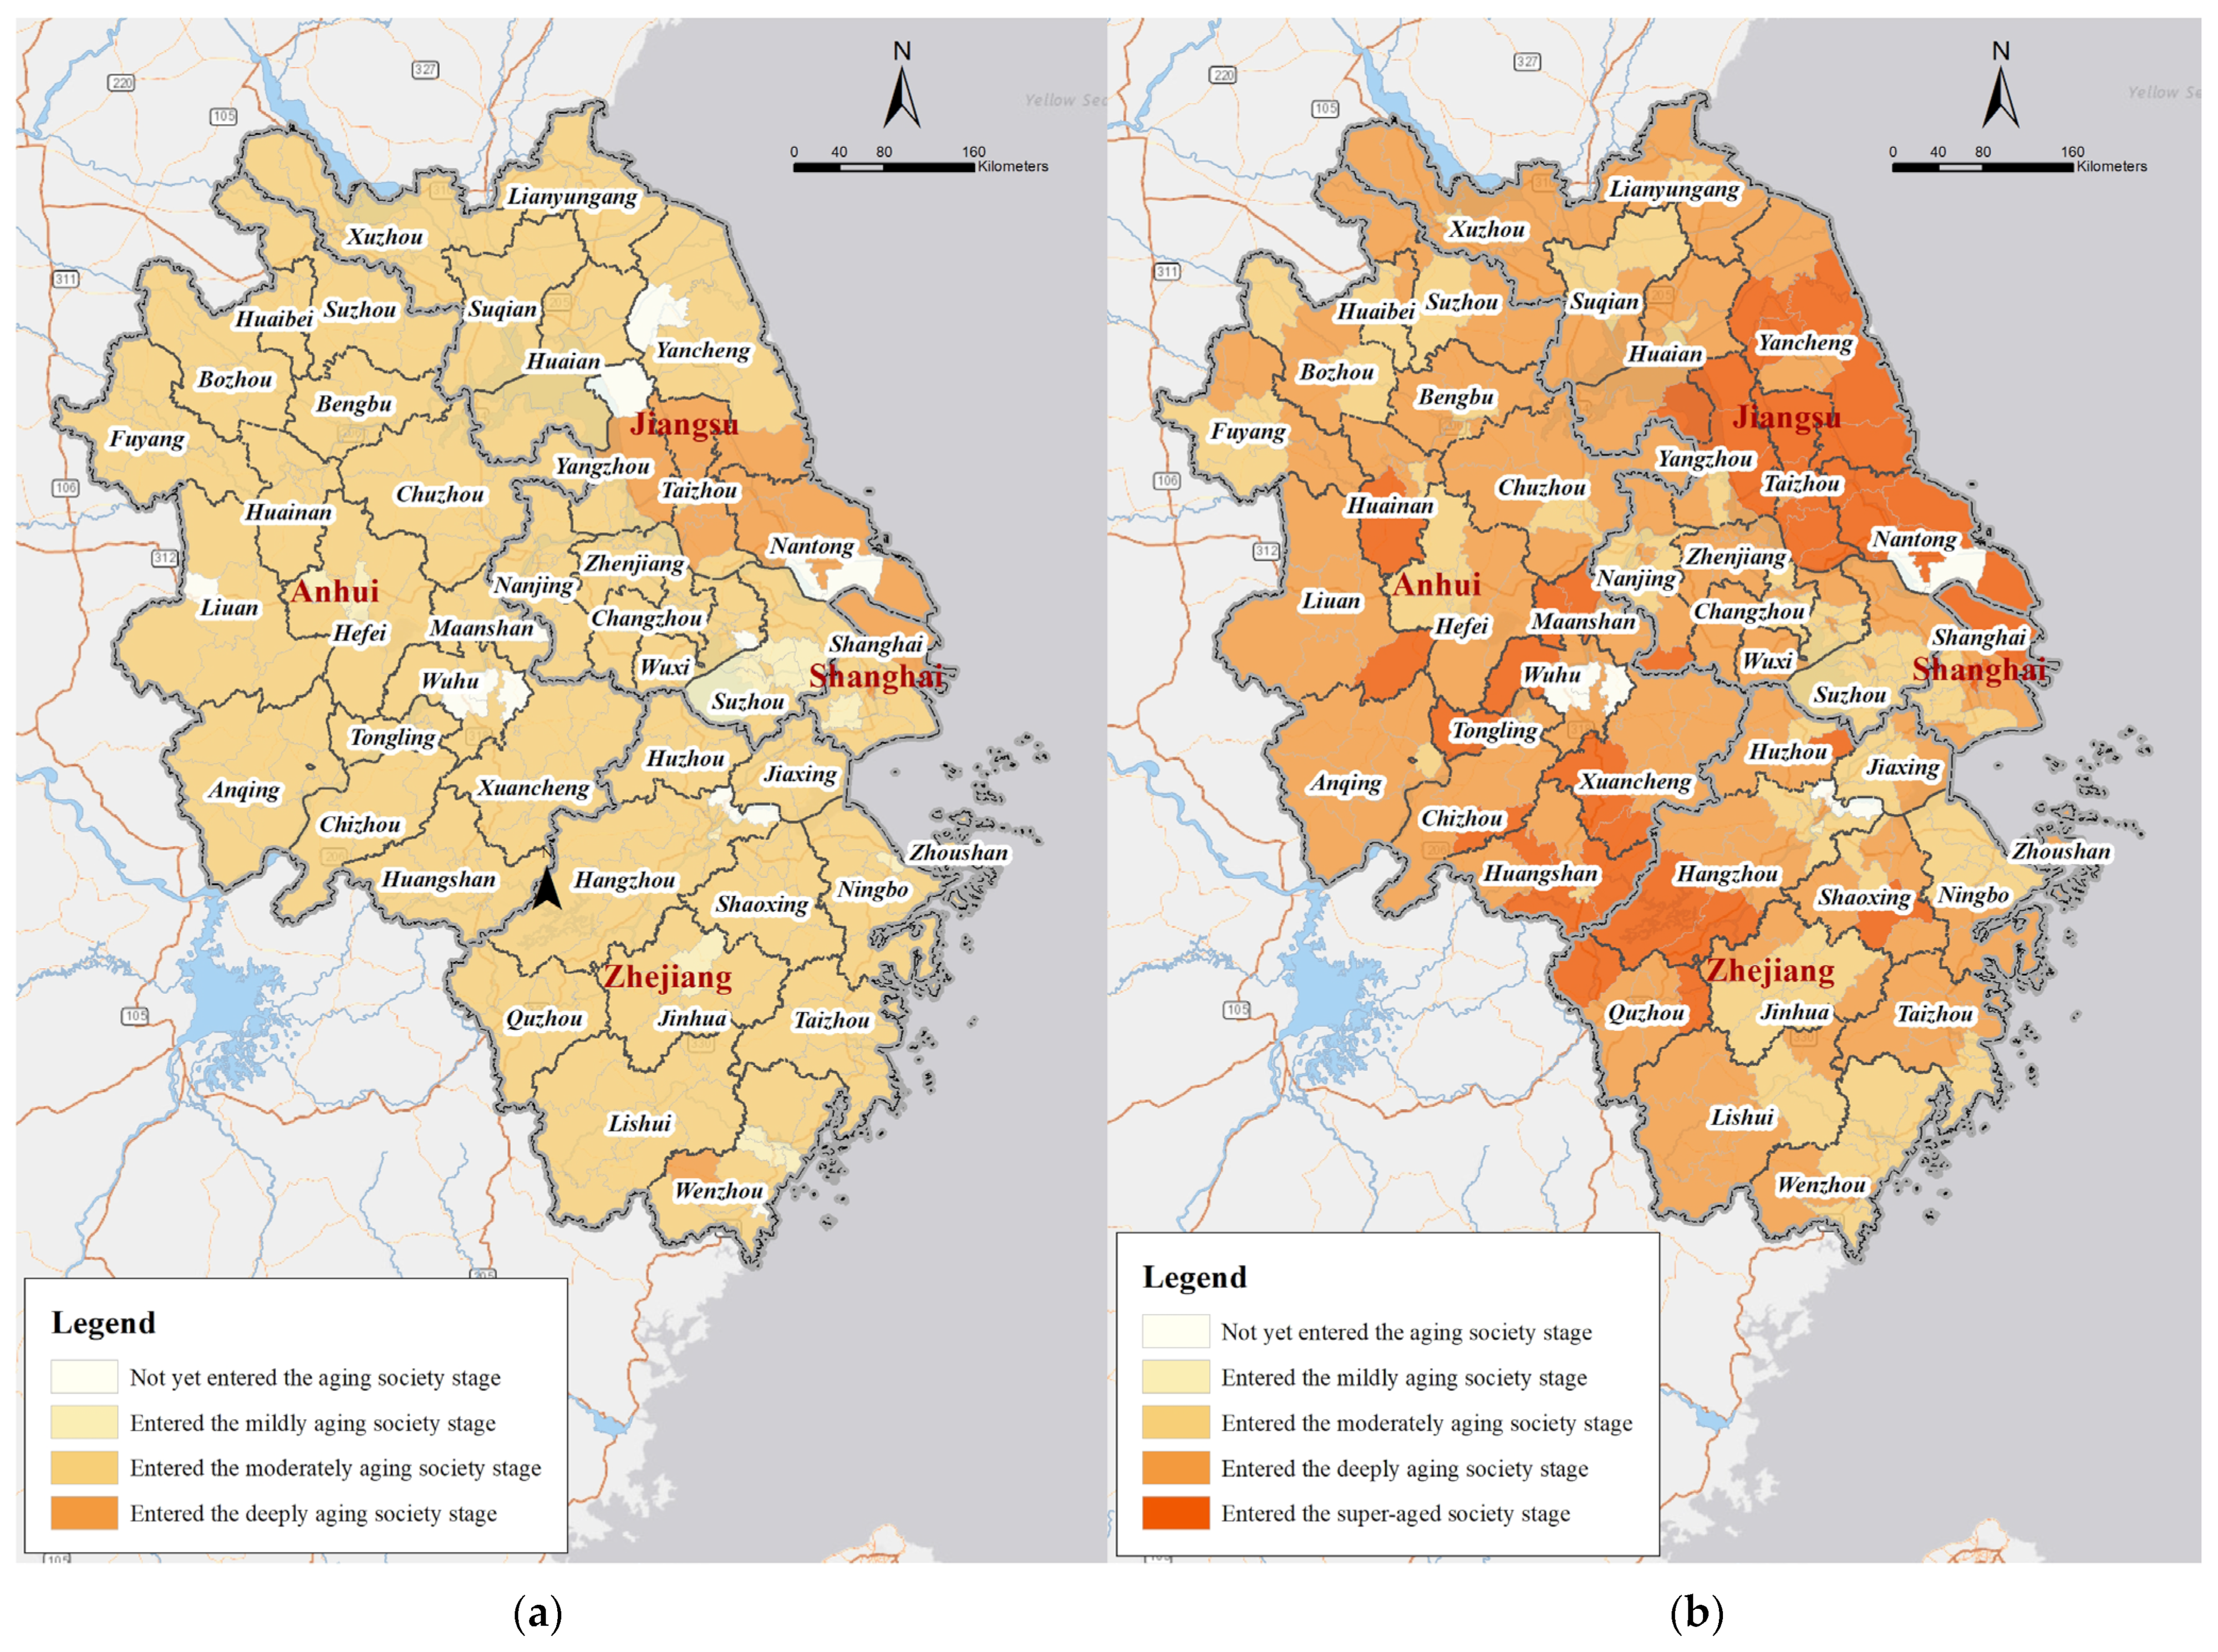
China’s population census data are systematically collected by the National Bureau of Statistics to provide comprehensive insights into the country’s demographic characteristics, structure, distribution, and socio-economic features [
61]. Since the first national census in 1953, China has conducted seven censuses, typically every ten years, with the 2000, 2010, and 2020 censuses being particularly notable. Population censuses are essential for accurately understanding the demographic status of China and addressing population-related and socio-economic challenges. They also serve as a critical data source for addressing population aging and supporting the country’s high-quality development strategy. According to the latest data from the seventh national census, the proportion of people aged 65 and older in Shanghai, Jiangsu, Zhejiang, and Anhui provinces are 16.28%, 16.20%, 13.27%, and 15.01%, respectively. Compared to the 2010 census, the proportion of people aged 65 and older increased by 6.20%, 5.32%, 3.93%, and 4.78%, respectively.
Figure 4 illustrates the aging trends in each district and county within the YRD region, categorized into five stages (
Table 1) based on the proportion of individuals aged 65 and above.
5. Analysis and Results
5.1. Analysis of the Spatial Distribution of Elderly Care Facilities in the Yangtze River Delta
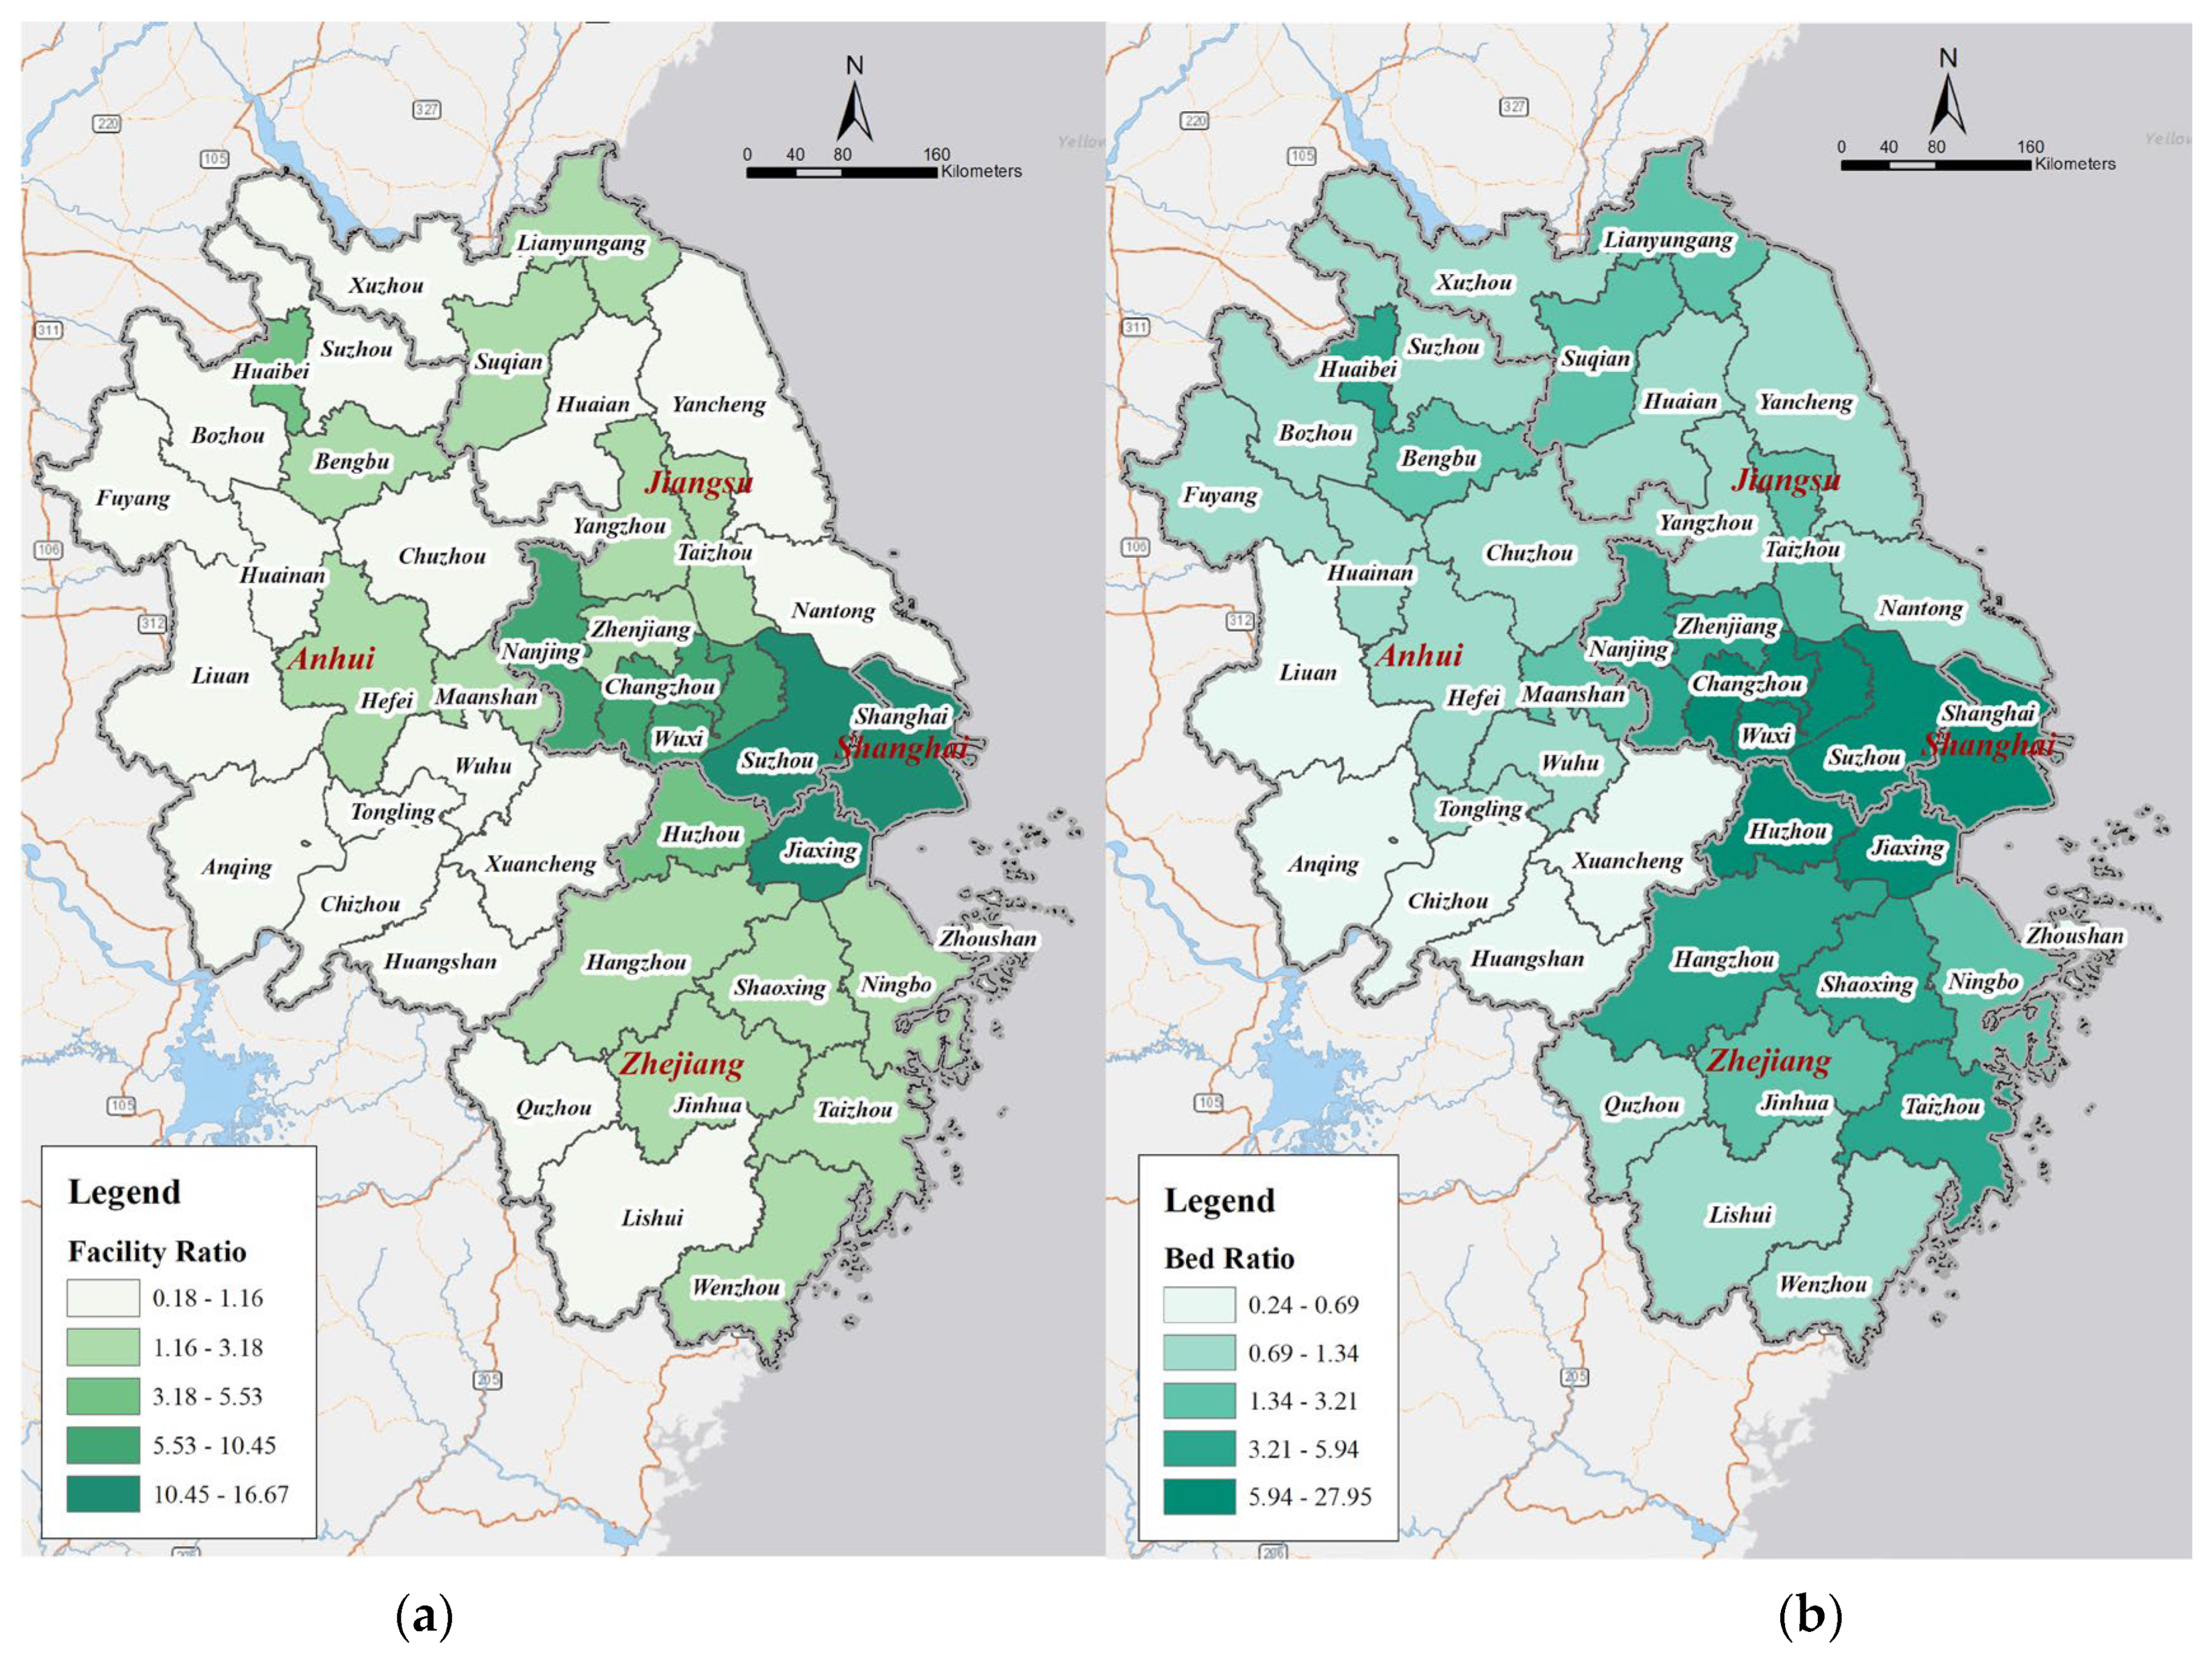
This study employs ArcGIS to conduct a comprehensive spatial visualization analysis of elderly care facilities and their bed capacities across counties in the YRD region. Utilizing the Natural Breaks (Jenks) classification method, we stratify these indicators into five distinct levels, providing a nuanced cartographic representation that reveals subtle spatial variations in elderly care infrastructure (
Figure 5). The results reveal significant inter-provincial and regional disparities in the allocation of elderly care resources. Shanghai, as the core city of the region, exhibits a marked advantage in this regard, with the highest number of facilities and bed capacities, characterized by a concentric spatial distribution where resources are more concentrated in the central urban areas, gradually decreasing toward the outer suburbs. Jiangsu Province shows a “South Strong, North Weak” pattern, with the southern cities like Suzhou, Wuxi, and Nantong having a high density of elderly care facilities and beds, while the northern cities such as Xuzhou, Suqian, and Lianyungang have fewer facilities and beds, reflecting regional developmental imbalances. This highlights the dominance of southern Jiangsu in elderly care resource allocation while also underscoring the internal disparities within the province. In Zhejiang and Anhui, elderly care resources follow a “North Strong, South Weak” distribution. In Zhejiang, northern cities such as Hangzhou and Ningbo have a high concentration of facilities and beds, while regions like Lishui and Quzhou in the west are comparatively underdeveloped, aligning with the province’s regional economic disparities. Similarly, in Anhui, the northern cities such as Suzhou, Fuyang, and Bozhou have relatively dense elderly care resources, while the southern cities like Huangshan, Chizhou, and Anqing face a scarcity of such resources.
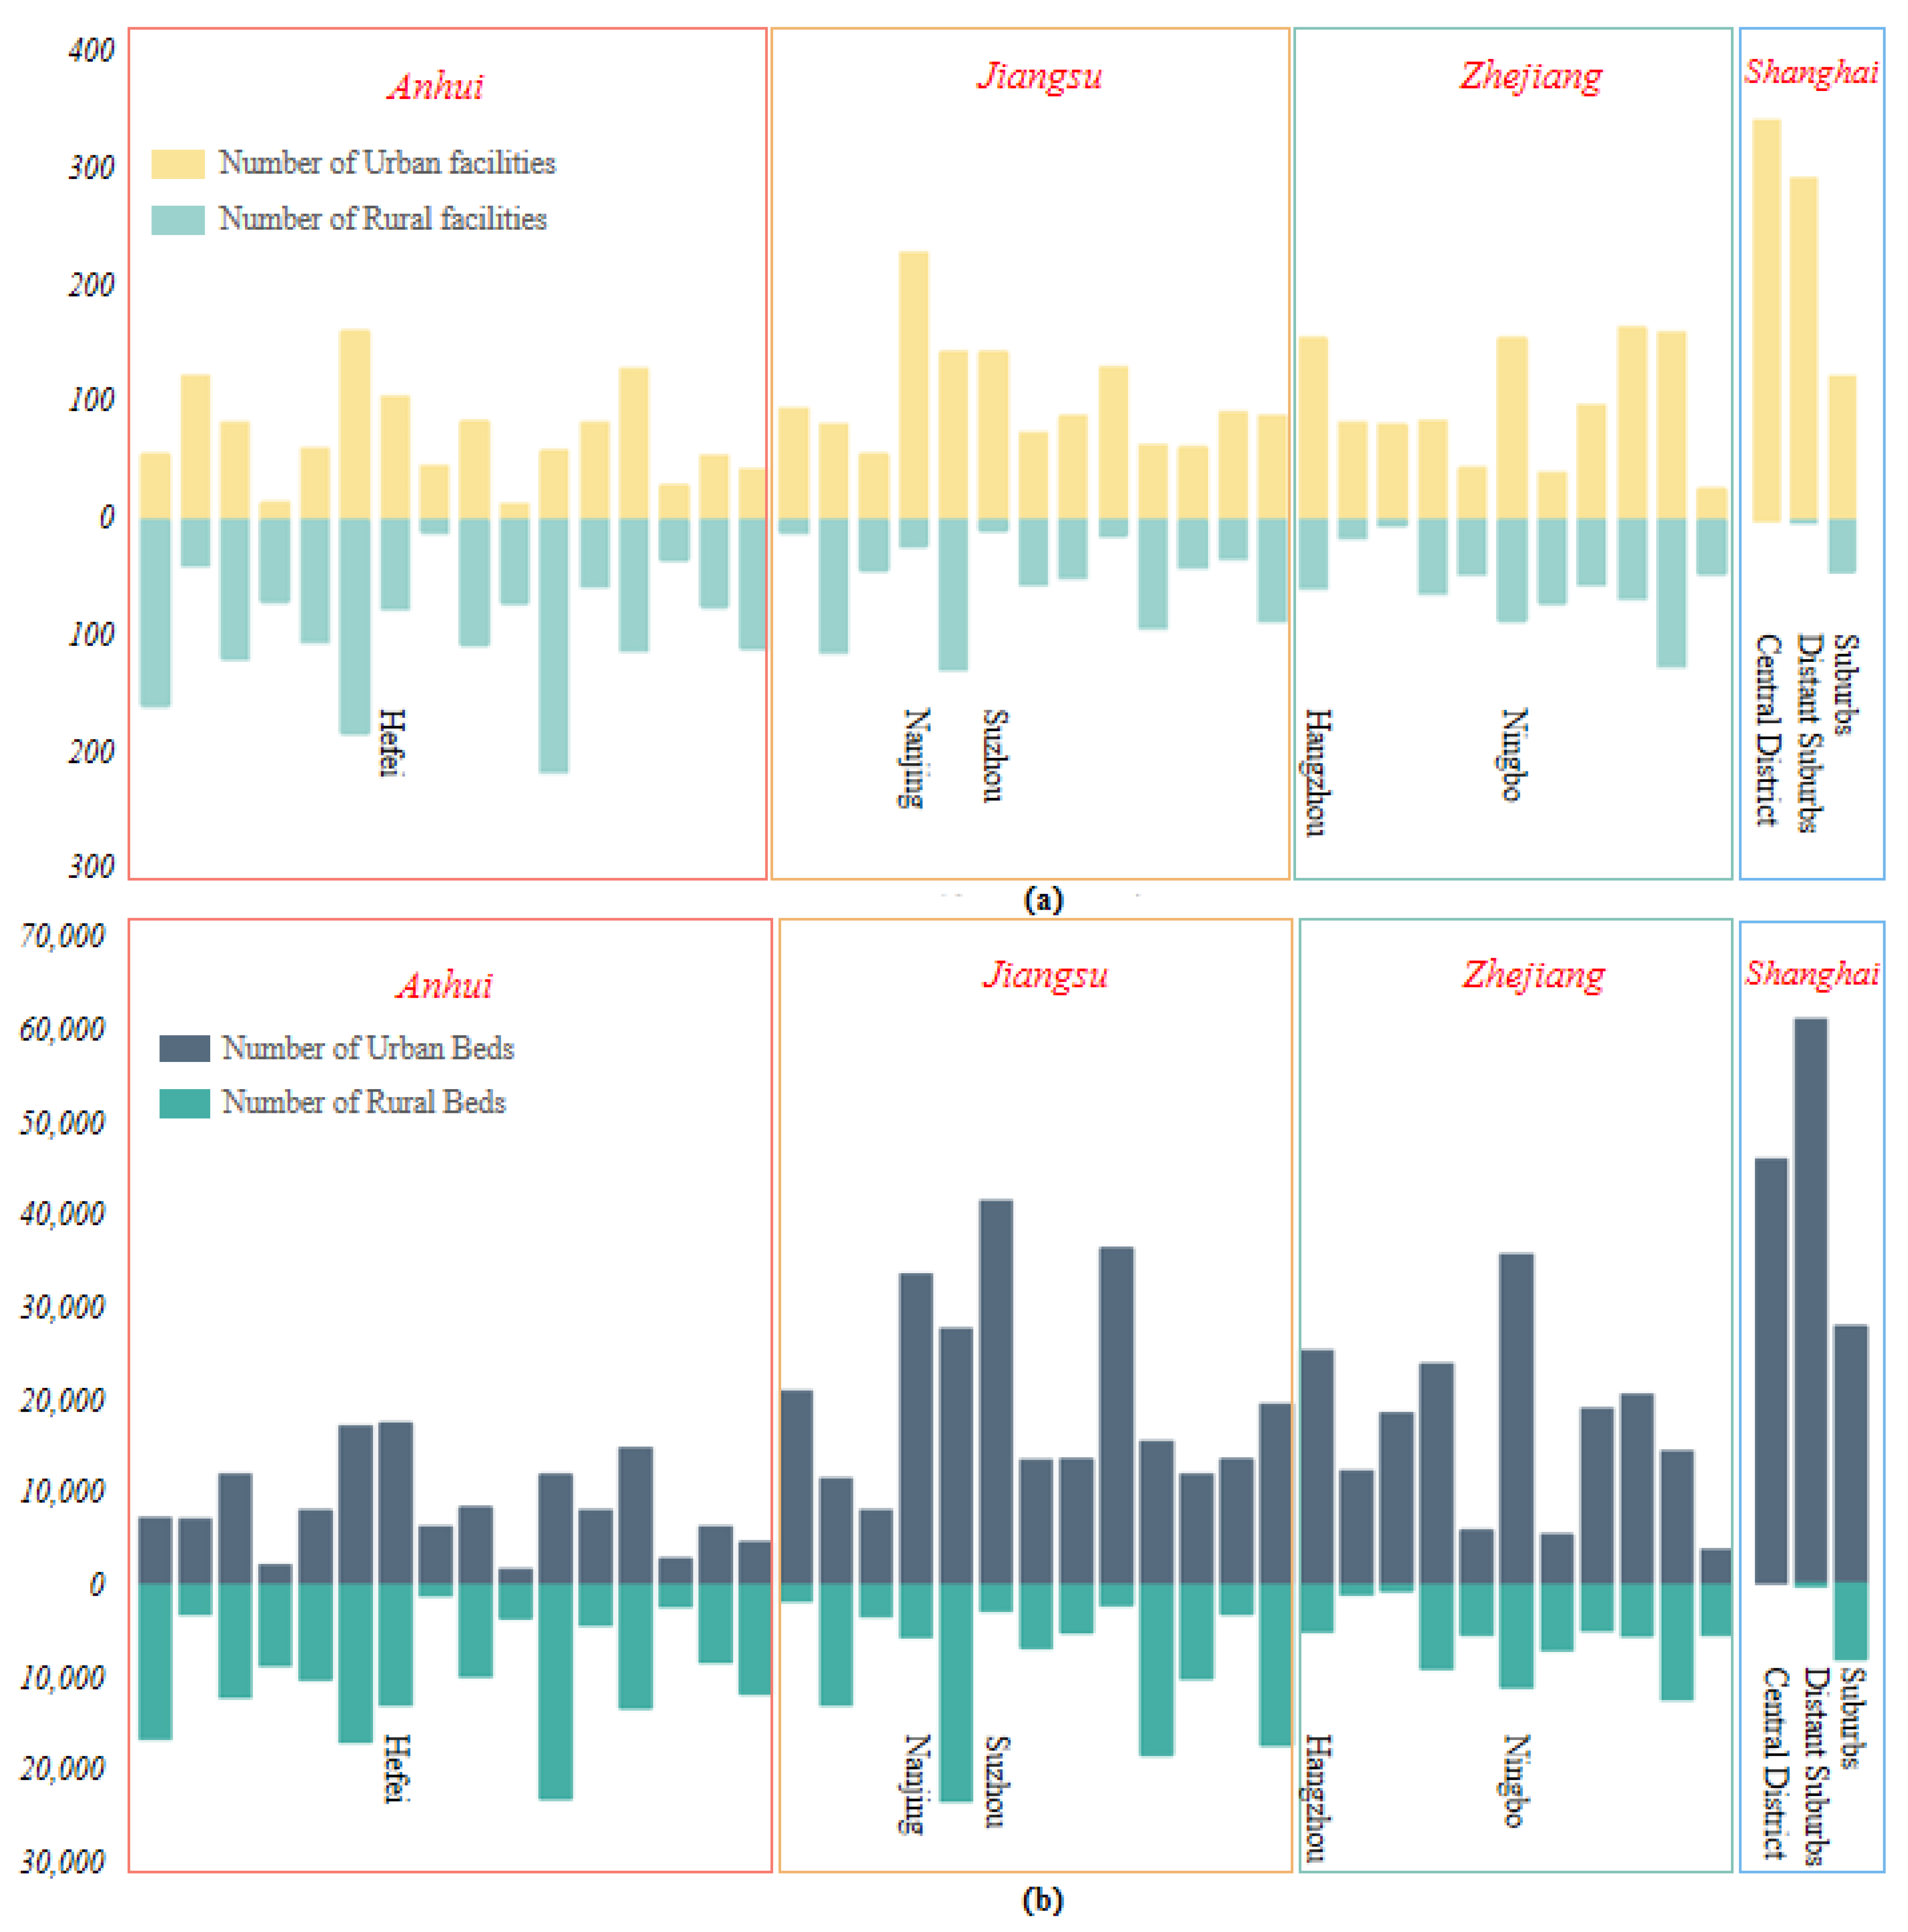
Further analysis of the spatial distribution of elderly care resources across 41 cities in the region (
Figure 6 and
Figure 7) reveals marked urban–rural disparities. In Shanghai, elderly care resources are predominantly urban-oriented, with a concentration of facilities in central and suburban urban areas where individual facility sizes are larger, while rural areas in the outer suburbs have fewer and smaller facilities. In Jiangsu, the southern region is dominated by urban facilities, while the northern region exhibits a more balanced urban–rural distribution, with smaller facilities overall. Zhejiang displays a regional gradient in resource allocation, with developed cities like Hangzhou and Ningbo leading in the number and size of elderly care facilities, while less developed areas like Lishui and Quzhou have more rural facilities, though their scale is smaller. Anhui’s distribution is notably rural-centric, with rural elderly care facilities predominating in cities such as Lu’an, Wuhu, Anqing, and Huangshan, and in some areas, rural bed numbers even exceed those in urban areas.
To further explore the spatial distribution and development characteristics of elderly care facilities in the YRD from a macro perspective, global spatial autocorrelation and nearest neighbor index analyses were conducted. As shown in
Table 2, the global Moran’s I index is 0.51, statistically significant at the 99% confidence level, indicating a spatial clustering pattern of elderly care facilities. To examine changes in clustering or dispersion over different time periods, the spatial distribution data of elderly care facilities were extracted based on the timing of three population censuses, focusing on 2000, 2010, and 2020. Nearest neighbor index analysis was performed for each of these years (
Table 3). From 2000 to 2010, the nearest neighbor index rose from 0.86 to 0.89, indicating a trend toward greater dispersion of elderly care facilities during this period. However, from 2010 to 2020, the nearest neighbor index decreased from 0.89 to 0.76, showing a shift toward greater clustering. By 2020, the nearest neighbor index further dropped to 0.76, suggesting that elderly care facilities began to concentrate significantly in certain areas.
5.2. Analysis of Spatiotemporal Evolution Trends of Elderly Care Facilities in the Yangtze River Delta
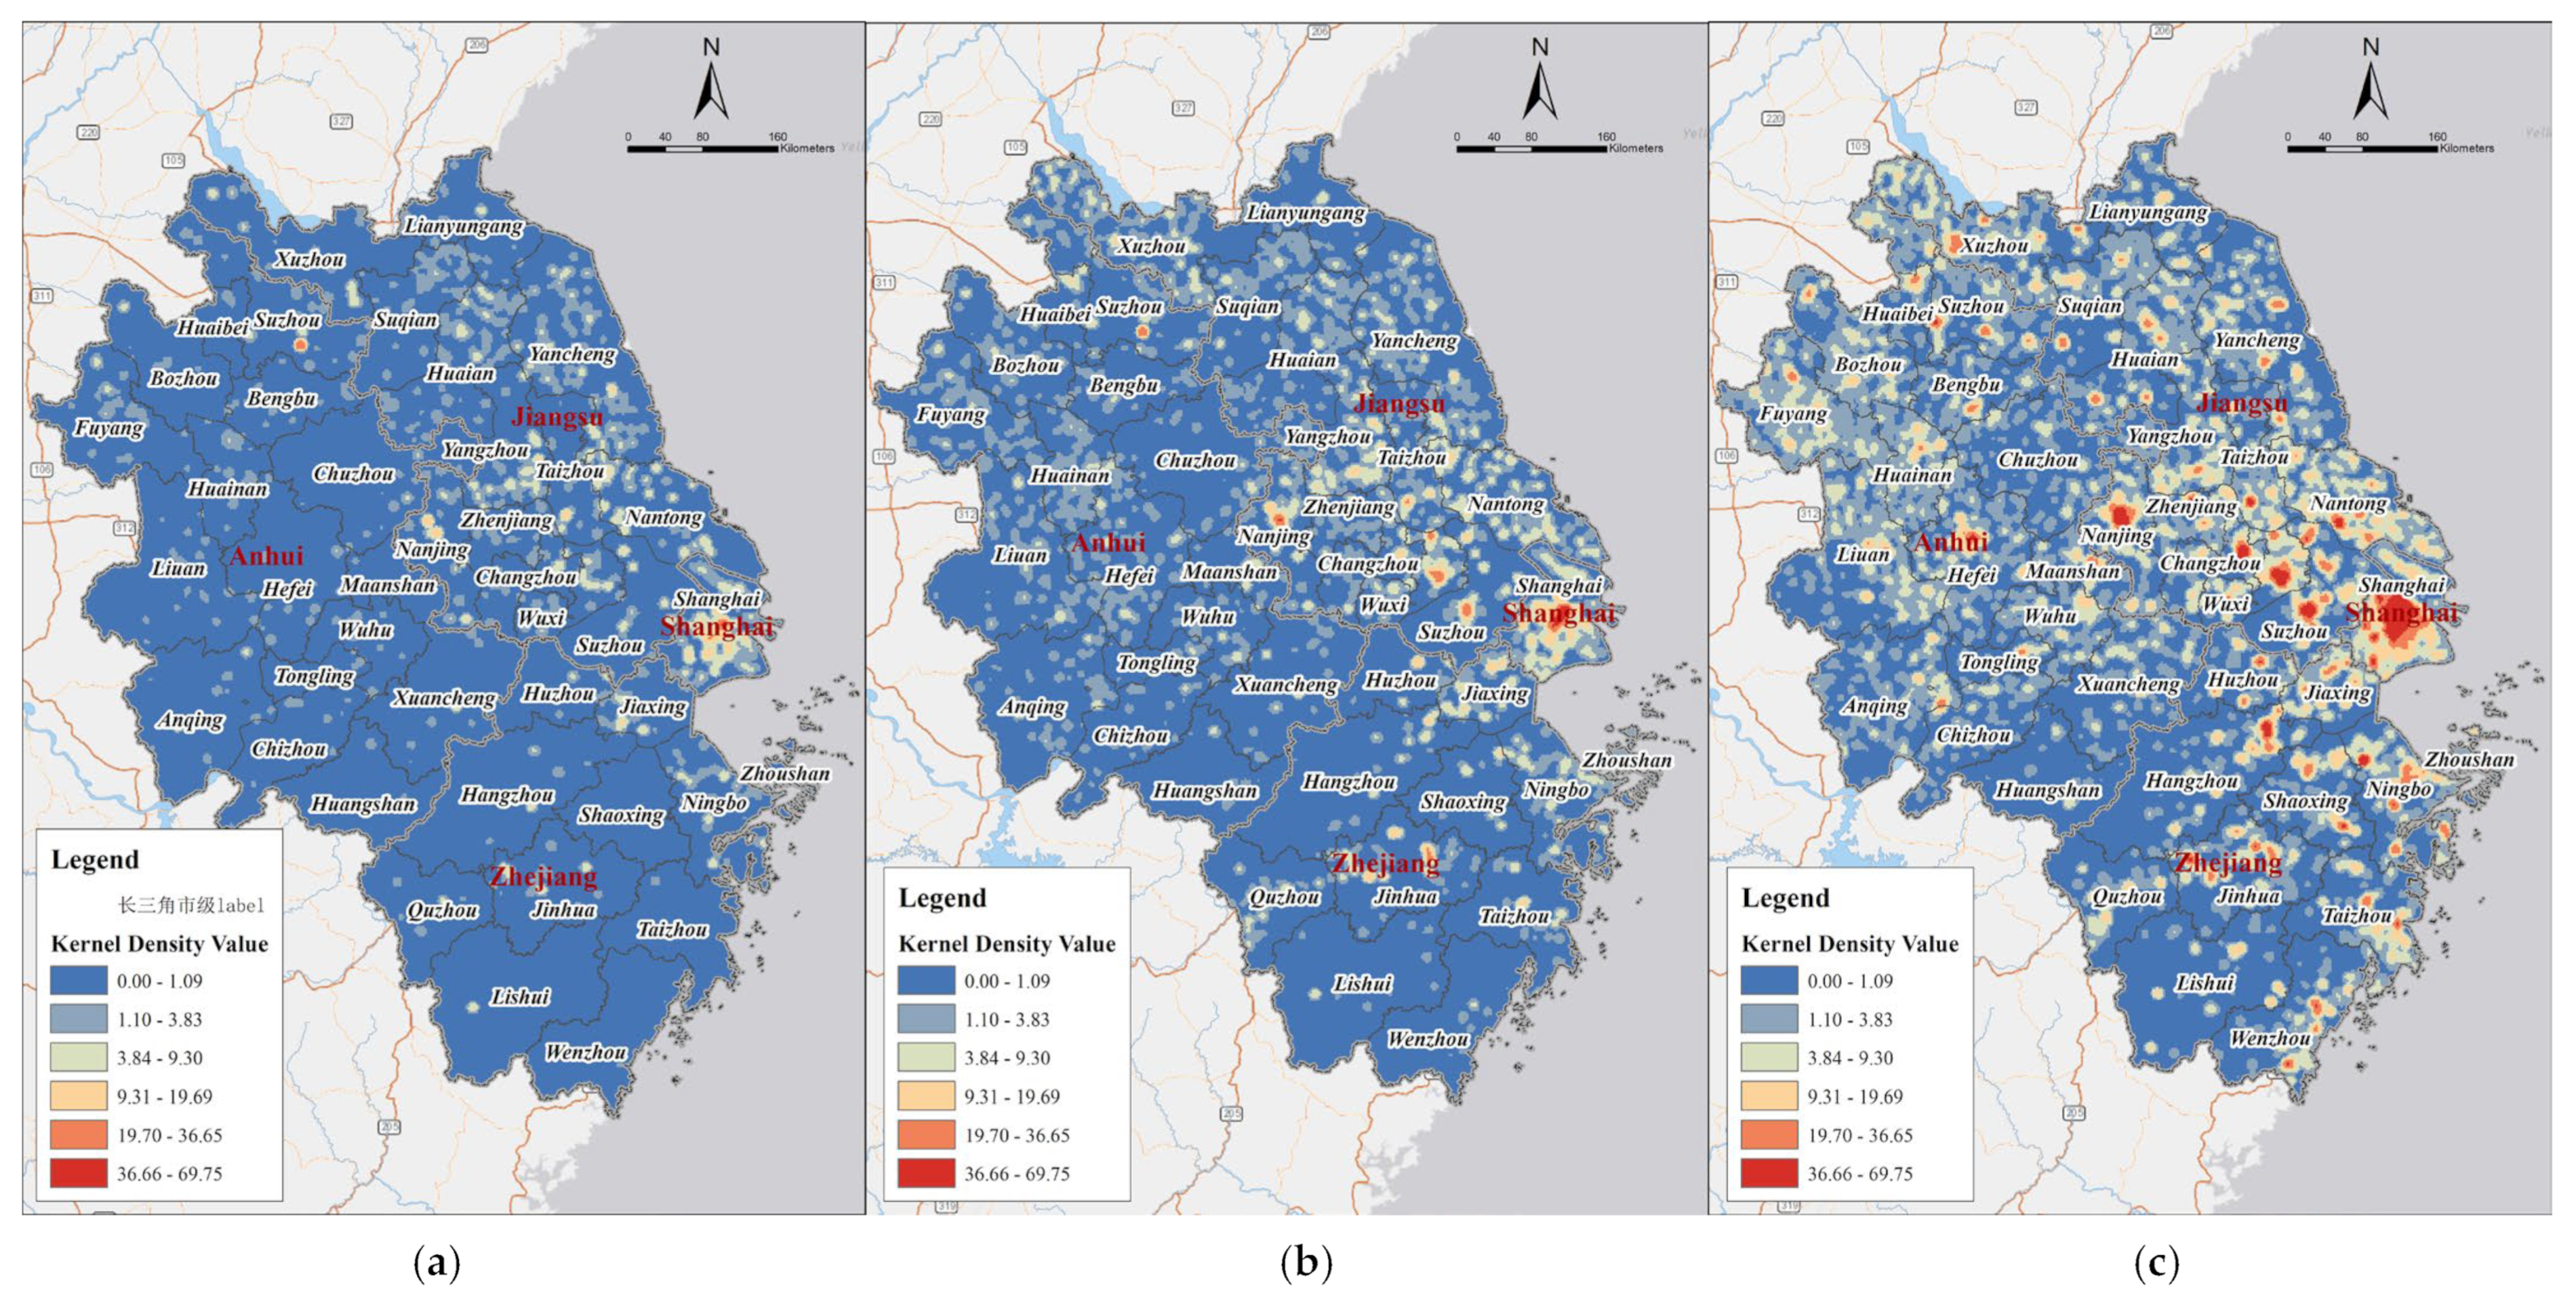
Employing a Gaussian kernel function for kernel density estimation, this study meticulously analyzes the spatiotemporal dynamics of elderly care facility development, revealing the evolution and migration of hotspots across different periods. The results of the kernel density analysis are shown in
Figure 8. From 2000 to 2020, the spatial distribution of elderly care facilities experienced a significant evolution. In 2000, high-density areas for elderly care facilities were mainly concentrated in Shanghai and its surrounding areas. By 2010, elderly care facilities began to expand to other cities in the YRD, especially in cities such as Suzhou and Nanjing, where the density increased. By 2020, the spatial distribution of elderly care facilities had further expanded, with high-density areas no longer limited to Shanghai and its surrounding cities. More cities in the YRD, such as Hefei and Nanjing (provincial capitals), as well as the Su-Xi-Chang metropolitan area (the urban agglomeration centered around the cities of Suzhou, Wuxi, and Changzhou in Jiangsu Province, China, which are closely interconnected in terms of economic, transportation, and social activities), had developed high-density zones. The distribution in northern Anhui and coastal areas in eastern Zhejiang had also increased significantly. Although the distribution improved, imbalances remained, with some remote areas, such as Huangshan and Lishui in Zhejiang, still facing insufficient elderly care services.
To better understand the expansion range and evolutionary direction of elderly care facility distribution, this study uses the standard deviation ellipse method to analyze elderly care facilities between 2000 and 2020. As shown in
Figure 9, the region has undergone a significant spatial restructuring. In terms of the evolution of the spatial center of gravity, the center point of facilities shows a clear trend of southeastward migration. From 2000, when the facility center was around the Nanjing area, it gradually moved southeastward, and by 2020, it had shifted to the Zhenjiang–Changzhou urban belt. This migration reflects the development trend of the core region of the YRD and also demonstrates how the spatial layout of elderly care facilities responds to regional socio-economic development levels. From the shape changes of the standard deviation ellipse, the range of the ellipse shows a continuous contraction from 2000 to 2020, but it has always maintained a northwest–southeast-oriented axis. The distribution range was widest in 2000, with a high elongation ratio of the ellipse, indicating a more scattered spatial distribution of elderly care facilities in the early period. The ellipse area gradually shrank over time, and by 2020, a more concentrated spatial pattern had formed. This evolutionary feature reveals that the spatial organization of elderly care facilities is shifting from a dispersed model to a more concentrated one, gradually forming an intensive layout centered around regional core cities.
The study also provides a statistical analysis of elderly care facilities of different scales over time (
Figure 10). The data show significant changes in the scale structure of elderly care facilities in the YRD between 2000 and 2020. The proportion of small-scale elderly care facilities (0–99 beds) increased from about 33% in 2000 to around 42% in 2020, a rise of 9 percentage points. The proportion of medium- and large-scale facilities (200 beds and above) remained relatively stable, maintaining around 25% over the 20-year period. Meanwhile, the proportion of medium- and small-scale facilities (100–199 beds) decreased from about 32% in 2000 to around 26% in 2020, a decline of 8 percentage points. This shift indicates a structural adjustment in the elderly care facilities in the YRD, transitioning from large institutions dominating the sector to a greater prevalence of smaller facilities.
5.3. Discussion-Coupling Coordination Degree of Supply and Demand for Elderly Care Services in the Yangtze River Delta
To investigate the balance between the supply and demand of elderly care facilities in the YRD, this study conducts a supply–demand matching analysis of these at the county level for the year 2020. The evaluation indicators were divided into two subsystems: supply and demand. Using the entropy method to determine the weight of each indicator and following principles of scientific validity, data availability, and systematization, a coupling evaluation index system for the supply and demand of elderly care services in the YRD was constructed, as shown in
Table 4. The coupling coordination model was employed to calculate the comprehensive evaluation indices of elderly care service supply and demand levels, as well as the coupling coordination index for 306 counties and districts in the YRD. This model provides a quantitative measure of the degree of coordination between the supply and demand for elderly care facilities across the region.
The spatial distribution of the comprehensive supply and demand indices for elderly care facilities in the YRD reveals significant disparities in supply–demand matching across the region (
Figure 11). Overall, the level of elderly care service supply is relatively low and unevenly distributed. High supply index areas are primarily concentrated in the northern Anhui region and a few economically developed cities and their surrounding areas along the southeastern coast, with scattered distribution in central areas. Most regions exhibit relatively low supply indices. In comparison, high-demand index areas are more concentrated, especially in the eastern coastal and certain inland regions, where the demand for elderly care services is higher and more concentrated.
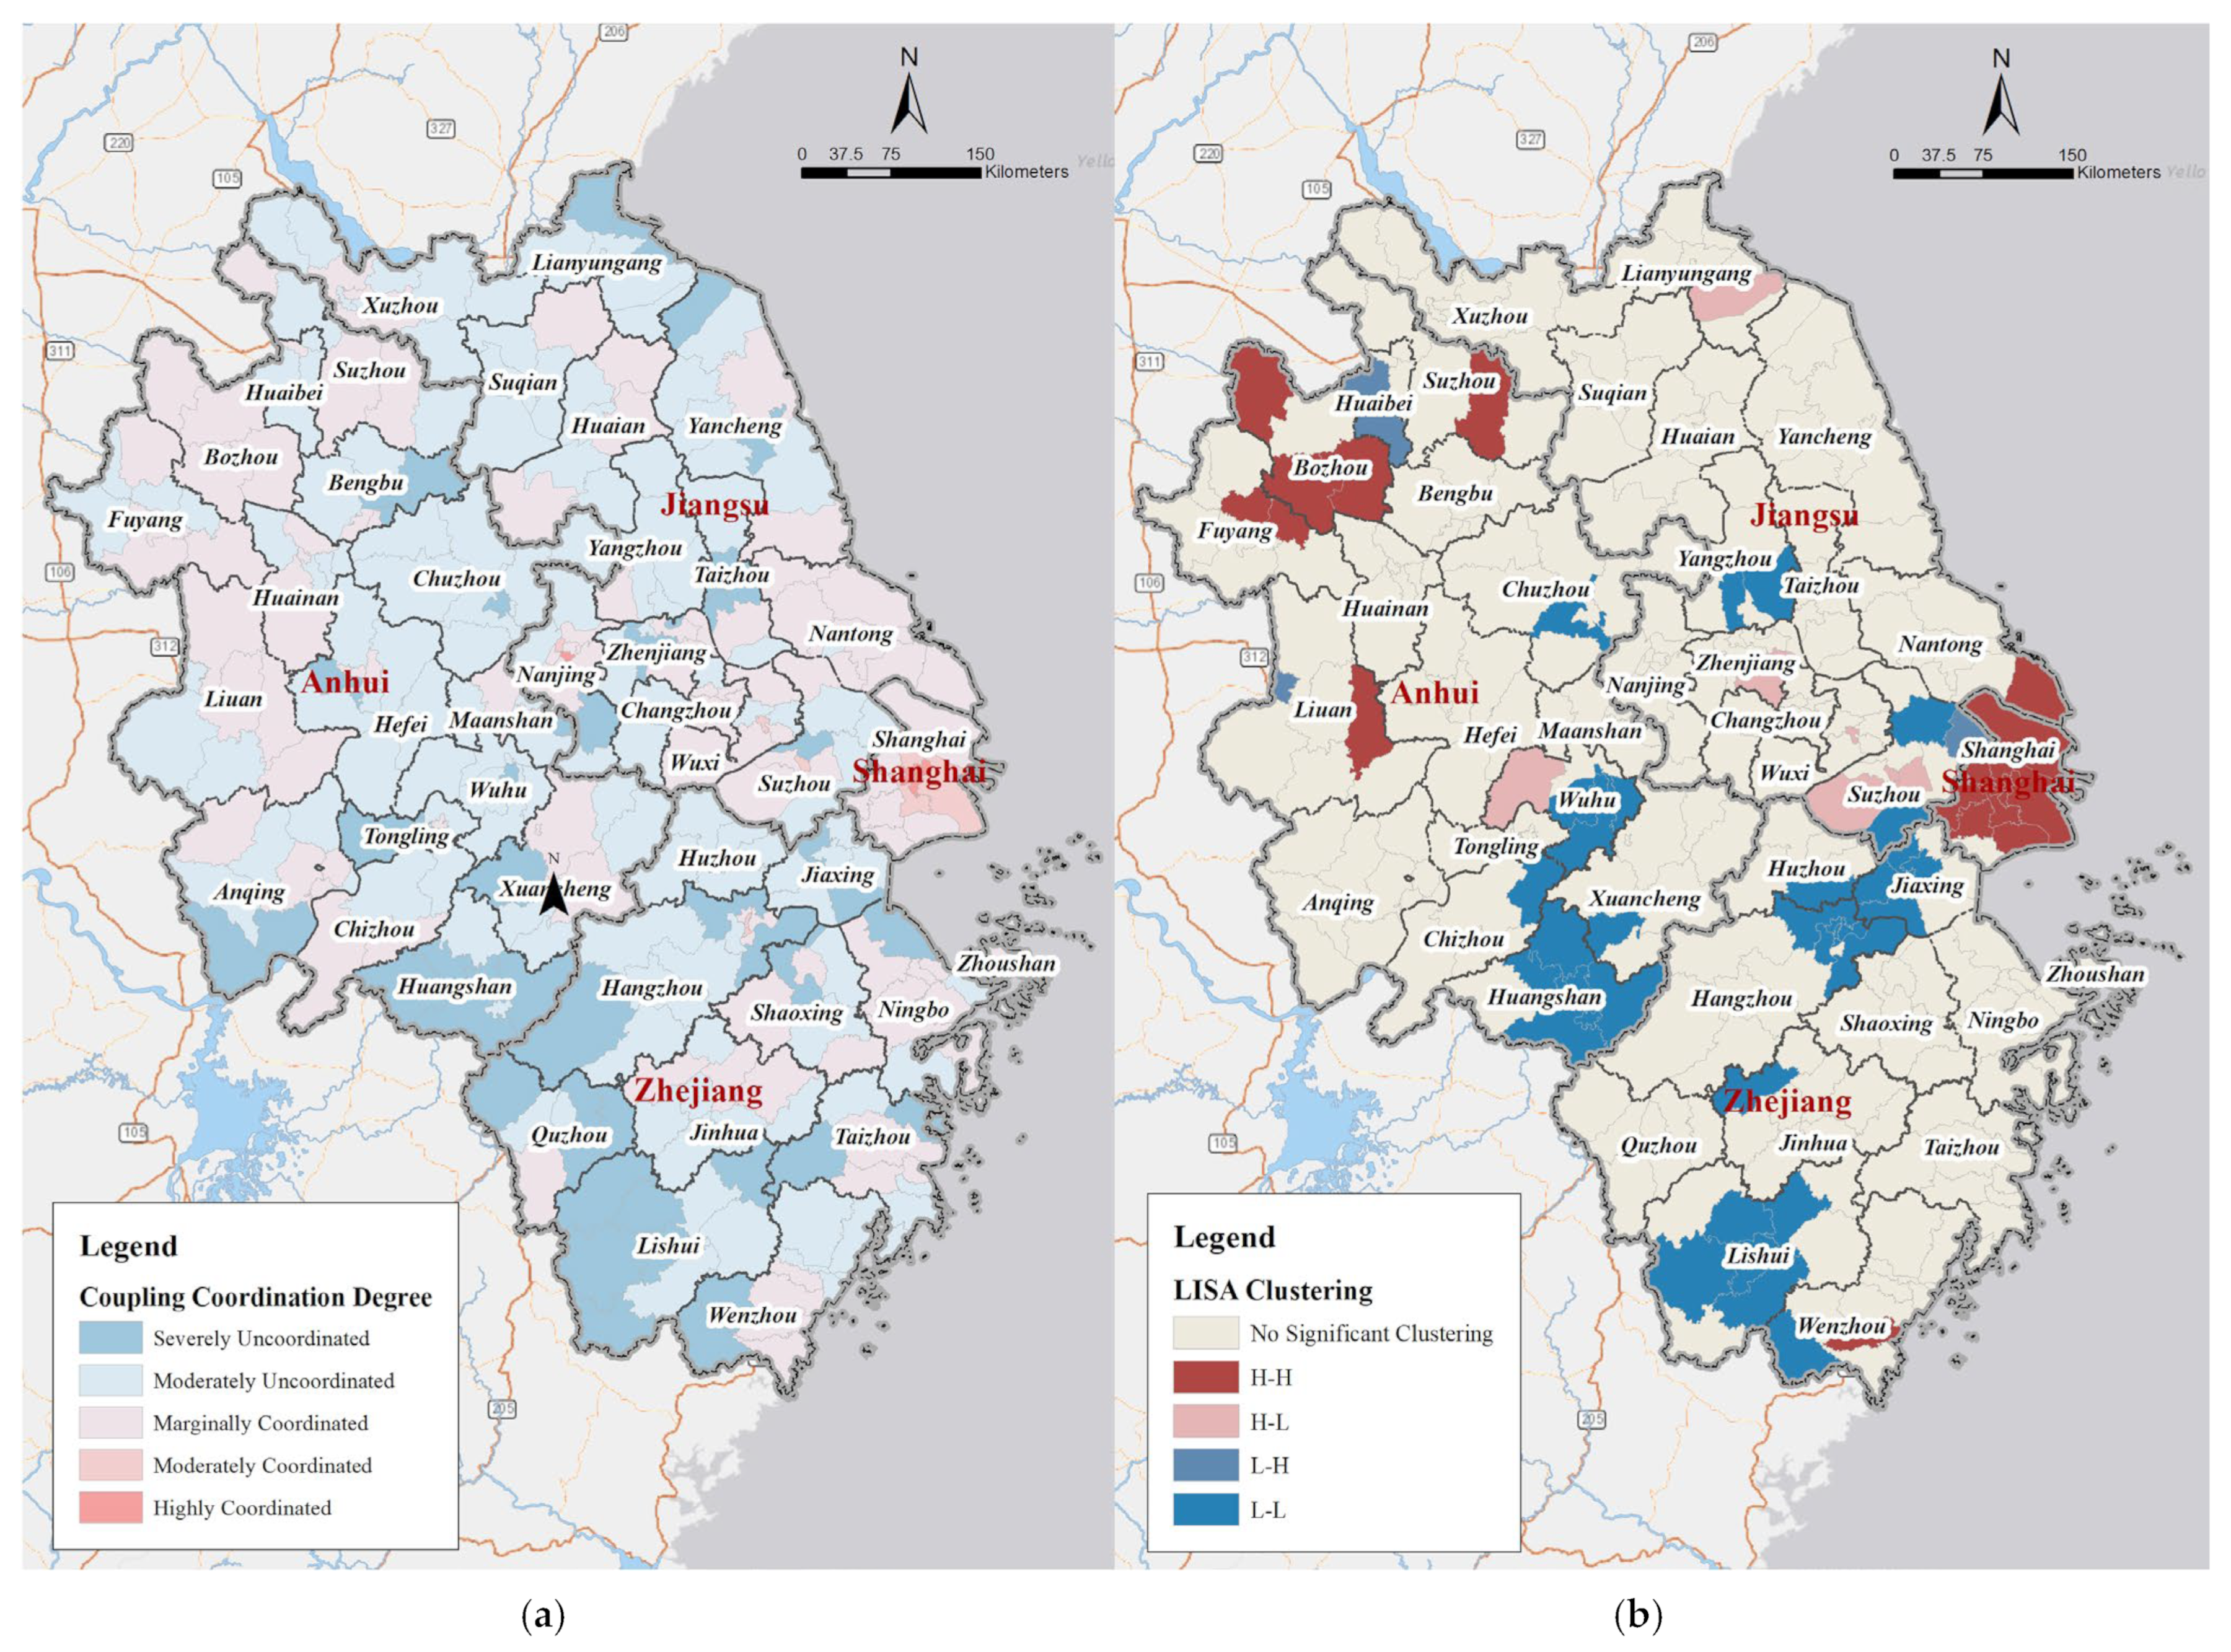
From the perspective of supply–demand coupling coordination, the overall coordination degree of elderly care facilities in the YRD is relatively low, with significant spatial variation in the types of coupling coordination between elderly care demand and facility supply (
Figure 12). Severely uncoordinated areas are concentrated in the southwestern part of the region, forming a band-like pattern, particularly in western Huangshan (Anhui) and western Lishui (Zhejiang), which are characterized by mountainous terrain and poor transportation. Moderately uncoordinated areas are more widespread, primarily located in central parts of the YRD. Marginally coordinated areas are mainly concentrated in the southeastern coastal region and the northwestern part of the YRD. The southeastern coastal areas include cities like Nantong and the Suzhou-Wuxi-ChangzhouSu-Xi-Chang metropolitan area, while the northwestern areas include southern Bozhou, southern Fuyang, and northern Lu’an. Moderately coordinated areas are relatively few and scattered, mainly found in urban districts such as Pudong, Baoshan, and Minhang in Shanghai; Gulou in Nanjing; Gusu in Suzhou; Liangxi in Wuxi; and Shangcheng and Xiacheng in Hangzhou. Highly coordinated areas are sparsely concentrated in the core region of Shanghai. Based on local autocorrelation analysis, it can be observed that both H-H and L-L clusters exhibit significant spatial agglomeration characteristics. H-H clusters are primarily concentrated in the entire Shanghai area and the core of Nanjing, forming contiguous clusters. These regions are economically developed, have convenient transportation, and exhibit a well-coordinated development of elderly care services and demand. In contrast, L-L clusters are relatively concentrated in peripheral areas with relatively underdeveloped economies, poor transportation, and a location far from the center of the YRD, such as Huangshan and Lishui. H-L (high-low) and L-H (low-high) clusters are relatively rare and do not form significant spatial clusters, mainly appearing near the H-H and L-L cluster areas.
6. Discussion
The spatial distribution of elderly care facilities in the YRD exhibits significant regional differentiation, reflecting disparities in regional economic development as well as inefficiencies in elderly care resource allocation. The metropolitan cluster centered around Shanghai demonstrates a notable concentration of elderly care resources, driven primarily by the city’s role as a national economic center, enhancing its capacity for population aggregation and service provision. However, such a concentrated distribution pattern also reveals a pronounced “Matthew Effect” [
62] in resource allocation, whereby economically developed areas attract a disproportionately high share of high-quality elderly care resources, leaving less-developed regions unable to effectively meet the growing service demands. Addressing this imbalance necessitates systematic adjustments through regional coordination strategies aimed at optimizing elderly care service allocation on a broader spatial scale. From an urban–rural perspective, the elderly care facility distribution presents a clear dual structure, with distinct development pathways emerging across provinces and cities. Shanghai and southern Jiangsu primarily feature urban-oriented elderly care facilities, indicative of a highly urbanized area’s preference toward institution-based elderly care service systems. In contrast, Anhui Province exhibits a higher proportion of rural elderly care facilities, reflecting the continuation of traditional family-based and rural collective care models. These urban–rural differences illustrate not only varying stages of socio-economic development but also underscore the diversity in elderly care provision shaped by regional cultural traditions, lifestyles, and institutional practices. Therefore, future elderly care service planning should adhere to the principle of localized adaptation, balancing urban–rural developmental stages and integrating local cultural traditions to foster differentiated and specialized care models.
From a temporal perspective, the spatial evolution of elderly care facilities in the YRD demonstrates distinct developmental phases. Between 2000 and 2010, elderly care facilities exhibited a dispersed spatial pattern, reflecting widespread initial investment and broad infrastructure establishment in elderly care service development. Between 2010 and 2020, however, the distribution shifted toward increasing centralization within urban core areas, indicating an advanced stage characterized by resource integration and efficiency enhancement. This evolutionary trajectory aligns with general developmental logic observed in public service facilities and highlights an ongoing trend towards the professionalization and scaling-up of elderly care services. Nevertheless, excessive centralization may inadvertently exacerbate regional disparities in resource redistribution, underscoring the necessity for policies to enhance service protection mechanisms targeting peripheral areas and vulnerable populations, thus balancing efficiency-driven goals with equity-oriented objectives. Additionally, shifts in the scale and structure of elderly care facilities highlight transitions in service models. The rising prominence of small-scale and community-based elderly care facilities reflects the increasing popularity of the “aging-in-place” concept and growing demand for personalized, refined elderly services. While this trend enhances accessibility and convenience for elderly residents, it also poses new challenges, such as reduced operational efficiency and increased difficulties in standardizing service quality. Consequently, future optimization of elderly care systems must carefully balance intimacy and accessibility of community-based care with operational efficiency and service standardization through targeted policy guidance and technological support.
Examining supply–demand relationships, significant regional disparities characterize the spatial match between elderly care facility supply and elderly population demand in the YRD region. High-supply areas are concentrated in economically developed southeastern coastal regions and parts of northern Anhui; the former benefit from abundant financial and human resources, while the latter enjoy preferential policy support and local investments. In contrast, demand for elderly care services is primarily concentrated in eastern coastal regions and certain inland areas with high aging populations, closely linked to demographic characteristics and urbanization processes. This study identifies three distinct patterns of spatial coordination between elderly care facility supply and demand. Severely unbalanced areas mainly occur in remote mountainous or peripheral regions with poor transportation infrastructure, highlighting the constraint of infrastructure limitations on service accessibility. Moderately unbalanced areas are widespread across the region, indicating an ongoing developmental phase of the elderly care system, with significant potential for improvement in overall coordination efficiency. Highly coordinated areas, meanwhile, are primarily centered around major urban cores like Shanghai, reflecting the institutional and systemic advantages possessed by economically advanced regions in integrating and optimizing elderly care services.
Further analysis using local spatial autocorrelation reveals significant clustering in supply–demand coordination. High-High (H-H) clusters—areas characterized by both high supply and high demand—predominantly occur in economically developed, well-equipped regions, effectively meeting diverse elderly care needs. Conversely, Low-Low (L-L) clusters—areas with both low supply and low demand—are typically found in resource-deficient regions with lower rates of aging, facing dual pressures from insufficient resource investment and gaps in service coverage. The interwoven distribution of High-Low (H-L) and Low-High (L-H) clusters illustrates transitional spatial mismatches in supply–demand relationships. These “potential mismatch zones” suggest that targeted policy interventions are necessary to enhance service efficiency and spatial equity in elderly care provision precisely.
7. Conclusions
This study, based on the perspective of information geography, takes the YRD region as the research subject. Using methods such as information collection, GIS spatial analysis, and statistical modeling, the study systematically analyzes the spatial distribution characteristics, evolution path, and supply–demand matching pattern of elderly care facilities in the YRD. It constructs a comprehensive analysis framework integrating “spatial differentiation–evolution characteristics–supply–demand coupling.” The study finds that elderly care facilities in the YRD exhibit significant regional differences and stage-specific evolution characteristics. There is a spatial mismatch and uneven coordination between supply and demand, providing empirical evidence for regional elderly care policy formulation and optimization of elderly care resource allocation. Based on the findings and theoretical framework, we propose the following conclusions and policy recommendations:
1. Uneven spatial distribution of elderly care facilities and significant regional differences: Elderly care facilities in the YRD region exhibit a clear urban–rural dual distribution, with a high density in urban areas and a shortage in suburban and rural areas. This creates a “center-periphery” spatial structure, reflecting the imbalances in resource distribution observed globally and regional development theories on resource tilt and policy selectivity. To address this spatial imbalance, we recommend implementing targeted policy interventions including (a) establishing financial incentives and subsidies specifically for rural elderly care facility development; (b) creating cross-regional elderly care service networks that enable resource sharing between urban and rural areas; and (c) developing integrated transportation systems to improve accessibility to existing facilities for rural elderly populations. Additionally, the observed shift toward smaller, community-based facilities represents a positive development that can partially mitigate the center-periphery imbalance by bringing care services closer to where elderly people live.
2. Spatial mismatch and coordination imbalance between supply and demand of elderly care facilities in the YRD: There is a significant spatial misalignment between the high-demand elderly population areas and the supply of elderly care facilities, particularly in urban–rural fringe and rural areas with severe aging. This mismatch reduces service efficiency and exacerbates accessibility issues for elderly groups. To address this challenge, we recommend implementing a multi-scale precise allocation and supply–demand matching mechanism to optimize resource distribution. Specific measures include establishing a real-time monitoring system for elderly population density and care demand to dynamically guide facility layout optimization, formulating differentiated regional elderly care policies to prioritize resource allocation in severely aging areas, and introducing intelligent demand forecasting models to enable proactive allocation of elderly care resources, thereby enhancing service accessibility and equity.
From an international perspective, the findings of this study align with the welfare geography views proposed by Pinch [
63] and Smith [
64] and the spatial justice theories of Soja [
65] and Harvey [
66], which state that the distribution of public service facilities is often positively correlated with socio-economic status, resulting in unequal spatial distribution of resources. The observed phenomenon of elderly care facility agglomeration in urban core areas is consistent with these theories, and the uneven distribution of elderly care facilities reflects inequality in spatial resource allocation. This theoretical framework helps explain why elderly care services are more advanced in economically developed areas. By drawing on the path dependency theory of Martin and Sunley [
67], we find that the spatial distribution pattern of elderly care facilities in the YRD is profoundly influenced by historical development trajectories and institutional inertia, explaining why the supply model is slow to adjust despite changes in demand.
Based on the research findings, the following recommendations are proposed to address the issues of large-scale aging and supply–demand imbalance in the Yangtze River Delta region. Firstly, it is crucial to strengthen regionally coordinated development by establishing a cross-regional elderly care resource-sharing mechanism, focusing on supporting the construction of elderly care facilities in underdeveloped areas to reduce provincial and urban–rural gaps. This could be achieved by learning from the EU’s regional balanced development policies [
68] and Australia’s cross-regional resource-sharing models [
69]. Secondly, the elderly care service system should be improved by promoting the professionalization and scaling-up of services while also actively supporting the development of small, community-based elderly care facilities and enhancing the integration of urban and rural services. This can be achieved by adopting the Nordic “continuum of care” [
70] model and Japan’s “community-inclusive care system” [
71] to build a multi-level elderly care network covering community, home, and institutional services. Finally, technology should be leveraged to enhance elderly care services by establishing a smart elderly care platform that integrates big data, the Internet of Things, and artificial intelligence. Drawing on Singapore’s “smart nation” [
72] initiatives and South Korea’s remote care systems [
73], information technology should be deeply integrated into elderly care to address spatial distribution gaps and improve both temporal and spatial accessibility of services.
As one of the six globally recognized world-class metropolitan areas, the elderly care service system and development model in the Yangtze River Delta region provide diverse solutions for global aging governance, especially suitable for densely populated and rapidly urbanizing Asian countries and developing countries undergoing economic transformation. In the future, its regional collaboration mechanism and smart elderly care model can be further promoted, offering a Chinese solution to the global challenge of aging.


