Article

Analysis of Cultivated Land Productivity in Southern China: Stability and Drivers

by
Zhihong Yu
1,2,
Yingcong Ye
1,2,*,
Yefeng Jiang
1,2,
Yuqing Liu
1,2,
Yanqing Liao
1,2,
Weifeng Li
1,2,
Lihua Kuang
1,2 and
Xi Guo
1,2,*
1
Key Laboratory of Poyang Lake Watershed Agricultural Resources and Ecology (Co-Construction by Ministry and Province), Ministry of Agriculture and Rural Affairs, Jiangxi Agricultural University, Nanchang 330045, China
2
Technology Innovation Center for Land Spatial Ecological Protection and Restoration in Great Lakes Basin, Ministry of Natural Resources (MNR), Nanchang 330045, China
*
Authors to whom correspondence should be addressed.
Land 2025, 14(4), 708; https://doi.org/10.3390/land14040708
Submission received: 18 February 2025 / Revised: 14 March 2025 / Accepted: 24 March 2025 / Published: 26 March 2025
(This article belongs to the Section Landscape Ecology)

Abstract

:
Owing to climate change and increasing resource competition, elucidating the control mechanism of cultivated land productivity stability is essential. Previous research has focused on anthropogenic or climatic factors individually, overlooking their combined effects; therefore, the “climate–anthropogenic” framework was constructed. Net primary productivity (NPP) was employed to measure the cultivated land productivity and investigate the impact of climate change and anthropogenic factors on cultivated land productivity stability in Poyang Lake from 2001 to 2022. Results revealed that NPP increased but fluctuated significantly and was higher in southern Poyang Lake than in the north. The low spatial stability distribution fluctuation area was concentrated in the periphery of Poyang Lake, the periphery and riverbank comprised the middle and high fluctuation areas, and the Ganjiang River Delta exhibited high fluctuation. Multiple linear regression analysis indicated that the stability of cultivated land productivity was positively impacted by farmland and river proximity and average patch area and that fractal dimension was positively affected and negatively impacted by low farmland proximity and average annual precipitation. Stable cultivated land production and improved utilization efficiency requires irrigation and drainage system optimization and improved adaptability to climate change. Moreover, cultivated land fragmentation should be reduced, and the resilience of cultivated land to external disturbances should be enhanced.

1. Introduction

The global population reached 8 billion in 2022 and is expected to peak at approximately 10.4 billion in 2080 [1]. This trend presents significant challenges to global food supply systems. Simultaneously, urbanization is encroaching on cultivated land, further reducing the space for food production [2]. During 2000–2030, global urban expansion is expected to lead to the conversion of 270,000–350,000 ha of cultivated land, accounting for 1.8–2.4% of the total area of global cultivated land and affecting 3.4–4.2% of the global annual crop yield. Urban expansion reduces the area of cultivated land, causes fragmentation, reduces productivity, increases production costs, and leads to low land-use efficiency [3]. In addition, extreme weather events triggered by global climate change, such as drought, floods, and strong tornadoes, increase the risk of reduced food production, posing severe threats to agricultural stability [4]. Moreover, land degradation, especially agricultural land, poses a major challenge to global food sustainability [5]. Addressing these challenges requires maintaining a stable output of the cultivated land system, and the stability of cultivated land productivity is important for cultivated land system resilience [6].
Stability is consistently the focus of an interdisciplinary complex system, especially ecosystem stability research [7,8]. Traditionally, the evaluation of cultivated land productivity stability relied on micro-scale indicators, such as soil organic matter (SOM), aggregate stability, and nitrogen (N) content, to detect the micro-feedback mechanism between soil and crops [9,10,11]. However, these data are mostly derived from sample observations and are limited by laboratory measurement conditions and temporal resolution [12]. The rapid progress of satellite remote sensing technology provides an opportunity for large-scale, high-precision, and real-time monitoring of regional productivity changes. Vegetation indices, such as the Normalized Vegetation index (NDVI), Enhanced Vegetation Index (EVI), and total primary productivity (GPP), have been widely used in environmental and ecosystem studies [13,14,15,16]. Specifically, Chen used GPP to explore ecosystem stability on a global scale, while Liu and Zhou used GPP and NDVI to characterize the productivity of drylands [17,18]. Although these vegetation indices are beneficial in natural ecosystem assessment, their application effects in artificial systems are inconsistent [19]. Therefore, remote sensing indicators used in specific fields are important. Among them, the net primary productivity (NPP), as a superior metric, quantifies the accumulation of photosynthetic organic matter per unit of space and time, effectively avoiding the interference of agricultural structure adjustment, crop variety change, and other factors on crop yield measurement, making it a characteristic index of cultivated land productivity [20].
Improving agricultural productivity and its interannual stability is critical to long-term global food security and environmental sustainability; however, climate change is exacerbating this challenge. While rising temperatures may extend the growing season and promote the northward spread of crops, they may also increase pest and disease occurrences and the threat to food security posed by extreme weather [21]. Rainfall shortages and droughts directly damage food supplies and increase the instability of agricultural production [22]. Moreover, anthropogenic factors, such as land occupation and fragmentation, landscape pattern change, and increased human activity intensity, significantly impact cultivated land productivity [23,24]. Fragmentation, boundary irregularity, and poor spatial connectivity threaten the stability of cultivated land productivity [25]. As a quantitative tool to reflect landscape characteristics, the landscape pattern index is closely related to the stability of cultivated land productivity [26]. However, most studies have focused on climatic or anthropogenic factors individually, and their combined impact remains unclear.
China is the second-most populous country globally, with 1.42 billion people, and ensuring China’s food security is imperative. Since the founding of the People’s Republic of China, remarkable achievements have been made in protecting cultivated land. However, the cultivated land system still faces multiple challenges. Fragmentation caused by urban expansion has become a significant problem, particularly in the Bohai Rim Economic Zone and the Yangtze River Delta [27,28], restricting the efficient use of cultivated land. The continuous reduction in cultivated land and intensification of fragmentation weaken the ecosystem service function and promote inefficient cultivated land use, threatening national food production [29,30]. Simultaneously, the spatiotemporal pattern changes in cultivated land utilization driven by urban expansion threaten environmental sustainability [31]. In addition, non-grain cultivation trends have emerged in China under the influence of topography, irrigation, and drainage conditions; cultivation distance; rural labour shortages; and other factors [32]. Therefore, a long-term analysis of the relationship between cultivated land and other land-use types, focusing on cultivated land with stable long-term grain cultivation, is required to evaluate the stability of cultivated land productivity.
The Poyang Lake region in Southern China is a key grain production area. However, rapid population growth and urbanization, coupled with the impact of extreme climate change, pose challenges to the productivity of cultivated land. Therefore, this study aimed to (1) analyze the spatiotemporal variation characteristics of cultivated land and NPP from 2001 to 2022; (2) explore the spatial distribution of cultivated land productivity stability from 2001 to 2022; and (3) identify the factors affecting the stability of cultivated land productivity. Evaluating the stability of cultivated land productivity in Poyang Lake has broad significance for ensuring national food security and the sustainable use of cultivated land resources [33].

2. Materials and Methods

2.1. Study Area

The Poyang Lake region, located in northern Jiangxi Province and on the southern bank of the junction of the middle and lower reaches of the Yangtze River, covers Pengze, Hukou, Duchang, Chaisang, Lushan, Ruichang, De’an, Yongxiu, Poyang, Leping, Wannian, Yugan, Yujiang, Linchuan, Dongxiang, Fengcheng, Zhangshu, Gao’an, Anyi, and Jinxian counties and the urban areas of Nanchang, Jiujiang, and Fuzhou (Figure 1). The geographical coordinates are from 115°01′ E to 117°34′ E and 27°32′ N to 30°06′ N. It is characterized by a subtropical humid monsoon climate with superior hydrothermal conditions.
The terrain of the Poyang Lake region presents a “semi-encircled” pattern of high in the northwest and low in the southeast. Mountains, low hills, and plains are intertwined and dominate the landforms, and the overall terrain is relatively low and flat. The west and north of the region are surrounded by the Lushan and Meiling Mountains, among others. The Lushan Mountains are the highest point in the region at 1474 m above sea level. The central lakeside zone is flat, with the Poyang Lake water system as the core. The surface cover mainly includes paddy soil, red soil, and river alluvium. The vegetation is dominated by subtropical evergreen broad-leaved forests, which are mainly distributed in the upper reaches of the river, accounting for 24% of the total area. The Ganjiang, Fuhe, Xiuhe, Xinjiang, and Raohe Rivers flow into Poyang Lake, making it the largest freshwater lake in China and forming a water network zone with numerous lakes and traversed rivers.
The Poyang Lake region is a commodity grain production base in China. It is the largest agricultural production base in Jiangxi Province, particularly for grain, cotton, oil, and pigs, making it one of the most economically developed regions in the province. Rice dominates, accounting for >50% of the total cultivated area of crops in Jiangxi Province. However, although the agricultural production conditions in this region are superior, investment in agricultural production is insufficient, resulting in low grain productivity.

2.2. Data Sources and Processing

Vegetation NPP data were sourced from MOD17A3 data of NASA EOS/MODIS from 2001 to 2022 (https://lpdaac.usgs.gov, 8 October 2024), with a spatial resolution of 500 m and a temporal resolution of 1 year. Annual average precipitation and temperature data were sourced from the National Earth System Science Data Center (http://www.geodata.cn, 20 October 2024), with a spatial resolution of 1000 m. Land-use data were sourced from the National Glacier, Frozen Soil, and Desert Science Data Center (http://www.ncdc.ac.cn, 5 November 2024), with a resolution of 30 m.
Data processing and downloading was based on the Google Earth Engine (GEE) remote sensing cloud platform. The MODIS/061/MYD17A3HGF dataset of GEE was used to extract NPP data of Poyang Lake region during 2001–2022 at a resolution of 30 m and a geographical coordinate system of WGS1984. MODIS NPP and land-use data of the same period were spatially overlaid. Pure cultivated land pixels were extracted using a cultivated land classification code, and mixed pixels and non-cultivated land areas were excluded to construct the NPP time series dataset of cultivated land from 2001 to 2022. To verify the ability of NPP data to characterize cultivated land productivity, a trend consistency test was conducted using the grain yield data of the surface cultivated land productivity monitoring station. The Pearson correlation coefficient was used to evaluate the correlation between NPP and production, confirming that NPP was a reliable proxy indicator of productivity.

2.3. Research Methodology

2.3.1. Theil–Sen Median Trend Analysis and Mann–Kendall Significance Test

Theil–Sen median trend analysis is a non-parametric method that requires no specific sample distribution and is unaffected by outliers. It is often used to analyze the trend in long-term series changes and is calculated as follows:
ρ = M e d i a n x j x i j i
where ρ is the median value of cultivated land NPP to slope. When ρ > 0, the vegetation change increases, and when ρ < 0, the vegetation change decreases. xj and xi are the values of years j and i in the cultivated land NPP time series, respectively, and the median was used [34]. The calculation was applied using the zyp package (version 0.1-1) in R language (version 4.3.1), called the zyp.sen function for median slope estimation.
The Mann–Kendall significance test is a non-parametric method which supplements Theil–Sen Median slope estimation to test the significance of a time series. Considering that long-term series data may exhibit autocorrelations (such as lag effects caused by interannual climate fluctuations), we adopted the variance correction method proposed by Hamed and Rao to reduce the risk of Type I errors by adjusting the effective sample size [35]. The modified test was implemented in R language using the Man–Kendall function of the Kendall package (version 2.2.1), and the effective sample size was calculated with autocorrelation correction. The MK significance test formula is:
S = i = 1 n 1 j = i + 1 n sgn x j x i
where xi and xj are the observed values corresponding to time series i and j, respectively, and i < j, sgn() is a symbolic function.

2.3.2. Stability Analysis of Cultivated Land Productivity

The coefficient of variation (CV) was used as a measurement method:
C V = 1 n 1 i = 1 n N P P i N P P 2 / N P P
where CV is the coefficient of variation in NPP, NPPi is the NPP value for the ith year, NPP is the mean NPP over 22 years, and n is the corresponding number of research years. The smaller the CV, the stronger its stability.

2.3.3. Cultivated Land Landscape Pattern Metrics

The terrain of Poyang Lake region is complex, which affects the utilization efficiency of cultivated land. To evaluate cultivated land use, quantitative index analysis is essential. Patch size (AREA_MN) is a key measure of cultivated land fragmentation, and a large cultivated land area is conducive to structural stability, mechanization, and improving productivity [36]. The scattered cultivated land in hilly areas restricts the mechanization and scale of agriculture. Fractal dimension (FRACT) was introduced to quantify the complexity of cultivated patches. The higher the value, the more complex the shape, which hindered mechanization and scale [37]. The nearest neighbour distance (ENN) reflects the patch isolation degree, reveals the degree of cultivated land intensification, and facilitates cultivated land planning [25]. By comprehensively using these indicators, the present situation of cultivated land utilization in Poyang Lake region was comprehensively analyzed. The raster data of cultivated land were divided by county, and the landscape pattern index was calculated using Fragstats 4.2 software [38]. The specific formula and description are shown in Table S1.

2.3.4. Analysis of Factors Influencing the Stability of Cultivated Land Productivity

Multiple linear regression is a statistical method used to study the relationship between dependent and multiple independent variables. The method assumes that the dependent variable (usually expressed as Y) and the independent variable (usually expressed as X1, X2, …) have a linear relationship, where the dependent variable can be expressed as a linear combination of the independent variable plus the constant and error terms [39]. Mean precipitation (MAP), mean air temperature (MAT), field road distance, average patch size (AREA-MN), distance between the field and the road (field-road distance), distance between the field and the river (field-river distance), nearest neighbour distance (ENN), and fractal dimension (FRACT) were considered as factors that may influence cultivated land productivity. Using multiple linear regression, the relationship between cultivated land area and influencing factors was established as follows:
Y = a 0 + a 1 X 1 + a 2 X 2 + a 3 X 3 + a 4 X 4 + a 5 X 5 + a 6 X 6

2.3.5. Methodological Flowchart for the Stability of Cultivated Land Productivity

The flowchart of the proposed method is shown in Figure 2, which systematically outlines the entire research process for assessing the stability of cultivated land productivity and its influencing factors, from data collection to results analysis, providing an intuitive and comprehensive overview of the research path.

3. Results

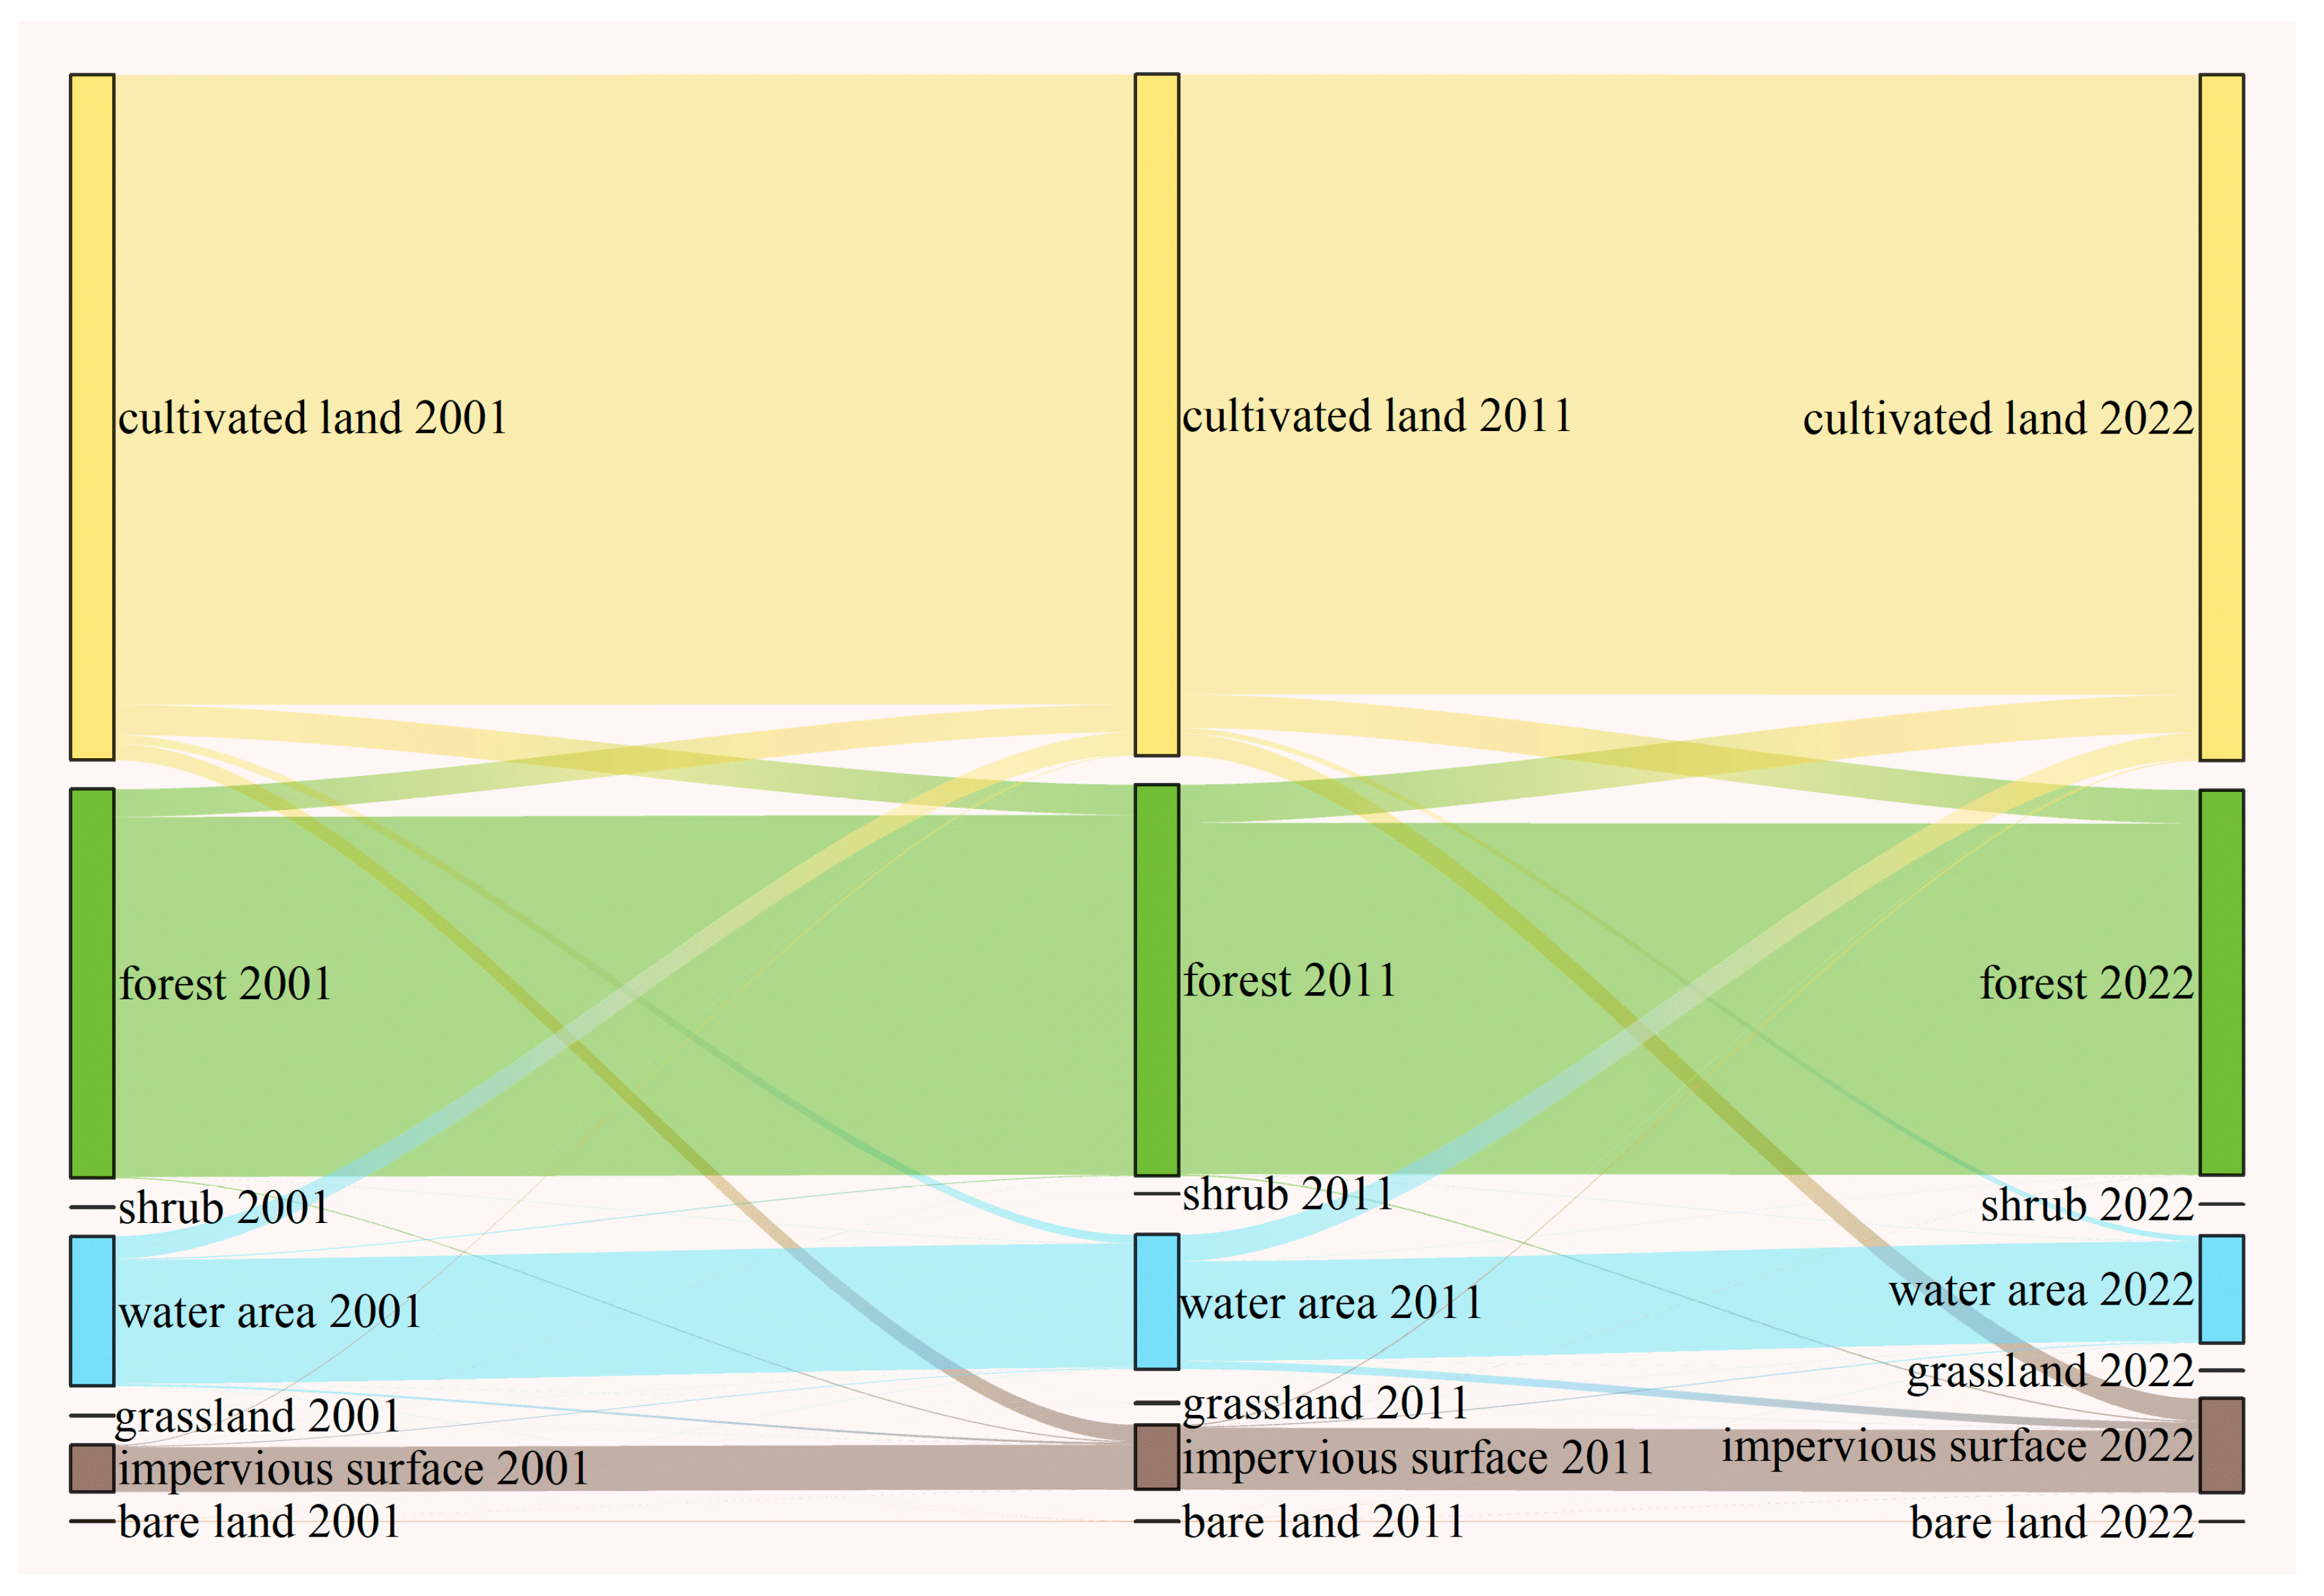
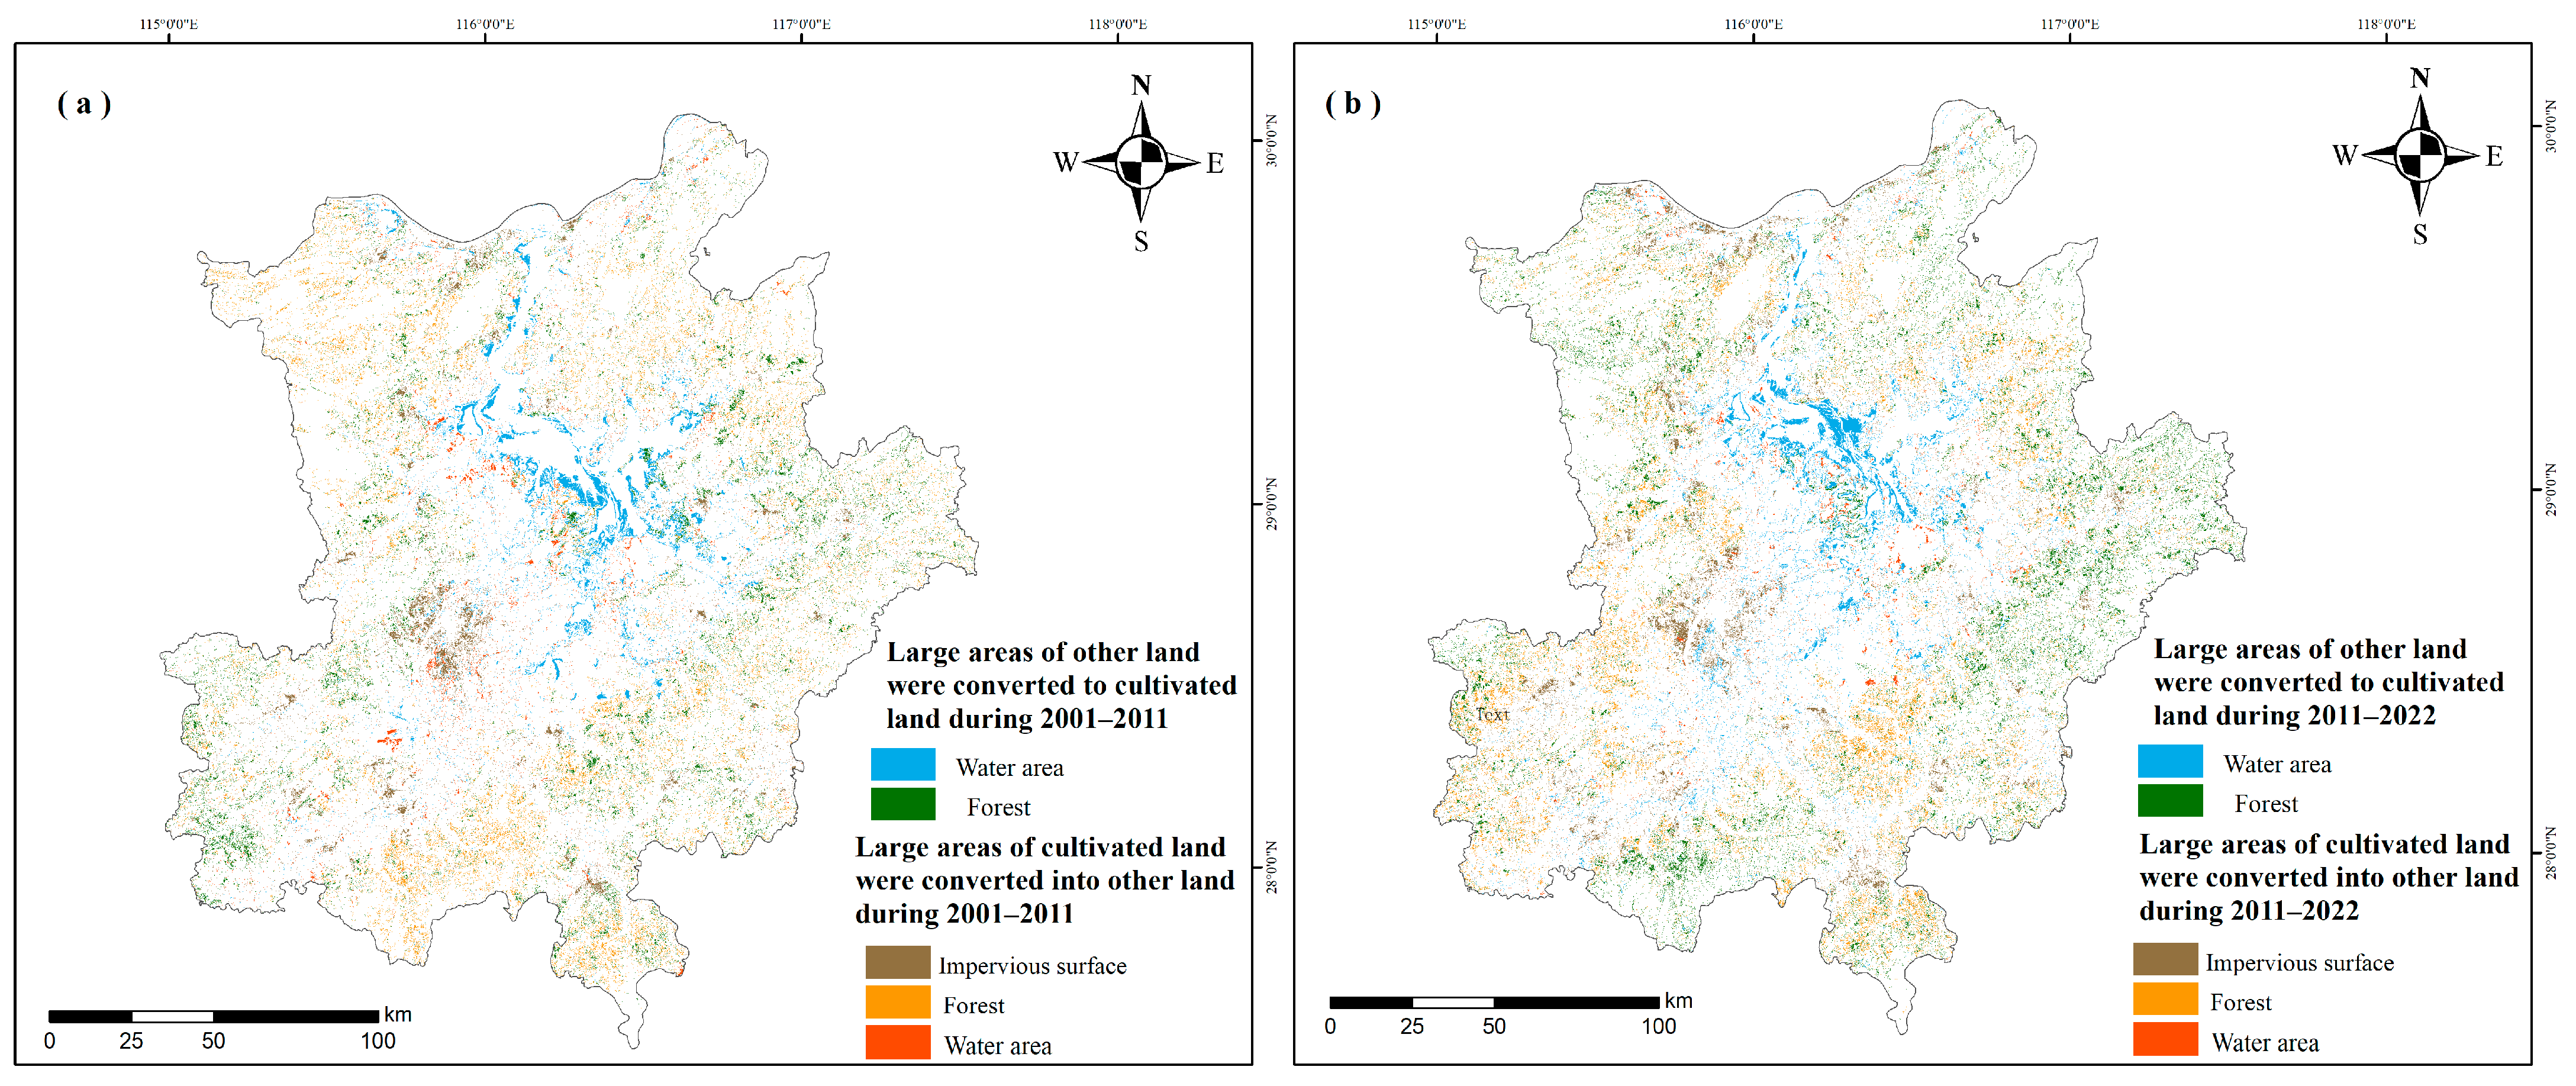
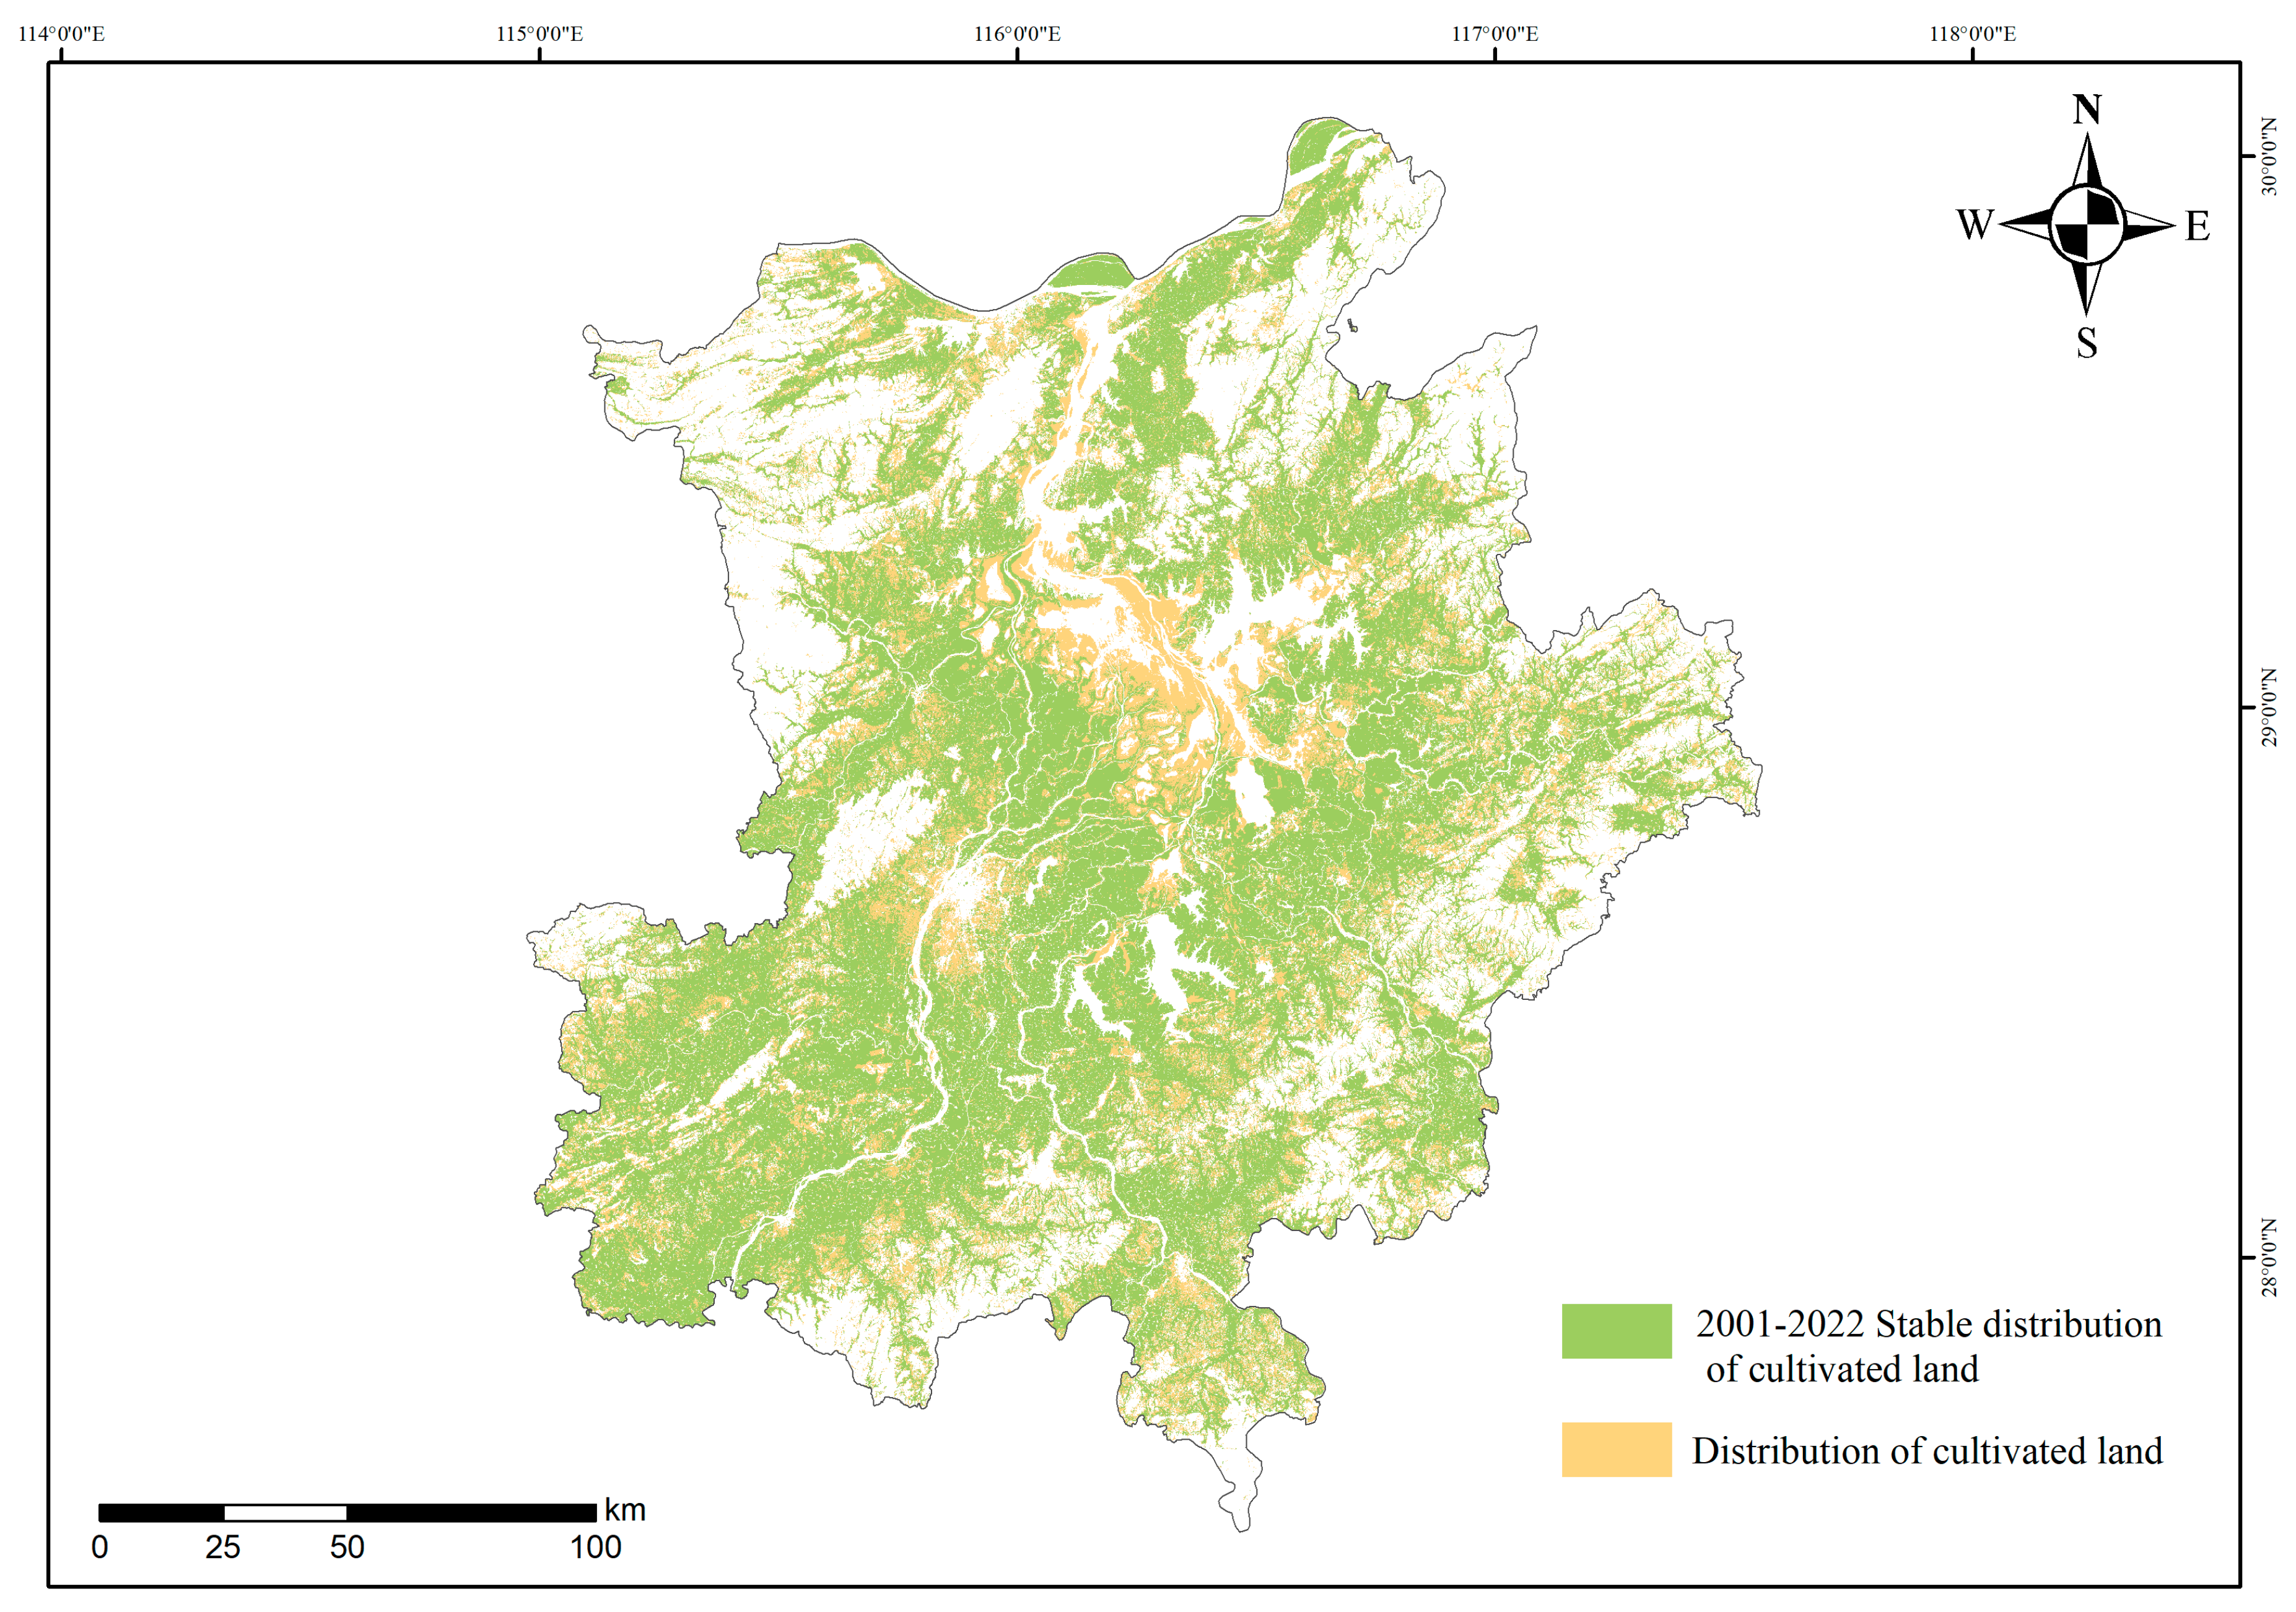
3.1. Spatiotemporal Change Characteristics of Regional Cultivated Land Utilization

To clarify the change in cultivated land use from 2001 to 2022, a land-use transfer Sankey diagram was generated (Figure 3). From 2001 to 2022, cultivated land and forest area showed no obvious change, water area and bare land decreased, and construction land area increased (Figure 4). The change in land types revealed that from 2001 to 2011, cultivated land changed significantly to forest, water, and construction land, with transferred areas of 915.88, 262.62, and 500.28 km2, respectively. Substantial forest and water lands were also transformed into cultivated land (Table S2). From 2011 to 2022, the transformation trend of cultivated land to forest, water area, and construction land continued, with transformation areas of 1018.44, 171.55, and 673.13 km2, respectively, while forest and water areas were frequently transformed into cultivated land. The transformation area of cultivated to construction land increased annually (Table S3). In addition, the transformation area of water to cultivated land was significantly larger than that from cultivated land to water. Notably, the mutual transformation between cultivated land and forests was generally stable.
The grassland is situated at the forefront of the Ganjiang River delta, exhibiting pronounced interannual change characteristics. Construction land is primarily concentrated in economically developed urban areas and sporadically distributed across the Poyang Lake plain. From 2001 to 2022, the changes in cultivated land surrounding lakes and rivers were most evident. Specifically, the Poyang Lake plain emerged as the primary region where cultivated land was transformed into construction land, while the outermost area of the Poyang Lake was the main location for cultivated land conversion to forest.

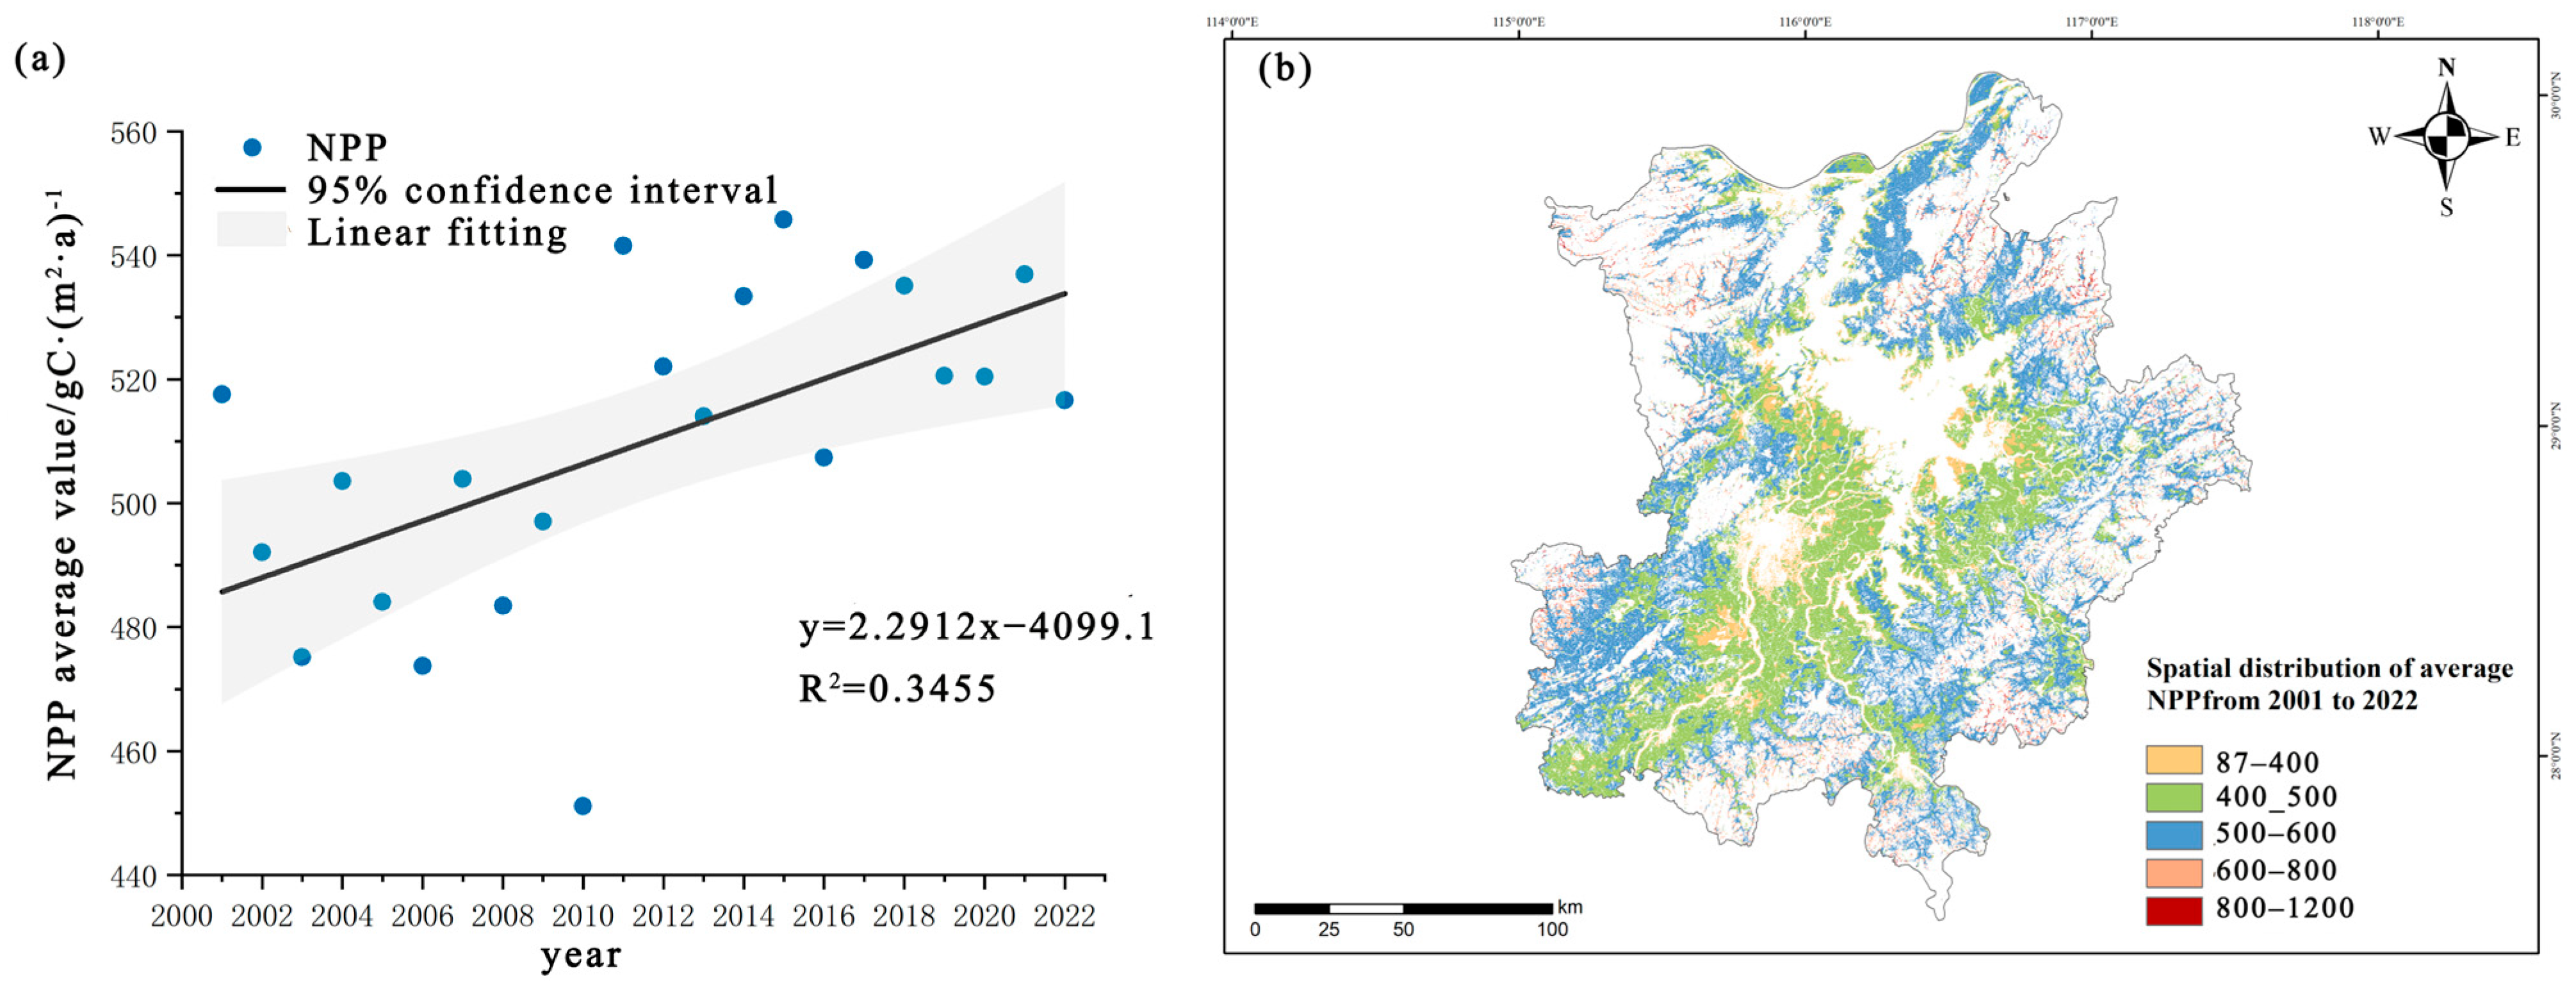
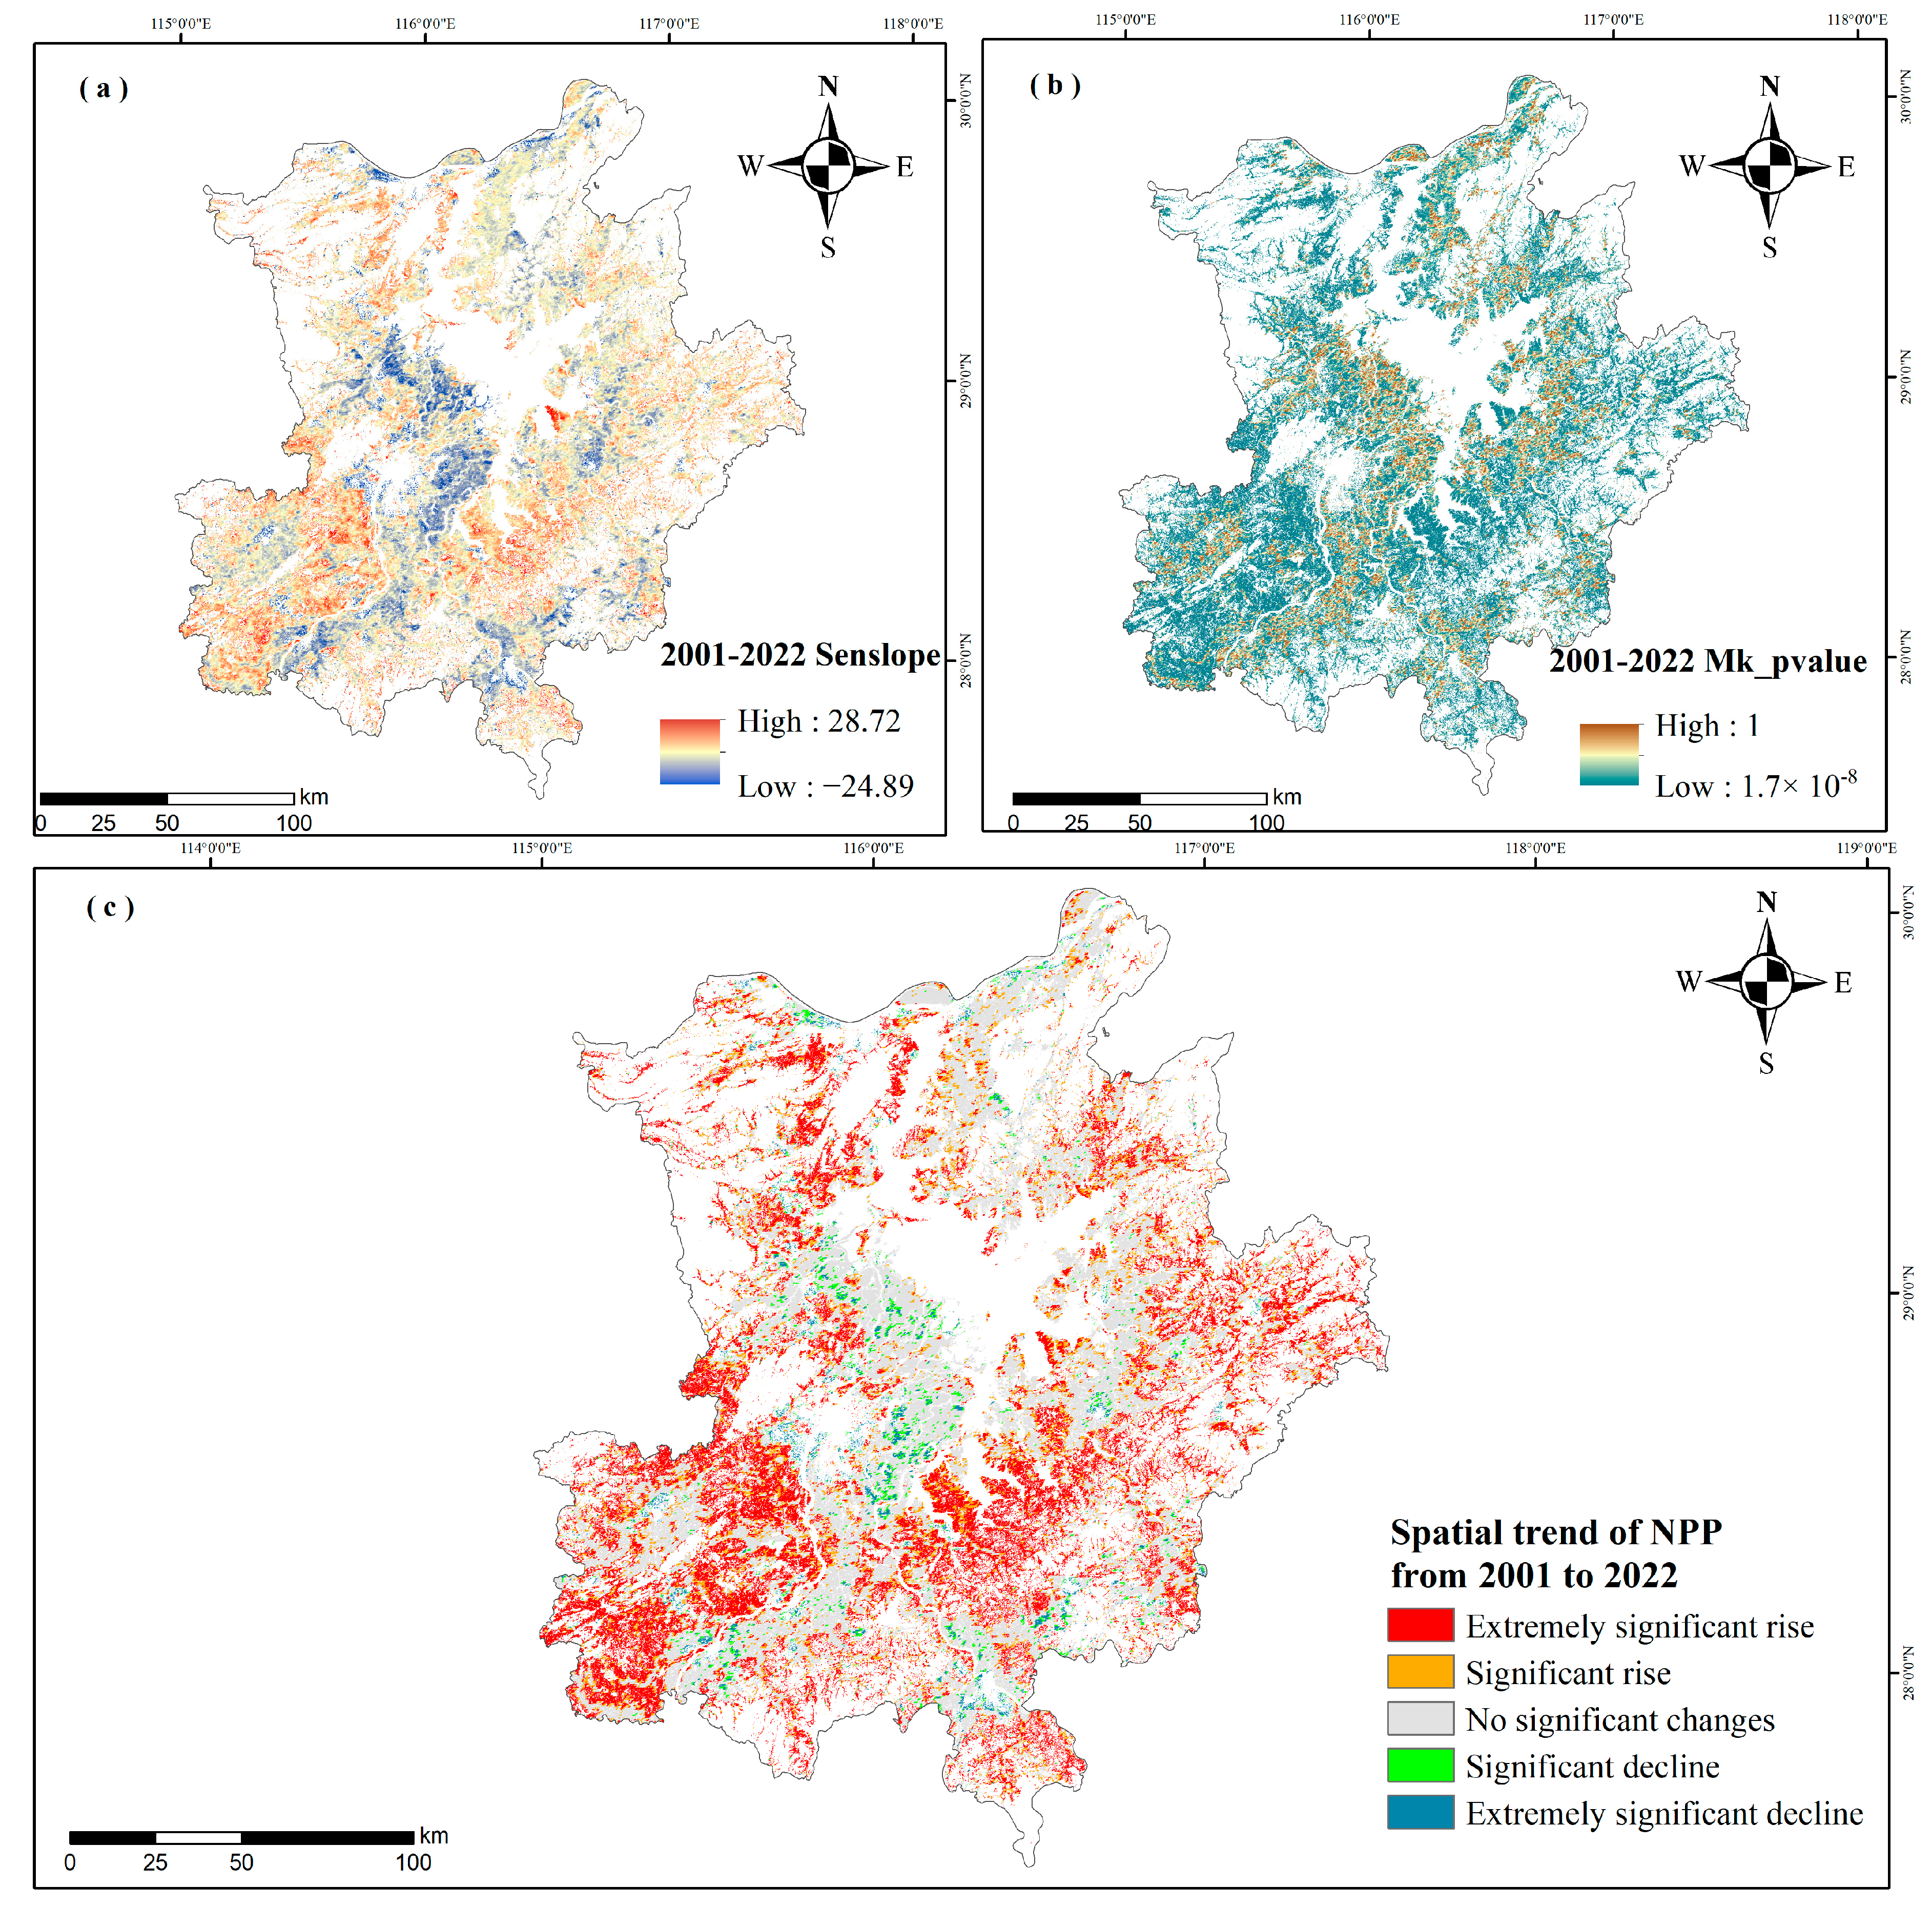
3.2. Spatiotemporal Changes in NPP in Long-Term Cultivated Land

To control for the impact of cultivated land area change on the stability of cultivated land productivity, only the long-term change in cultivated land productivity was considered. From 2001 to 2022, long-term cultivated land in the Poyang Lake region was mainly distributed in the periphery of the study area, with the central plain exhibiting the highest change (Figure 5). From 2001 to 2022, the interannual variation in cultivated land NPP in the study area showed a fluctuating upward trend, reaching a significant level (p < 0.05), with a slope of 2.2912 gC·(m2·a)−1. The highest value was 545.76 gC·(m2·a)−1 in 2015, and the lowest was 451.10 gC·(m2·a)−1 in 2010 (Figure 6a). NPP showed an overall upward trend in interannual variation, achieving its minimum in 2010 and then rapidly recovering. The gap was the largest between 2010 and 2011. The annual NPP data of cultivated land were superimposed (Figure 6b), and a multi-year average of cultivated land NPP of 506.37 gC·(m2·a)−1 was observed, with annual average values of 87.11–1160.58 gC·(m2·a)−1. The distribution of cultivated land NPP in the study area showed significant differences; spatially, the NPP around the study area was higher than that around Poyang Lake.
To elucidate the spatial change trend of cultivated land productivity, Theil–Sen median slope analysis was used to calculate the NPP change in cultivated land per pixel (Figure 7a) and the Mann–Kendall significance test was used to test the change trend (Figure 7b). During the study period, the NPP of cultivated land in most regions increased, with the change in NPP ranging from −24.89 to –28.72 gC·(m2·a)−1. Combining the Theil–Sen median change trend with the Mann–Kendall significance test, the significance results of the cultivated land NPP change trend in the study area were obtained and divided into five grades (Figure 7c). The NPP of cultivated land decreased significantly, and the regional distribution of the significant decrease was low, which was mainly caused by the transformation of cultivated land into construction land due to the expansion of urban space. Regions without significant changes were mainly distributed north of the Poyang Lake region. Significant and extremely significant increases were mainly observed in the peripheral areas of the Poyang Lake region. The spatial variation in NPP showed obvious spatial heterogeneity in the study area, and the increase in NPP in the south was significantly greater than that in the north.

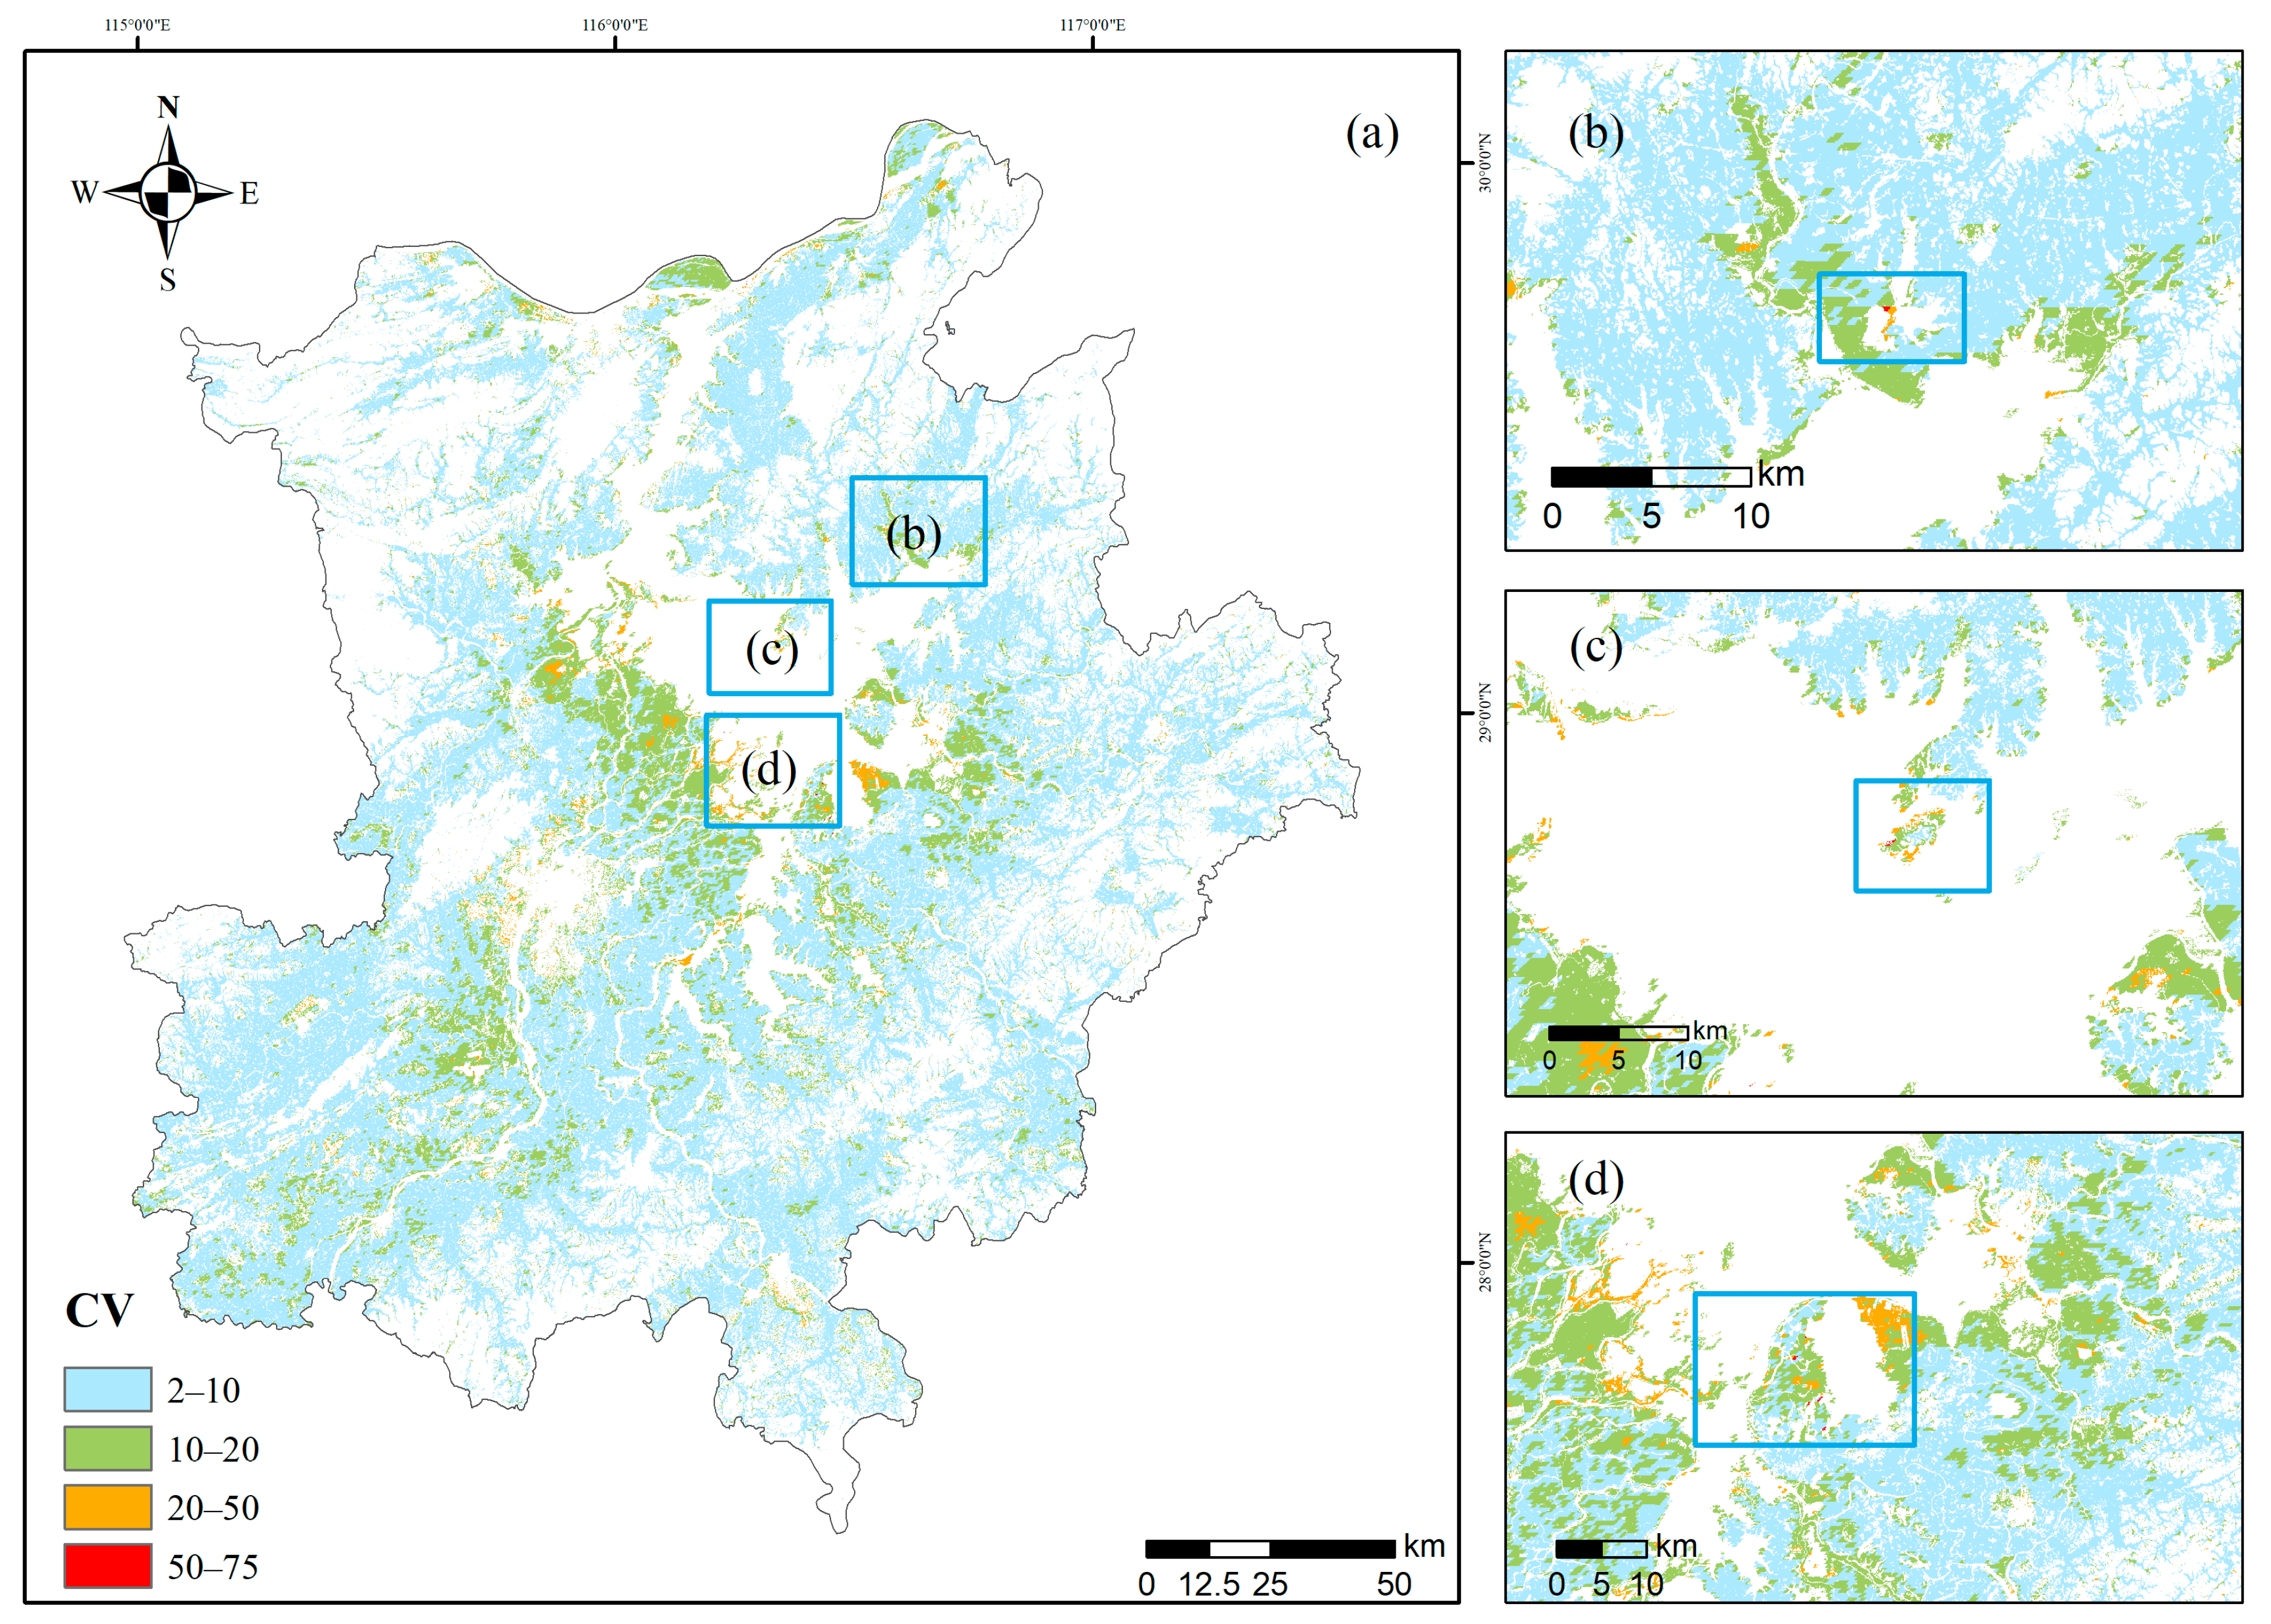
3.3. Spatial Distribution of Cultivated Land Productivity Stability from 2001 to 2022

During 2001–2022, the CV of the NPP of cultivated land was 2–75%. To reveal the stability characteristics of cultivated land NPP, the CV was divided into four fluctuation levels: low (2–10%), medium (10–20%), high (20–50%), and very high (50–75%). Low-fluctuation regions dominated and were mainly concentrated in the periphery of Poyang Lake region, middle- and high-fluctuation areas were relatively closer to the centre of Poyang Lake, and the extremely high-fluctuation area was concentrated in the Ganjiang Delta (Figure 8). To understand the fluctuation characteristics of NPP per unit area, we integrated linear trend analysis. The NPP of cultivated land around Poyang Lake and the areas along the river declined (negative fluctuations), whereas the periphery increased (positive fluctuation) (Figure 9).

3.4. Factors Affecting the Stability of Cultivated Land Productivity from 2001 to 2022

Multiple linear regression analysis was used to explore the factors affecting the stability of cultivated land productivity. County-level MAP, MAT, field-road distance, AREA_MN, field-river distance, ENN, and FRACT values were set as the independent variables, and the CV was set as the dependent variable. The R2 value of the regression model was 0.915, reflecting that the selected independent variable explained 91.5% of the CV of the dependent variable, indicating that the model had a high degree of fitting (Table 1). At a 95% significance level, field_river distance, AREA_MN, FRACT, ENN, and MAP significantly affected the stability of cultivated land productivity. However, the influence of MAT and field_road distance were not statistically significant (Table 1).
Specifically, field_river distance, AREA_MN, and FRACT were positively correlated with the stability of cultivated land productivity; that is, an increase in these factors improved the stability of cultivated land productivity. Conversely, ENN and MAP were negatively correlated with the stability of cultivated land productivity, indicating that an increase in these factors may reduce the stability of cultivated land productivity.

4. Discussion

4.1. Cultivated Land NPP Stability: A Core Indicator of System Resilience

Environmental stressors, such as climate change, drought, and wildfires, can decrease NPP; therefore, NPP serves as an important index for evaluating the response of cultivated land systems to disturbance stability [40]. Our analysis of NPP during 2001–2022 revealed that the stability of cultivated land productivity increased, with significant mutation points. The Mann–Kendall mutation point method identified 2010 as a key change point when NPP shifted from decline to growth (Figure 10). This trend, characterized by an initial decrease followed by recovery, reflects the resilience of the cultivated land system to external interference [41]. This shift may be associated with flooding in the Yangtze River Basin in 2010, including the Poyang Lake region, following continuous heavy rainfall. In-depth analyses of mutation points in NPP, temperature, and precipitation revealed that fluctuations in NPP were associated with precipitation change rates. This indicated the significant correlation between the stability of cultivated land productivity and extreme weather events, particularly precipitation conditions. However, this finding contradicts previous research on the response of NPP to climate factors in the Yangtze River Economic Belt [42], where the sensitivity of NPP to temperature changes did not exceed its sensitivity to precipitation. This is likely because precipitation changes were more dramatic in the study area than temperature changes, leading to a higher sensitivity of NPP to precipitation variations [43,44].
The resilience of the cultivated land system is evident in several aspects: (1) resistance, including anti-interference capabilities, such as climate change and soil erosion; (2) the buffer resistance effect, which ensures that the entire ecosystem can adapt to environmental changes and function regularly; and (3) productivity, a key function to ensure crop growth and food production [45]. Cultivated land ecosystems are affected not only by crop growth stability and land productivity but also by the complex interactions between farmland and the external environment [46]. These characteristics emphasize the importance of cultivated land resilience in the face of external pressures and change. Therefore, when considering the stability of cultivated land productivity, the resilience of cultivated land systems must be considered to maintain productivity and resist external environmental changes [47]. Achieving this requires an in-depth analysis from the perspectives of spatial layout and farmland infrastructure [48].
Field and river proximities affect irrigation conditions, thereby impacting crop yield. Good irrigation can help achieve crop yields and improve farmers’ income [49]. The anti-waterlogging effect of irrigation and water conservancy projects is obvious in humid areas, such as Fujian, Jiangxi, and Hubei [50]. Improvements in infrastructure and farmland regulation have enhanced the resilience of the cultivated land system and further promoted the increase in NPP [51]. The size, regularity, and continuity of cultivated land are important factors affecting agricultural efficiency and the stability of cultivated land productivity [52]. The size, shape regularity, and contiguity of cultivated land are affected by many factors, including topography, geomorphology, regional settlement morphology, and traffic–water system distribution [53]. The rationality of cultivated land spatial distribution is another key factor in enhancing the resilience of cultivated land systems. Generally, highly concentrated plots facilitate large-scale and mechanized planting, improve production efficiency and incomes, and reduce productivity variations [54]. Trends in scale and mechanization have enhanced the ability of cultivated land to resist external interference. Conversely, fragmentation affects the efficiency of mechanized operations and cultivated land management and increases the risk of abandoned land [55]. Therefore, by optimizing the layout of cultivated land and reducing fragmentation, the resilience of cultivated land systems can be increased, and the stability of productivity can be maintained.

4.2. Spatial Change in Cultivated Land Affect the Stability of Regional Cultivated Land Productivity

Cultivated land productivity stability enables continuously high and stable yield [33,56]. Spatiotemporally, changes in land-use structure not only reflect the dynamic expansion and contraction of various land uses in the process of regional development but also the fluctuation in its quantity, which is the foundation for exploring how land-use change responds to human activities [57]. During 2001–2022, the water and bare land areas in the Poyang Lake region decreased, whereas construction land area continuously increased, reflecting the transformation of land resource utilization in the region from a natural to an artificial state. This change is closely related to increasing human activity [58]. With population and economic growth, human demand for land resources is rising, driving significant changes in the land-use mode [58].
Natural conditions guarantee the stability of cultivated land productivity and provide favourable conditions for the efficient use of cultivated land. However, external human land-use behaviours, such as urban expansion, threaten the stability of cultivated land productivity. The central lakeside zone of the Poyang Lake region is flat, with the lake water system as the core. Cultivated land is mainly distributed in the surrounding hilly and mountainous areas. The complex topography and favourable natural conditions in these areas provide a foundation for the sustainable and stable use of cultivated land [59]. In contrast, the central plain of the Poyang Lake region, which has undergone rapid economic development, has experienced more dramatic changes in cultivated land use. The spatial stability of cultivated land in the central plain is relatively low owing to pressure from economic development, population growth, and urbanization.
Rapid urban land expansion is a primary cause of the increasing instability of cultivated land in the Poyang Lake region. As urbanization accelerates, substantial high-quality cultivated land has become occupied by urban construction, especially in economically developed regions such as Nanchang and Jiujiang [60]. This urban expansion reduces the cultivated land area and land-use efficiency, which threatens food security and the sustainability of land use [61]. In addition, with economic development and population growth, the demand for land has surged and substantial cultivated land has been converted for commercial, industrial, and other uses. This trend was particularly prominent at the county level, further aggravating the instability of the spatial location of cultivated land [62]. To ensure food security, the government has balanced cultivated land occupation and compensation and promoted cultivated land supplementation. While these efforts have maintained the overall cultivated land area, they have caused significant spatial shifts. Newly supplemented cultivated land is often located in remote areas with poor production conditions, where it was previously of higher quality and concentrated around cities. Accordingly, to supplement the total amount of cultivated land, some bare land or other low-quality land types have been reclaimed as cultivated land [63]. The instability of the spatial location of cultivated land leads to a decline in its quality, which adversely impacts the stability of cultivated land productivity. Simultaneously, the complex interaction between farmland abandonment and reclamation has led to significant changes in the temporal and spatial patterns of cultivated land resources. Cultivated land is abandoned in some areas owing to a decline in quality and low agricultural efficiency, while in other areas, paddy field areas have increased through land development [64,65]. Such frequent changes in the spatial position of cultivated land put pressure on its productivity.
Natural geographical conditions and manmade land-use behaviour in the Poyang Lake region jointly affect the stability of cultivated land productivity. Natural conditions provide basic support, whereas human behaviour present challenges that must be effectively addressed.

4.3. Climate Change and Cropping Systems’ Influence on the Stability of Cultivated Land Productivity

The spatial trend in long-term cultivated land per unit area is key in assessing the stability of cultivated land productivity. The expansion of cultivated land area and an increase in primary crop yield per unit area are two key driving forces for the growth in the NPP of global cultivated land [56]. In the Poyang Lake region, the primary yield per unit area significantly increased in most regions. Notably, the growth in NPP in the southern and northern regions showed obvious spatial heterogeneity, and the increase in NPP in the south was significantly greater than that in the north. Such spatial distribution characteristics emphasize the differences and complexity of cultivated land productivity in different geographical regions. The change in the NPP of cultivated land around Poyang Lake was mainly affected by climate change and lake ecosystems. The lack of obvious changes in the northern region may be related to relatively stable natural conditions, land-use patterns, and agricultural technology levels, while the significant and extremely significant increases in the peripheral region may be related to superior natural conditions, innovation and promotion of agricultural technology, and policy. In addition to natural conditions and the level of agricultural technology, planting patterns, irrigation, and water conservancy projects in agricultural practices have contributed to improving NPP.
However, continuous land cultivation and climate change negatively impacted NPP. Extreme weather events, such as droughts, floods, and low temperatures, may lead to crop growth inhibition or death, thus reducing NPP per unit area. Long-term climate change trends, such as temperature increases and precipitation mode changes, may also adversely affect crop growth [20]. In addition, continuous cultivation may lead to soil degradation, such as a decline in soil fertility, structural damage, and soil acidification, which impacts crop growth and yield, leading to a decline in NPP per unit area [66]. In addition to natural factors, the transformation of agricultural planting systems also has an important impact on NPP.
A key factor for increasing NPP per unit area is the improvement in the multiple cropping index. Optimizing the crop planting structure, increasing the crop planting density, prolonging the growth period, or adopting rotation, intercropping, and other planting modes can improve the multiple cropping index, crop yield, and NPP per unit area [67,68]. Yu et al. [69] argued that although the total rice yield in southern China decreased owing to a reduction in the double-cropping rice area, the rice planting share in Anhui and Jiangxi and the multiple cropping index in Hunan increased, which contributed to improved NPP in some regions.
In recent decades, changes in the rice cropping system in southern China have significantly impacted NPP. Substantial farmland has transitioned from double-cropping to single-cropping rice, which reflects seasonal land abandonment [70]. From 1990 to 2015, the multiple cropping index of rice decreased from 148.3% to 129.3%. The most dramatic change was observed in the middle and lower reaches of the Yangtze River Plain, which includes the Poyang Lake region, with the distribution of rice farming systems in the south changing from north to south, with double-cropping rice decreasing and single-cropping rice increasing [71]. This transformation from double-cropping to single-cropping rice reduced the planting density and multiple cropping indices, affecting the NPP promotion potential. In addition, improved natural conditions in the southern Poyang Lake region, coupled with the north being more directly and significantly affected by the hydrological conditions of the Yangtze River, partially explain why the NPP growth rate in the southern region was higher than that in the northern region. Understanding the impact of these changes in NPP will help formulate more reasonable agricultural policies and measures to promote the stable and sustainable development of cultivated land productivity.

4.4. Technological Progress Influence on the Growth of Cultivated Land Productivity

Technological progress plays a crucial role in promoting the steady growth of cultivated land productivity [72]. Continuous innovation in agricultural science and technology, including the application of precision agriculture technology, popularization of efficient water-saving irrigation systems, and promotion of excellent crop varieties, has generated substantial production potential to cultivated lands. These technologies have significantly increased the yield per unit area of crops, enhanced soil fertility management, and reduced the occurrence of diseases and pests, thus ensuring a stable supply and improvement in food and agricultural production quality [73].

4.5. Study Limitations and Prospects

Although this study provided valuable results, limitations still existed. The impact of crop planting types on NPP per unit area were not considered when analyzing the stability of cultivated land productivity. To describe the productivity of cultivated land more comprehensively, future studies should analyze multiple vegetation type indices to accurately reflect the impacts of different crop planting types on the productivity of cultivated land [74]. The following two approaches may be adopted: one is to use crop models to predict NPP among different crops and adjust NPP data accordingly [75]. Secondly, NPP of different crops can be accurately calculated by direct measurement of crop biomass and photosynthetic rate through field experiment monitoring [76].

5. Conclusions

When investigating the interaction between the climate and anthropogenic activities, it is crucial to explore the factors affecting the stability of cultivated land production capacity. This study revealed the influence mechanism of multiple geospatial factors on the stability of cultivated land productivity. Policies should be formulated based on geographical spatial characteristics, such as the distribution of terrain, roads, and water systems, to ensure the sustainable use and productive potential of agricultural land. The strategic integration of scattered and irregular cultivated land can improve land-use efficiency and promote agricultural scale and mechanization.
Precipitation changes in lakeside areas such as Poyang Lake Basin impact the stability of cultivated land productivity more than temperature. Therefore, precipitation factors should be prioritized, and irrigation and drainage systems should be optimized, to enhance the adaptability of cultivated land to water level fluctuation to manage its adverse effects on agricultural production.
In addition, the change in cultivated land NPP provides a foundation for assessing the resilience of agricultural systems. Despite inter-annual fluctuations, NPP increased, indicating that the agricultural system was resilient. This provided a reference index for measuring the resilience of cultivated land systems.
The results of this study provide key insights with broad implications for agricultural policy and land management strategies. First, these findings highlighted the importance of land-use change and its impact on agricultural systems. The conversion of cultivated land to forest, water, and especially construction land reflected economic development and urbanization pressures and highlighted the need for balanced land-use planning. This change was evident around lakes and rivers, suggesting that land-use policies should be stricter in vulnerable areas.

Supplementary Materials

The following supporting information can be downloaded at: https://www.mdpi.com/article/10.3390/land14040708/s1, Table S1: Landscape pattern metrics; Table S2: Land use change from 2001–2011; Table S3: Land use change from 2011–2022.

Author Contributions

Z.Y.: conceptualization, data curation, formal analysis, visualization, writing—original draft, writing—review and editing. Y.Y.: conceptualization, data curation, formal analysis, writing—original draft, visualization, writing—review and editing, funding acquisition. Y.J.: data curation, writing—original draft, writing—review and editing. Y.L. (Yuqing Liu): data curation, formal analysis, visualization. Y.L. (Yanqing Liao): data curation, formal analysis, visualization. W.L.: data curation, formal analysis, visualization. L.K.: methodology, resources, supervision, writing—review and editing, funding acquisition. X.G.: conceptualization, data curation, formal analysis, writing—original draft, visualization, writing—review and editing. All authors have read and agreed to the published version of the manuscript.

Funding

This work was supported by the National Key R&D Program of China [grant No. 2023YFD1900300] and the “14th Five-Year Plan” Social Science Fund Project of Jiangxi Province (Grant No. 24GL36).

Data Availability Statement

The original contributions presented in this study are included in the article/Supplementary Materials. Further inquiries can be directed to the corresponding authors.

Acknowledgments

We gratefully acknowledge financial support from the National Key R&D Program of China (Grant No. 2023YFD1900300) and “14th Five-Year Plan” Social Science Fund Project of Jiangxi Province (Grant No. 24GL36). These funds were crucial in enabling our research endeavours. Additionally, we deeply appreciate the constructive comments and valuable time invested by the experts and anonymous reviewers. Their insights greatly improved the quality of our work.

Conflicts of Interest

The authors declare no conflict of interest.

References

  1. UN General Assembly. Transforming Our World: The 2030 Agenda for Sustainable Development: Resolution; UN: New York, NY, USA, 2015. [Google Scholar]
  2. Long, H.L.; Kong, X.B.; Hu, S.G.; Li, Y.R. Land Use Transitions under Rapid Urbanization: A Perspective from Developing China. Land 2021, 10, 935. [Google Scholar] [CrossRef]
  3. Wang, X. Changes in cultivated land loss and landscape fragmentation in China from 2000 to 2020. Land 2022, 11, 684. [Google Scholar] [CrossRef]
  4. Lesk, C.; Rowhani, P.; Ramankutty, N. Influence of extreme weather disasters on global crop production. Nature 2016, 529, 84–87. [Google Scholar] [CrossRef] [PubMed]
  5. Chaudhuri, S.; Roy, M.; McDonald, L.M.; Emendack, Y. Land Degradation—Desertification in Relation to Farming Practices in India: An Overview of Current Practices and Agro-Policy Perspectives. Sustainability 2023, 15, 6383. [Google Scholar] [CrossRef]
  6. Meng, L.; Huang, C.; Chen, X.; Jiang, L.; Zhang, G.; Hao, J.; An, P. Evaluation of cultivated land system resilience of Quzhou County. Resour. Sci. 2019, 41, 1949–1958. [Google Scholar] [CrossRef]
  7. Domínguez-García, V.; Dakos, V.; Kéfi, S. Unveiling dimensions of stability in complex ecological networks. Proc. Natl. Acad. Sci. USA 2019, 116, 25714–25720. [Google Scholar] [CrossRef]
  8. Huang, G.X.; Wang, P. Assessment of the ecosystem stability of Shapotou arid desert nature reserve in Ningxia, China. Acta Ecol. Sin. 2019, 39, 6381–6392. [Google Scholar] [CrossRef]
  9. Tian, S.; Zhu, B.; Yin, R.; Wang, M.; Jiang, Y.; Zhang, C.; Li, D.; Chen, X.; Kardol, P.; Liu, M. Organic fertilization promotes crop productivity through changes in soil aggregation. Soil Biol. Biochem. 2022, 165, 108533. [Google Scholar] [CrossRef]
  10. Ding, W.; Song, D.; Zhou, W. Dominant factors driving the farmland quality in China and strategies for improvement. J. Plant Nutr. Fertil. 2024, 30, 1580–1594. [Google Scholar] [CrossRef]
  11. Li, S.; Wu, X.; Song, X.; Liu, X.; Gao, H.; Liang, G.; Zhang, M.; Zheng, F.; Yang, P. Long-term nitrogen fertilization enhances crop yield potential in no-tillage systems through enhancing soil fertility. Resour. Conserv. Recycl. 2024, 206, 107622. [Google Scholar] [CrossRef]
  12. Allocca, C.; Castrignanò, A.; Nasta, P.; Romano, N. Regional-scale assessment of soil functions and resilience indicators: Accounting for change of support to estimate primary soil properties and their uncertainty. Geoderma 2023, 431, 116339. [Google Scholar] [CrossRef]
  13. Dubovyk, O. The role of Remote Sensing in land degradation assessments: Opportunities and challenges. Eur. J. Remote Sens. 2017, 50, 601–613. [Google Scholar] [CrossRef]
  14. Liao, C.; Wang, J.; Dong, T.; Shang, J.; Liu, J.; Song, Y. Using spatio-temporal fusion of Landsat-8 and MODIS data to derive phenology, biomass and yield estimates for corn and soybean. Sci. Total Environ. 2019, 650, 1707–1721. [Google Scholar] [CrossRef] [PubMed]
  15. Wang, J.; Li, X.; Lu, L.; Fang, F. Estimating near future regional corn yields by integrating multi-source observations into a crop growth model. Eur. J. Agron. 2013, 49, 126–140. [Google Scholar] [CrossRef]
  16. Xu, W.; Jin, J.; Jin, X.; Xiao, Y.; Ren, J.; Liu, J.; Sun, R.; Zhou, Y. Analysis of changes and potential characteristics of cultivated land productivity based on MODIS EVI: A case study of Jiangsu Province, China. Remote Sens. 2019, 11, 2041. [Google Scholar] [CrossRef]
  17. Liu, K.; Li, X.; Wang, S.; Zhou, G. Past and future adverse response of terrestrial water storages to increased vegetation growth in drylands. Npj Clim. Atmos. Sci. 2023, 6, 113. [Google Scholar] [CrossRef]
  18. Zhou, W.; Li, C.; Fu, B.; Wang, S.; Ren, Z.; Stringer, L.C. Changes and drivers of vegetation productivity in China’s drylands under climate change. Environ. Res. Lett. 2024, 19, 114001. [Google Scholar] [CrossRef]
  19. Chen, J.; Chi, Y.; Zhou, W.; Wang, Y.; Zhuang, J.; Zhao, N.; Ding, J.; Song, J.; Zhou, L. Quantifying the Dimensionalities and Drivers of Ecosystem Stability at Global Scale. J. Geophys. Res. Biogeosci. 2021, 126, e2020JG006041. [Google Scholar] [CrossRef]
  20. Han, B.; Jin, X.; Yeting, F.; Chen, H.; Jin, J.; Xu, W.; Ren, J.; Zhou, Y. Trend and spatial pattern of stable cropland productivity in China based on satellite observations (2001−2020). Environ. Impact Asses. 2023, 101, 107136. [Google Scholar] [CrossRef]
  21. Piao, S.; Ciais, P.; Huang, Y.; Shen, Z.; Peng, S.; Li, J.; Zhou, L.; Liu, H.; Ma, Y.; Ding, Y.; et al. The impacts of climate change on water resources and agriculture in China. Nature 2010, 467, 43–51. [Google Scholar] [CrossRef]
  22. Yang, Y.; Tilman, D.; Jin, Z.; Smith, P.; Barrett, C.B.; Zhu, Y.; Burney, J.; D’Odorico, P.; Fantke, P.; Fargione, J.; et al. Climate change exacerbates the environmental impacts of agriculture. Science 2024, 385, eadn3747. [Google Scholar] [CrossRef] [PubMed]
  23. Liu, Y.; Liu, L.; Zhu, A.; Lao, C.; Hu, G.; Hu, Y. Scenario farmland protection zoning based on production potential: A case study in China. Land Use Policy 2020, 95, 104581. [Google Scholar] [CrossRef]
  24. Ye, S.; Ren, S.; Song, C.; Cheng, C.; Shen, S.; Yang, J.; Zhu, D. Spatial patterns of county-level arable land productive-capacity and its coordination with land-use intensity in mainland China. Agric. Ecosyst. Environ. 2022, 326, 107757. [Google Scholar] [CrossRef]
  25. Wang, X.; Feng, Q.; Li, B.; Fan, Y.; Fan, H.; Yang, N.; Quan, Y.; Ding, H.; Zhang, Y. Trends and Factors Influencing the Evolution of Spatial Patterns of Cropland toward Large-Scale Agricultural Production in China. Land 2024, 13, 607. [Google Scholar] [CrossRef]
  26. Zhou, X.; Liang, Y.; Li, X.; Chai, D. The spatiotemporal evolution and driving factors of farmland system health: Taking the middle and lower reaches of the Yangtze River as an example. J. Nat. Resour. 2024, 39, 1174–1192. [Google Scholar] [CrossRef]
  27. Bren D Amour, C.; Reitsma, F.; Baiocchi, G.; Barthel, S.; Güneralp, B.; Erb, K.; Haberl, H.; Creutzig, F.; Seto, K.C. Future urban land expansion and implications for global croplands. Proc. Natl. Acad. Sci. USA 2017, 114, 8939–8944. [Google Scholar] [CrossRef]
  28. Tu, Y.; Chen, B.; Yu, L.; Song, Y.; Wu, S.; Li, M.; Wei, H.; Chen, T.; Lang, W.; Gong, P.; et al. Raveling the nexus between urban expansion and cropland loss in China. Landsc. Ecol. 2023, 38, 1869–1884. [Google Scholar] [CrossRef]
  29. Liu, J.; Jin, X.; Xu, W.; Zhou, Y. Evolution of cultivated land fragmentation and its driving mechanism in rural development: A case study of Jiangsu Province. J. Rural Stud. 2022, 91, 58–72. [Google Scholar] [CrossRef]
  30. Liu, J.; Jin, X.; Xu, W.; Wang, S.; Zhou, Y. Characteristic evolution and trend prediction of cultivated land landscape fragmentation in China from 1990 to 2020. Acta Geogr. Sin. 2023, 78, 2163–2185. [Google Scholar] [CrossRef]
  31. Kuang, W.; Liu, J.; Tian, H.; Shi, H.; Dong, J.; Song, C.; Li, X.; Du, G.; Hou, Y.; Lu, D.; et al. Cropland redistribution to marginal lands undermines environmental sustainability. Natl. Sci. Rev. 2022, 9, nwab091. [Google Scholar] [CrossRef]
  32. Su, Y.; Qian, K.; Lin, L.; Wang, K.; Guan, T.; Gan, M. Identifying the driving forces of non-grain production expansion in rural China and its implications for policies on cultivated land protection. Land Use Policy 2020, 92, 104435. [Google Scholar] [CrossRef]
  33. Fan, J.; Wang, L.; Qin, J.; Zhang, F.; Xu, Y. Evaluating cultivated land stability during the growing season based on precipitation in the Horqin Sandy Land, China. J. Environ. Manag. 2020, 276, 111269. [Google Scholar] [CrossRef] [PubMed]
  34. Xiao, Q.; Wang, Y. Spatial-temporal Differentiation Characteristics and Influencing Factors of Cultivated Land NPP in Major Grain Producing Areas (Henan Province). Environ. Sci. 2024, 1–15. [Google Scholar] [CrossRef]
  35. Hamed, K.H.; Ramachandra Rao, A. A modified Mann-Kendall trend test for autocorrelated data. J. Hydrol. 1998, 204, 182–196. [Google Scholar] [CrossRef]
  36. Li, J.H.; Zhou, K.C.; Dong, H.M.; Xie, B.G. Cultivated Land Change, Driving Forces and Its Impact on Landscape Pattern Changes in the Dongting Lake Basin. Int. J. Environ. Res. Public Health 2020, 17, 7988. [Google Scholar] [CrossRef] [PubMed]
  37. Yu, Z.H.; Kuang, L.H.; Jiang, Y.F.; Li, W.F.; Zhang, J.; Zhou, Y.T.; Guo, X.; Ye, Y.C. Soil attributes are more important than others in shaping the diversity of cultivated land quality types, southern China. Ecol. Indic. 2024, 166, 112472. [Google Scholar] [CrossRef]
  38. McGarigal, K. FRAGSTATS Help; University of Massachusetts: Amherst, MA, USA, 2015; 182p. [Google Scholar]
  39. Wang, X.; Xu, H.; Pan, C. Change Features of Cultivated Land Resources and Its Driving Factors in Tarim River Basin. Bull. Soil Water Conserv. 2017, 37, 327–332. [Google Scholar] [CrossRef]
  40. Yao, Y.; Liu, Y.; Fu, F.; Song, J.; Wang, Y.; Han, Y.; Wu, T.; Fu, B. Declined terrestrial ecosystem resilience. Glob. Change Biol. 2024, 30, e17291. [Google Scholar] [CrossRef]
  41. Lyu, X.; Wang, Y.; Niu, S.; Peng, W. Spatio-Temporal Pattern and Influence Mechanism of Cultivated Land System Resilience: Case from China. Land 2022, 11, 11. [Google Scholar] [CrossRef]
  42. Jia, L.; Yu, K.; Li, Z.; Li, P.; Xu, G.; Cong, P.; Li, B. Spatiotemporal pattern of NPP and its response to climatic factors in the Yangtze River Economic Belt. Ecol. Indic. 2024, 162, 112017. [Google Scholar] [CrossRef]
  43. De Keersmaecker, W.; Lhermitte, S.; Honnay, O.; Farifteh, J.; Somers, B.; Coppin, P. How to measure ecosystem stability? An evaluation of the reliability of stability metrics based on remote sensing time series across the major global ecosystems. Glob. Change Biol. 2014, 20, 2149–2161. [Google Scholar] [CrossRef] [PubMed]
  44. Zhang, S.; Hao, X.M.; Zhao, Z.; Zhang, J.; Fan, X.; Li, X. Natural Vegetation Succession Under Climate Change and the Combined Effects on Net Primary Productivity. Earth’s Future 2023, 11, e2023EF003903. [Google Scholar] [CrossRef]
  45. Yu, Q.; Yue, D.P.; Wang, Y.H.; Kai, S.; Fang, M.Z.; Ma, H.; Zhang, Q.B.; Huang, Y. Optimization of ecological node layout and stability analysis of ecological network in desert oasis: A typical case study of ecological fragile zone located at Deng Kou County (Inner Mongolia). Ecol. Indic. 2018, 84, 304–318. [Google Scholar] [CrossRef]
  46. Yan, Y.; Guan, Q.Y.; Shao, W.Y.; Wang, Q.Z.; Yang, X.Y.; Luo, H.P. Spatiotemporal dynamics and driving mechanism of arable ecosystem stability in arid and semi-arid areas based on Pressure-Buffer-Response process. J. Clean. Prod. 2023, 421, 138553. [Google Scholar] [CrossRef]
  47. Gao, H.; Gong, J.; Ye, T.; Maier, M.; Liu, J. Constructing cropland ecological stability assessment method based on disturbance-resistance-response processes and classifying cropland ecological types. Sci. Total Environ. 2024, 930, 172673. [Google Scholar] [CrossRef]
  48. Lv, T.; Chen, A.; Fu, S.; Zhao, Q.; Liang, H. Spatial-temporal evolution characteristics and influencing mechanism of resilience of China’s cultivated land system under agricultural green transformation. Acta Ecol. Sin. 2025, 1–14. [Google Scholar] [CrossRef]
  49. Sun, X.; Cai, W.; Kong, X.; Li, Q.; Zhao, J. Quality regulation pattern and consolidation time zone of county-level cultivated land based on multi agent collaboration. Trans. Chin. Soc. Agric. Eng. 2023, 39, 232–245. [Google Scholar] [CrossRef]
  50. Wang, L.; Zhang, Q.; Zhang, Y.; Wei, X.; Zhao, A.; Zhang, X. Evaluating the Improved Ability of Irrigation Water Conservancy Engineering Projects Since 2011 in Mitigating Flood and Drought in China. J. Irrig. Drain. 2021, 40, 129–136. [Google Scholar] [CrossRef]
  51. Jin, W.; Ai, G.; Xiong, Y. The Impact of Environmental Changes on Agricultural Waterlogging Disasters: A case study of the Three Rivers Union in the Ganfu Plain Irrigation Area. Water Resour. Hydropower Eng. 2024, 94–101. [Google Scholar]
  52. Ma, L.; Long, H.; Tang, L.; Tu, S.; Zhang, Y.; Qu, Y. Analysis of the spatial variations of determinants of agricultural production efficiency in China. Comput. Electron. Agric. 2021, 180, 105890. [Google Scholar] [CrossRef]
  53. Zhang, S.; Chen, W.; Wang, Y.; Li, Q.; Shi, H.; Li, M.; Sun, Z.; Zhu, B.; Seyoum, G. Human interventions have enhanced the net ecosystem productivity of farmland in China. Nat. Commun. 2024, 15, 10523. [Google Scholar] [CrossRef] [PubMed]
  54. Ren, P.; Wu, T.; Zhou, J. Analysis of spatial distribution pattern and evolutionary characteristics of cultivated lands based on spatial autocorrelation model and GIS platform—A case study of Longquanyi District, Chengdu, China. Chin. J. Eco-Agric. 2016, 24, 325–334. [Google Scholar] [CrossRef]
  55. Hao, W.; Hu, X.; Wang, J.; Zhang, Z.; Shi, Z.; Zhou, H. The impact of farmland fragmentation in China on agricultural productivity. J. Clean. Prod. 2023, 425, 138962. [Google Scholar] [CrossRef]
  56. Potapov, P.; Turubanova, S.; Hansen, M.C.; Tyukavina, A.; Zalles, V.; Khan, A.; Song, X.; Pickens, A.; Shen, Q.; Cortez, J. Global maps of cropland extent and change show accelerated cropland expansion in the twenty-first century. Nat. Food. 2022, 3, 19–28. [Google Scholar] [CrossRef]
  57. Zhong, Y.; Shao, H.; Xu, C.; Zhu, Z. The Spatial-Temporal Evolution Analysis of Land Utilization and Landscape Pattern in Poyang Lake Area from 2001 to 2018. J. Jiangxi Norm. Univ. (Nat. Sci. Ed.) 2021, 45, 94–102. [Google Scholar] [CrossRef]
  58. Qing, L.; Huanhuan, F.; Fuqing, Z.; Wenbo, C.; Yuanping, X.; Bing, Y. The dominant role of human activity intensity in spatial pattern of ecosystem health in the Poyang Lake ecological economic zone. Ecol. Indic. 2024, 166, 112347. [Google Scholar] [CrossRef]
  59. Zhong, Y.; Sun, J.; Wang, Q.; Ou, D.; Tian, Z.; Yu, W.; Li, P.; Gao, X. Spatiotemporal Distribution and Driving Mechanisms of Cropland Long-Term Stability in China from 1990 to 2018. Land 2024, 13, 1016. [Google Scholar] [CrossRef]
  60. Gao, X.; Cheng, W.; Wang, N.; Liu, Q.; Ma, T.; Chen, Y.; Zhou, C. Spatio-temporal distribution and transformation of cropland in geomorphologic regions of China during 1990–2015. J. Geogr. Sci. 2019, 29, 180–196. [Google Scholar] [CrossRef]
  61. Qu, S.J.; Hu, S.G.; Li, W.D.; Wang, H.; Zhang, C.R.; Li, Q.F. Interaction between urban land expansion and land use policy: An analysis using the DPSIR framework. Land Use Policy 2020, 99, 104856. [Google Scholar] [CrossRef]
  62. Wu, X.; Zhao, N.; Wang, Y.; Zhang, L.; Wang, W.; Liu, Y. Cropland non-agriculturalization caused by the expansion of built-up areas in China during 1990–2020. Land Use Policy 2024, 146, 107312. [Google Scholar] [CrossRef]
  63. Liu, C.; Song, C.; Ye, S.; Cheng, F.; Zhang, L.; Li, C. Estimate provincial-level effectiveness of the arable land requisition-compensation balance policy in mainland China in the last 20 years. Land Use Policy 2023, 131, 106733. [Google Scholar] [CrossRef]
  64. Long, Y.Q.; Sun, J.; Wellens, J.; Colinet, G.; Wu, W.B.; Meersmans, J. Mapping the Spatiotemporal Dynamics of Cropland Abandonment and Recultivation across the Yangtze River Basin. Remote Sens. 2024, 16, 1052. [Google Scholar] [CrossRef]
  65. Wang, Y.; Aoxi, Y.; Xin, L.; Dong, S.; Li, X. Spatial and temporal differentiation and influencing factors of fallowing in different types of farmland in China: Based on survey data from 346 mountainous counties. Geogr. Res.-Aust. 2024, 43, 1977–1993. [Google Scholar] [CrossRef]
  66. Liu, X.Y.; Shi, H.D.; Bai, Z.K.; Liu, X.C.; Yang, B.; Yan, D.X. Assessing Soil Acidification of Croplands in the Poyang Lake Basin of China from 2012 to 2018. Sustainability 2020, 12, 3072. [Google Scholar] [CrossRef]
  67. Li, P.; Feng, Z.M.; Jiang, L.G.; Liu, Y.J.; Xiao, X.M. Changes in rice cropping systems in the Poyang Lake Region, China during 2004–2010. J. Geogr. Sci. 2012, 22, 653–668. [Google Scholar] [CrossRef]
  68. Yang, L.; Wang, L.; Chu, J.; Zhao, H.; Zhao, J.; Zang, H.; Yang, Y.; Zeng, Z. Improving soil quality and wheat yield through diversified crop rotations in the North China Plain. Soil Tillage Res. 2024, 244, 106231. [Google Scholar] [CrossRef]
  69. Jin, T.; Zhong, T. Changing rice cropping patterns and their impact on food security in southern China. Food Secur. 2022, 14, 907–917. [Google Scholar] [CrossRef]
  70. Wang, R.; Li, X.; Tan, M.; Xin, L.; Wang, X.; Wang, Y.; Jiang, M. Inter-provincial Differences in Rice Multi-cropping Changes in Main Double-cropping Rice Area in China: Evidence from Provinces and Households. Chin. Geogr. Sci. 2019, 29, 127–138. [Google Scholar] [CrossRef]
  71. Jiang, M.; Li, X.B.; Xin, L.J.; Tan, M.H. Paddy rice multiple cropping index changes in Southern China: Impacts on national grain production capacity and policy implications. J. Geogr. Sci. 2019, 29, 1773–1787. [Google Scholar] [CrossRef]
  72. Pan, Y.; Smith, S.C.; Sulaiman, M. Agricultural Extension and Technology Adoption for Food Security: Evidence from Uganda. Am. J. Agric. Econ. 2018, 100, 1012–1031. [Google Scholar] [CrossRef]
  73. Yu, K.; Zhao, S.; Sun, B.; Jiang, H.; Hu, L.; Xu, C.; Yang, M.; Han, X.; Chen, Q.; Qi, Z. Enhancing Food Production Through Modern Agricultural Technology. Plant Cell Environ. 2024. [Google Scholar] [CrossRef] [PubMed]
  74. Zhang, J.; Wang, J.; Chen, Y.; Huang, S.; Liang, B. Spatiotemporal variation and prediction of NPP in Beijing-Tianjin-Hebei region by coupling PLUS and CASA models. Ecol. Inf. 2024, 81, 102620. [Google Scholar] [CrossRef]
  75. Müller, C.; Jägermeyr, J.; Franke, J.A.; Ruane, A.C.; Balkovic, J.; Ciais, P.; Dury, M.; Falloon, P.; Folberth, C.; Hank, T. Substantial differences in crop yield sensitivities between models call for functionality-based model evaluation. Earth’s Future 2024, 12, e2023EF003773. [Google Scholar] [CrossRef]
  76. Li, Z.; Zhao, Y.; Taylor, J.; Gaulton, R.; Jin, X.; Song, X.; Li, Z.; Meng, Y.; Chen, P.; Feng, H. Comparison and transferability of thermal, temporal and phenological-based in-season predictions of above-ground biomass in wheat crops from proximal crop reflectance data. Remote Sens. Environ. 2022, 273, 112967. [Google Scholar] [CrossRef]
Figure 1. Location map of the study area. ((a) is a schematic diagram showing the location of the Poyang Lake region in China and within Jiangxi Province. (b) is a remote sensing image of the Poyang Lake region. (c) illustrates the distribution of farmland in the Poyang Lake region in 2022, as well as the spatial distribution of lakes and rivers.)
Land 14 00708 g001
Figure 2. Methodological flowchart for the stability of cultivated land productivity.
Land 14 00708 g002
Figure 3. Three-phase land-use transfer Sankey diagram.
Land 14 00708 g003
Figure 4. Map of regions with substantial changes from 2001 to 2011 and 2011 to 2022.
Land 14 00708 g004
Figure 5. Spatial distribution of long-term cultivated land.
Land 14 00708 g005
Figure 6. Interannual variation and spatial distribution of annual average NPP of cultivated land from 2001 to 2022. ((a) is the average annual NPP change, and (b) is the average spatial distribution of NPP from 2001 to 2022).
Land 14 00708 g006
Figure 7. Cultivated land NPP, according to Theil–Sen median trend analysis and Mann–Kendall significance test, from 2001 to 2022. ((a) is the change trend of Theil-Sen median, (b) is the Mann-Kendall significance test, and (c) is the significance result of the change trend of cultivated land NPP in the study area).
Land 14 00708 g007
Figure 8. Regional variation coefficient. ((a) shows the spatial distribution of the coefficient of variation in cultivated land in the Poyang Lake region, while (b), (c), and (d) show local magnification of the areas with high fluctuation, respectively.)
Land 14 00708 g008
Figure 9. Fluctuations in cultivated land productivity from 2001 to 2022.
Land 14 00708 g009
Figure 10. Mann−Kendall mutation point tests for NPP, precipitation, and temperature.
Land 14 00708 g010
Table 1. Multiple linear regression model coefficients.
Non-Standardized CoefficientStandardization CoefficientSignificanceCollinearity Statistics
BBeta ToleranceVIF
Constant−811.789 0
Field_road distance−0.01−0.1830.0710.5511.816
Field_river distance0.020.69100.621.612
AREA_MN1.66 × 10−60.2180.0180.7251.379
FRACT793.1490.48100.4512.219
ENN−0.246−0.7060.0010.185.558
MAT0.3240.0770.7340.1019.93
MAP−0.006−0.3710.0370.1865.384
R2: 0.915, Debin Watson: 2.318.
Disclaimer/Publisher’s Note: The statements, opinions and data contained in all publications are solely those of the individual author(s) and contributor(s) and not of MDPI and/or the editor(s). MDPI and/or the editor(s) disclaim responsibility for any injury to people or property resulting from any ideas, methods, instructions or products referred to in the content.

