Article

People–Place Relationships in Regenerative Urban Assemblages: Streetscape Composition and Subjective Well-Being of Older Adults

1
Department of Urban Engineering, Graduate School of Engineering, The University of Tokyo, Tokyo 113-8656, Japan
2
Center for Research and Development of Higher Education, The University of Tokyo, Tokyo 113-0033, Japan
*
Author to whom correspondence should be addressed.
Land 2025, 14(4), 680; https://doi.org/10.3390/land14040680
Submission received: 27 February 2025 / Revised: 18 March 2025 / Accepted: 19 March 2025 / Published: 23 March 2025
(This article belongs to the Special Issue Urban Regeneration: Challenges and Opportunities for the Landscape)

Abstract

:
Cities are undergoing rapid transformations due to global trends such as population aging, climate change, and increasing social diversity. In order to address these challenges, urban planning must adopt regenerative approaches that enhance subjective well-being by fostering meaningful relationships between people and their surroundings. Streetscapes, which serve as accessible urban landscapes, are important, especially for older adults, who depend on their local environment due to mobility constraints. This study examines the composition of streetscapes and the subjective well-being of older adults in a Japanese municipality. Using streetscape imagery and semantic segmentation, we quantified landscape elements—including vegetation, sky, roads, and buildings—within various walking distances from participants’ residences. Subjective well-being was measured using an 11-point Likert scale and analyzed by ordinal logistic regression. The results revealed that specific streetscape elements significantly impacted subjective well-being differently across spatial thresholds, showing that micro-scale urban landscapes are substantially important in promoting well-being among older adults. This study provides evidence-based insights for adaptive, inclusive, and regenerative urban planning strategies that promote the well-being of diverse demographic groups.

1. Introduction

Cities are rapidly transforming in response to global issues such as climate change [1,2,3], social diversity [4,5], and demographic shifts [6,7,8]. These challenges highlight the limitations of conventional urban planning, as cities have often been viewed as static entities rather than dynamic systems that are adaptive and resilient [9,10]. In this context, regenerative urbanism has emerged as a conceptual framework that mitigates environmental and social risks, actively adapts to threats, and enhances urban ecosystems [11]. By incorporating nature-based solutions, circular economy, and participatory governance, regenerative approaches seek to establish positive loops throughout the multi-scale urban environment. Such approaches offer a strategic pathway to address the immediate risks associated with the Anthropocene while enhancing urban resilience and livability [12].
In order to promote the design and planning of cities that fully realize their potential for urban renewal, it is essential to recognize that cities are more than just physical infrastructure but are composed of a complex assemblage of diverse and interconnected components, including built form, social relationships, ecological processes, and governance structures [13,14]. Assemblage is the reinterpretation of the concept of “assemblage (agencement)” discussed in the writings of Deleuze and Guattari that has been developed by Manuel DeLanda, offering a dynamic perspective on urban transformation, from macro-scale infrastructure to micro-scale everyday space, highlighting how components of different scales interact and exhibit emergent properties [15]. This perspective is consistent with the multi-scalability that regenerative urbanism emphasizes, which ensures that interventions are not limited to large-scale projects but are across various dimensions. As the most familiar and accessible urban landscape, the streetscape serves as an important site where regenerative urban strategies can directly impact the quality of life. Through their impact on social interactions, environmental experiences, and individual mobility, streetscapes hold great potential for fostering inclusive, resilient, and regenerative urban environments [16,17].
Aging is a pressing issue among the many challenges facing contemporary urban environments, especially in a hyper-aged society such as Japan [18]. Older adults are disproportionately affected by the design and accessibility of their immediate environment, as they often experience mobility constraints [19,20]. In this context, micro-scale urban landscapes, including streetscapes, have been noted to directly influence perceptions of safety, walkability, and social inclusion, which are essential for maintaining quality of life [21,22,23,24]. Nevertheless, previous research has focused on limited types of spatial elements and their impact on behavior and cognition, leaving room for further investigation of experiential and place-based aspects of well-being.
When examining the relationship between streetscapes and individual well-being, subjective well-being emerges as a significant concept. This term encompasses an individual’s self-evaluation of happiness or satisfaction, attracting enormous attention from diverse academic and practical fields [25]. Many studies have shown a strong connection between subjective well-being and physical health, suggesting that a positive evaluation of well-being is linked to better health outcomes [26,27]. In light of its extensive implications, subjective well-being is a crucial indicator for assessing older adults’ health and quality of life.
Studies have been conducted on the effects of urban environments and landscapes on subjective health and well-being, with natural elements as the primary focus [28]. However, the results regarding natural elements vary. For example, one study showed that exposure to the natural outdoor environment within 300 m of their residence improved subjective health [29]. Another study found that exposure to vegetation and waterscapes within 100 and 150 m has been shown to decrease depression [30]. On the other hand, one study has concluded that the amount of greenery within 400 m, 800 m, and 1200 m of one’s home has no significant effect on subjective health [31]. These studies use the Normalized Difference Vegetation Index (NDVI) to indicate the amount of greenery [32]. In addition to natural landscapes, studies on the urban environment have also shown the impact of gentrification [33], public safety [34], and walkability [35] on subjective health perceptions.
Based on these arguments, this research aims to investigate the relationship between streetscapes and subjective well-being, which seems essential for older adults, who depend on the local environment for their daily activities. Research that has focused on various landscape elements and analyzed them at the micro-scale of the living area, with the street as the unit, which is a spatial scale directly related to the living experience of older adults, remains scarce. This study examined the relationship between the configuration of streetscapes and the subjective well-being of older adults in a municipality in Japan. Specifically, we quantified how streetscape at various spatial thresholds affects the sense of well-being by semantically subdividing the street-level images and evaluating the configuration of important landscape elements. The introduction and comparison of multiple spatial thresholds are based on the defining characteristic of assemblages, in which individual components express their characteristics as an aggregate at any scale [13], and is an attempt to incorporate the idea of “city as assemblage” as a dimension of urban planning and spatial design. The findings contribute to developing evidence-based urban design strategies that enhance livability through regenerative and inclusive planning methodologies.
The structure of the paper is as follows: Section 2 introduces the methodology, including data collection, image analysis, and statistical modeling. Section 3 presents the results, emphasizing significant relationships between streetscape elements and subjective well-being. Section 4 discusses the implications of these findings for regenerative urban design and planning. Finally, Section 5 concludes with recommendations for future research and policy applications.

2. Materials and Methods

2.1. Study Area

This study was conducted in Kunitachi, Japan. The country provides a suitable context for this study, given that individuals aged 65 and older constitute 26.6% of the population, according to the 2015 national census [36]. Kunitachi, situated approximately 30 km west of central Tokyo, was chosen for its blend of urban and suburban environments that characterize Japanese metropolitan suburbs. From a statistical perspective, Kunitachi is a typical situation in the Japanese metropolitan area. It is ranked as nearly average among municipalities in Tokyo in terms of the municipal aging rate (23.93% as of January 2023, ranked 21st/49th in Tokyo), population density (9346 persons per square kilometer as of January 2023, ranked 31st/49th in Tokyo), per capita income per taxpayer (4,807,000 yen as of 2022, ranked 16th/49th in Tokyo), and average residential land prices (356,500 yen per square meter as of July 2023, ranked 21st/49th in Tokyo) [37,38].
The Fujimidai neighborhood is located in the central part of Kunitachi. The area includes a variety of urban structures, from densely populated, walkable areas and boulevards designed for automobile traffic to agricultural lands. This mixture establishes an optimal setting for investigating the relationship between streetscape composition and subjective well-being. The area has an approximate population of 18,000 and is approximately 2.5 km from east to west and 1.0 km from north to south.

2.2. Data Collection

2.2.1. Street-Level Imagery

Street-level imagery was obtained from Mapillary [39], an online street imagery platform. Images taken in bad weather or at night were excluded from the dataset to ensure the quality of the analysis (see Figure 1 for examples).

2.2.2. Subjective Well-Being and Other Individual Data

Data on subjective well-being and other personal information were collected from a municipal questionnaire survey, the “Care Prevention and Daily Living Area Needs Survey”, in 2016. This survey, mandated for municipalities following the Long-Term Care Insurance Law, includes questions on perceived physical and mental health, social interactions, and financial circumstances. It is aimed at residents aged 75 years and older who have not been certified by the local government as requiring long-term care.
Subjective well-being was assessed by asking participants, “How happy do you feel now?” Responses were recorded on an 11-point Likert scale, ranging from 0 (not at all happy) to 10 (extremely happy). The survey also collected personal information, including age, sex (binary variable), and family structure (categorized as living alone, living with a spouse aged 65 or over, living with a spouse aged under 65, living with children, or other). Housing type was classified into seven categories: owned single-family detached house, owned unit in a housing complex, public rental housing, private rental detached housing, private rental unit in a housing complex, company housing, and others. Additionally, subjective financial status was assessed on a five-point scale (stable, somewhat stable, neither stable nor unstable, somewhat unstable, unstable). The survey also inquired about the frequency of going out, willingness to participate in community activities, and willingness to organize community activities. One thousand one hundred forty-six responses were collected from people living in the Fujimidai neighborhood. Those responses were geocoded to enable spatial analysis. The residential addresses were included in the basic data on individual residents, which was provided under a joint research agreement concluded between Kunitachi City and the authors. To avoid the leakage of personal information through the use of the geocoder, an anonymized ID was assigned to the basic data and questionnaire response data for use in this study, and a file containing only this ID and text indicating their addresses was used to convert addresses to latitude and longitude using the geocoder publicly available online, after which the latitude and longitude were reflected in the questionnaire response data using the ID. We obtained permission to use address information in our analysis, provided that we carried out the above operations and that we would not disclose individual results.
Table 1 presents the sociodemographic and personal characteristics of the survey respondents. The sample consisted of 915 older adults residing in the Fujimidai neighborhood, with a mean age of 80.66 years (SD = 4.09). Among the respondents, 42.2% were male, and 57.8% were female. Regarding family structure, 32.6% lived alone, 43.6% resided with their spouse aged 65 or over, 1.0% lived with their spouse under 65, 10.7% resided with their children, and 10.7% lived with other family members or acquaintances. Housing type varied, with 25.0% owning a single-family detached house, 18.7% living in an owned unit in a housing complex, 44.4% living in public rental housing, and the other respondents residing in private rental, company-provided housing, and others. Subjective financial status, measured on a five-point scale, showed that 5.5% of participants perceived their financial situation as stable and 34.9% as unstable, whereas 59.7% considered it neither stable nor unstable. Regarding daily activity and community engagement, the frequency of going out varied across individuals, with 42.1% reporting daily outings (five or more times a week), 45.2% reporting occasional outings (two to four times a week), 9.2% going out once a week, and 3.5% rarely going out. 60.9% of respondents expressed a willingness to participate in community activities eagerly or somewhat eagerly, while 32.2% showed interest in organizing such initiatives.

2.2.3. Additional Data

Other datasets, including land use maps and road network data, were integrated for spatial analysis. Land use and building information were extracted from the Tokyo Metropolitan Government’s Geographic Information System data, and “street units” were established, comprising segments of streets delimited from intersection to intersection [40]. Street network data were obtained from OpenStreetMap.

2.3. Image Processing and Feature Extraction

Streetscape elements were analyzed using semantic segmentation, a deep learning technique that classifies image pixels into predefined categories. This study employed DeepLabv3+ [41] trained on a Mapillary Vistas Dataset [42] with urban landscape elements. Key elements extracted included the following:
  • Object: pole, utility pole, traffic sign front, traffic sign back, traffic sign frame, streetlight, billboard, traffic light, trash can, junction box, car, bus, truck, motorcycle, bicycle;
  • Construction: building, wall, fence, rail track, road, sidewalk, curb, guard rail, other barrier;
  • Human: person;
  • Nature: sky, vegetation, terrain, mountain, water;
  • Marking: crosswalk zebra, general;

2.4. Spatial Analysis

Network-based distance measures were used instead of conventional circular buffers to better reflect the everyday walking experiences of older adults. Street network distances were calculated using GIS-based routing algorithms, providing a more accurate representation of walkable access to urban features. The distances between the center points of all street unit pairs within and around the Fujimidai neighborhood were computed using the QNEAT3 network analysis tool, a QGIS plug-in. Spatial thresholds of 50 m, 100 m, 150 m, 200 m, 250 m, and 300 m were applied to calculate the average percentage composition of each landscape element within all these scales from each street unit.

2.5. Modeling

We employed hierarchical ordinal logistic regression to examine the relationship between streetscape composition and subjective well-being. This method was chosen due to the ordinal nature of the dependent variable, which represents subjective well-being on a graded scale. The hierarchical approach was adopted to assess the incremental explanatory power of landscape composition variables beyond demographic and personal factors. By structuring the analysis in stages, we aimed to isolate the contribution of streetscape characteristics while controlling for individual-level covariates.
The variables were hierarchically incorporated into the model as follows:
  • Baseline Model: The first model included only demographic and personal variables, such as age, gender, housing type, subjective socioeconomic status, and self-reported everyday behaviors. This model served as a reference to assess the effect of individual characteristics on subjective well-being.
  • Streetscape Composition Model: The second model introduced streetscape composition variables, calculated as the proportion of different landscape elements within predefined network distance thresholds. These elements, extracted through semantic segmentation of street-level images, included vegetation, sky, road, and building, as listed in the previous section.
As mentioned above, the independent variables for landscape composition were aggregated based on network distances rather than circular buffers, ensuring a more accurate representation of physical accessibility in older adults’ daily experiences.
To assess model performance, we examined key goodness-of-fit measures, including the corrected Akaike Information Criterion (AICc) and Nagelkerke R-squared. We used those statistical indicators to compare those models and determine whether including streetscape variables significantly improved explanatory power. By employing this hierarchical modeling approach, we aimed to disentangle the relative contributions of individual elements and streetscape composition to subjective well-being. This approach provides a robust framework for evidence-based urban design interventions.

3. Results

This section presents the results of the analysis based on survey responses and spatial analysis, examining the relationships between subjective well-being among older adults and both demographic/personal factors and the proportions of streetscape elements at multiple spatial thresholds from their residences. The findings indicate statistically significant relationships between certain streetscape elements and subjective well-being, highlighting the importance of micro-scale urban environments. The following subsections offer a detailed account of the descriptive statistics, the relationships between variables and subjective well-being, and the development of hierarchical ordinal logistic regression models.

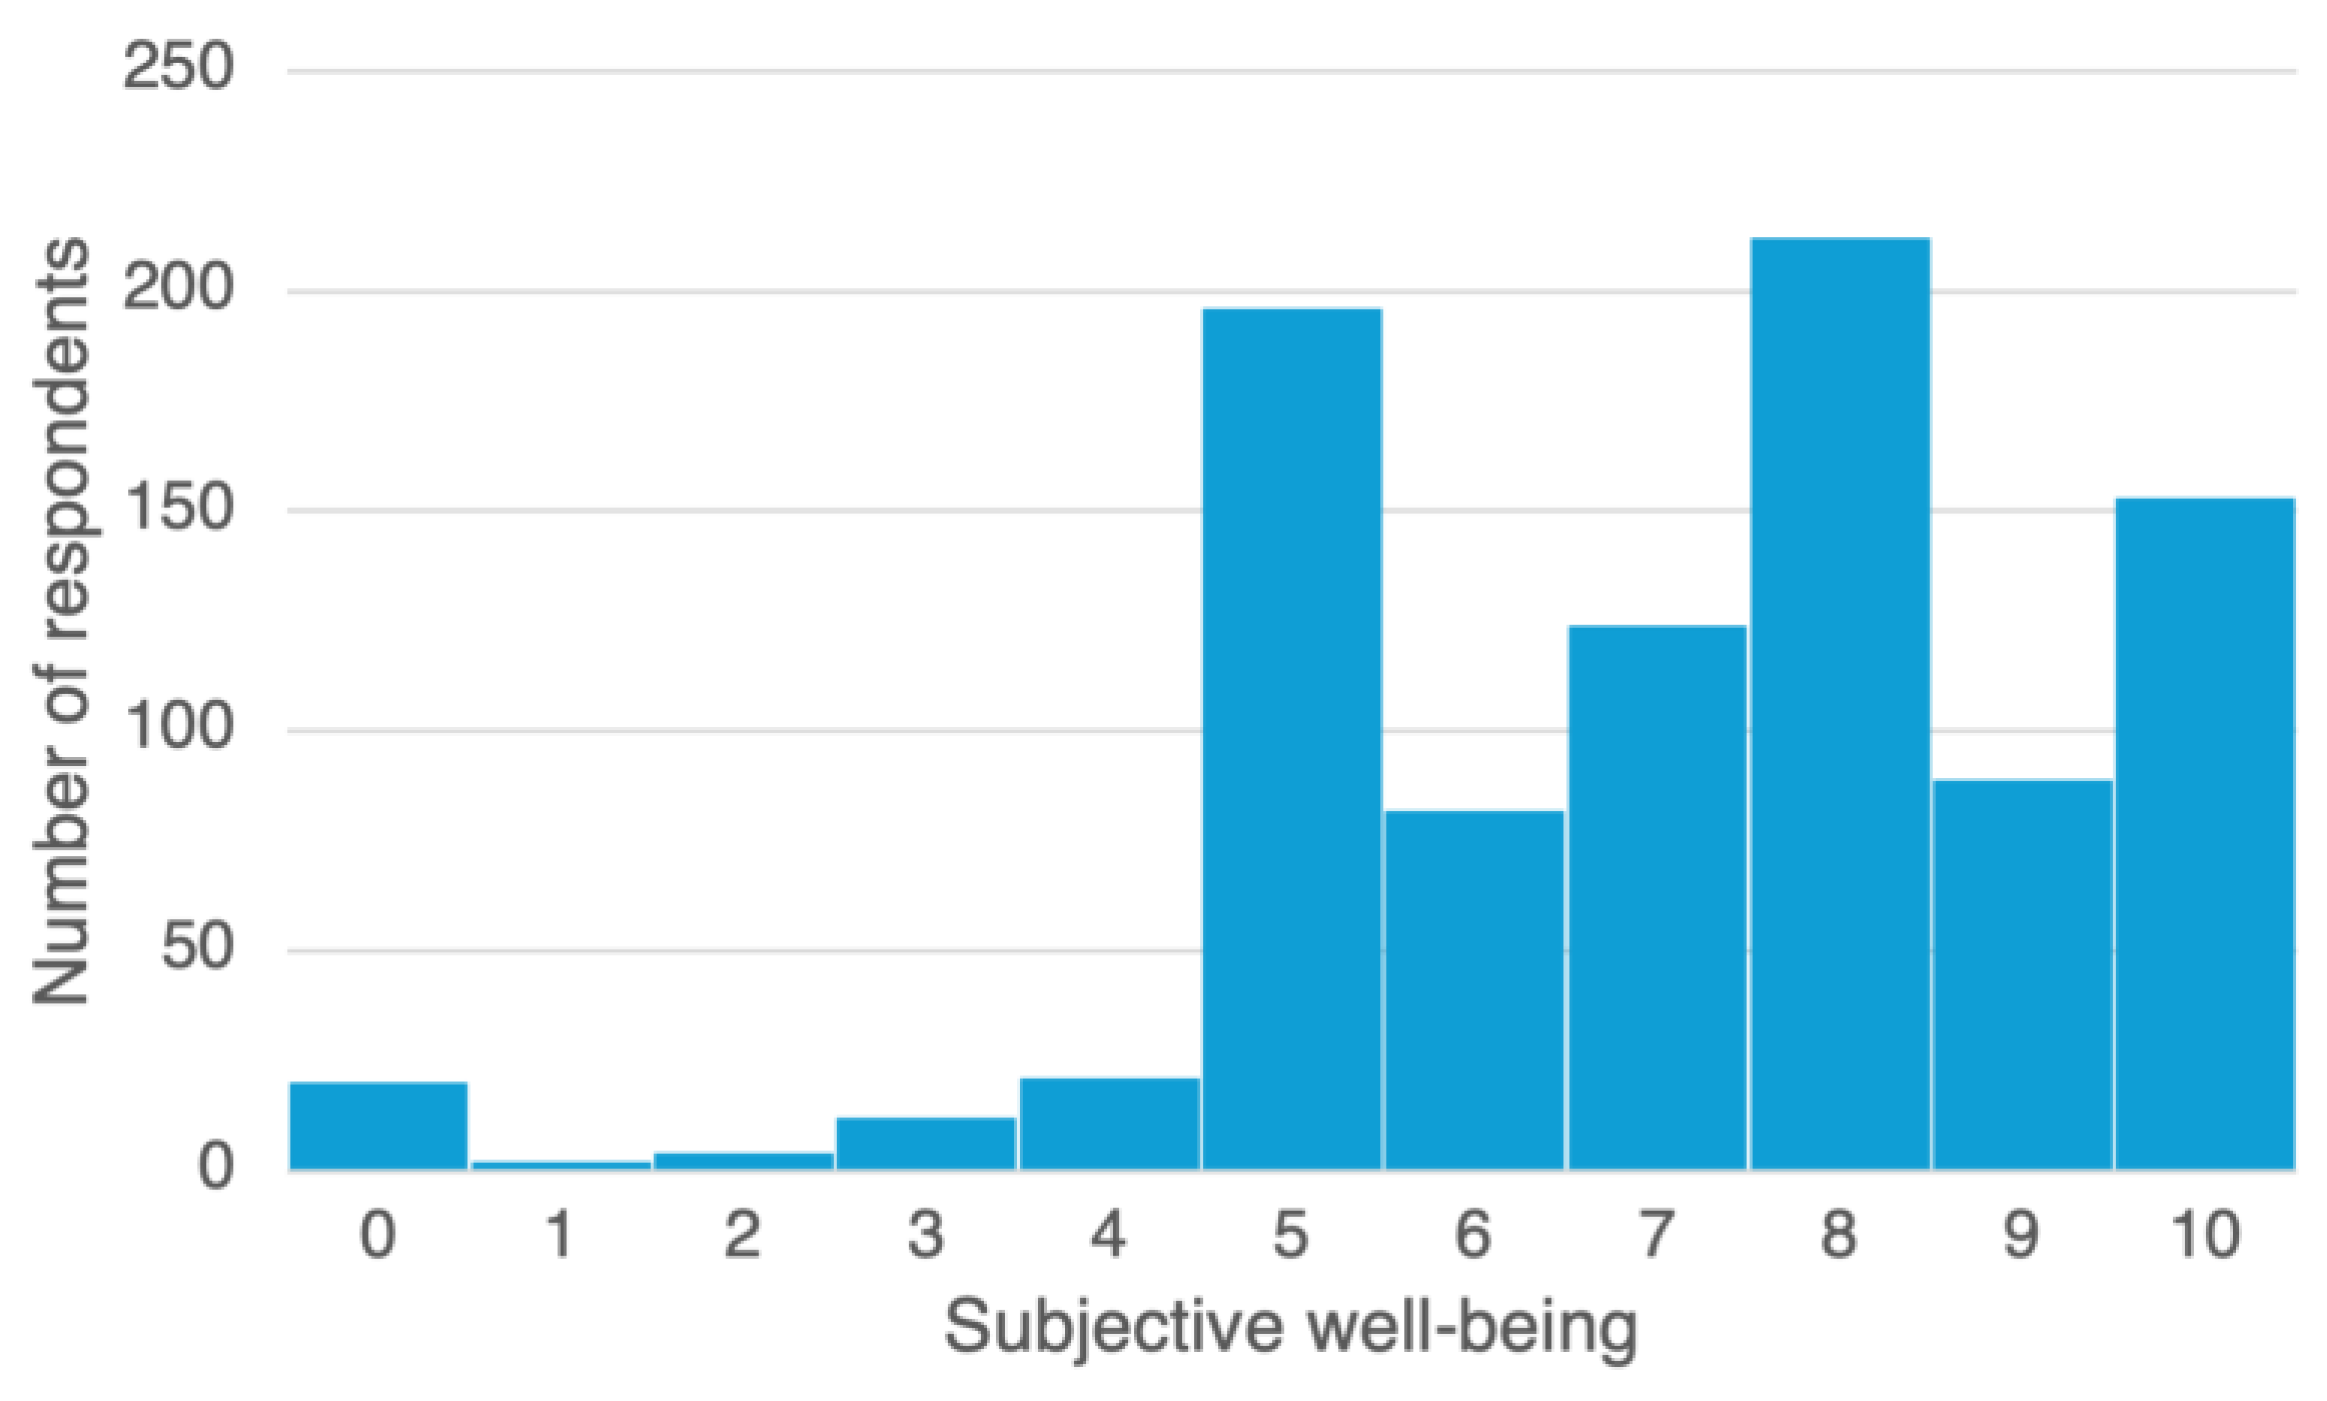
3.1. Subjective Well-Being

The average subjective well-being score was 7.10 (SD = 2.18), assessed on an 11-point Likert scale. The distribution of subjective well-being (Figure 2) shows three peaks; therefore, we decided to label them as low (marked 0–6), mid (7–8), and high (9–10).

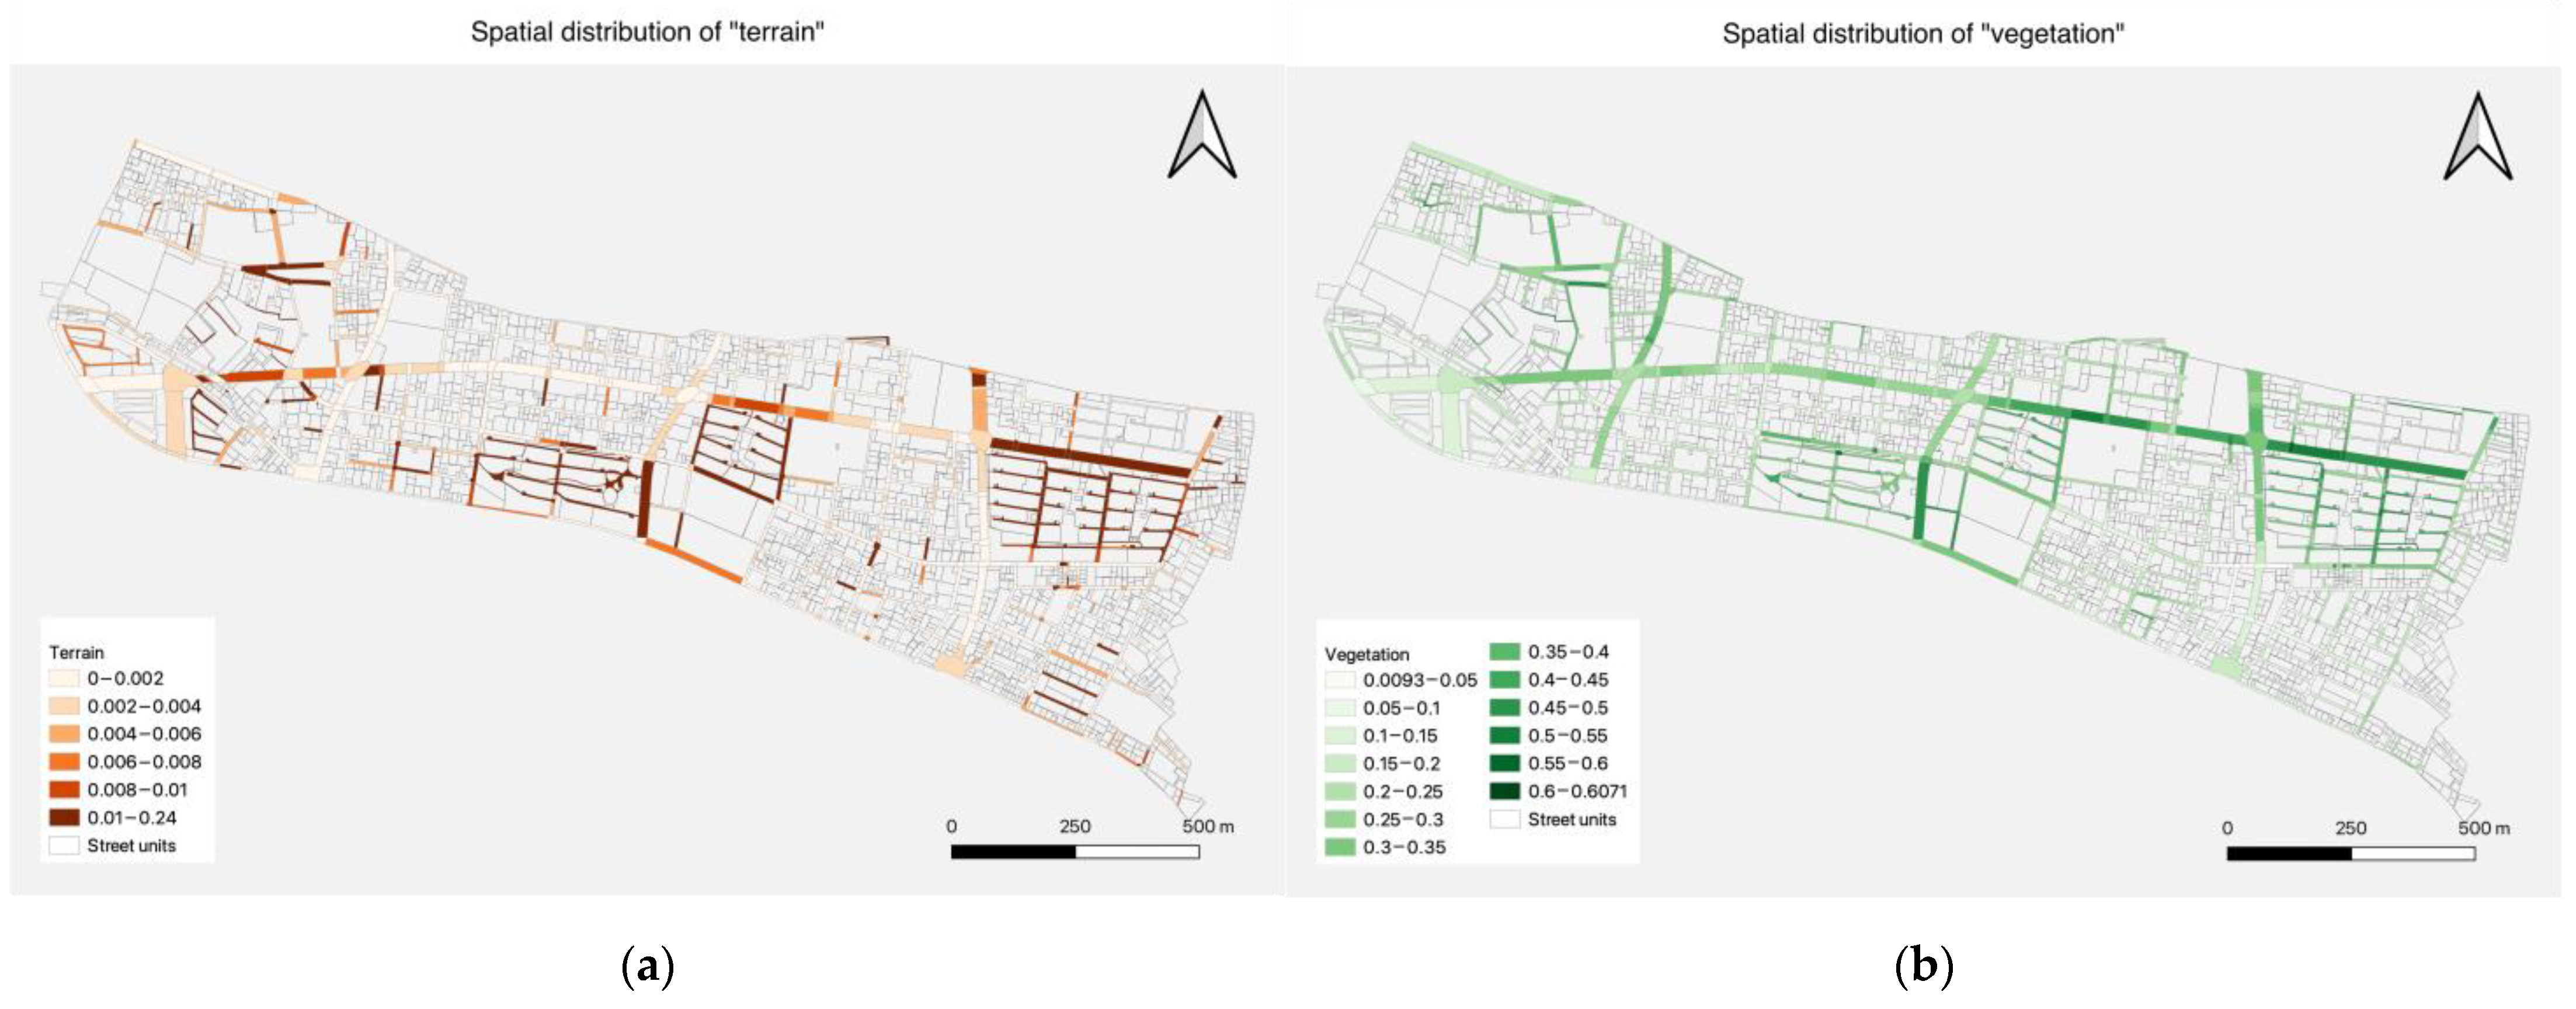
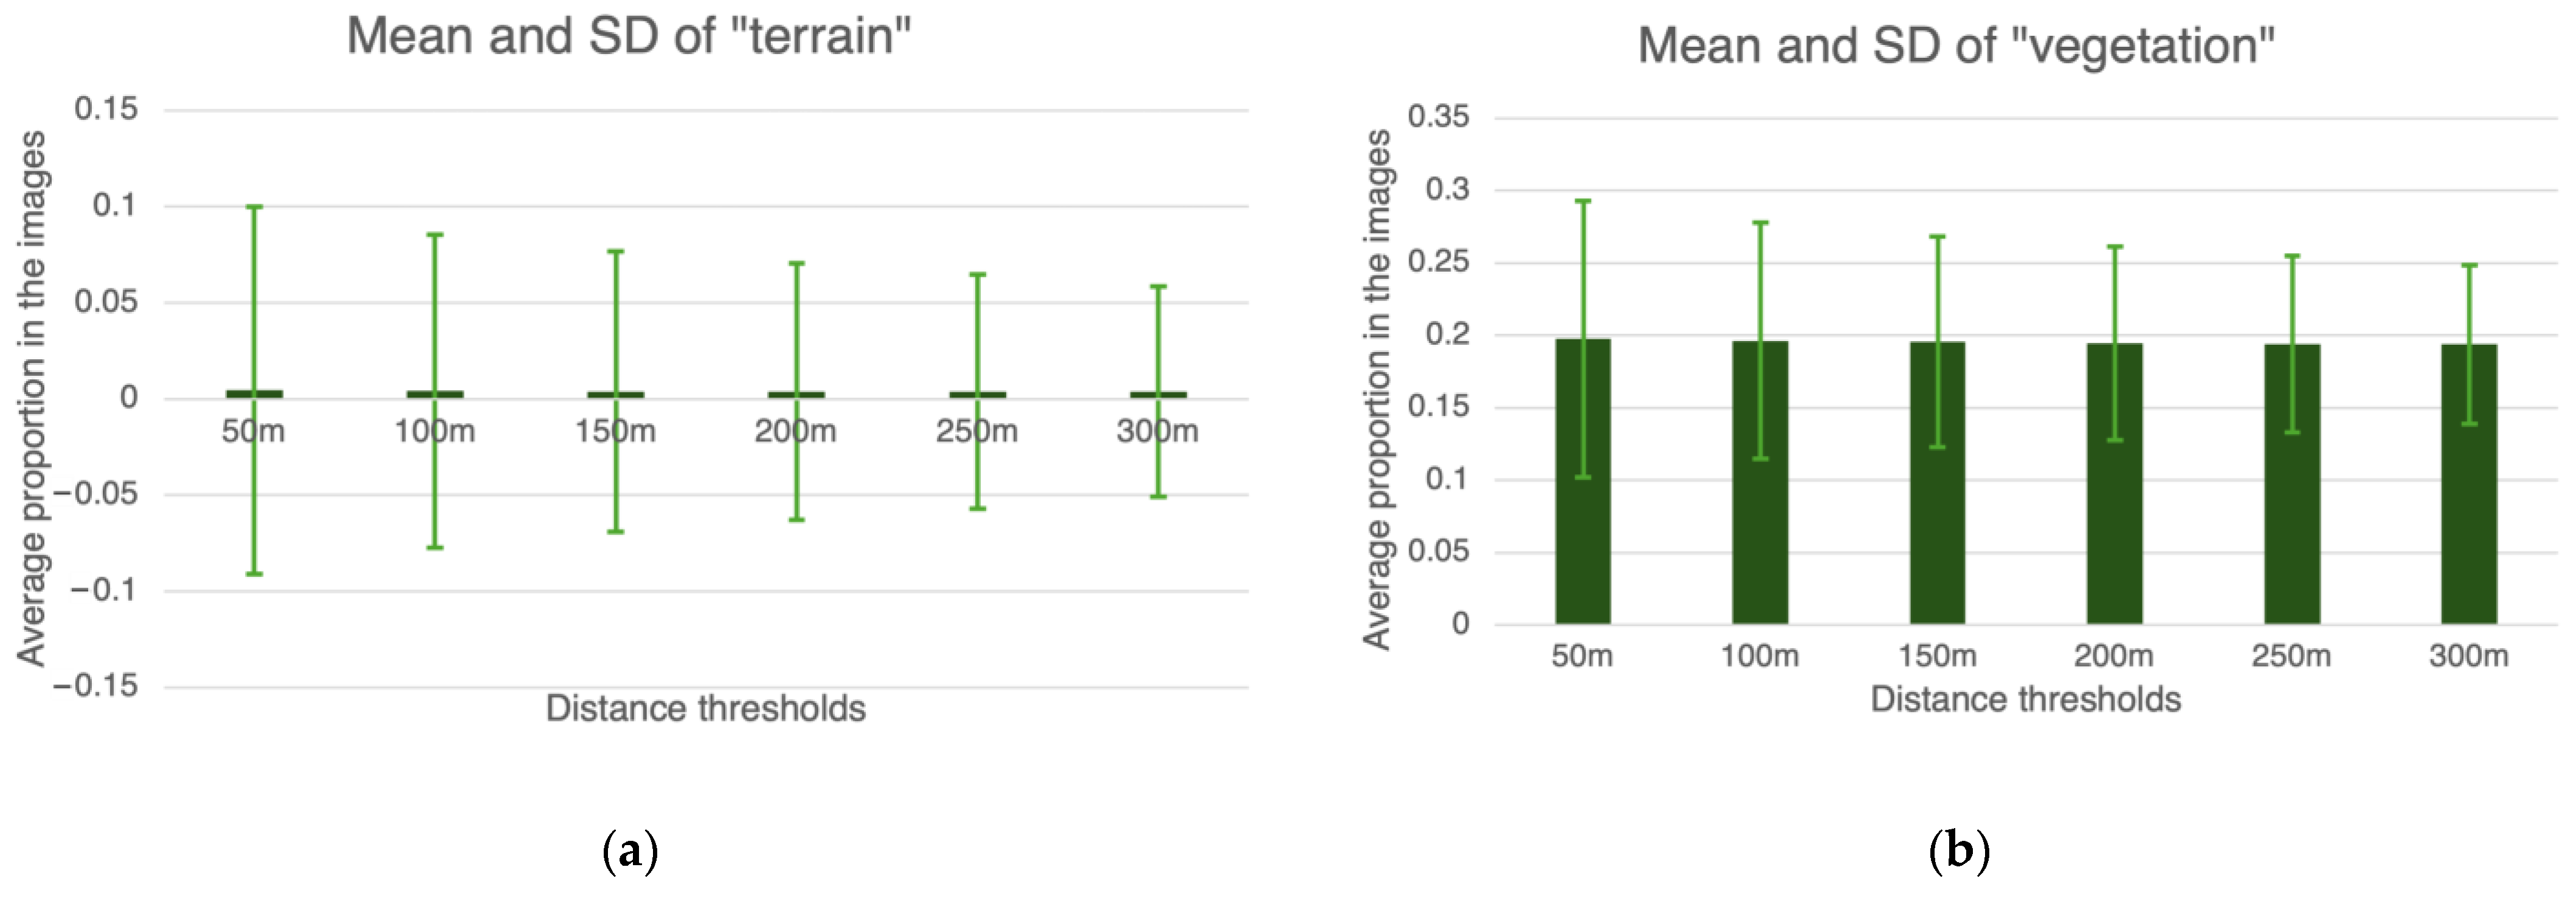
3.2. Streetscape Configurations

To identify potential impacts of correlations among landscape elements on the analysis, we first calculated the proportion and distribution of each landscape element in the streetscape configuration. Semantic segmentation was performed on 2374 street units in and around the Fujimidai neighborhood, specifying the latitude and longitude of their center points and selecting the street-level image of the nearest point. As a result, the percentage of each landscape element introduced in Section 2.3 was calculated in the image. Figure 3 shows the distribution in terms of the number of street units of the compositional proportions of the four typical elements: road, sky, building, and vegetation (these elements combined, on average, account for about 69% of the total area of the image). Roads accounted for an average of 13.5% of the image (SD = 0.059), and when divided by two percentage points, 10–12% of the image was the largest number of street units (316). Similarly, sky averaged 7.8% (SD = 0.047), buildings averaged 28.6% (SD = 0.116), and vegetation averaged 20.0% (SD = 0.119).

3.3. Bivariate Analysis

Bivariate analysis of sociodemographic and personal variables and subjective well-being is conducted as a prerequisite for creating a model to identify factors that influence subjective well-being. Since subjective well-being is a three-level ordinal scale of “low”, “medium”, and “high”, Pearson’s chi-square test was used to assess their significance. In all cases, the significance level was set at p < 0.05. Table 2 shows the percentage of subjective well-being levels and p-value for each ordinal and nominal scale. Women had significantly higher levels of subjective well-being than men, and significant differences were found for housing type, subjective financial status, frequency of going out, willingness to participate in community activities, and willingness to organize community activities. On the other hand, no significant differences were found regarding family structure.

3.4. Ordinal Logistic Regression

Hierarchical ordinal logistic regression analysis was then conducted. As a first step, a baseline model was created that did not include streetscape configurations but only sociodemographic and personal variables. Based on the results of the previous section, age, sex, housing type, subjective financial status, frequency of going out, willingness to participate in community activities, and willingness to organize community activities were entered as variables. The statistical analysis software JMP Pro (Version 18.0.1) was used for the following analyses.
A baseline model was created by selecting variables using the maximum likelihood method. The model had a negative log-likelihood (NLL) of 921.51, an AICc of 1886.06, and a Nagelkerke R-square (NR2) of 0.1676. The Area Under the Curve (AUC) was fair, with 0.6998 for “medium” and 0.7082 for “high” subjective well-being. Table 3 shows the results of the Wald test for variable effects. These results indicate that the baseline model should include age, sex, housing type, frequency of going out, and subjective financial status.
The second step is to create a streetscape composition model with the percentage of streetscape elements within a specific road network distance from the respondent’s residence as a variable. As mentioned above, the distance thresholds are 50 m, 100 m, 150 m, 200 m, 250 m, and 300 m. In selecting the distances, we are based on the methodology in a previous study [29], where the analysis was conducted in the range of 50 m to 250 m in a radius from the place of residence. For each respondent, we take the center point of the street unit that the geocoded residence faces as the starting point, calculate the mean value of the percentage composition of streetscape elements in all street units closer than a specific distance threshold from it, and use these as the values of the landscape variables linked to the individual. In each distance threshold, the correlations among the streetscape elements were checked. It turned out that, for example, in the 50 m model, the VIF exceeds 15 for the four elements that occupy a large area in the image (road, sky, building, and vegetation). Therefore, a principal component analysis of the four component proportions was performed, and a new VIF was calculated by adding the first and second principal components (PC1, PC2) instead of the four components, resulting in a maximum VIF of 8.275 for the first principal component, which is sufficiently small. The same procedure was followed for the models from 100 m to 300 m.
For each distance threshold from 50 m to 300 m, parameters were again estimated by the maximum likelihood method to create a streetscape composition model. Table 4 presents the statistical details of the model for each distance threshold and the log values and Wald test results for each variable. NLL, AICc, NR2, and AUC were calculated for each model. The 50 m model showed a significant change in NLL compared to the baseline model, improving the model’s explanatory power. In comparison, while NLL and AICc remained similar to the baseline model for all models except the 250 m model, they increased AUC by over 0.01. No change in any statistical indicators was found on the 250 m model, and no significant streetscape elements were detected that significantly impacted it. The results indicate that, in addition to sociodemographic and personal variables, different streetscape elements affect the subjective well-being of older adults within different spatial boundaries.
Table 5 shows the range of odds ratios for the significant streetscape elements in each model, expressing the odds ratio of subjective well-being between the largest and smallest value of the relevant streetscape element tied to the individual who responded to the survey.

4. Discussion

The hierarchical ordinal logistic regression analysis conducted in this study reveals that certain streetscape elements significantly affect subjective well-being at different spatial scales around the residence of older adults in relatively good health. Notably, these effects are more eminent at smaller spatial scales. It may be due to the diminishing differences between the places of residence as the distance increases. For example, terrain, which showed a statistically significant impact in the 50 m model, represents small-scale greenery and soil, and the distribution per street unit is shown in Figure 4a. In contrast, vegetation represents relatively large greenery, and the distribution per street unit is shown in Figure 4b. While the standard deviation of terrain is greater, street units with large proportions are scattered inside the city blocks, making them accessible to many individuals even in shorter distance thresholds. On the other hand, since large-scale vegetation is concentrated and distributed on some blocks and along arterial roads, many individuals can access them only when the spatial range extends to several hundred meters. Comparing the mean and standard deviation of the composition of terrain and vegetation for each individual from 50 m to 300 m, we see a gradual decrease in individual differences (Figure 5).
The revealed effects of streetscape elements on subjective well-being vary across spatial scales. In the 50 m model, the smallest spatial scales addressed in this study, the impact of streetscape elements, distinguished from sociodemographic and personal variables, was most eminent, with elements like sidewalks and terrain having a more positive impact. This finding suggests that enhancing a well-designed walking environment is important in the very vicinity of the residence of older adults. At 100 m to 200 m from the residence, streetlights, buses, walls, and guard rails contributed positively, while billboards and crosswalks had a negative effect. These results suggest that primary roads nearby with moderate traffic and pedestrian infrastructure play a role in well-being, while boulevards having commercial billboards and crosswalks may be too large to be present near their homes. Significant streetscape elements were not detected in the 250 m model. Finally, the positive impact of a lower PC1 value in the 300 m model was found.
To better interpret PC1 in the 300 m model, we will now investigate the principal component analysis of the composition ratio of the four main elements of the streetscape: road, sky, building, and vegetation. Figure 6 displays the component vectors of the four elements with PC1 on the horizontal axis and PC2 on the vertical axis for each model from 50 m to 300 m. Across all distance thresholds, PC1 has positive contributions from roads, sky, and buildings and negative contributions from vegetation. In PC2, road and sky are positive, buildings are negative, with vegetation remaining neutral. The range odds ratio of 0.003 for PC1 in the 300 m model suggests that a higher proportion of vegetation at this scale enhances subjective well-being. This finding aligns with previous research findings that access to large green spaces at the neighborhood scale is desirable for improving subjective health and well-being and reducing the risk of certain mental illnesses among older adults.
The results of this study contribute to neighborhood-scale planning and design through the lenses of regenerative urbanism and assemblage thinking. The insignificance of PC1 and PC2 below 250 m, coupled with the statistical significance of smaller-scale elements such as terrain and ground-level facilities, suggests a strong connection to the principles of regeneration and resilience. Unlike large-scale infrastructure such as buildings and roads, small-sized elements such as sidewalks, terrain, and guard rails can be modified or experimentally implemented in the short term, opening up the possibility of intervention through tactical efforts in the micro-scale urban environment. Additionally, the difference in significant streetscape elements at different spatial scales suggests that individuals may perceive a certain “semantic cohesion” at a sub-neighborhood scale. This empirical evidence supports the assemblage thinking, in which various components of a city dynamically assemble and disassemble across scales to express their emergent properties.
In discussing the findings obtained in this study, it is also necessary to consider the effect of the urban planning regulations. In the study area, the Kunitachi City Community Development Ordinance stipulates procedures for making development projects meet certain criteria, such as the submission of prior consultation documents, holding meetings to provide explanations to neighborhood residents, and confirmation of conformance with approval criteria. The ordinance sets standards, such as minimum lot size, green space, building height restrictions, road widths, and sidewalk installations [43]. The possibility that these standards influence the high percentage of sidewalks and vegetation, which can be extracted from street-level images, and subsequently contribute to improving the subjective well-being of older adults provides a rationale for the legitimacy of regulations and guidelines related to building and spatial design that have been introduced in various regions.

5. Conclusions

This study examined the relationship between streetscape elements and subjective well-being at different spatial scales and revealed that significant environmental factors vary depending on distance. Specifically, the desirable direction of streetscape design to enhance the subjective well-being of older adults includes the development of a safe and pleasant walking environment with terrains and sidewalks in the very vicinity of their homes and having a living primary road of moderate size located a short distance away from their homes. The study also revealed that large-scale greenery is beneficial if located within a neighborhood scale. Implications of these findings for urban design include the fact that multiple spatial scales should be considered simultaneously rather than relying on a single scale. This can be seen as an indication that assemblage thinking applies to urban design. In addition, given the fact that the streetscape elements for which standards are set in the Kunitachi City Community Development Ordinance, such as the provision of green space and sidewalks, were shown to contribute to the subjective well-being of older adults, it is expected that the findings on streetscape and subjective well-being presented in this study can be used in the formulation of such ordinances and guidelines.
Future research can contribute to a more comprehensive urban design and planning approach by exploring three directions while recognizing the limitations of this study. The first is to incorporate short-term temporal variability. Although open-source street-level imagery was used in this study, the images at each location were only taken at a single moment, and the study could not account for transient factors, such as time of day and weather conditions. This limitation in data availability could be solved by the emergence of new methodologies for capturing and sharing streetscapes. For example, mobility-mounted devices could facilitate more dynamic analyses. Data sources other than movies and images, such as audio, may also be combined to provide a more detailed understanding of the situation. Second, a long-term temporal variation could be added, as subjective well-being and the streetscape are expected to evolve. A longitudinal study tracking physical and perceptual changes in the streetscape could contribute to regenerative and assemblage-based urbanism theories. Finally, although this study uses a typical urban neighborhood in a Japanese metropolitan suburb as its case study, the relationship between streetscape and subjective well-being may differ in different urban contexts. Conducting comparative analyses across a broader range of people and cultures is essential to developing theories that account for cultural differences between countries and regions. This will ultimately lead to practices depending on those contexts.

Author Contributions

Conceptualization, T.I.; methodology, T.I.; software, T.I. and R.M.; validation, T.I. and R.M.; formal analysis, T.I.; investigation, T.I.; resources, R.M. and H.K.; data curation, T.I.; writing—original draft preparation, T.I.; writing—review and editing, R.M., A.M. and H.K.; visualization, T.I.; supervision, A.M. and H.K.; project administration, H.K. All authors have read and agreed to the published version of the manuscript.

Funding

This research received no external funding.

Data Availability Statement

The data presented in this study are available on request from the corresponding author due to privacy reasons.

Acknowledgments

This research was conducted with the cooperation of the city government of Kunitachi, Tokyo, Japan.

Conflicts of Interest

The authors declare no conflicts of interest.

References

  1. Betsill, M.M.; Bulkeley, H. Cities and the multilevel governance of global climate change. In Understanding Global Cooperation: Twenty-Five Years of Research on Global Governance; Mills, K., Stiles, K., Eds.; Brill: Leiden, The Netherlands, 2021; pp. 219–236. [Google Scholar] [CrossRef]
  2. Hölscher, K.; Frantzeskaki, N. Perspectives on urban transformation research: Transformations in, of, and by cities. Urban Transform. 2021, 3, 2. [Google Scholar] [CrossRef]
  3. Seto, K.C.; Churkina, G.; Hsu, A.; Keller, M.; Newman, P.W.; Qin, B.; Ramaswami, A. From low-to net-zero carbon cities: The next global agenda. Annu. Rev. Environ. Resour. 2021, 46, 377–415. [Google Scholar] [CrossRef]
  4. Hamnett, C. The changing social structure of global cities: Professionalisation, proletarianisation or polarisation. Urban Stud. 2021, 58, 1050–1066. [Google Scholar] [CrossRef]
  5. Vertovec, S. Superdiversity: Migration and Social Complexity; Taylor & Francis: London, UK, 2023. [Google Scholar] [CrossRef]
  6. Döringer, S.; Uchiyama, Y.; Penker, M.; Kohsaka, R. A meta-analysis of shrinking cities in Europe and Japan. Towards an integrative research agenda. Eur. Plan. Stud. 2020, 28, 1693–1712. [Google Scholar] [CrossRef]
  7. Lesthaeghe, R. The second demographic transition, 1986–2020: Sub-replacement fertility and rising cohabitation—A global update. Genus 2020, 76, 10. [Google Scholar] [CrossRef]
  8. Wolff, M.; Wiechmann, T. Urban growth and decline: Europe’s shrinking cities in a comparative perspective 1990–2010. Eur. Urban Reg. Stud. 2018, 25, 122–139. [Google Scholar] [CrossRef]
  9. Datola, G. Implementing urban resilience in urban planning: A comprehensive framework for urban resilience evaluation. Sustain. Cities Soc. 2023, 98, 104821. [Google Scholar] [CrossRef]
  10. Nel, D.; du Plessis, C.; Landman, K. Planning for dynamic cities: Introducing a framework to understand urban change from a complex adaptive systems approach. Int. Plan. Stud. 2018, 23, 250–263. [Google Scholar] [CrossRef]
  11. Thomson, G.; Newman, P. Cities and the Anthropocene: Urban governance for the new era of regenerative cities. Urban Stud. 2020, 57, 1502–1519. [Google Scholar] [CrossRef]
  12. Thomson, G.; Newman, P. Urban fabrics and urban metabolism–from sustainable to regenerative cities. Resour. Conserv. Recycl. 2018, 132, 218–229. [Google Scholar] [CrossRef]
  13. DeLanda, M. Assemblage Theory; Edinburgh University Press: Edinburgh, UK, 2016. [Google Scholar]
  14. Dovey, K.; Rao, F.; Pafka, E. Agglomeration and assemblage: Deterritorialising urban theory. Urban Stud. 2018, 55, 263–273. [Google Scholar] [CrossRef]
  15. Durose, C.; van Ostaijen, M.; van Hulst, M.; Escobar, O.; Agger, A. Working the urban assemblage: A transnational study of transforming practices. Urban Stud. 2022, 59, 2129–2146. [Google Scholar] [CrossRef]
  16. Lara-Hernandez, J.A.; Melis, A.; Lehmann, S. Temporary appropriation of public space as an emergence assemblage for the future urban landscape: The case of Mexico City. Future Cities Environ. 2019, 5, 1–22. [Google Scholar] [CrossRef]
  17. Thwaites, K.; Simpson, J.; Simkins, I. Transitional edges: A conceptual framework for socio-spatial understanding of urban street edges. Urban Des. Int. 2020, 25, 295–309. [Google Scholar] [CrossRef]
  18. Arai, H.; Ouchi, Y.; Toba, K.; Endo, T.; Shimokado, K.; Tsubota, K.; Matsuo, S.; Mori, H.; Yumura, W.; Yokode, M.; et al. Japan as the front-runner of super-aged societies: Perspectives from medicine and medical care in Japan. Geriatr. Gerontol. Int. 2015, 15, 673–687. [Google Scholar] [CrossRef]
  19. Levasseur, M.; Généreux, M.; Bruneau, J.F.; Vanasse, A.; Chabot, É.; Beaulac, C.; Bédard, M.M. Importance of proximity to resources, social support, transportation and neighborhood security for mobility and social participation in older adults: Results from a scoping study. BMC Public Health 2015, 15, 503. [Google Scholar] [CrossRef]
  20. Maresova, P.; Krejcar, O.; Maskuriy, R.; Bakar, N.A.A.; Selamat, A.; Truhlarova, Z.; Horak, J.; Joukl, M.; Vítkova, L. Challenges and opportunity in mobility among older adults–key determinant identification. BMC Geriatr. 2023, 23, 447. [Google Scholar] [CrossRef]
  21. Chen, Y.; Huang, X.; White, M. A study on street walkability for older adults with different mobility abilities combining street view image recognition and deep learning- The case of Chengxianjie Community in Nanjing (China). Comput. Environ. Urban Syst. 2024, 112, 102151. [Google Scholar] [CrossRef]
  22. Moran, M.R.; Werner, P.; Doron, I.; HaGani, N.; Benvenisti, Y.; King, A.C.; Winter, S.J.; Sheats, J.L.; Garber, R.; Motro, H.; et al. Exploring the objective and perceived environmental attributes of older adults’ neighborhood walking routes: A mixed methods analysis. J. Aging Phys. Act. 2017, 25, 420–431. [Google Scholar] [CrossRef]
  23. Yang, L.; Ao, Y.; Ke, J.; Lu, Y.; Liang, Y. To walk or not to walk? Examining non-linear effects of streetscape greenery on walking propensity of older adults. J. Transp. Geogr. 2021, 94, 103099. [Google Scholar] [CrossRef]
  24. Yap, W.; Chang, J.H.; Biljecki, F. Incorporating networks in semantic understanding of streetscapes: Contextualising active mobility decisions. Environ. Plan. B Urban Anal. City Sci. 2023, 50, 1416–1437. [Google Scholar]
  25. Diener, E.; Oishi, S.; Tay, L. Advances in subjective well-being research. Nat. Hum. Behav. 2018, 2, 253–260. [Google Scholar]
  26. Diener, E.; Pressman, S.D.; Hunter, J.; Delgadillo-Chase, D. If, why, and when subjective well-being influences health, and future needed research. Appl. Psychol. Health Well Being 2017, 9, 133–167. [Google Scholar] [CrossRef]
  27. Steptoe, A.; Deaton, A.; Stone, A.A. Subjective wellbeing, health, and ageing. Lancet 2015, 385, 640–648. [Google Scholar] [PubMed]
  28. Smardon, R.C. Perception and aesthetics of the urban environment: Review of the role of vegetation. Landsc. Urban Plan. 1988, 15, 85–106. [Google Scholar] [CrossRef]
  29. Triguero-Mas, M.; Dadvand, P.; Cirach, M.; Martínez, D.; Medina, A.; Mompart, A.; Basagaña, X.; Gražulevičienė, R.; Nieuwenhuijsen, M.J. Natural outdoor environments and mental and physical health: Relationships and mechanisms. Environ. Int. 2015, 77, 35–41. [Google Scholar]
  30. Zhifeng, W.; Yin, R. The influence of greenspace characteristics and building configuration on depression in the elderly. Build. Environ. 2021, 188, 107477. [Google Scholar]
  31. Kim, Y. Impacts of the perception of physical environments and the actual physical environments on self-rated health. Int. J. Urban Sci. 2016, 20, 73–87. [Google Scholar]
  32. Pettorelli, N. The Normalized Difference Vegetation Index; Oxford University Press: Oxford, UK, 2013. [Google Scholar]
  33. Izenberg, J.M.; Mujahid, M.S.; Yen, I.H. Health in changing neighborhoods: A study of the relationship between gentrification and self-rated health in the state of California. Health Place 2018, 52, 188–195. [Google Scholar]
  34. Lamarca, G.A.; Leal, M.D.C.; Sheiham, A.; Vettore, M.V. The association of neighbourhood and individual social capital with consistent self-rated health: A longitudinal study in Brazilian pregnant and postpartum women. BMC Pregnancy Childbirth 2013, 13, 1. [Google Scholar] [CrossRef]
  35. Soares, J.; Simões, E.J.; Ramos, L.R.; Pratt, M.; Brownson, R.C. Cross-sectional associations of health-related quality of life measures with selected factors: A population-based sample in Recife, Brazil. J. Phys. Act. Health 2010, 7, S229–S241. [Google Scholar] [CrossRef] [PubMed]
  36. Statistics Bureau of Japan. Available online: https://www.stat.go.jp/english/data/kokusei/2015/final_en/final_en.html (accessed on 9 February 2025).
  37. Statistics Bureau of Japan. Available online: https://www.e-stat.go.jp/stat-search/files?page=1&toukei=00200241&tstat=000001039591 (accessed on 17 March 2025).
  38. OCN Real Estate. Available online: https://house.ocn.ne.jp/toshi/detail/13215/ (accessed on 17 March 2025).
  39. Mapillary. Available online: https://www.mapillary.com/ (accessed on 9 February 2025).
  40. Inoue, T.; Manabe, R.; Murayama, A.; Koizumi, H. Aggregation of Geospatial Data on “Street Units”: The Smallest Geographical Unit of Urban Places. In Urban Informatics and Future Cities; Geertman, S.C.M., Pettit, C., Goodspeed, R., Staffans, A., Eds.; Springer: Cham, Switzerland, 2021; pp. 501–526. [Google Scholar]
  41. Chen, L.C.; Zhu, Y.; Papandreou, G.; Schroff, F.; Adam, H. Encoder-decoder with atrous separable convolution for semantic image segmentation. In Proceedings of the European Conference on Computer Vision (ECCV), Munich, Germany, 8–14 September 2018. [Google Scholar]
  42. Neuhold, G.; Ollmann, T.; Rota Bulo, S.; Kontschieder, P. The mapillary vistas dataset for semantic understanding of street scenes. In Proceedings of the IEEE International Conference on Computer Vision, Venice, Italy, 24–27 October 2017. [Google Scholar]
  43. Kunitachi City. Available online: https://www.city.kunitachi.tokyo.jp/machi/keikaku/9355.html (accessed on 17 March 2025).
Figure 1. Typical examples of streetscape images: (a) a shopping street near a train station; (b) a lush green boulevard; (c) a public housing complex; and (d) a single-family residential area.
Land 14 00680 g001
Figure 2. The distribution of subjective well-being in the questionnaire survey.
Land 14 00680 g002
Figure 3. The distribution of the compositions of landscape elements in the imagery among street units: (a) road; (b) sky; (c) building; and (d) vegetation.
Land 14 00680 g003
Figure 4. The geographic distributions: (a) terrain; (b) vegetation.
Land 14 00680 g004
Figure 5. The mean and standard deviation: (a) terrain; (b) vegetation.
Land 14 00680 g005
Figure 6. The component vectors of the principal component analysis of four streetscape elements—vegetation, sky, roads, and buildings—in different distance thresholds: (a) 50 m model; (b) 100 m model; (c) 150 m model; (d) 200 m model; (e) 250 m model; (f) 300 m model.
Land 14 00680 g006
Table 1. Sociodemographic and personal characteristics of the survey respondents.
CategoryItemNumber of
Respondents
Proportion (%)
Age75–7931234.1
80–8441144.9
85–8914816.2
90–94374.0
95 or over40.4
SexMale38642.2
Female52957.8
Family structureLiving alone29832.6
Living with a spouse aged 65 or over39943.6
Living with a spouse aged under 6591.0
Living with children11112.1
Other9810.7
Housing typeOwned single-family detached house22925.0
Owned a unit in a housing complex17118.7
Rental public housing40644.4
Rental private detached house30.3
Rental private unit in a housing complex9210.1
Company-provided housing70.8
Other70.8
Subjective financial statusStable70.8
Somewhat stable434.7
Neither stable nor unstable54659.7
Somewhat unstable25327.7
Unstable667.2
Frequency of going outFive or more times a week38542.1
Two to four times a week41445.2
Once a week849.2
Rarely323.5
Willingness to participate in
community activities
Would love to participate707.7
May participate48753.2
Do not want to participate35839.1
Willingness to organize
community activities
Would love to organize242.6
May organize27129.6
Do not want to organize62067.8
Table 2. Difference between sociodemographic and personal characteristics.
CategoryItemSubjective Well-Being (%)p-Value
LowMidHigh
SexMale41.738.320.00.0004
Female33.335.531.2
Family structureLiving alone37.639.622.80.6732
Living with a spouse aged 65 or over37.334.328.3
Living with a spouse aged under 6522.233.344.4
Living with children36.035.128.8
Other34.739.825.5
Housing typeOwned single-family detached house27.537.634.90.0005
Owned a unit in a housing complex30.439.829.8
Rental public housing44.335.720.0
Rental private detached house33.30.066.7
Rental private unit in a housing complex37.033.729.4
Company-provided housing57.128.614.3
Other42.957.10.0
Subjective financial statusStable14.342.942.9<0.0001
Somewhat stable9.341.948.8
Neither stable nor unstable30.438.131.5
Somewhat unstable49.436.414.2
Unstable62.122.715.2
Frequency of going outFive or more times a week31.236.432.5<0.0001
Two to four times a week36.538.924.6
Once a week52.433.314.3
Rarely68.821.99.4
Willingness to participate in
community activities
Would love to participate22.938.638.60.0006
May participate33.339.826.9
Do not want to participate44.432.123.5
Willingness to organize
community activities
Would love to organize20.836.726.50.0056
May organize29.940.229.9
Do not want to organize40.535.324.2
p-values < 0.05 were considered statistically significant.
Table 3. The statistical profile of a baseline model.
CharacteristicsDegree of FreedomWald Chi-Squarep-Value
Age13.89750.0484
Sex117.7344<0.0001
Housing type613.01900.0427
Subjective financial status326.7374<0.0001
Frequency of going out441.7977<0.0001
Willingness to participate in community activities22.47720.2898
Willingness to organize community activities23.19120.2028
p-values < 0.05 were considered statistically significant.
Table 4. The statistical details and the effects of variables in streetscape composition models.
VariableModel_50 mModel_100 mModel_150 mModel_200 mModel_250 mModel_300 m
Log ValueWald Chi-SquareLog ValueWald Chi-SquareLog ValueWald Chi-SquareLog ValueWald Chi-SquareLog ValueWald Chi-SquareLog ValueWald Chi-Square
Age0.483 1.013 1.091 3.196 1.190 3.530 1.104 3.193 1.160 3.417 0.950 2.618
Sex3.674 13.722 ** 4.247 16.052 ** 4.776 18.255 ** 4.663 17.848 ** 4.893 18.771 ** 4.906 18.789 **
Housing type0.878 7.618 0.850 9.772 0.512 7.389 0.903 10.309 0.568 7.908 1.237 12.552
Frequency of going out2.867 15.390 ** 7.237 35.141 ** 6.437 31.452 ** 6.503 31.720 ** 6.007 29.328 ** 6.106 29.909 **
Subjective financial status5.687 31.081 ** 8.311 42.930 ** 9.276 46.818 ** 9.096 46.122 ** 8.417 43.020 ** 7.836 40.375 **
PC10.201 0.236 0.123 0.103 0.749 1.913 0.755 1.905 0.044 0.015 1.863 6.075 *
PC21.136 3.316 0.197 0.225 1.001 2.728 0.106 0.074 0.313 0.500 0.009 0.001
Pole0.356 0.598 0.540 1.124 0.301 0.465 0.618 1.370 0.034 0.009 1.178 3.438
Utility pole2.355 7.950 ** 0.052 0.020 0.050 0.019 0.469 0.924 0.199 0.230 0.130 0.113
Traffic sign (front)0.299 0.451 0.067 0.033 0.287 0.430 0.928 2.452 0.092 0.058 0.022 0.004
Traffic sign (back)0.166 0.175 0.576 1.228 0.731 1.720 0.510 1.022 0.555 1.178 0.162 0.163
Traffic sign (frame)1.234 3.706 1.982 6.741 ** 1.258 3.709 1.626 5.232 * 0.070 0.036 0.491 0.981
Streetlight1.299 3.562 2.078 6.921 ** 2.019 6.841 ** 1.642 5.206 * 0.647 1.464 0.058 0.026
Billboard0.079 0.042 1.462 4.320 * 1.822 5.851 * 1.544 4.801 * 0.984 2.691 0.667 1.593
Traffic light0.316 0.504 0.231 0.305 0.145 0.135 0.844 2.164 0.654 1.526 0.207 0.257
Trash can0.104 0.074 0.109 0.082 0.287 0.416 0.003 0.000 0.151 0.143 0.335 0.541
Junction box2.596 8.826 ** 1.070 3.057 0.575 1.282 0.828 2.122 0.347 0.583 0.141 0.127
Car0.089 0.056 0.060 0.026 0.264 0.356 0.468 0.882 0.318 0.489 0.149 0.142
Bus1.274 3.763 1.068 3.029 1.437 4.310 * 2.351 8.039 ** 0.323 0.511 0.845 2.211
Truck0.714 1.956 0.128 0.102 0.275 0.401 0.190 0.219 0.189 0.217 0.494 1.013
Motorcycle1.309 3.824 0.885 2.380 0.451 0.866 0.779 1.888 0.046 0.015 1.404 2.990
Bicycle1.179 3.484 0.080 0.048 0.268 0.392 0.220 0.272 0.133 0.117 0.072 0.037
Wall1.264 3.545 0.431 0.796 0.362 0.632 1.892 6.284 * 0.377 0.678 0.052 0.021
Fence0.334 0.545 0.401 0.722 0.138 0.121 0.311 0.476 0.336 0.556 1.738 5.513 *
Rail track1.291 3.833 1.338 4.196 * 0.713 1.789 0.176 0.188 0.331 0.568 0.126 0.101
Sidewalk1.811 5.678 * 0.265 0.367 0.150 0.140 0.938 2.394 1.307 3.788 0.214 0.261
Curb1.452 4.375 * 0.098 0.063 0.296 0.453 0.244 0.317 0.147 0.138 0.774 1.915
Guard rail0.262 0.364 0.323 0.527 0.136 0.124 2.291 7.938 ** 0.142 0.136 0.221 0.275
Other barriers0.729 1.674 1.030 2.771 2.176 7.312 ** 1.544 4.990 * 0.492 0.999 0.904 2.496
Person0.053 0.021 0.011 0.001 0.182 0.200 0.297 0.447 0.910 2.403 0.214 0.268
Terrain1.694 5.126 * 0.756 1.838 0.555 1.187 0.096 0.063 0.322 0.507 0.178 0.189
Mountain0.307 0.446 0.071 0.037 0.098 0.064 0.024 0.005 0.055 0.023 0.526 1.080
Water1.394 3.457 0.059 0.024 0.032 0.008 0.807 1.997 0.485 0.944 0.233 0.305
Crosswalk0.195 0.218 0.605 1.348 1.765 5.868 * 3.021 10.893 ** 0.312 0.499 1.569 5.003 *
Marking
(general)
1.804 5.745 * 0.436 0.804 1.071 2.967 1.165 3.287 0.943 2.510 0.233 0.296
Statistical details
NLL648.81874.19905.24902.53914.97911.47
AICc1398.921847.791909.691904.261929.141922.15
NR20.22270.19750.20110.20660.18120.1884
AUC (mid)0.74420.72190.72110.72880.70990.7149
AUC (high)0.71610.71970.72540.72300.71160.7159
** p < 0.01, * p < 0.05.
Table 5. The odds ratio of statistically significant streetscape elements.
Model_50 mModel_100 mModel_150 mModel_200 mModel_250 mModel_300 m
PC1 0.003
PC2
Pole
Utility pole9.728
Traffic sign (front)
Traffic sign (back)
Traffic sign (frame) 0.075 0.007
Streetlight 8.370 12.613 9.202
Billboard 0.087 0.098 0.088
Traffic light
Trash can
Junction box0.079
Car
Bus 4.080 10.591
Truck
Motorcycle
Bicycle
Wall 41.619
Fence 0.072
Rail track 4.929
Sidewalk5.375
Curb0.121
Guard rail 282.808
Other barriers 0.094 0.113
Person
Terrain6.598
Mountain
Water
Crosswalk 0.212 0.056 24.751
Marking (general)5.185
Disclaimer/Publisher’s Note: The statements, opinions and data contained in all publications are solely those of the individual author(s) and contributor(s) and not of MDPI and/or the editor(s). MDPI and/or the editor(s) disclaim responsibility for any injury to people or property resulting from any ideas, methods, instructions or products referred to in the content.

