
Temporal Heterogeneity in Land Use Effects on Urban Rail Transit Ridership—Case of Beijing, China


Abstract
1. Introduction
2. Related Work
3. Study Design
3.1. Study Area
3.2. Data and Processing
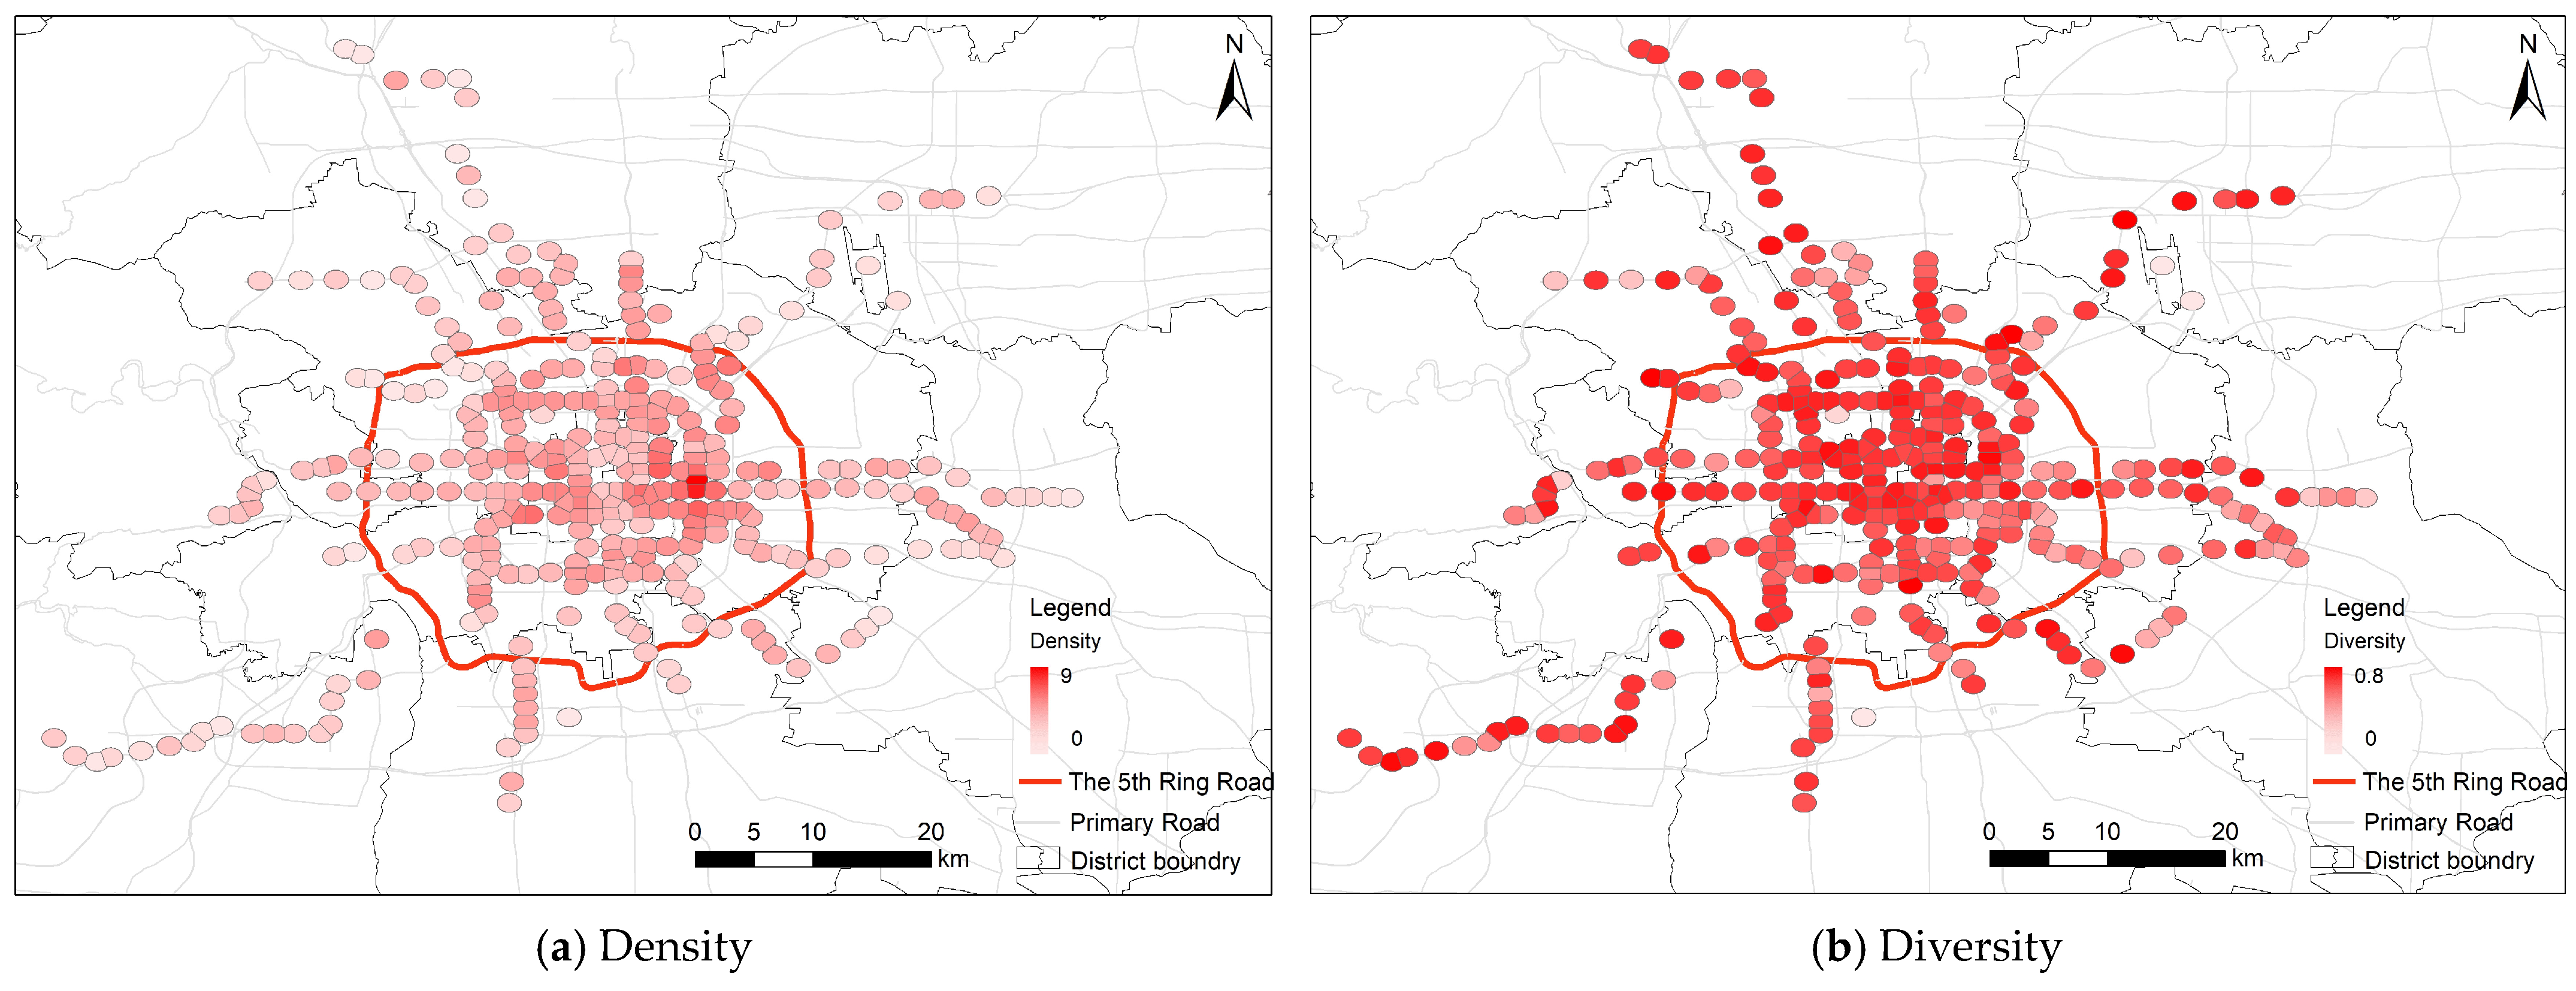
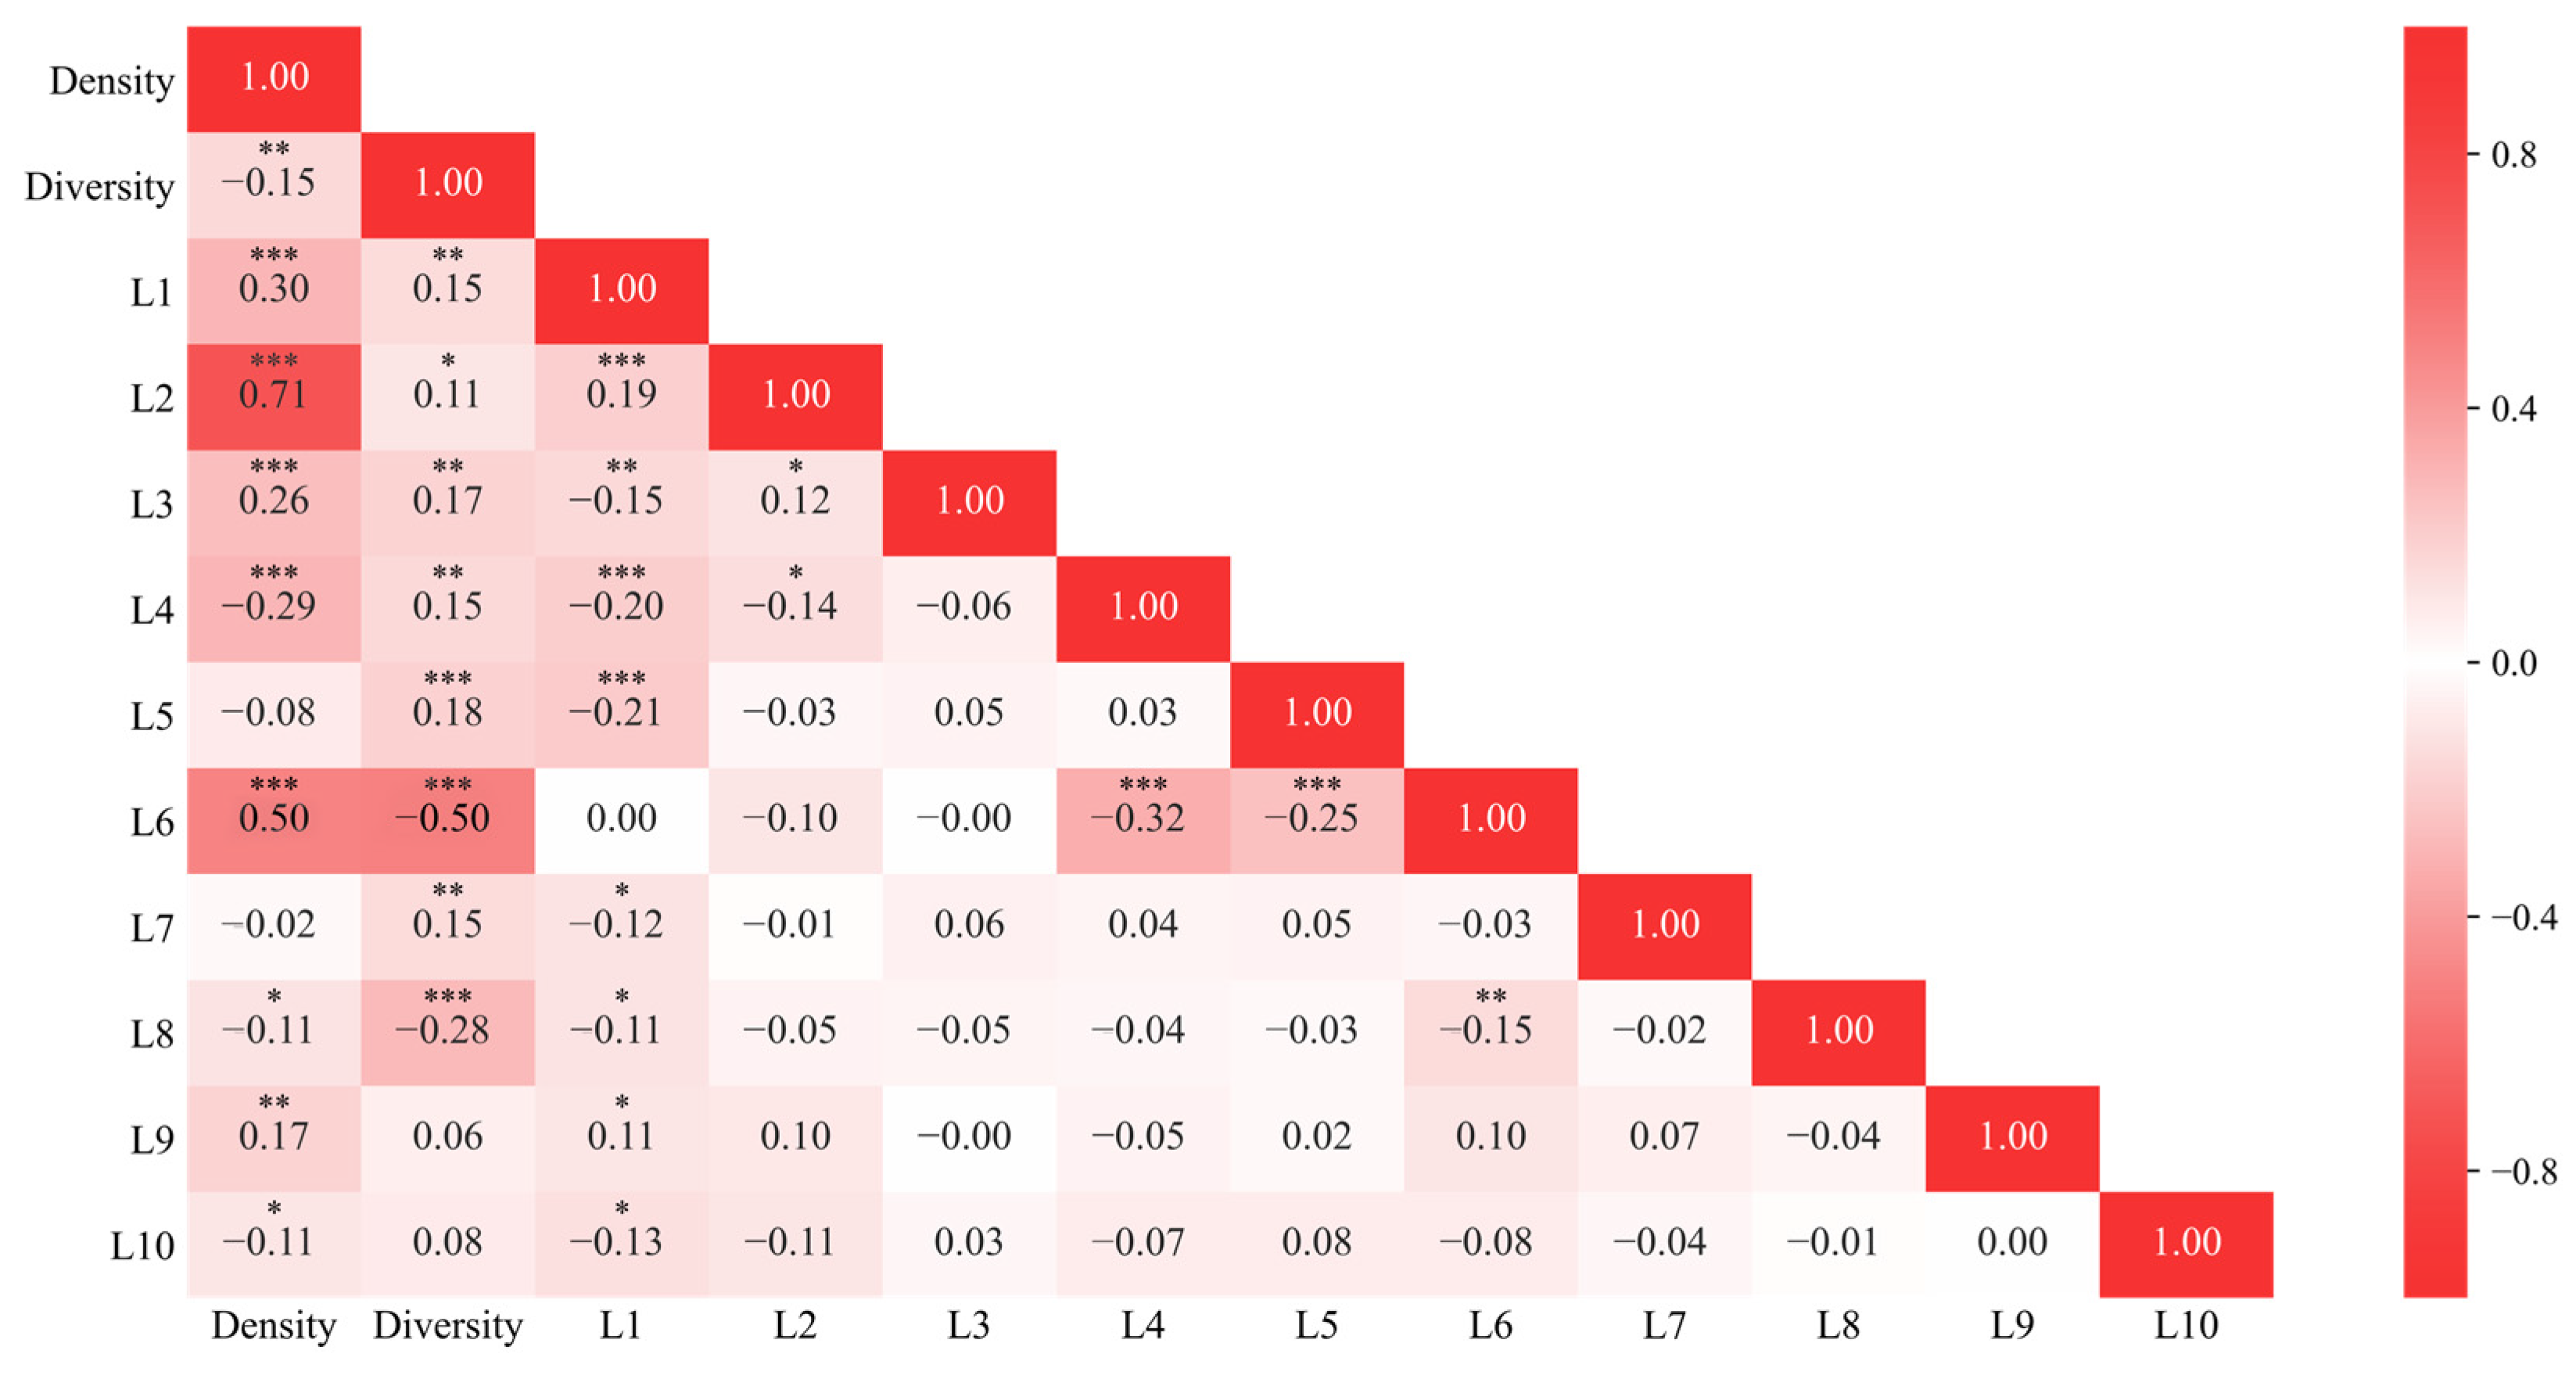
3.2.1. Land Use
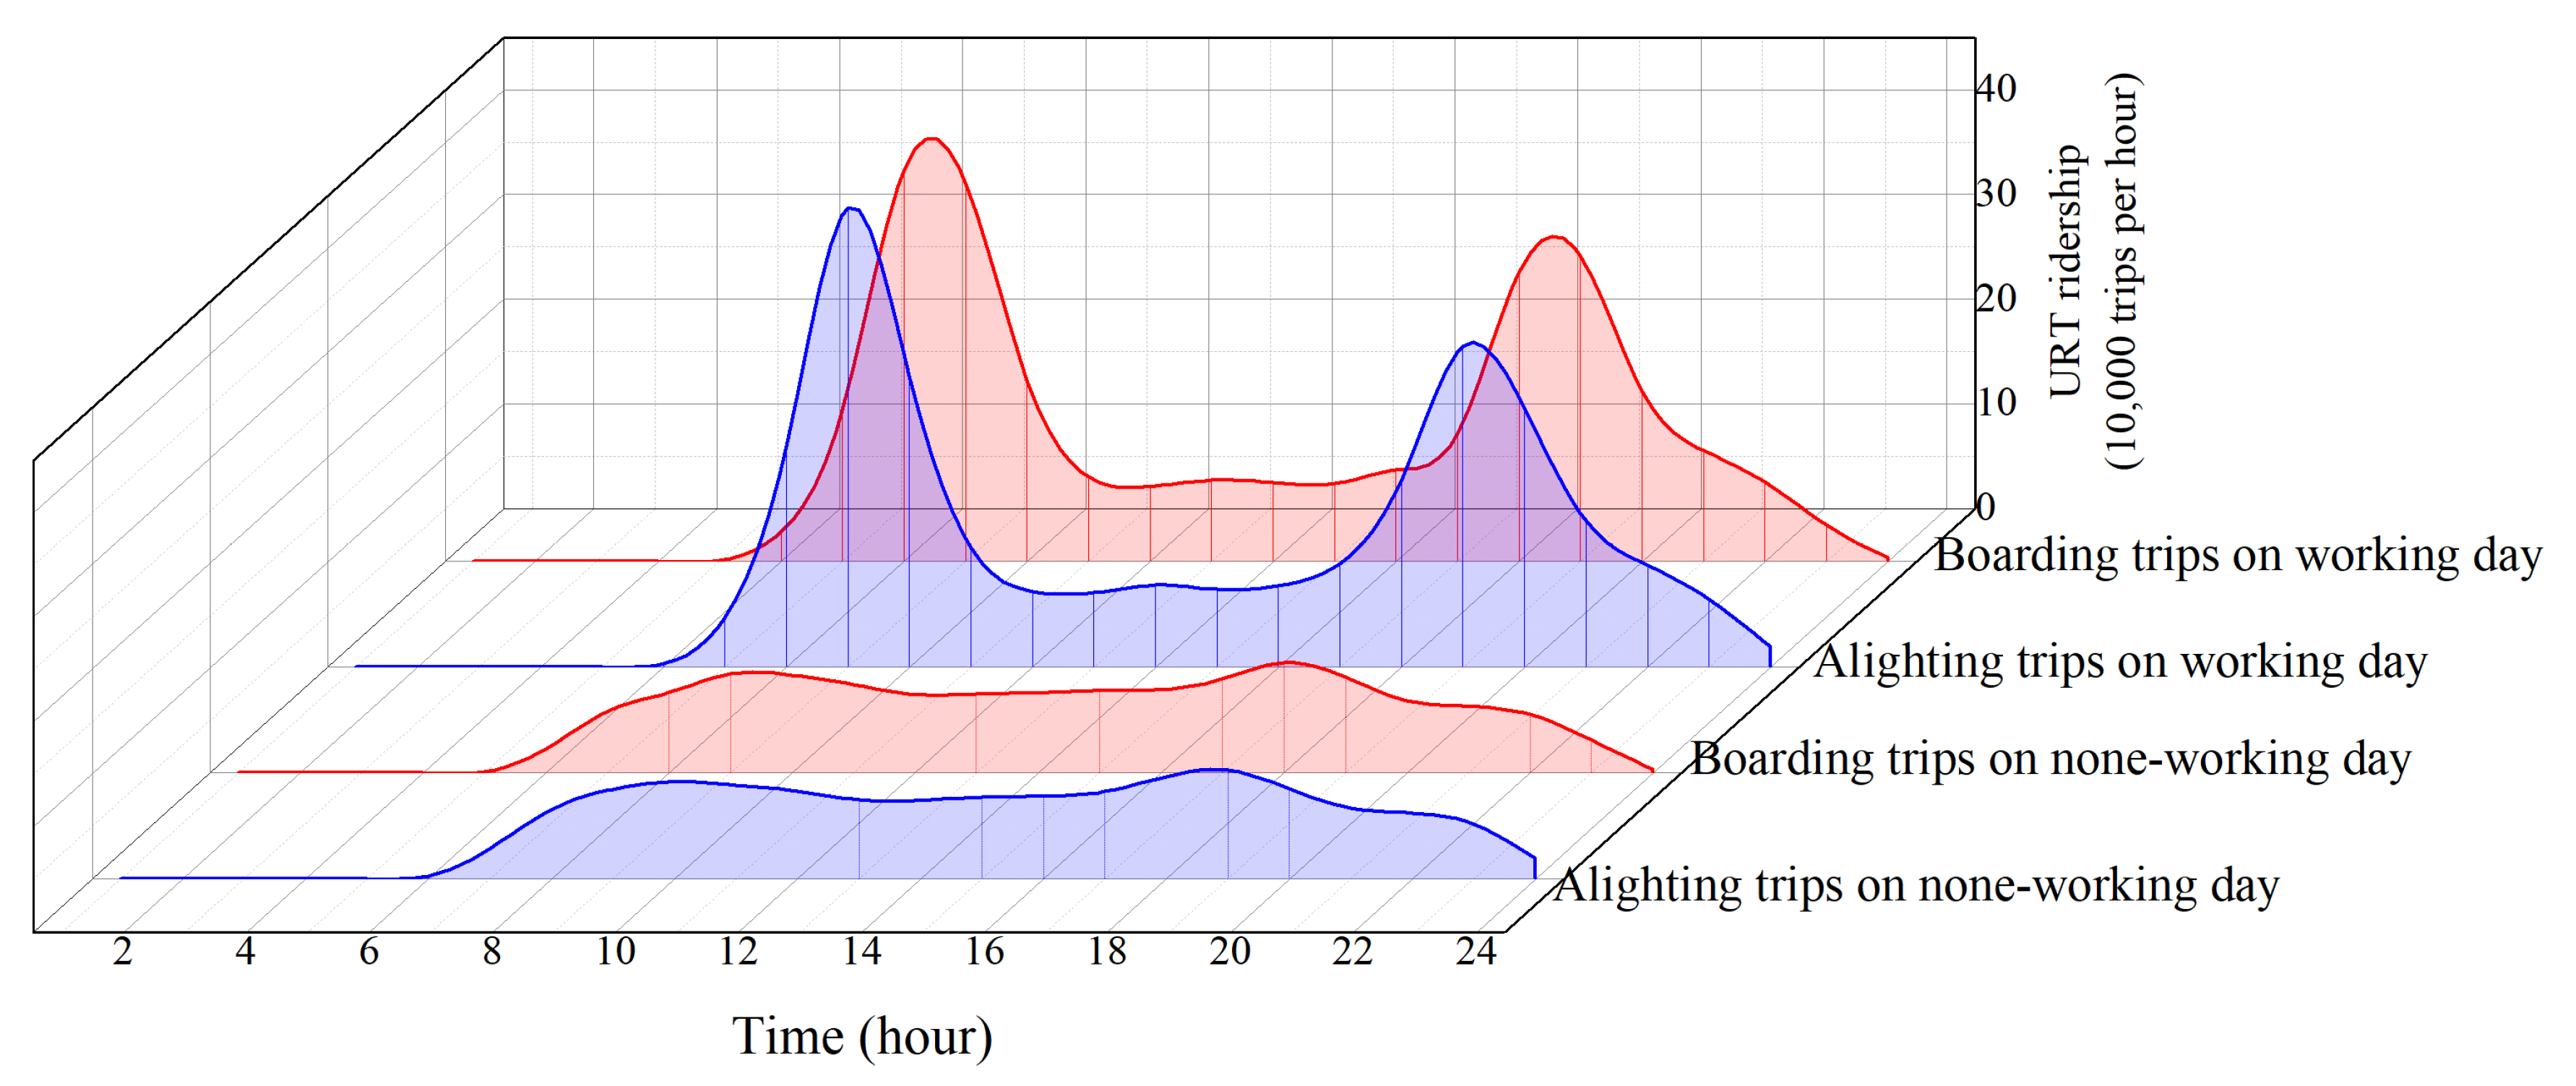
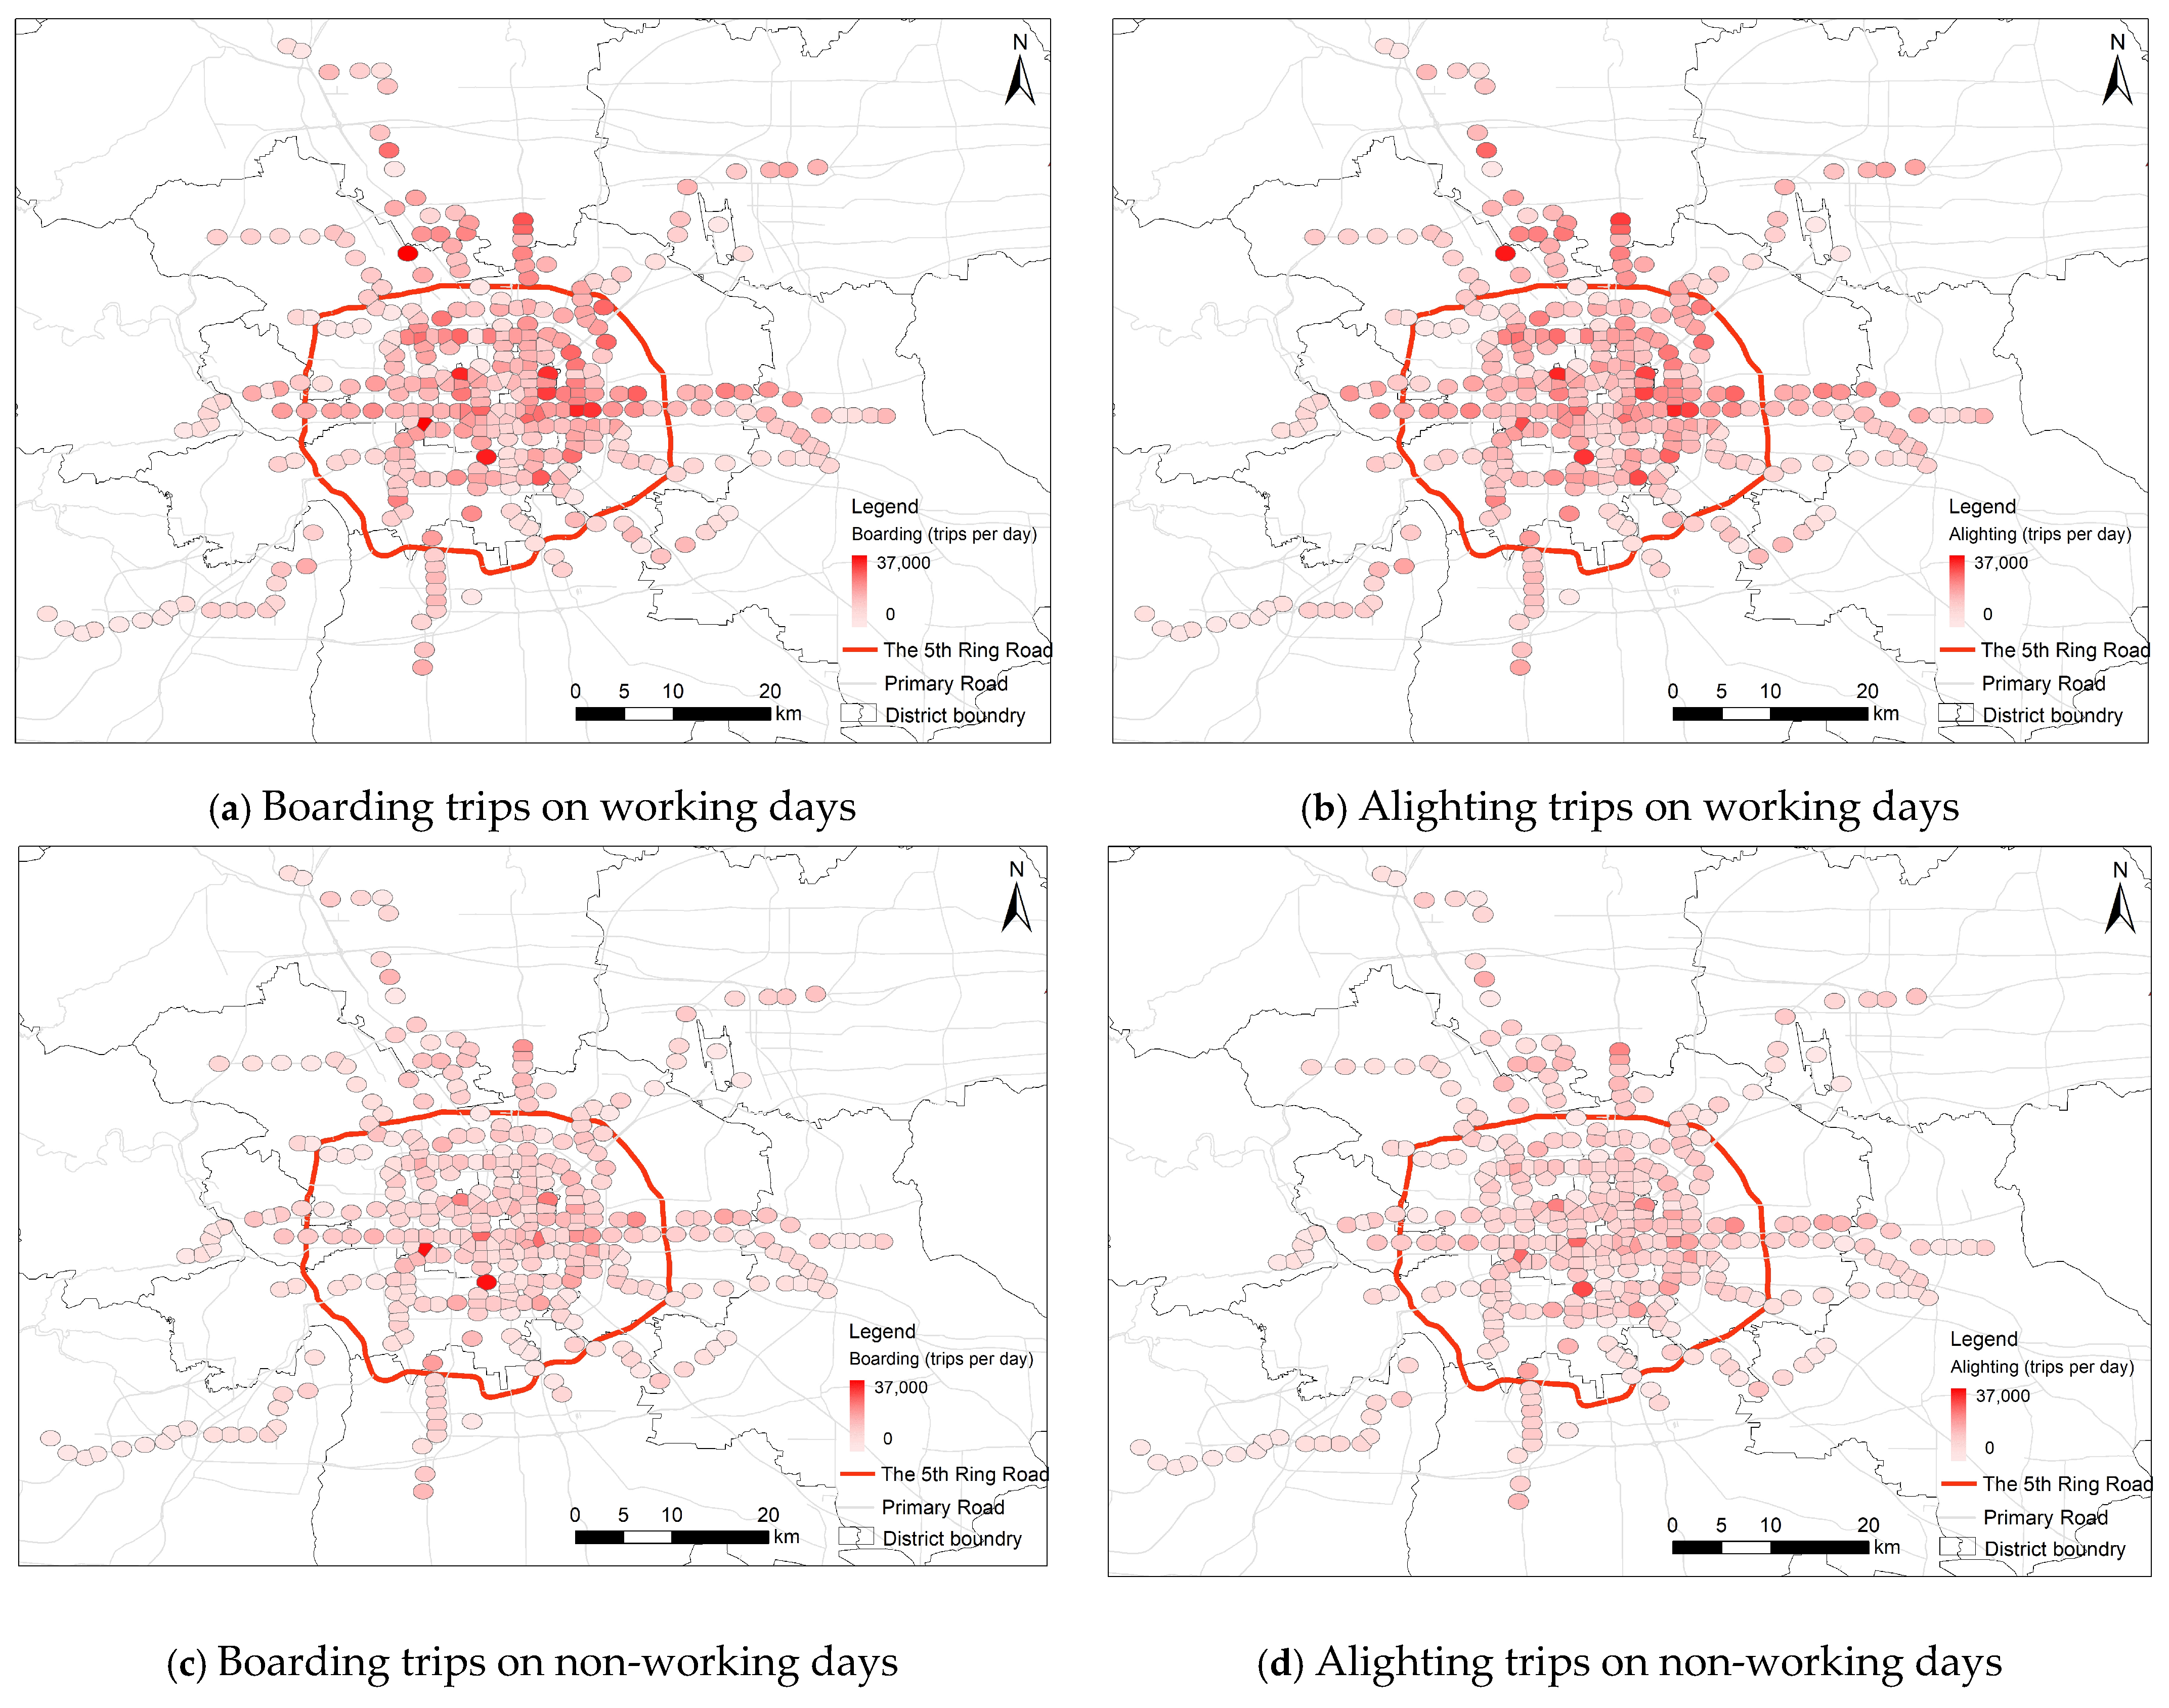
3.2.2. URT Ridership
3.3. Methodology
4. Results
4.1. Temporal Heterogeneity Test and Model Selection
4.2. Impact Analysis of Temporal Heterogeneity
5. Discussion
6. Conclusions
Author Contributions
Funding
Data Availability Statement
Conflicts of Interest
References
- Jamme, H.-T.; Rodriguez, J.; Bahl, D.; Banerjee, T. A Twenty-Five-Year Biography of the TOD Concept: From Design to Policy, Planning, and Implementation. J. Plan. Educ. Res. 2019, 39, 409–428. [Google Scholar] [CrossRef]
- Calthorpe, P. The Next American Metropolis: Ecology, Community, and the American Dream; Princeton Architectural Press: New York, NY, USA, 1993. [Google Scholar]
- Baoming, H.; Yiran, Y.; Zhe, X.; Yajie, S.; Fang, L.; Siwei, L.; Zhuoyi, L.; Siqi, H.; Jiangfeng, H.; Yanling, S. Statistical Analysis of Urban Rail Transit Operations Worldwide in 2023: A Review. Urban Rapid Rail Transit 2024, 37, 1–9. [Google Scholar] [CrossRef]
- 2023 National Passenger Volume in Urban Transportation. Available online: https://xxgk.mot.gov.cn/2020/jigou/zhghs/202404/t20240416_4128383.html (accessed on 16 April 2024).
- Liu, S.; Rong, J.; Zhou, C.; Bian, Y. Probability -Based Typology for Description of Built Environments around Urban Rail Stations. Build. Environ. 2021, 205, 108193. [Google Scholar] [CrossRef]
- Peng, B.; Zhang, Y.; Li, C.; Wang, T.; Yuan, S. Nonlinear, Threshold and Synergistic Effects of First/Last-Mile Facilities on Metro Ridership. Transp. Res. Part D Transp. Environ. 2023, 121, 103856. [Google Scholar] [CrossRef]
- Zhu, H.; Peng, J.; Dai, Q.; Yang, H. Exploring the Long-Term Threshold Effects of Density and Diversity on Metro Ridership. Transp. Res. Part D Transp. Environ. 2024, 128, 104101. [Google Scholar] [CrossRef]
- Pan, H.; Li, J.; Shen, Q.; Shi, C. What Determines Rail Transit Passenger Volume? Implications for Transit Oriented Development Planning. Transp. Res. Part D Transp. Environ. 2017, 57, 52–63. [Google Scholar] [CrossRef]
- Ding, C.; Cao, X.; Liu, C. How Does the Station-Area Built Environment Influence Metrorail Ridership? Using Gradient Boosting Decision Trees to Identify Non-Linear Thresholds. J. Transp. Geogr. 2019, 77, 70–78. [Google Scholar] [CrossRef]
- Kuai, X.; Wang, F. Global and Localized Neighborhood Effects on Public Transit Ridership in Baton Rouge, Louisiana. Appl. Geogr. 2020, 124, 102338. [Google Scholar] [CrossRef]
- Cardozo, O.D.; García-Palomares, J.C.; Gutiérrez, J. Application of Geographically Weighted Regression to the Direct Forecasting of Transit Ridership at Station-Level. Appl. Geogr. 2012, 34, 548–558. [Google Scholar] [CrossRef]
- Liu, S.; Zhang, X.; Zhou, C.; Rong, J.; Bian, Y. Temporal Heterogeneous Effects of Land-Use on Dockless Bike-Sharing Usage under Transit-Oriented Development Context: The Case of Beijing. J. Clean. Prod. 2022, 380, 134917. [Google Scholar] [CrossRef]
- Li, S.; Lyu, D.; Huang, G.; Zhang, X.; Gao, F.; Chen, Y.; Liu, X. Spatially Varying Impacts of Built Environment Factors on Rail Transit Ridership at Station Level: A Case Study in Guangzhou, China. J. Transp. Geogr. 2020, 82, 102631. [Google Scholar] [CrossRef]
- Hsiao, C. Analysis of Panel Data, 4th ed.; Cambridge University Press: Cambridge, UK, 2022; Volume 82, ISBN 9781009057745. [Google Scholar]
- Gan, Z.; Yang, M.; Feng, T.; Timmermans, H.J.P. Examining the Relationship between Built Environment and Metro Ridership at Station-to-Station Level. Transp. Res. Part D Transp. Environ. 2020, 82, 102332. [Google Scholar] [CrossRef]
- Sung, H.; Oh, J.T. Transit-Oriented Development in a High-Density City: Identifying Its Association with Transit Ridership in Seoul, Korea. Cities 2011, 28, 70–82. [Google Scholar] [CrossRef]
- Li, S.; Lyu, D.; Liu, X.; Tan, Z.; Gao, F.; Huang, G.; Wu, Z. The Varying Patterns of Rail Transit Ridership and Their Relationships with Fine-Scale Built Environment Factors: Big Data Analytics from Guangzhou. Cities 2020, 99, 102580. [Google Scholar] [CrossRef]
- Cervero, R.; Kockelman, K. Travel Demand and the 3Ds: Density, Diversity, and Design. Transp. Res. Part D Transp. Environ. 1997, 2, 199–219. [Google Scholar] [CrossRef]
- Ewing, R.; Cervero, R. Travel and the Built Environment. J. Am. Plan. Assoc. 2010, 76, 265–294. [Google Scholar] [CrossRef]
- Higgins, C.D.; Kanaroglou, P.S. A Latent Class Method for Classifying and Evaluating the Performance of Station Area Transit-Oriented Development in the Toronto Region. J. Transp. Geogr. 2016, 52, 61–72. [Google Scholar] [CrossRef]
- Shao, Q.; Zhang, W.; Cao, X.; Yang, J.; Yin, J. Threshold and Moderating Effects of Land Use on Metro Ridership in Shenzhen: Implications for TOD Planning. J. Transp. Geogr. 2020, 89, 102878. [Google Scholar] [CrossRef]
- Jun, M.J.; Choi, K.; Jeong, J.E.; Kwon, K.H.; Kim, H.J. Land Use Characteristics of Subway Catchment Areas and Their Influence on Subway Ridership in Seoul. J. Transp. Geogr. 2015, 48, 30–40. [Google Scholar] [CrossRef]
- An, D.; Tong, X.; Liu, K.; Chan, E.H.W. Understanding the Impact of Built Environment on Metro Ridership Using Open Source in Shanghai. Cities 2019, 93, 177–187. [Google Scholar] [CrossRef]
- Rodríguez, D.A.; Kang, C.-D. A Typology of the Built Environment around Rail Stops in the Global Transit-Oriented City of Seoul, Korea. Cities 2020, 100, 102663. [Google Scholar] [CrossRef]
- Monajem, S.; Nosratian, F.E. The Evaluation of the Spatial Integration of Station Areas via the Node Place Model; an Application to Subway Station Areas in Tehran. Transp. Res. Part D Transp. Environ. 2015, 40, 14–27. [Google Scholar] [CrossRef]
- Li, Z.; Han, Z.; Xin, J.; Luo, X.; Su, S.; Weng, M. Transit Oriented Development among Metro Station Areas in Shanghai, China: Variations, Typology, Optimization and Implications for Land Use Planning. Land Use Policy 2019, 82, 269–282. [Google Scholar] [CrossRef]
- Nigro, A.; Bertolini, L.; Moccia, F.D. Land Use and Public Transport Integration in Small Cities and Towns: Assessment Methodology and Application. J. Transp. Geogr. 2019, 74, 110–124. [Google Scholar] [CrossRef]
- Kumar, P.P.; Sekhar, C.R.; Parida, M. Identification of Neighborhood Typology for Potential Transit-Oriented Development. Transp. Res. Part D Transp. Environ. 2020, 78, 102186. [Google Scholar] [CrossRef]
- Guzman, L.A.; Cardona, S.G. Density-Oriented Public Transport Corridors: Decoding Their Influence on BRT Ridership at Station-Level and Time-Slot in Bogotá. Cities 2021, 110, 103071. [Google Scholar] [CrossRef]
- Zhao, J.; Deng, W.; Song, Y.; Zhu, Y. What Influences Metro Station Ridership in China? Insights from Nanjing. Cities 2013, 35, 114–124. [Google Scholar] [CrossRef]
- Ma, J.; Zhao, Y. Study on the Adaptability of the Level of Urban Transportation Infrastructure and Economic Development. Appl. Mech. Mater. 2013, 361–363, 1950–1953. [Google Scholar] [CrossRef]
- Durning, M.; Townsend, C. Direct Ridership Model of Rail Rapid Transit Systems in Canada. Transp. Res. Rec. 2015, 2537, 96–102. [Google Scholar] [CrossRef]
- Aston, L.; Currie, G.; Kamruzzaman, M.; Delbosc, A.; Teller, D. Study Design Impacts on Built Environment and Transit Use Research. J. Transp. Geogr. 2020, 82, 102625. [Google Scholar] [CrossRef]
- Lee, S.; An, Y.; Kim, K. Relationship between Transit Modal Split and Intra-City Trip Ratio by Car for Compact City Planning of Municipalities in the Seoul Metropolitan Area. Cities 2017, 70, 11–21. [Google Scholar] [CrossRef]
- Li, M.; Kwan, M.-P.; Hu, W.; Li, R.; Wang, J. Examining the Effects of Station-Level Factors on Metro Ridership Using Multiscale Geographically Weighted Regression. J. Transp. Geogr. 2023, 113, 103720. [Google Scholar] [CrossRef]
- Chen, E.; Ye, Z.; Wang, C.; Zhang, W. Discovering the Spatio-Temporal Impacts of Built Environment on Metro Ridership Using Smart Card Data. Cities 2019, 95, 102359. [Google Scholar] [CrossRef]
- Yang, L.; Yu, B.; Liang, Y.; Lu, Y.; Li, W. Time-Varying and Non-Linear Associations between Metro Ridership and the Built Environment. Tunn. Undergr. Space Technol. 2023, 132, 104931. [Google Scholar] [CrossRef]
- Beijing 2023 National Economic and Social Development Statistical Bulletin. Available online: https://tjj.beijing.gov.cn/tjsj_31433/tjgb_31445/ndgb_31446/202403/t20240321_3595860.html (accessed on 12 March 2024).
- Liu, S.; Zhou, C.; Rong, J.; Bian, Y.; Wang, Y. Concordance between Regional Functions and Mobility Features Using Bike-Sharing and Land-Use Data near Metro Stations. Sustain. Cities Soc. 2022, 84, 104010. [Google Scholar] [CrossRef]
- Ibraeva, A.; Correia, G.H.d.A.; Silva, C.; Antunes, A.P. Transit-Oriented Development: A Review of Research Achievements and Challenges. Transp. Res. Part A Policy Pract. 2020, 132, 110–130. [Google Scholar] [CrossRef]
- Kim, D.; Seo, D.; Cho, S.; Kang, P. Multi-Co-Training for Document Classification Using Various Document Representations: TF–IDF, LDA, and Doc2Vec. Inf. Sci. 2019, 477, 15–29. [Google Scholar] [CrossRef]
- Song, Y.; Merlin, L.; Rodriguez, D. Comparing Measures of Urban Land Use Mix. Comput. Environ. Urban Syst. 2013, 42, 1–13. [Google Scholar] [CrossRef]
- Yang, H.; Zhang, Q.; Wen, J.; Sun, X.; Yang, L. Multi-group exploration of the built environment and metro ridership: Comparison of commuters, seniors and students. Transp. Policy 2024, 155, 189–207. [Google Scholar] [CrossRef]
- Pan, M.; Liao, Z.; Wang, Z.; Ren, C.; Xing, Z.; Li, W. Tourism forecasting: A dynamic spatiotemporal model. Ann. Tour.Res. 2025, 110, 103871. [Google Scholar] [CrossRef]


| Var | Min. | Max. | Mean | Std. |
|---|---|---|---|---|
| L1 | 0.00 | 2.59 | 0.47 | 0.49 |
| L2 | 0.00 | 9.11 | 0.96 | 1.23 |
| L3 | 0.00 | 36.63 | 2.97 | 6.42 |
| L4 | 0.00 | 1.74 | 0.12 | 0.17 |
| L5 | 0.00 | 25.95 | 1.49 | 3.07 |
| L6 | 0.00 | 1.39 | 0.58 | 0.32 |
| L7 | 0.00 | 6.99 | 0.35 | 0.71 |
| L8 | 0.00 | 164.66 | 2.15 | 12.59 |
| L9 | 0.00 | 4.04 | 0.31 | 0.44 |
| L10 | 0.00 | 101.51 | 1.87 | 8.72 |
| Density | 0.01 | 8.95 | 2.06 | 1.22 |
| Diversity | 0.00 | 0.79 | 0.52 | 0.16 |
| Weekdays | Non-Weekdays | ||||||||
|---|---|---|---|---|---|---|---|---|---|
| Boarding | Alighting | Boarding | Alighting | ||||||
| RSS | F | RSS | F | RSS | F | RSS | F | ||
| H0 | 2.13 × 10⁹ | - | 2.49 × 10⁹ | - | 2.48 × 10⁹ | - | 3.11 × 10⁹ | - | F0.01(192, 5507) = 1.00 F0.01(16, 5491) = 2.12 |
| H1 | 1.20 × 10⁹ | 22.05 | 1.33 × 10⁹ | 25.01 | 2.18 × 10⁹ | 3.89 | 2.82 × 10⁹ | 2.98 | |
| H2 | 1.20 × 10⁹ | 1.55 | 1.33 × 10⁹ | 1.05 | 2.17 × 10⁹ | 1.44 | 2.80 × 10⁹ | 2.11 | |
| Time | Density | Diversity | L1 | L2 | L3 | L4 | L5 | L6 | L7 | L8 | L9 | L10 | C | |
|---|---|---|---|---|---|---|---|---|---|---|---|---|---|---|
| GLR | Daily | 0.23 *** | 0.05 *** | 0.08 * | 0.08 * | 0.06 *** | 0.05 *** | −0.06 *** | −70.21 | |||||
| TVC-P | 6–7 | 0.10 * | 0.14 * | 0.15 ** | 0.45 *** | 0.18 *** | −70.21 * | |||||||
| 7–8 | 0.09 *** | 0.11 *** | 0.06 ** | 0.09 *** | 0.5 *** | 0.14 *** | −0.09 *** | |||||||
| 8–9 | 0.05 * | 0.13 *** | 0.05 ** | 0.47 *** | 0.15 *** | −0.09 *** | 0.03 ** | |||||||
| 9–10 | 0.12 * | 0.4 *** | 0.13 ** | 0.04 ** | ||||||||||
| 10–11 | ||||||||||||||
| 11–12 | ||||||||||||||
| 12–13 | ||||||||||||||
| 13–14 | ||||||||||||||
| 14–15 | ||||||||||||||
| 15–16 | ||||||||||||||
| 16–17 | ||||||||||||||
| 17–18 | 0.62 *** | 0.05 * | 0.11 ** | 0.17* | −0.2 *** | |||||||||
| 18–19 | 0.73 *** | −0.28 *** | −0.07 *** | |||||||||||
| 19–20 | 0.63 *** | −0.21 ** | −0.07 * | |||||||||||
| 20–21 | 0.10 * | 0.14 * | 0.15 ** | 0.45 *** | 0.18 *** | |||||||||
| 21–22 | 0.09 *** | 0.11 *** | 0.06 ** | 0.09 *** | 0.5 *** | 0.14 *** | −0.09 *** | |||||||
| 22–23 | 0.05 * | 0.13 *** | 0.05 ** | 0.47 *** | 0.15 *** | −0.09 *** |
| Time | Density | Diversity | L1 | L2 | L3 | L4 | L5 | L6 | L7 | L8 | L9 | L10 | C | |
|---|---|---|---|---|---|---|---|---|---|---|---|---|---|---|
| GLR | Daily | 0.23 *** | 0.06 *** | 0.09 ** | 0.05 *** | 0.07 *** | −0.06 *** | −127.26 ** | ||||||
| TVC-P | 6–7 | −127.26 *** | ||||||||||||
| 7–8 | 0.47 *** | 0.10 ** | 0.16 ** | 0.07* | ||||||||||
| 8–9 | 0.69 *** | 0.04 ** | 0.15 *** | −0.06 *** | 0.04 ** | −0.27 *** | −0.07 *** | −0.04 ** | ||||||
| 9–10 | 0.64 *** | 0.04 * | 0.07 *** | −0.23 *** | −0.08 *** | −0.04 ** | ||||||||
| 10–11 | 0.54 ** | |||||||||||||
| 11–12 | 0.22 * | |||||||||||||
| 12–13 | 0.23 * | |||||||||||||
| 13–14 | 0.22 * | |||||||||||||
| 14–15 | 0.24 * | |||||||||||||
| 15–16 | 0.25 * | |||||||||||||
| 16–17 | 0.22 ** | |||||||||||||
| 17–18 | 0.13 * | 0.30 * | 0.17 *** | 0.16 *** | ||||||||||
| 18–19 | 0.10 ** | 0.11 ** | 0.42 *** | 0.16 *** | 0.10 *** | −0.10 *** | ||||||||
| 19–20 | 0.07 * | 0.15 *** | 0.09 ** | 0.10 ** | 0.50 *** | 0.13 *** | 0.09 ** | −0.11 *** | ||||||
| 20–21 | 0.16 * | 0.55 *** | 0.12 * | |||||||||||
| 21–22 | 0.60 ** | |||||||||||||
| 22–23 | 0.69 * |
| Time | Density | Diversity | L1 | L2 | L3 | L4 | L5 | L6 | L7 | L8 | L9 | L10 | C | |
|---|---|---|---|---|---|---|---|---|---|---|---|---|---|---|
| GLR | Daily | 0.11 *** | 0.08 *** | 0.25 *** | 0.05 *** | 0.08 *** | 0.30 *** | 0.10 *** | 0.16 *** | −0.07 *** | −78.63 *** | |||
| TVC−P | 6–7 | 0.12 ** | 0.11 * | 0.13 ** | 0.39 *** | 0.22 *** | 0.09 * | −78.63 *** | ||||||
| 7–8 | 0.14 *** | 0.11 ** | 0.12 * | 0.43 *** | 0.19 *** | 0.10 ** | −0.1 * | |||||||
| 8–9 | 0.15 *** | 0.08 | 0.44 *** | 0.18 *** | 0.12 *** | −0.08 * | ||||||||
| 9–10 | 0.16 *** | 0.41 *** | 0.16 *** | 0.17 *** | −0.09 * | |||||||||
| 10–11 | 0.16 *** | 0.38 *** | 0.14 ** | 0.19 *** | ||||||||||
| 11–12 | 0.16 ** | 0.10 * | 0.34 ** | 0.13 ** | 0.22 *** | |||||||||
| 12–13 | 0.15 ** | 0.13 * | 0.39 ** | 0.13 ** | 0.23 *** | −0.11 * | ||||||||
| 13–14 | 0.14 ** | 0.38 ** | 0.12 ** | 0.20 *** | −0.10 * | |||||||||
| 14–15 | 0.12 ** | 0.33 ** | 0.34 ** | 0.12 ** | 0.20 *** | |||||||||
| 15–16 | 0.12 ** | 0.34 ** | 0.09 * | 0.31 ** | 0.11 ** | 0.18 *** | −0.09 * | |||||||
| 16–17 | 0.11 ** | 0.16 ** | 0.39 *** | 0.09 ** | 0.32 *** | 0.10 ** | 0.18 *** | −0.09 * | ||||||
| 17–18 | 0.09 ** | 0.18 ** | 0.31 ** | 0.09 ** | 0.23 ** | 0.08 * | 0.15 *** | −0.07 * | ||||||
| 18–19 | 0.10 ** | 0.26 ** | 0.14 *** | |||||||||||
| 19–20 | 0.08 * | 0.34 ** | 0.22 * | 0.14 *** | ||||||||||
| 20–21 | 0.08 * | 0.38 *** | 0.19 * | 0.18 *** | ||||||||||
| 21–22 | 0.45 *** | 0.21 * | 0.17 *** | |||||||||||
| 22–23 | 0.52 ** | 0.19 *** |
| Time | Density | Diversity | L1 | L2 | L3 | L4 | L5 | L6 | L7 | L8 | L9 | L10 | C | |
|---|---|---|---|---|---|---|---|---|---|---|---|---|---|---|
| GLR | Daily | 0.15 *** | 0.06 *** | 0.29 *** | 0.04 ** | 0.09 *** | 0.30 *** | 0.11 *** | 0.23 *** | −0.06 *** | −143.50 *** | |||
| TVC−P | 6–7 | 0.20 *** | 0.36 *** | −143.50 *** | ||||||||||
| 7–8 | 0.17 *** | 0.11 ** | 0.29 *** | |||||||||||
| 8–9 | 0.16 *** | 0.12 *** | 0.26 *** | |||||||||||
| 9–10 | 0.15 *** | 0.33 *** | 0.11 *** | 0.19 * | 0.11 *** | 0.26 *** | ||||||||
| 10–11 | 0.15 *** | 0.38 *** | 0.11 *** | 0.24 ** | 0.09 ** | 0.26 *** | −0.07 * | |||||||
| 11–12 | 0.14 *** | 0.39 *** | 0.08 * | 0.26 ** | 0.07 * | 0.25 *** | ||||||||
| 12–13 | 0.15 *** | 0.35 ** | 0.25 ** | 0.08 * | 0.25 *** | |||||||||
| 13–14 | 0.15 *** | 0.35 ** | 0.09 * | 0.26 ** | 0.10 ** | 0.25 *** | ||||||||
| 14–15 | 0.15 *** | 0.35 ** | 0.28 ** | 0.09 * | 0.25 *** | |||||||||
| 15–16 | 0.15 *** | 0.35 ** | 0.10 * | 0.34 *** | 0.11 ** | 0.25 *** | ||||||||
| 16–17 | 0.16 *** | 0.33 ** | 0.38 *** | 0.12 ** | 0.23 *** | |||||||||
| 17–18 | 0.14 *** | 0.30 ** | 0.08 * | 0.38 *** | 0.16 *** | 0.20 *** | −0.09 * | |||||||
| 18–19 | 0.15 *** | 0.26 * | 0.11 * | 0.10 ** | 0.42 *** | 0.17 *** | 0.17 *** | −0.11 ** | ||||||
| 19–20 | 0.17 *** | 0.14 * | 0.12 ** | 0.52 *** | 0.15 ** | 0.18 *** | −0.11 * | |||||||
| 20–21 | 0.20 ** | 0.14 * | 0.63 *** | 0.22 *** | ||||||||||
| 21–22 | 0.21 ** | 0.67 *** | 0.20 ** | |||||||||||
| 22–23 | 0.20 ** | 0.80 *** | 0.16 * |
Disclaimer/Publisher’s Note: The statements, opinions and data contained in all publications are solely those of the individual author(s) and contributor(s) and not of MDPI and/or the editor(s). MDPI and/or the editor(s) disclaim responsibility for any injury to people or property resulting from any ideas, methods, instructions or products referred to in the content. |
© 2025 by the authors. Licensee MDPI, Basel, Switzerland. This article is an open access article distributed under the terms and conditions of the Creative Commons Attribution (CC BY) license (https://creativecommons.org/licenses/by/4.0/).
Share and Cite
Liu, S.; Rong, J.; Zhou, C.; Gao, Y.; Xing, L. Temporal Heterogeneity in Land Use Effects on Urban Rail Transit Ridership—Case of Beijing, China. Land 2025, 14, 665. https://doi.org/10.3390/land14040665
Liu S, Rong J, Zhou C, Gao Y, Xing L. Temporal Heterogeneity in Land Use Effects on Urban Rail Transit Ridership—Case of Beijing, China. Land. 2025; 14(4):665. https://doi.org/10.3390/land14040665
Chicago/Turabian StyleLiu, Siyang, Jian Rong, Chenjing Zhou, Yacong Gao, and Lu Xing. 2025. "Temporal Heterogeneity in Land Use Effects on Urban Rail Transit Ridership—Case of Beijing, China" Land 14, no. 4: 665. https://doi.org/10.3390/land14040665
APA StyleLiu, S., Rong, J., Zhou, C., Gao, Y., & Xing, L. (2025). Temporal Heterogeneity in Land Use Effects on Urban Rail Transit Ridership—Case of Beijing, China. Land, 14(4), 665. https://doi.org/10.3390/land14040665