1. Introduction
The rapid growth of the global population and economy has led to an accelerated increase in both urban populations and the spatial extent of cities. Daily rural-to-urban migration continues to fuel urban population growth. Currently, about 56% of the global population, equivalent to 4.4 billion people, resides in urban areas. This proportion is expected to rise to 70% by 2050, with an estimated addition of 1.2 million square kilometers of new urban areas being added globally by 2030 [
1,
2,
3]. As of 2023, the urban population ratio in Türkiye stands at 77%, which exceeds the global average [
4]. Urban areas, due to their dense populations, are significant drivers of environmental change. The increase in rural-to-urban migration leads to rising demands for essential services, employment challenges, a surge in housing needs, and inadequacies in infrastructure systems such as transportation, communication, and sanitation, all of which force cities to expand. The expansion of urban areas and associated infrastructure often comes at the expense of green spaces and agricultural lands, which are destroyed to meet these needs. Consequently, the land-use pattern changes, with green spaces and agricultural lands replaced by impervious surfaces. The proliferation of impervious surfaces alters heat capacity, albedo, and evaporation rates, leading to higher land surface temperature (LST) levels and intensifying the urban heat island (UHI) effect [
5,
6,
7].
Land surface temperature is a critical parameter related to surface energy and water balance at both local and global scales [
8,
9]. LST serves as a key climatic indicator, reflecting the surface temperature of the Earth, which is influenced by radiative transfer processes [
10,
11]. The variability of LST is shaped by multiple factors, including landscape texture, vegetation cover, wetlands, soil moisture, slope, elevation, diurnal cycles, urban structural characteristics, building density and height, roof types and colors, tree heights, cloud cover, and albedo [
12,
13,
14,
15,
16,
17,
18,
19]. LST measurements can be obtained through two primary methods: in situ measurements recorded at meteorological stations or satellite-based data, which have become increasingly reliable in recent years, providing datasets at both local and global scales (e.g., ASTER, Landsat, and MODIS). However, meteorological station data are limited to the station’s immediate area and do not represent the entire landscape, making them less practical. Despite being affected by cloud cover, satellites equipped with various sensors have emerged as the most preferred data sources in recent research [
20,
21,
22].
The concept of the urban heat island (UHI) was first defined by Oak in 1982. UHIs are phenomena resulting from human-induced alterations to natural environments, where impervious surfaces replace natural landscapes. This concept describes the condition whereby surface temperatures in urban areas, characterized by poor vegetation and a high density of impervious surfaces, exceed those in surrounding natural environments [
13,
23,
24]. Changes in land cover lead to varying heating processes, amplifying the UHI effect [
5,
25]. UHIs contribute to extreme temperatures, increased rates of disease and mortality, air pollution, and increased water and energy consumption [
26,
27,
28,
29,
30,
31].
In recent years, the impact of land-use characteristics on LST has become a focal point for numerous studies. Specifically, the effects of land-use changes in urban areas on UHI and LST are of critical importance in the context of climate change, public health, and sustainable urban planning. For example, Weng (2009) examined the effects of land-use changes on LST, evaluating the influence of various land-use types using Landsat TM data. Their study concluded that intense urbanization significantly increases surface temperatures, providing a fundamental understanding of the urban heat island phenomenon temperature. Further investigated the relationship between urban growth and UHI, analyzing how this relationship influences LST. Using satellite data, Weng demonstrated that dense urbanization and the reduction of green spaces considerably elevate LST in urban areas [
32]. Similarly, Zhang, Odeh, and Han (2009) analyzed the thermal characteristics of urban areas in Fuzhou, Fujian Province, using Landsat Thematic Mapper (TM) and Enhanced Thematic Mapper Plus (ETM+) imagery from 1989 and 2001. They explored relationships among LST, the impervious surface area percentage, the Normalized Difference Vegetation Index (NDVI), and the Normalized Difference Built-up Index (NDBI). Their results revealed weak correlations between NDVI and LST but strong positive correlations between impervious surface area, NDBI, and LST [
33]. Li et al. investigated how landscape composition and configuration influence UHI in Shanghai’s metropolitan area by analyzing LST in relation to the Normalized Difference Vegetation Index (NDVI), vegetation fraction (Fv), and impervious surface area (ISA) percentage. Using Landsat ETM+ imagery from 13 March and 2 July 2001, they identified significant variations in LST per pixel based on specific vegetation or impervious surface ratios. Although NDVI, Fv, and ISA percentages were good predictors of LST on a regional scale, a strong negative linear relationship was found between LST and NDVI, as well as an even stronger negative linear relationship between LST and Fv. The study concluded that urban vegetation better mitigates surface UHI effects during summer than in early spring, while a strong positive relationship exists between the mean LST and ISA percentages. Furthermore, residential areas were identified as the largest contributors to UHI, followed by industrial zones [
23]. Zhou et al. analyzed daily and seasonal surface UHI intensity in 32 major cities in China between 2003 and 2011 using MODIS data. Their study examined the relationship between land use and LST, finding that the annual average urban-to-rural temperature difference ranged from 0.01 to 1.87 °C during the day and 0.35 to 1.95 °C at night, with significant spatial heterogeneity. The study highlighted that artificial surfaces increase LST in densely urbanized regions, while green areas mitigate this effect [
34]. Naserikia et al. characterized land cover and its effects on LST for 54 highly populated cities using Landsat-8 imagery. They observed that urban surface features and thermal responses differ significantly across climate regimes, with the largest discrepancies occurring in arid climate cities. While cold cities showed the greatest seasonal variability, tropical and arid cities exhibited minimal seasonality. In tropical, temperate, and cold climates, the Normalized Difference Built-up Index (NDBI) was the strongest contributor to LST variability during warmer months, followed by NDVI. In arid climates, the Normalized Difference Bare Soil Index (NDBaI) was the most influential factor. These findings provide a climate-sensitive foundation for future land-cover planning to mitigate local surface warming [
35]. Hasan et al. investigated changes in land cover, LST, soil moisture, and evapotranspiration over the Kutupalong Rohingya Refugee Camp in Bangladesh. Utilizing index- and spatial algorithm-based remote sensing methodologies applied to Landsat-8 satellite imagery, they analyzed the impact of rapid population growth and land-use changes on LST. The study concluded that, across the entire Rohingya camp area, the land experienced a shift from moderately moist soil conditions to predominantly dry soil conditions due to increases in LST [
36]. Shu et al. employed land-use and land-cover data, surface temperatures, the Normalized Difference Vegetation Index (NDVI), the Normalized Difference Built-up Index (NDBI), and the Modified Normalized Difference Water Index (MNDWI) obtained from Landsat-5 TM and Landsat-8 OLI for four-year intervals between 1992 and 2021. Their analysis revealed a positive correlation between urban expansion, the spatial extent of impervious surfaces, and surface temperatures, alongside climate change [
37]. Mathew et al. demonstrated significant relationships between LST and various factors in their study spanning the summer and winter seasons from 2001 to 2021. They employed a wide range of input variables, including spectral indices, land characteristics, land-use/land-cover (LULC) data, atmospheric parameters, and spatial datasets, to perform their analyses [
6].
Numerous studies emphasize the link between land surface temperature (LST) and landscape characteristics. This connection plays a crucial role in understanding ecosystem functions and shaping urban planning strategies. The aforementioned studies emphasize that LST varies significantly depending on factors such as land-cover types, landscape structure, and human activities. For instance, areas with dense vegetation typically exhibit lower LST values due to high evapotranspiration rates and shading effects, whereas impervious surfaces such as asphalt and concrete contribute to higher LST values through the urban heat island effect. Moreover, the spatial configuration of the landscape (e.g., fragmentation, connectivity, and landscape diversity) has been identified as a determinant of the spatial distribution of LST. In this context, sustainable landscape design is highlighted as an effective strategy for controlling LST and adapting to climate change [
5,
15,
28,
37].
Land surface temperature has a broad impact range, extending from atmospheric processes to ecological dynamics, from human activities to energy balances. In the physical dimension, surface temperature plays a decisive role in soil moisture, evaporation, precipitation patterns, wind dynamics, and microclimatic conditions [
15,
28]. Its effects on moisture and energy balance are particularly critical for the hydrological cycle and ecosystem services. From a human perspective, changes in land surface temperature intensify the urban heat island effect, directly influencing air quality, energy consumption, human health, and biodiversity. Rising temperature levels exert pressure on agricultural productivity, the sustainability of water resources, and infrastructure systems, thereby transforming social and economic structures. Therefore, a comprehensive analysis of the multidimensional effects of land surface temperature is crucial for developing climate change adaptation strategies and establishing sustainable environmental planning frameworks [
2,
23,
28,
38,
39].
This study aims to analyze the effects of landscape on land surface temperature (LST) and land-use classification in the Muratpaşa District of Antalya by utilizing bands derived from Landsat satellite images for the years 1984, 1989, 1994, 1999, 2004, 2009, 2014, 2019, and 2024. The specific objectives of the research are as follows: to investigate the role of the landscape in illustrating LST, to measure the relationship between LST and different land-use types in the landscape, to examine and evaluate the temporal changes in these dynamics, and to provide concrete data for district-scale spatial planning and climate-change adaptation projects by correlating landscape metrics with LST analyses using Fragstats 4.2 software. Considering the lack of similar district-scale research in the national literature, this study aims to fill this gap and serve as a guide for comparable research. While global studies on LST and landscape relationships typically focus on broad geographic scales (e.g., national or regional levels), this research contributes detailed micro-scale (district-based) analyses to the international literature. Additionally, by addressing the relationship between landscape metrics and LST within a long-term change perspective, the study adopts a less common approach in the international literature. In this regard, it aims to provide a novel methodological and scale-based reference point for international research.
3. Findings
3.1. Spatial and Temporal Changes in Urban Land Use and LST
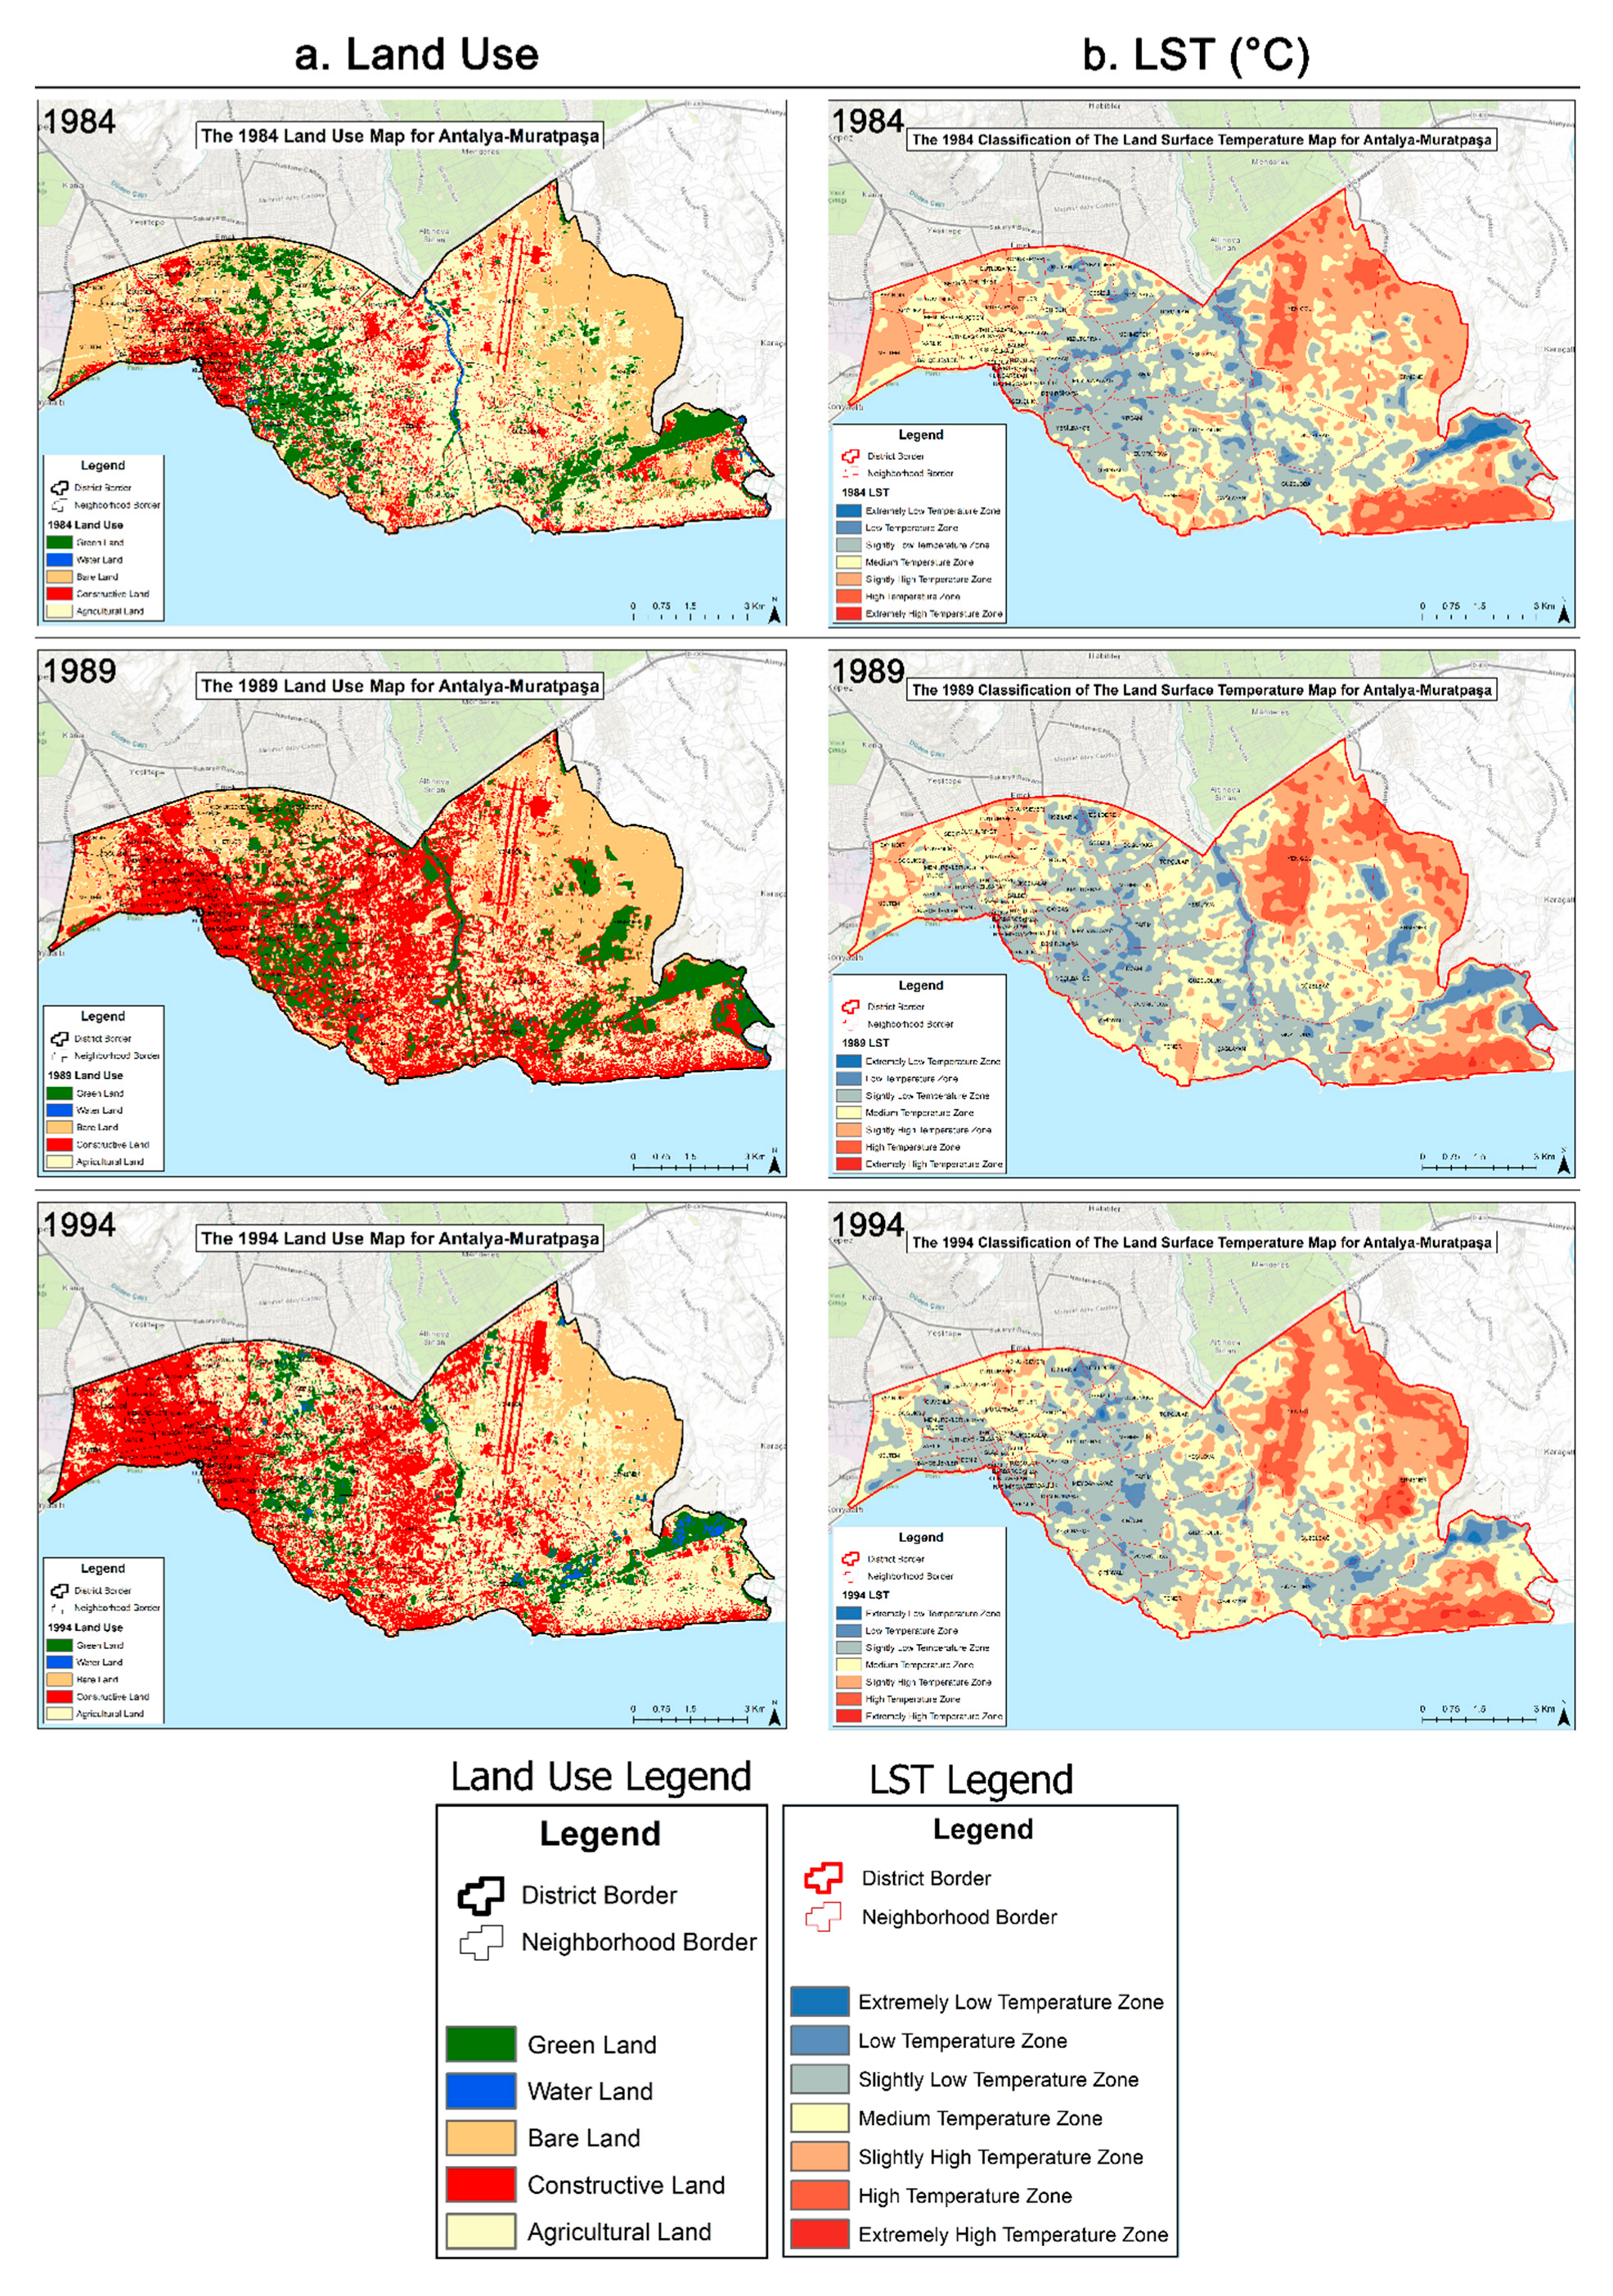
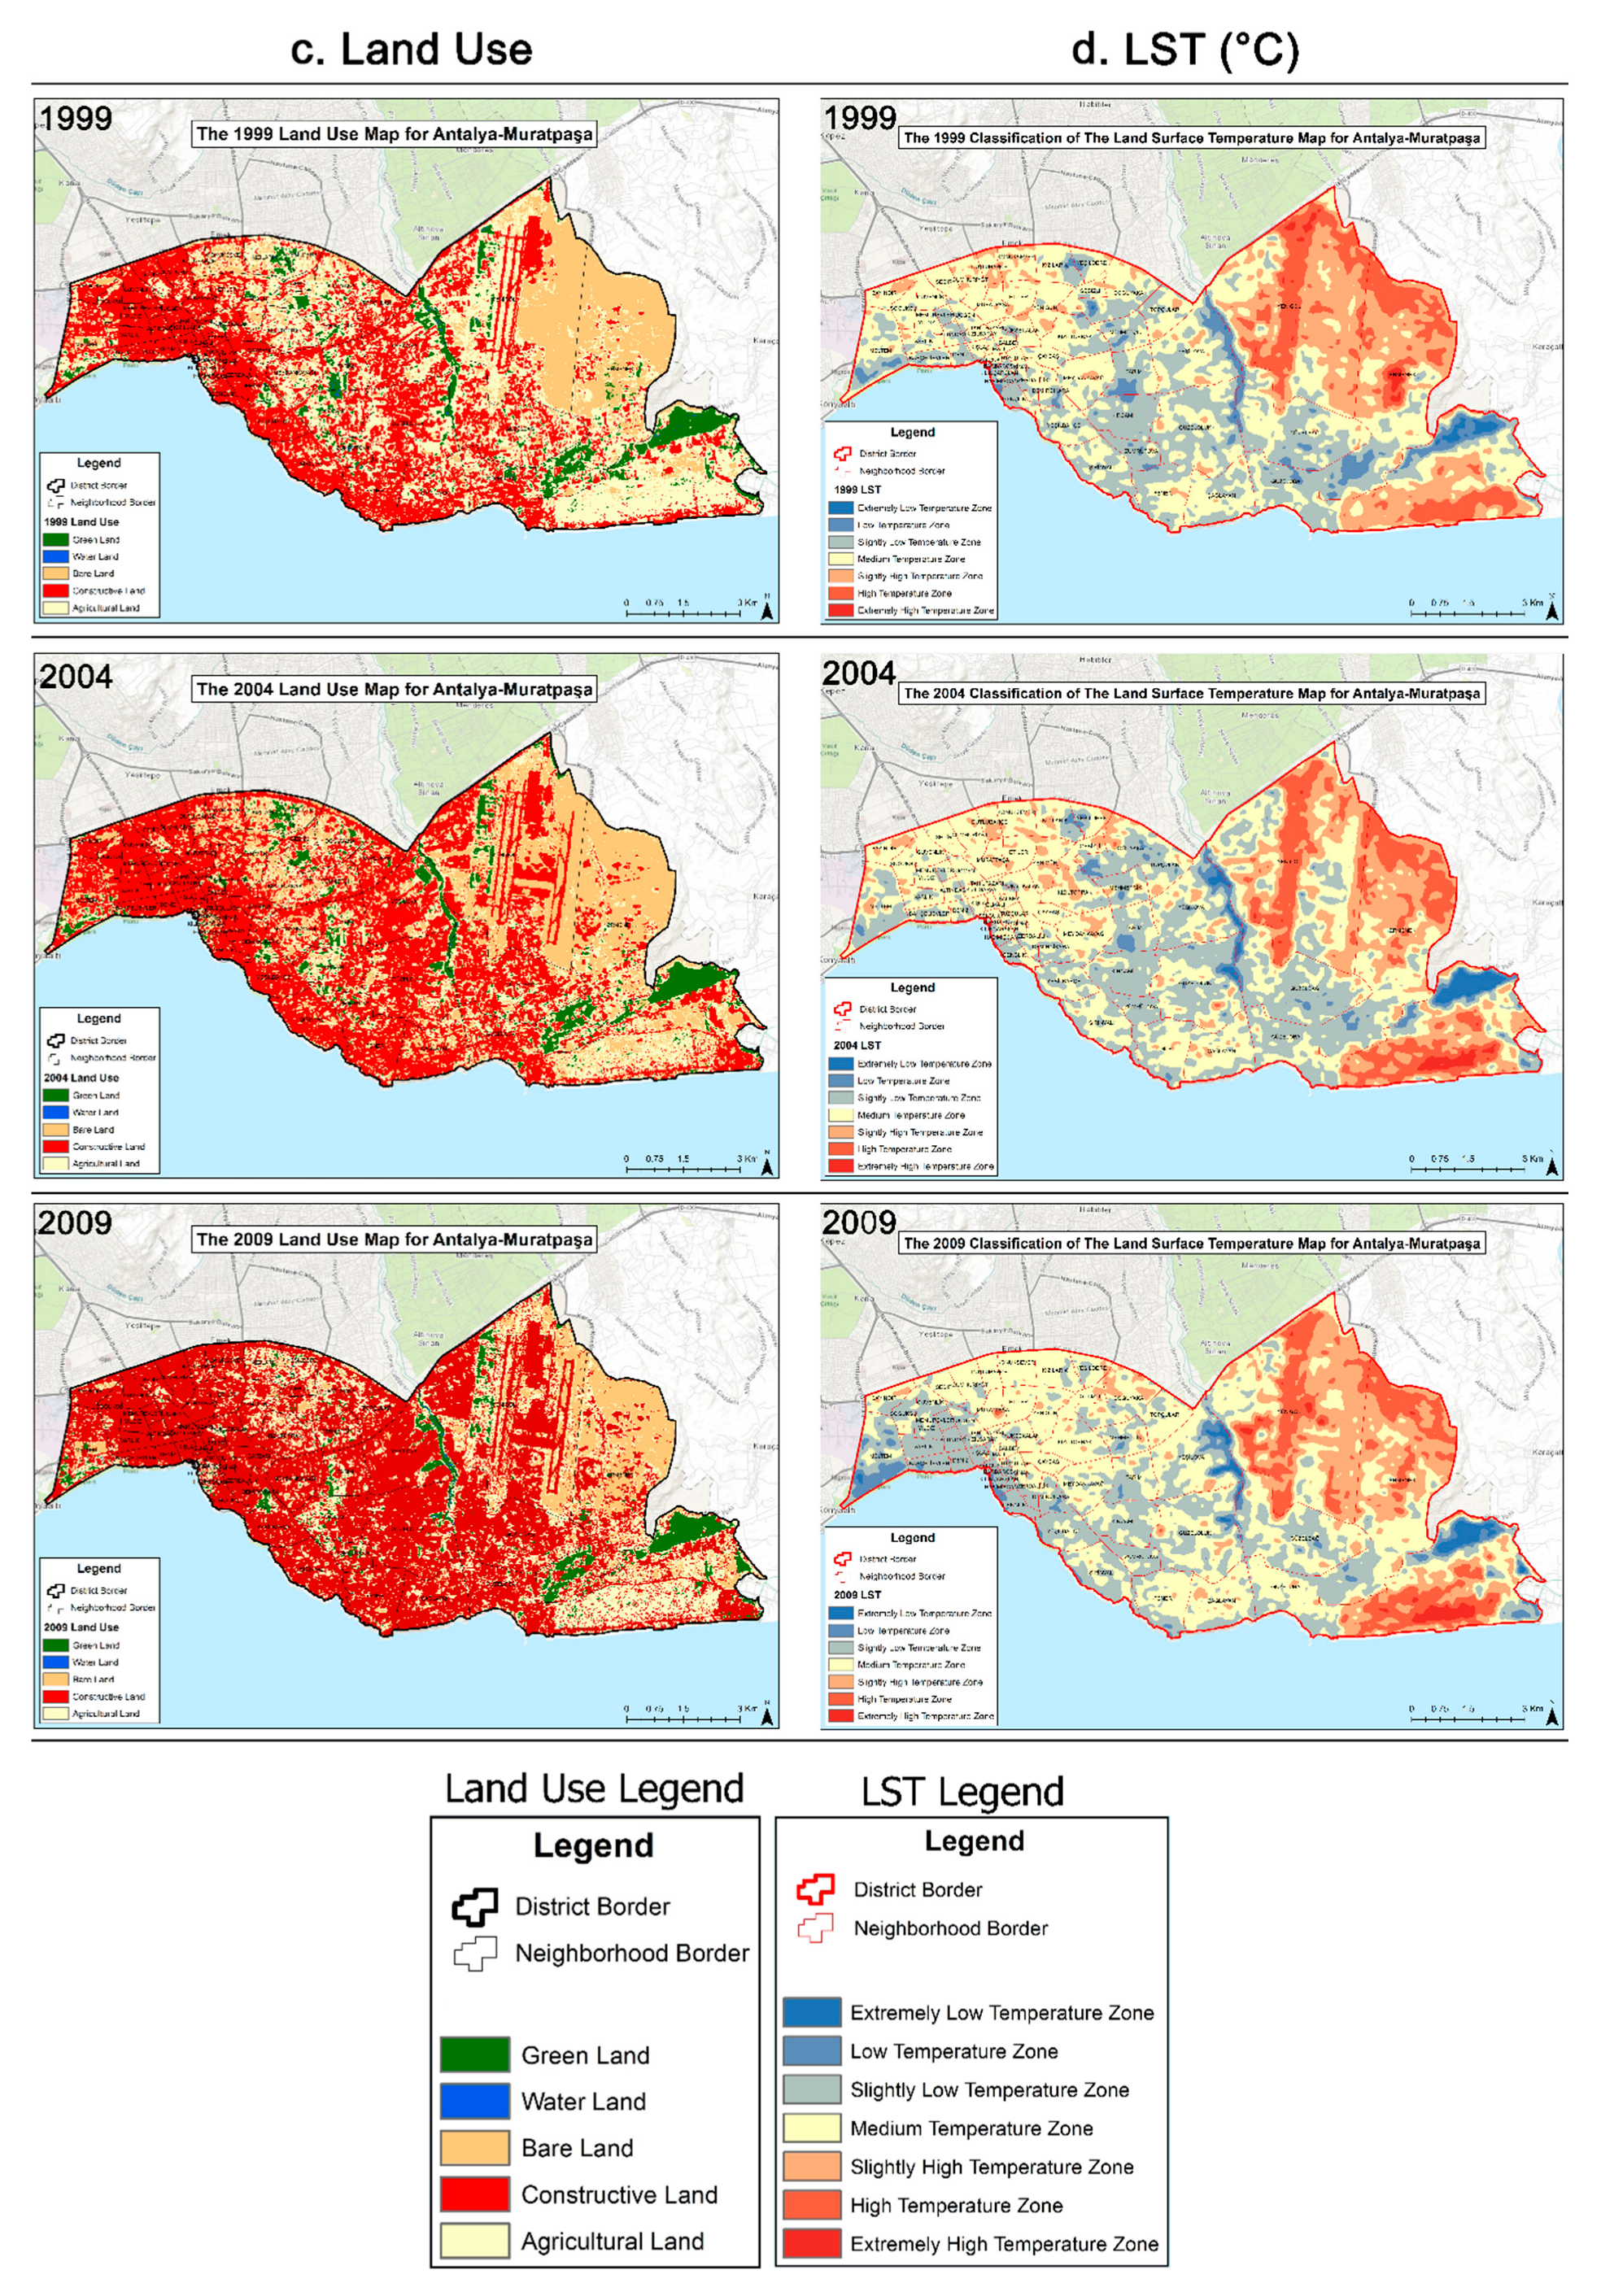
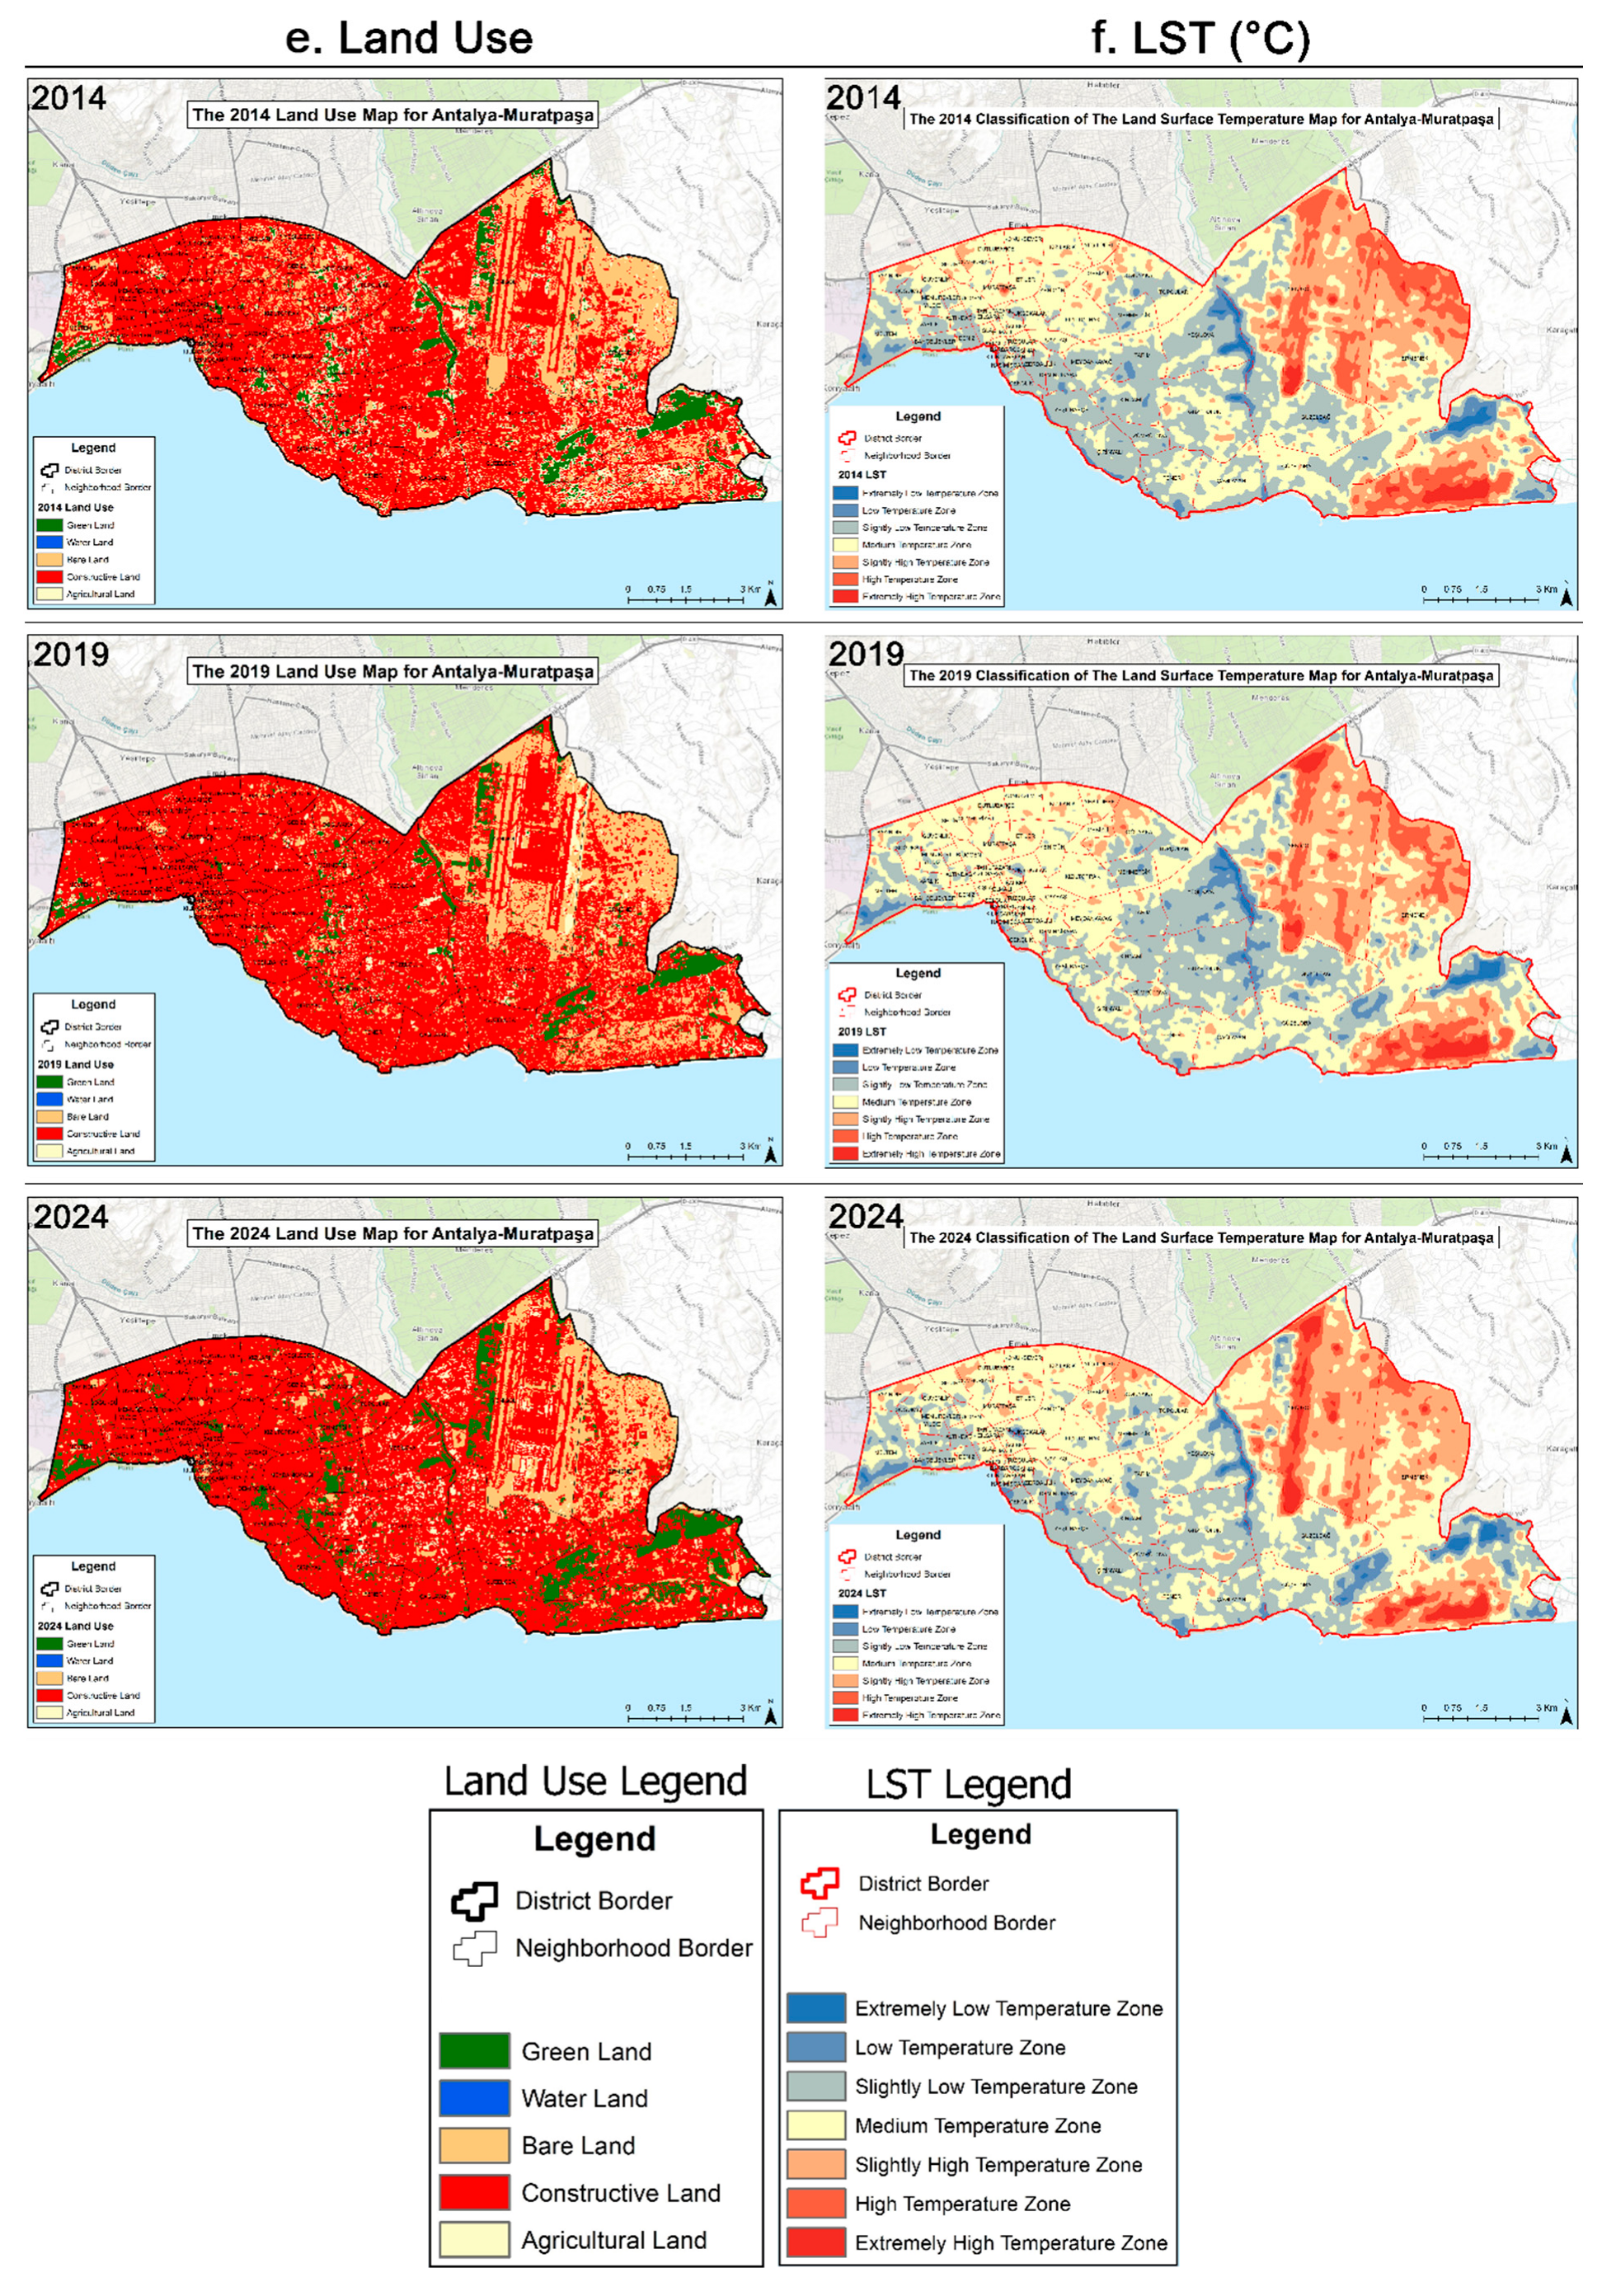
Figure 1 and
Table 4 illustrate the percentage changes in five land-use classes (agricultural land [AL], bare land [BL], built-up land [CL], green land [GL], and water land [WL]) between 1984 and 2024. The spatial distribution of these land uses is shown in
Scheme 1a,c,e. Analyses of land use of this nature provide crucial insights into urban development, environmental sustainability, and land-management policies. Addressing these changes concerning global issues such as climate change and rapid urbanization is foundational for developing strategic plans.
In 1984, agricultural land accounted for the largest share of land use at 45.77%, but it has undergone a significant decline from 1989 to 2024. This decline became especially pronounced after 2004, with the percentage dropping to 19.89% in 2004 and further decreasing to a mere 3.39% in 2024. This reduction can be attributed to rural areas being overtaken by urbanization and the conversion of agricultural lands into industrial and residential areas. This decline raises critical concerns due to its potential adverse impacts on food security and rural economies. The percentages of bare land have fluctuated over time. While bare land had a high share of 24.83% in 1984, it decreased to 9.97% in 1994, rose again to 24.90% in 2004, and fell to 13.04% in 2024. These fluctuations can be explained by land rehabilitation efforts, natural disasters, or industrialization processes. The share of bare land is significant in terms of environmental impacts such as soil erosion and natural hazards. The percentage of built-up land has shown a continuous increase throughout the analyzed period. Starting at 15.72% in 1984, it rose dramatically to 75.33% in 2024. This sharp increase reflects urbanization, population growth, and economic development processes. The post-2004 surge in built-up land highlights the displacement of agricultural and green areas by urban development. This trend has environmental implications, including the loss of ecosystem services and biodiversity and the exacerbation of the urban heat island (UHI) effect. The percentage of green land exhibited a general decline over the study period but showed an increase in 2024. From 12.97% in 1984, it dropped to its lowest point of 6.35% in 1999 before recovering to 8.21% in 2024. This rebound may reflect increased environmental awareness and policies aimed at preserving green spaces. Protecting and increasing green land is critical for urban sustainability and public health. Water land consistently held the lowest share among land-use classes throughout the analyzed period. From 0.67% in 1984, it dropped to 0.00% in 2024. This significant decline is linked to factors such as climate change, excessive water use, and urban expansion. The loss of water bodies raises serious concerns for both ecological balance and sustainable water resource management.
Overall, the data from
Table 4 and
Figure 1 indicate substantial changes in land use between 1984 and 2024. Notably, the replacement of agricultural and green land with built-up land underscores the environmental consequences of urbanization. In this context, the development and implementation of sustainable land-management policies are vital for preserving ecosystems and combating climate change. Strategies such as increasing green land and protecting agricultural land are pivotal for achieving long-term environmental sustainability goals.
Figure 2,
Table 5 and
Table 6 present the changes in land surface temperature (LST) values for the five land-use classes (AL, BL, CL, GL, and WL) from 1984 to 2024. The spatial distribution of LST is illustrated in
Scheme 1b,d,f. LST serves as a key indicator for understanding the thermal properties of land-use types and their interactions with climatic processes.
Agricultural land consistently exhibited high LST values throughout the studied years. The average LST increased from 37.00 °C in 1984 to a peak of 40.12 °C in 2004. In 2014, the LST rose again to 41.48 °C but dropped to 38.06 °C in 2019. By 2024, it had risen slightly to 39.65 °C. These fluctuations can be explained by factors such as the intensity of agricultural activities, vegetation changes, and irrigation practices. Additionally, the decline of agricultural land may correlate with the thermal influence of the built-up land that replaced it. Bare land exhibited the highest LST values among all classes. The LST rose from 39.40 °C in 1984 to 42.72 °C in 2004 and reached its maximum of 43.98 °C in 2024. These high temperatures can be attributed to the low vegetation cover and high solar radiation absorption of bare land. The increasing LST of bare land has significant environmental implications, such as soil moisture loss, higher erosion risk, and environmental degradation. The LST of built-up land showed a general upward trend during the period. From 36.94 °C in 1984, it increased to 39.36 °C in 2004 and again to 40.91 °C in 2024. This increase is directly associated with the UHI effect. The expansion of built-up land, replacing green areas, contributes to rising surface temperatures in urban regions. This phenomenon poses serious challenges to environmental sustainability, energy consumption, and public health in urban areas. Green land had relatively lower LST values compared to other classes, reflecting the thermal regulation capacity of vegetation. The LST increased from 33.76 °C in 1984 to 35.10 °C in 2004 and reached 36.11 °C in 2024, indicating a decline in its cooling effect. This trend may result from the degradation of vegetation due to the reduction of green land and environmental pressures. Preserving and expanding green land is crucial for mitigating urban temperatures and addressing climate-change impacts. Water land, due to its thermal properties, exhibited the lowest LST values among all land-use classes. The LST decreased from 33.11 °C in 1984 to 31.32 °C in 2004, but after 2014, it was recorded as 0 °C. This indicates a significant loss or complete disappearance of water land after 2014. The loss of water bodies can have severe adverse effects on local ecosystems and environmental processes. Protecting water resources is vital for maintaining the water cycle and climate regulation.
The effects of land-use types on LST are directly linked to global challenges such as urban expansion, environmental sustainability, and climate change. Land-use classes such as agricultural land, bare land, and built-up land contribute to environmental degradation and increased energy demands with their high LST values. Conversely, classes like green land and water land play a critical role in maintaining thermal balance with their lower LST values. Overall, in the years when agricultural land (AL) was replaced by built-up land (CL), a significant increase in land surface temperature (LST) values was observed. This trend indicates that the transformation of extensive agricultural areas into settlements and built-up spaces has led to a warmer region and an intensified urban heat island effect. During this period of continuous growth in CL, changes in land use have generally contributed to rising temperatures.
3.2. The Relationship Between LST and Land-Use Percentages
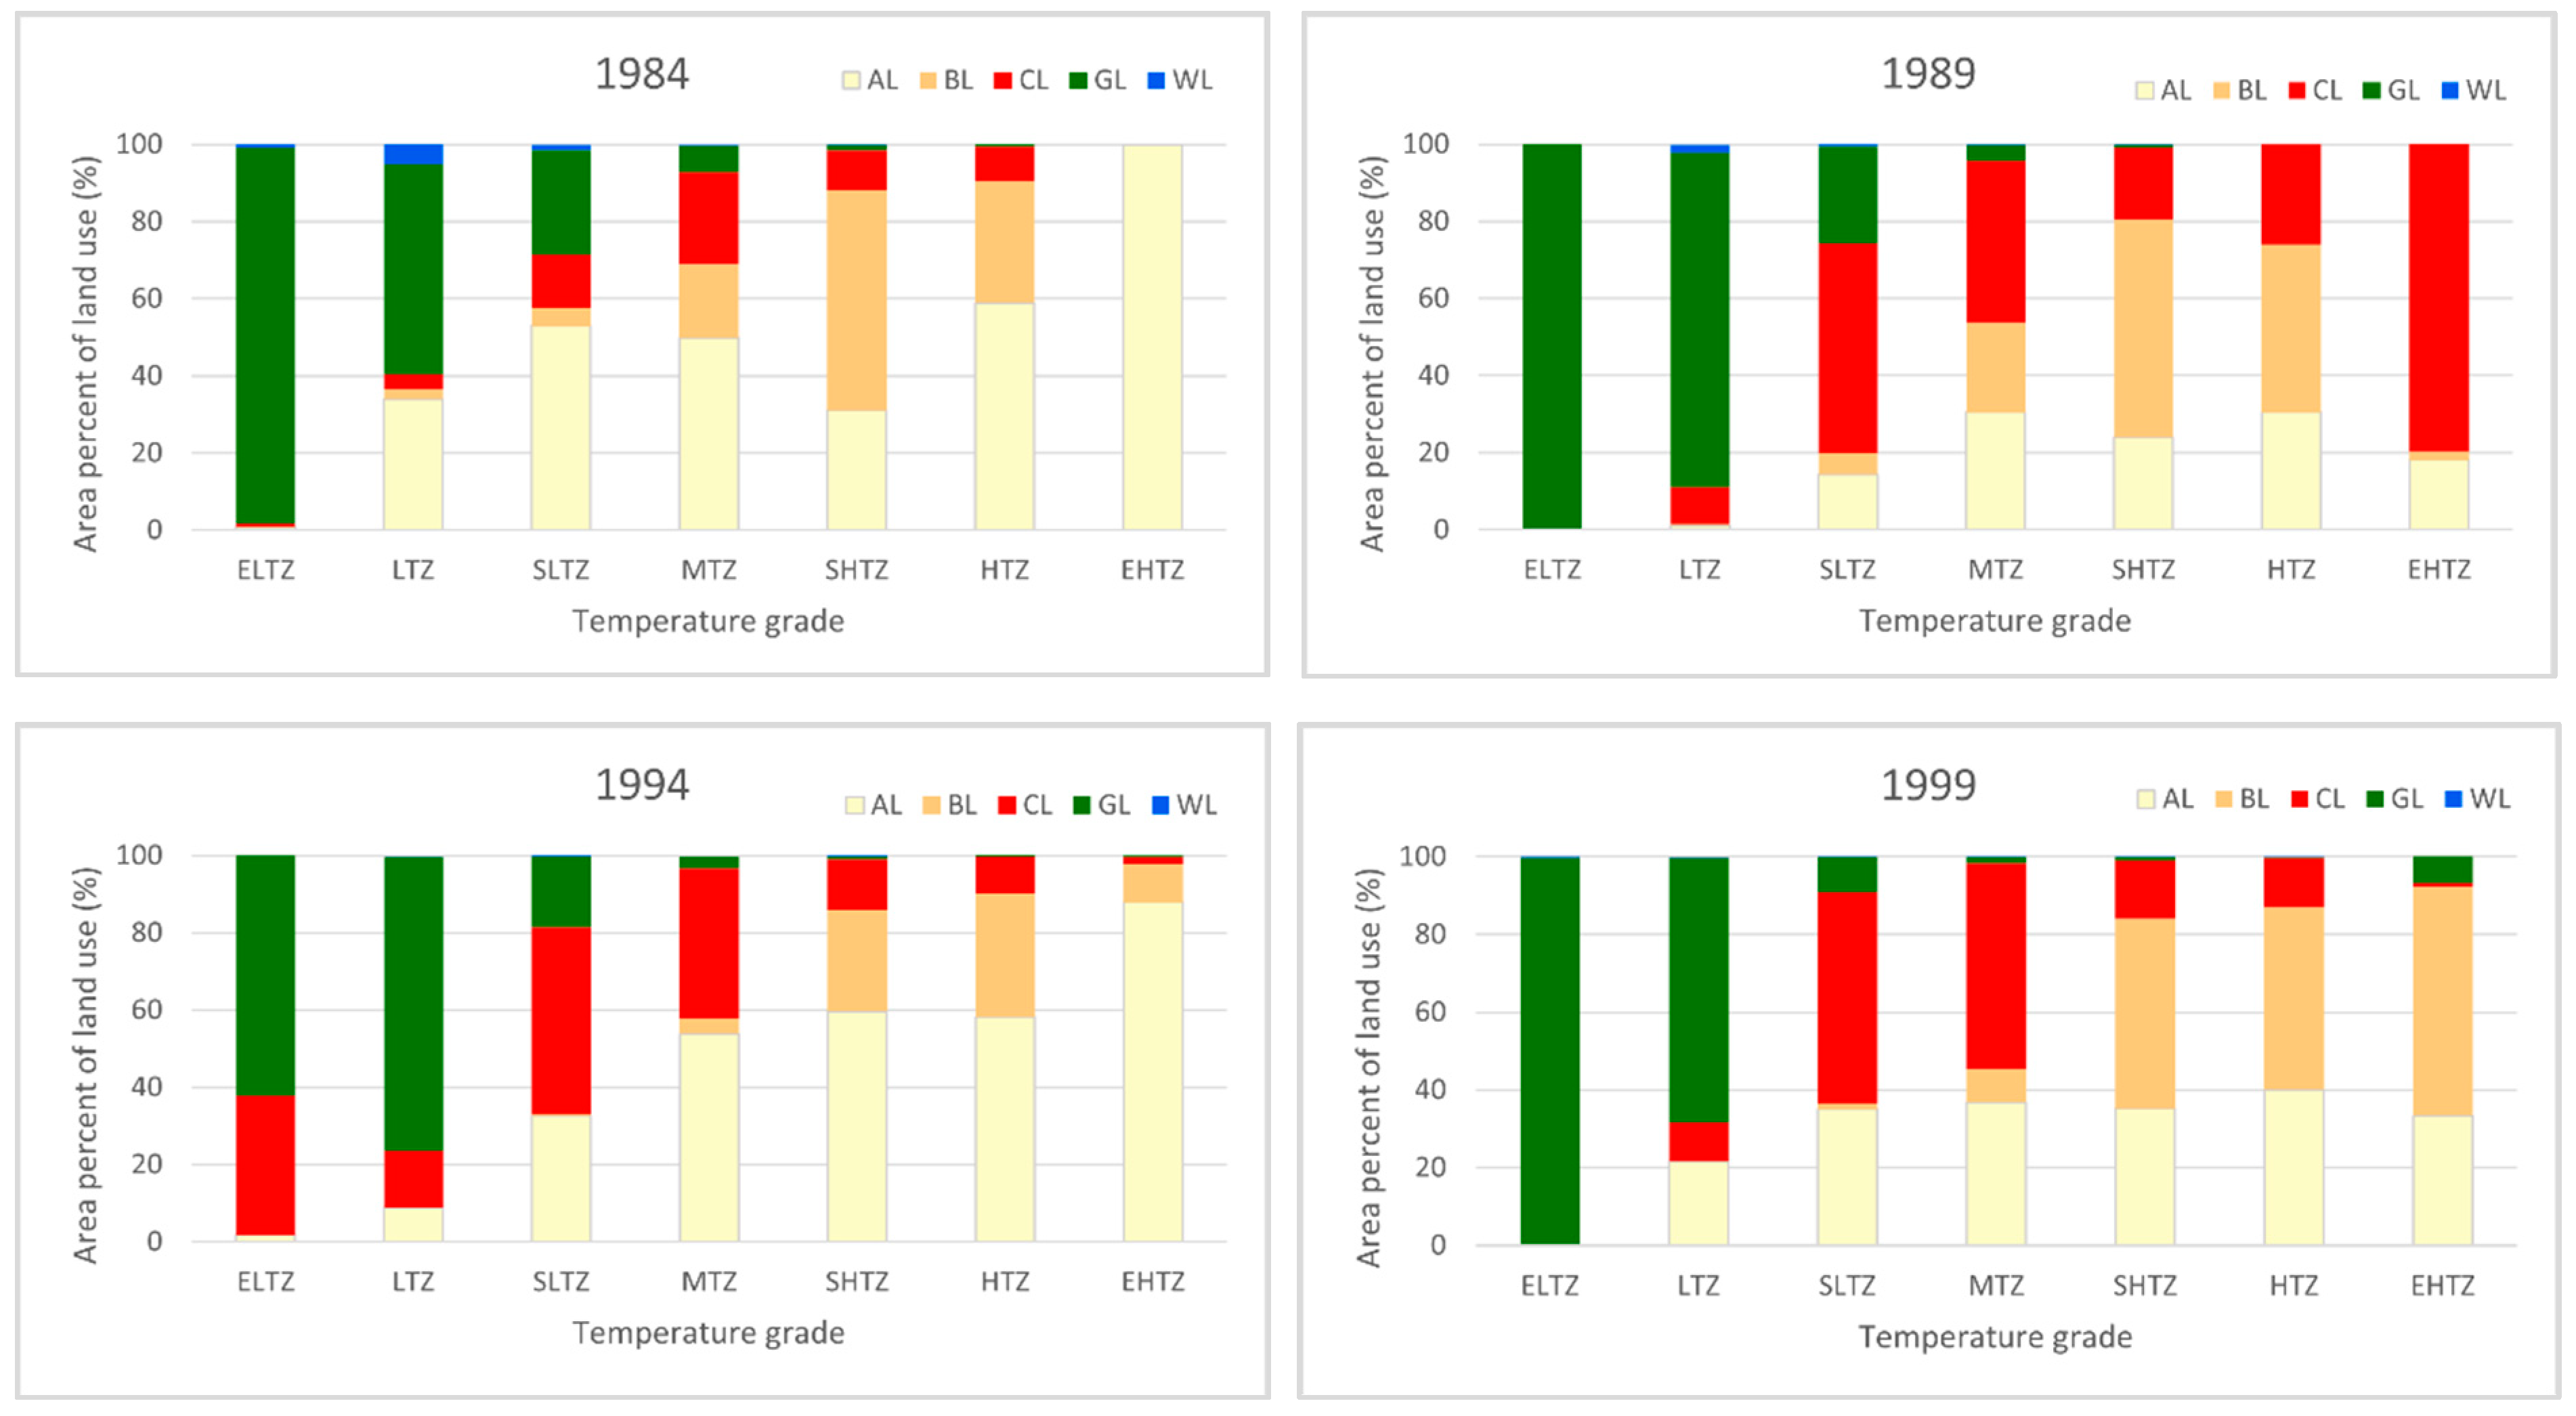
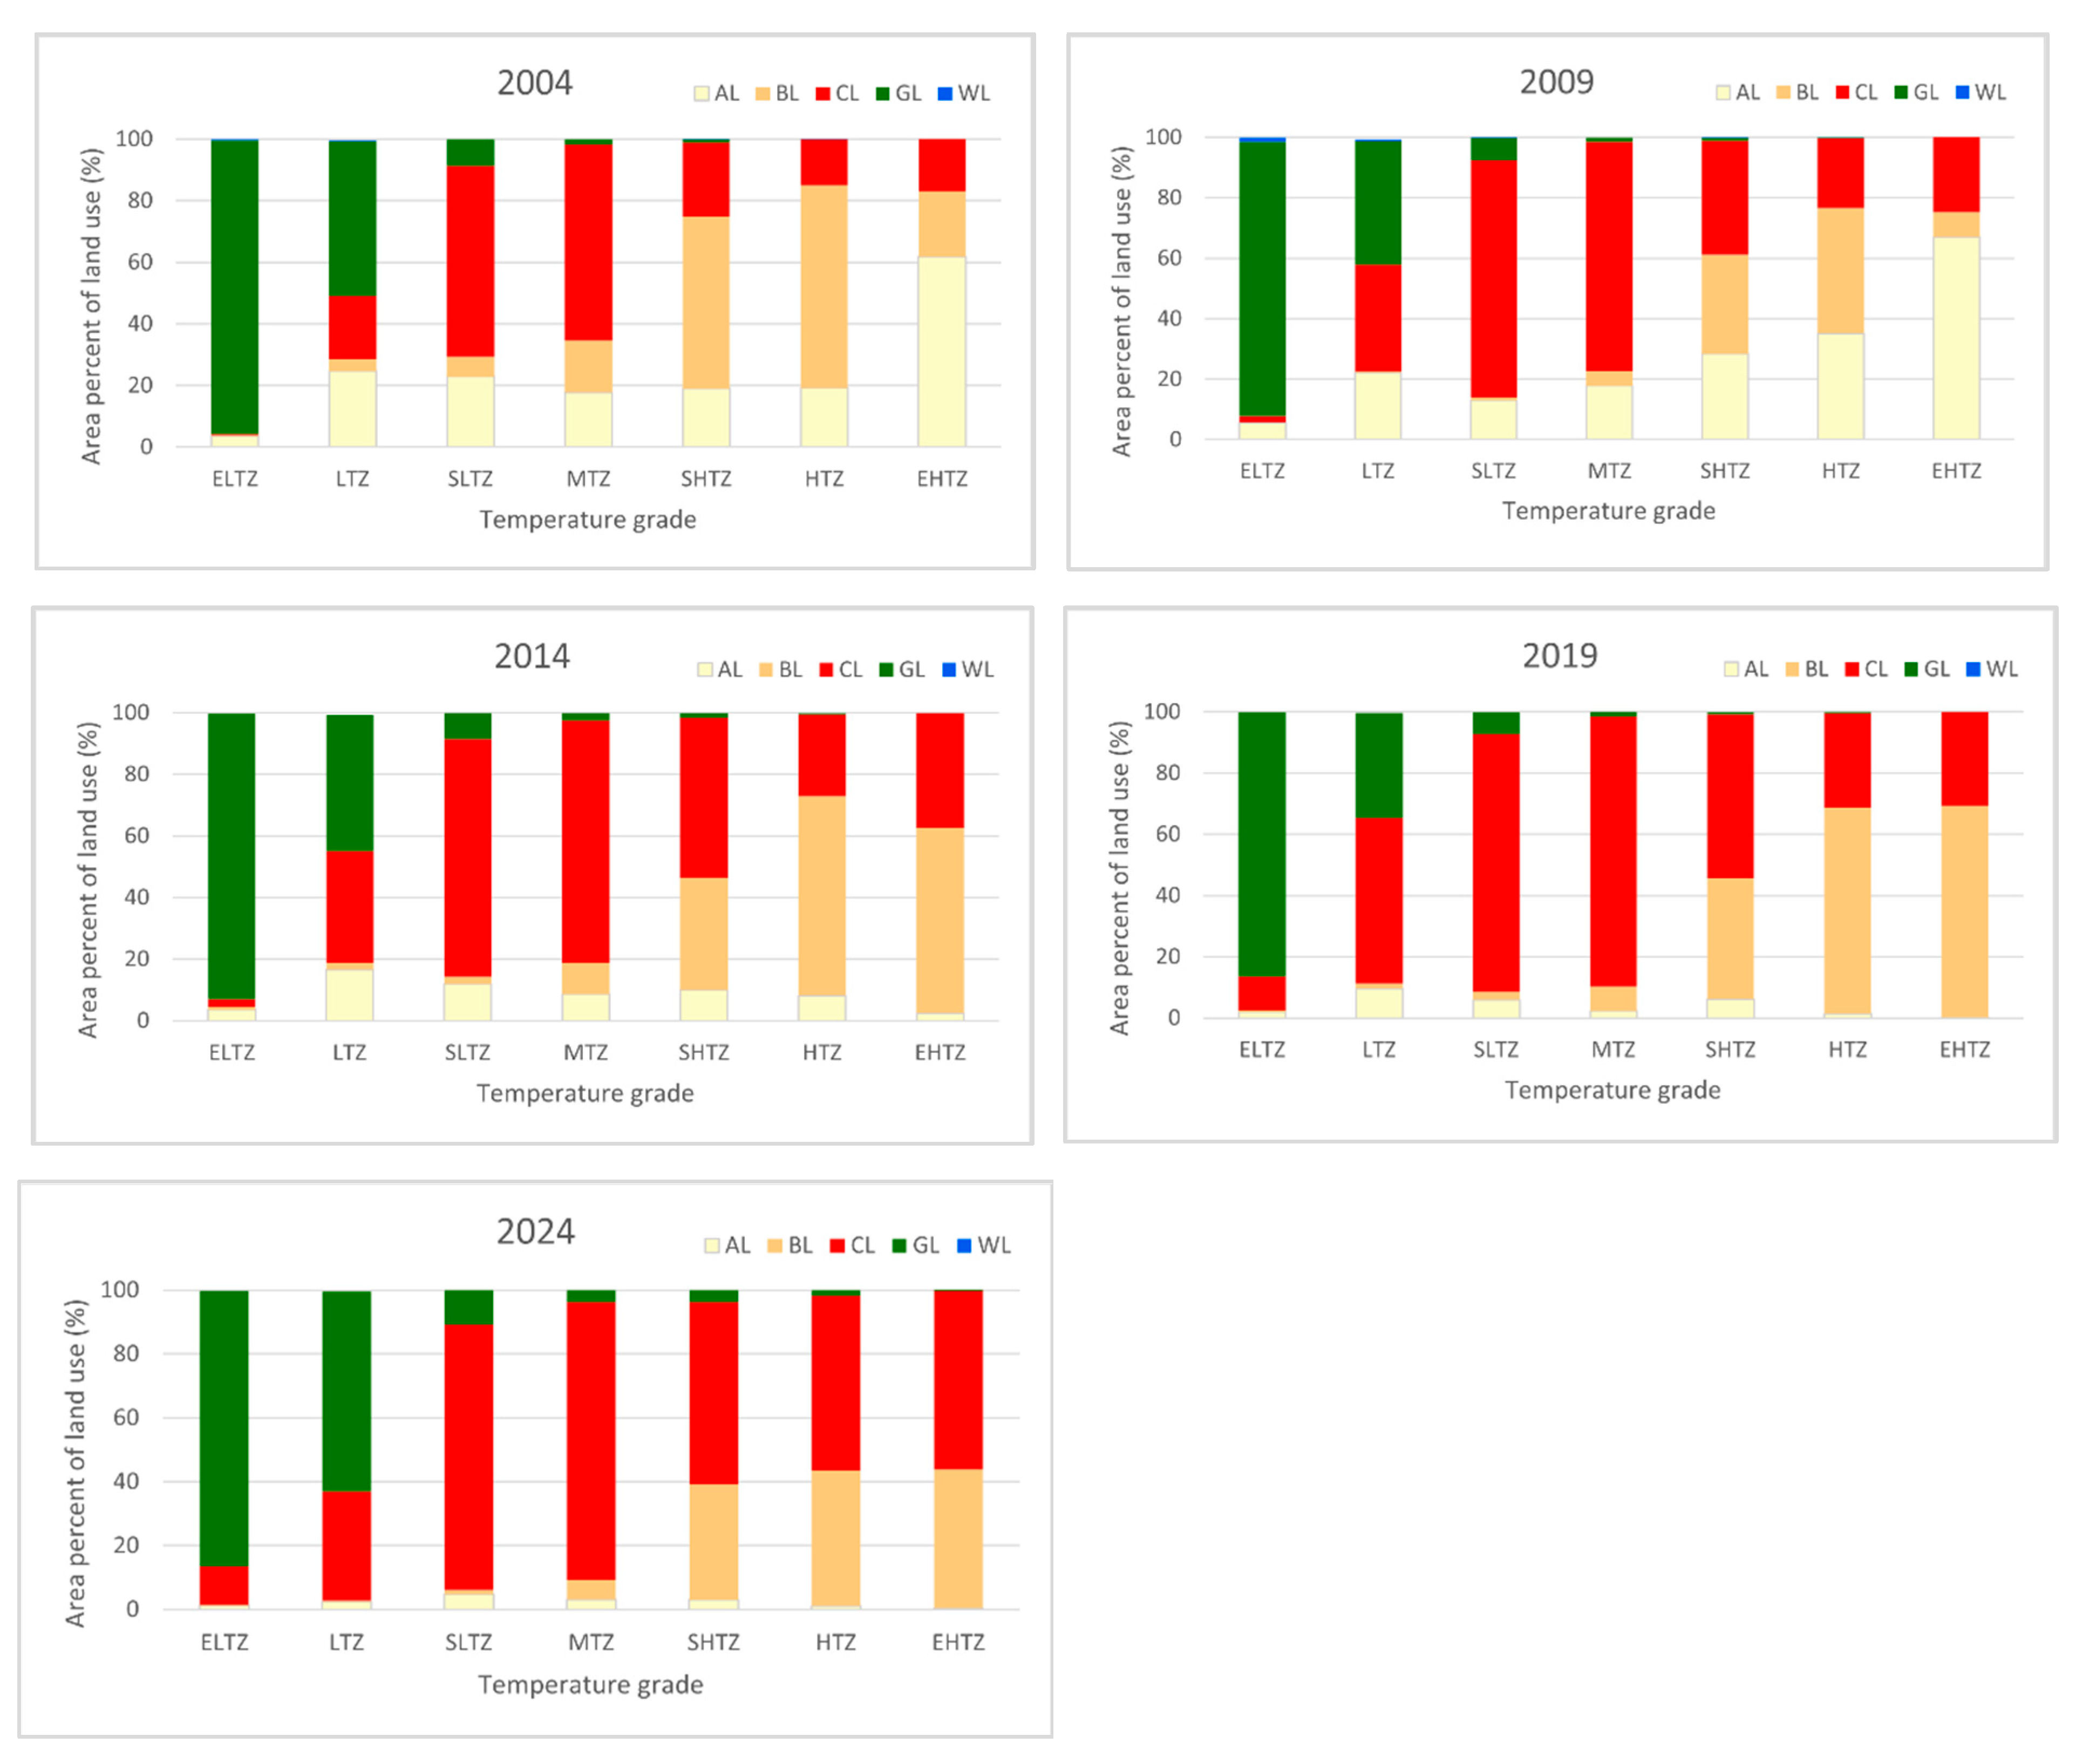
Figure 3 elaborates on the complex relationship between land use and surface temperatures, detailing changes over 40 years from 1984 to 2024. Analyzing the transformations within each temperature range alongside land-use observations provides a deeper understanding of the underlying environmental and urban dynamics driving these changes.
In 1984, green land (GL) accounted for 97.56% of the Extremely Low Temperature Zone (ELTZ), but this share dropped to 86.35% in 2024. This decline highlights the reduction in the cooling effect of green areas, which in turn led to a decrease in Low Temperature Zones. During the same period, the share of constructive land (CL) and agricultural land (AL) within the ELTZ increased from 0.83% and 0.82% in 1984 to 12.21% and 1.24%, respectively, by 2024. This shift reflects the contraction of the ELTZ boundary due to increased urbanization, with green spaces giving way to built-up areas. In 1984, GL covered 54.51% of the Low Temperature Zone (LTZ), but this share increased to 62.66% in 2024. While this suggests that green areas still play a significant role in Low Temperature Zones, the overall cooling effect has diminished. Meanwhile, CL’s share within the LTZ rose significantly from 3.91% in 1984 to 34.23% in 2024. This increase indicates that urban influences are becoming more pronounced, even in low temperature areas. The most notable changes in the Slightly Low Temperature Zone (SLTZ) were observed in the CL and AL classes. CL expanded dramatically from 13.87% in 1984 to 83.07% in 2024, underscoring the dominance of urban sprawl within the SLTZ. Conversely, AL’s share decreased sharply from 53% in 1984 to 4.81% in 2024, reflecting the significant loss of agricultural land to urbanization. In the Medium Temperature Zone (MTZ), AL accounted for 49.91% in 1984 but plummeted to 3.15% by 2024. This indicates that agricultural lands have become more vulnerable to temperature increases, with urbanization playing a dominant role. In contrast, CL increased its share within the MTZ from 23.94% in 1984 to 87.00% in 2024, signifying a marked expansion of urban areas in this temperature range. Bare land (BL) also exhibited a notable increase, rising from 19% in 1984 to 6.16% in 2024. Within the Slightly High Temperature Zone (SHTZ), CL’s share grew from 10.48% in 1984 to 57.15% in 2024. This reflects the increasing dominance of built-up areas in higher temperature zones and highlights the intensification of the urban heat island effect. Meanwhile, AL’s share within the SHTZ dropped from 31.09% in 1984 to 3.04% in 2024, indicating a declining presence of agricultural lands in these temperature ranges as they were replaced by urban development. In the High Temperature Zone (HTZ), the most significant change was observed in the CL class, whose share rose from 9.11% in 1984 to 54.76% in 2024. This indicates that the HTZ is now largely dominated by built-up areas. AL, on the other hand, saw its share within the HTZ decrease from 58.92% in 1984 to 1.22% in 2024, suggesting that agricultural lands have almost completely disappeared from high temperature areas. In the Extremely High Temperature Zone (EHTZ), the impact of CL was particularly striking. While CL was completely absent in this zone in 1984 (0%), its share reached 56.06% by 2024. This dramatic change demonstrates the extent to which urban expansion has become influential, even in extreme temperature areas. In contrast, AL, which accounted for 100% of the EHTZ in 1984, dropped to just 0.42% in 2024, indicating the near-total disappearance of agricultural lands from the hottest zones.
The changes in land use from 1984 to 2024, as shown in
Figure 3, are directly linked to increases in surface temperatures. The CL class exhibited the most significant growth across nearly all temperature ranges, confirming that the expansion of urban areas and built-up land has intensified surface temperatures. In contrast, the substantial percentage decreases in the AL and GL classes highlight the weakening of their temperature-regulating effects and emphasize the role of urbanization in exacerbating warming trends.
3.3. Analysis of LST Correlations Among the Years
The correlation matrix illustrates the linear relationships among the land surface temperatures (LST) of 1984, 1989, 1994, 1999, 2004, 2009, 2014, 2019, and 2024 (
Table 7). Correlation coefficients range from −1 to 1, where 1 indicates a perfect positive correlation, −1 signifies a perfect negative correlation, and 0 denotes no correlation. This matrix is a critical tool for understanding how various environmental variables are interconnected over the years.
The correlation coefficients derived from the LST data, which were categorized into seven distinct classes, are positive, indicating that LST exhibited a largely consistent pattern of variation over the years. This consistency reflects the persistent influence of environmental factors on LST. The correlation coefficient between 2014 and 2019, at 0.83410 (the highest value), indicates a very strong positive relationship, signifying that the LST data for these years are highly similar and that the changes observed were largely parallel. This high correlation suggests that environmental conditions between 2014 and 2019 remained relatively stable, resulting in comparable effects on LST. It also implies that a comparative analysis between these two years would yield reliable insights. On the other hand, the correlation coefficient between 1999 and 1984, at 0.62720 (the lowest value), indicates a moderate positive relationship. While there is still a similarity in LST data between these two years, certain differences are evident. This moderate correlation suggests that specific environmental changes, likely influenced by urban development, land-use alterations, or climatic shifts, contributed to some divergence in LST patterns during this period.
Overall, the correlation matrix demonstrates high positive correlations between LST values across the years, with notably stronger correlations observed between consecutive years. This indicates that LST variations followed a consistent trajectory over time. The strongest positive correlation, between 2014 and 2019, highlights the similarity in LST data and stable environmental conditions during these years. In contrast, the lowest correlation, between 1999 and 1984, reflects greater variability in environmental influences on LST. These findings are invaluable for urban planning, assessing the impacts of climate change, and developing future environmental management strategies.
3.4. Correlation Analysis Between LST and Land-Use Types
To evaluate the impact of land use on land surface temperatures (LST) in Muratpaşa District, correlation analyses were performed using data from the respective years. However, to better visualize and understand the changes, a comparison was made between the first year of the study, 1984, and the last year, 2024. This comparison reveals the transformation in the influence of land use on LST, categorized into seven classes, over time.
In 1984 (
Table 8), it was observed that green areas and water bodies in Muratpaşa District exerted a notable cooling effect on surface temperatures. The strong negative correlation between green areas and LST (−0.904) underscores the natural climate-regulating role of these areas, while water bodies demonstrated a similar cooling effect with a negative correlation (−0.788). Conversely, bare areas (r = 0.770) and built-up areas (r = 0.234) exhibited positive correlations with LST, indicating that these land-use types contributed to increased surface temperatures. These findings provide critical insights into how land use influenced LST in 1984, emphasizing the importance of sustainable land-management strategies. This analysis reveals the dynamic relationship between land use and LST and highlights the transformative impact of urbanization, land-cover changes, and environmental management strategies on the region’s thermal environment.
By 2024 (
Table 9), significant changes can be observed in the impacts of land use on LST within the district. The correlations between LST and both bare lands and built-up areas have reached remarkably high values of 0.873 and 0.965, respectively. This indicates that urban sprawl and land-use changes have substantially intensified their effects on surface temperatures. Agricultural areas also exhibit a positive correlation (r = 0.753), revealing that their influence on LST has strengthened over time. Green areas continue to have a strong negative correlation (−0.969), underscoring their role in mitigating surface temperatures. The data regarding water areas point to a decrease or complete loss of water resources in the region.
Overall, an analysis of the correlation data from 1984 and 2024 reveals a significant transformation in the impacts of land use on surface temperatures in the Muratpaşa District. In 1984, green areas (−0.904) and water areas (−0.788) played a substantial role in lowering LST. By 2024, these effects persist, yet the dominant influence of urbanization and bare lands has significantly increased. Built-up areas (r = 0.965) and bare lands (r = 0.873) exhibit strong warming effects on LST, highlighting the growing pressure of urbanization and land-use changes on surface temperatures.
3.5. Changes in LST and Landscape-Level Indices
The analyses conducted between 1984 and 2024 comprehensively illustrate the substantial changes in land use and their effects on LST, categorized into seven classes, within the Muratpaşa District. During this period, the environmental impacts of urban sprawl, particularly the increase in built-up areas and the loss of natural areas, are evident.
In 1984, agricultural areas (AL) covered the largest surface area at 45.01%, followed by bare lands (BL) at 24.95%, green areas (GL) at 12.99%, and built-up areas (CL) at 16.34%. Water areas comprised only 0.71%. At this time, agricultural and green areas dominated the landscape, while urban areas occupied relatively smaller proportions. The landscape metrics included an LPI of 34.94%, an LSI of 50.42, an SHDI of 1.302, and an SHEI of 0.809. The high SHDI and SHEI values indicate a diverse and heterogeneous landscape.
In 1989, the proportion of agricultural areas (AL) decreased to 23.25%, while built-up areas (CL) increased significantly to 38.06%. This shift reduced the surface areas of other land-use classes, signaling a trend toward urbanization. Water areas remained low at 0.31%. The landscape metrics (LPI = 34.94%, LSI = 50.42, SHDI = 1.302, and SHEI = 0.809) reflected the growing dominance of urban areas and the decline in agricultural and green areas.
In 1994, agricultural areas (AL) expanded to 47.06%, while built-up areas (CL) declined to 33.22%. The proportion of green areas (GL) was 9.42%, and bare lands (BL) accounted for 10.29%. Water areas remained minimal at 0.014%. The metrics (LPI = 32.43%, LSI = 42.85, SHDI = 1.1785, and SHEI = 0.7322) suggest a temporary increase in agricultural areas and a decline in urbanization but also highlight reduced landscape diversity and heterogeneity.
In 1999, the proportions shifted again, with agricultural areas (AL) at 35.64%, built-up areas (CL) at 39.76%, green areas (GL) at 6.46%, and bare lands (BL) at 18.13%. Water areas were nearly negligible (0.0115%). The metrics (LPI = 29.28%, LSI = 44.05, SHDI = 1.222, and SHEI = 0.7593) reflect a rapid increase in urban areas and a loss of green spaces, underscoring the environmental impacts of urban expansion.
In 2004, built-up areas (CL) had risen to 48.49%, while green areas (GL) decreased to 5.73%. Bare lands (BL) accounted for 25.11%, and agricultural areas (AL) dropped to 20.65%. Water areas were nearly absent (0.0135%). The metrics (LPI = 41.60%, LSI = 50.37, SHDI = 1.1889, and SHEI = 0.7387) indicate the dominance of urban areas and the ongoing destruction of natural habitats, with urban areas exerting increasing control over the landscape.
In 2009, built-up areas (CL) rose to 61.61%, while green areas (GL) declined further to 4.90%. Bare lands (BL) decreased to 12.03%, and agricultural areas (AL) slightly increased to 21.41%. Water areas remained at 0.0432%. The metrics (LPI = 56.94%, LSI = 43.55, SHDI = 1.0344, and SHEI = 0.6427) emphasize the unsustainable environmental impacts of urban sprawl and the declining presence of green spaces.
In 2014, built-up areas (CL) reached 65.63%, with green areas (GL) at 5.68%, bare lands (BL) at 17.73%, and agricultural areas (AL) at 10.96%. Water areas were entirely absent. The metrics (LPI = 63.32%, LSI = 43.89, SHDI = 0.9884, and SHEI = 0.713) reveal the intensification of urban development, the continued loss of natural habitats, and the growing dominance of urban areas in the landscape.
In 2019, built-up areas (CL) continued to rise, reaching 72.98%, while green areas (GL) decreased to 4.61%. Bare lands (BL) remained at 17.50%, and agricultural areas (AL) dropped to 4.91%. Water areas were nonexistent. The metrics (LPI = 71.37%, LSI = 33.69, SHDI = 0.8247, and SHEI = 0.5949) highlight the severe environmental consequences of urban sprawl and the ongoing reduction of green spaces.
In 2024, built-up areas (CL) reached their highest proportion at 73.90%, while green areas (GL) increased slightly to 8.69%. Bare lands (BL) accounted for 13.47%, and agricultural areas (AL) dropped to 3.95%. Water areas remained absent. The metrics (LPI = 72.15%, LSI = 32.10, SHDI = 0.8334, and SHEI = 0.6012) reflect the peak dominance of urban areas, the limited but noticeable increase in green spaces, and the ongoing loss of natural habitats in the district.
4. Discussion
This study conducted in Antalya’s Muratpaşa District demonstrates how the urban heat island (UHI) effect evolves through strong correlations between land-use changes and land surface temperatures (LST). During a period characterized by rapid urbanization and a decline in natural surfaces, the expansion of impervious surfaces has reduced evapotranspiration, ultimately leading to increased LST. These findings confirm the earlier literature that highlights the strong alignment between built-up areas (CL) and High Temperature Zones (HTZ), as well as the association of green spaces (GL) with Low Temperature Zones (LTZ) [
5,
22,
26,
47,
49,
56,
57,
58].
Our findings clearly illustrate the dramatic changes in urban land use and their impact on LST between 1984 and 2024. The percentage of agricultural areas declined from 45.77% to 3.39%, while water areas decreased from 0.67% to complete disappearance. These trends are striking indicators of urban sprawl and land transformation. Conversely, the proportion of built-up areas increased from 15.72% to 75.33%, emphasizing the dominant role of urban development in Muratpaşa. These results are consistent with the trends of urban expansion reported in other studies [
5,
44,
56,
58]. Similarly, in other geographic contexts, the loss of agricultural areas and the increase in built-up areas highlight the environmental impacts of urbanization.
The findings of this study reveal that the relationships between land-use classes (CL, AL, BL, GL, and WL) and LST are closely tied not only to the size of these surface areas but also to their distribution and structural characteristics. For instance, large and homogeneous CL areas tend to produce higher LST values, whereas fragmented and irregularly shaped GL and WL areas are more effective in reducing LST. This emphasizes the importance of considering not only the size of surface areas but also their spatial configuration in urban landscape planning, aligning with findings in previous studies [
1,
28,
59]. Extensive and cohesive green areas (GL) with low fragmentation levels demonstrate significant potential to lower LST, while dense and extensive CL areas contribute to elevated LST. This finding, consistent with earlier research, underscores the critical role of landscape composition and configuration in managing the UHI effect. However, further research is necessary to better understand the influence of landscape configurations on LST. In particular, advanced multivariate analyses and long-term datasets are essential to fully comprehend the contributions of landscape pattern metrics to cooling and heating effects, consistent with prior studies [
47,
51,
60].
The former presence of water areas in Muratpaşa, before their complete disappearance, aligns with previous studies emphasizing the critical role of water bodies in mitigating LST [
5,
19,
46]. This finding highlights the importance of prioritizing the conservation of water resources to ensure environmental sustainability and mitigate climatic impacts.
The increase in built-up areas has shown a clear impact on LST in our findings. The average LST for built-up areas increased from 36.94 °C in 1984 to 40.91 °C in 2024. This rise serves as an indicator of the UHI effect and reflects the environmental consequences of urban expansion. On the other hand, green areas are associated with lower LST values, reaffirming their critical role in maintaining thermal balance. These findings align with the various studies that have highlighted the environmental benefits of green areas [
19,
26,
57].
In summary, the findings of this study underscore the necessity of developing sustainable land-use policies in Antalya’s Muratpaşa District. To reduce the UHI effect and balance the local climate, efforts should focus on expanding green infrastructure, minimizing impervious surfaces, and promoting diverse and complex landscape configurations in urban planning. Such strategies not only have positive implications for the local climate but also contribute to enhancing urban quality of life [
5,
8,
13,
47].
5. Conclusions
This study comprehensively examined the relationship between land surface temperatures (LST) and land-use classes in Antalya’s Muratpaşa District from 1984 to 2024 at five-year intervals. Understanding the impacts of land-use changes on LST is critically important for urban planning and environmental management. In this context, the relationship between LST and land-use classes, especially built-up areas (CL) and green areas, emerged as a key focus of this analysis [
5].
The findings revealed that the expansion of urban areas has significantly increased surface temperatures. While the influence of built-up areas (CL) on LST was limited in 1984 (22.67%), this effect markedly intensified by 2024, substantially elevating surface temperatures. This increase highlights a direct correlation between the intensity of urbanization and the urban heat island effect. Notably, the correlation coefficient between built-up areas and LST reached 0.965 by 2024, underscoring the rapid rise in surface temperatures in densely urbanized regions and the pressing influence of built-up areas on the local climate [
47,
59]. Similar studies have reported parallel findings, demonstrating that the growth of impervious surfaces in urban centers not only contributes to increased LST but also intensifies heat concentration within densely populated zones [
26,
58]. Moreover, impervious surface expansion has been linked to reduced evapotranspiration, further exacerbating the urban heat island effect [
5,
47].
The relationship between green areas and LST, on the other hand, exhibited a negative trend over this period. The reduction in green areas from 1984 to 2024 accelerated the increase in surface temperatures. In 1999, when green areas reached their lowest share (6.35%), a significant rise in LST was observed. However, by 2024, the resurgence of green areas (8.21%) played a crucial role in mitigating surface temperature increases. A strong negative correlation coefficient of −0.969 between green areas and LST indicates the potential of green spaces to balance urban surface temperatures and reduce the urban heat island effect [
50,
57]. Previous research has consistently shown that cohesive and large-scale green areas are highly effective in reducing LST through cooling effects such as shading and evapotranspiration [
28,
59]. Fragmented or poorly connected green spaces, however, lose their cooling efficiency, emphasizing the need for integrated landscape planning [
1,
47].
Water areas underwent notable changes during this period. While limited in 1984, some water areas had disappeared entirely by 2024. The reduction in water areas weakened their cooling effect on LST, a trend attributed to factors such as climate change, excessive water consumption, and urban sprawl. The loss of water bodies adversely affected not only surface temperatures but also ecosystem services and biodiversity [
5,
57]. This aligns with findings in the literature, where water bodies have been identified as key elements in mitigating urban heat due to their thermal inertia and evaporative cooling effects. The disappearance of water areas has been linked to reduced resilience against heat waves and increased urban heat stress in other studies, as well [
19,
46].
Agricultural areas also played a significant role in influencing surface temperatures. The share of agricultural areas decreased from 45.77% in 1984 to just 3.39% in 2024, largely due to their conversion into built-up areas. This decline posed risks to both local economies and food security while indirectly contributing to LST increases [
5]. Similar findings in other regions have demonstrated that the conversion of agricultural areas to urban land not only raises local temperatures but also disrupts regional climate regulation and soil health [
5,
22]. Furthermore, the loss of agricultural land is often irreversible, making its preservation crucial for sustainable urban development.
In conclusion, this study demonstrates the profound impact of land-use changes on LST in the Muratpaşa region of Antalya. The expansion of built-up areas has rapidly elevated surface temperatures, while the preservation and expansion of green areas have been critical in balancing these temperature increases. In particular, areas such as the Yıldız, Yüksekalan, Gebizli, and Varlık neighborhoods are experiencing significant reductions in green space, which contributes to higher local temperatures. Local authorities should consider developing green-space expansion strategies specifically tailored to these districts, such as converting vacant lots into urban parks and introducing more street-level greenery. With the addition of the necessary equipment for rainwater harvesting from rooftops in the parks to be created, water needs can be met and used to reduce the surface temperature of the land in that area in summer. The decline in water and agricultural areas has raised serious concerns for climate and ecosystem stability in the region. To address this, policies that promote the conservation and restoration of wetland areas around the Tarım, Kırcami, and Yeşilova regions, as well as the preservation of agricultural land near the eastern part of Muratpaşa, should be prioritized. This could include zoning regulations that limit urban encroachment on these vital areas. Developing sustainable urban-planning and land-management policies is essential to controlling LST increases and ensuring ecosystem continuity. To mitigate LST increases, the implementation of green infrastructure, such as green roofs and permeable pavements, should be mandated in new commercial and residential developments, especially in dense urban areas like the Meydankavağı and Varlık districts. Encouraging green infrastructure practices and the conservation of water resources are highlighted as effective strategies to mitigate the urban heat island effect [
5]. Consistent with prior studies, the implementation of green roofs, urban forests, and permeable pavements has proven effective in reducing the negative impacts of the urban heat island effect [
19,
26,
57]. These strategies not only contribute to cooling but also enhance biodiversity and water management in urban environments. Specific policies such as tax incentives or subsidies for building owners who install green roofs or adopt permeable paving could be introduced in key areas with high impermeable surfaces, including the Sinan and Zerdalilik neighborhoods. Overall analysis of the findings reveals that urbanization processes in Antalya’s Muratpaşa District are in conflict with the expansion and preservation of green spaces. Urban planning fails to align with sustainability goals, prioritizing policies that focus on increasing construction and commercial areas. In the case of rapid development in the Muratpaşa and Kılınçarslan neighborhoods, a more integrated approach is needed, where new developments are planned with sufficient green space allocations. Zoning laws should require that any new building projects incorporate green space elements within their plans. This approach not only leads to the destruction of existing green spaces but also creates significant obstacles to establishing new ones. The insufficient measures taken by local authorities to protect green spaces, the inadequacy of alternative energy policies, and the lack of environmentally friendly infrastructure projects further exacerbate the problem. In other words, actions aimed at increasing green spaces often conflict with economic growth and urban development priorities. It is crucial to integrate landscape ecology principles into urban planning practices, as highlighted in other studies. For instance, in areas with high development pressure, such as the Çağlayan and Güvenlik neighborhoods, the creation of ecological corridors and buffer zones around green spaces could help reduce fragmentation and preserve biodiversity. Strategies such as creating buffer zones, maintaining ecological corridors, and prioritizing mixed-use development have been shown to mitigate the negative impacts of urban sprawl on LST and biodiversity [
28,
47,
51]. These key findings are summarized as follows:
Rising Urban Heat Island Effect: The urban heat island effect in Muratpaşa, Antalya, has intensified over the past 40 years. In 1984, with limited built-up areas, heat hotspots were concentrated in the city center. By 2024, the rapid and extensive expansion of built-up areas had spread heat hotspots across the entire city, exacerbating the thermal environment. This highlights the significant pressure rapid urbanization places on surface temperatures.
LST Differences Among Land-Use Classes: Notable differences in LST were observed among land-use classes, with built-up areas (CL) exhibiting the highest LST values. According to 2024 data, the LST hierarchy is as follows: CL > agricultural areas (AL) > bare land (BL) > green areas (GL) > water areas (WL). Built-up areas were identified as the largest contributors to the urban heat island. Although green areas provided cooling effects through transpiration and shading, their limited presence in the region constrained their impact. Water areas, with their expansive surfaces, were the most effective in reducing LST, but their decline reduced this cooling effect.
Land Use and Patch Indices: Relationships between land-use classes and patch indices revealed the impact of land fragmentation on LST. Larger green areas (GL) with lower fragmentation, denser distribution, and more complex shapes were associated with lower LST, contrasting with built-up areas (CL). The reduction and fragmentation of agricultural areas (AL) contributed to rising LST. These findings underscore the importance of landscape design and land-management strategies in controlling surface temperatures.
LST and Landscape Metrics: The relationship between LST and landscape-level indices revealed complex dynamics affecting surface temperatures. LST showed negative correlations with patch density (PD), the landscape shape index (LSI), interspersion and juxtaposition index (IJI), Shannon diversity index (SHEI), and Shannon homogeneity index (SHDI), and positive correlations with the contagion index (CONTAG), largest patch index (LPI), and area index (AI). These findings emphasize that increasing landscape diversity and reducing fragmentation are critical for mitigating surface temperatures. Diverse and less fragmented landscapes proved more effective in balancing surface temperatures compared to homogeneous and expansive landscapes.
Recommendations for Mitigation: To reduce surface temperatures, landscape diversity should be increased, and connectivity among different landscape types should be minimized. Expanding green areas and reducing the density of built-up areas are essential strategies for alleviating the urban heat island effect. Urban planning and land-management policies must be revisited in line with sustainability principles. This study provides critical insights into the environmental impacts of urbanization in Muratpaşa, Antalya, and offers a valuable guide to prevent similar challenges in the future [
5,
61].


