4.1. Criteria Classification
The spatial distribution of the five criteria used in flood-hazard assessment, categorized into five flood-hazard levels, based on their respective influence on flooding, is shown in the thematic maps in
Figure 3,
Figure 4,
Figure 5,
Figure 6 and
Figure 7.
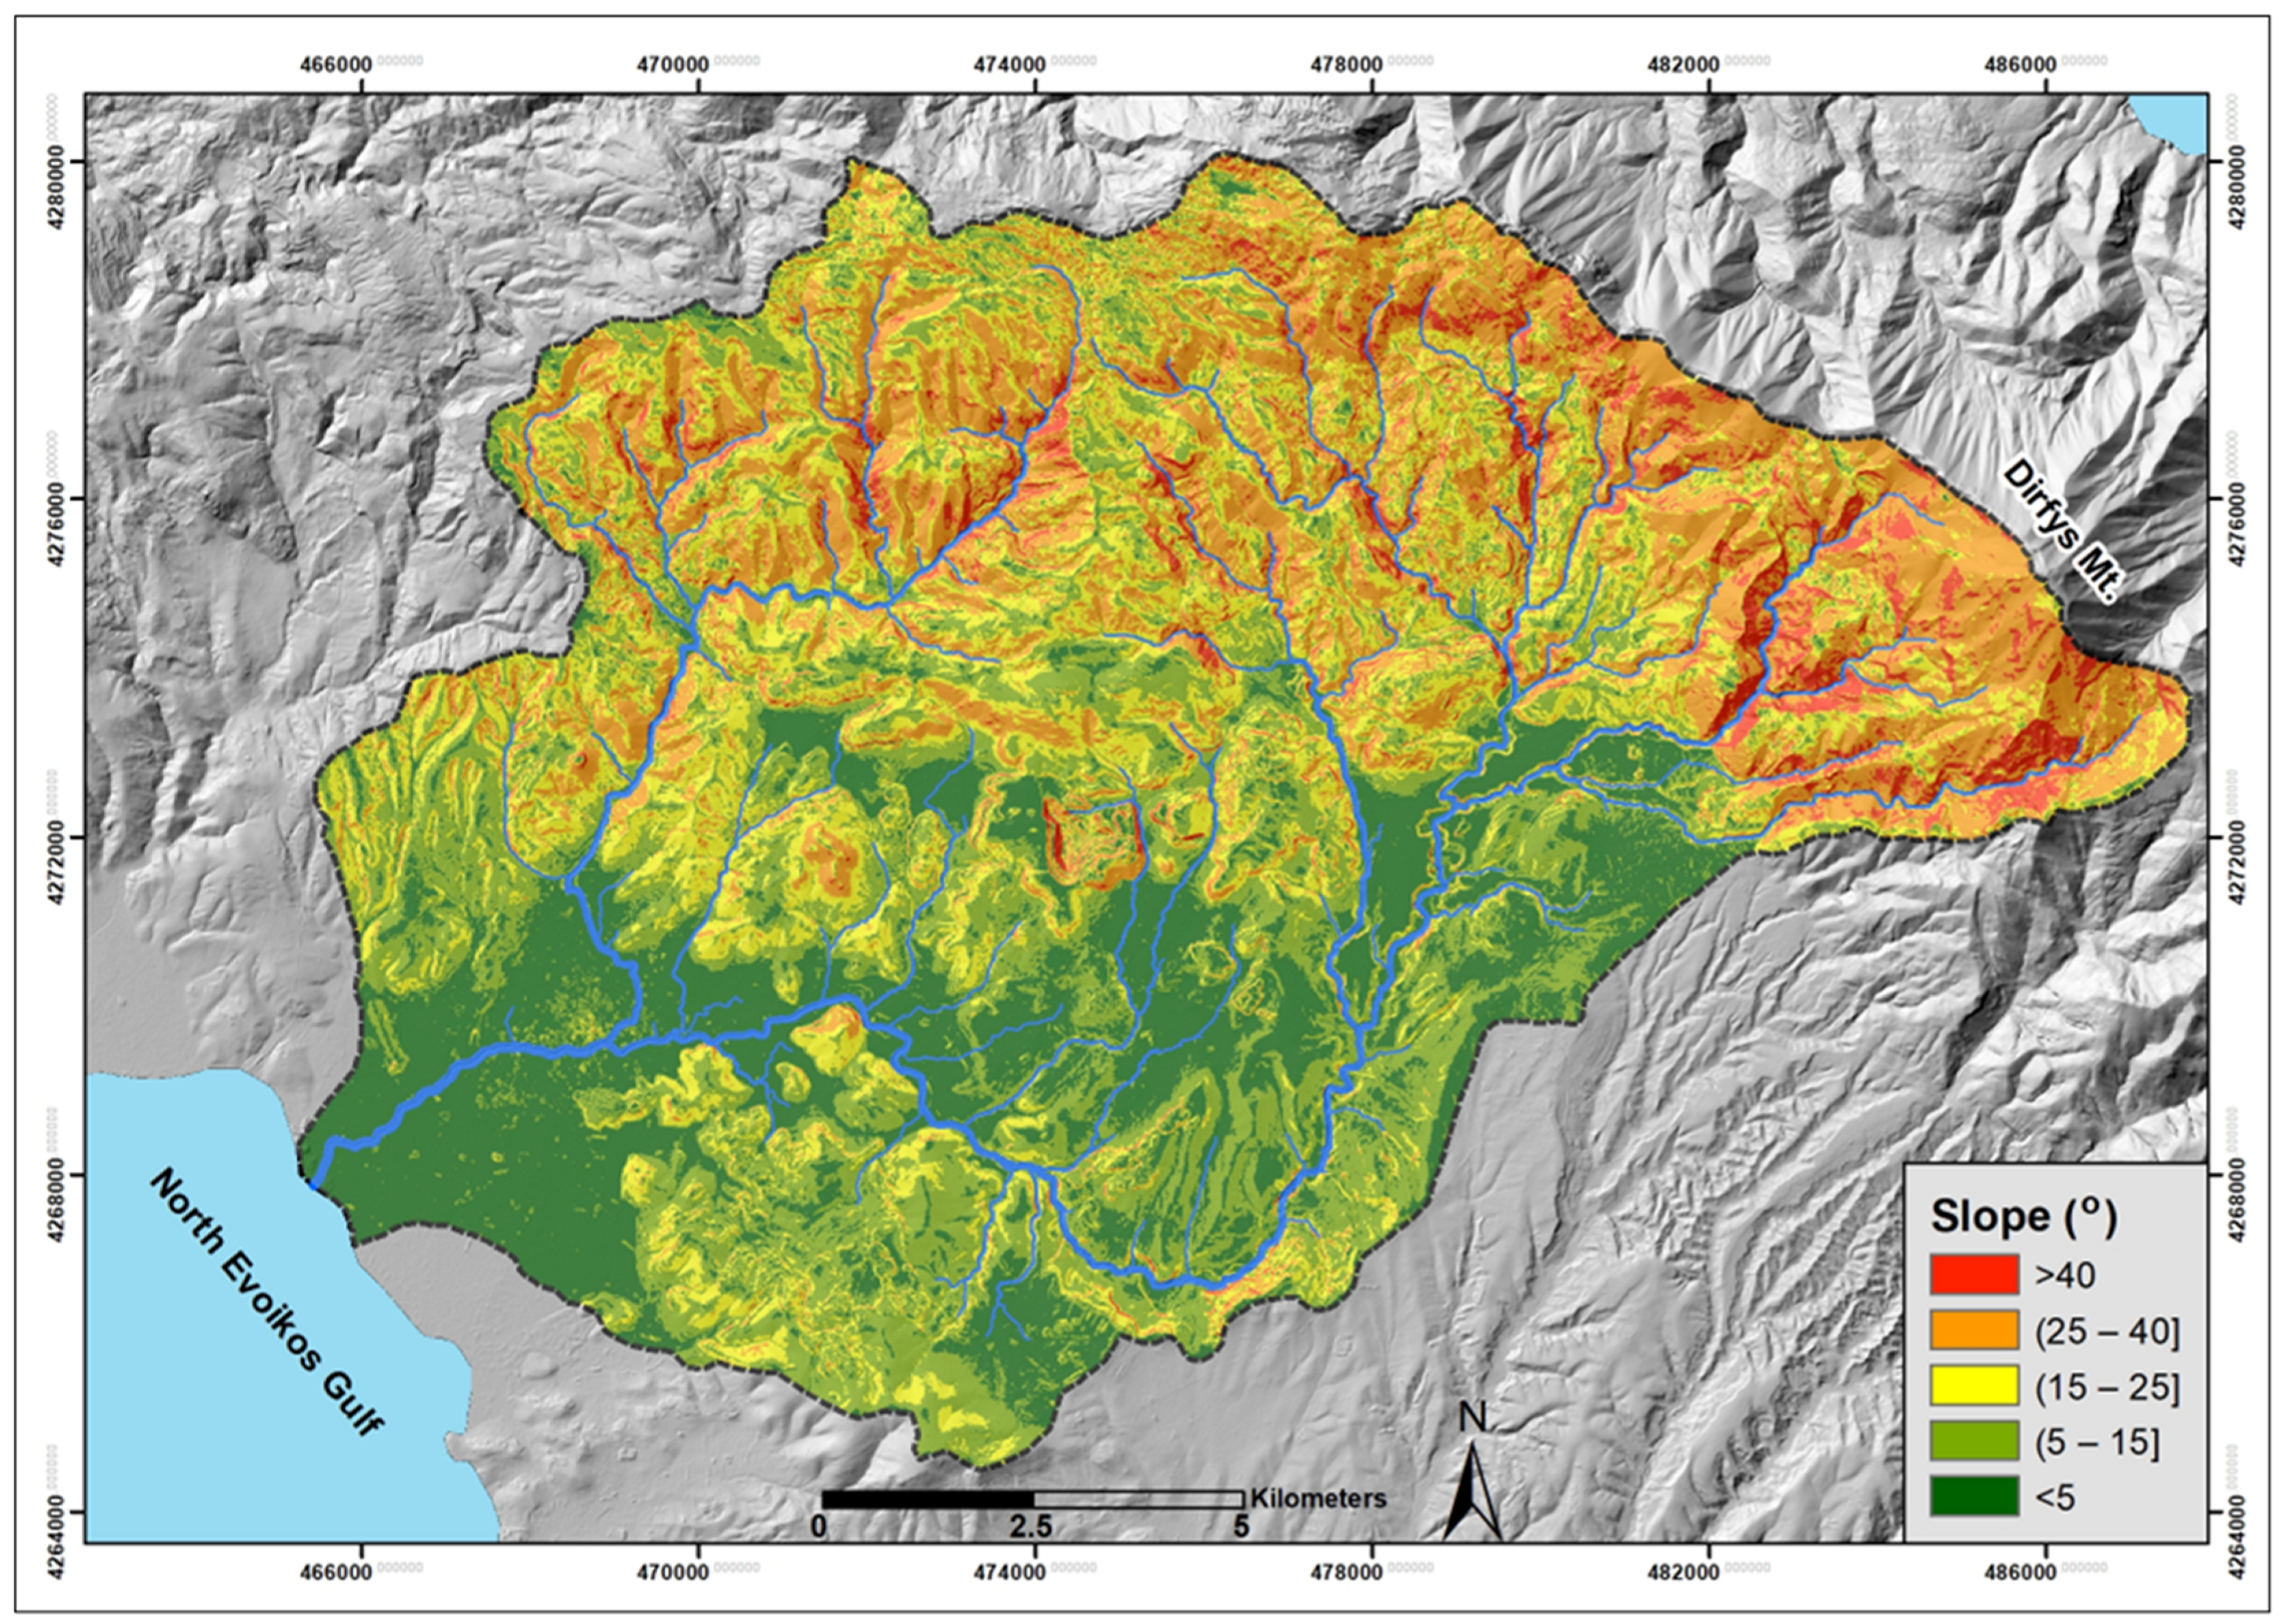
The slope in the study area ranges from 0° to 76°. Approximately 110 km2, or 51% of the total catchment area, fall into the categories of high and very high susceptibility to flood hazard. These gentle sloping areas are predominantly located in the central, southern, and western parts of the catchment, primarily covering the plains of Psachna and Triada. Conversely, the steeply sloping areas of low and very low flood risk are found in the northern and eastern parts of the study area, corresponding to the mountainous regions of Mount Dirfys.
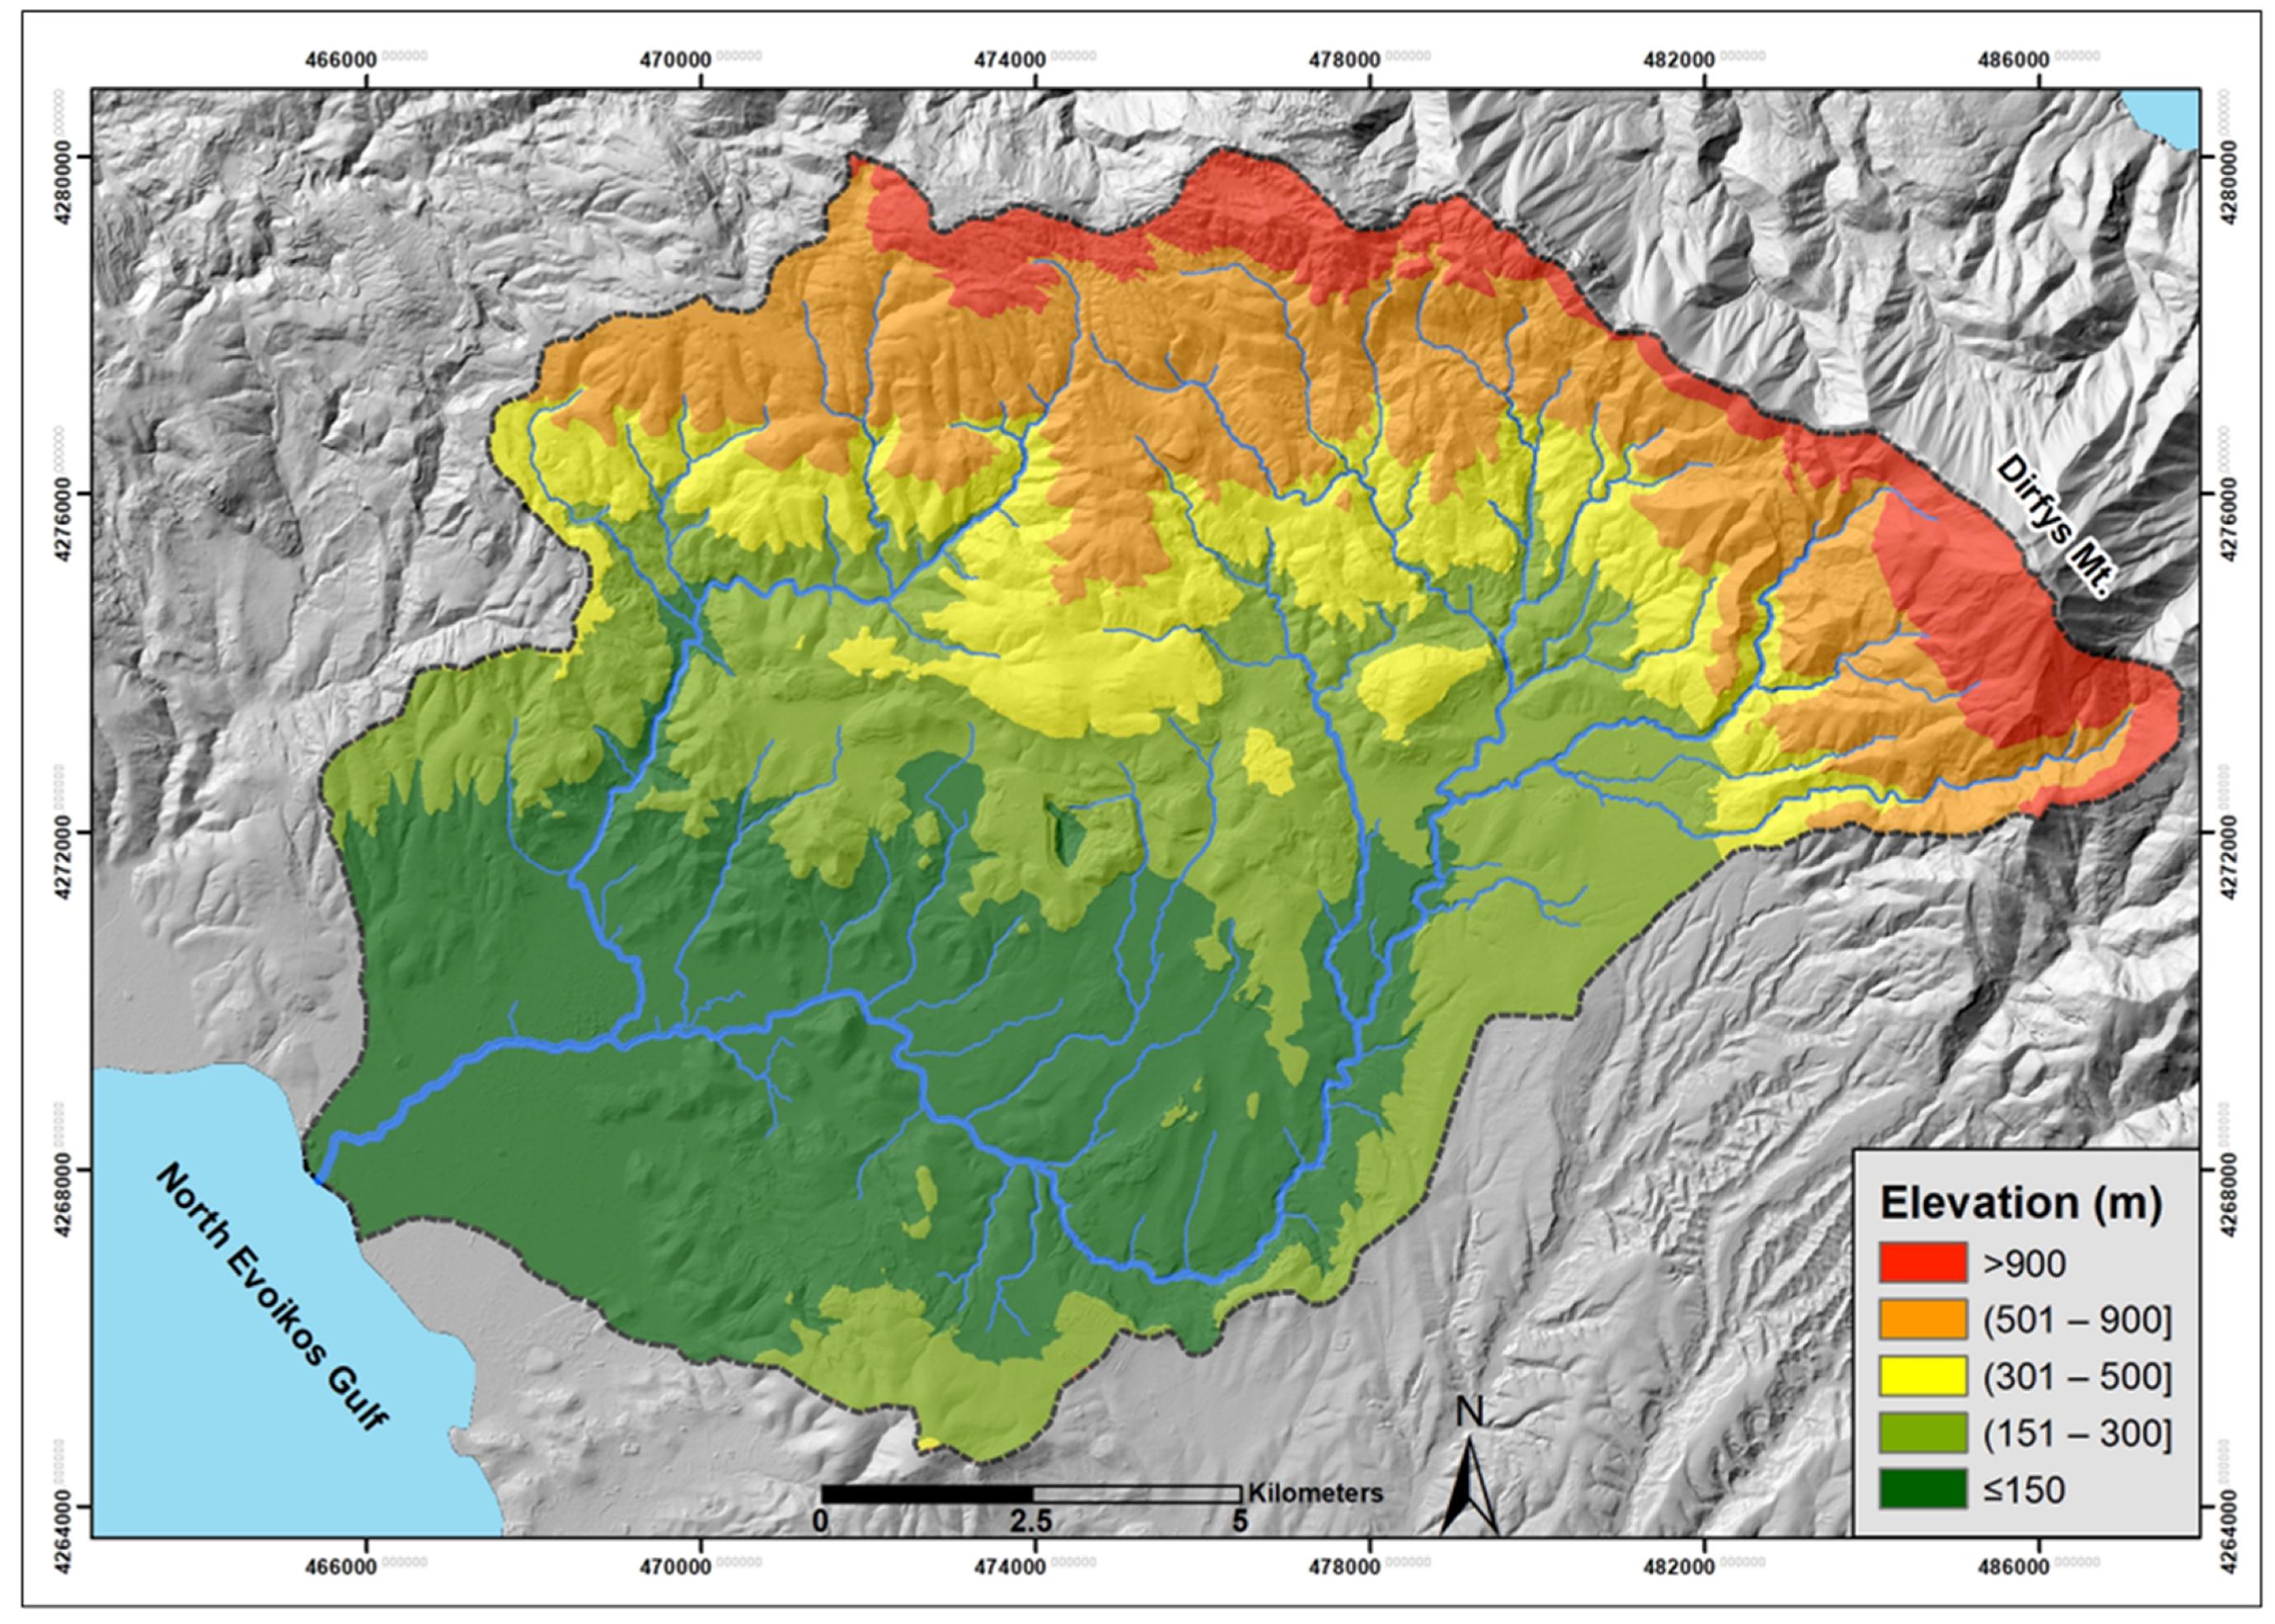
The Messapios River catchment is predominantly characterized as a lowland region, with its highest elevation reaching 1717 m along its eastern border, at the western slopes of Mount Dirfys. Approximately 65% of the catchment area (~137 km2) lies below 300 m in elevation, where most settlements are concentrated. Notably, all documented flood events have occurred within this zone, which is classified as highly to very highly susceptible to flooding. Areas exceeding 900 m in elevation are confined to the northern and northeastern mountainous parts of the catchment, accounting for only a small fraction (~4%) of the total area.
Based on the classification used for the “distance from the stream channels” criterion, areas adjacent to the stream channel beds of higher Strahler-order steams in the drainage network are categorized as highly to very highly flood-prone. These flood-susceptible zones are primarily situated along the main stream channels of Messapios and its major 5th order tributaries (
Figure 5).
According to the “land cover” criterion, approximately 60% of the study area (~130 km2), primarily located in the northern, eastern, and central-southern parts of the catchment, is covered by forests and semi-natural vegetation with very low susceptibility to flooding. A notable part (~40 km2 representing ~18% of the total catchment) consists of agricultural and cultivable land with low flood susceptibility, while artificial surfaces highly susceptible to flooding (~5 km2) correspond to settlement and account for only a small percentage (~3.5%) of the study area. However, ~19% (~41 km2) of the catchment, located in the central and western parts, hosts non-irrigated arable land and areas with sparse vegetation, which are classified as highly susceptible to flooding during heavy precipitation events.
A substantial part of the catchment area, approximately 103 km2 (~48% of the total), is covered by permeable carbonate geological formations, which are considered to have low susceptibility to flooding. In addition, about 50 km2 (~23% of the catchment), primarily in the lower reaches of the Messapios River (the plains of Psachna and Triada) and along the main channels of the drainage network, is occupied by very highly permeable alluvial deposits with very low susceptibility to flooding.
4.3. Sensitivity Analysis
Sensitivity Analysis is performed to determine whether the forecast model is vulnerable to micro-variations in the weighting factors of the criteria examined. For the sensitivity analysis, a small variation of the coefficient of the strongest factor will be performed with a simultaneous small variation of the coefficient of the second-strongest factor [
58]. The variation should not be large because there is a risk of negatively affecting the effectiveness of the model chosen.
For the sensitivity analysis, two scenarios were considered. In the first scenario, the weight of the strongest criterion (Slope) was increased by 0.05, while simultaneously the weight of the second-strongest criterion (Elevation) was decreased by 0.05. In the second scenario, the opposite adjustment was applied.
Table 8 presents the sensitivity analysis scenarios.
The criteria were then integrated as before, using the Weighted Linear Combination (WLC) method but with the updated weights for the two scenarios. This process produced two new thematic maps representing the flood hazard of the catchment area for each scenario.
Table 9 and
Table 10 show that the deviations of the two scenarios considered in the sensitivity analysis, compared to the flood risk estimated using the AHP model, are minimal. Specifically, in Scenario 1, the maximum negative percentage deviation (−1.57%) appears in category (1)—very low flood risk, while the maximum positive percentage deviation (+1.71%) occurs in category (2)—low flood risk. In Scenario 2, the maximum negative percentage deviation (−0.58%) occurs in category (3)—moderate flood risk, while the maximum positive percentage deviation (+0.73%) appears in category (2)—low flood risk. These deviations are minor, indicating that the selected model was not greatly influenced by small changes in the weights, and thus can be considered stable.
4.4. Verification of the Flood-Hazard Assessment
The results of this study were compared with the thematic layer of flood-prone zones provided by the Special Secretariat for Water of the Ministry of Environment and Energy of Greece. Additionally, a layer depicting locations within the Messapios River catchment affected by historical flood events was compared to the flood-hazard map produced using the AHP method. These comparisons enabled the verification of whether the areas classified as very high flood-hazard level zones aligned with these additional data layers.
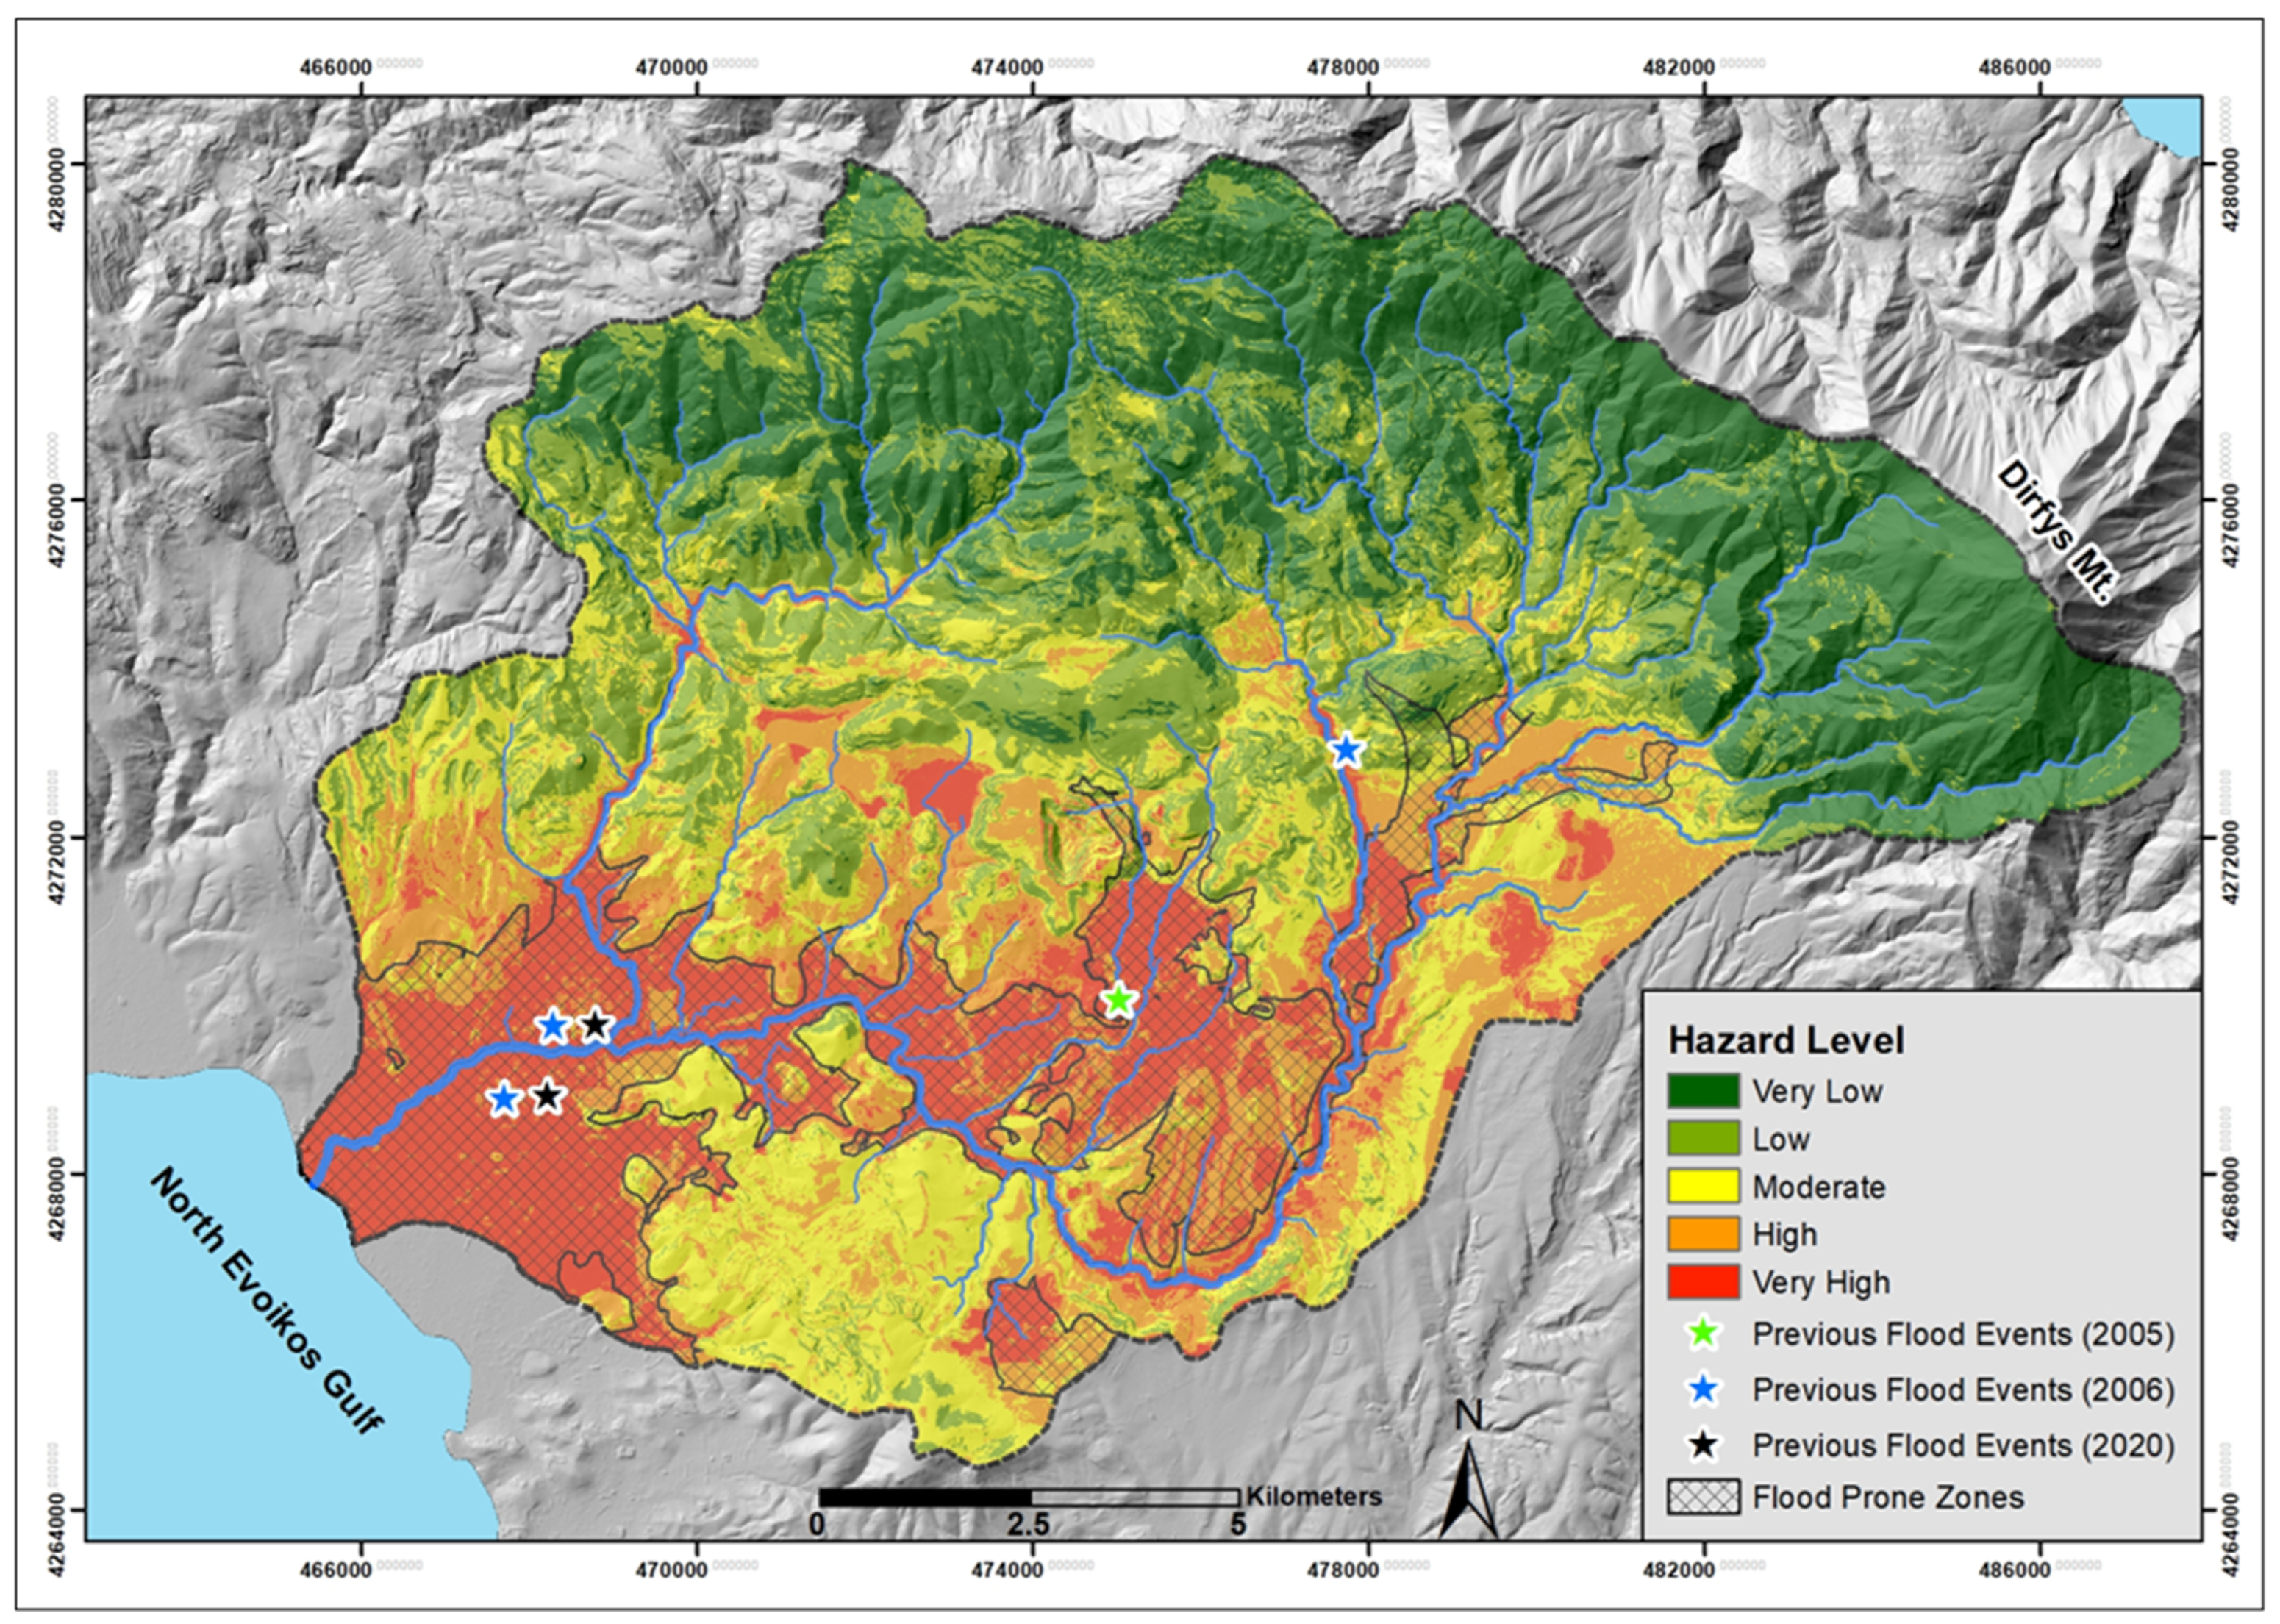
Figure 8 illustrates an overlay between the flood-prone zone layer as estimated by the Special Secretariat of Water of the Ministry of Environment and Energy of Greece, and the flood-hazard level layer calculated in this study by using the AHP method. The comparison between these two layers demonstrates a strong correlation between the results of both methodologies, as 78% of the area classified in this study as having very high flood-hazard level aligns with the flood-prone zone as assessed by the Special Secretariat. Similarly, when analyzing the flood-prone zone designated by the Special Secretariat, approximately 85% of the area identified as flood-prone by the Special Secretariat aligns with zones classified as very high flood-hazard level in this study.
However, when comparing the flood events of 2005, 2006, and 2020, all of which occurred within the zones classified as very high flood-hazard areas in this study, an important observation is that the 2020 event lies outside the flood-prone zone proposed by the Special Secretariat. This indicates that, despite the 2020 event occurring in an upstream part of the catchment, the area’s morphology favors the occurrence of flood events, even within minor basins. The discrepancy in the 2020 event underscores the limitations of the current zoning approach, emphasizing the need for a stronger consideration of geomorphological factors to improve the accuracy of flood-hazard assessments. In this context, the study classifies areas with similar characteristics as high or very high flood-hazard zones in the central part of the catchment, where low slopes appear to play a crucial role in driving flood events. These findings suggest that the applied methodology not only aligns well with past flood events but also enhances existing flood-hazard delineations by identifying additional areas with high or very high flood-hazard levels.
Based on all the above, it can be concluded that the selected model applied for the flood-hazard assessment of the Messapios River catchment is quite reliable and provides a more refined and comprehensive flood-hazard assessment, contributing to the prevention and management of flood risk in this area.
4.5. Spatial Distribution of Flood-Hazard Zones
The areas corresponding to each of the five flood-hazard zones, as depicted in the flood-hazard assessment maps shown in
Figure 8 and
Figure 9, are provided in
Table 10. The “very high” and “high” flood-hazard zones cover approximately one-third of the study area. Specifically, an area of 38.58 km
2, representing 17.86% of the total catchment, is classified as very highly prone to flooding, while 38.91 km
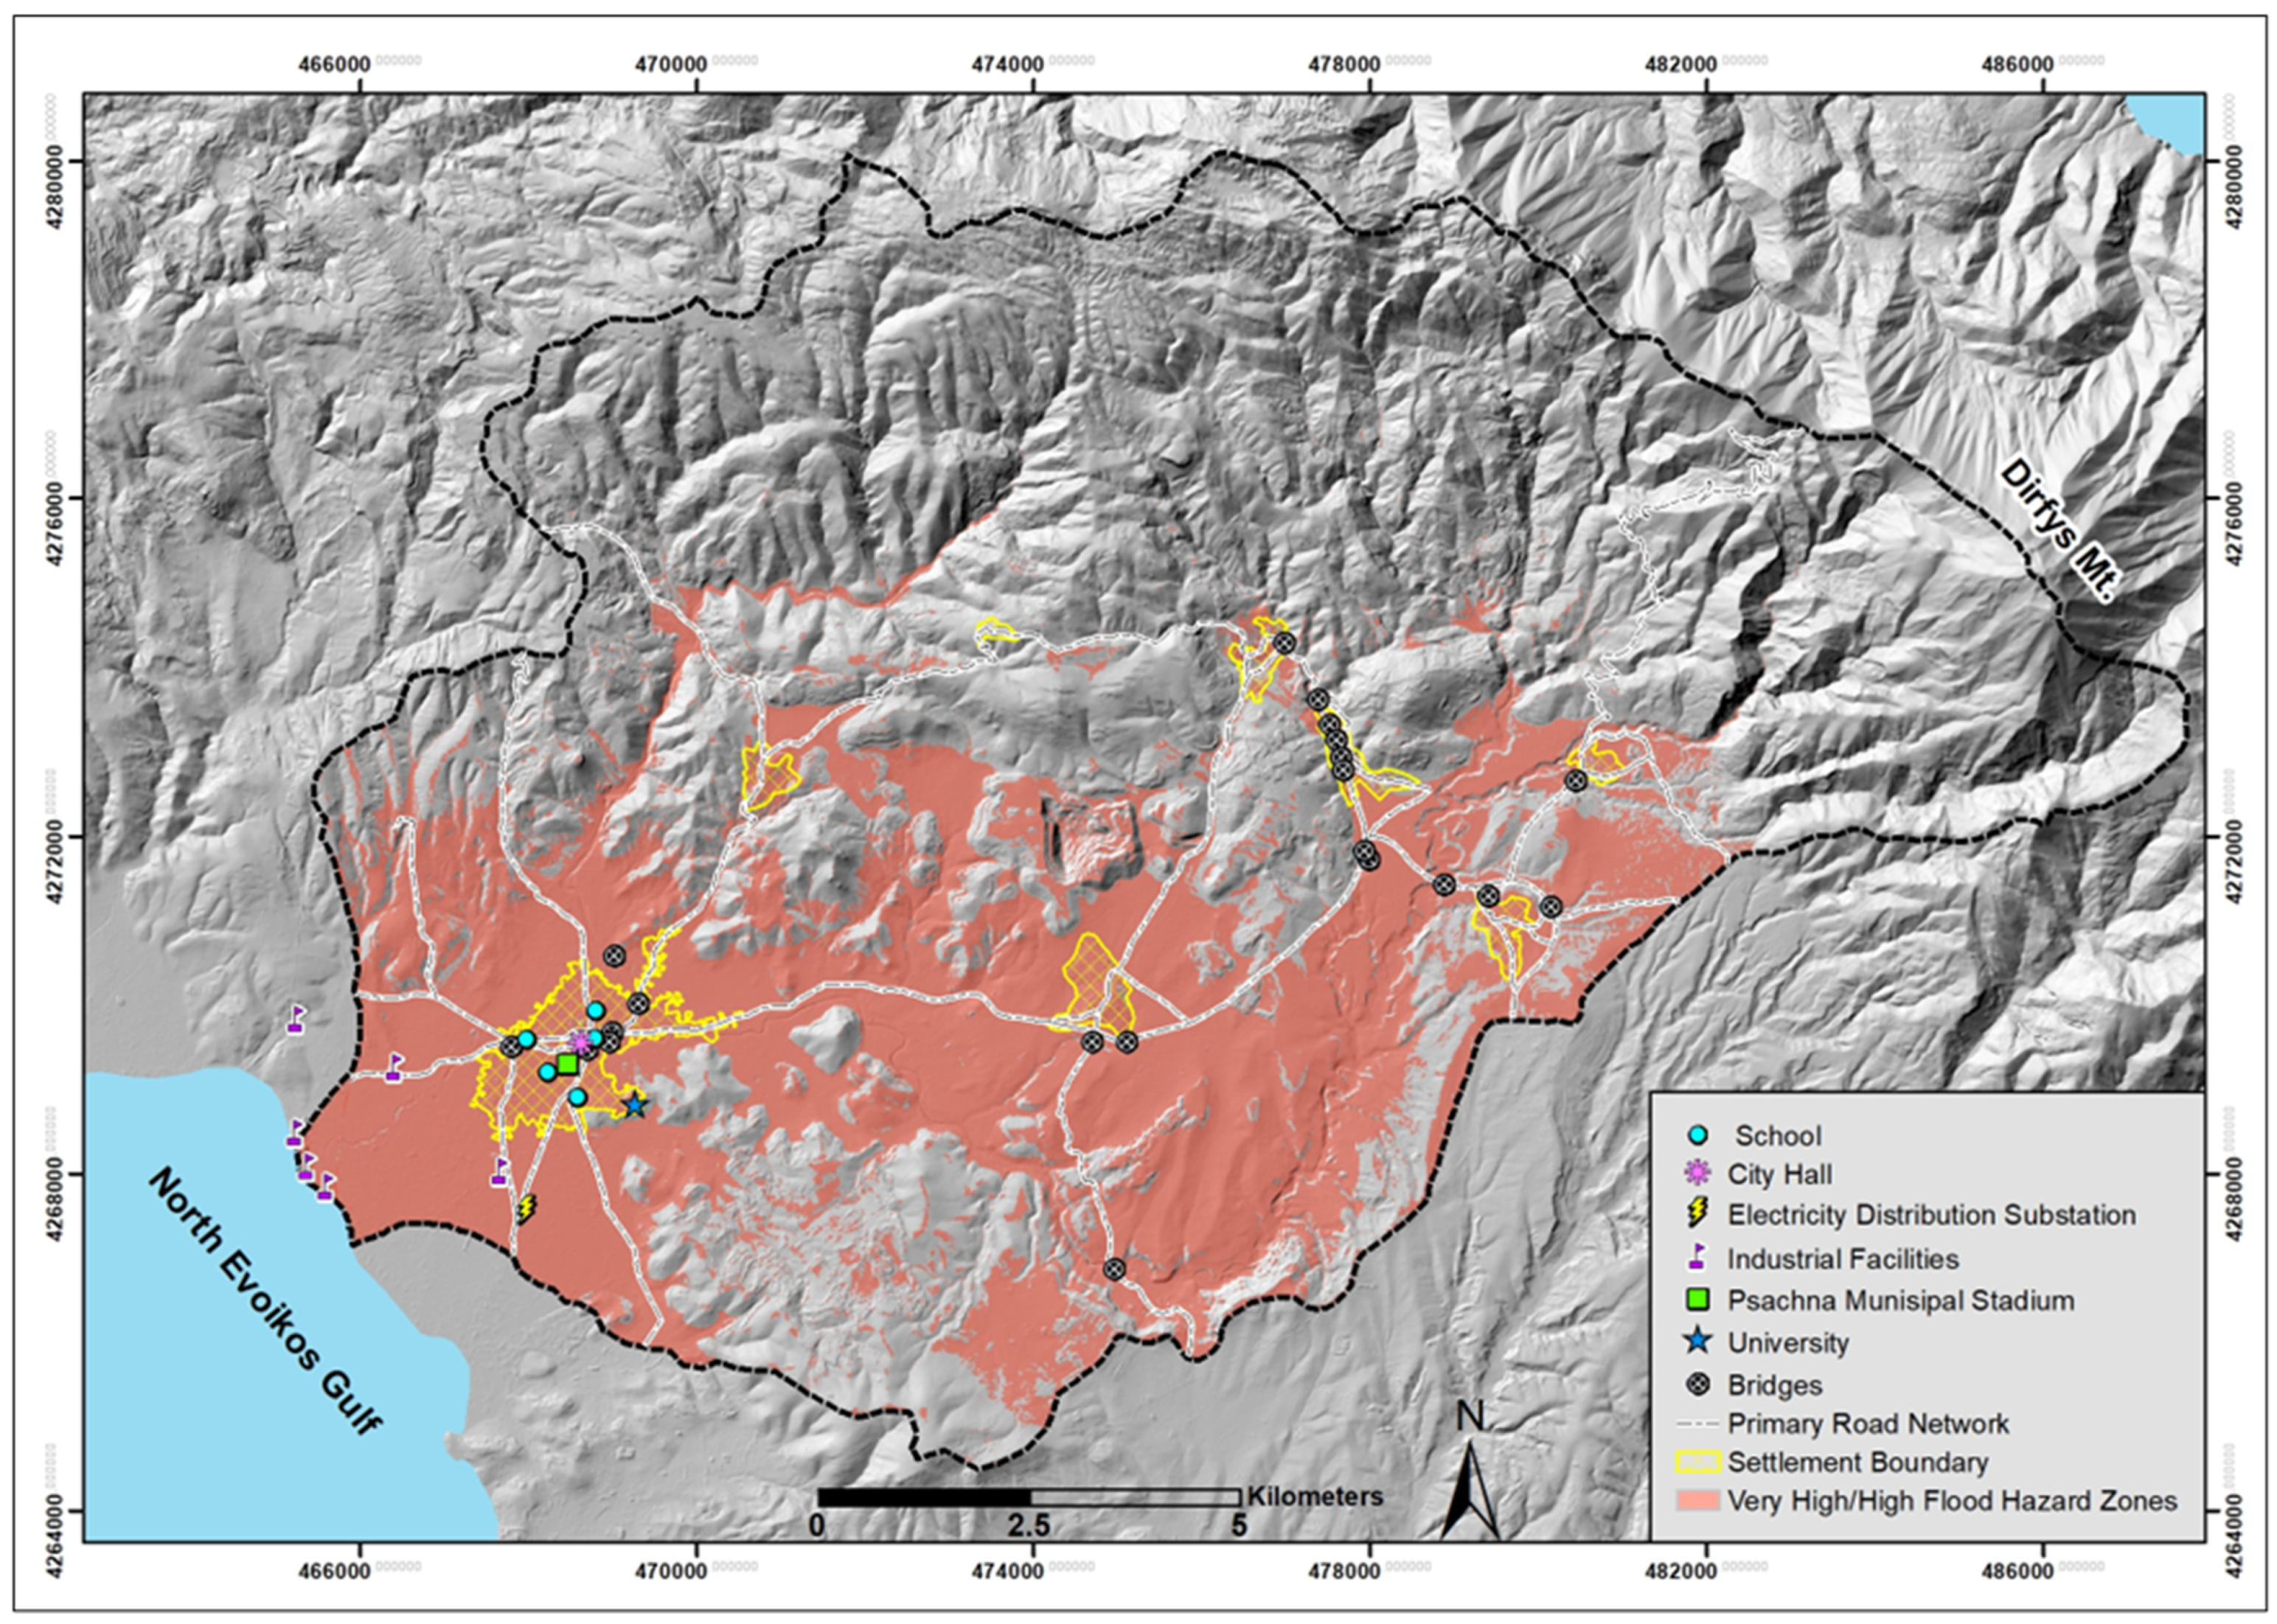
2 (18.02% of the catchment) falls within the high flood-hazard zone. These zones are primarily located in the central, southern, and western parts of the study area, mainly at the lower reaches of the catchment, on both sides of the channels of the main streams (Messapios, Mantanias, Makrimalli, Koumpes) and in the gently sloping, low-lying fan delta of the river. Conversely, the “very low” and “low” flood-hazard areas occupy the northern and easternmost parts of the catchment, corresponding to predominantly mountainous regions with steep slopes and dense vegetation. The comparison of the spatial distribution of settlements and critical infrastructure—such as the road network, bridges, schools, industrial facilities, and electricity distribution substations—with the flood-hazard zones mapped in this study (
Figure 10) provides a preliminary assessment of the area’s vulnerability to flood hazard.
All settlements in the study area, except for the village of Platana, are located in highly and very highly prone to flooding areas. This is because residential areas are built on gently sloping areas, at relatively low elevations, and in close proximity to the main stream channels of the drainage network. Thus, approximately 9000 residents are exposed to flood hazard as they live in settlements with very high flood susceptibility. The settlements of Psachna and Makrykapa are considered to be at higher risk because the Messapios River and Makrikapiatiko River flow through these settlements, respectively, and they have previously been affected by severe flood events. The settlement of Makrykapa experiences relatively frequent, small-scale flooding events, such as during the extreme weather event “Elias” on 27 September 2023.
A significant length of the road network in the study area, amounting to approximately 60 km, is located in high and very high flood-hazard level areas. Furthermore, all the bridges of the road network are located in areas of very high flood risk, as they cross over riverbeds where the channels are insufficient to accommodate extreme flash flood discharges.
The five largest industrial facilities in the study area, which employ hundreds of workers, are located in the low-lying, low-elevation, very highly prone to flooding zone of the Messapios River fan delta, with two of them situated just a few dozen meters from the river mouth. Within the very high flood-risk zone is the General High School of Psachna, which is built just a few meters from the banks of the Messapios River. It is noteworthy that many students from across the Municipality of Dirfys-Messapia attend this school. Adjacent to the school is the Psachna Municipal Stadium, a place frequently visited by many people. The university campus, located on the outskirts of the town and also within the very high flood-hazard zone, accommodates hundreds of students who attend courses there on a daily basis, significantly heightening the exposure to floods. Of particular importance is that the Public Power Corporation substation is also located within the very high flood-hazard zone.
Finally, almost the entire area of the Psachna and Triada plains, which are the main sources of agricultural production in the study area, lies within the very high flood-risk zone. Therefore, the impact of a potential flood would be devastating for the local economy of the region.
The flood-hazard assessment map is a valuable tool for regional land-use planning, enabling the identification of areas suitable or unsuitable for urban development [
59,
60]. While hazard maps reflect the current state of flood risk across the catchment, they offer invaluable insights that can guide long-term policymaking and future planning. This is especially critical for the study area, where land cover is continuously changing, primarily due to the devastating impact of wildfires that have ravaged a significant part of the catchment’s forests.
A significant factor in the severity of floods is the quantity of transported materials [
61]. These materials consist of soil fine-grained particles, rocky debris and boulders, or other elements (tree trunks, trash, cars, and materials from destroyed structures such as buildings and bridges) with varying particle-size composition [
62]. They are transported and contained in the floodwaters, and as a solid–liquid mixture contributes to the damage. This parameter (as a quantity measurement) is usually not recorded, resulting in an underestimation of the actual floodwaters and the maximum “flood depth”. Geomorphological mapping, as a future work, could significantly enhance flood-hazard zonation by offering a more precise representation of erosional and depositional processes, including the potential existence of alluvial fans in streams confluence and the debris flows as flash flood indicators. Detailed mapping of these processes would improve the assessment of flood magnitude and extent in a more deterministic manner, allowing for better prediction of flood dynamics and identification of areas with varying proneness to flooding, whether higher or lower.
One cause of increased sediment load and flood runoff in the study area is soil erosion in areas affected by wildfires [
63]. The major wildfires in Evia that occurred in 2018 and 2019 impacted the wider Psachna area. The 2018 wildfire burned approximately 48.5 km
2, with the affected areas located west of the Messapios River catchment and only a small portion within it. In contrast, the August 2019 wildfire occurred entirely within the study area, with an estimated burned area of approximately 97 km
2. This area constituted the upper part of the catchment of the Mantania Stream, a tributary that joins the Messapios River just upstream from Psachna. This wildfire, due to its impact on increasing transported material, was identified as one of the main factors contributing to the severity of the flood that affected the Psachna area in August 2020 [
64,
65].


 ,
, 


