


Low-Carbon City Policies and Employment in China: Impact Effects and Spatial Spillovers

Abstract
1. Introduction
2. Theoretical Analysis
2.1. Employment Effects of Low-Carbon City Policies
2.2. Spatial Spillover Mechanism
3. Study Design
3.1. Model Specification
3.2. Data Sources
3.3. Variable Selection
3.3.1. Dependent Variable
3.3.2. Key Explanatory Variable
3.3.3. Control Variables
4. Empirical Analysis Results
4.1. Base Regression Results
4.2. Robustness Test
4.2.1. Endogeneity Problem
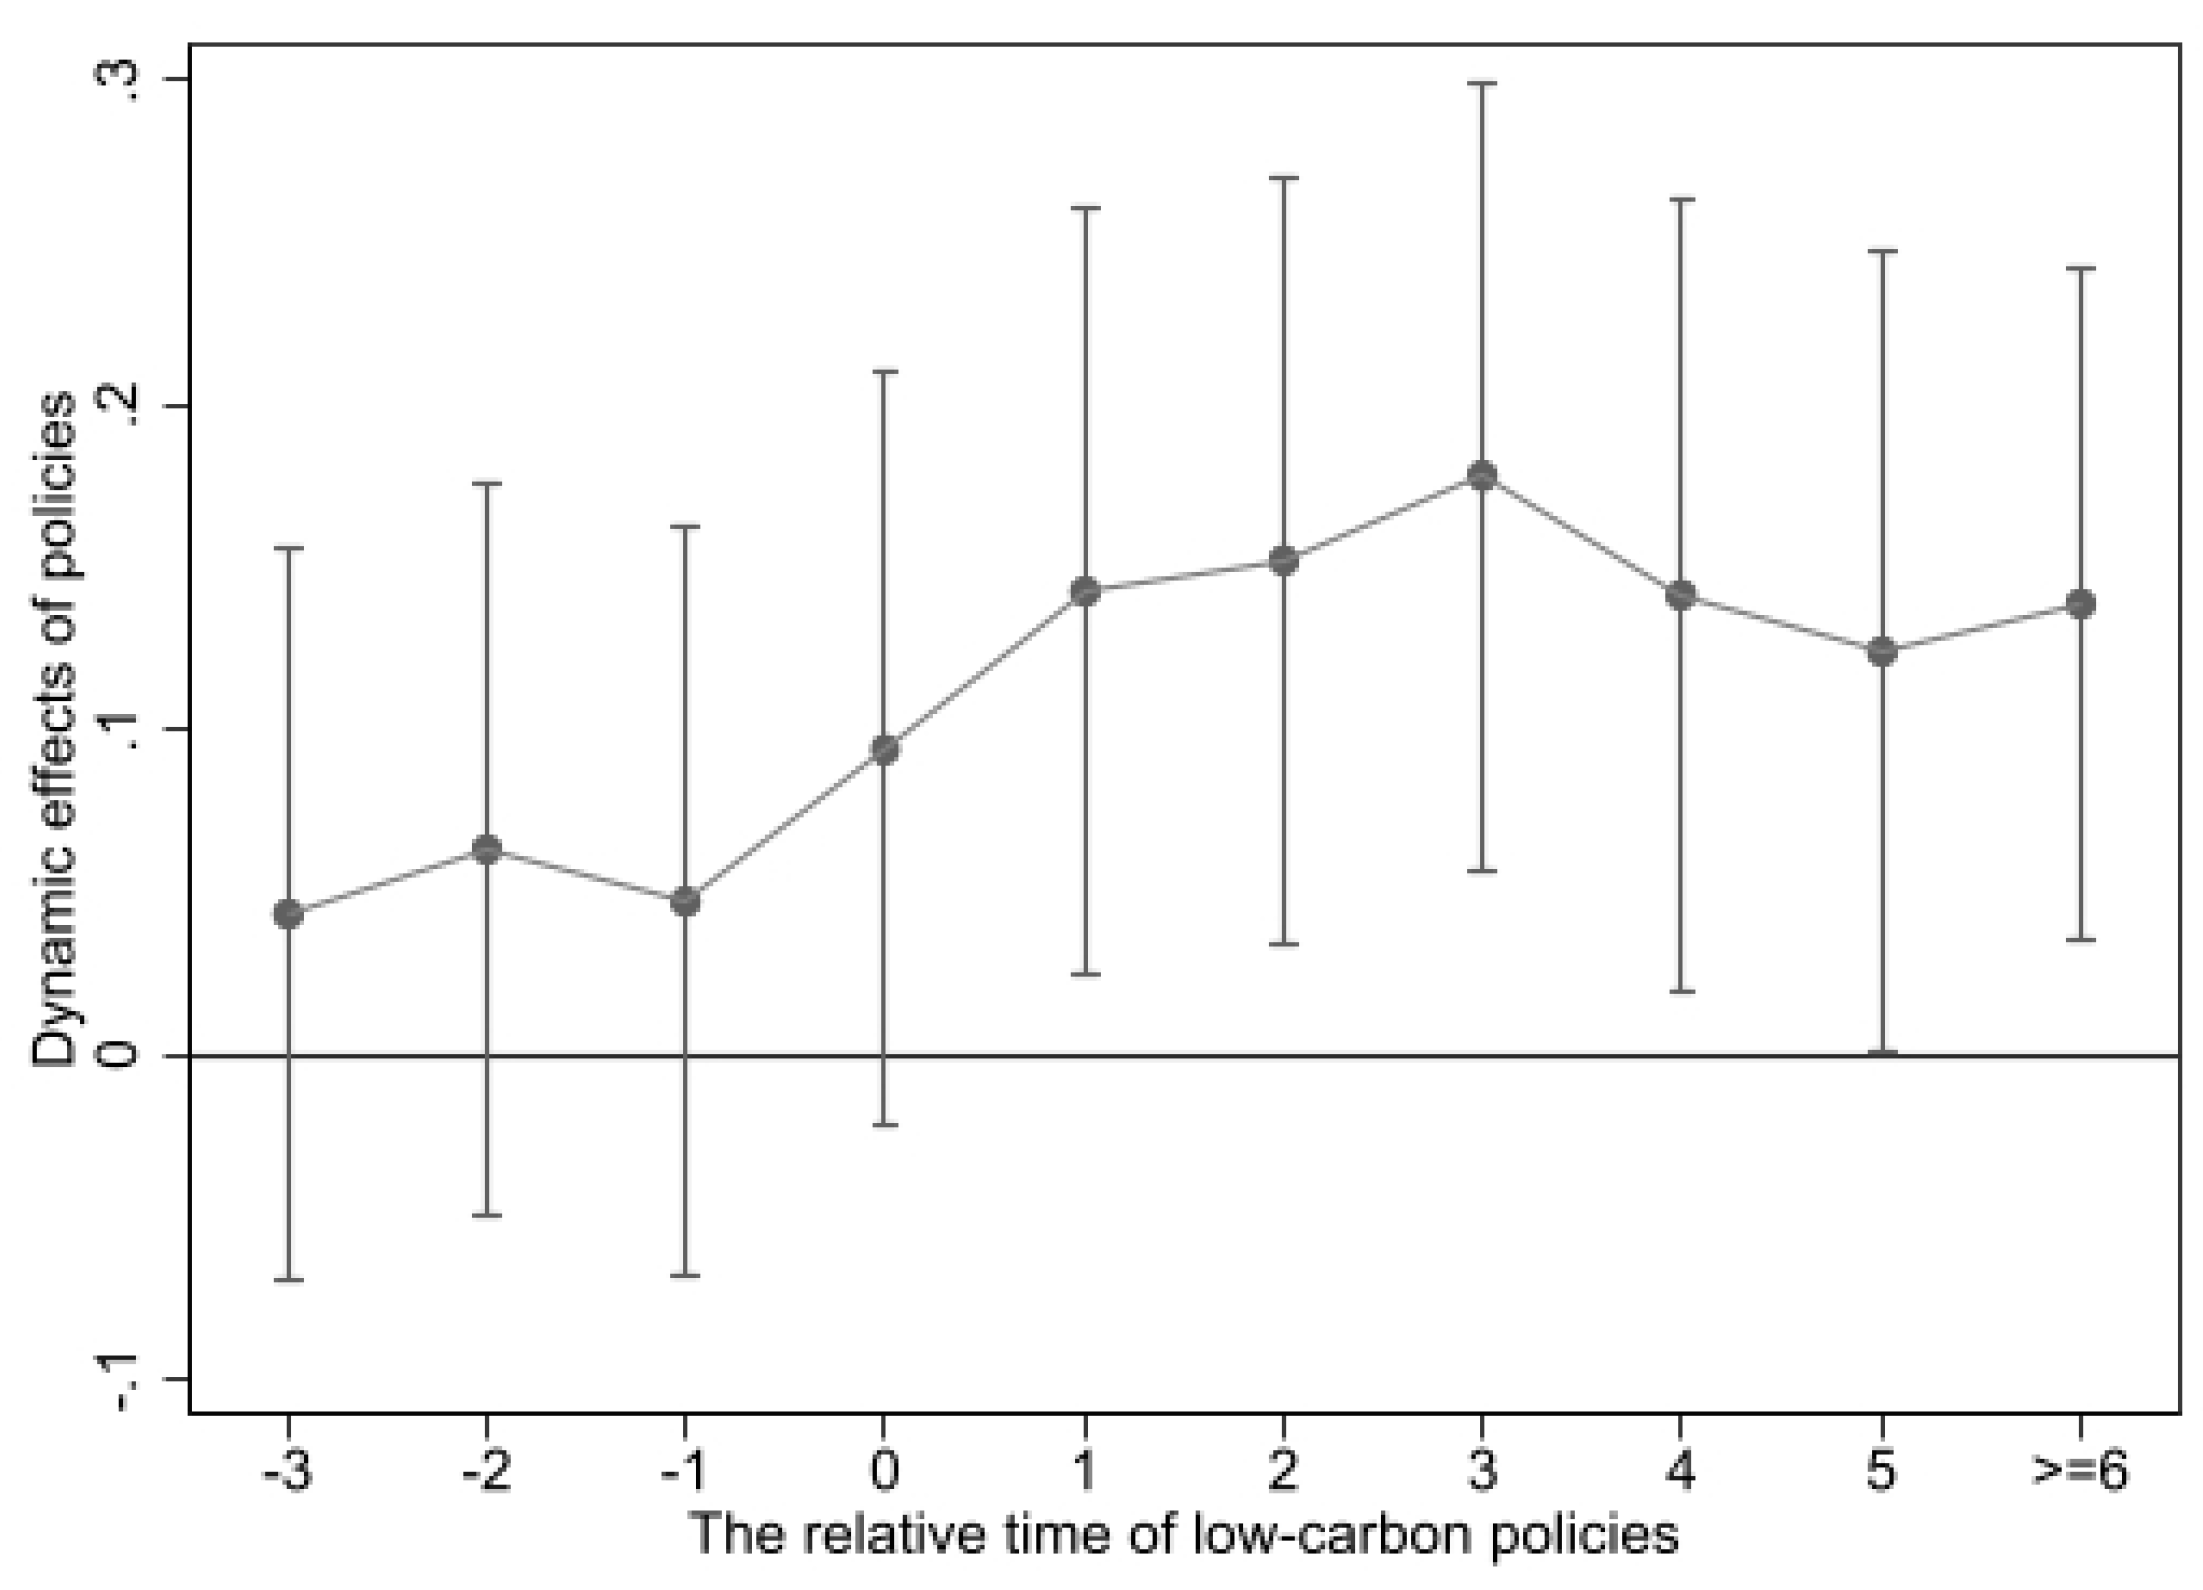
4.2.2. Parallel Trend Test
4.2.3. Placebo Test
4.2.4. Propensity Score Matching PSM-DID
4.2.5. Eliminate Interference from Other Policies
4.2.6. Other Robustness Tests
- Replace the core explanatory variable
- 2.
- Replace the explained variable
- 3.
- Data truncation
5. Spatial Spillover Effect
5.1. Model Settings
5.2. Results of Spatial Spillover Effect Analysis
6. Heterogeneity Analysis
6.1. Threshold Effects
6.2. Heterogeneity of Urban Characteristics
6.2.1. Impact of Low-Carbon City Policies on Cities with Different Resource Endowments
6.2.2. Impact of Low-Carbon City Policies on Cities with Different Administrative Levels
7. Conclusions
Author Contributions
Funding
Data Availability Statement
Conflicts of Interest
| 1 | Data source: White Paper on Low-carbon Employment in China’s Energy Transition, 2023. |
| 2 | Notice of the National Development and Reform Commission on Promoting the National Innovative City Pilot Work: National Development and Reform Commission (NDRC). Notice on promoting the pilot work of national innovative cities. Beijing: NDRC, 2010. Three-Year Action Plan for Winning the Blue Sky Defense War: State Council. Three-year action plan for winning the battle for blue skies. Beijing: State Council, 2018. National Smart City (District, Town) Pilot Index System (Trial): National Development and Reform Commission (NDRC). Pilot index system for national smart cities (districts, towns). Beijing: NDRC, 2014. |
References
- Dong, K.; Dong, X.; Dong, C. Determinants of the global and regional CO2 emissions: What causes what and where. Appl. Econ. 2019, 51, 5031–5044. [Google Scholar] [CrossRef]
- Dong, K.; Sun, R.; Dong, X. CO2 emissions, natural gas and renewables, economic growth: Assessing the evidence from China. Sci. Total Environ. 2018, 640, 293–302. [Google Scholar] [CrossRef]
- Satterthwaite, D. Cities’ contribution to global warming: Notes on the allocation of greenhouse gas emissions and urbanization. Environ. Urban. 2008, 20, 539–549. [Google Scholar] [CrossRef]
- United Nations. United Nations Framework Convention on Climate Change. Treaty Ser. 1992, 1771, 107. [Google Scholar]
- United Nations. Kyoto Protocol to the United Nations Framework Convention on Climate Change. Treaty Ser. 1997, 2303, 162. [Google Scholar]
- United Nations. Paris Agreement. Treaty Ser. 2015, 54113, 1. [Google Scholar]
- National Development and Reform Commission (NDRC). Notice on Launching Low-Carbon Province and City Pilot Projects; NDRC: Beijing, China, 2010.
- Wang, F.; Ge, X. Does low-carbon transition impact employment?—Empirical evidence from low-carbon city pilots. China Ind. Econ. 2022, 2022, 81–99. [Google Scholar]
- Chen, G.; Wei, B. Low-carbon city pilots and site selection for migrant employment: Evidence from China. Energy Econ. 2024, 131, 107417. [Google Scholar] [CrossRef]
- Lu, Y. Green policies and employment in China: Is there a dual dividend? Econ. Res. J. 2011, 46, 42–54. [Google Scholar]
- Koskela, E.; Schöb, R. Alleviating unemployment: The case for green tax reforms. Eur. Econ. Rev. 1999, 43, 1723–1746. [Google Scholar] [CrossRef]
- Bosquet, B. Environmental tax reform: Does it work? A survey of the empirical evidence. Ecol. Econ. 2000, 34, 19–32. [Google Scholar] [CrossRef]
- Raff, Z.; Earnhart, D. The effects of Clean Water Act enforcement on environmental employment. Res. Energy Econ. 2019, 57, 1–17. [Google Scholar] [CrossRef]
- Li, Z.; Lin, B. Analyzing the impact of environmental regulation on labor demand: A quasi-experiment from Clean Air Action in China. Environ. Impact Assess. Rev. 2022, 93, 106721. [Google Scholar] [CrossRef]
- Li, M. Environmental regulation, industry heterogeneity, and employment effects: Empirical analysis based on industrial panel data. Popul. Econ. 2016, 1, 66–77. [Google Scholar]
- Kahn, M.E.; Mansur, E.T. Do local energy prices and regulation affect the geographic concentration of employment? J. Public Econ. 2013, 101, 105–114. [Google Scholar] [CrossRef]
- Li, B.; Zhan, K.; Hu, Z.G. Do environmental regulations and employment really achieve the “double dividend”?—Empirical evidence from China’s “Two-Control Zones” policy. Ind. Econ. Res. 2019, 1, 113–126. [Google Scholar]
- Chateau, J.; Saint-Martin, A. Economic and employment impacts of climate change mitigation policies in OECD: A general-equilibrium perspective. Int. Econ. 2013, 135, 79–103. [Google Scholar] [CrossRef]
- Wei, M.; Patadia, S.; Kammen, D.M. Putting renewables and energy efficiency to work: How many jobs can the clean energy industry generate in the US? Energy Policy 2010, 38, 919–931. [Google Scholar] [CrossRef]
- Li, S.S. Environmental regulation and its impact on heterogeneous labor employment: Evidence from provincial dynamic panel data analysis. China Popul. Resour. Environ. 2015, 25, 135–143. [Google Scholar]
- Liu, M.; Tan, R.; Zhang, B. The costs of “blue sky”: Environmental regulation, technology upgrading, and labor demand in China. J. Dev. Econ. 2021, 150, 102610. [Google Scholar] [CrossRef]
- Goodstein, E.B. Jobs and the Environment: The Myth of a National Trade-Off; Economic Policy Institute: Washington, DC, USA, 1994; pp. 27–29. [Google Scholar]
- Song, H.; Sun, Y.J.; Chen, D.K. Government air pollution control effects evaluation: Empirical evidence from China’s “Low-Carbon City” construction. Manag. World 2019, 35, 95–108+195. [Google Scholar]
- Zhang, H. Can low-carbon city pilot policies reduce carbon emissions?—Evidence from a quasi-natural experiment. Econ. Manag. 2020, 42, 25–41. [Google Scholar]
- Song, M.; Zhao, X.; Shang, Y. The impact of low-carbon city construction on ecological efficiency: Empirical evidence from quasi-natural experiments. Resour. Conserv. Recycl. 2020, 157, 104777. [Google Scholar] [CrossRef]
- Zhong, J.; Zhang, J.; Fu, M. Does the carbon emissions trading pilot policy have a demonstrated impact on advancing low-carbon technology? Evidence from a case study in Beijing, China. Land 2024, 13, 1276. [Google Scholar] [CrossRef]
- Yu, Y.; Zhang, N. Low-carbon city pilot and carbon emission efficiency: Quasi-experimental evidence from China. Energy Econ. 2021, 96, 105125. [Google Scholar] [CrossRef]
- Zhang, B.B.; Zhou, J.T.; Yan, Z.J. Low-carbon city pilot policies and total-factor energy efficiency improvement: Evidence from three batches of pilot policy implementation. Econ. Rev. 2021, 5, 32–49. [Google Scholar]
- Li, B.; Huang, M.; Li, Q. The impact of low-carbon city construction on urban shrinkage: Evidence from China. Land 2024, 13, 2185. [Google Scholar] [CrossRef]
- Qiu, S.; Wang, Z.; Liu, S. The policy outcomes of low-carbon city construction on urban green development: Evidence from a quasi-natural experiment conducted in China. Sustain. Cities Soc. 2021, 66, 102699. [Google Scholar] [CrossRef]
- Chen, H.; Guo, W.; Feng, X.; Wei, W.; Liu, H.; Feng, Y.; Gong, W. The impact of low-carbon city pilot policy on the total factor productivity of listed enterprises in China. Resour. Conserv. Recycl. 2021, 169, 105457. [Google Scholar] [CrossRef]
- Wang, Y.F.; Tao, W.Q. The impact of low-carbon city pilots on urban green total factor productivity growth and effects. China Popul. Resour. Environ. 2021, 31, 78–89. [Google Scholar]
- Xu, J.; Cui, J.B. Low-carbon cities and corporate green technological innovation. China Ind. Econ. 2020, 12, 178–196. [Google Scholar]
- Huang, J.; Zhao, J.; Cao, J. Environmental regulation and corporate R&D investment—Evidence from a quasi-natural experiment. Int. Rev. Econ. Finance 2021, 72, 154–174. [Google Scholar]
- Zheng, J.; Shao, X.; Liu, W.; Kong, J.; Zuo, G. The impact of the pilot program on industrial structure upgrading in low-carbon cities. J. Clean. Prod. 2021, 290, 125868. [Google Scholar] [CrossRef]
- Borjas, G.J. Labor Economics; McGraw-Hill: New York, NY, USA, 2013; pp. 27–29. [Google Scholar]
- Carraro, C.; Galeotti, M.; Gallo, M. Environmental taxation and unemployment: Some evidence on the ‘double dividend hypothesis’ in Europe. J. Public Econ. 1996, 62, 141–181. [Google Scholar] [CrossRef]
- Pereira, A.M.; Pereira, R.M.; Rodrigues, P.G. A new carbon tax in Portugal: A missed opportunity to achieve the triple dividend? Energy Policy 2016, 93, 110–118. [Google Scholar] [CrossRef]
- Wesseh, P.K., Jr.; Lin, B. Environmental policy and ‘double dividend’ in a transitional economy. Energy Policy 2019, 134, 110947. [Google Scholar] [CrossRef]
- Maxim, M.R. Environmental fiscal reform and the possibility of triple dividend in European and non-European countries: Evidence from a meta-regression analysis. Environ. Econ. Policy Stud. 2020, 22, 633–656. [Google Scholar] [CrossRef]
- Porter, M. America’s green strategy. Sci. Am. 1991, 264, 168. [Google Scholar] [CrossRef]
- Wagner, M. The Porter Hypothesis Revisited: A Literature Review of Theoretical Models and Empirical Tests; Centre for Sustainability Management: Lüneburg, Germany, 2003. [Google Scholar]
- Harrison, R.; Jaumandreu, J.; Mairesse, J.; Peters, B. Does innovation stimulate employment? A firm-level analysis using comparable micro-data from four European countries. Int. J. Ind. Organ. 2014, 35, 29–43. [Google Scholar] [CrossRef]
- Tiebout, C.M. A pure theory of local expenditures. J. Polit. Econ. 1956, 64, 416–424. [Google Scholar] [CrossRef]
- Whisler, R.L.; Waldorf, B.S.; Mulligan, G.F.; Plane, D.A. Quality of life and the migration of the college-educated: A life-course approach. Growth Change 2008, 39, 58–94. [Google Scholar] [CrossRef]
- Xia, Y.; Lu, M. Intercity “Mencius’s Mother Moving Three Times”: An empirical study on public services’ impact on labor mobility. Manag. World 2015, 10, 78–90. [Google Scholar]
- Banzhaf, H.S.; Walsh, R.P. Do people vote with their feet? An empirical test of Tiebout’s mechanism. Am. Econ. Rev. 2008, 98, 843–863. [Google Scholar] [CrossRef]
- Krugman, P. Increasing returns and economic geography. J. Polit. Econ. 1991, 99, 483–499. [Google Scholar] [CrossRef]
- Fujita, M.; Krugman, P.; Venables, A.J. The Spatial Economy: Cities, Regions, and International Trade; MIT Press: Cambridge, MA, USA, 1999. [Google Scholar]
- Krugman, P. On the number and location of cities. Eur. Econ. Rev. 1993, 37, 293–298. [Google Scholar] [CrossRef]
- Beck, T.; Levine, R.; Levkov, A. Big Bad Banks? The winners and losers from bank deregulation in the United States. J. Finance 2010, 65, 1637–1667. [Google Scholar] [CrossRef]
- Li, L.; Wang, X.; Bao, Q. The employment effects of robots: Mechanisms and China’s experience. Manag. World 2021, 9, 104–119. [Google Scholar]
- Broner, F.; Bustos, P.; Carvalho, V.M. Sources of Comparative Advantage in Polluting Industries; National Bureau of Economic Research: Cambridge, MA, USA, 2012. [Google Scholar]
- Hering, L.; Poncet, S. Environmental policy and exports: Evidence from Chinese cities. J. Environ. Econ. Manag. 2014, 68, 296–318. [Google Scholar] [CrossRef]
- Cai, X.; Lu, Y.; Wu, M.; Yu, L. Does environmental regulation drive away inbound foreign direct investment? Evidence from a quasi-natural experiment in China. J. Dev. Econ. 2016, 123, 73–85. [Google Scholar] [CrossRef]
- Lu, Y.; Tao, Z.; Zhu, L. Identifying FDI spillovers. J. Int. Econ. 2017, 107, 75–90. [Google Scholar] [CrossRef]
- Edmonds, E.V.; Pavcnik, N.; Topalova, P. Trade adjustment and human capital investments: Evidence from Indian tariff reform. Am. Econ. J. Appl. Econ. 2010, 2, 42–75. [Google Scholar] [CrossRef]
- Jacobson, L.S.; LaLonde, R.J.; Sullivan, D.G. Earnings losses of displaced workers. Am. Econ. Rev. 1993, 83, 685–709. [Google Scholar]
- Zhu, S.X.; Liang, B.F. Construction and application of the comprehensive indicator for evaluating low-carbon development in Chinese cities. Urban Dev. Stud. 2012, 19, 93–98. [Google Scholar]
- Qiu, B.; Tang, B.Q.; Sun, S.Q.; Liu, X.Y. Factor endowment, institutional dividends, and new comparative advantage in exports. Econ. Res. 2014, 49, 107–119. [Google Scholar]
- Liu, Y.L.; Zhang, M. Regional labor productivity differences based on generalized population structure. Popul. Econ. 2017, 4, 10–23. [Google Scholar]
- Fotheringham, A.S.; Brunsdon, C.; Charlton, M. Geographically Weighted Regression: The Analysis of Spatially Varying Relationships; Wiley: Hoboken, NJ, USA, 2003. [Google Scholar]
- Fotheringham, A.S.; Kelly, M.H.; Charlton, M. The demographic impacts of the Irish famine: Towards a greater geographical understanding. Trans. Inst. Brit. Geogr. 2013, 38, 221–237. [Google Scholar] [CrossRef]
- Gu, H.Y.; Meng, X.; Shen, T.Y. Spatial differentiation characteristics of factors influencing the settlement intentions of urban migrant populations in China. Acta Geogr. Sin. 2020, 75, 240–254. [Google Scholar]
- Burridge, P. On the Cliff-Ord test for spatial correlation. J. Roy. Stat. Soc. Ser. B 1980, 42, 107–108. [Google Scholar] [CrossRef]
- Sun, W.Y.; Zhou, H. The impact of environmental regulation on employment structure: Empirical analysis based on spatial econometric models. Popul. Econ. 2020, 3, 106–122. [Google Scholar]
- Liu, J.; Yu, Q.; Chen, Y.; Liu, J. The impact of digital technology development on carbon emissions: A spatial effect analysis for China. Resour. Conserv. Recycl. 2022, 185, 106445. [Google Scholar] [CrossRef]
- Liu, J.M.; Ma, X.Y.; Zhao, B. Does heterogeneous enterprise collaborative agglomeration enhance urban innovation vitality? Ind. Econ. Res. 2024, 2, 15–29. [Google Scholar]
- Wang, Y.Q.; Liu, C.K.; Wang, H. Employment creation effects of urban green transformation: Evidence from low-carbon city pilots. J. Zhongnan Univ. Finance Econ. 2024, 1, 45–57. [Google Scholar]
- National People’s Congress of the People’s Republic of China. The Outline of the 14th Five-Year Plan (2021–2025) for National Economic and Social Development and the Long-Range Objectives Through the Year 2035; National People’s Congress of the People’s Republic of China: Beijing, China, 2021.


| Variable Name | Indicator Selection | Symbol | Observations | Mean | SE | Min | Max |
|---|---|---|---|---|---|---|---|
| Total employment | Total number of employed people (in 10,000 people) | Labor | 4512 | 114.61 | 167.51 | 5.58 | 1830 |
| Low-carbon city policy | Low-carbon pilot city (Pilot city = 1, non-pilot city = 0) | LCCP | 4512 | 0.24 | 0.43 | 0 | 1 |
| GDP per capita | Real GDP per capita (in 10,000 yuan) | perGDP | 4512 | 3.93 | 3.39 | 0.28 | 28.14 |
| Wage level | The average wage of employed workers (in 10,000 yuan) | Wage | 4512 | 4.96 | 2.56 | 0.74 | 32.06 |
| Total consumption | Total retail sales of consumer goods (in 100 million yuan) | Spend | 4512 | 870.75 | 1390 | 13.41 | 18100 |
| Government budget expenditure | Local general public budget expenditure (in 100 million yuan) | Budget | 4512 | 348.59 | 591.35 | 5.76 | 8430 |
| Passenger traffic | Total passenger traffic (in 100 million person-times) | Traffic | 4512 | 1.617 | 4.800 | 0.014 | 129.115 |
| Industrial structure | GDP of the tertiary industry/GDP of the secondary industry | Struc | 4512 | 0.981 | 0.559 | 0.094 | 5.348 |
| Financial loans | Balance of RMB loans by financial institutions at year-end (in million yuan) | Finance | 4512 | 2.86 | 6.7 | 0.032 | 88.3 |
| Population size | Registered population at year-end (in 10,000 people) | Pop | 4512 | 152 | 200 | 13 | 2488 |
| Higher education | Number of enrolled students in regular higher education institutions (in 10,000 people) | Educate | 4512 | 9.0213 | 16.2061 | 0 | 127.2973 |
| (1) | (2) | (3) | (4) | |
|---|---|---|---|---|
| Variable | Labor | Labor | Labor | Labor |
| LCCP | 0.354 *** | 0.080 *** | 0.079 *** | 0.075 *** |
| (0.095) | (0.028) | (0.030) | (0.028) | |
| perGDP | 0.130 *** | 0.134 *** | 0.190 *** | |
| (0.026) | (0.034) | (0.033) | ||
| Struc | −0.111 *** | −0.153 *** | −0.087 *** | |
| (0.026) | (0.033) | (0.031) | ||
| Spend | 0.512 *** | 0.490 *** | 0.428 *** | |
| (0.012) | (0.023) | (0.024) | ||
| Wage | −0.303 *** | −0.250 *** | ||
| (0.052) | (0.050) | |||
| Finance | 0.025 * | −0.102 *** | ||
| (0.014) | (0.017) | |||
| Educate | 0.051 ** | 0.042 ** | ||
| (0.022) | (0.021) | |||
| Budget | 0.153 *** | |||
| (0.022) | ||||
| Traffic | 0.075 *** | |||
| (0.004) | ||||
| Pop | 0.472 *** | |||
| (0.153) | ||||
| Constant | 0.588 *** | 0.449 *** | 0.580 *** | −0.008 |
| (0.039) | (0.025) | (0.050) | (0.160) | |
| Year fixed effects | Yes | Yes | Yes | Yes |
| City fixed effects | Yes | Yes | Yes | Yes |
| Observations | 4512 | 4512 | 4512 | 4512 |
| City numbers | 282 | 282 | 282 | 282 |
| R-squared | 0.188 | 0.465 | 0.472 | 0.522 |
| (1) | (2) | (3) | (4) | |
|---|---|---|---|---|
| IV | Add the Interaction Term | |||
| Variable | Labor | Labor | Labor | Labor |
| LCCP | 0.044 * | 0.097 *** | 0.083 *** | 0.188 * |
| (0.027) | (0.029) | (0.028) | (0.102) | |
| Two control zones | / | Yes | No | No |
| Special economic zone | / | No | Yes | No |
| Hu Huanyong | / | No | No | Yes |
| Controls | Yes | Yes | Yes | Yes |
| Year fixed effects | Yes | Yes | Yes | Yes |
| City fixed effects | Yes | Yes | Yes | Yes |
| Constant | / | −0.612 *** | −0.104 | 0.365 *** |
| Over-identification test | / | (0.155) | (0.151) | (0.024) |
| Chi-sq(1) p-value | 0.000 | / | / | / |
| Weak instrumental variable-F | 19.602 | / | / | / |
| Observations | 4512 | 4512 | 4512 | 4512 |
| City numbers | 282 | 282 | 282 | 282 |
| R-squared | 0.398 | 0.454 | 0.519 | 0.511 |
| (1) | (2) | (3) | |
|---|---|---|---|
| Variable | k-Nearest Neighbor Matching Method | Radius Matching Method | Kernel Matching Method |
| _treated | 0.922 *** | 0.922 *** | 0.922 *** |
| (0.049) | (0.049) | (0.049) | |
| Constant | 0.777 *** | 0.777 *** | 0.777 *** |
| (0.024) | (0.024) | (0.024) | |
| ATT | 0.284 | 0.212 | 0.366 |
| t-ATT | 3.05 | 2.57 | 4.66 |
| Observations | 4512 | 4512 | 4512 |
| R-squared | 0.073 | 0.073 | 0.073 |
| (1) | (2) | (3) | |
|---|---|---|---|
| Variable | Labor | Labor | Labor |
| LCCP | 0.074 *** | 0.077 *** | 0.309 *** |
| (0.029) | (0.028) | (0.035) | |
| innovate | −0.110 *** | ||
| (0.042) | |||
| blue | 0.102 *** | ||
| (0.028) | |||
| clever | 0.429 *** | ||
| (0.050) | |||
| Controls | Yes | Yes | Yes |
| Year fixed effects | Yes | Yes | Yes |
| City fixed effects | Yes | Yes | Yes |
| Observations | 4512 | 4512 | 4512 |
| City numbers | 282 | 282 | 282 |
| R-squared | 0.519 | 0.523 | 0.222 |
| (1) | (2) | (3) | (4) | (5) | (6) | |
|---|---|---|---|---|---|---|
| Variable | Labor | Labor | Labor | |||
| LCCP | 0.162 *** | 0.056 *** | 0.006 *** | 0.005 *** | 0.250 *** | 0.227 *** |
| (0.019) | (0.015) | (0.002) | (0.002) | (0.072) | (0.026) | |
| Controls | No | Yes | No | Yes | No | Yes |
| Year fixed effects | Yes | Yes | Yes | Yes | Yes | Yes |
| City fixed effects | Yes | Yes | Yes | Yes | Yes | Yes |
| Observations | 4512 | 4512 | 4512 | 4512 | 4512 | 4512 |
| City numbers | 282 | 282 | 282 | 282 | 282 | 282 |
| R-squared | 0.184 | 0.523 | 0.239 | 0.273 | 0.246 | 0.558 |
| (1) | (2) | (3) | (4) | (5) | |
|---|---|---|---|---|---|
| Main | W*x | Direct | Indirect | Total | |
| Variable | Labor | Labor | Labor | Labor | Labor |
| LCCP | 0.018 *** | 0.009 * | 0.018 *** | 0.015 ** | 0.034 *** |
| (0.002) | (0.005) | (0.002) | (0.006) | (0.007) | |
| Controls | Yes | Yes | Yes | Yes | Yes |
| Spatial rho | 0.207 *** | ||||
| (0.025) | |||||
| Variance sigma2_e | 0.001 *** | ||||
| (0.000) | |||||
| Observations | 4512 | 4512 | 4512 | 4512 | 4512 |
| R-squared | 0.838 | 0.838 | 0.838 | 0.838 | 0.838 |
| City numbers | 282 | 282 | 282 | 282 | 282 |
| (1) | (2) | (3) | |
|---|---|---|---|
| Industrial Structure | Government Innovation Preference | Urbanization Rate | |
| Variable | Labor | Labor | Labor |
| Threshold | 1.5804 | 80,339.00 | 0.6772/0.7361 |
| Threshold -p value | 0.0000 | 0.0000 | 0.0000/0.0047 |
| Controls | Yes | Yes | Yes |
| Less than the first threshold | 0.015 *** | −0.002 | −0.002 |
| (0.005) | (0.002) | (0.003) | |
| Greater than the first threshold | 0.057 *** | 0.056 *** | 0.031 *** |
| (0.017) | (0.011) | (0.009) | |
| Greater than the second threshold | 0.073 *** | ||
| (0.016) | |||
| Observations | 4512 | 4512 | 4512 |
| City numbers | 282 | 282 | 282 |
| R-squared | 0.229 | 0.267 | 0.268 |
| (1) | (2) | (3) | (4) | |
|---|---|---|---|---|
| Resource-Based Cities | Non-Resource-Based Cities | Capital Cities | Non-Capital Cities | |
| Variable | Labor | Labor | Labor | Labor |
| LCCP | −0.003 * | 0.024 *** | 0.030 ** | 0.009 *** |
| (0.002) | (0.003) | (0.012) | (0.002) | |
| Controls | Yes | Yes | Yes | Yes |
| Year fixed effects | Yes | Yes | Yes | Yes |
| City fixed effects | Yes | Yes | Yes | Yes |
| Observations | 1808 | 2704 | 496 | 4016 |
| City numbers | 113 | 169 | 31 | 251 |
| R-squared | 0.243 | 0.258 | 0.390 | 0.217 |
Disclaimer/Publisher’s Note: The statements, opinions and data contained in all publications are solely those of the individual author(s) and contributor(s) and not of MDPI and/or the editor(s). MDPI and/or the editor(s) disclaim responsibility for any injury to people or property resulting from any ideas, methods, instructions or products referred to in the content. |
© 2025 by the authors. Licensee MDPI, Basel, Switzerland. This article is an open access article distributed under the terms and conditions of the Creative Commons Attribution (CC BY) license (https://creativecommons.org/licenses/by/4.0/).
Share and Cite
Ru, L.; Yao, Y. Low-Carbon City Policies and Employment in China: Impact Effects and Spatial Spillovers. Land 2025, 14, 656. https://doi.org/10.3390/land14030656
Ru L, Yao Y. Low-Carbon City Policies and Employment in China: Impact Effects and Spatial Spillovers. Land. 2025; 14(3):656. https://doi.org/10.3390/land14030656
Chicago/Turabian StyleRu, Lifei, and Yongling Yao. 2025. "Low-Carbon City Policies and Employment in China: Impact Effects and Spatial Spillovers" Land 14, no. 3: 656. https://doi.org/10.3390/land14030656
APA StyleRu, L., & Yao, Y. (2025). Low-Carbon City Policies and Employment in China: Impact Effects and Spatial Spillovers. Land, 14(3), 656. https://doi.org/10.3390/land14030656