Article

Effects of Natural Factors and Human Activities on the Spatio-Temporal Distribution of Net Primary Productivity in an Inland River Basin

1
State Key Laboratory of Ecological Safety and Sustainable Development in Arid Lands, Xinjiang Institute of Ecology and Geography, Chinese Academy of Sciences, Urumqi 830011, China
2
Fukang Station of Desert Ecology, Chinese Academy of Sciences, Fukang 831505, China
3
University of Chinese Academy of Sciences, Beijing 100049, China
4
CAS Key Laboratory of Forest Ecology and Silviculture, Institute of Applied Ecology, Chinese Academy of Sciences, Shenyang 110016, China
5
State Key Laboratory of Ecological Safety and Sustainable Development in Arid Lands, Northwest Institute of Eco-Environment and Resources, Chinese Academy of Sciences, Lanzhou 730000, China
6
Field Observation and Research Station of Water Resources and Ecological Effect in Lower Reaches of Tarim River Basin, Urumqi Comprehensive Survey Center on Natural Resources, Urumqi 830057, China
*
Author to whom correspondence should be addressed.
Land 2025, 14(3), 650; https://doi.org/10.3390/land14030650
Submission received: 11 February 2025 / Revised: 14 March 2025 / Accepted: 16 March 2025 / Published: 19 March 2025

Abstract

:
Net primary productivity (NPP) is a critical indicator for evaluating the carbon sequestration potential of an ecosystem and regional sustainable development, as its spatiotemporal dynamics are jointly influenced by natural and anthropogenic factors. This study investigated the Sangong River Basin, an inland watershed located in northwestern China. By employing the Carnegie–Ames–Stanford Approach (CASA) model and the Geodetector method, integrated with remote sensing data and field surveys, we systematically analyzed the spatiotemporal evolution and driving mechanisms of NPP from 1990 to 2020. Our results reveal an average annual basin-wide NPP increase of 2.33 g C·m−2·a−1, with plains experiencing significantly greater increases (2.86 g C·m−2·a−1) than mountains (1.71 g C·m−2·a−1). Land use intensity (LUI) explained 31.44% of the NPP variability in the plains, whereas climatic factors, particularly temperature (71.27% contribution rate), primarily governed the NPP dynamics in mountains. Soil properties exhibited strong associations with NPP. Specifically, a 1 g·kg−1 increase in soil organic content elevated NPP by 99.04 g C·m−2·a−1, while a comparable rise in soil salinity reduced NPP by 123.59 g C·m−2·a−1. These findings offer spatially explicit guidance for ecological restoration and carbon management in arid inland basins, underscoring the need for a strategic equilibrium between agricultural intensification and ecosystem conservation to advance carbon neutrality objectives.

1. Introduction

Net primary productivity (NPP) quantifies the organic material synthesized by plants through photosynthesis per unit area and time, minus autotrophic respiration losses [1]. This metric serves as a dual indicator of the net energy available for transfer to higher trophic levels and the carbon sequestered as long-term biomass in ecosystems [2]. As a pivotal parameter in regional carbon cycling, NPP reflects both ecosystem vitality and vegetation carbon sink capacity [3,4]. The conceptual foundation of NPP estimation can be traced to Ebermayer’s late 19th century biomass assessments in Bavarian forests [5]. Modern remote sensing techniques offer an enhanced spatiotemporal resolution and efficiency over traditional field methods by synergistically integrating climatic variables, vegetation biophysical parameters, and satellite data [6,7]. Contemporary modeling approaches comprise three primary categories: climate statistical models, ecosystem process models, and light use efficiency (LUE) models [8,9]. The first two model categories suffer from operational constraints due to inherent methodological limitations [10,11], whereas LUE models calculate NPP based on the product of absorbed photosynthetically active radiation (APAR) and light use efficiency (ε), balancing theoretical rigor with practical application. The CASA model [12], distinguished by its multi-source data assimilation capabilities, superior spatiotemporal resolution, and modular architecture, has emerged as the predominant methodology [13,14,15]. Subsequent refinements by Zhu et al. [10] improved its predictive accuracy [16], expanded its applicability to arid zones [17], and strengthened ecological interpretability while preserving operational simplicity, establishing it as the preferred tool for meso-microscale investigations [18].
Arid inland river basins constitute ecologically vulnerable zones marked by pronounced environmental heterogeneity, acute spatiotemporal variability [19], and heightened sensitivity to climatic and anthropogenic perturbations. The NPP dynamics in these basins illuminate complex synergies between natural processes and human influences [20]. Although precipitation and temperature predominantly govern NPP fluctuations, spatial heterogeneity arises principally from anthropogenic resource allocation strategies. Case analyses reveal contrasting patterns [21,22]: the Shiyang River Basin exhibits marked NPP increases correlated with climatic warming and heightened precipitation/radiation sensitivity, while the mid-lower Heihe Basin’s NPP reduction is directly linked to intensified hydrological competition. These examples illustrate that, while climatic shifts drive long-term NPP trajectories, strategic policy measures (e.g., managed water redistribution and land use zoning) can significantly augment carbon sequestration potential. Consequently, NPP is dually regulated through natural and anthropogenic mechanisms [23,24]. Land use modifications directly mediate human–environment dynamics, with land use intensity and landscape stability indices providing robust proxies for anthropogenic impacts. Concurrently, edaphic and climatic factors exert substantial influences: soil organic matter enhances productivity through nutrient cycling and moisture retention, whereas salinization induces physiological stress that degrades vegetation [25,26]. Precipitation modulates NPP via nonlinear soil moisture interactions—moderate increases bolster productivity, whereas excessive moisture triggers hypoxic root conditions and organic matter mineralization [27,28]. Temperature plays a pivotal regulatory role, particularly in high-latitude and cryospheric environments [24,29]. Deciphering these multidimensional interactions is critical for adaptive basin governance, where geospatial analytical tools demonstrate exceptional utility in disentangling driving mechanisms.
Regardless of whether climate change or human activity can cause changes in NPP, its dynamics can provide an overview for understanding the effects of natural environment factors and human activities. However, limited attention has been paid to the individual factor impacts of NPP dynamics; multidimensional interactions with NPP under both climate change and human activity in an arid inland basin are still not clear. We hypothesize that the distribution patterns of NPP in an inland river basin were jointly driven by human activities and natural factors. Specifically, mountainous NPP distribution patterns were dominated by climatic factors, while plain NPP distribution patterns were primarily influenced by land use changes. Here, we combined land use change, soil and vegetation investigations, NDVI datasets, and meteorological data and employed an enhanced CASA model coupled with geospatial detectors to (1) understand the NPP variability across spatial and temporal dimensions and (2) partition the relative contributions of land use change, climatic variables, and edaphic conditions to the impacts of NPP dynamics. This study quantified the relative contributions of land use changes, climatic variables, and soil environmental factors to NPP distribution patterns, advancing comprehensive insights into how anthropogenic and natural drivers collectively govern ecosystem dynamics in water-scarce basins. It is hoped that these findings will optimize vegetation restoration and inform adaptive ecosystem management strategies.

2. Study Area, Data, and Methods
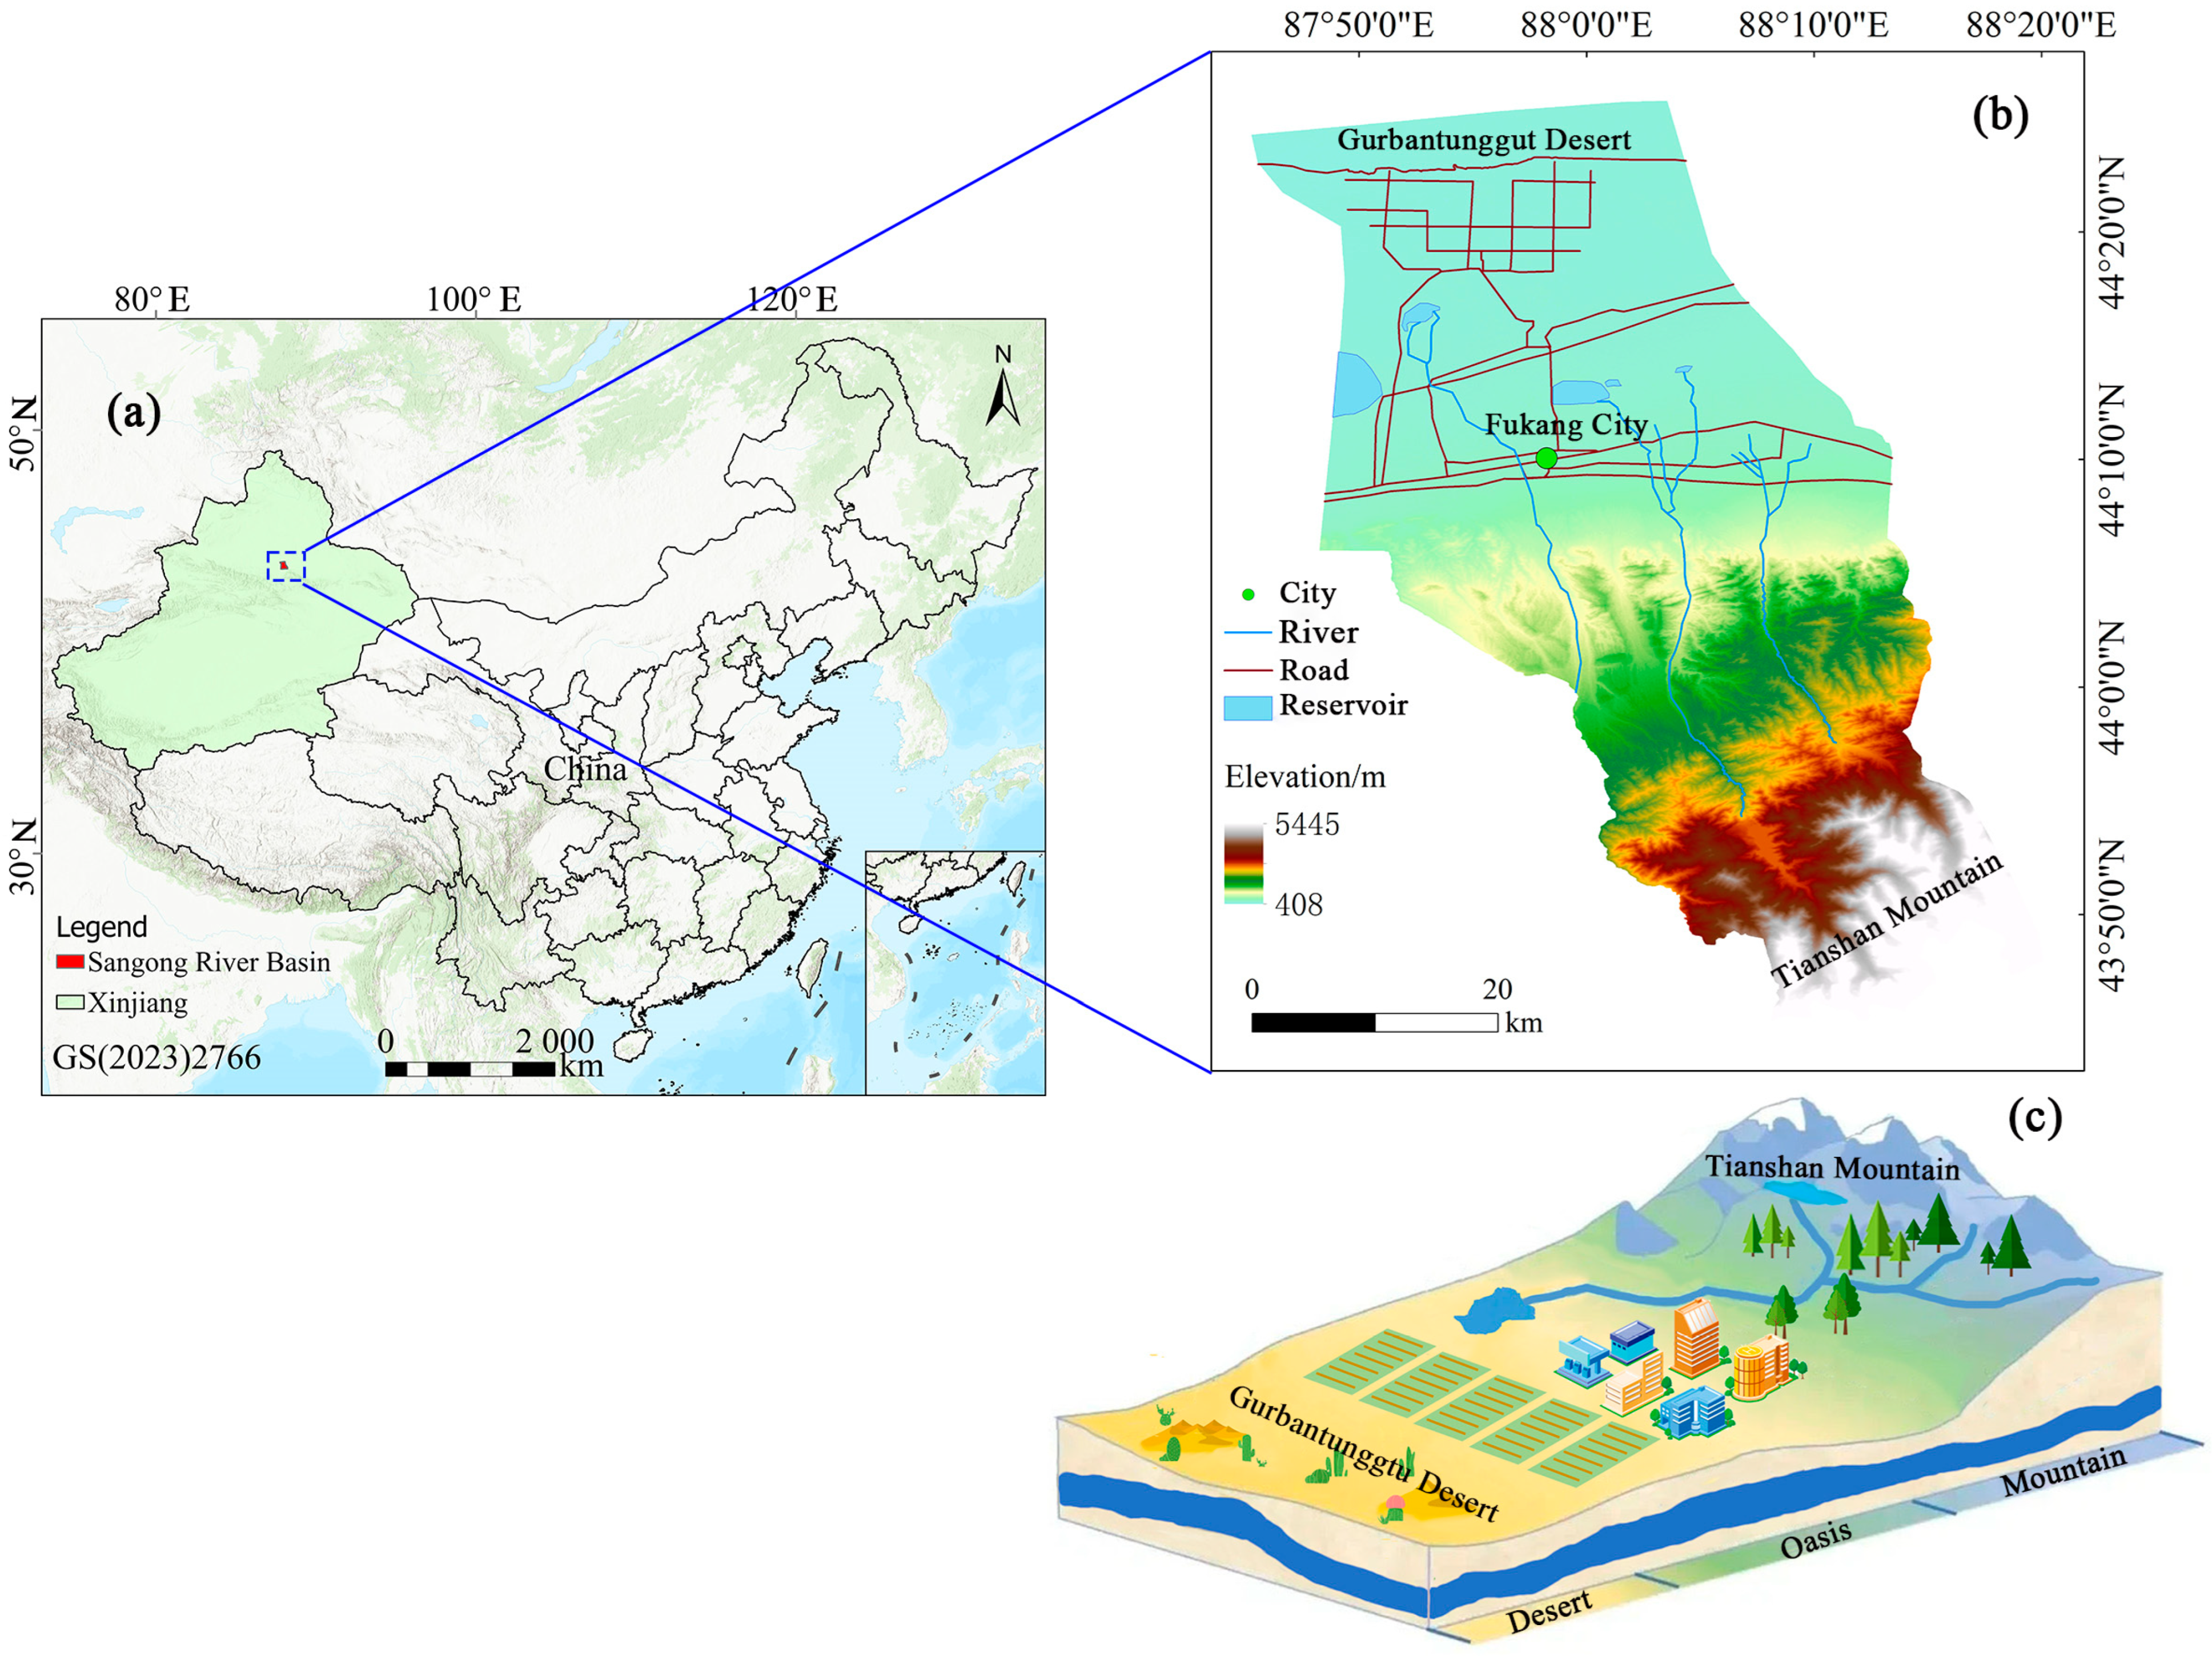
2.1. Study Area

The Sangong River Basin is located within northwestern China (Figure 1), occupying a critical interfacial zone between the northern piedmont of Bogda Peak (Tianshan Mountains) and the southern periphery of the Gurbantunggut Desert [30]. Administratively, it is part of Fukang City in the Changji Hui Autonomous Prefecture of Xinjiang and covers an area of approximately 1749 km2. The Sangong River Basin, a representative arid inland catchment, displays distinct landscape heterogeneity and differential anthropogenic pressure regimes. Its alluvial plains have undergone intensive agricultural and urban expansion since the 1990s, contrasting with the ecologically preserved mountainous headwaters. The climate belongs to a temperate continental climate, characterized by hot summers and cold winters in the study area. The annual average temperature is 6.6 °C, with a maximum of 42.6 °C and a minimum of −41.6 °C; the average temperature in July is 25.6 °C. The average temperature in January is −17 °C, with annual precipitation measuring 164 mm and annual evaporation approximately 2000 mm. The ecosystem includes zones such as ice and snow areas, meadow grassland, forest, desert grassland, Gobi, oasis, and desert. The study area is primarily divided into two major geomorphic units: the plain and the mountain area. The plain exhibits an elevation range of approximately 408 to 800 m and is characterized by a long-standing history of agricultural reclamation coupled with extensive urbanization development. The altitude of the mountain area in the upper reaches of the basin ranges from approximately 800 to 5445 m, encompassing the low mountain grassland zone, middle mountain forest zone, subalpine meadow zone, and alpine ice and snow zone. The plain features an arid climate with annual precipitation below 200 mm. Vegetation is predominantly characterized by desert flora and cultivated crops. The desert vegetation includes major species such as Tamarix, Suaeda, Haloxylon, and Salsola. The artificial vegetation primarily comprises crops, including cotton, corn, wheat, and melons. In the mountain, elevations between 800 and 1700 m are classified as semi-arid, with vegetation dominated by xerophytic steppe species such as Stipa capillata, Festuca ovina, and Artemisia frigida. In contrast, elevations of 1800–2700 m receive enhanced summer precipitation (ca. 500 mm yr−1) due to westerly moisture transport and orographic lifting, supporting monodominant Picea schrenkiana forests with herbaceous understory. Above 2700 m, the alpine zone is characterized by subalpine meadows dominated by Kobresia spp. and Xanthium sibiricum, reflecting cryogenic conditions.

2.2. Data

2.2.1. Soil Data

The soil element was acquired through systematic field surveys conducted in 2022. Sampling ensured the comprehensive coverage of all the land use types under logistically feasible conditions. A total of 472 topsoils were sampled across various land use types in the study area, including 228 from crop land, 56 from forest, 73 from grassland, 67 from urban land, 11 from water, and 45 from unused land. At each georeferenced site (GPS coordinates recorded), non-stratified topsoil samples (0–20 cm depth) were collected using soil augers, with the concurrent documentation of vegetation type, land use classification, latitude, longitude, and elevation. Following air-drying, homogenization, and grinding in laboratory settings, the soil salinity (TS) and organic matter (OM) content were quantified. These measurements were integrated with historical TS and OM datasets from 2005 (n = 308) and 2015 (n = 290) to evaluate their cumulative impacts on NPP.

2.2.2. Vegetation Biomass Data

A total of 35 vegetation plots were investigated in the field, including typical crops such as cotton, corn, herbs, and Haloxylon, which were used to validate the model results. The sampling method involved selecting 10 m × 10 m plots and arranging five 1 m2 plots within each plot, randomly. The aboveground biomass was collected in each plot, with new branches and leaves of the same year selected for perennial vegetation. The average value was then calculated to obtain the biomass for each plot. The subsurface biomass was estimated based on studies exploring the relationship between aboveground biomass and subsurface biomass across various vegetation types [31,32,33].

2.2.3. Satellite-Derived Datasets

NDVI datasets derived from GEE serve as inputs to the CASA model, enabling the spatially explicit quantification of NPP. Digital elevation models (DEMs) were generated from 30-meter resolution ASTER GDEM datasets, accessed using the Geospatial Data Cloud platform (www.gscloud.cn). The general map of the study area was created after pre-processing steps, including cropping. Land use type data were obtained through visual interpretation. A total of seven Landsat images from 1990, 1995, 2000, 2005, 2010, 2015, and 2020 were selected as the primary data sources. Sentinel-2 image data, field files, and land use status maps from land management departments were also combined for visual interpretation. The land cover classification adhered to China’s national remote sensing monitoring framework, categorizing six primary classes: cropland, forest, grassland, urban land, water area, and unused land [34]. The 2022 basin-wide land use map was manually delineated using Landsat imagery, with the classification accuracy validated using 472 field-surveyed ground truth points from the same year. A stratified subset of field survey samples was analyzed to validate the classification accuracy. The overall accuracy was 85.24% as shown by a comprehensive confusion matrix, and the Kappa coefficient reached 0.91, indicating that the classification results were reliable.

2.2.4. Meteorological Data

Derived from a nationally harmonized meteorological repository (1 km grid cells; 1990–2020 coverage), the temperature and precipitation monthly means for 1990–2020 were acquired from www.geodata.cn. After data accumulation, averaging, format conversion, cutting, unit conversion, downscaling, and other pre-processing, NPP was calculated. Sunshine percentage measurements were computationally converted to estimate total solar irradiance. The National Meteorological Science Data Sharing Service platform (http://data.cma.cn/) provided standardized sunshine percentage records for analysis, and the time series was 1990–2020. Total solar radiation was estimated following the methodology established by He et al. [35]:
Q = Q A × a + b × s
where Q is the total solar radiation; a and b are coefficients of 0.185 and 0.595, respectively; s is the sunshine percentage (%); and Q A is the astronomical radiation.
NPP was calculated using the input CASA model. At the same time, temperature, precipitation, and solar radiation data for 2022 were collected and combined with land use type data for 2022; these parameters drove the CASA model for 2022 NPP estimation. The model’s accuracy was assessed through ground-truthing with field-collected vegetation specimens, and correlation analysis was performed based on the analysis of soil organic matter and salinity data in that year.

2.3. Methods

2.3.1. Land Use Intensity and Landscape Stability

Land use intensity (LUI) serves as a metric characterizing anthropogenic modifications across land use types, quantifying human-induced alterations to land cover patterns [36]. According to the research of Zhuang [37], land use types received tiered numerical designations. The prefecture-level value of urban settlement was 4, including construction land; the value of agricultural land level was 3, including cropland, garden land, and artificial grassland; the value of forest, grass, and water use was 2, including forest land, water area, and grassland; unused land was assigned a value of 1, including unused or difficult to use land. The LUI computation is mathematically expressed through the following formulation:
U = i = 1 n Z i C i × 100 %
where U is the LUI, Z i serves as the identifier for land use type i , C i quantifies its areal proportion relative to the entire region, and n enumerates the distinct land use classes. The Sangong River Basin was divided according to the window size of 3 km × 3 km, and the LUI of each window was calculated separately. The calculated results were assigned to the center point of each window and based on the center point. The inverse distance weight (IDW) method was used for interpolation. Applying the natural breakpoint methodology, the LUI in the study area was divided into five levels: <174% (low), 174–213% (moderately low), 213–240% (moderate), 240–271% (moderately high), and >271% (high).
Landscape stability (LS) encompasses a landscape’s dual capacity to resist perturbations and restore ecological equilibrium post-disturbance. According to the hierarchical patch dynamic theory, the smaller the total edge contrast (TECI) and patch density (PD) and the larger the spread index (CONTAG) of the landscape mosaic are, the more stable the landscape structure. The model for evaluating LS [38] was constructed as follows:
S = C P × T
where S is the LS, C is the spread index, P is the PD, and T is the TECI. S increases monotonically with S -value increments but decreases with S -value reductions.
The landscape index was calculated with Fragstats 4.2, using the moving window method, and the analysis scale was 300 m. To ensure that the number and size of landscape samples would meet the analysis requirements and the composition would reflect the prevailing circumstances of the investigated zone, a total of 909 research units of 1.2 km × 1.2 km were divided according to the principle that the average patch area was 2–5 times, and the create fishnet of ArcGIS 10.8 was used for segmentation. The IDW method was used for interpolation, and the natural breakpoint method [39] was used to divide landscape stability into five levels: unstable (<0.1), moderately unstable (0.1–0.21), moderately stable (0.21–0.35), stable (0.35–0.56), and highly stable (>0.56).

2.3.2. CASA Model

NPP is regulated through coupled mechanisms involving environmental drivers and socioeconomic activities. The NPP used in this paper was calculated using the CASA model. The CASA model is a widely used model of light energy utilization efficiency that combines various factors and has high precision. The enhanced CASA model developed by Zhu et al. [10] was implemented, with the governing equations expressed as follows:
N P P x , t = A P A R x , t × ε x , t
where N P P ( x , t ) quantifies the NPP (g C·m−2) for pixel x during month t , A P A R ( x , t ) represents the absorbed photosynthetically active radiation (g C·m−2) at pixel x in month t , and ε   ( x ,   t ) denotes the effective light-use efficiency (g C·MJ−1) for pixel x throughout month t .
A P A R x , t = S O L x , t × F P A R x , t × 0.5
Here, S O L ( x ,   t ) denotes the monthly total solar radiation (g C·m−2) at pixel x ; F P A R ( x ,   t ) quantifies the fraction of photosynthetically active radiation absorbed by vegetation canopies. The scalar 0.5 defines the ratio of photosynthetically utilizable radiation to total solar flux. Within defined NDVI thresholds, FPAR exhibits a linear dependence on NDVI values, enabling its derivation through NDVI-based parameterization.
ε x , t = T ε 1 x , t × T ε 2 × W ε x , t × ε m a x
Here, T ε 1 ( x , t ) and T ε 2 ( x , t ) represent the low-and high-temperature limitations on photosynthetic efficiency; W ε ( x , t ) is the effect of modulating moisture stress on water availability; and ε m a x (g C·MJ−1) is the vegetation’s maximum attainable light energy conversion rate under optimal conditions.
Validating the model entailed comparative analysis between field-measured biomass and CASA model-derived NPP estimates at co-located sampling sites. Statistical analysis revealed a significant positive correlation between these variables (n = 35, R2 = 0.64, p < 0.05; Figure S1), with the model’s outputs exhibiting strong congruence with the empirical observations.

2.3.3. Geodetector

Geodetector employs spatial heterogeneity analysis to discern dominant drivers of geographic element distributions through intra- and intervariable variance decomposition [40]. In this study, two functions of the geographic detector were used: single factor detection and interactive detection. Geodetector enables multiform data analysis (quantitative/qualitative covariates) while quantifying interactive effects between paired independent variables on the response variable. The operational algorithm is mathematically defined as follows:
q = 1 h = 1 L N h σ h 2 N σ 2
where h = 1,…, L represents the stratification (classification or partitioning) of variable y or factor x . N h denotes the total units in stratum h , while N represents the total units across the entire study area. σ h 2 and σ 2 correspond to the variances of stratum h and the overall population y values, respectively. The parameter q is bounded within [0, 1], where a higher q value reflects a greater explanatory capacity of the independent variable regarding NPP, with a weaker explanatory capacity observed at lower values. According to this q metric, the independent variable accounts for q × 100% of the observed NPP variation.
This investigation employed Geodetector to assess the determinants underlying NPP’s spatial distribution patterns. Considering that the dominant factors affecting NPP may vary across different areas of the Sangong River Basin, the analysis not only included the driving factors of NPP for the entire basin but also divided the basin into two parts: the plain and the mountain. Eight driving factors closely related to NPP in the Sangong River Basin were selected from three main categories (Table 1) and classified into five categories using the natural breaks method for factor detection and interaction detection.

3. Results

3.1. Land Use Change and Landscape Stability Change

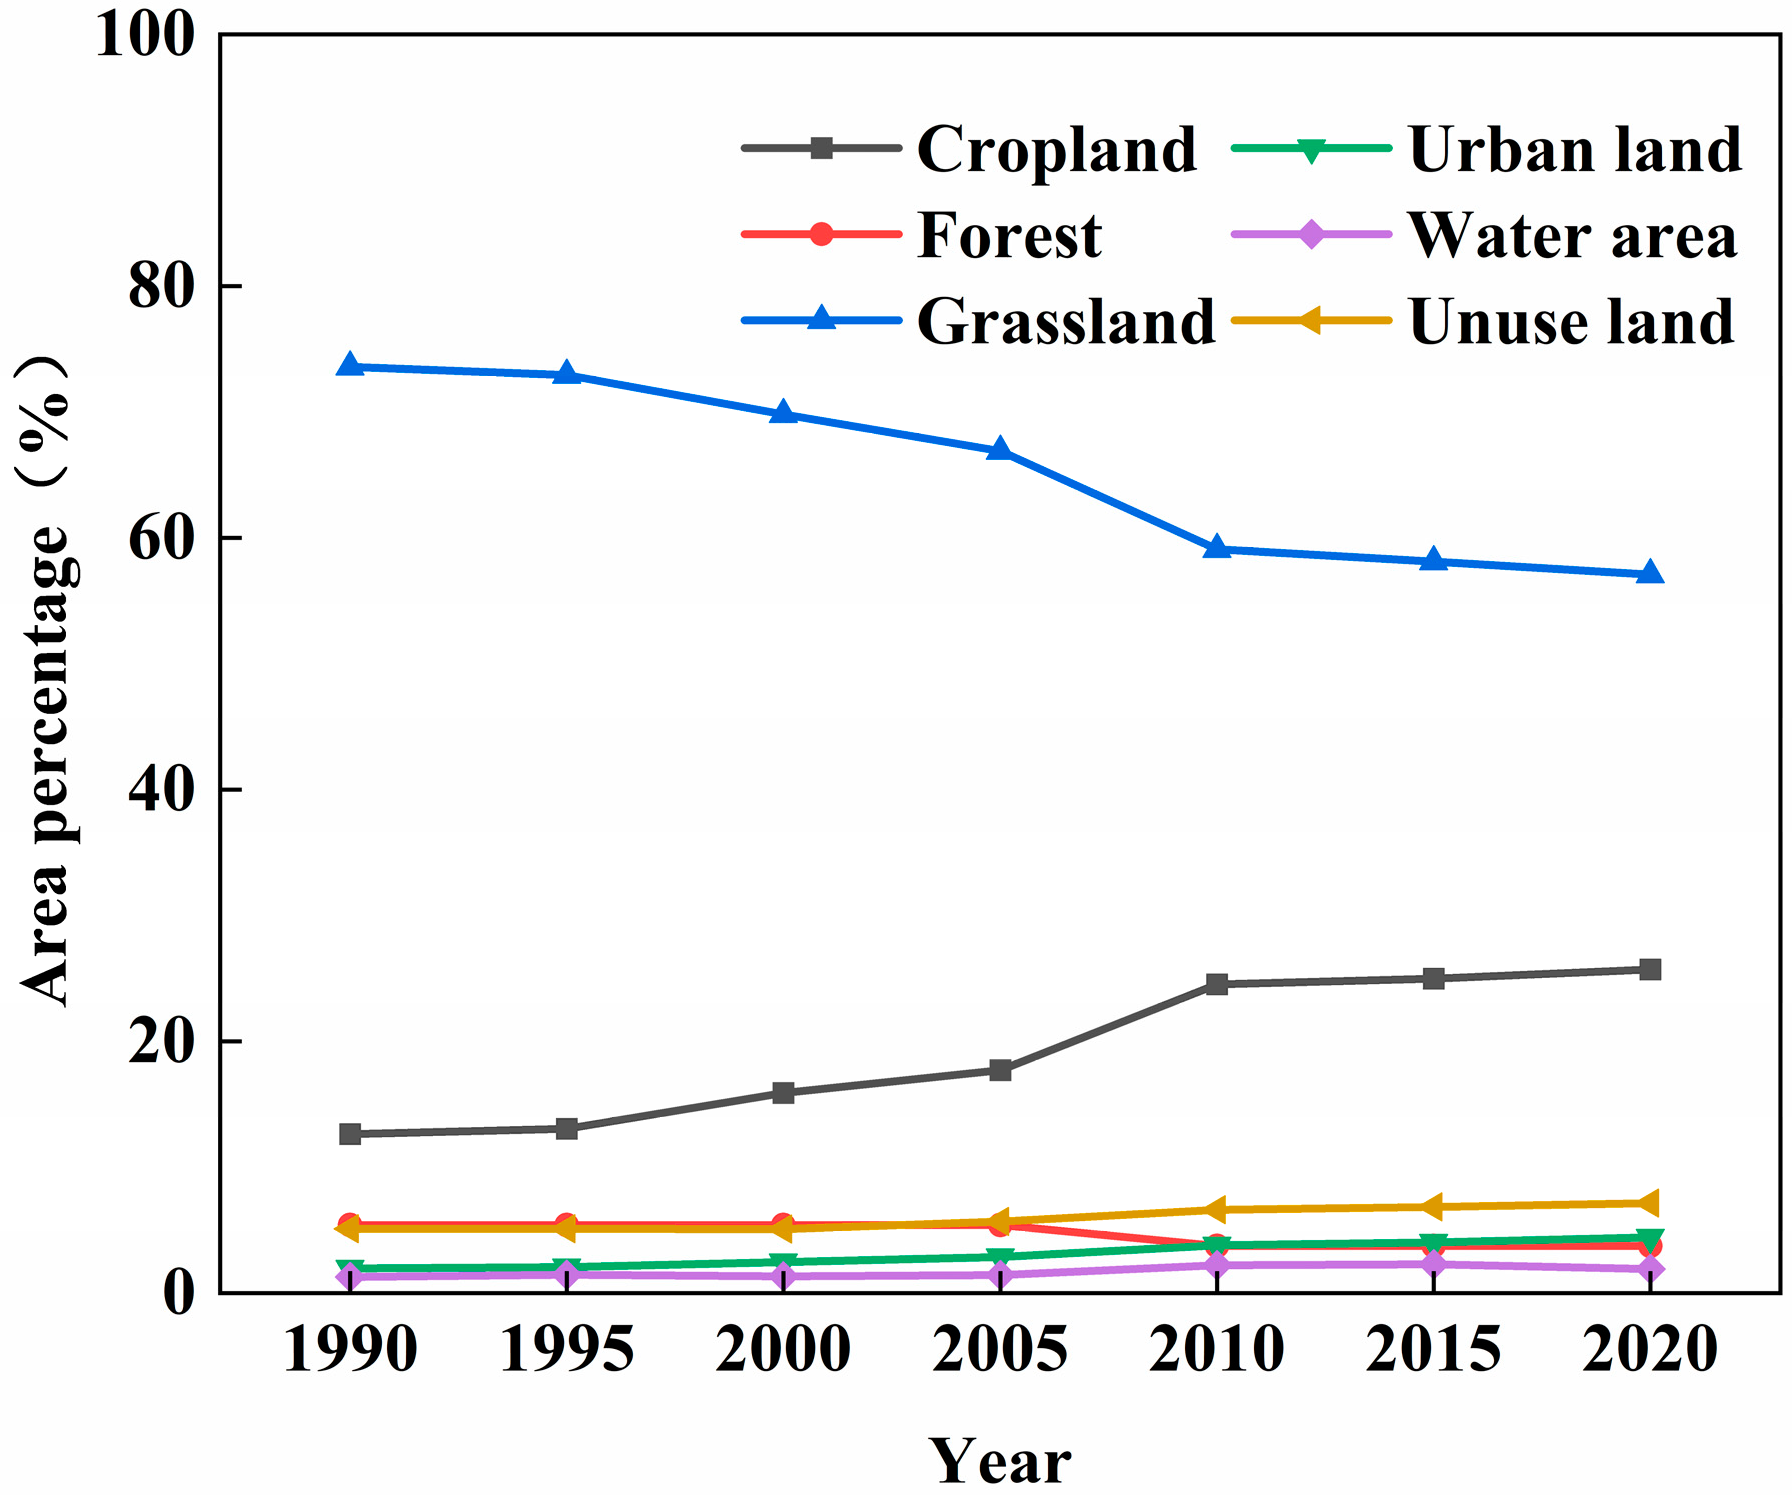
3.1.1. Change in Land Use Structure

The land use cover in the Sangong River Basin changed dramatically from 1990 to 2020 (Figure 2), with grassland and cropland experiencing the most substantial alterations. The percentage of grassland area showed a decreasing trend, declining from 73.59% in 1990 to 57.08% in 2020, representing a total decrease of 16.51%, and a 0.53% decrease per year. The percentage of cropland area exhibited an increasing trend, which rose from 12.64% in 1990 to 25.71% in 2020, reflecting a total increase of 13.07%, and 0.42% per year. The cropland expansion and grassland contraction in the study area are attributed to multi-year agricultural reclamation initiatives, stemming principally from the systematic transformation of grassland ecosystems into cultivated agricultural parcels. The percentage of forest declined annually, decreasing from 5.4% in 1990 to 3.76% in 2020, representing a total decrease of 1.64%. The percentage of urban land demonstrated an increasing trend, rising from 1.97% in 1990 to 4.42% in 2020, reflecting a total increase of 2.46%. The percentage of water area exhibited an increasing trend, growing from 1.29% in 1990 to 1.90% in 2020, resulting in an increase of 0.61%. The percentage of unused land showed an increasing trend, rising from 5.11% in 1990 to 7.13% in 2020, an increase of 2.02%.

3.1.2. Change in Land Use Intensity

Upon examining the percentage of area across different levels of LUI (Figure 3), the area designated as having moderately low intensity showed a decreasing trend. It declined from 60.3% in 1990 to 39.1% in 2020, reflecting a total reduction of 21.2%, and 6.84% per year. The percentage of area for the other LUI levels generally exhibited an increasing trend, with the most notable increase occurring at high intensity, rising from 6.5% in 1990 to 23.95% in 2020, a total increase of 17.46%, and a 5.63% increase per year. The decrease in area designated as having moderately low intensity, coupled with the increase in area classified as high intensity, indicates that, as agricultural land expands and urbanization progresses, the overall intensity of land use in the watershed is gradually increasing. Moreover, the impact of human activities on the watershed landscape is intensified. Changes in LUI classifications further support this observation. In 1990, the land use intensity in the Sangong River Basin was 211.46%, exhibiting an annual increasing trend (p < 0.05) and reaching 227.42% by 2020, with an annual increase rate of 0.613% (Figure 4). Considering regional differences, the land use intensity in the plain (243.5%) significantly exceeded that in the mountains (191.6%), with both areas exhibiting a significant upward trend (p < 0.05). The rate of increase in the plains was 1.04% per year, compared to only 0.1% in the mountains. The LUI stability in the mountains stems from multidimensional constraints imposed by its mountainous terrain (elevation range: 800–5445 m). Specifically, slopes exceeding 15° preclude mechanized agricultural practices (e.g., tractor operations), thereby limiting cropland expansion. Furthermore, the area above 1200 m elevation—encompassing the state-planned Tianchi Bogda Peak Nature Reserve—serves as a critical ecological functional zone. The low and stable LUI in this region is further reinforced by human-driven ecological conservation efforts, which prioritize habitat protection over intensive land development.

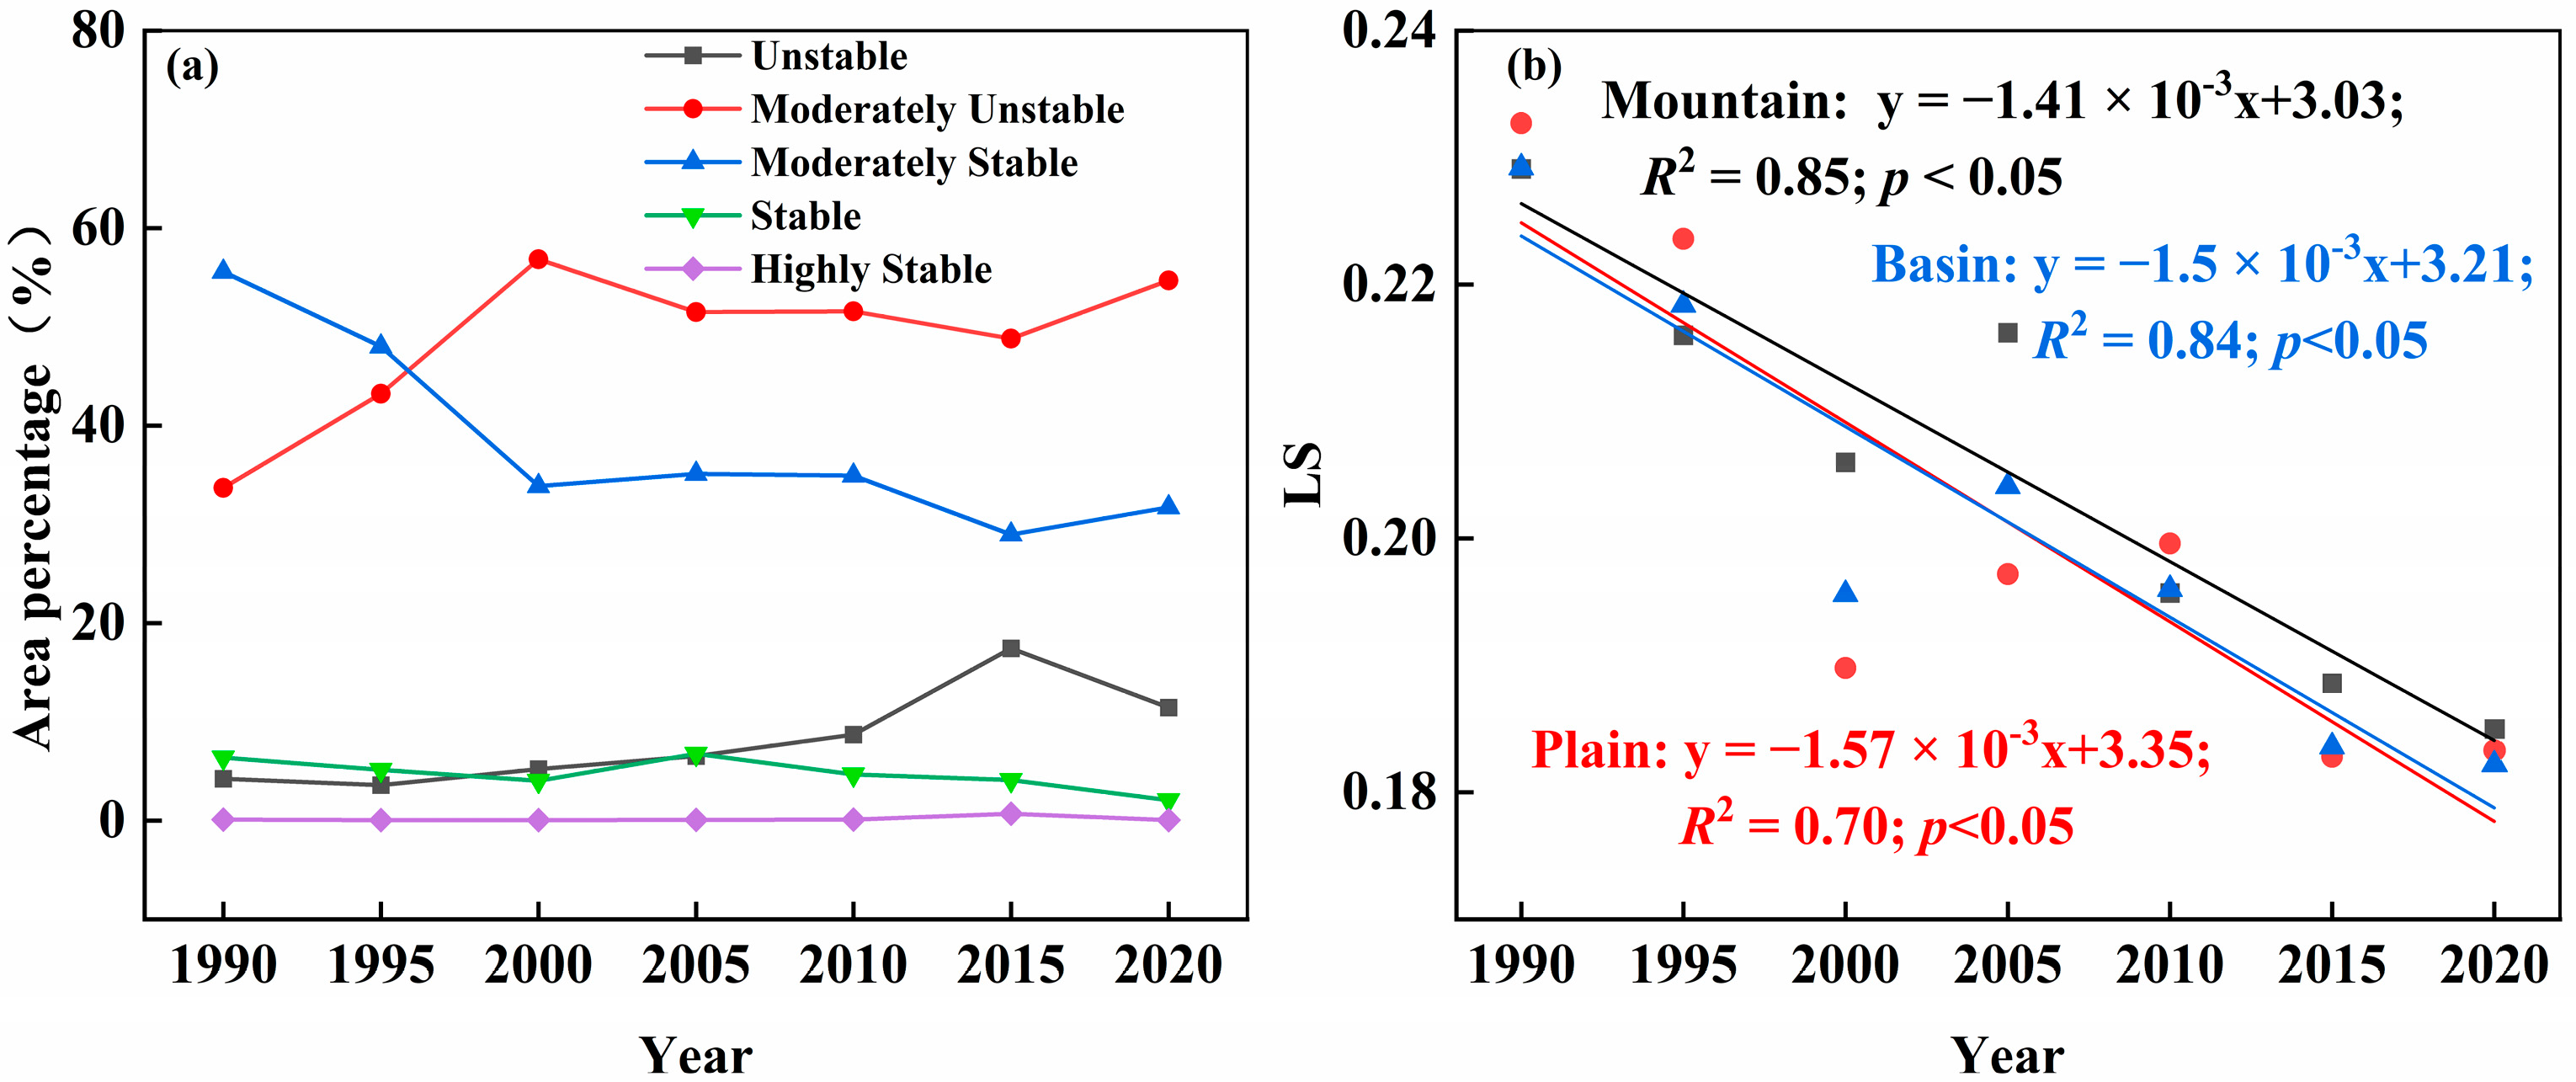
3.1.3. Changes in Landscape Stability

In terms of quantitative changes (Figure 5), the largest proportion of LS grades in the Sangong River Basin was classified as moderately unstable (48.62%), followed by moderately stable (38.31%). The moderately unstable grade exhibited a fluctuating upward trend, with its area proportion increasing by 21% from 1990 to 2020. In contrast, the moderately stable grade showed a fluctuating downward trend, with its area proportion decreasing by 23.84%. This indicates a general decline in overall LS in the Sangong River. Changes in the area proportion of the unstable grade further support this, as it increased by 7.2% in 2020 compared to 1990. In terms of the overall trend of LS from 1990 to 2020, the LS in the Sangong River Basin significantly declined (p < 0.05), with an annual decrease rate of 0.0015. Across different regions, LS was slightly higher in the mountains (0.205) compared to the plain (0.201), with both regions exhibiting significant downward trends (p < 0.05). The decline rate in the plain was 0.00157 per year, exceeding the rate of 0.0014 per year in the mountain.

3.2. Spatial and Temporal Distribution Pattern of NPP

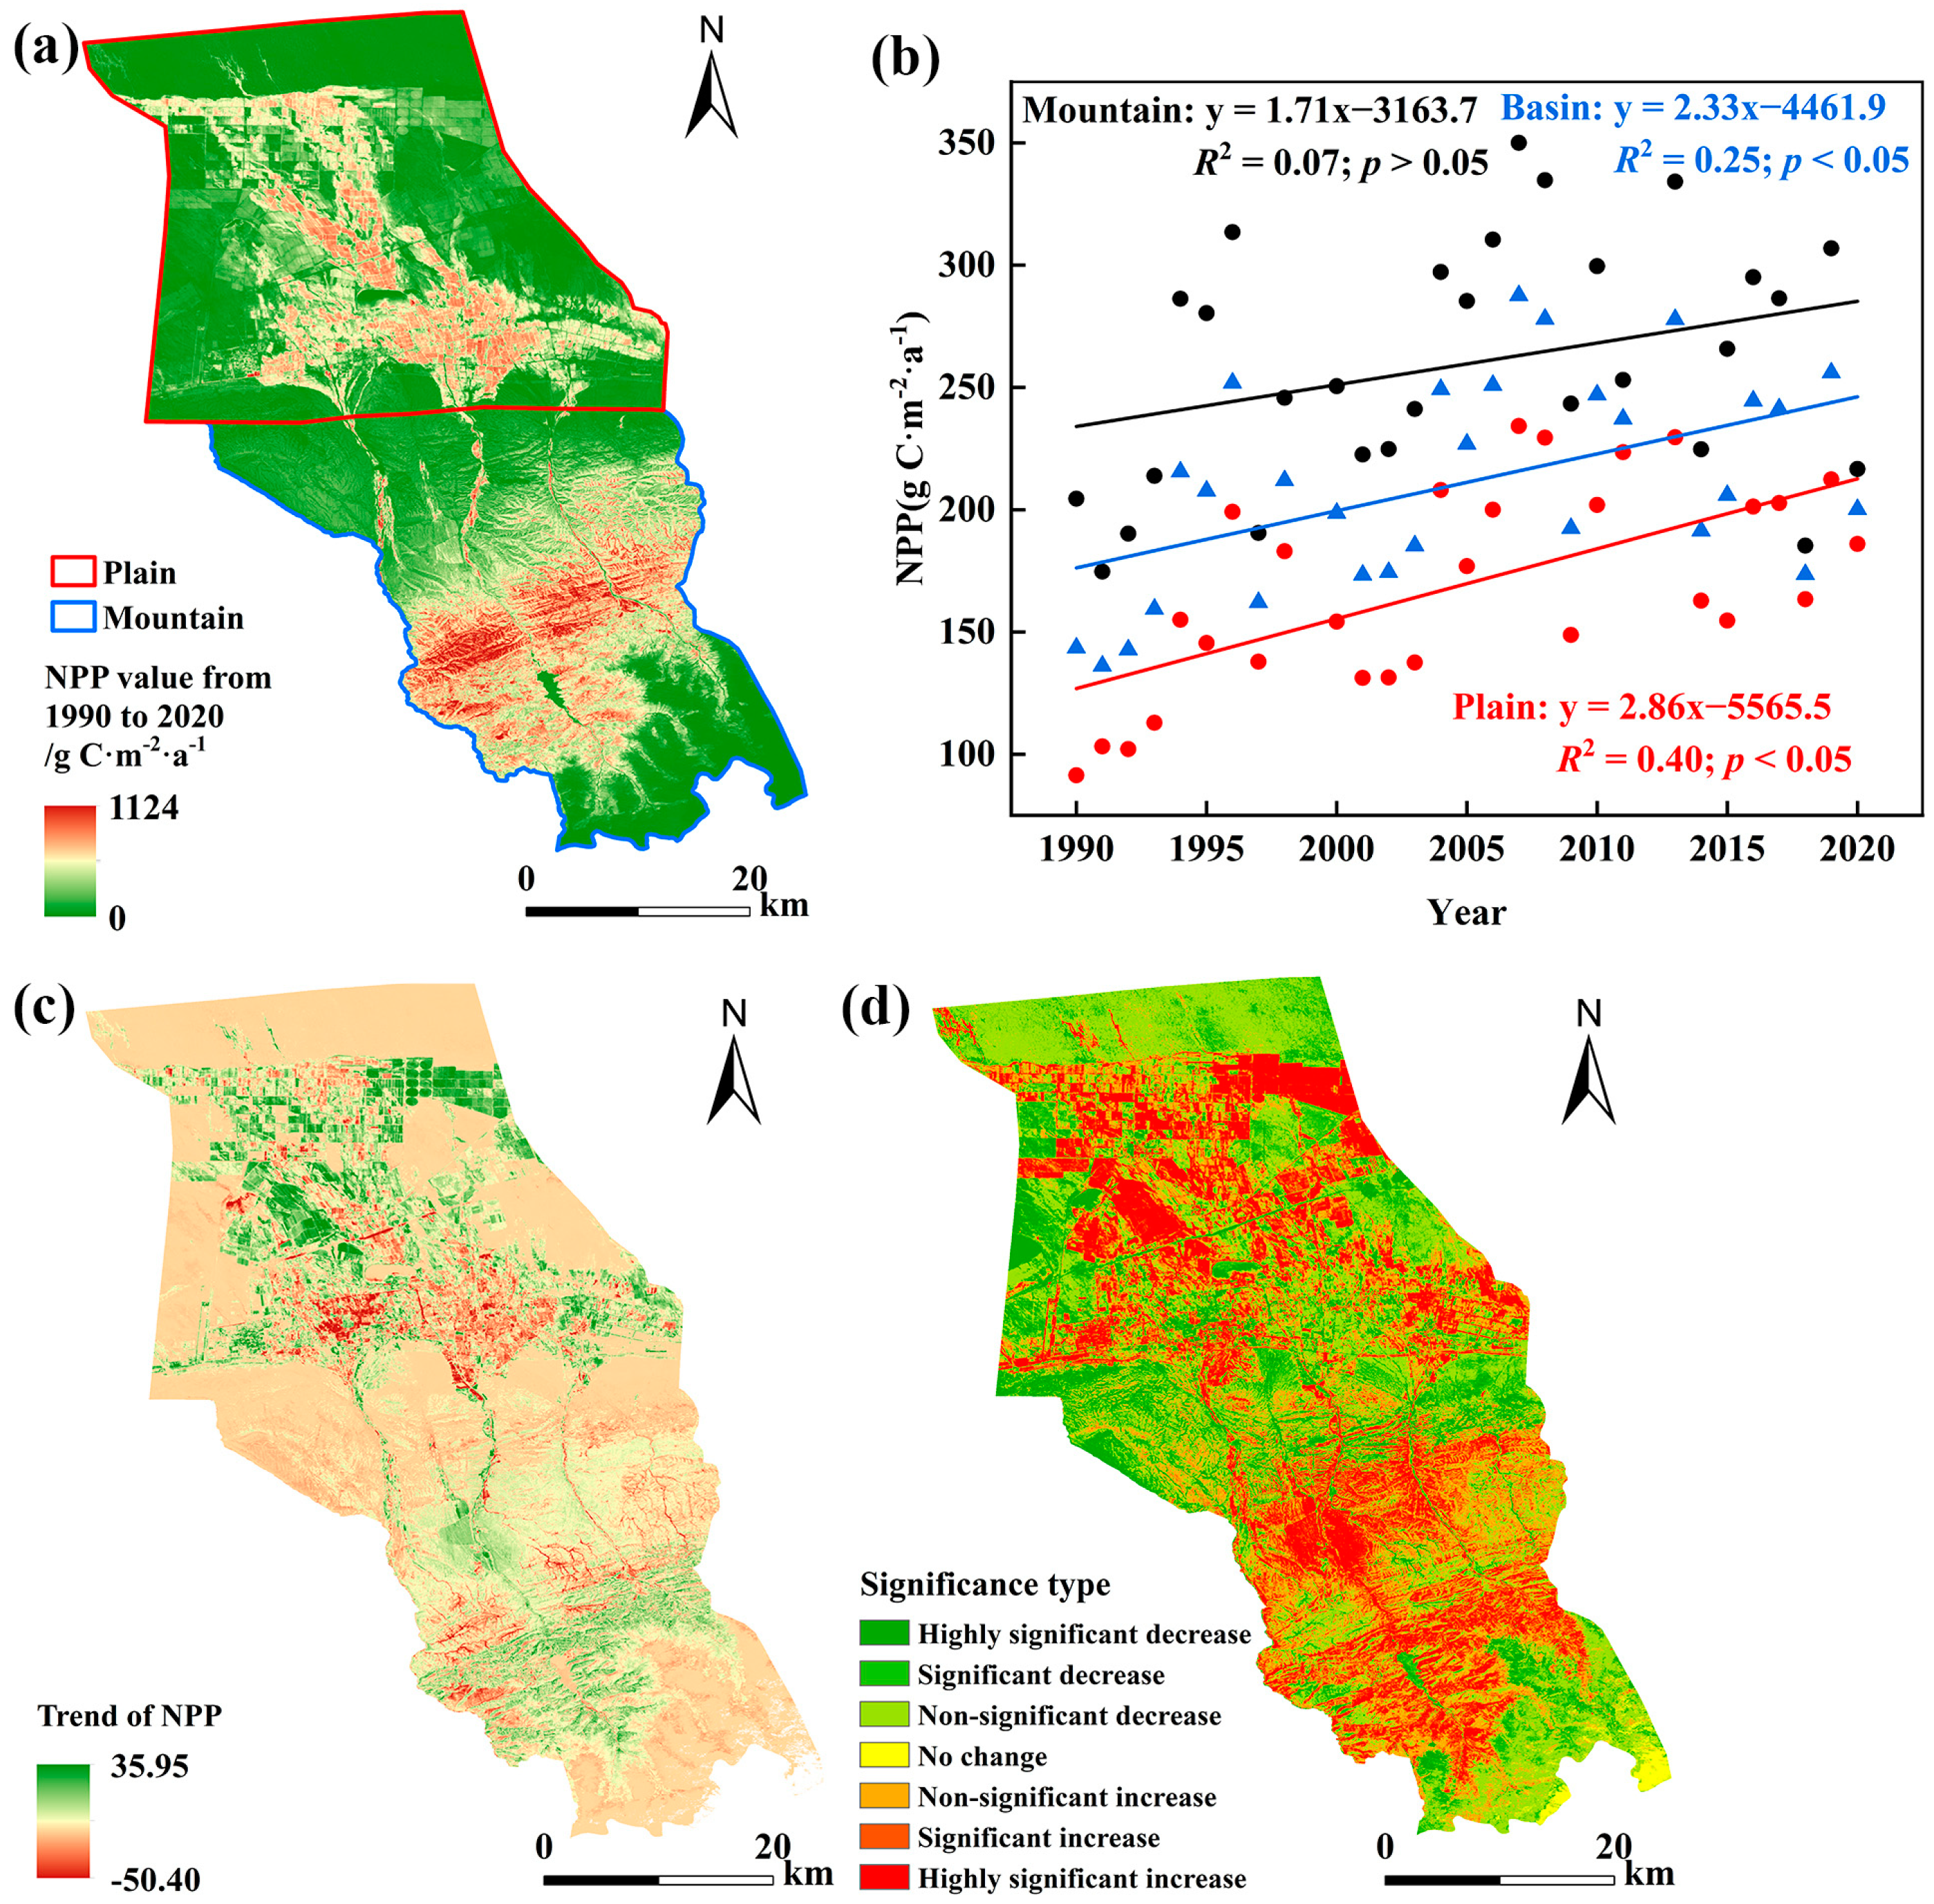
3.2.1. The Spatial Distribution Characteristics of NPP

The NPP in the Sangong River Basin exhibits significant spatial heterogeneity (Figure 6a). During the 31-year study period, the NPP ranged from 0 to 1124 g C·m−2·a−1, averaging 289.92 g C·m−2·a−1. Elevated NPP levels predominantly concentrated within north-central oasis zones, southern low-altitude montane grasslands, and mid-elevation forested belts. Specifically, the average NPP in the oasis regions was 334.2 g C·m−2·a−1, while in the southern mountains, it was 404.3 g C·m−2·a−1. Low NPP values were primarily concentrated at the edges of the oasis and in the higher-elevation subalpine regions, with average NPP values of approximately 174.2 g C·m−2·a−1 and 25.2 g C·m−2·a−1, respectively.
In terms of the interannual variability (Figure 6b), from 1990 to 2020, the annual average NPP in the Sangong River Basin showed a significant increasing trend (p < 0.05), with an increase rate of 2.33 g C·m−2·a−1. In comparison to that in different regions, the multi-year average NPP in the plain was 167.78 g C·m−2·a−1, which is lower than the average in the mountain at 257.40 g C·m−2·a−1. Regarding the change rates, both regions exhibited significant increasing trends over time. The plain showed a change rate of 2.86 g C·m−2·a−1, while the mountains showed a rate of 1.71 g C·m−2·a−1, indicating faster growth in the plain compared to the mountains.

3.2.2. Temporal Change Trend of NPP

Theil–Sen slope analysis (Figure 6c) revealed that 52.44% of the basin’s total area exhibited positive NPP trajectory patterns, mainly including some cropland in the oasis region and the mountain forest. Areas with a decreasing trend accounted for 47.56%, primarily consisting of natural vegetation on the periphery of the oasis and subalpine meadows. The Mann–Kendall statistical evaluation (Figure 6d) revealed that the area with significant and highly significant increases (p < 0.01) made up 28.98%, with the mountains accounting for 13.50% and the plain for 15.49%. These increases were mainly distributed in newly reclaimed cropland, newly added urban land, and forest. Stability (including no significant increase, no change, and no significant decrease) characterized 47.92% of the basin, with the mountains and plain accounting for 23.62% and 24.3%, respectively. Areas with significant and highly significant decreases accounted for 23.10% of the study area, with the mountain and plain areas accounting for 9.26% and 13.82%, respectively, mainly including grassland, water area in the western and southern parts of the oasis, and unused land in high-altitude areas.

3.2.3. Annual Mean Values and Changing NPP Trends for Different Land Use Types

The interannual NPP dynamics across land use categories in the Sangong River Basin (1990–2020) demonstrate divergent temporal patterns (Figure 7). Cultivated areas, urbanized zones, and undeveloped terrains demonstrate non-significant NPP variations (p > 0.05). Conversely, forested and grassland ecosystems manifest statistically significant NPP increments (p < 0.05), with respective accumulation rates of 6.38 g C·m−2·a−1 and 2.29 g C·m−2·a−1.

3.3. Relationship Between Soil Factors, Climate Factors, and NPP

3.3.1. Soil Factors

Soil nutrients and salinization significantly influence NPP. This study characterized soil nutrients and salinization through the analysis of soil organic matter content and total soil salt content. Spatial interpolation data for multi-period soil organic matter content and total soil salt content in the Sangong River Basin, alongside corresponding NPP data from specific years, were employed to randomly extract sample points for linear fitting (Figure 8). The results indicate that the NPP in the plain showed a significant increasing trend correlated with rising soil organic matter content (p < 0.05), with a change rate of 99.04 g C·m−2·a−1 for a 1 g·kg−1 increase in soil organic matter content. Conversely, the NPP in the plain demonstrated a significant decreasing trend associated with higher total soil salt content (p < 0.05), with a change rate of 123.59 g C·m−2·a−1 for a 1 g·kg−1 increase in total soil salt content. In the mountain, variations in total soil salt content and organic matter content did not demonstrate a significant correlation with NPP (p > 0.05).

3.3.2. Climate Factors

Climate factors significantly influence NPP. This investigation evaluated climatic parameters using the mean annual temperature and precipitation metrics. This investigation assessed the mean annual temperature (TMP), precipitation (PRE), and NPP dynamics in the Sangong River Basin during the 1990–2020 period. Linear and nonlinear fitting were performed on randomly extracted sample point data from specific sub-regions (Figure 9). The TMP distribution in the Sangong River Basin exhibited spatial heterogeneity, with high-temperature zones situated in the plain where the distribution was relatively uniform. In contrast, temperatures in the mountains declined with increasing elevation. The spatial distribution of PRE was inversely related to that of temperature. Plains with homogeneous spatial distribution, characterized by semi-arid conditions and low precipitation levels, demonstrated a marked positive association between NPP levels and mean annual precipitation, with the NPP increasing by 10.76 g C·m−2·a−1 for every additional 1 mm of precipitation (p < 0.05). Conversely, there was a significant negative correlation between NPP in the plain and TMP, with the NPP decreasing by 266.9 g C·m−2·a−1 for a 1 °C decrease in temperature (p < 0.05). The nonlinear fitting section relates to the mountains of the study region where temperature and precipitation exhibited clear vertical differentiation. Different elevations have distinct combinations of water and thermal conditions, impacting NPP in various ways. Low-, medium-, and high-altitude regions are characterized by water–thermal combinations of “high temperature–dry”, “moderate temperature–humid”, and “low temperature–humid”, respectively. The vegetation in low- and high-altitude areas experiences drought and low-temperature stress, resulting in lower NPP. In contrast, the water–thermal combination at mid-elevations is most conducive to vegetation growth. Consequently, the vegetation in these areas primarily consists of snow-capped spruce forests. The maximum NPP in mountainous terrain concentrates at mid-altitude zones, peaking under specific hydrothermal thresholds of 243.8 mm of mean annual precipitation and a 0.22 °C mean annual temperature.

3.4. Influencing Factors of the NPP Distribution Pattern

NPP dynamics and their determinants in the Sangong River Basin demonstrate multi-driver regulation of spatial allocation patterns (Table 2). Dominant factors exhibit marked spatial heterogeneity in governing the NPP distribution across sub-regions. From a watershed perspective, the contribution rate of LS is 32.26%, followed by TMP, LUI, and PRE, with explanatory rates of 31.02%, 25.85%, and 23.19%, respectively. This indicates that the primary factors influencing the NPP distribution in the Sangong River Basin are climate and human activities, with soil factors having a relatively minor impact. In the plains, the factors with higher contributions for NPP are LUI, TS, and LS, with values of 31.44%, 30.36%, and 18.36%, respectively. This shows that NPP in the plains is primarily influenced by human activities. In the mountains, the factors contributing to NPP are TMP and PRE, with values of 71.27% and 52%, respectively. This shows that climate factors are the primary driving forces affecting NPP in this region. For artificial vegetation in the plains, the driving factors are TS and LUI, with explanatory rates of 32.48% and 21.65%, respectively. The driving factors affecting the NPP of natural vegetation in the plains are pH and OM, with explanatory rates of 13.36% and 8.6%. This indicates that the NPP of natural vegetation is primarily influenced by soil factors in the plain. In the low mountain grassland and mid-mountain forest zones, the factor contributing to the NPP distribution is TMP, with contributions of 57.19% and 27.03%, respectively. In the subalpine and alpine meadow zones, the contributing factor is PRE, with an explanatory rate of 23.04%.

4. Discussion

4.1. Disturbance of Landscape Patterns by Human Activities

LUI quantifies the anthropogenic disturbance intensity on land use configurations [41]. LUI was originally used to measure inputs and outputs in agricultural production activities [42]. The progressive intensification of anthropogenic land resource appropriation has driven the LUI framework to encompass integrated ecosystem exploitation, stewardship, and preservation strategies [43,44]. The mean LUI in the Sangong River Basin ranges from 2.11 to 2.28, and the maximum is 3.52 (Figure 4b). This is higher than that of the Shule River Basin (1.20) [45] and lower than that of the Yangtze River Delta urban agglomeration (4.40) [46], indicating that the LUI of the Sangong River Basin is higher than that of other inland river basins and lower than that of the eastern developed areas. On the other hand, the LUI in this study area showed an increasing trend, which was consistent with the results for other areas [47], indicating that the interference of human activities with the land use pattern in the Sangong River Basin was increasing. In tandem with the observed rapid increase in NPP across the Sangong River Basin (Figure 6b), key anthropogenic drivers likely include optimized irrigation/fertilization regimes and strategic urban green infrastructure development [48]. In addition to the overall rising trend of LUI, the proportion of area with LUI (Figure S2) also showed a significant rising trend, demonstrating intensive anthropogenic exploitation and the transformation of natural resources within the study region. However, the management and protection of ecological environment were also continuously promoted. The low utilization intensity area greatly overlaps with the core area of the Tianchi Bogda National Nature Reserve [49].
LS represents the ability of the landscape mosaic to resist interference and to recover [50]. According to graded patch dynamic theory, LS is closely related to landscape fragmentation. The lower the degree of landscape fragmentation is, the higher the landscape stability, and vice versa [51]. Landscape fragmentation is characterized by the number of patches and the average patch area. The average patch area of the Sangong River Basin decreased from 4550 m2 in 1990 to 2570.6 m2 in 2020. The number of patches increased from 991 to 1754, indicating serious landscape fragmentation in the Sangong River Basin (Figure S3), which corroborates the overall significant decline in LS in the Sangong River Basin.

4.2. Additional Evidence of the Impact of Human Activities on NPP

There are significant differences in NPP among different land use types analyzed in this study (p < 0.05) (Figure 7), which is consistent with the conclusions of other researchers [52]. The overall trends of NPP for various land use types in the study area align closely with the calculations of other scholars, with the highest NPP observed in cropland, followed by forest land [53]. The NPP calculated by different scholars also varies, which could potentially originate from methodological discrepancies, heterogeneous data provenance, and parametric variations across modeling frameworks [54,55,56]. Arid regions are characterized by dry climates and sparse vegetation, which can lead to inaccuracies in model calculations. Adjusting model parameters is a crucial approach to enhancing the accuracy of these results [57,58]. Therefore, the static parameters of the model were adjusted to some extent according to the actual situation in the Sangong River Basin (Table 3), and the operation results of the modified model were relatively reliable.
The result of Mann–Kendall trend test shows (Figure 6d) that the areas with a very significant increase (p < 0.01) are mainly newly reclaimed cropland and urban land, indicating that the land use change is closely related to the increase in NPP in inland basin. However, the increase in NPP in the forest ecosystem may be related to protection management. Since 2000, the management department has prohibited grazing in order to conserve soil and water in the forest area. In addition, understory cleaning ways will increase the forest window area and then promote the regeneration of stands, resulting in the increase in vegetation NPP. There are also differences in NPP changes between forbidden and non-forbidden grazing areas. In this paper, a 1 km wide buffer zone was set along the Sigong River as the boundary, and the changes in NPP of forest vegetation in the buffer zone on both sides were compared (Figure S4). Comparative analysis demonstrated a 4.57% greater spatial coverage of statistically significant NPP increments (p < 0.01) in grazing-prohibited zones relative to actively grazed areas, with threshold-differentiated magnitude stratification. This proportion may be even greater if moderate disturbance measures such as moderate grazing are carried out on vegetation in the forbidden grazing areas. Prior research documents a 25.4% elevation in mean NPP values within grazing-prohibited zones of the Sangong River Basin compared to actively grazed regions [59].

4.3. Driving Factors of NPP Distribution

Geodetector serves as a spatial statistical technique for assessing stratification heterogeneity and identifying its driving determinants; it is widely used in geography, ecology, and other research fields [60]. This investigation employed Geodetector methodology to identify the drivers of NPP’s spatial heterogeneity in the Sangong River Basin. Regional analysis revealed divergent primary determinants governing vegetation productivity across basin subzones (Table 3). The Sangong River Basin is an inland basin with a large elevation drop within the region, various vertical ecosystem distributions, and strong spatial heterogeneity of the climate, soil, and other natural environments. Different factors may influence the vegetation NPP across regions, with land use intensity identified as the dominant factor in plain areas, while temperature and precipitation are the primary factors in mountains. This aligns with findings from other researchers [61,62,63,64]. This indicates that human activities primarily drive changes in NPP in plain regions, whereas natural factors predominantly affect NPP in mountains. The relationship between NPP and OM involves a dynamic and reciprocal interaction rather than a one-way influence of soil organic matter on NPP (Figure 8b). A key component of this interaction is the “plant–soil” feedback, which refers to how plants modify the biological and abiotic properties of the soil in their growing environment, thereby creating conditions more favorable for plant growth [65]. This process is driven by the interactions among plants, litter, rhizosphere residues, soil organisms, and soil organic matter, which collectively regulate the aboveground–belowground nutrient cycle [66]. Vegetation proliferation augments OM, thereby fostering edaphic condition improvements that synergistically enhance net NPP.

4.4. Limitations and Prospects

This study utilized an enhanced CASA model to quantify long-term NPP in the Sangong River Basin and investigated the relationships between NPP and edaphic parameters (total salinity and organic matter) using extensive field measurements. Validation demonstrated that, while the model achieves high accuracy in estimating NPP for high-biomass cropland and forest ecosystems, it exhibits limitations for low-biomass grassland vegetation. Future methodological refinements will integrate MODIS-derived land surface temperature and GLDAS soil moisture data to establish a hybrid mechanistic–statistical framework. Controlled experiments under water stress gradients will enhance parameter calibration for spatially explicit NPP simulations.
Water availability serves as a critical determinant of vegetation dynamics in arid regions. Although this work elucidated precipitation–NPP correlations across diverse ecological zones, the analysis of water availability’s impacts on natural vegetation and staple crops (wheat, maize, and cotton) in plains was limited by data constraints. Given the hydrological–ecological interdependencies governing agricultural yields and ecosystem resilience, targeted studies quantifying ecohydrological thresholds under irrigation scenarios will be essential for sustainable basin management.

5. Conclusions

This study elucidates the spatiotemporal dynamics of net primary productivity (NPP) and its driving mechanisms in the Sangong River Basin from 1990 to 2020. The findings reveal distinct spatial heterogeneities in NPP distribution, with cropland exhibiting the highest productivity (459.8 g C·m−2·a−1), significantly surpassing other land use types (p < 0.05). Notably, while the mean NPP in the plain (167.78 g C·m−2·a−1) was lower than that in the mountain (257.40 g C·m−2·a−1), its growth rate (2.86 g C·m−2·a−1) outpaced that in the mountainous region (1.71 g C·m−2·a−1), reflecting intensified agricultural and urban expansion. Human activities, particularly land use intensity (LUI), dominated the NPP variations in the plain, where soil organic matter was positively correlated with NPP (p < 0.05) and soil salinity exhibited inhibitory effects. In contrast, temperature and precipitation emerged as the primary drivers of NPP in the mountains, where nonlinear climatic interactions (p < 0.05) underscored the sensitivity of mountain ecosystems to hydrological variability.
Ecological governance in arid inland river basins necessitates spatially differentiated strategies to reconcile anthropogenic activities with natural drivers. In plains, optimizing land use through precision agriculture and green infrastructure can mitigate soil degradation while maintaining productivity. Prioritizing organic enrichment (e.g., crop residue retention) and salinity mitigation (e.g., subsurface drainage) enhances carbon sequestration. Mountainous regions require adaptive water management—such as precipitation harvesting in moisture-sensitive zones—to buffer climate-induced NPP variability. Critical forest ecosystems warrant protection via cropland-to-forest conversion, silvicultural practices, and grazing bans. Policy frameworks must integrate cross-regional water allocation to balance agricultural demands in plains with ecological conservation in mountains, fostering basin-scale carbon neutrality.

Supplementary Materials

The following supporting information can be downloaded at: https://www.mdpi.com/article/10.3390/land14030650/s1, Figure S1: Accuracy validation of NPP. Figure S2: The change trend of the proportion of low intensity area in Sangong River Basin. Figure S3: The average patch area and number of patches in Sangong River Basin. Figure S4: Proportion of NPP change grade area in grazing-prohibited area and grazing area in buffer zone. Figure S5: Real-world photos of the Sangong River Basin. Table S1: Confusion Matrix. Table S2: Vegetation Survey Data.

Author Contributions

Conceptualization and investigation, J.S. and F.L.; methodology, F.S. and B.C.; software, validation, and formal analysis, J.X.; resources and data curation, B.C.; writing—original draft preparation, F.S.; writing—review and editing, project administration, and funding acquisition, Y.W.; visualization and supervision, F.L. All authors have read and agreed to the published version of the manuscript.

Funding

This research was funded by the Tianshan Talent Training Program, grant number 2023TSYCLJ0048; the Third Xinjiang Scientific Expedition Program, grant number 2022xjkk0901; and the Field Observation and Research Station of Water Resources and Ecological Effects in the Lower Reaches of the Tarim River Basin Program.

Data Availability Statement

The data presented in this study are available on request from the corresponding author.

Acknowledgments

We thank all the staff at Fukang Station of Desert Ecology for technical and field help. Acknowledgement for the data support from "National Earth System Science Data Center. (https://www.geodata.cn).

Conflicts of Interest

The authors declare that this study was conducted without any commercial or financial relationships that could be perceived as potential conflicts of interest.

References

  1. Morel, A.C.; Adu Sasu, M.; Adu-Bredu, S.; Quaye, M.; Moore, C.; Ashley Asare, R.; Mason, J.; Hirons, M.; McDermott, C.L.; Robinson, E.J.Z.; et al. Carbon Dynamics, Net Primary Productivity and Human-Appropriated Net Primary Productivity across a Forest–Cocoa Farm Landscape in West Africa. Glob. Chang. Biol. 2019, 25, 2661–2677. [Google Scholar] [CrossRef] [PubMed]
  2. Yang, H.; Zhong, X.; Deng, S.; Xu, H. Assessment of the Impact of LUCC on NPP and Its Influencing Factors in the Yangtze River Basin, China. Catena 2021, 206, 105542. [Google Scholar] [CrossRef]
  3. Fu, Y.; Lu, X.; Zhao, Y.; Zeng, X.; Xia, L. Assessment Impacts of Weather and Land Use/Land Cover (LULC) Change on Urban Vegetation Net Primary Productivity (NPP): A Case Study in Guangzhou, China. Remote Sens. 2013, 5, 4125–4144. [Google Scholar] [CrossRef]
  4. Hu, C.; Zhang, L.; Wu, Q.; Soomro, S.; Jian, S. Response of LUCC on Runoff Generation Process in Middle Yellow River Basin: The Gushanchuan Basin. Water 2020, 12, 1237. [Google Scholar] [CrossRef]
  5. Ebermayer, E. Die Gesammte Lehre Der Waldstreu Mit Rücksicht Auf Die Chemische Statik Des Waldbaues. Unter Zugrundlegung Der in Den Königl. Staatsforsten Bayerns Angestellten Untersuchungen; Springer: Berlin/Heidelberg, Germany, 1876; Available online: https://link.springer.com/book/10.1007/978-3-642-91491-1 (accessed on 14 June 2023).
  6. Wang, X.; Du, G.; Dai, R.; Wang, G. The establishment of grassland productive assessment model and the determination of precipitation resource distribution pattern of Gannan tibetan autonomous prefecture based on RS and GIS. Acta Pratacult. Sin. 2001, 10, 95–102. [Google Scholar]
  7. Alexandrov, G.; Oikawa, T.; Yamagata, Y. The scheme for globalization of a process-based model explaining gradations in terrestrial NPP and its application. Ecol. Model. 2002, 148, 293–306. [Google Scholar] [CrossRef]
  8. Kicklighter, W.; Bondeau, A.; Schloss, L.; Kaduk; McGuire, D. Comparing global models of terrestrial net primary productivity (NPP): Global pattern and differentiation by major biomes. Glob. Chang. Biol. 1999, 5, 16–24. [Google Scholar] [CrossRef]
  9. Piao, S.; Fang, J. Terrestrial net primary production and its spatio-temporal patterns in Qinghai-Xizang Plateau, China. Nat. Resour. J. 2002, 17, 373–380. [Google Scholar]
  10. Zhu, W.; Pan, Y.; Zhang, J. Estimation of net primary productivity of chinese terrestrial vegetation based on remote sensing. Chin. J. Ecol. 2007, 31, 413–424. [Google Scholar]
  11. Huang, K.; Zheng, Z.; Cheddadi, R.; Laurent, M.; Franois, L. Research advance and application of terrestrial carbon cycle model CARAIB. Trop. Geogrophy 2007, 27, 483–488. [Google Scholar]
  12. Potter, S.; Klooster, A. Global model estimates of carbon and nitrogen storage in litter and soil pools: Response to changes in vegetation quality and biomass allocation. Tellus B 1997, 49, 1–17. [Google Scholar] [CrossRef]
  13. Pan, J.; Huang, K.; Li, Z. Spatio-temporal variation in vegetation net primary productivity and its relationship with climatic factors in the Shule River basin from 2001 to 2010. Acta Ecol. Sin. 2017, 37, 1888–1899. [Google Scholar] [CrossRef]
  14. Piao, S.; Luyssaert, S.; Ciais, P.; Janssens, I.; Chen, A.; Cao, C.; Fang, J.; Friedlingsteinm, P.; Luo, Y.; Wang, S. Forest annual carbon cost: A global-scale analysis of autotrophic respiration. Ecology 2010, 91, 652–661. [Google Scholar] [CrossRef] [PubMed]
  15. Ke, J.; Piao, S.; Fang, J. Npp and its spatio-temporal patterns in the yangtze river watershed. Acta Phytoecol. Sin. 2003, 27, 764–770. [Google Scholar]
  16. Yang, Y.; Li, L.; Wang, B.; Song, X.; Liu, A.; Wang, M. Simulation of net primary productivity by a satellite data-driven improved CASA model in Xilingol grassland. Chin. J. Ecol. 2015, 34, 2344–2352. [Google Scholar]
  17. Yang, H.; Mu, S.; Li, J.; Li, J. Effects of ecological restoration projects on land use and land cover change and its influences on territorial NPP in Xinjiang, China. Catena 2014, 115, 85–95. [Google Scholar] [CrossRef]
  18. Wang, Y.; Xia, W.; Liang, T. Research progress on spatial-temporal dynamic simulation model of net primary productivity of terrestrial ecosystems. Pratacult. Sci. 2010, 27, 77–88. [Google Scholar]
  19. Li, R.; Han, R.; Yu, Q.; Qi, S.; Guo, L. Spatial Heterogeneous of Ecological Vulnerability in Arid and Semi-Arid Area: A Case of the Ningxia Hui Autonomous Region, China. Sustainability 2020, 12, 4401. [Google Scholar] [CrossRef]
  20. Liu, D.; Zhang, C.; Ogaya, R.; Fernández-Martínez, M.; Thomas, P.; Josep, P. Increasing climatic sensitivity of global grassland vegetation biomass and species diversity correlates with water availability. New Phytol. 2021, 230, 1761–1771. [Google Scholar] [CrossRef]
  21. Zhang, X.; Xiao, W.; Wang, Y.; Wang, Y.; Wang, H.; Wang, Y.; Zhu, L.; Yang, R. Spatial-temporal changes in NPP and its relationship with climate factors based on sensitivity analysis in the Shiyang River Basin. J. Earth Syst. Sci. 2020, 129, 24. [Google Scholar] [CrossRef]
  22. Lu, L.; Li, X.; Veroustraete, F.; Kang, E.; Wang, J. Analysing the forcing mechanisms for net primary productivity changes in the Heihe River Basin, north-west China. Int. J. Remote Sens. 2009, 30, 793–816. [Google Scholar] [CrossRef]
  23. Song, Z.; Gao, Z.; Yang, X.; Ge, Y. Distinguishing the Impacts of Human Activities and Climate Change on the Livelihood Environment of Pastoralists in the Qinghai Lake Basin. Sustainability 2022, 14, 8402. [Google Scholar] [CrossRef]
  24. Mao, S.; Shangguan, Z. Evolution of Spatiotemporal Patterns in Vegetation Net Primary Productivity and the Driving Forces on the Loess Plateau. Front. Environ. Sci. 2023, 11, 1134917. [Google Scholar] [CrossRef]
  25. Machado, R.M.A.; Serralheiro, R.P. Soil Salinity: Effect on Vegetable Crop Growth. Management Practices to Prevent and Mitigate Soil Salinization. Acta Hortic. 2017, 3, 30. [Google Scholar] [CrossRef]
  26. Zhao, C.; Zhang, H.; Song, C.; Zhu, J.-K.; Shabala, S. Mechanisms of Plant Responses and Adaptation to Soil Salinity. Innov. J. 2020, 1, 100017. [Google Scholar] [CrossRef]
  27. Zheng, Y.R.; Xie, Z.X.; Robert, C.; Jiang, L.H.; Shimizu, H. Did Climate Drive Ecosystem Change and Induce Desertification in Otindag Sandy Land, China over the Past 40 Years? J. Arid Environ. 2006, 64, 523–541. [Google Scholar] [CrossRef]
  28. Qu, S.; Wang, L.; Lin, A.; Zhu, H.; Yuan, M. What Drives the Vegetation Restoration in Yangtze River Basin, China: Climate Change or Anthropogenic Factors? Ecol. Indic. 2018, 90, 438–450. [Google Scholar] [CrossRef]
  29. Wen, Y.; Liu, X.; Pei, F.; Li, X.; Du, G. Non-Uniform Time-Lag Effects of Terrestrial Vegetation Responses to Asymmetric Warming. Agric. For. Meteorol. 2018, 252, 130–143. [Google Scholar] [CrossRef]
  30. Chen, B.; Feng, W.; Jing, X.; Wang, Y. Dryland Agricultural Expansion Leads to Lower Content and Higher Variability of Soil Inorganic Carbon in Topsoil. Agric. Ecosyst. Environ. 2023, 356, 108620. [Google Scholar] [CrossRef]
  31. Jia, L.; Wang, Y.; Ma, X.; Lu, Y.; Sheng, J.; Cheng, H. A Simulation Study of Effects of Above-Ground Drip Irrigation and Below-Ground Drip Irrigation on Growth and Biomass Allocation of Maize. J. Xinjiang Agric. Univ. 2021, 44, 235–240. (In Chinese) [Google Scholar]
  32. Li, Z.; Zhang, R.; Lai, D.; Yan, Z.; Jiang, L.; Tian, C. Effects of drip irrigation with plastic mulching on the net primary productivity, soil heterotrophic respiration, and net CO2 exchange flux of cotton field ecosystem in Xinjiang, Northwest China. Chin. J. Appl. Ecol. 2012, 23, 1018–1024. (In Chinese) [Google Scholar] [CrossRef]
  33. Ma, A.; Yu, G.; He, N.; Wang, Q.; Peng, S. Above and below ground biomass relationships in China‘s grassland vegetation. Quat. Sci. Rev. 2014, 34, 769–776. (In Chinese) [Google Scholar]
  34. Ning, J.; Liu, J.; Kuang, W.; Xu, X.; Zhang, S.; Yan, C.; Li, D.; Wu, S.; Hu, Y.; Du, G.; et al. Spatiotemporal patterns and characteristics of land-use change in China during 2010–2015. J. Geogr. Sci. 2018, 28, 547–562. (In Chinese) [Google Scholar] [CrossRef]
  35. He, Q.; Xie, Y. Research on the climatological calculation method of solar radiation in China. J. Nat. Resour. 2010, 25, 308–319. (In Chinese) [Google Scholar]
  36. Zeng, Z.; Yang, H.; Ning, Q.; Tang, H. Temporal and spatial evolution of land use intensity and its impact on ecosystem services in Dongting lake zone. J. Econ. Geogr. 2022, 42, 176–185. (In Chinese) [Google Scholar] [CrossRef]
  37. Zhuang, D.; Liu, J. Study on the model of regional differentiation of land use degree in China. J. Nat. Resour. 1997, 12, 10–16. (In Chinese) [Google Scholar]
  38. Li, H.; Wang, Q.; Wang, J.; Song, S.; Xu, D. Landscape stability dynamics and their driving forces in core area of Ejina oasis from 2013 to 2020. Bull. Soil Water Conserv. 2022, 42, 268–276. (In Chinese) [Google Scholar] [CrossRef]
  39. Zhang, X.; Wang, Z. Evaluation and characteristic analysis of urban landscape stability in karst mountainous cities in the central Guizhou Province. Acta Ecol. Sin. 2022, 42, 5243–5254. (In Chinese) [Google Scholar]
  40. Zhang, J.; Liu, Y.; Zhang, E.; Chen, J.; Tan, Q. Dynamics and driving mechanisms of cultivated land at county level in China. Acta Geogr. Sin. 2023, 78, 2105–2127. (In Chinese) [Google Scholar]
  41. Zhang, X.; Wang, X.; Zhou, Z.; Li, M.; Jing, C. Spatial Quantitative Model of Human Activity Disturbance Intensity and Land Use Intensity Based on GF-6 Image, Empirical Study in Southwest Mountainous County, China. Remote Sens. 2022, 14, 4574. [Google Scholar] [CrossRef]
  42. Claire, L.; Christoph, P.; Karl-Heinz, E.; Maud, M. Linking the human appropriation of net primary productivity-based indicators, input cost and high nature value to the dimensions of land-use intensity across french agricultural landscapes. Agric. Ecosyst. Environ. 2019, 283, 106565. [Google Scholar] [CrossRef]
  43. Mattias, G.; Vassilis, A.; Giuseppe, C.; Elisa, A. Land use intensification rather than land cover change affects regulating services in the mountainous Adige river basin (Italy). Ecosyst. Serv. 2020, 45, 101158. [Google Scholar] [CrossRef]
  44. Laura, R.; Brendan, C.; Adrian, M.; Ole, M.; Unai, P.; Esteve, C.; Neil, D.; Janet, F.; Phil, F.; Casey, R. Social-ecological outcomes of agricultural intensification. Nat. Sustain. 2018, 1, 275–282. [Google Scholar] [CrossRef]
  45. Sun, L.; Zhang, B.; Zhang, J.; Jin, S.; Ma, Z. Ecological benefit of land use/cover change in endorheic drainage—A case study on the middle and lower reacher of Shule River. J. Arid. Land 2013, 27, 80–85. (In Chinese) [Google Scholar] [CrossRef]
  46. Feng, X.; Li, Y.; Yu, E.; Yang, J.; Wang, S.; Ma, J. Spatiotemporal pattern and coordinating development characteristics of carbon emission performance and land use intensity in the Yangtze river delta urban agglomeration. Trans. Chin. Soc. Agric. Eng. 2023, 39, 208–218. (In Chinese) [Google Scholar] [CrossRef]
  47. Ma, L.; Cheng, W.; Bo, J.; Li, X.; Gu, Y. Spatio-Temporal Variation of Land-Use Intensity from a Multi-Perspective—Taking the Middle and Lower Reaches of Shule River Basin in China as an Example. Sustainability 2018, 10, 771. [Google Scholar] [CrossRef]
  48. Han, D.; Currell, M.; Cao, G.; Hall, B. Alterations to groundwater recharge due to anthropogenic landscape change. J. Hydrol. 2017, 554, 545–557. [Google Scholar] [CrossRef]
  49. Liu, Q.; Yang, Z.; Shi, H.; Wang, Z. Ecological risk assessment of geohazards in natural world heritage sites: An empirical analysis of Bogda, Tianshan. Open Geosci. 2019, 11, 327–340. [Google Scholar] [CrossRef]
  50. Monica, T.; William, R.; Robert, G.; Robert, V.; O’Neill; Timothy, K. A revised concept of landscape equilibrium: Disturbance and stability on scaled landscapes. Landsc. Ecolog. 1993, 8, 213–227. [Google Scholar] [CrossRef]
  51. Lin, X.; Zhen, S.; Zhao, Q.; Hu, X. A New Paradigm for Assessing Detailed Dynamics of Forest Landscape Fragmentation. Forests 2024, 15, 1212. [Google Scholar] [CrossRef]
  52. Liu, F.; Cao, L.; Jia, J.; Gong, H.; Qi, X.; Xu, X. Effects of land use changes on the nonlinear trends of net primary productivity in arid and semiarid areas, China. Land Degrad. Dev. 2021, 32, 2183–2196. [Google Scholar] [CrossRef]
  53. Xiao, X.; Li, X.; Jiang, T.; Tan, M.; Hu, M.; Liu, Y.; Zeng, W. Response of net primary production to land use and climate changes in the middle-reaches of the heihe river basin. Ecol. Evol. 2019, 9, 4651–4666. [Google Scholar] [CrossRef] [PubMed]
  54. Teng, M.; Zeng, L.; Hu, W.; Wang, P.; Yan, Z.; He, W.; Huang, Z.; Xiao, W. The impacts of climate changes and human activities on net primary productivity vary across an ecotone zone in Northwest China. Sci. Total Environ. 2020, 714, 136691. [Google Scholar] [CrossRef]
  55. Jiang, Y.; Guo, J.; Peng, Q.; Guan, Y.; Zhang, Y.; Zhang, R. The effects of climate factors and human activities on net primary productivity in Xinjiang. Int. J. Biometeorol. 2020, 64, 765–777. [Google Scholar] [CrossRef] [PubMed]
  56. Li, Z.; Pan, J. Spatiotemporal changes in vegetation net primary productivity in the arid region of Northwest China, 2001 to 2012. Front. Earth Sci. 2018, 12, 108–124. [Google Scholar] [CrossRef]
  57. Bao, G.; Bao, Y.; Qin, Z.; Xin, X.; Bao, Y.; Bayarsaikan, S.; Zhou, Y.; Chuntai, B. Modeling net primary productivity of terrestrial ecosystems in the semi-arid climate of the Mongolian Plateau using LSWI-based CASA ecosystem model. Int. J. Appl. Earth Obs. Geoinf. 2016, 46, 84–93. [Google Scholar] [CrossRef]
  58. Sun, B.; Li, Z.; Gao, Z.; Gao, W.; Zhang, Y.; Ding, X.; Li, C. NPP estimation using time-series GF-1 data in sparse vegetation area. In Proceedings of the IGARSS 2018–2018 IEEE International Geoscience and Remote Sensing Symposium, Valencia, Spain, 22–27 July 2018; pp. 3979–3982. [Google Scholar] [CrossRef]
  59. Sun, F.; Wang, Y.; Sun, J.; Li, S.; Chen, B. Spatial⁃temporal variation and influencing factors of vegetation carbon use efficiency in mountain ecosystem on the northern slope of Tianshan Mountain. Chin. J. Ecol. 2024, 43, 2923–2931. (In Chinese) [Google Scholar] [CrossRef]
  60. Song, Y.; Wang, J.; Ge, Y.; Xu, C. An optimal parameters-based geographical detector model enhances geographic characteristics of explanatory variables for spatial heterogeneity analysis: Cases with different types of spatial data. GIScience Remote Sens. 2020, 57, 593–610. [Google Scholar] [CrossRef]
  61. Thomas, K.; Sarah, M.; Matthew, F.; Simone, G.; Helmut, H.; Thomas, H.; Fridolin, K.; Gitta, L.; Maria, N.; Chistoph, P.; et al. Land use intensification increasingly drives the spatiotemporal patterns of the global human appropriation of net primary production in the last century. Glob. Chang. Biol. 2022, 28, 307–322. [Google Scholar] [CrossRef]
  62. Zhao, Y.; Wang, L.; Jiang, Q.; Wang, Z. Sensitivity of gross primary production to precipitation and the driving factors in China’s agricultural ecosystems. Sci. Total Environ. 2024, 948, 174938. [Google Scholar] [CrossRef]
  63. Nattasit, S.; Warong, W.; Janjira, S. Smart Urban Forest Initiative: Nature-Based Solution and People-Centered Approach for Tree Management in Chiang Mai, Thailand. Sustainability 2024, 16, 11078. [Google Scholar] [CrossRef]
  64. Marco, F.; Desirée, M.; Federico, R.; Mirko, F.; Beatrice, C.; Alessia, G.; Chiara, P.; Luigia, R.; Fabio, O. CO2 Emission Compensation by Tree Species in Some Urban Green Areas. Sustainability 2024, 16, 3515. [Google Scholar] [CrossRef]
  65. Dan, X.; He, M.; Meng, L.; He, X.; Wang, X.; Chen, S.; Cai, Z.; Zhang, J.; Zhu, B.; Christoph, M. Strong rhizosphere priming effects on N dynamics in soils with higher soil N supply capacity: The ‘Matthew effect’ in plant-soil systems. Soil Biol. Biochem. 2023, 178, 108949. [Google Scholar] [CrossRef]
  66. Bhattacharyya, S.; Furtak, K. Soil–Plant–Microbe Interactions Determine Soil Biological Fertility by Altering Rhizospheric Nutrient Cycling and Biocrust Formation. Sustainability 2023, 15, 625. [Google Scholar] [CrossRef]
Figure 1. (ac) Overview of the Sangong River basin. Note: The base map is based on the standard map of China. The base map was sourced from the website http://bzdt.ch.mnr.gov.cn/ under map certification GS(2023)2766, with no alterations to its cartographic boundaries.
Land 14 00650 g001
Figure 2. Change in land use area proportion by land use type in the Sangong River Basin.
Land 14 00650 g002
Figure 3. LUI in the Sangong River Basin.
Land 14 00650 g003
Figure 4. (a) Changes in the proportion of areas with different LUI. (b) Trends in changes in LUI.
Land 14 00650 g004
Figure 5. (a) Changes in the proportion of areas with different LS. (b) Trends in the changes in LS.
Land 14 00650 g005
Figure 6. (a) Distribution of NPP in the Sangong River Basin, 1990–2020. (b) Trends in NPP changes in the mountain, the basin, and the plain. (c) Trend of Theil–Sen median of NPP. (d) Mann–Kendall significance test for NPP change trends.
Land 14 00650 g006
Figure 7. Interannual variations in NPP across various land use types in the Sangong River Basin. Note: The letters (ae) in the figure represent cropland, forest, grassland, urban land, and unused land, respectively. The letter (f) in the figure represents NPP variations across different land use types.
Land 14 00650 g007
Figure 8. (a) Relationship between NPP and soil salinity. (b) Relationship between NPP and soil organic matter.
Land 14 00650 g008
Figure 9. (a) Relationship between NPP and precipitation. (b) The relationship between NPP and temperature.
Land 14 00650 g009
Table 1. Different types of driving factors.
Factor TypeDriving FactorUnit
Human activity factorsLand use intensity (LUI)%
Landscape stability (LS)/
Climate factorsAnnual average temperature (TMP)°C
Annual average precipitation (PRE)mm
Soil environmental factorsTotal soil salt (TS)kg·m−1
Soil organic matter (OM)kg·m−1
Soil pH (pH)/
Table 2. Detection results for driving factors in different areas in Sangong River Basin.
AreaContribution of Driving Factors (%)
LUILSTMPPRETSOMpH
a25.8532.2631.0223.198.462.44.11
b31.4418.36//30.363.923.6
c40.1751.971.2752//6.46
d21.6518.95//32.482.832.04
e5.72///3.498.613.36
f5.65/57.1919.86///
g3.411.0614.6212.45/8.215.27
h7.76/10.4423.04///
Note: In the table, a, b, c, d, e, f, g, and h are different regions of the study area, including the whole basin, plain, mountains, artificial vegetation area in the plain, natural vegetation area in the plain, low mountain grassland zone, middle mountain forest zone, and subalpine and alpine meadow zone, respectively.
Table 3. NDVImax, NDVImin, SRmax, and SRmin of different land use types in the Sangong River Basin.
Land Use TypeNDVImaxNDVIminSRmaxSRmin
Cropland0.92 0.09 27.57 1.19
Forest0.93 0.09 24.00 1.20
Grassland0.65 0.04 4.71 1.07
Urban land0.71 0.02 5.90 1.05
Water area0.54 0.06 3.35 1.12
Unuse land0.41 0.02 2.39 1.04
Disclaimer/Publisher’s Note: The statements, opinions and data contained in all publications are solely those of the individual author(s) and contributor(s) and not of MDPI and/or the editor(s). MDPI and/or the editor(s) disclaim responsibility for any injury to people or property resulting from any ideas, methods, instructions or products referred to in the content.

