
Obtaining a Land Use/Cover Cartography in a Typical Mediterranean Agricultural Field Combining Unmanned Aerial Vehicle Data with Supervised Classifiers


Abstract
1. Introduction
2. Experimental Set-Up
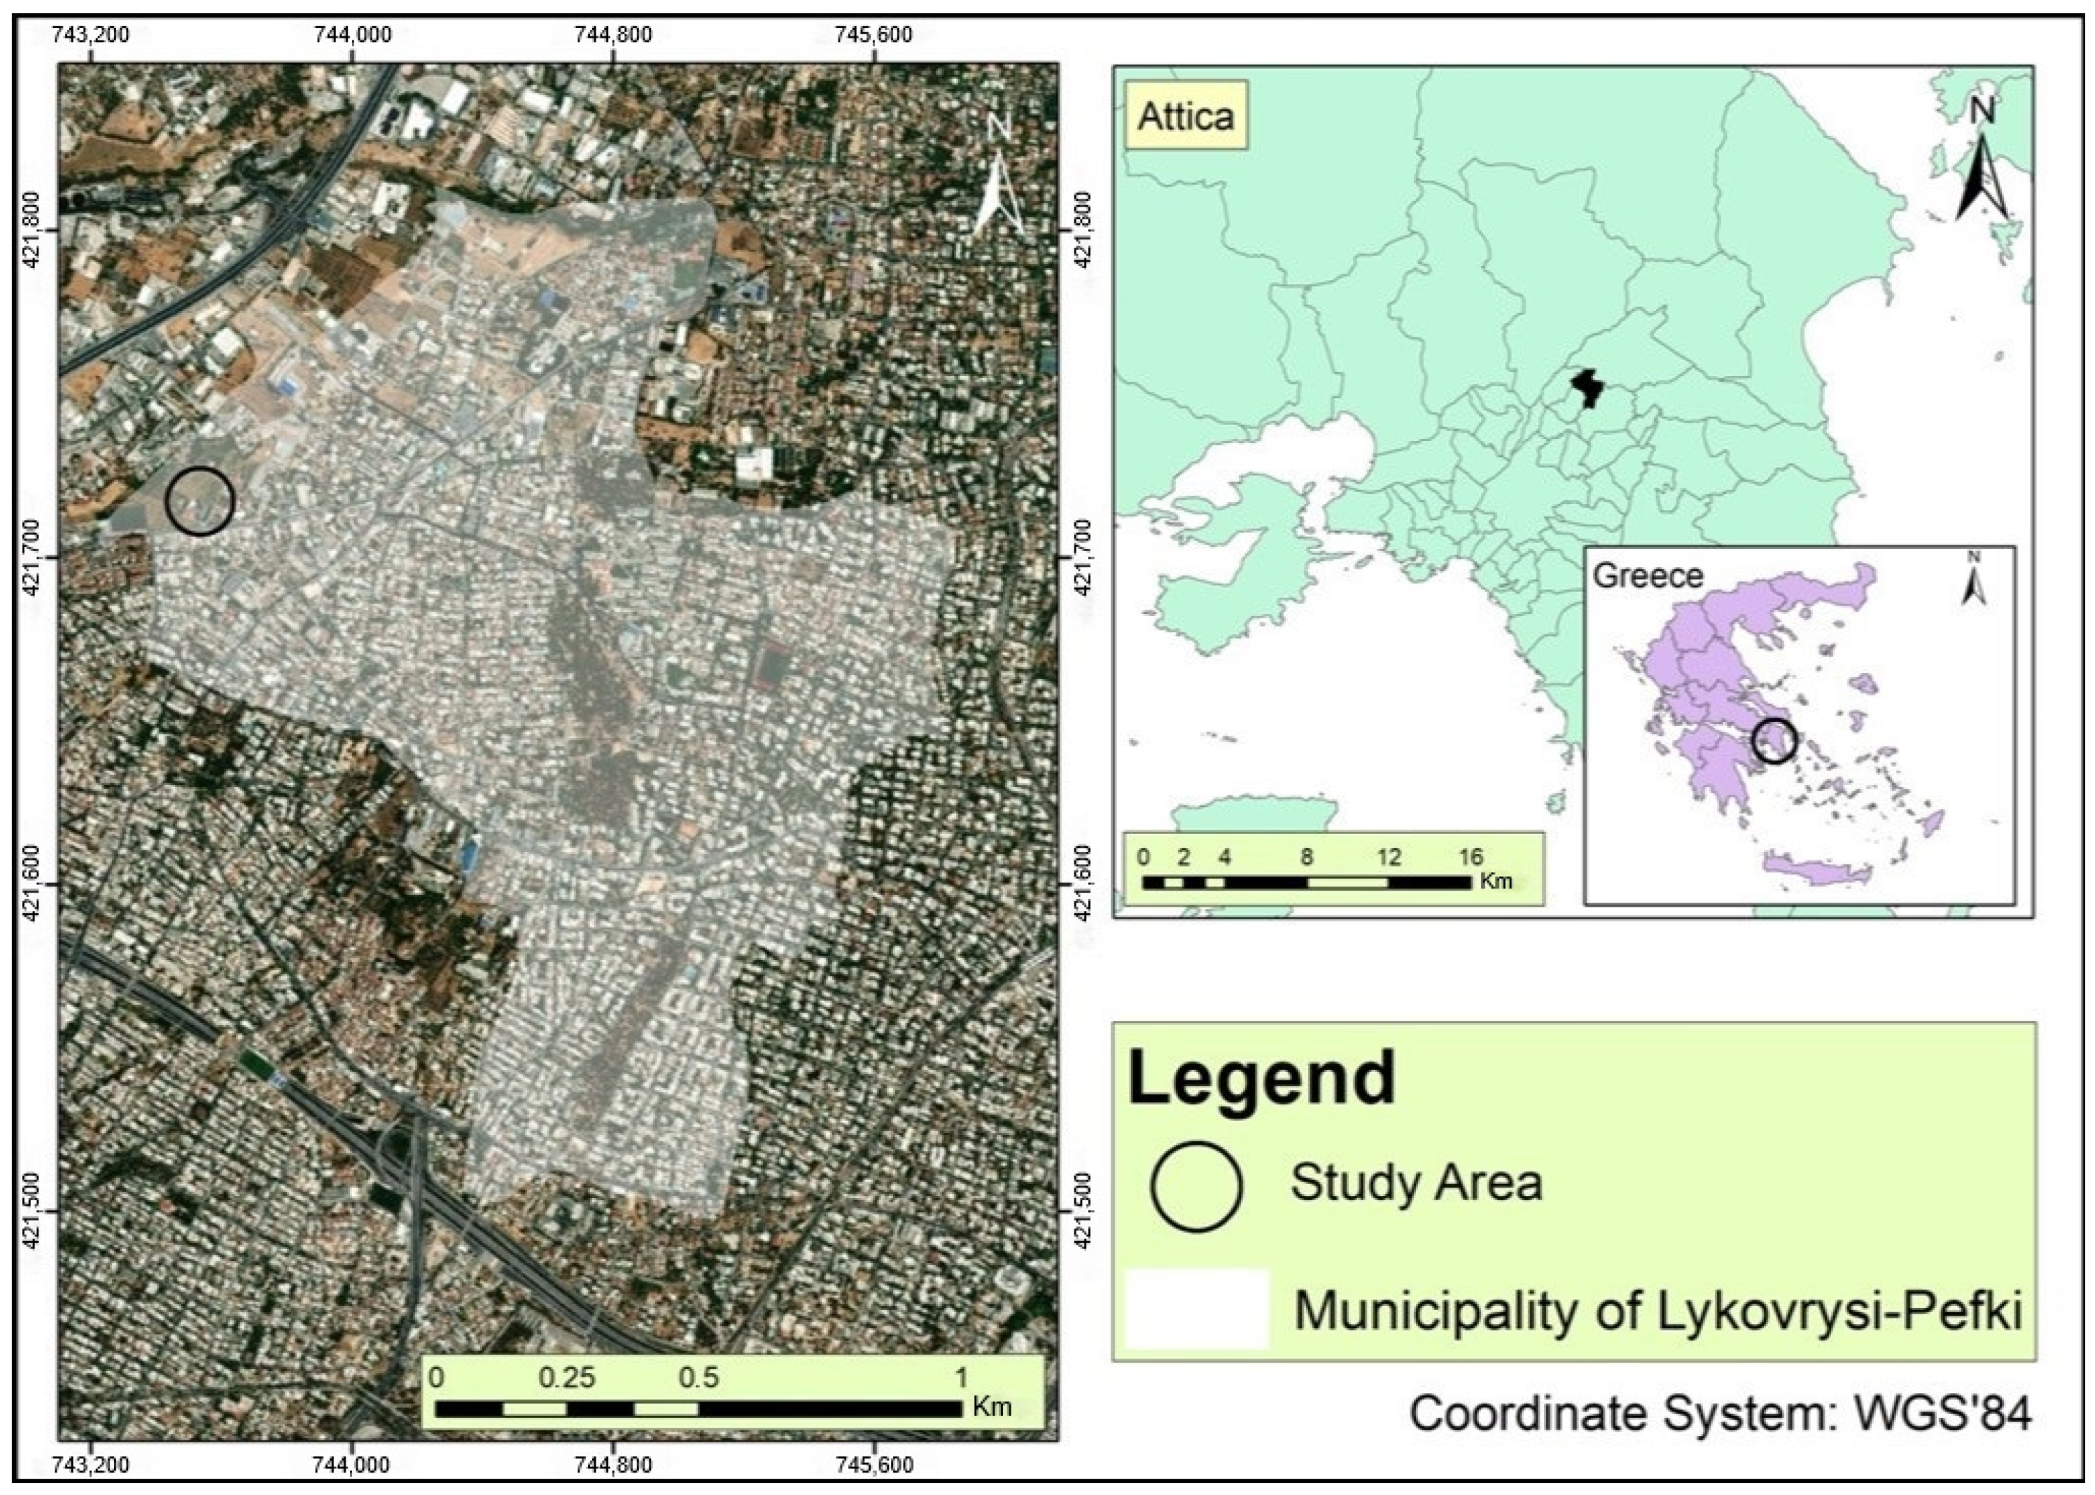
2.1. Study Area
2.2. Datasets
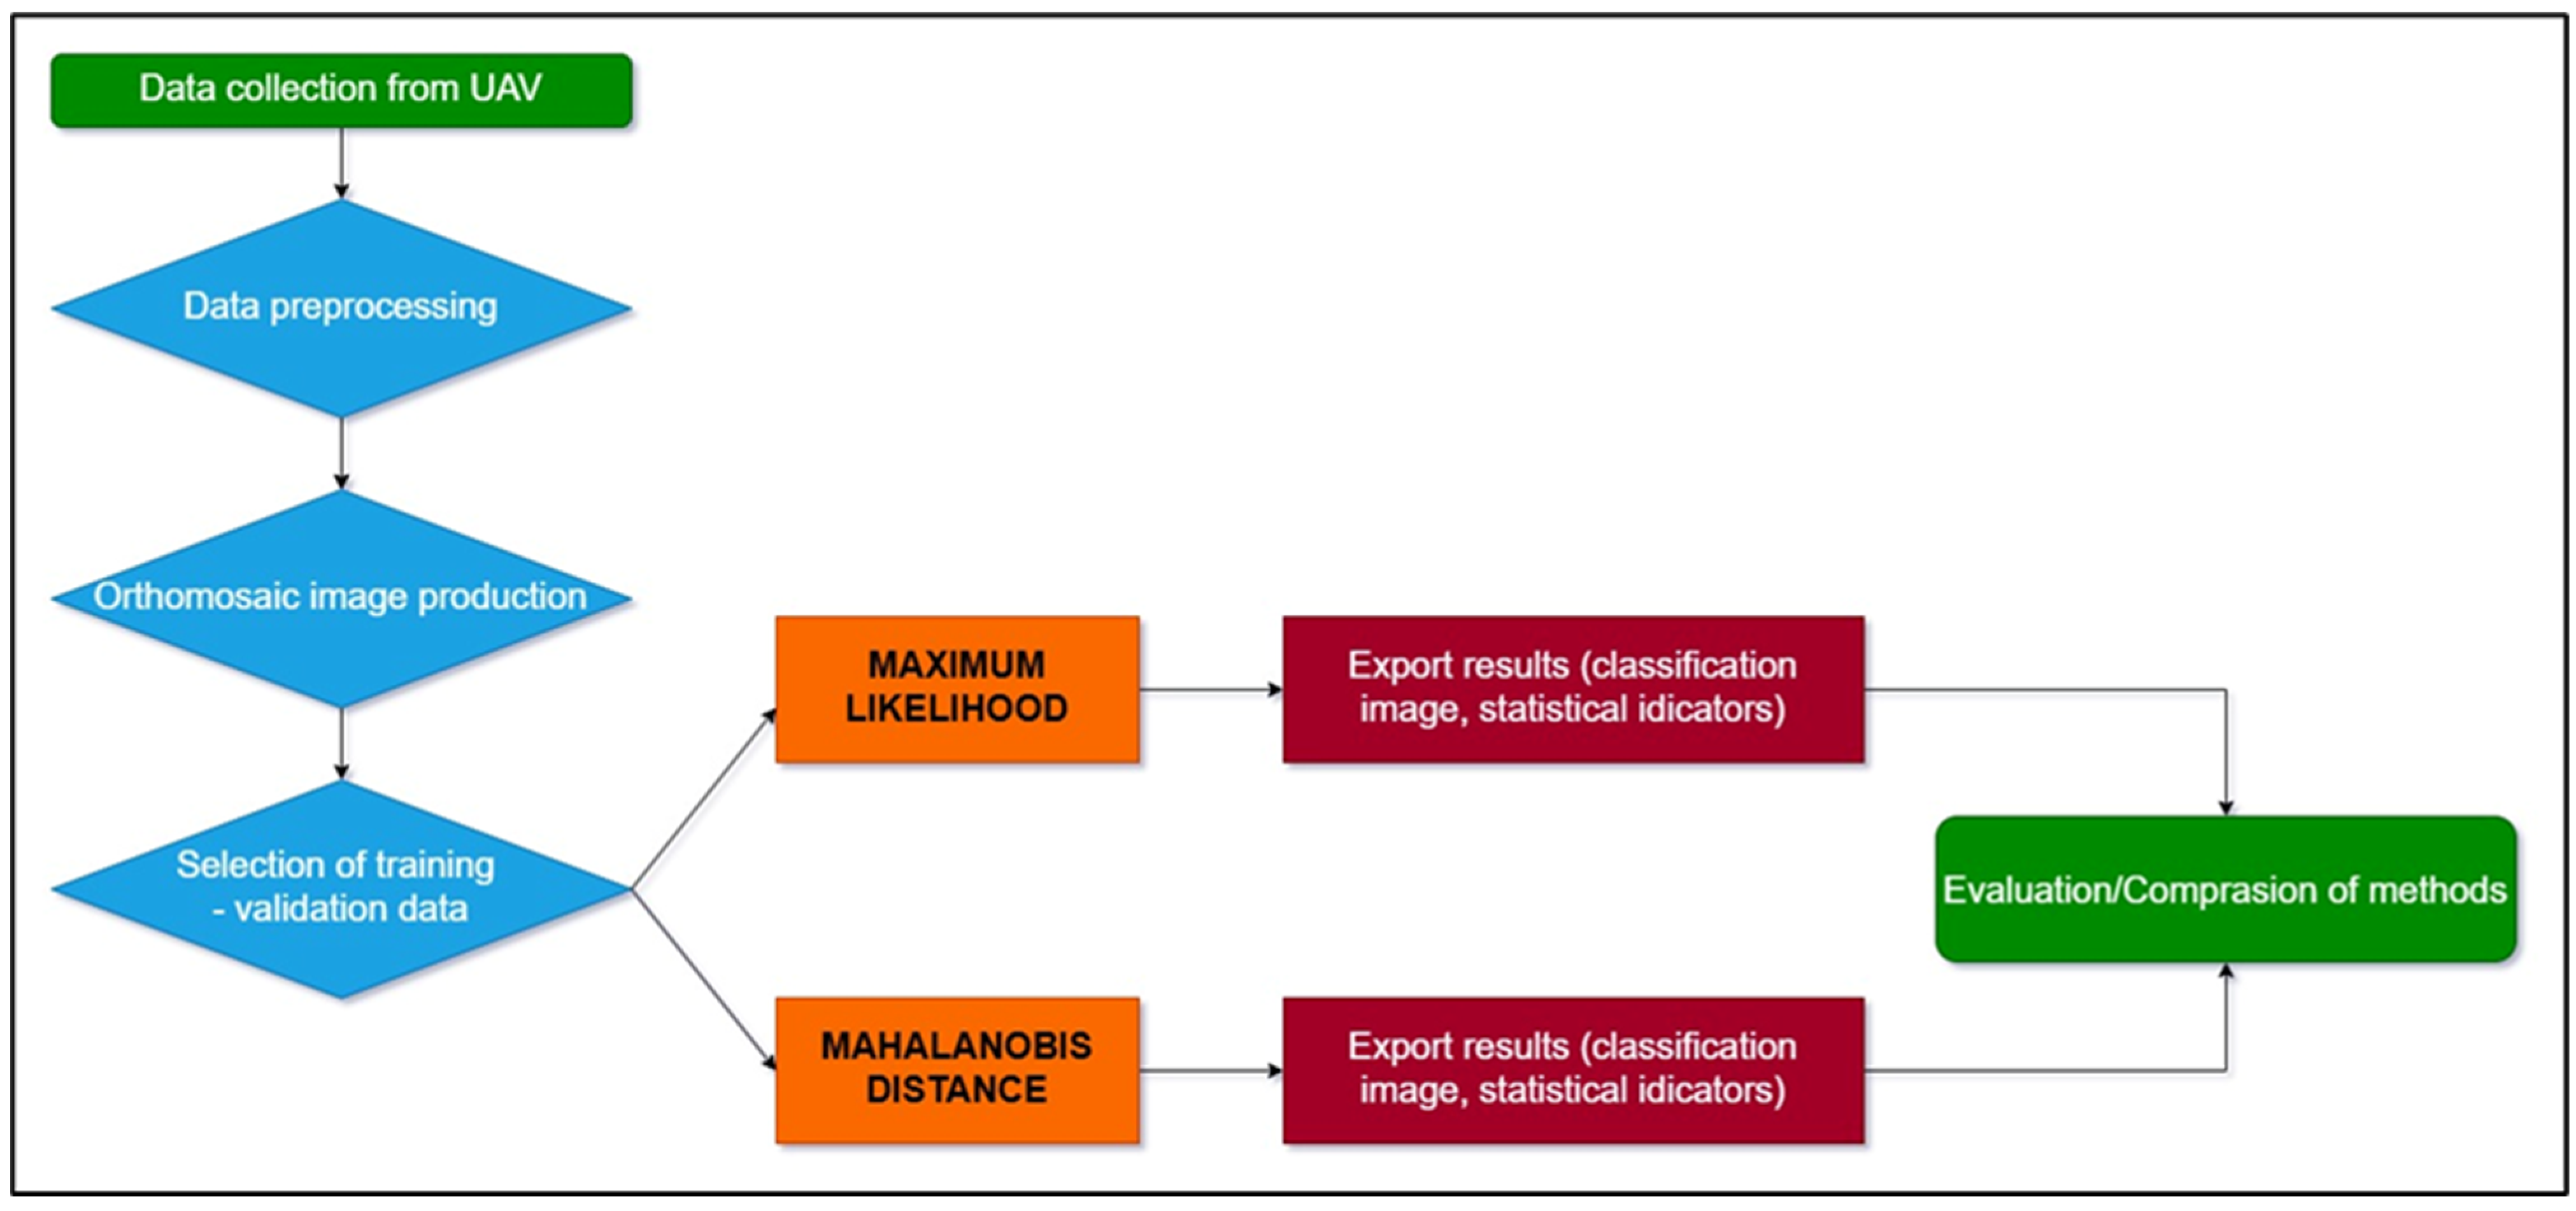
3. Methodology
3.1. Subsection
3.2. Main Processing
3.2.1. Classification Scheme Development
3.2.2. Classification Implementation
3.2.3. Accuracy Assessment
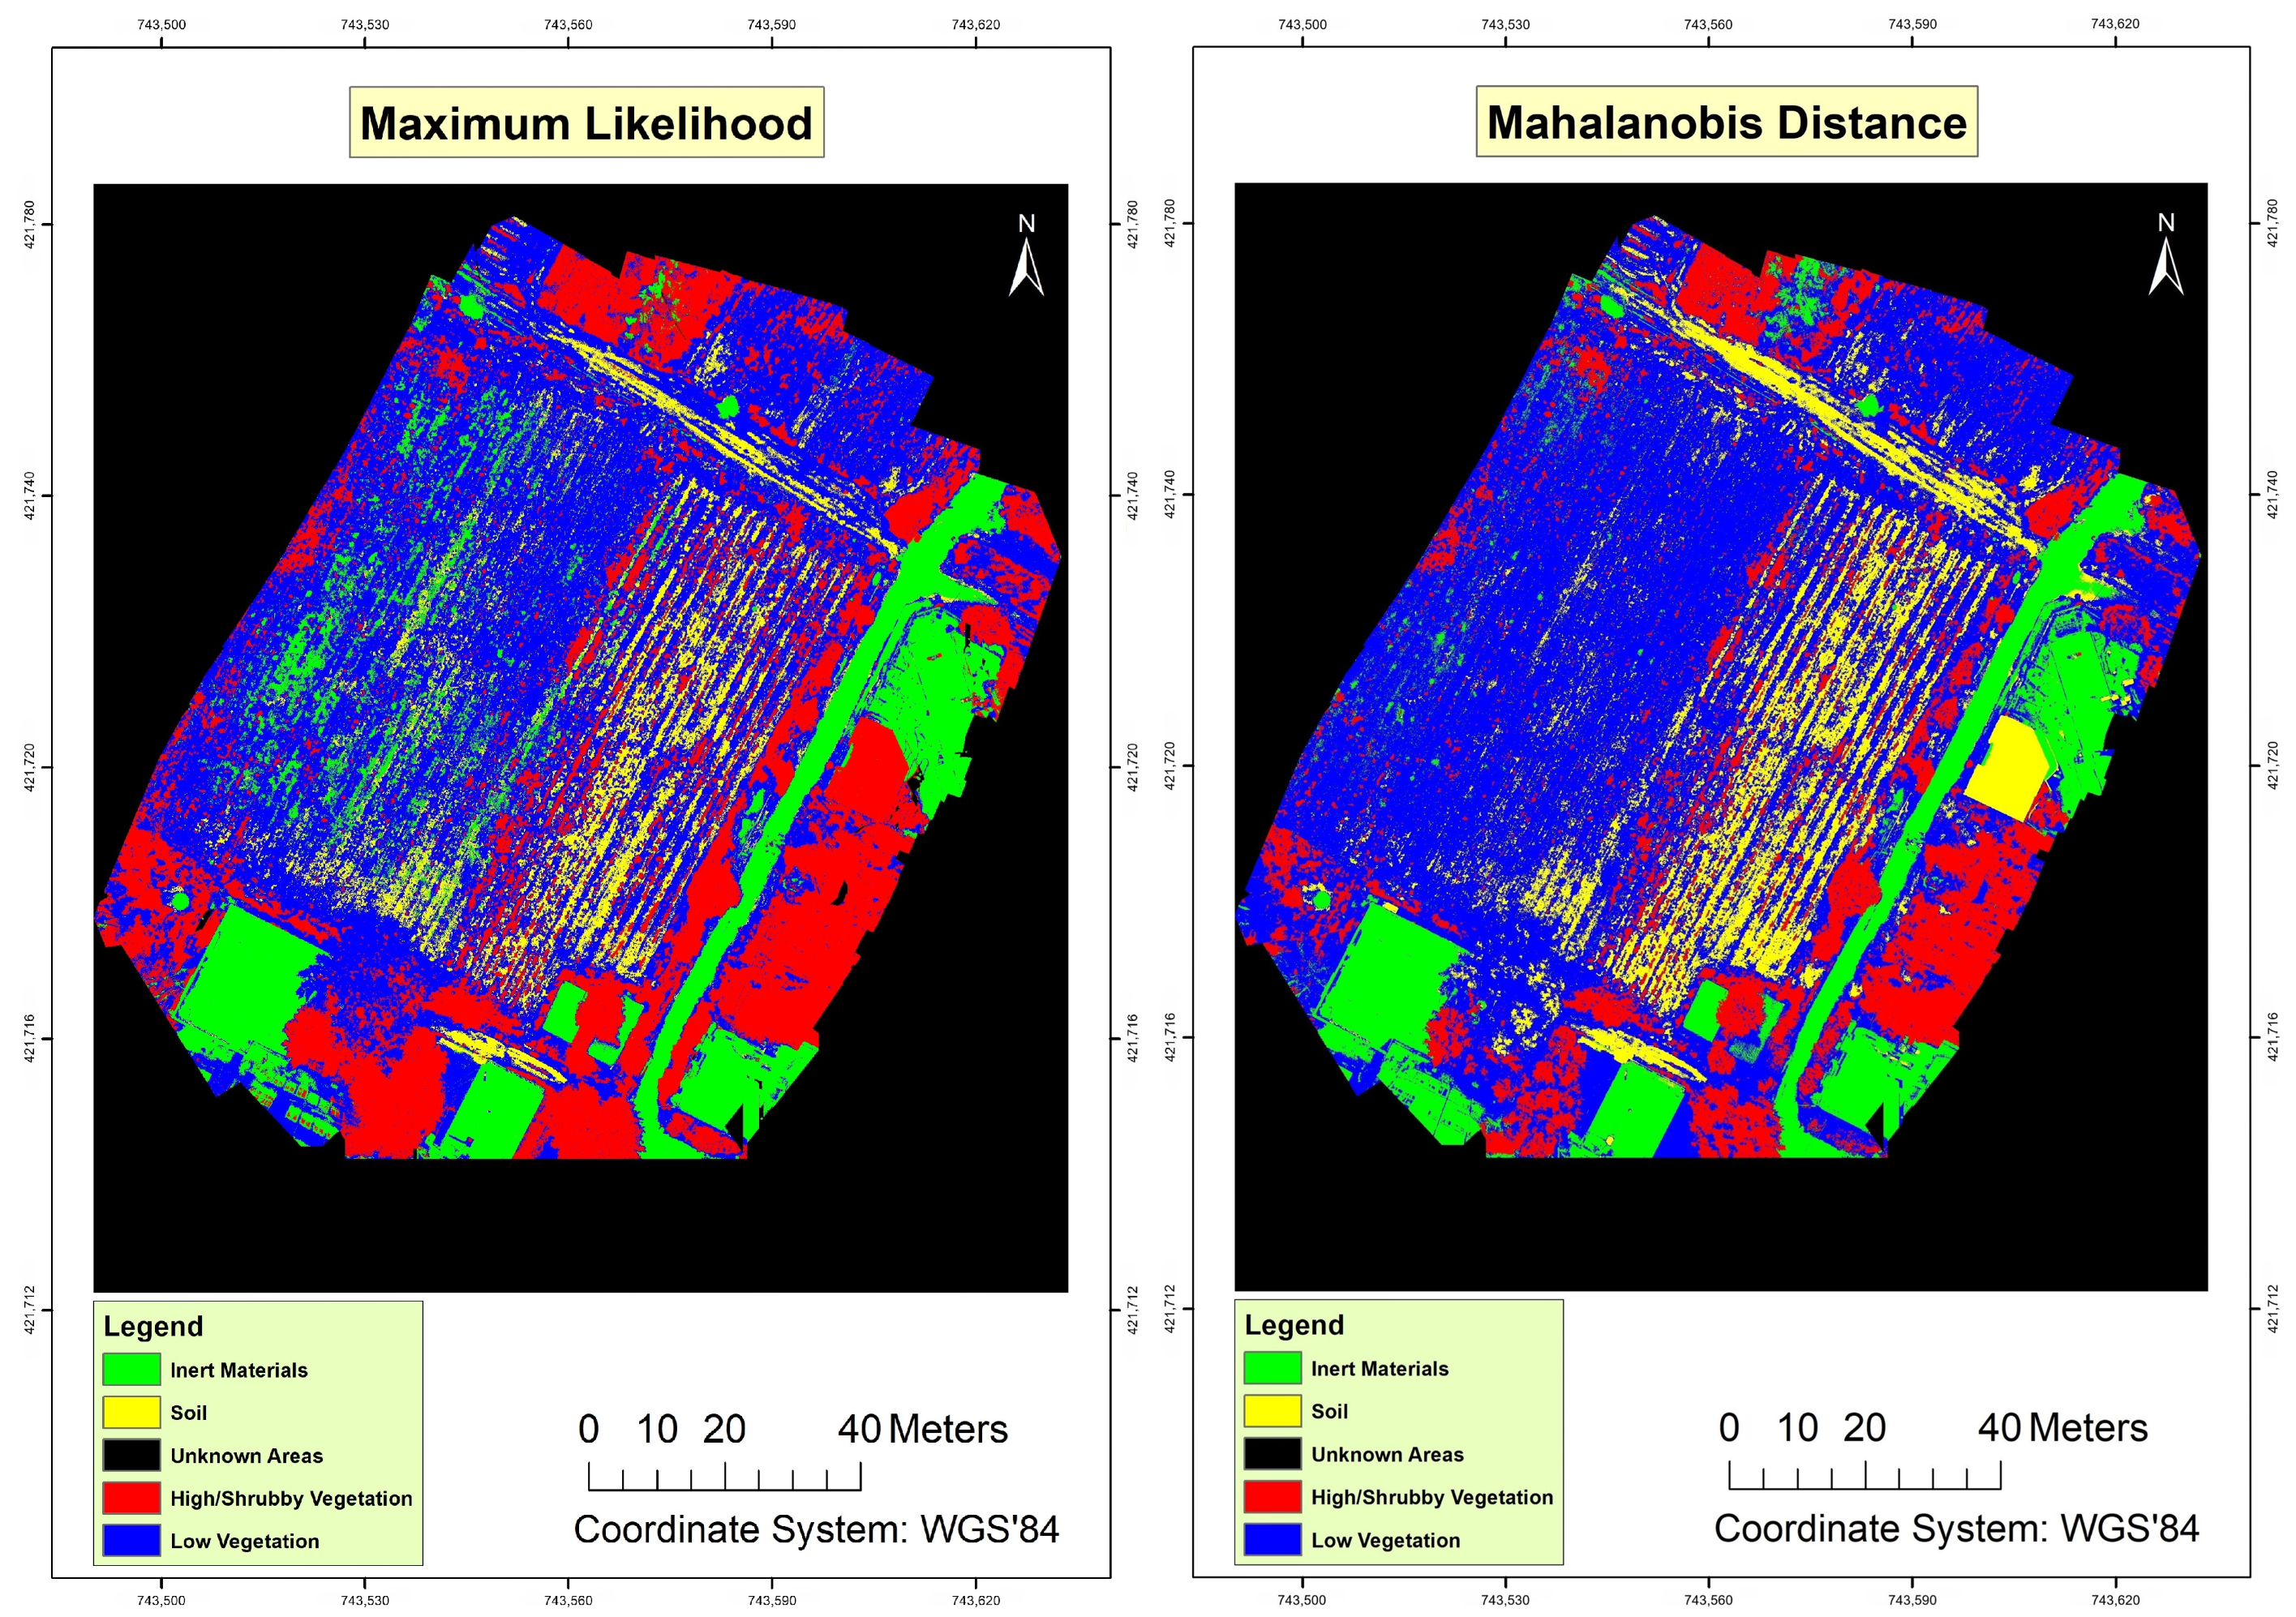
4. Results
5. Discussion
5.1. Comparison with Previous Studies
5.2. Sources of Errors and Limitations
5.3. Recommendations for Improvements and Future Research
6. Final Remarks
Author Contributions
Funding
Data Availability Statement
Conflicts of Interest
References
- Feng, Q.; Liu, J.; Gong, J. UAV Remote Sensing for Urban Vegetation Mapping Using Random Forest and Texture Analysis. Remote Sens. 2015, 7, 1074–1094. [Google Scholar] [CrossRef]
- Tsatsaris, A.; Kalogeropoulos, K.; Stathopoulos, N.; Louka, P.; Tsanakas, K.; Tsesmelis, D.E.; Krassanakis, V.; Petropoulos, G.P.; Pappas, V. Geoinformation Technologies in Support of Environmental Hazards Monitoring under Climate Change: An Extensive Review. ISPRS Int. J. Geo-Inf. 2021, 10, 94. [Google Scholar] [CrossRef]
- Dahiya, N.; Singh, G.; Gupta, D.K.; Kalogeropoulos, K.; Detsikas, S.E.; Petropoulos, G.P.; Singh, S.; Sood, V. A novel deep learning change detection approach for estimating spatiotemporal crop field variations from Sentinel-2 imagery. Remote Sens. Appl. Soc. Environ. 2024, 35, 101259. [Google Scholar] [CrossRef]
- Petropoulos, G.P.; Detsikas, S.E.; Kalogeropoulos, K.; Pavlides, A. A First Exploration of the Ts/VI “Analytical Triangle” Technique with UAV Imagery for Deriving Key Surface Energy Balance Parameters at Very High Spatial Resolution. Drones 2024, 8, 290. [Google Scholar] [CrossRef]
- Whitehead, K.; Hugenholtz, C.H.; Myshak, S.; Brown, O.; LeClair, A.; Tamminga, A.; Barchyn, T.E.; Moorman, B.; Eaton, B. Remote Sensing of the Environment with Small Unmanned Aircraft Systems (UASs), Part 2: Scientific and Commercial Applications. J. Unmanned Veh. Syst. 2014, 2, 86–102. [Google Scholar] [CrossRef]
- Sun, J.; Yuan, G.; Song, L.; Zhang, H. Unmanned Aerial Vehicles (UAVs) in Landslide Investigation and Monitoring: A Review. Drones 2024, 8, 30. [Google Scholar] [CrossRef]
- Pádua, L.; Vanko, J.; Hruška, J.; Adão, T.; Sousa, J.J.; Peres, E.; Morais, R. UAS, Sensors, and Data Processing in Agroforestry: A Review towards Practical Applications. Int. J. Remote Sens. 2017, 38, 2349–2391. [Google Scholar] [CrossRef]
- Turner, D.; Lucieer, A.; Watson, C. An Automated Technique for Generating Georectified Mosaics from Ultra-High Resolution Unmanned Aerial Vehicle (UAV) Imagery, Based on Structure from Motion (SfM) Point Clouds. Remote Sens. 2012, 4, 1392–1410. [Google Scholar] [CrossRef]
- Stöcker, C.; Bennett, R.; Nex, F.; Gerke, M.; Zevenbergen, J. Review of the Current State of UAV Regulations. Remote Sens. 2017, 9, 459. [Google Scholar] [CrossRef]
- Petropoulos, G.P.; Maltese, A.; Carlson, T.N.; Provenzano, G.; Pavlides, A.; Ciraolo, G.; Hristopulos, D.; Capodici, F.; Chalkias, C.; Dardanelli, G. Exploring the use of UAVs with the simplified ‘triangle’ technique for Soil Water Content and Evaporative Fraction retrievals in a Mediterranean setting. Int. J. Remote Sens. 2020, 42, 1623–1642. [Google Scholar] [CrossRef]
- Neyns, R.; Canters, F. Mapping of Urban Vegetation with High-Resolution Remote Sensing: A Review. Remote Sens. 2022, 14, 1031. [Google Scholar] [CrossRef]
- Lin, Y.; Hyyppä, J.; Jaakkola, A. Mini-UAV-Borne LIDAR for Fine-Scale Mapping. IEEE Geosci. Remote Sens. Lett. 2010, 8, 426–430. [Google Scholar] [CrossRef]
- Nguyen, H.T.; Lopez Caceres, M.L.; Moritake, K.; Kentsch, S.; Shu, H.; Diez, Y. Individual Sick Fir Tree (Abies mariesii) Identification in Insect Infested Forests by Means of UAV Images and Deep Learning. Remote Sens. 2021, 13, 260. [Google Scholar] [CrossRef]
- Wang, J.; Zhang, H.; Zhang, Y. Application of UAV Remote Sensing in Precision Agriculture: A Review. Remote Sens. 2021, 13, 438. [Google Scholar]
- Petropoulos, G.P.; Detsikas, S.E.; Lemesios, I.; Raj, R. Obtaining LULC distribution at 30-m resolution from Pixxel’s first technology demonstrator hyperspectral imagery. Int. J. Remote Sens. 2024, 45, 4883–4896. [Google Scholar] [CrossRef]
- Rahman, M.; Reza, H. Cost-effective monitoring of natural disasters using drones. Geospat. Sci. J. 2021, 18, 203–217. [Google Scholar]
- Kouvaras, L.; Petropoulos, G.P. A Novel Technique Based on Machine Learning for Detecting and Segmenting Trees in Very High Resolution Digital Images from Unmanned Aerial Vehicles. Drones 2024, 8, 43. [Google Scholar] [CrossRef]
- Tang, L.; Shao, G.; Ding, H. UAV Remote Sensing for Precision Agriculture: A Comparison between Different Cameras for Vegetation Monitoring. Remote Sens. 2021, 12, 1346. [Google Scholar]
- Wang, J.; Xu, Y.; Zhang, L.; Li, Z. Advancing precision agriculture with UAV-based hyperspectral imaging. J. Spectr. Imaging 2021, 10, 221–234. [Google Scholar]
- Breen, D.; Curtis, A.; Graham, J. The Use of Unmanned Aerial Systems for the Mapping of Forests and Peatlands: A Review. Remote Sens. 2020, 12, 2295. [Google Scholar]
- Jakob, S.; Zimmermann, R.; Gloaguen, R. The Need for Accurate Geometric and Radiometric Corrections of Drone-Borne Hyperspectral Data for Mineral Exploration: MEPHySTo—A Toolbox for Pre-Processing Drone-Borne Hyperspectral Data. Remote Sens. 2017, 9, 88. [Google Scholar] [CrossRef]
- Tang, H.; Liu, J.; Zhao, F. UAVs for post-disaster damage assessment: A case study on earthquake monitoring. Disaster Manag. J. 2021, 9, 43–56. [Google Scholar]
- Detsikas, S.E.; Petropoulos, G.P.; Kalogeropoulos, K.; Faraslis, I. Combining Low-Cost UAV Imagery with Machine Learning Classifiers for Accurate Land Use/Land Cover Mapping. Earth 2024, 5, 244–254. [Google Scholar] [CrossRef]
- Santos, M.J.; Fernandes, R.; Almeida, P.; Costa, L. Monitoring environmental changes with UAVs: Opportunities and challenges. Environ. Monit. Rev. 2021, 19, 245–260. [Google Scholar]
- Petropoulos, G.P.; Arvanitis, K.; Sigrimis, N. Hyperion Hyperspectral Imagery Analysis Combined With Machine Learning Classifiers for Land Use/Cover Mapping. Expert Syst. Appl. 2012, 39, 3800–3809. [Google Scholar] [CrossRef]
- Pandey, P.C.; Koutsias, N.; Petropoulos, G.P.; Srivastava, P.K.; Dor, E.B. Land Use/Land Cover in view of Earth Observation: Data Sources, Input Dimensions and Classifiers—A Review of the State of the Art. Geocarto Int. 2019, 36, 957–988. [Google Scholar] [CrossRef]
- Lekka, C.; Petropoulos, G.P.; Detsikas, S.E. Appraisal of EnMAP hyperspectral imagery use in LULC mapping when combined with machine learning pixel-based classifiers. Environ. Model. Softw. 2024, 173, 105956. [Google Scholar] [CrossRef]
- Goodfellow, I.; Bengio, Y.; Courville, A. Deep Learning; MIT Press: Cambridge, MA, USA, 2016. [Google Scholar]
- Zhang, L.; Zhang, L.; Du, B. Deep Learning for Remote Sensing Data: A Technical Tutorial on the State of the Art. IEEE Geosci. Remote Sens. Mag. 2018, 4, 22–40. [Google Scholar] [CrossRef]
- McRoberts, R.E.; Stehman, S.V. The effects of imperfect reference data on remote sensing-assisted estimators of land cover class proportions. Remote Sens. Environ. 2014, 141, 90–98. [Google Scholar] [CrossRef]
- Otukei, J.R.; Blaschke, T. Land Cover Change Assessment Using Decision Trees, Support Vector Machines and Maximum Likelihood Classification Algorithms. Int. J. Appl. Earth Obs. Geoinf. 2020, 12, S27–S31. [Google Scholar] [CrossRef]
- Ahamed, T.; Patel, N. Remote Sensing Applications in Land Use and Cover Change Detection Using MLC and MDC. Springer Environ. Stud. 2022, 10, 321–340. [Google Scholar]
- Russell, S.; Norvig, P. Artificial Intelligence: A Modern Approach, 4th ed.; Pearson: New York, NY, USA, 2021. [Google Scholar]
- Amani, P.J.; Hurtig, A.-K.; Frumence, G.; Kiwara, A.D.; Goicolea, I.; San Sebastián, M. Health insurance and health system (un)responsiveness: A qualitative study with elderly in rural Tanzania. BMC Health Serv. Res. 2021, 21, 1140. [Google Scholar] [CrossRef] [PubMed]
- Ban, Y.; Jacob, A. Object-Based Fusion of Multitemporal Multi-Angle ENVISAT ASAR and HJ-1B Multispectral Data for Urban Land-Cover Mapping. IEEE Trans. Geosci. Remote Sens. 2018, 56, 2837–2848. [Google Scholar]
- Wang, Y.; Yao, Q.; Kwok, J.T.; Ni, L.M. Generalizing from a few examples: A survey on few-shot learning. ACM Comput. Surv. 2020, 53, 1–34. [Google Scholar] [CrossRef]
- Sefercik, U.G.; Kavzoglu, T.; Colkesen, I.; Adali, S.; Dinc, S.; Nazar, M.; Ozturk, M.Y. Land Cover Classification Performance of Multispectral RTK UAVs. Int. Arch. Photogramm. Remote Sens. Spatial Inf. Sci. 2021, XLVI-4/W5-2021, 489–492. [Google Scholar] [CrossRef]
- He, K.; Zhang, X.; Ren, S.; Sun, J. Deep Residual Learning for Image Recognition. In Proceedings of the IEEE Conference on Computer Vision and Pattern Recognition (CVPR), Vancouver, BC, Canada, 18–22 June 2023; pp. 770–778. [Google Scholar]
- Dapke, P.; Syed, A.; Nagare, S.; Bandal, S.; Baheti, M. A Comparative Analysis of Machine Learning Techniques for LULC Classification Using Landsat-8 Satellite Imagery. Int. J. Eng. Geosci. 2025, 10, 84–92. [Google Scholar] [CrossRef]
- Campbell, J.B.; Wynne, R.H. Introduction to Remote Sensing, 5th ed.; Guilford Press: New York, NY, USA, 2011. [Google Scholar]
- Manfreda, S.; McCabe, M.F.; Miller, P.E.; Lucas, R.; Madrigal, V.P.; Mallinis, G.; Ben Dor, E.; Helman, D.; Estes, L.; Ciraolo, G.; et al. On the Use of Unmanned Aerial Systems for Environmental Monitoring. Remote Sens. 2018, 10, 641. [Google Scholar] [CrossRef]
- Bendig, J.; Bolten, A.; Bareth, G. UAV-Based Imaging for Multi-Temporal, Very High Resolution Crop Surface Models to Monitor Crop Growth Variability. Photogramm.–Fernerkund.–Geoinf. 2019, 2013, 551–562. [Google Scholar] [CrossRef]
- Rahman, M.; Reza, H. Evaluating Spectral Separability in UAV-Based Land Cover Classification. Int. J. Appl. Earth Obs. 2022, 18, 102–118. [Google Scholar]
- Lisein, J.; Pierrot-Deseilligny, M.; Bonnet, S.; Lejeune, P. A Photogrammetric Workflow for the Creation of a Forest Canopy Height Model from Small Unmanned Aerial System Imagery. Forests 2013, 4, 922–944. [Google Scholar] [CrossRef]
- Nevalainen, P.; Middleton, M.; Sutinen, R.; Heikkonen, J.; Pahikkala, T. Detecting Terrain Stoniness From Airborne Laser Scanning Data. Remote Sens. 2016, 8, 720. [Google Scholar] [CrossRef]
- Congalton, R.G. A Review of Assessing the Accuracy of Classifications of Remotely Sensed Data. Remote Sens. Environ. 1991, 37, 35–46. [Google Scholar] [CrossRef]
- Santos, T.T.; Messias, C.G.; Moreira, M.A. Assessment of Vegetation Indices for Estimating the Leaf Area Index of Coffee Crops Using Landsat 8 Images. Remote Sens. Appl. Soc. Environ. 2021, 22, 100482. [Google Scholar]
- Akram, M.W.; Vannucci, M.; Buttazzo, G.; Colla, V.; Roccella, S.; Vannini, A.; Caruso, G.; Nesi, S.; Francini, A.; Sebastiani, L. Automating grapevine LAI features estimation with UAV imagery and machine learning. arXiv 2024, arXiv:2411.17897. [Google Scholar]
- Xie, J.; Shen, Y.; Cen, H. Real-time Reflectance Generation for UAV Multispectral Imagery using an Onboard Downwelling Spectrometer in Varied Weather Conditions. arXiv 2024, arXiv:2412.19527. [Google Scholar]
- Gitelson, A.A.; Viña, A.; Arkebauer, T.J.; Rundquist, D.C.; Keydan, G.; Leavitt, B. Remote Estimation of Leaf Area Index and Green Leaf Biomass in Maize Canopies. Geophys. Res. Lett. 2017, 30, 1248. [Google Scholar] [CrossRef]
- Congalton, R.; Green, K. Assessing the Accuracy of Remotely Sensed Data: Principles and Practices; CRC/Lewis Press: Boca Raton, FL, USA, 1999; 137p. [Google Scholar]
- Johnson, M.P.; Lee, S.H. Visual Assessment of Land Cover Maps Derived from High-Resolution Imagery. Int. J. Appl. Earth Obs. Geoinf. 2021, 102, 102456. [Google Scholar]
- Lamine, S.; Petropoulos, G.P.; Singh, S.K.; Szabo, S.; Bachari, N.; Srivastava, P.K.; Suman, S. Quantifying Land Use/land Cover Spatio-temporal Landscape Pattern Dynamics from Hyperion Using SVMs Classifier and FRAGSTATS. Geocarto Int. 2018, 33, 862–878. [Google Scholar] [CrossRef]
- Fragou, S.; Kalogeropoulos, K.; Stathopoulos, N.; Louka, P.; Srivastava, P.K.; Karpouzas, S.; Kalivas, D.P.; Petropoulos, G.P. Quantifying Land Cover Changes in a Mediterranean Environment Using Landsat TM and Support Vector Machines. Forests 2020, 11, 750. [Google Scholar] [CrossRef]
- Smith, J.A.; Brown, L.M.; Davis, K.R. Evaluating Land Use Classification Accuracy Using UAV Data: A Case Study. Remote Sens. 2022, 14, 1234. [Google Scholar]
- Stavrakoudis, D.; Gitas, I.Z. Object-Based Burned Area Mapping with Extreme Gradient Boosting Using Sentinel-2 Imagery. J. Geogr. Inf. Syst. 2023, 15, 53–72. [Google Scholar] [CrossRef]
- Colomina, I.; Molina, P. Unmanned Aerial Systems for Photogrammetry and Remote Sensing: A Review. ISPRS J. Photogramm. Remote Sens. 2014, 92, 79–97. [Google Scholar] [CrossRef]
- Zhu, X.; Tuia, D.; Mou, L.; Xia, G.-S.; Zhang, L.; Xu, F.; Fraundorfer, F. Deep learning in remote sensing: A comprehensive review and roadmap. IEEE Geosci. Remote Sens. Mag. 2017, 5, 8–36. [Google Scholar] [CrossRef]
- Osco, L.P.; Marcato, J., Jr.; Ramos, A.P.M.; Jorge, L.A.C.; Fatholahi, S.N.; Silva, J.A.; Matsubara, E.T.; Pistori, H.; Gonçalves, W.N.; Li, J. A Review on Deep Learning in UAV Remote Sensing. Int. J. Appl. Earth Obs. Geoinf. 2022, 112, 102456. [Google Scholar] [CrossRef]


| Category | Description | Example |
|---|---|---|
| Low Vegetation | Areas with sparse or low vegetation, which exhibit spectral homogeneity. |  |
| Soil | Bare soil surfaces with no significant vegetation cover, easily distinguishable due to their spectral characteristics. |  |
| High/Shrubby Vegetation | Zones with dense vegetation or shrubby cover, showing greater spectral differentiation compared to other vegetation categories. |  |
| Inert Materials | Areas with materials such as rocks, sand, or other structural elements, easily separable from natural categories. |  |
| Unknown Areas | Areas with classification uncertainty due to spectral overlap or insufficient data. |  |
| Category | MLC | MDC | ||
|---|---|---|---|---|
| PA (%) | UA (%) | PA (%) | UA (%) | |
| Inert Materials | 96.49 | 99.29 | 97.54 | 99.97 |
| Soil | 95.53 | 98.40 | 96.71 | 62.99 |
| High/Shrubby Vegetation | 98.95 | 89.89 | 81.70 | 98.68 |
| Unknown Areas | 92.54 | 88.55 | 91.22 | 78.27 |
| Low Vegetation | 96.49 | 99.29 | 97.54 | 99.97 |
| OA | 96.58 | 92.77 | ||
| Kc | 0.942 | 0.878 | ||
Disclaimer/Publisher’s Note: The statements, opinions and data contained in all publications are solely those of the individual author(s) and contributor(s) and not of MDPI and/or the editor(s). MDPI and/or the editor(s) disclaim responsibility for any injury to people or property resulting from any ideas, methods, instructions or products referred to in the content. |
© 2025 by the authors. Licensee MDPI, Basel, Switzerland. This article is an open access article distributed under the terms and conditions of the Creative Commons Attribution (CC BY) license (https://creativecommons.org/licenses/by/4.0/).
Share and Cite
Nikolakopoulos, I.A.; Petropoulos, G.P. Obtaining a Land Use/Cover Cartography in a Typical Mediterranean Agricultural Field Combining Unmanned Aerial Vehicle Data with Supervised Classifiers. Land 2025, 14, 643. https://doi.org/10.3390/land14030643
Nikolakopoulos IA, Petropoulos GP. Obtaining a Land Use/Cover Cartography in a Typical Mediterranean Agricultural Field Combining Unmanned Aerial Vehicle Data with Supervised Classifiers. Land. 2025; 14(3):643. https://doi.org/10.3390/land14030643
Chicago/Turabian StyleNikolakopoulos, Ioannis A., and George P. Petropoulos. 2025. "Obtaining a Land Use/Cover Cartography in a Typical Mediterranean Agricultural Field Combining Unmanned Aerial Vehicle Data with Supervised Classifiers" Land 14, no. 3: 643. https://doi.org/10.3390/land14030643
APA StyleNikolakopoulos, I. A., & Petropoulos, G. P. (2025). Obtaining a Land Use/Cover Cartography in a Typical Mediterranean Agricultural Field Combining Unmanned Aerial Vehicle Data with Supervised Classifiers. Land, 14(3), 643. https://doi.org/10.3390/land14030643