
Trade-Offs and Synergies Between Ecosystem Services and Their Ecological Security Patterns in the Guanzhong–Tianshui Economic Zone

Abstract
1. Introduction
2. Materials and Methods
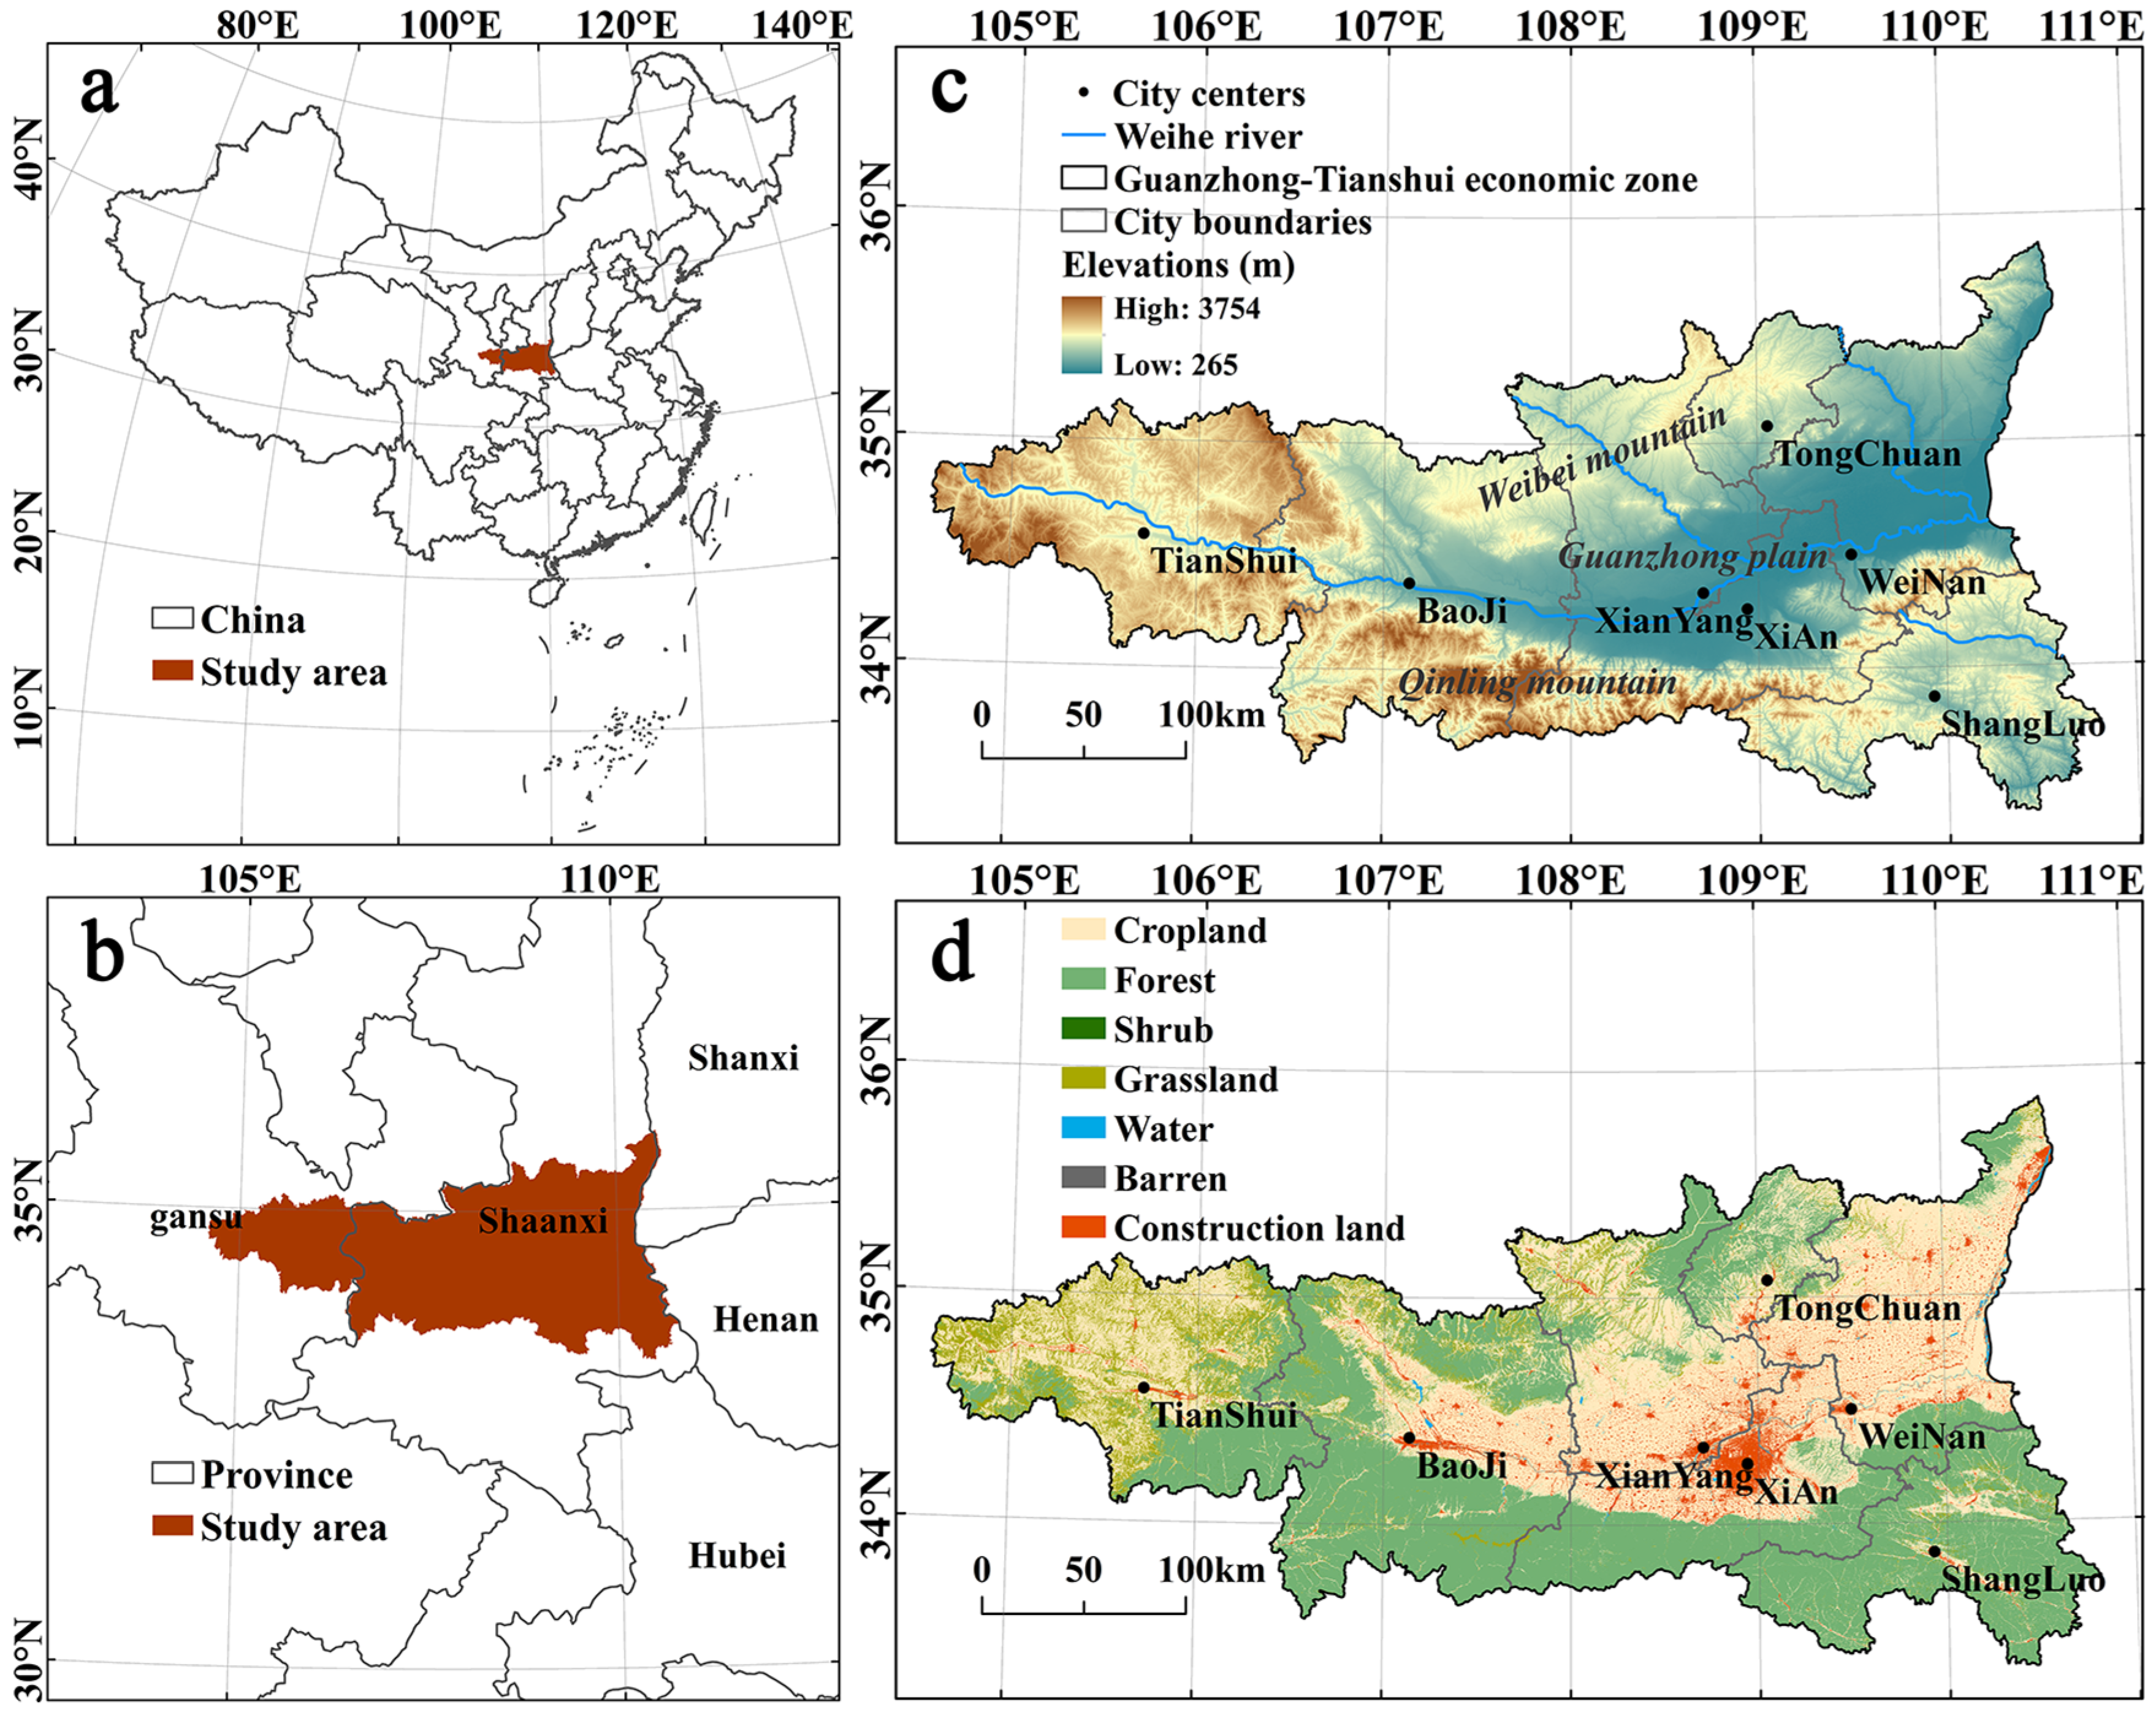
2.1. Overview of the Study Area
2.2. Data Sources and Processing
- (1)
- Digital Elevation Model data. We obtained the data from the SRTM DEM UTM 90 m resolution digital elevation data product provided by China’s Geospatial Data Cloud (https://www.gscloud.cn/) (accessed on 12 July 2024).
- (2)
- Land use data. We obtained the data from a publication by Yang and Huang (2023) [36] (https://zenodo.org/records/8176941) (accessed on 12 July 2024). The data had an annual temporal resolution and a spatial resolution of 30 m. The land use types were classified into seven primary categories: cropland, forest, shrub, grassland, water, barren land, and construction land.
- (3)
- Meteorological data. We obtained temperature, precipitation, and potential evapotranspiration data from the China 1 km resolution monthly average temperature, monthly precipitation, and monthly potential evapotranspiration datasets provided by the National Tibetan Plateau Data Center (http://data.tpdc.ac.cn/) (accessed on 2 October 2023). We obtained solar radiation data from version 3.0 of the China Meteorological Data Network’s Ground Climate Daily Data Set (http://data.cma.cn/) (accessed on 6 October 2023) and converted the data into daily solar radiation values using the Python 2.7 programming language. We spatially interpolated the results to a resolution of 30 m with the ANUSPLIN 4.4 software to generate a grid of solar radiation on a monthly scale.
- (4)
- Normalized-difference vegetation index (NDVI) data. We obtained this data from the MODIS MOD13Q1 product available on the Google Earth Engine platform (https://earthengine.google.com/) (accessed on 20 October 2023), with a temporal resolution of 16 days and a spatial resolution of 250 m. We derived monthly and annual NDVI values using the maximum synthesis method implemented in the MATLAB R2022a software.
- (5)
- Soil data. We obtained this data from version 1.1 of the Harmonized World Soil Database (https://www.fao.org/soils-portal/data-hub/soil-maps-and-databases/harmonized-world-soil-database-v20/en/) (accessed on 24 October 2023), characterized by a spatial resolution of 1 km, and it was extracted using ArcGIS 10.7 to obtain the soil texture, soil bulk density, and rooting depth data.
- (6)
- Population spatial distribution. We obtained this data from the LandScan platform (https://landscan.ornl.gov/) (accessed on 24 July 2024), with a resolution of 1 km, to provide a gridded representation of the population distribution.
- (7)
- Food production data. We obtained this data from Gotohui (https://www.gotohui.com/) (accessed on 15 July 2024). It provides cereal production figures for Xi’an, Baoji, Tongchuan, Weinan, Shangluo, Xianyang, and Tianshui.
2.3. Research Methods
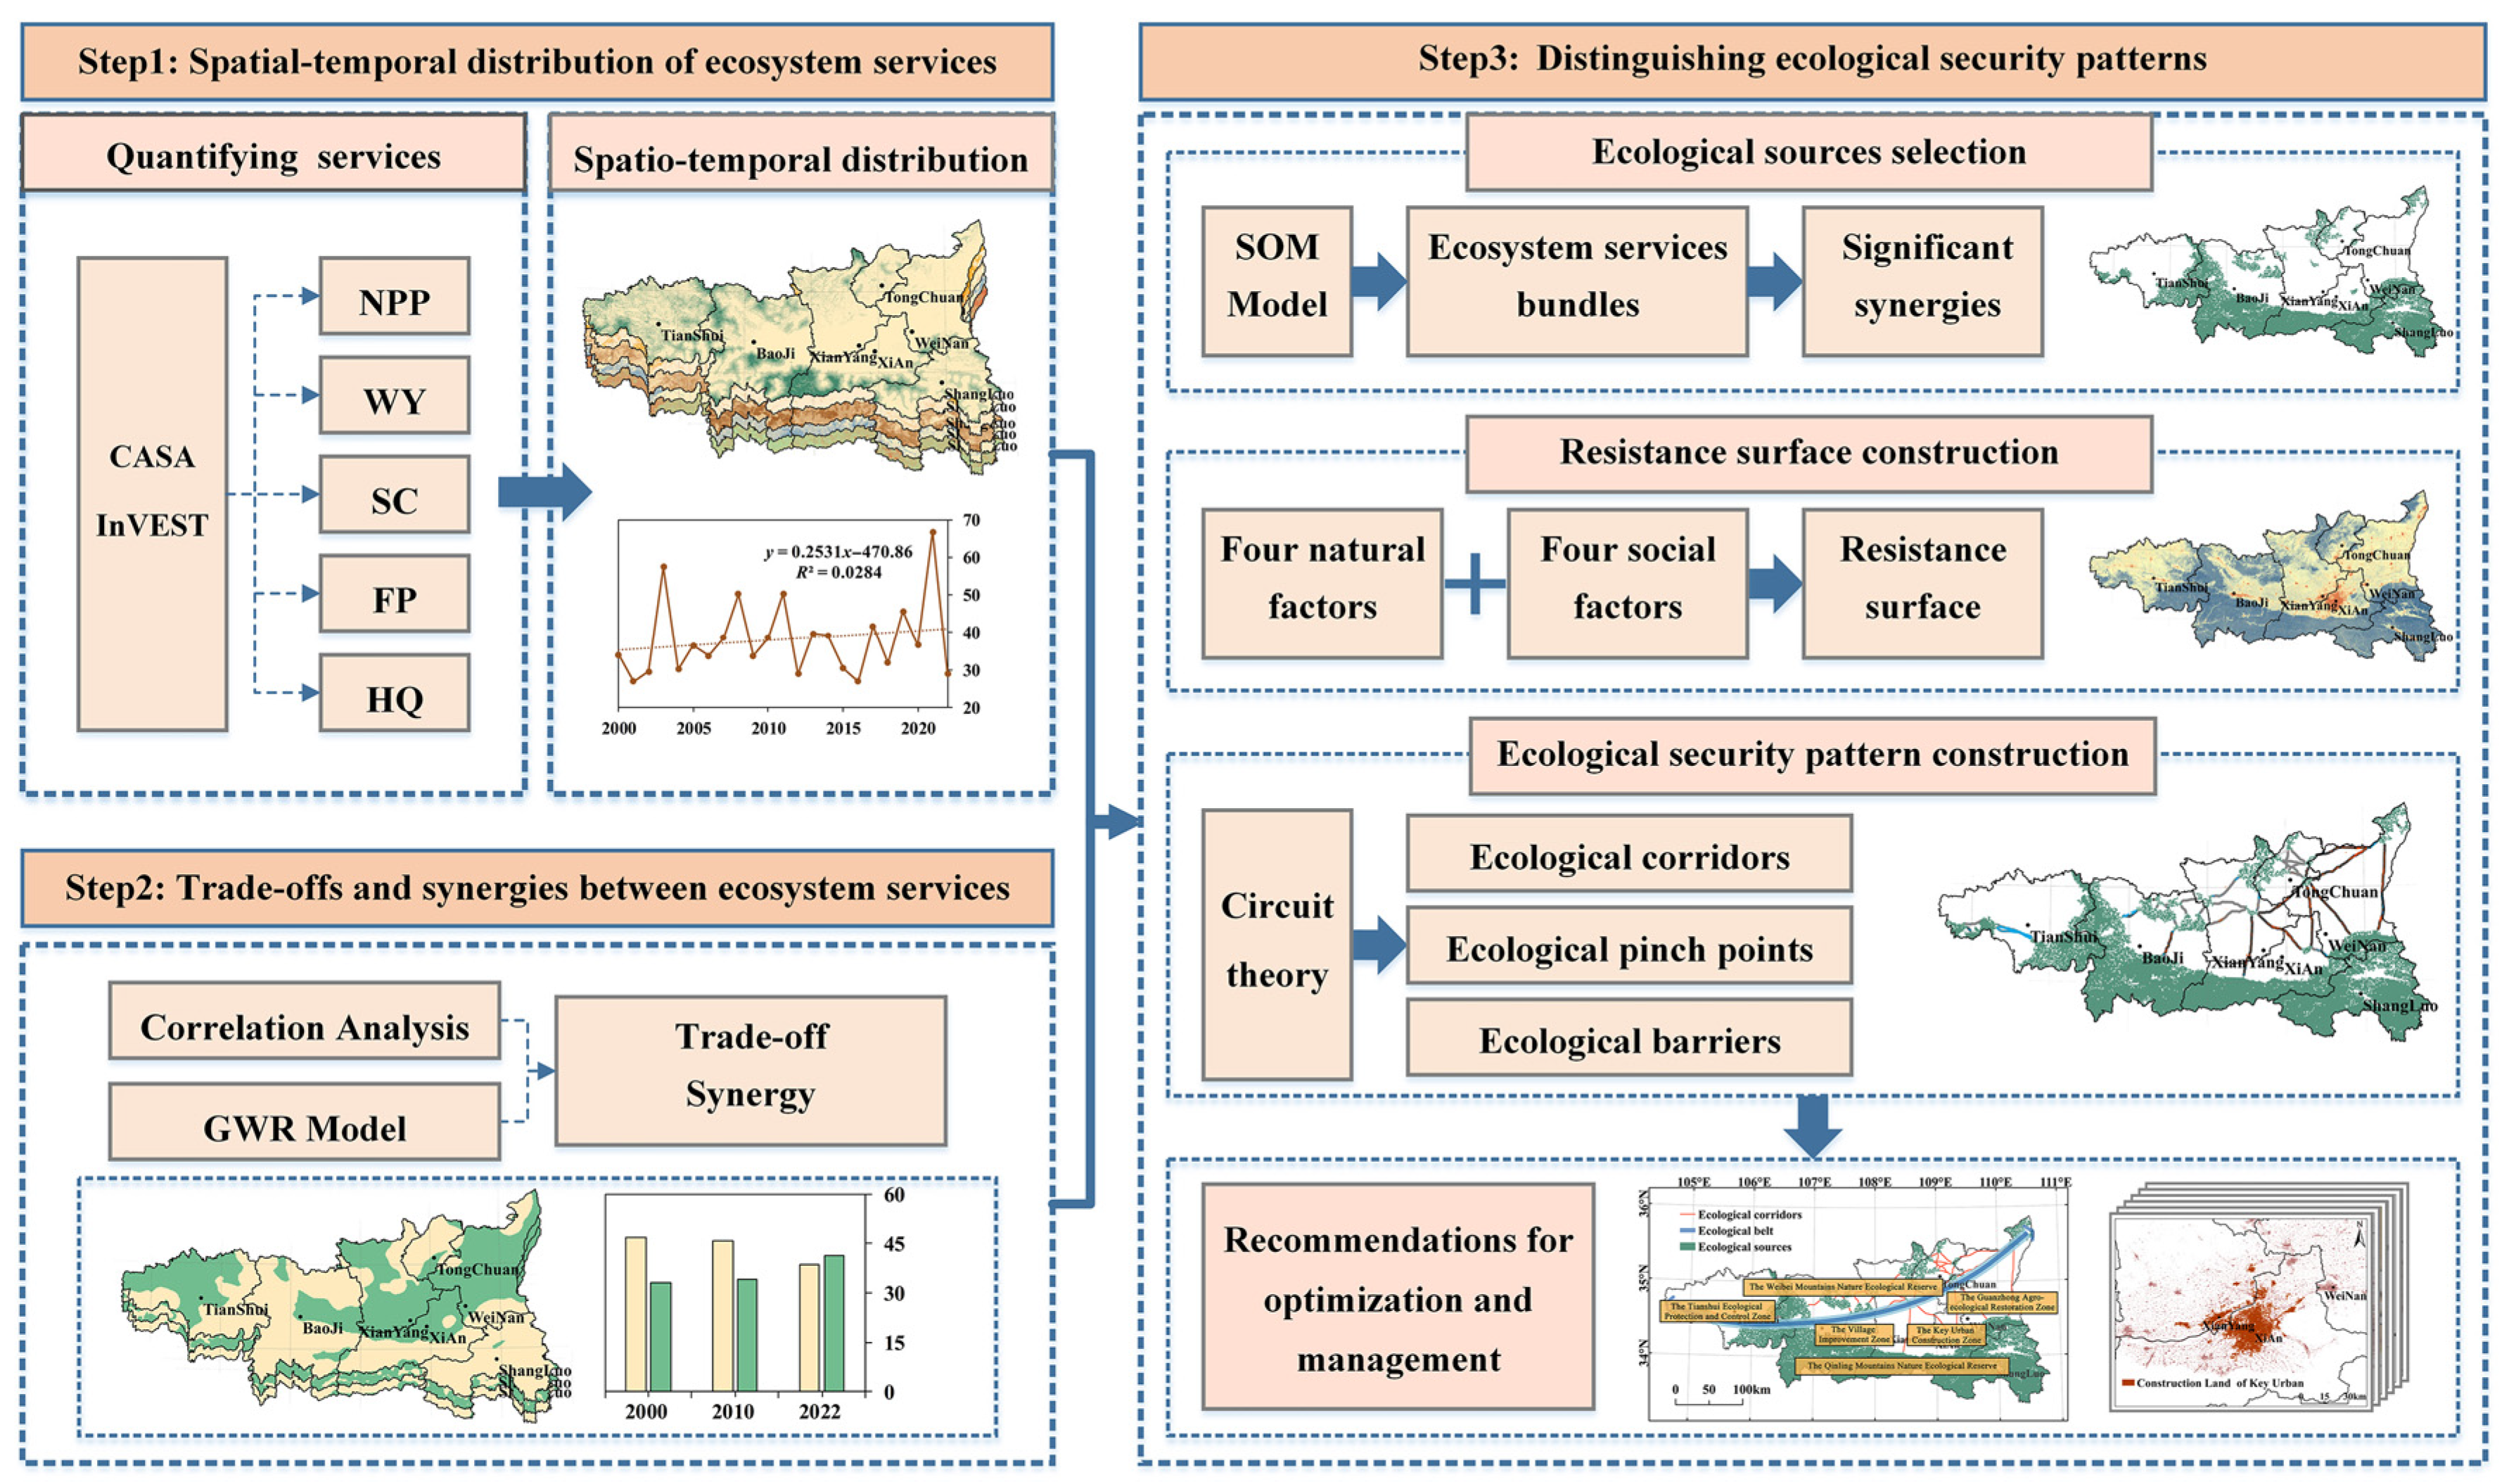
2.3.1. Quantifying Ecosystem Services
- (1)
- NPP denotes the organic carbon sequestered by green plants per unit time and unit area through photosynthesis after deducting the plant’s respiratory consumption of photosynthate [37]. We used the CASA model to estimate NPP.
- (2)
- WY denotes the capacity of an ecosystem to produce and retain water, which is influenced by both natural conditions and anthropogenic land cover changes [38]. We used the water yield module of the InVEST model to assess WY. We validated the WY against the total water resources of the Wei River Basin (Water Resources Bulletin of the Shaanxi Provincial Water Resources Department) to ensure that the results are reliable.
- (3)
- SC denotes the role of soil within an ecosystem in controlling erosion and intercepting sediment flows, which are influenced by topography, vegetation, and various ecosystem components [39]. We used the soil conservation module of the InVEST model to assess SC.
- (4)
- (5)
- HQ denotes the capacity of an ecosystem in terms of its ability to provide suitable living and developmental conditions for individuals, populations, and communities, thereby reflecting biodiversity [43]. We used the habitat quality module of the InVEST model to assess HQ.
2.3.2. Quantification of Trade-Offs and Synergies Between Ecosystem Services
2.3.3. Construction of Ecological Security Patterns
Identification of Ecological Sources
Constructing an Integrated Resistance Surface
Extracting Ecological Corridors and Identifying Pinch Points and Barriers
3. Results
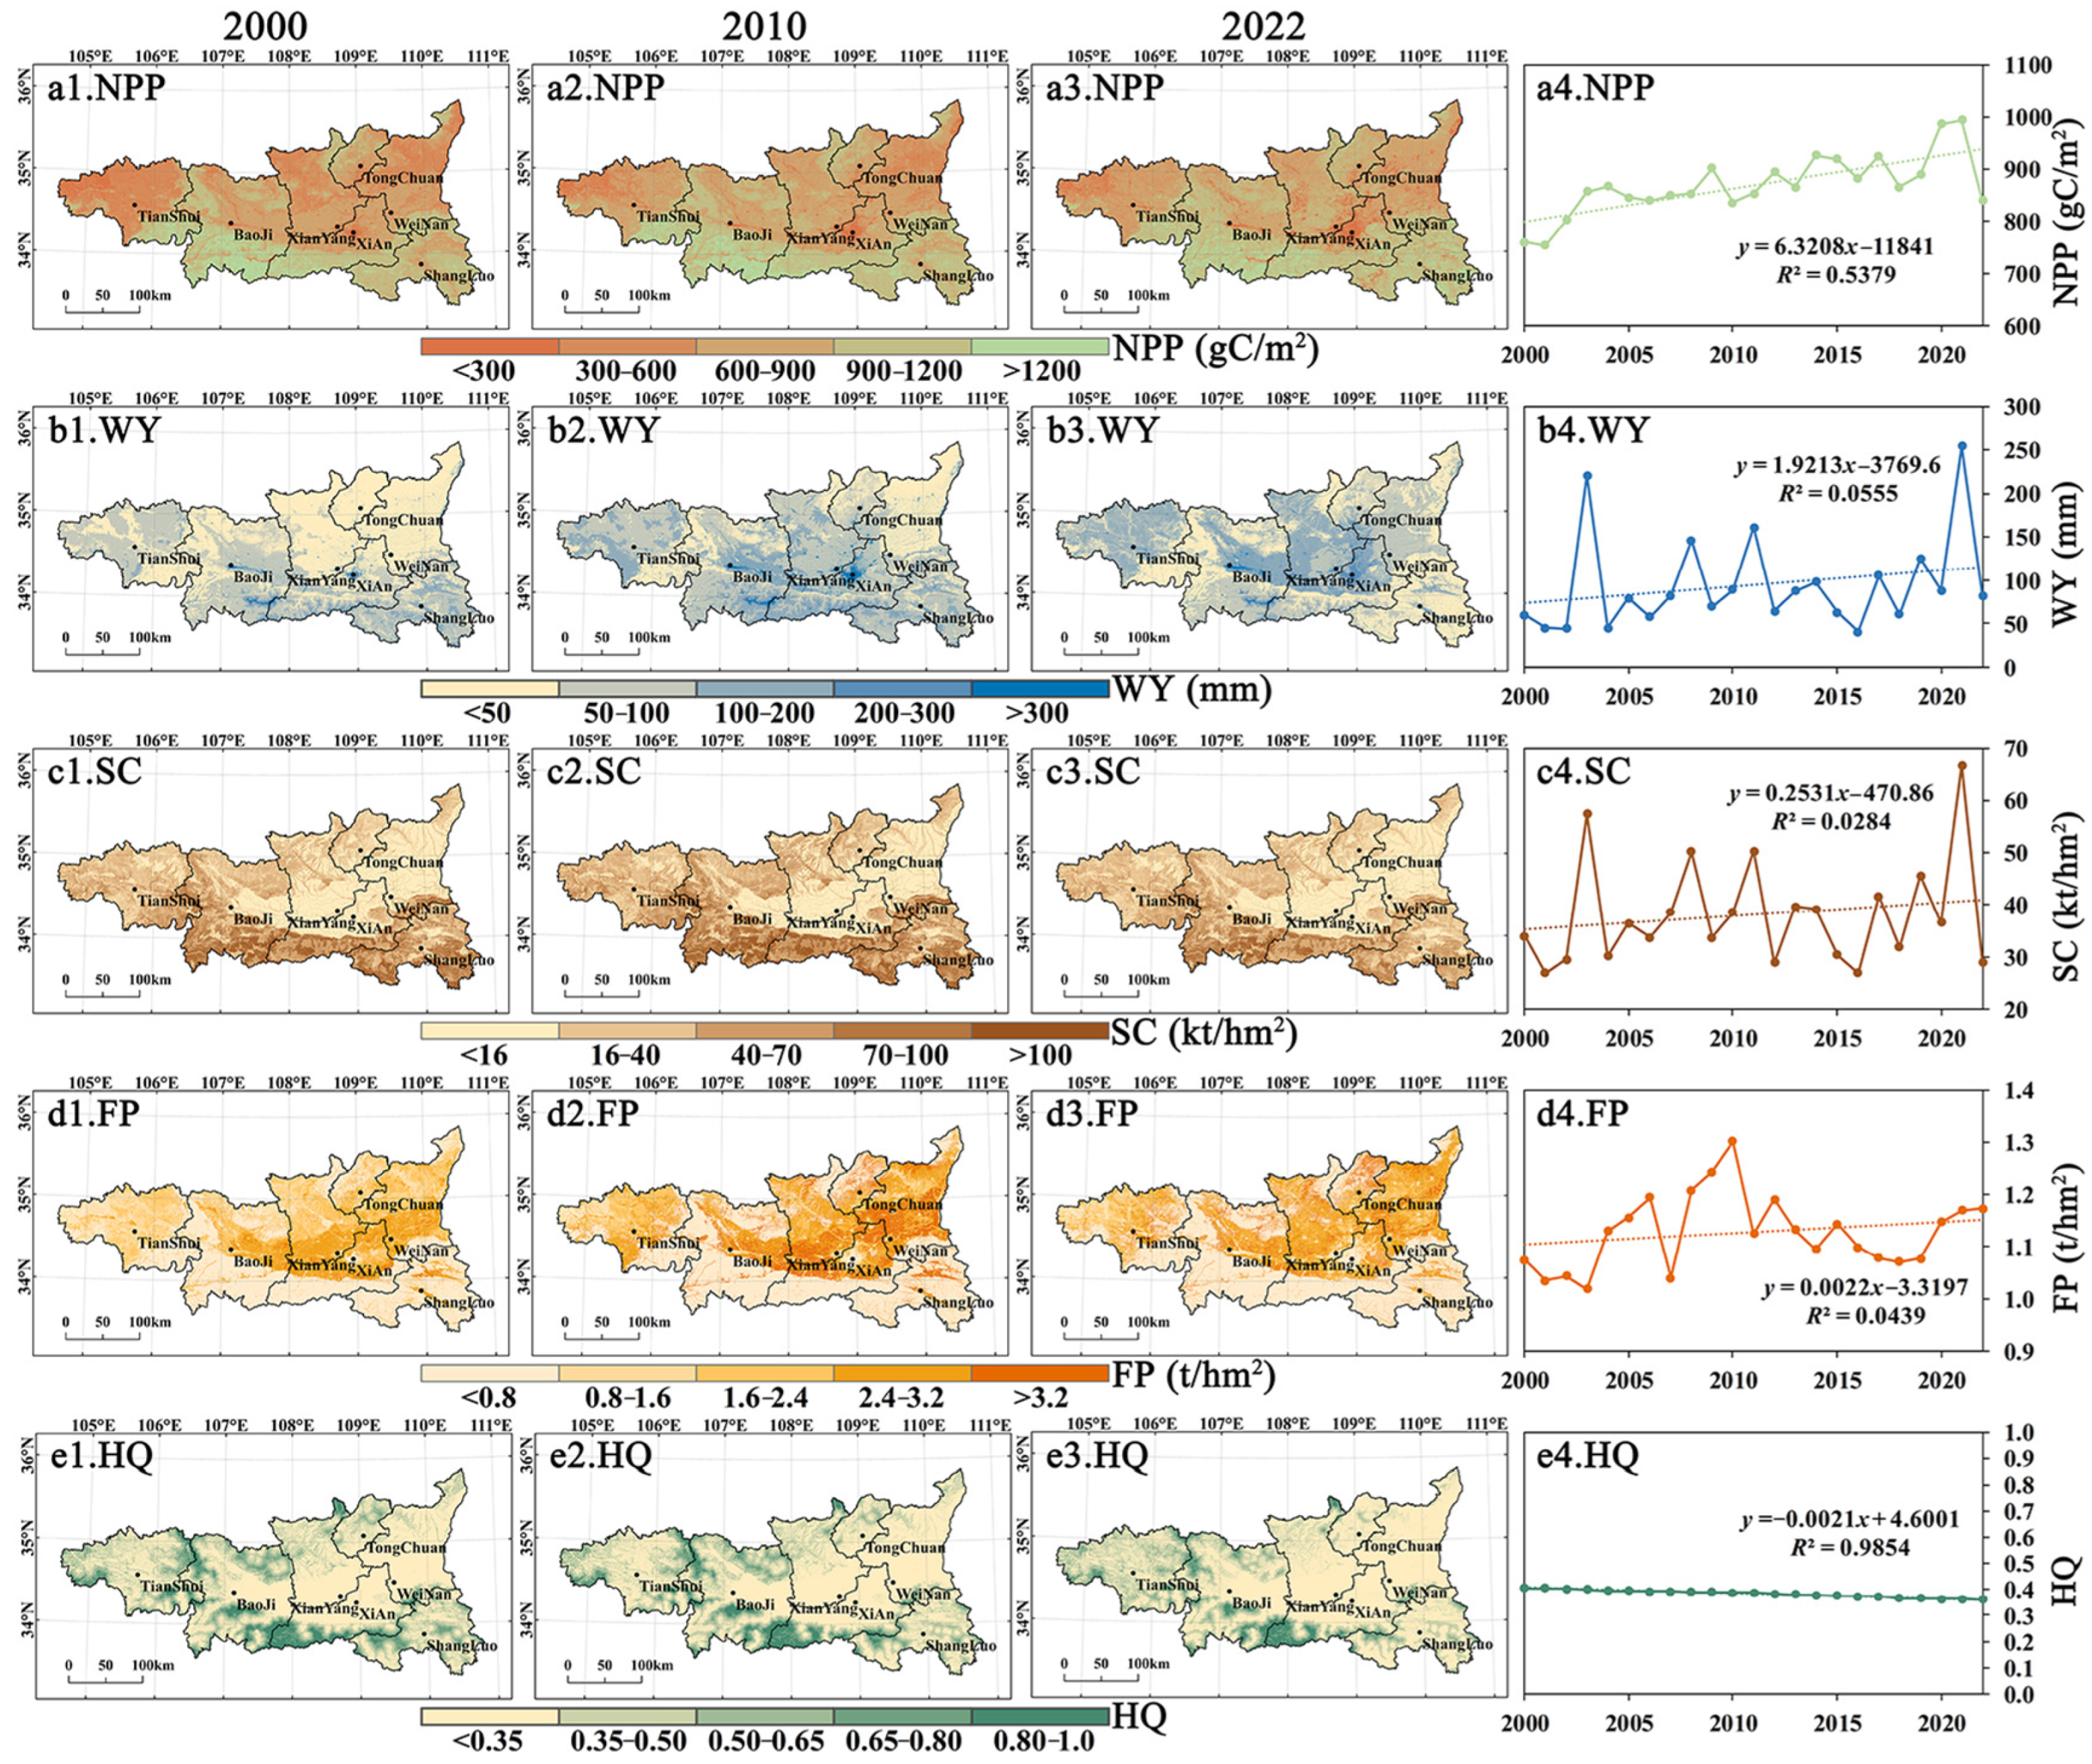
3.1. Spatial and Temporal Distribution of Ecosystem Services
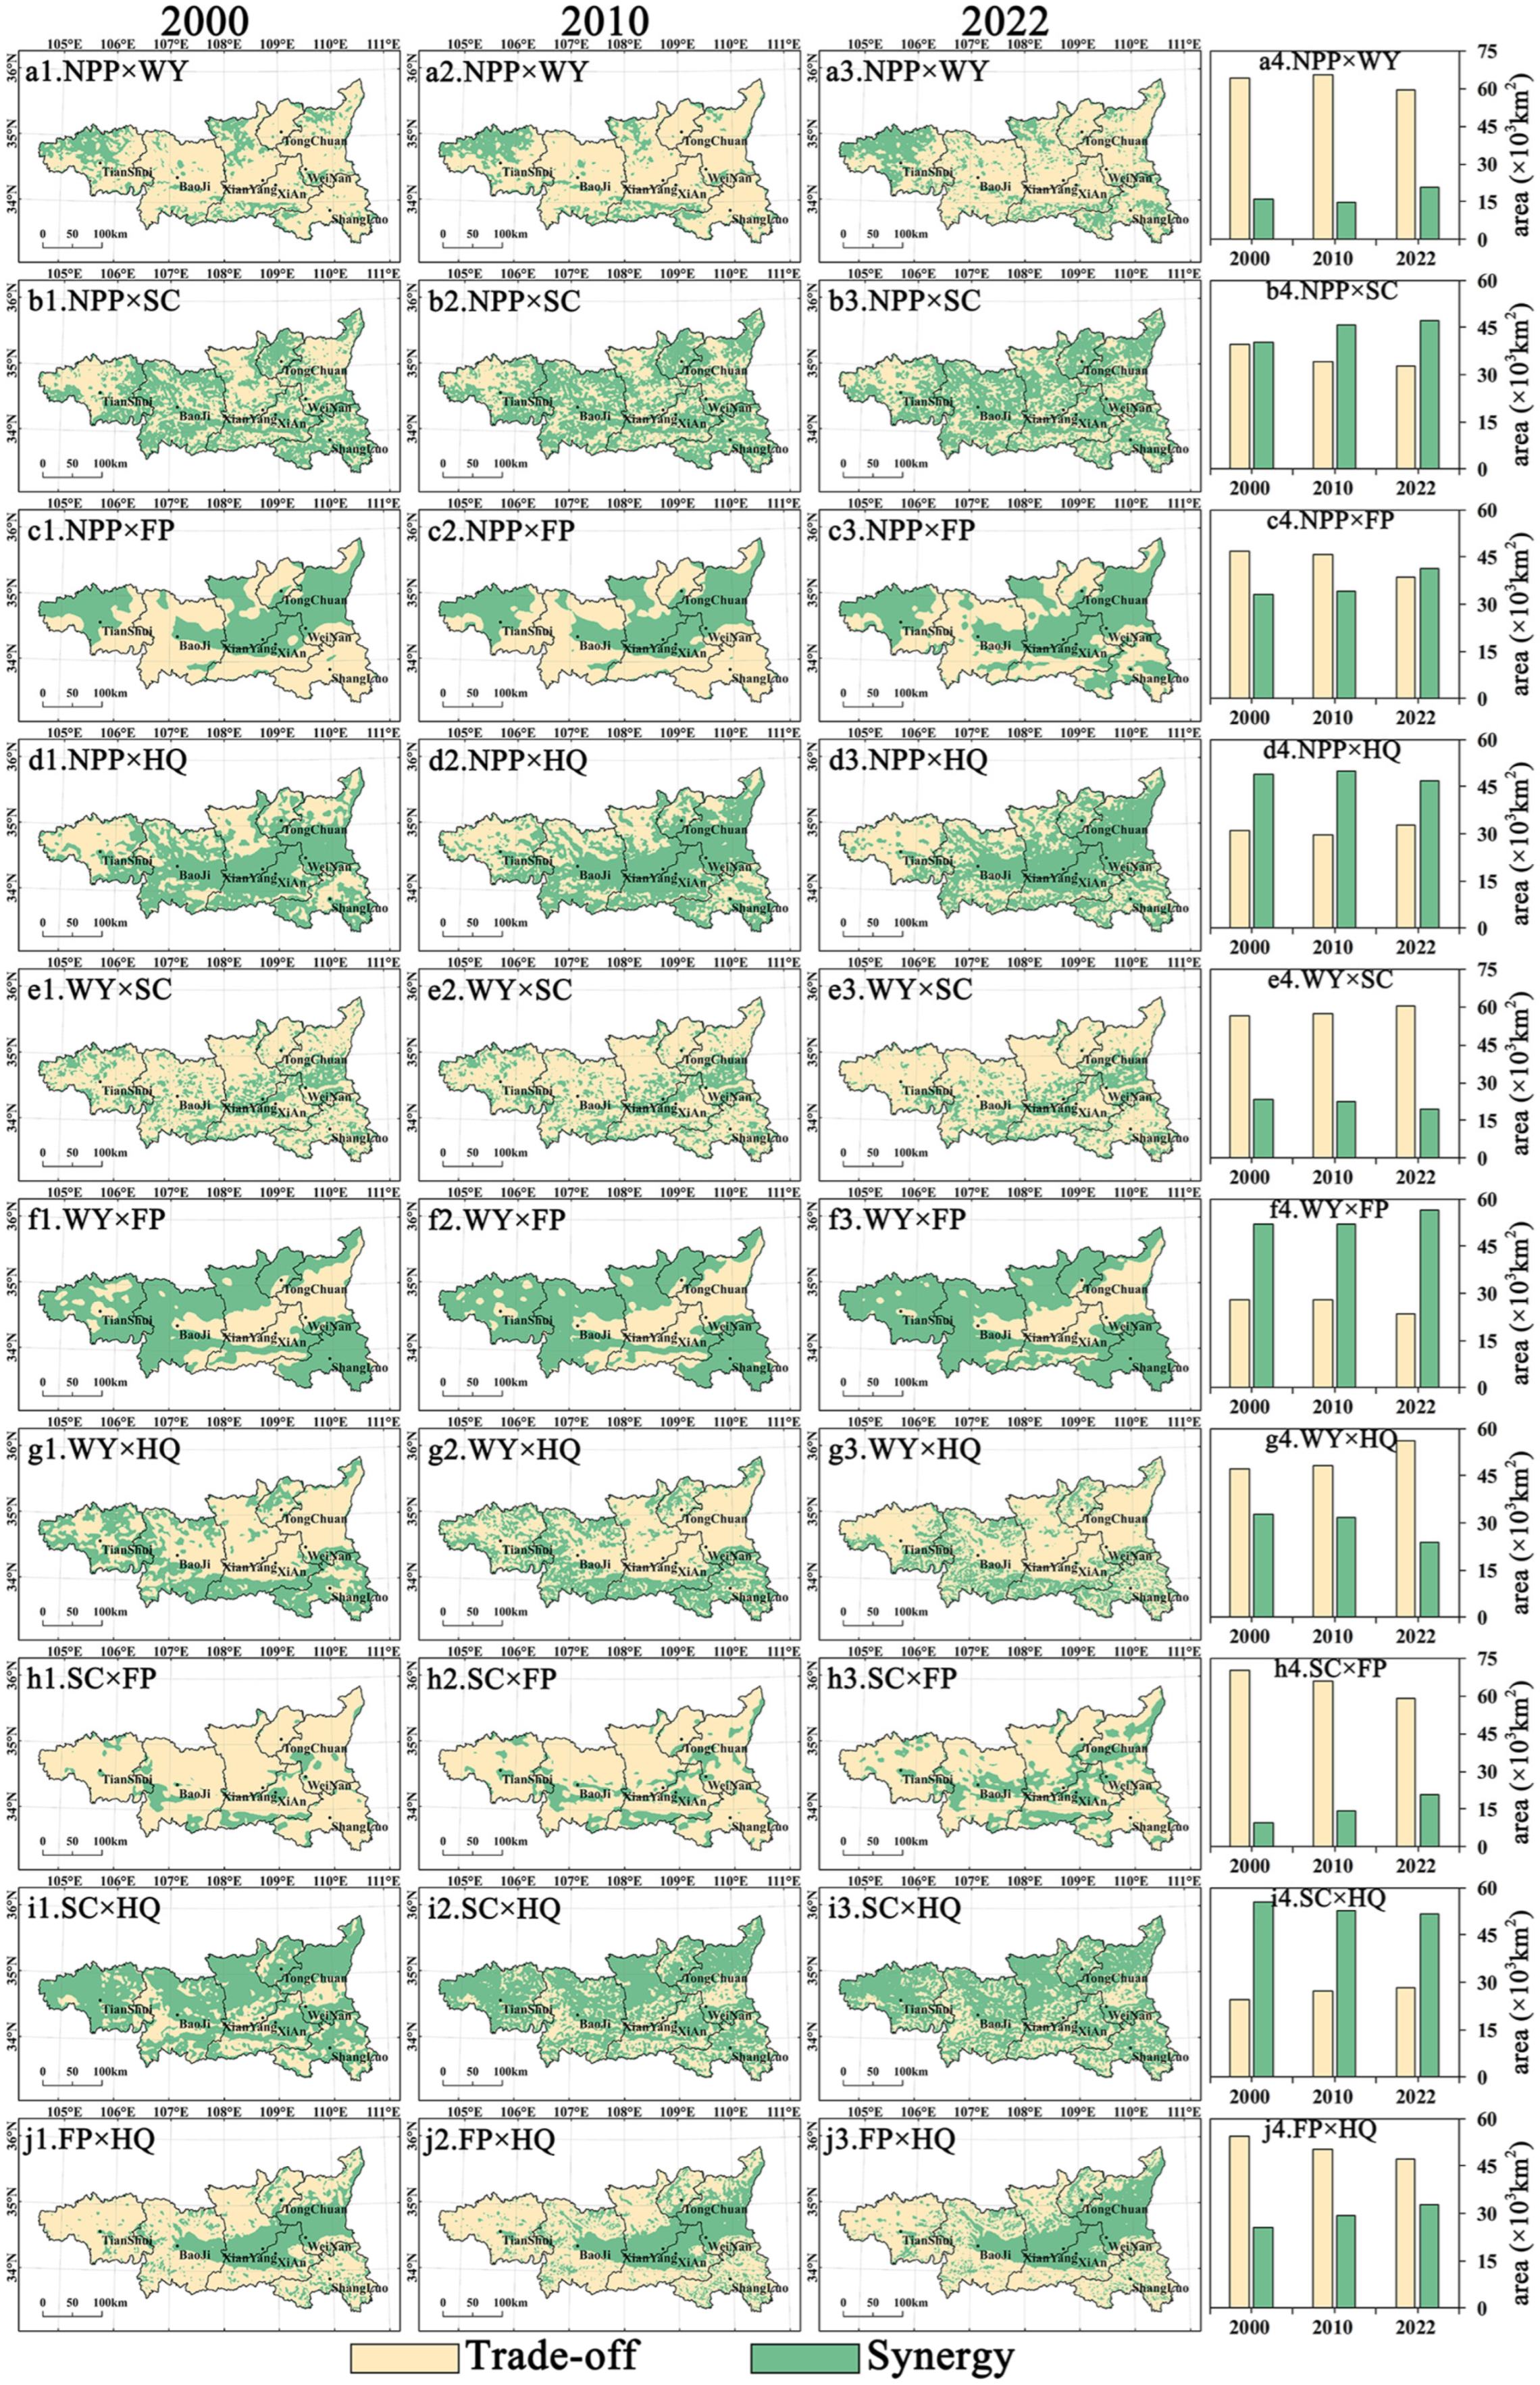
3.2. Trade-Offs and Synergies Between Ecosystem Services
3.3. Distinguishing Ecological Security Pattern
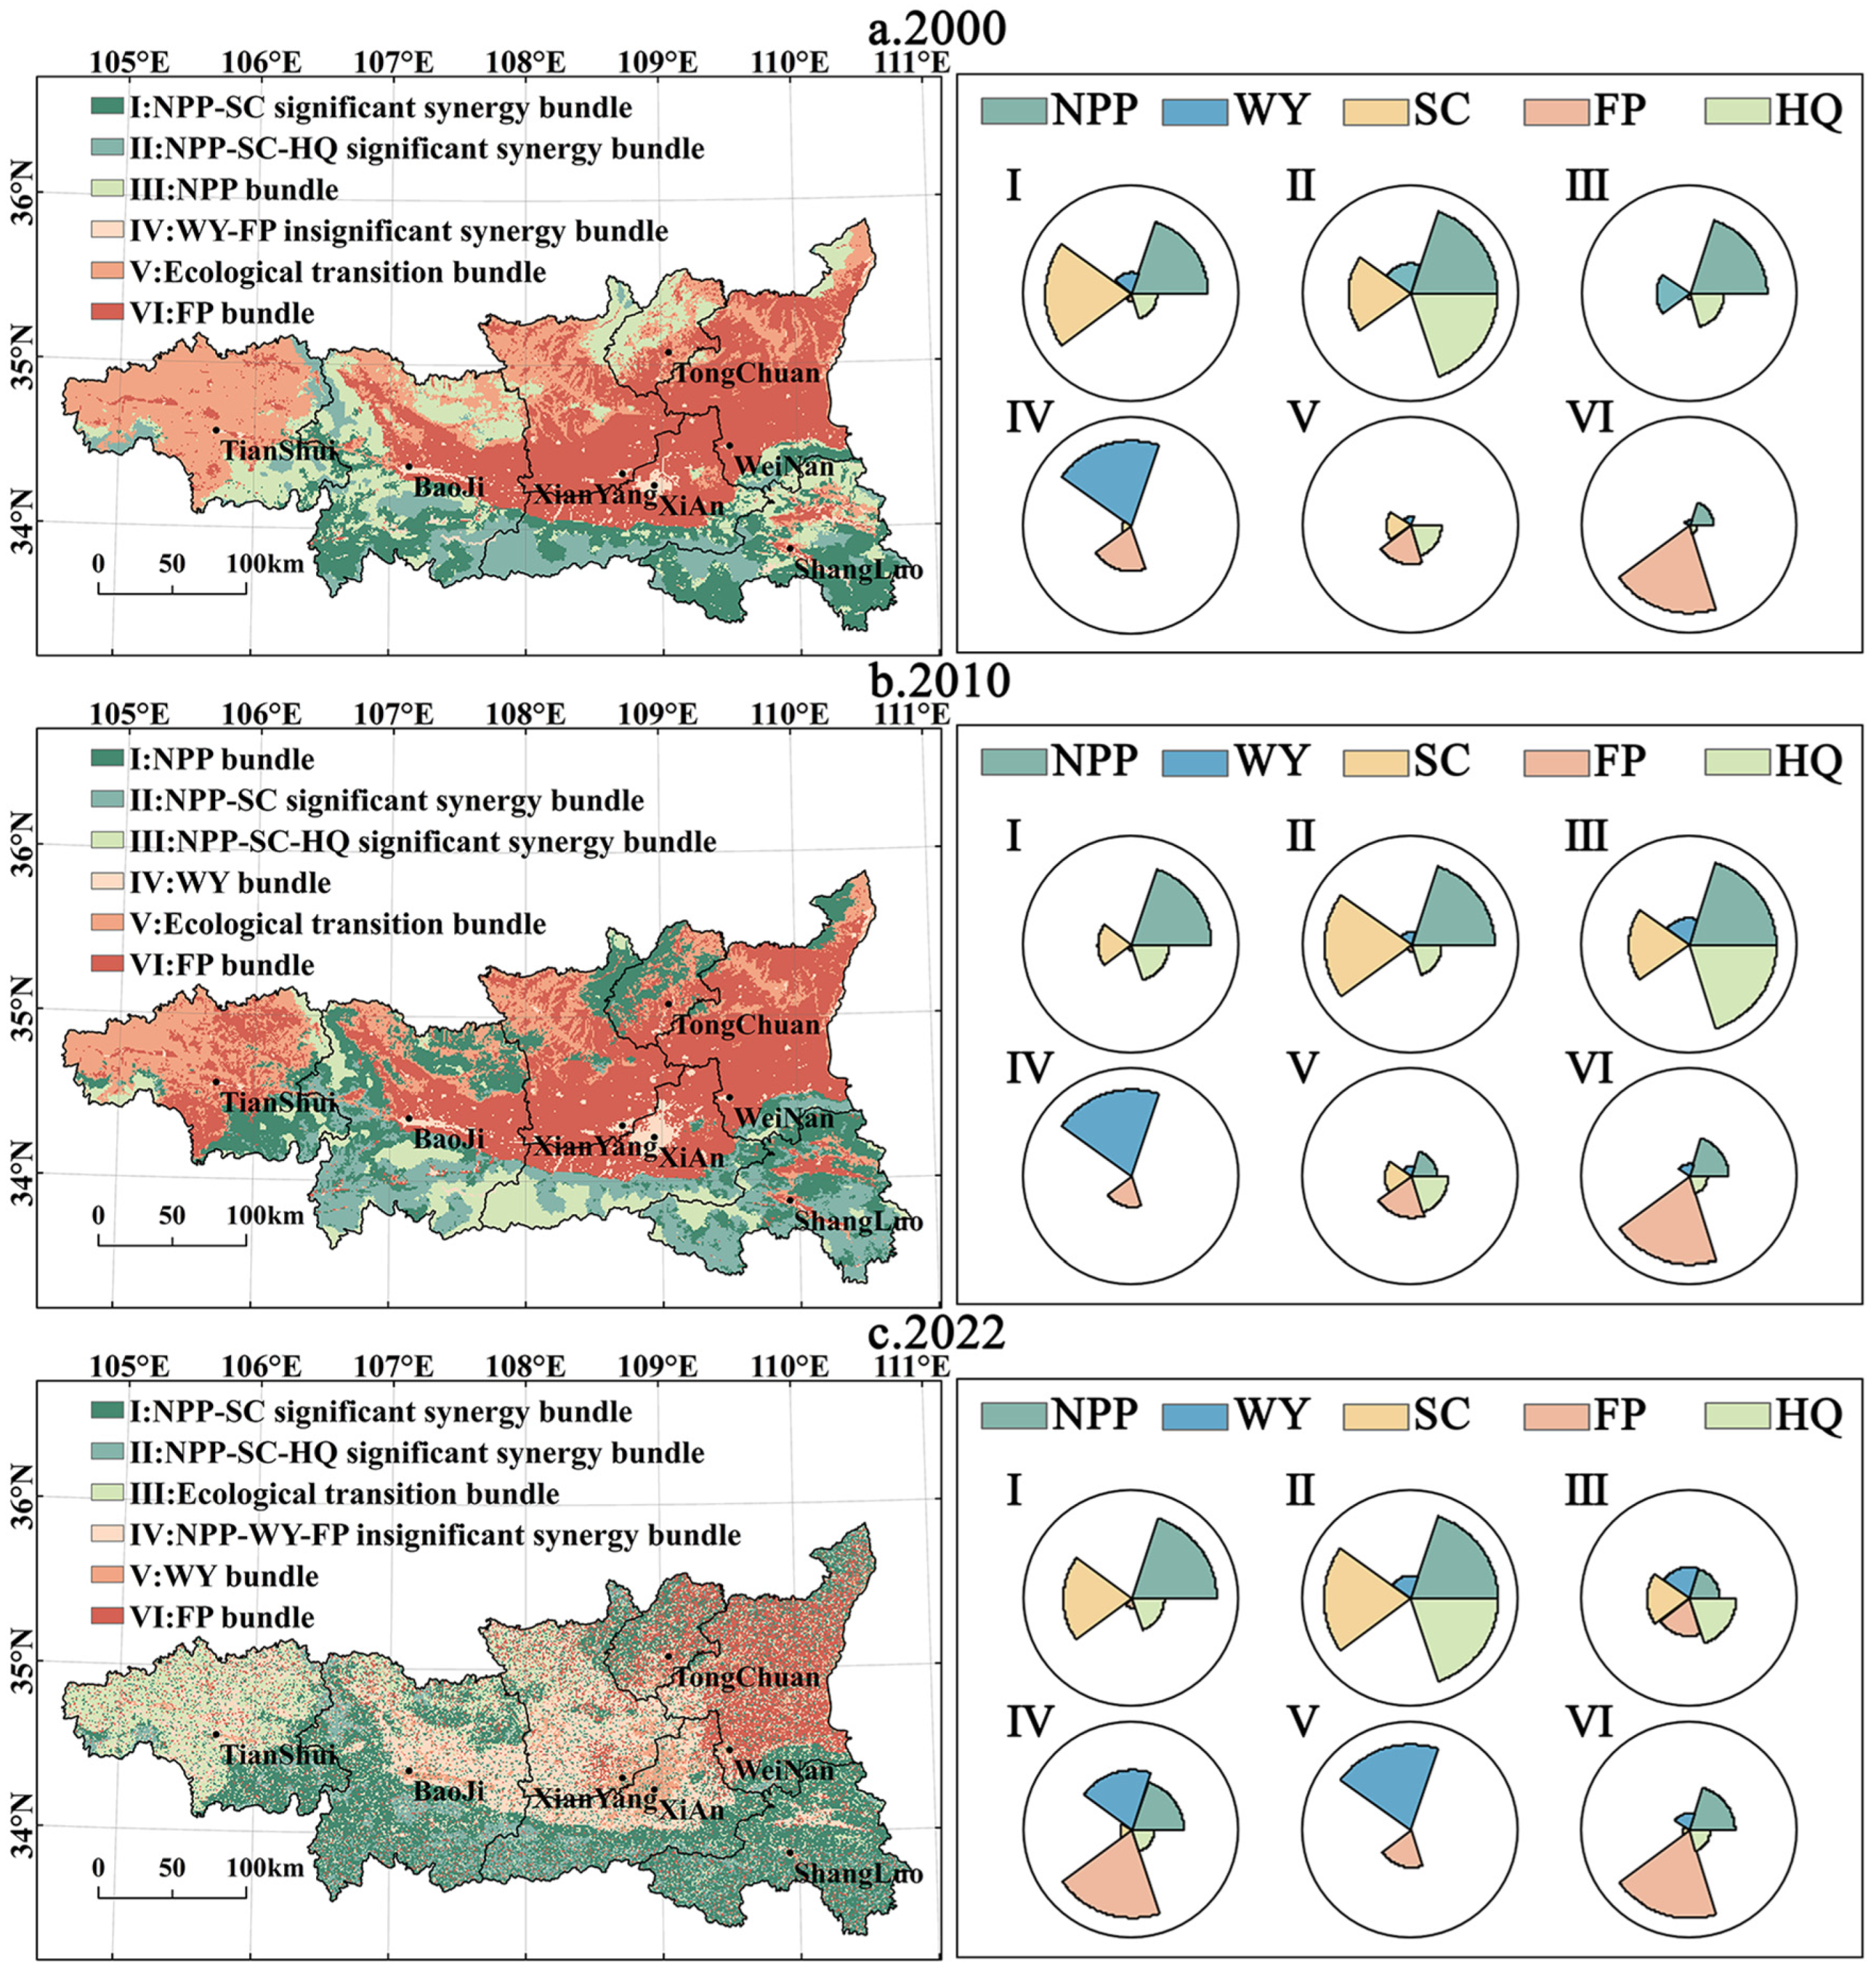
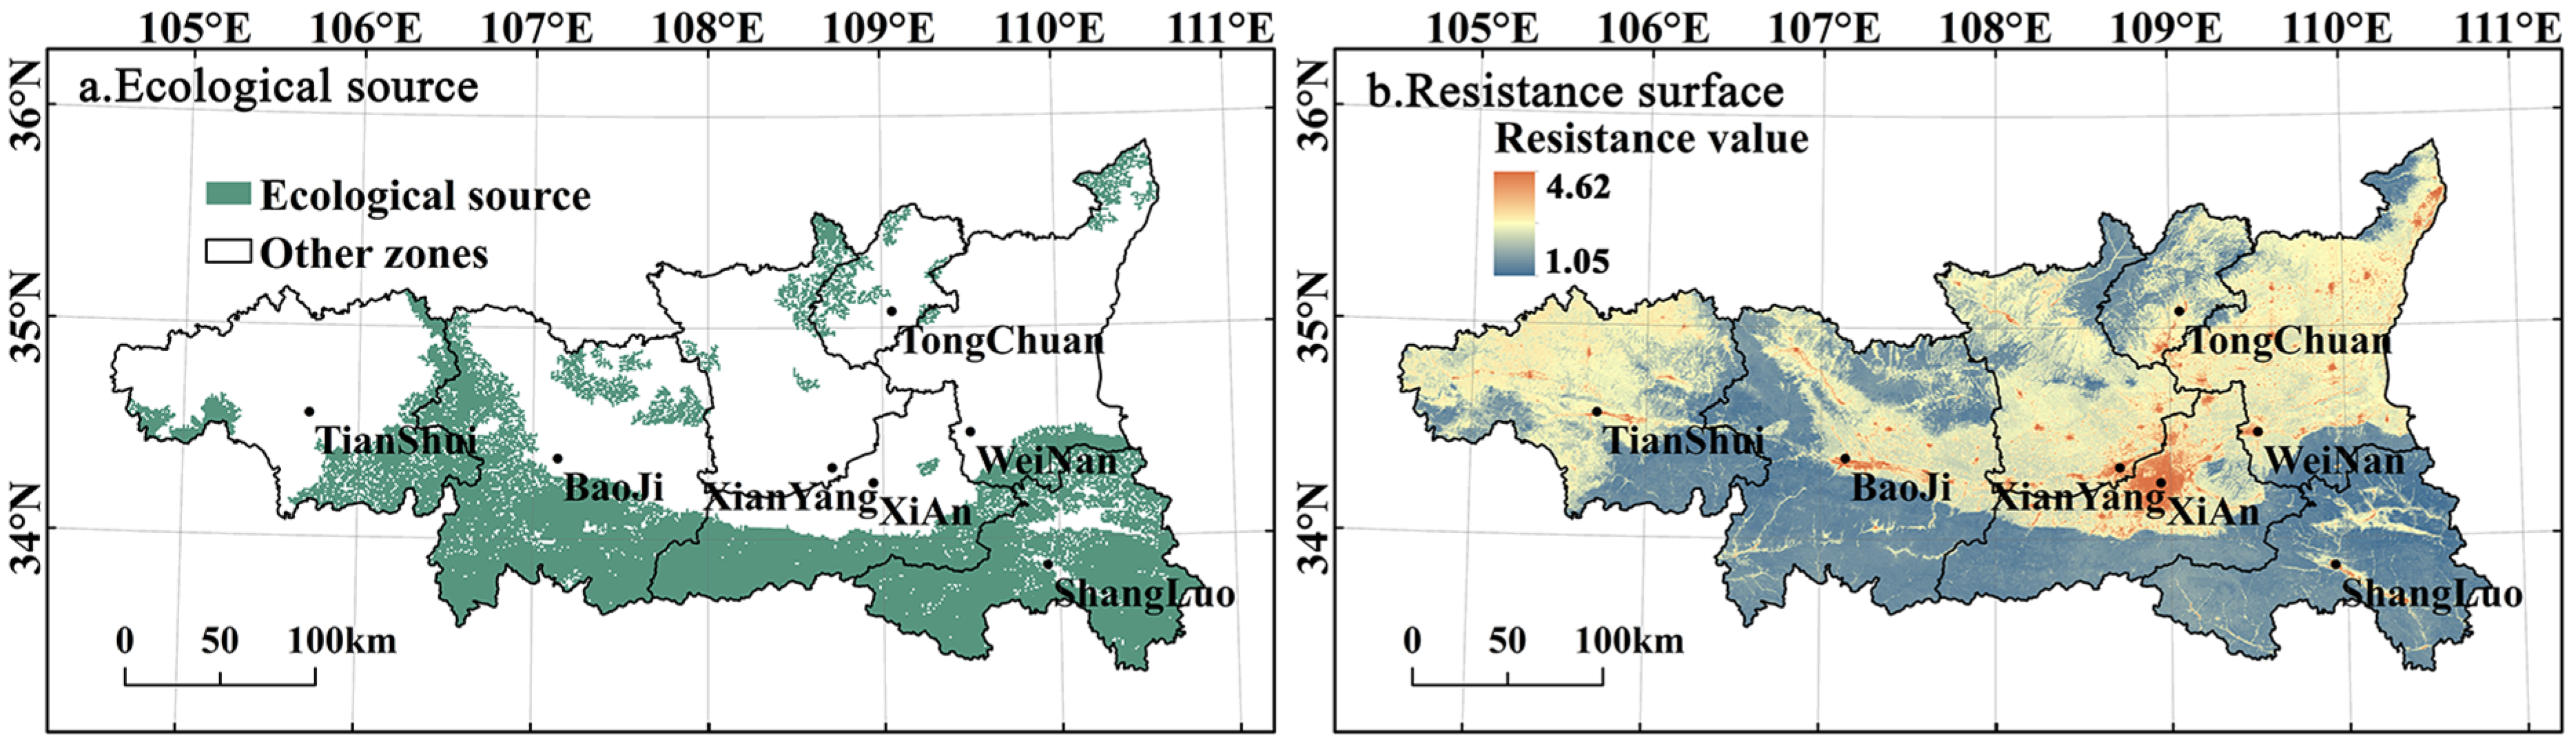
3.3.1. Ecological Source Selection Based on Ecosystem Service Bundles
3.3.2. Resistance Surface Construction
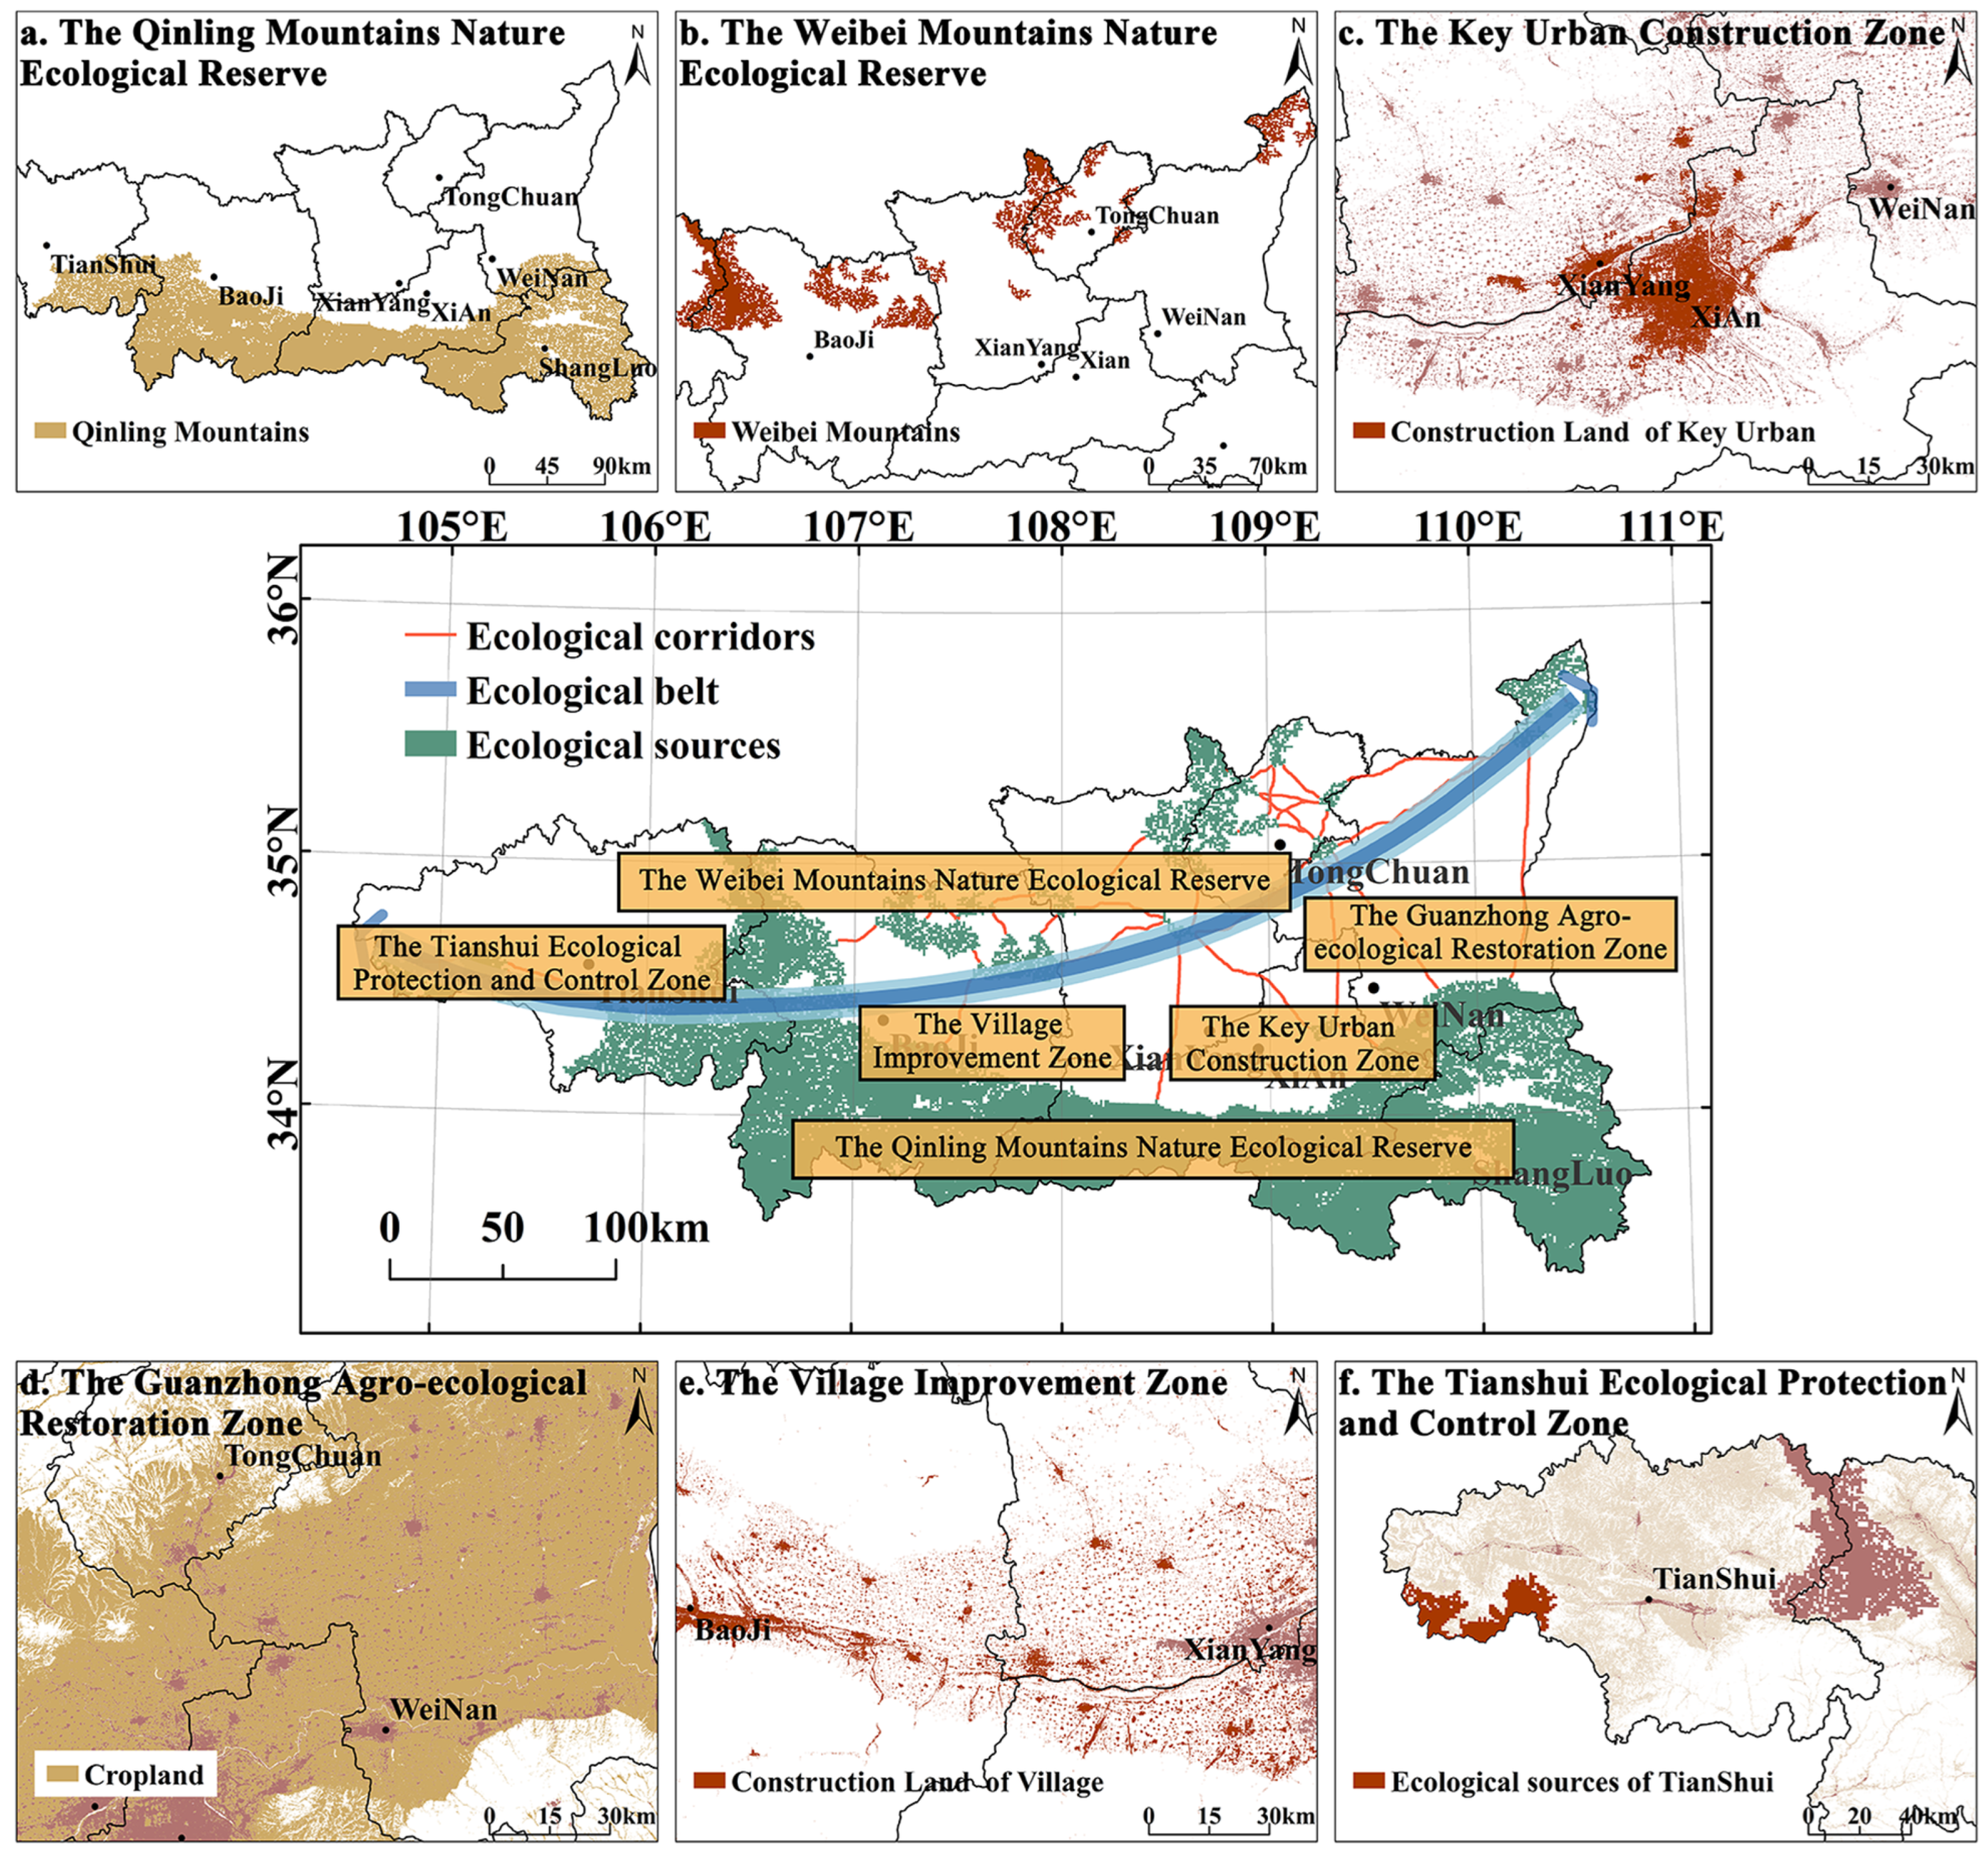
3.3.3. Ecological Security Pattern Construction
4. Discussion
4.1. Characterization of Ecosystem Service Interactions
4.2. Recommendations for Optimization and Management of Spatial Ecological Patterns
4.3. Research Gaps and Future Plans
- (1)
- There are many types of ecosystem services. Although we studied regulating, supplying, and supporting services, we did not account for cultural services. The associated human leisure and recreation services should be incorporated into the assessment system in future research.
- (2)
- Our analysis relied on correlation and regression analyses to explore the relationships among ecosystem services. However, these methods are relatively simplistic and do not delve into the influencing mechanisms that underlie the relationships. Thus, our analytical methods should be enhanced using methods such as structural equation modeling and random forest analysis in the future to provide insights into the mechanisms by which the external environment influences the relationships among ecosystem services.
- (3)
- When we defined the ecological security patterns, our focus on the identification of the ecological sources did not involve testing the desirable or required widths of the ecological corridors. In the future, more attention should be paid to objectively defining the width of the ecological corridors and to exploring evaluation methods for this analysis so that the patterns can be optimized according to the feedback results.
5. Conclusions
- (1)
- NPP, WY, SC, and FP generally increased during the study period. In contrast, habitat quality HQ decreased. The high-value areas for NPP, SC, and HQ were mainly distributed in the Qinling Mountains, whereas the low-value areas were mainly distributed in the Guanzhong Plains. The opposite was true for FP.
- (2)
- NPP × WY, WY × SC, and WY × HQ shifted from synergies to trade-offs; NPP × SC, NPP × HQ, and SC × HQ were always synergies; NPP × FP, SC × FP, and FP × HQ were always trade-offs; and WY × FP shifted from trade-offs to synergies.
- (3)
- The ecosystem service bundles in different time periods had similar spatial structures. We selected the bundles with significant synergies among NPP, SC, and HQ as the ecological source. We found 47 patches that together accounted for 38.1% of the study area, and they were mainly located in the Qinling Mountains and the Weibei Mountains.
- (4)
- In the ecological security pattern we constructed, we identified 58 ecological corridors that spread throughout the study area in a net-like structure. The pinch points had forest and grassland as the main land use types. The barriers had cropland and construction land as the main land use types.
- (5)
- We defined an ecological security pattern with six zones and one belt that spanned the entire study area from west to east.
Author Contributions
Funding
Data Availability Statement
Acknowledgments
Conflicts of Interest
References
- Costanza, R.; d’Arge, R.; De Groot, R.; Farber, S.; Grasso, M.; Hannon, B.; Limburg, K.; Naeem, S.; O′neill, R.V.; Paruelo, J. The value of the world’s ecosystem services and natural capital. Nature 1997, 387, 253–260. [Google Scholar] [CrossRef]
- Pejchar, L.; Mooney, H.A. Invasive species, ecosystem services and human well-being. Trends Ecol. Evol. 2009, 24, 497–504. [Google Scholar] [CrossRef]
- Mason, N.; Ward, M.; Watson, J.E.; Venter, O.; Runting, R.K. Global opportunities and challenges for transboundary conservation. Nat. Ecol. Evol. 2020, 4, 694–701. [Google Scholar] [CrossRef]
- Jia, Q.; Jiao, L.; Lian, X.; Wang, W. Linking supply-demand balance of ecosystem services to identify ecological security patterns in urban agglomerations. Sustain. Cities Soc. 2023, 92, 104497. [Google Scholar] [CrossRef]
- Guerra, C.A.; Rosa, I.M.; Valentini, E.; Wolf, F.; Filipponi, F.; Karger, D.N.; Nguyen Xuan, A.; Mathieu, J.; Lavelle, P.; Eisenhauer, N. Global vulnerability of soil ecosystems to erosion. Landsc. Ecol. 2020, 35, 823–842. [Google Scholar] [CrossRef]
- Li, M.; Liang, D.; Xia, J.; Song, J.; Cheng, D.; Wu, J.; Cao, Y.; Sun, H.; Li, Q. Evaluation of water conservation function of Danjiang River Basin in Qinling Mountains, China based on InVEST model. J. Environ. Manag. 2021, 286, 112212. [Google Scholar] [CrossRef]
- Liu, Z.; Liu, Z.; Zhou, Y.; Huang, Q. Distinguishing the impacts of rapid urbanization on ecosystem service trade-offs and synergies: A case study of shenzhen, China. Remote Sens. 2022, 14, 4604. [Google Scholar] [CrossRef]
- Zhao, J.; Li, C. Investigating ecosystem service trade-offs/synergies and their influencing factors in the Yangtze River Delta Region, China. Land 2022, 11, 106. [Google Scholar] [CrossRef]
- Pan, N.; Du, Q.; Guan, Q.; Tan, Z.; Sun, Y.; Wang, Q. Ecological security assessment and pattern construction in arid and semi-arid areas: A case study of the Hexi Region, NW China. Ecol. Indic. 2022, 138, 108797. [Google Scholar] [CrossRef]
- Dai, L.; Liu, Y.; Luo, X. Integrating the MCR and DOI models to construct an ecological security network for the urban agglomeration around Poyang Lake, China. Sci. Total Environ. 2021, 754, 141868. [Google Scholar] [CrossRef]
- Cao, W.; Li, X.; Lyu, X.; Dang, D.; Wang, K.; Li, M.; Liu, S. To explore the effectiveness of various ecological security pattern construction methods in many growth situations in the future: A case study of the West Liaohe River Basin in Inner Mongolia. Sci. Total Environ. 2024, 948, 174607. [Google Scholar] [CrossRef] [PubMed]
- Fu, Y.; Shi, X.; He, J.; Yuan, Y.; Qu, L. Identification and optimization strategy of county ecological security pattern: A case study in the Loess Plateau, China. Ecol. Indic. 2020, 112, 106030. [Google Scholar] [CrossRef]
- Li, L.; Huang, X.; Wu, D.; Yang, H. Construction of ecological security pattern adapting to future land use change in Pearl River Delta, China. Appl. Geogr. 2023, 154, 102946. [Google Scholar] [CrossRef]
- Zhao, C.; Wu, S.; Yang, L.; Wu, Y.; Xiao, P.; Xu, J.; Liu, Y. Evaluating ecological conservation effectiveness of security patterns under multiple scenarios: A case study of Hubei Province. Ecol. Indic. 2024, 166, 112528. [Google Scholar] [CrossRef]
- Zhang, F.; Jia, Y.; Liu, X.; Li, T.; Gao, Q. Application of MSPA-MCR models to construct ecological security pattern in the basin: A case study of Dawen River basin. Ecol. Indic. 2024, 160, 111887. [Google Scholar] [CrossRef]
- Gao, M.; Hu, Y.; Bai, Y. Construction of ecological security pattern in national land space from the perspective of the community of life in mountain, water, forest, field, lake and grass: A case study in Guangxi Hechi, China. Ecol. Indic. 2022, 139, 108867. [Google Scholar] [CrossRef]
- Ran, Y.; Lei, D.; Li, J.; Gao, L.; Mo, J.; Liu, X. Identification of crucial areas of territorial ecological restoration based on ecological security pattern: A case study of the central Yunnan urban agglomeration, China. Ecol. Indic. 2022, 143, 109318. [Google Scholar] [CrossRef]
- Yu, Y.; Li, J.; Zhou, Z.; Ma, X.; Zhang, X. Response of multiple mountain ecosystem services on environmental gradients: How to respond, and where should be priority conservation? J. Clean. Prod. 2021, 278, 123264. [Google Scholar] [CrossRef]
- Guo, M.; Cong, X.; Zheng, H.; Zhang, M.-J.; Wang, L.-J.; Gong, J.-W.; Ma, S. Integrating the ordered weighted averaging method to establish an ecological security pattern for the Jianghuai ecological economic zone in China: Synergistic intraregional development. Ecol. Indic. 2022, 135, 108543. [Google Scholar] [CrossRef]
- Yu, H.; Gu, X.; Liu, G.; Fan, X.; Zhao, Q.; Zhang, Q. Construction of regional ecological security patterns based on multi-criteria decision making and circuit theory. Remote Sens. 2022, 14, 527. [Google Scholar] [CrossRef]
- Lyu, F.; Tang, J.; Olhnuud, A.; Hao, F.; Gong, C. The impact of large-scale ecological restoration projects on trade-offs/synergies and clusters of ecosystem services. J. Environ. Manag. 2024, 365, 121591. [Google Scholar] [CrossRef] [PubMed]
- Ding, M.; Liu, W.; Xiao, L.; Zhong, F.; Lu, N.; Zhang, J.; Zhang, Z.; Xu, X.; Wang, K. Construction and optimization strategy of ecological security pattern in a rapidly urbanizing region: A case study in central-south China. Ecol. Indic. 2022, 136, 108604. [Google Scholar] [CrossRef]
- Han, W.; Xia, S.; Zhou, W.; Shen, Y.; Su, X.; Liu, G. Constructing ecological securily pattern based on ecological corridor identification in Lhasa River Basin. Acta Ecologica Sinica 2023, 43, 8948–8957. (In Chinese) [Google Scholar] [CrossRef]
- Gou, M.; Li, L.; Ouyang, S.; Shu, C.; Xiao, W.; Wang, N.; Hu, J.; Liu, C. Integrating ecosystem service trade-offs and rocky desertification into ecological security pattern construction in the Daning river basin of southwest China. Ecol. Indic. 2022, 138, 108845. [Google Scholar] [CrossRef]
- Kang, J.; Li, C.; Li, M.; Zhang, T.; Zhang, B. Identifying priority areas for conservation in the lower Yellow River basin from an ecological network perspective. Ecosyst. Health Sustain. 2022, 8, 2105751. [Google Scholar] [CrossRef]
- Zhou, Y.; Ning, L.; Bai, X. Spatial and temporal changes of human disturbances and their effects on landscape patterns in the Jiangsu coastal zone, China. Ecol. Indic. 2018, 93, 111–122. [Google Scholar] [CrossRef]
- Li, Q.; Zhou, Y.; Yi, S. An integrated approach to constructing ecological security patterns and identifying ecological restoration and protection areas: A case study of Jingmen, China. Ecol. Indic. 2022, 137, 108723. [Google Scholar] [CrossRef]
- Shi, F.; Liu, S.; Sun, Y.; An, Y.; Zhao, S.; Liu, Y.; Li, M. Ecological network construction of the heterogeneous agro-pastoral areas in the upper Yellow River basin. Agric. Ecosyst. Environ. 2020, 302, 107069. [Google Scholar] [CrossRef]
- Lv, L.; Zhang, S.; Zhu, J.; Wang, Z.; Wang, Z.; Li, G.; Yang, C. Ecological restoration strategies for mountainous cities based on ecological security patterns and circuit theory: A case of Central Urban Areas in Chongqing, China. Int. J. Environ. Res. Public Health 2022, 19, 16505. [Google Scholar] [CrossRef]
- Gao, C.; Pan, H.; Wang, M.; Zhang, T.; He, Y.; Cheng, J.; Yao, C. Identifying priority areas for ecological conservation and restoration based on circuit theory and dynamic weighted complex network: A case study of the Sichuan Basin. Ecol. Indic. 2023, 155, 111064. [Google Scholar] [CrossRef]
- Zhu, X.; Xu, L. Changes of ecological service value and its coupling with economic development in Guanzhong region. Chin. J. Ecol. 2022, 41, 769–776. (In Chinese) [Google Scholar] [CrossRef]
- Bai, Z.; Xue, L.; Xue, D.; Zhang, Z.; Liu, J.; Zeng, H. Impact of human activities on the vegetation cover change in Guangzhong-Tianshui economic zone. J. China Agric. Univ. 2020, 25, 151–159. (In Chinese) [Google Scholar]
- Li, J.; Li, J. Ecological Costs of Food Production in Guangzhong-Tianshui Economic zone. Bull. Soil Water Conserv. 2013, 33, 85–89. (In Chinese) [Google Scholar] [CrossRef]
- Li, H.; Liang, X.; Wei, Z.; Zhu, Y.; Shi, J. Driving Force Analysis of Ecosystem Service Bundle Change Based on Logistic Regression Model: A Case Study of Guantian Economic Zone. Ecol. Environ. Sci. 2024, 33, 1803. (In Chinese) [Google Scholar]
- Qin, K.; Li, J.; Yang, X. Trade-off and synergy among ecosystem services in the Guanzhong-Tianshui Economic Region of China. Int. J. Environ. Res. Public Health 2015, 12, 14094–14113. [Google Scholar] [CrossRef]
- Yang, J.; Huang, X. The 30 m Annual Land Cover Datasets and Its Dynamics in China from 1985 to 2022. Earth Syst. Sci. Data 2023, 13, 3907–3925. [Google Scholar] [CrossRef]
- Sala, O.E.; Austin, A.T. Methods of estimating aboveground net primary productivity. In Methods in Ecosystem Science; Springer: Berlin/Heidelberg, Germany, 2000; pp. 31–43. [Google Scholar]
- Bosch, J.M.; Hewlett, J. A review of catchment experiments to determine the effect of vegetation changes on water yield and evapotranspiration. J. Hydrol. 1982, 55, 3–23. [Google Scholar] [CrossRef]
- Morgan, R.P.C. Soil Erosion and Conservation; John Wiley & Sons: Hoboken, NJ, USA, 2009. [Google Scholar]
- Jie, Y.; Shiying, W.; Jie, Z.; Jing, Z.; Wenliu, Z. Optimisation of ecological security patterns in ecologically transition areas under the perspective of ecological resilience—A case of Taohe River. Ecol. Indic. 2024, 166, 112315. [Google Scholar] [CrossRef]
- Peng, J.; Hu, X.; Qiu, S.; Meersmans, J.; Liu, Y. Multifunctional landscapes identification and associated development zoning in mountainous area. Sci. Total Environ. 2019, 660, 765–775. [Google Scholar] [CrossRef]
- Liu, W.; Zhan, J.; Zhao, F.; Zhang, F.; Teng, Y.; Wang, C.; Chu, X.; Kumi, M.A. The tradeoffs between food supply and demand from the perspective of ecosystem service flows: A case study in the Pearl River Delta, China. J. Environ. Manag. 2022, 301, 113814. [Google Scholar] [CrossRef]
- Johnson, M.D. Measuring habitat quality: A review. Condor 2007, 109, 489–504. [Google Scholar] [CrossRef]
- Ma, H.; Chen, Q. Spatial-temporal differentiation characteristics and influencing factors of agricultural carbon emissions in Gansu Province. Arid Land Geogr. 2024, 1–15. (In Chinese) [Google Scholar] [CrossRef]
- Gollini, I.; Lu, B.; Charlton, M.; Brunsdon, C.; Harris, P. GWmodel: An R package for exploring spatial heterogeneity using geographically weighted models. arXiv 2013, arXiv:1306.0413. [Google Scholar] [CrossRef]
- Yan, X.; Li, X.; Liu, C.; Li, J.; Zhong, J. Spatial evolution trajectory of ecosystem service bundles and its social-ecological driven by geographical Exploration: A case study of Dalian. Acta Ecol. Sin. 2022, 42, 5734–5747. (In Chinese) [Google Scholar]
- Howe, C.; Suich, H.; Vira, B.; Mace, G.M. Creating win-wins from trade-offs? Ecosystem services for human well-being: A meta-analysis of ecosystem service trade-offs and synergies in the real world. Glob. Environ. Change 2014, 28, 263–275. [Google Scholar] [CrossRef]
- Wang, X.; Liu, G.; Xiang, A.; Qureshi, S.; Li, T.; Song, D.; Zhang, C. Quantifying the human disturbance intensity of ecosystems and its natural and socioeconomic driving factors in urban agglomeration in South China. Environ. Sci. Pollut. Res. 2022, 29, 11493–11509. [Google Scholar] [CrossRef]
- Yang, Y.; Song, G. Human disturbance changes based on spatiotemporal heterogeneity of regional ecological vulnerability: A case study of Qiqihaer city, northwestern Songnen Plain, China. J. Clean. Prod. 2021, 291, 125262. [Google Scholar] [CrossRef]
- Chen, S.; Li, G.; Zhuo, Y.; Xu, Z.; Ye, Y.; Thorn, J.P.; Marchant, R. Trade-offs and synergies of ecosystem services in the Yangtze River Delta, China: Response to urbanizing variation. Urban Ecosyst. 2022, 25, 313–328. [Google Scholar] [CrossRef]
- Lin, S.; Wu, R.; Yang, F.; Wang, J.; Wu, W. Spatial trade-offs and synergies among ecosystem services within a global biodiversity hotspot. Ecol. Indic. 2018, 84, 371–381. [Google Scholar] [CrossRef]
- Yang, G.; Ge, Y.; Xue, H.; Yang, W.; Shi, Y.; Peng, C.; Du, Y.; Fan, X.; Ren, Y.; Chang, J. Using ecosystem service bundles to detect trade-offs and synergies across urban–rural complexes. Landsc. Urban Plan. 2015, 136, 110–121. [Google Scholar] [CrossRef]
- Niu, T.; Yu, J.; Yue, D.; Yang, L.; Mao, X.; Hu, Y. The temporal and spatial evolution of ecosystem service synergy/trade-offs based on ecological units. Forests 2021, 12, 992. [Google Scholar] [CrossRef]
- Gardner, H.; Woolhiser, D. Hydrologic and climatic factors. In Reclamation of Drastically Disturbed Lands; American Society of Agronomy; Crop Science Society of America; Soil Science Society of America: Madison, WI, USA, 1978; pp. 173–191. [Google Scholar]
- Chen, J.; Chen, Y.; Wang, K.; Zhang, H.; Tian, H.; Cao, J. Impacts of land use, rainfall, and temperature on soil conservation in the Loess Plateau of China. Catena 2024, 239, 107883. [Google Scholar] [CrossRef]
- Jiang, C.; Guo, H.; Wei, Y.; Yang, Z.; Wang, X.; Wen, M.; Yang, L.; Zhao, L.; Zhang, H.; Zhou, P. Ecological restoration is not sufficient for reconciling the trade-off between soil retention and water yield: A contrasting study from catchment governance perspective. Sci. Total Environ. 2021, 754, 142139. [Google Scholar] [CrossRef] [PubMed]
- Piao, S.; Fang, J. Seasonal Changes in Vegetation Activity in Response to ClimateChanges in China between 1982 and 1999. Acta Geogr. Sin. 2003, 58, 119–125. (In Chinese) [Google Scholar]
- Gong, J.; Xie, Y.; Cao, E.; Huang, Q.; Li, H. Integration of InVEST-habitat quality model with landscape pattern indexes to assess mountain plant biodiversity change: A case study of Bailongjiang watershed in Gansu Province. J. Geogr. Sci. 2019, 29, 1193–1210. [Google Scholar] [CrossRef]
- Liu, Y.; Lü, Y.; Fu, B.; Harris, P.; Wu, L. Quantifying the spatio-temporal drivers of planned vegetation restoration on ecosystem services at a regional scale. Sci. Total Environ. 2019, 650, 1029–1040. [Google Scholar] [CrossRef]
- Song, J.; Ren, Z.; Hao, M.; Duan, Y. Spatial and temporal changes in the synergy and trade-off between ecosystem services, and its influencing factors in Yanan, Loess Plateau. Acta Ecol. Sin. 2019, 39, 3443–3454. (In Chinese) [Google Scholar]
- Lin, J.; Huang, J.; Prell, C.; Bryan, B.A. Changes in supply and demand mediate the effects of land-use change on freshwater ecosystem services flows. Sci. Total Environ. 2021, 763, 143012. [Google Scholar] [CrossRef]
- Zhao, T.; Pan, J.; Bi, F. Can human activities enhance the trade-off intensity of ecosystem services in arid inland river basins? Taking the Taolai River asin as an example. Sci. Total Environ. 2023, 861, 160662. [Google Scholar] [CrossRef]
- Wang, L.; Pan, F.; Zhang, J.; Yang, Y.; Liu, Z. Ecosystem Service Trade-offs/Synergies and Projectionsin Qinling Mountains. J. Earth Sci. Environ. 2024, 46, 584–594. (In Chinese) [Google Scholar] [CrossRef]
- Liu, Y.; Qiu, J. Analysis of ecological environment problems and countermeasures in Qinling area. Mod. Gard. 2024, 47, 173–175. (In Chinese) [Google Scholar] [CrossRef]
- Liu, X.; Su, Y.; Li, Z.; Zhang, S. Constructing ecological security patterns based on ecosystem services trade-offs and ecological sensitivity: A case study of Shenzhen metropolitan area, China. Ecol. Indic. 2023, 154, 110626. [Google Scholar] [CrossRef]
- Feng, D.; Bao, W.; Yang, Y.; Fu, M. How do government policies promote greening? Evidence from China. Land Use Policy 2021, 104, 105389. [Google Scholar] [CrossRef]
- Wei, Q.; Halike, A.; Yao, K.; Chen, L.; Balati, M. Construction and optimization of ecological security pattern in Ebinur Lake Basin based on MSPA-MCR models. Ecol. Indic. 2022, 138, 108857. [Google Scholar] [CrossRef]


| Ecosystem Service | Calculation |
|---|---|
| NPP | NPP(x,t) = APAR(x,t) × ε(x,t) |
| NPP is the net primary productivity of vegetation at time t for pixel x (gC/m2); APAR is the absorbed photosynthetically active radiation (MJ/m2); and ε is the actual light energy utilization (gC/MJ). | |
| WY | WY(x) = [1 − AET(x)/P(x)] × P(x) |
| WY is the annual water yield of pixel x (mm); AET is the annual actual evapotranspiration (mm); and P(x) is the annual precipitation (mm). | |
| SC | RKLS = R × K × LS USLE = R × K × LS × C × M SC = RKLS − USLE |
| SC is the soil conservation amount (t/hm2); RKLS is the potential soil erosion amount (t/hm2); USLE is the actual soil erosion amount under ecological management measures (t/hm2); and R, K, LS, C, and M indicate the rainfall erosion factor, the soil erodibility, slope length factor, vegetation cover factor, and management factor and account for soil and water conservation. | |
| FP | |
| FP is the food production of pixel x (t/hm2); FPt is the total food production in the study area; n is the total number of cropland pixels in the study area; NDVIx is the normalized-difference vegetation index for cropland pixel x; and NDVImax and NDVImin are the annual NDVI maxima and minima, respectively, for cropland. | |
| HQ | |
| HQxj is the habitat quality of pixel x in land use type j; H is the habitat suitability for that land use type; Dxj is the level of stress on pixel x in that land use type; k is the half-saturation factor, which is usually taken as half the maximum value of Dxj; and Z is a normalized constant that is usually taken as 2.5. |
| Resistance Factors | Score | Weight | |||||
|---|---|---|---|---|---|---|---|
| 1 | 2 | 3 | 4 | 5 | |||
| Natural factors | Elevation (m) | <600 | 600–1200 | 1200–1800 | 1800–2400 | >2400 | 0.0503 |
| Slope (°) | <10 | 10–15 | 15–20 | 20–30 | >30 | 0.0503 | |
| Vegetation cover | >0.85 | 0.75–0.85 | 0.65–0.75 | 0.50–0.65 | <0.50 | 0.1458 | |
| Distance from river (km) | 0–10 | 10–20 | 20–40 | 40–60 | >60 | 0.0750 | |
| Social factors | Land use type | forests, shrubs | grassland, water | cropland | barren | construction land | 0.3452 |
| HDI | <0.2 | 0.2–0.4 | 0.4–0.6 | 0.6–0.8 | >0.8 | 0.2123 | |
| Distance from roads (km) | >20 | 10–20 | 2–10 | 1–2 | 0–1 | 0.0349 | |
| Population (×103) | <0.5 | 0.5–2 | 2–6 | 6–10 | >10 | 0.0861 | |
| NPP × WY | NPP × SC | NPP × FP | NPP × HQ | WY × SC | WY × FP | WY × HQ | SC × FP | SC × HQ | FP × HQ | |
|---|---|---|---|---|---|---|---|---|---|---|
| 2000 | 0.08 | 0.60 | –0.53 | 0.45 | 0.29 | –0.15 | 0.19 | –0.70 | 0.44 | –0.58 |
| 2010 | –0.11 | 0.62 | –0.53 | 0.47 | 0.06 | –0.01 | 0.04 | –0.69 | 0.45 | –0.53 |
| 2022 | –0.50 | 0.53 | –0.38 | 0.35 | –0.33 | 0.43 | –0.22 | –0.65 | 0.47 | –0.44 |
Disclaimer/Publisher’s Note: The statements, opinions and data contained in all publications are solely those of the individual author(s) and contributor(s) and not of MDPI and/or the editor(s). MDPI and/or the editor(s) disclaim responsibility for any injury to people or property resulting from any ideas, methods, instructions or products referred to in the content. |
© 2025 by the authors. Licensee MDPI, Basel, Switzerland. This article is an open access article distributed under the terms and conditions of the Creative Commons Attribution (CC BY) license (https://creativecommons.org/licenses/by/4.0/).
Share and Cite
Zhou, J.; Xiao, J.; Yin, D.; Ren, Y. Trade-Offs and Synergies Between Ecosystem Services and Their Ecological Security Patterns in the Guanzhong–Tianshui Economic Zone. Land 2025, 14, 637. https://doi.org/10.3390/land14030637
Zhou J, Xiao J, Yin D, Ren Y. Trade-Offs and Synergies Between Ecosystem Services and Their Ecological Security Patterns in the Guanzhong–Tianshui Economic Zone. Land. 2025; 14(3):637. https://doi.org/10.3390/land14030637
Chicago/Turabian StyleZhou, Jing, Jianhua Xiao, Daiying Yin, and Yu Ren. 2025. "Trade-Offs and Synergies Between Ecosystem Services and Their Ecological Security Patterns in the Guanzhong–Tianshui Economic Zone" Land 14, no. 3: 637. https://doi.org/10.3390/land14030637
APA StyleZhou, J., Xiao, J., Yin, D., & Ren, Y. (2025). Trade-Offs and Synergies Between Ecosystem Services and Their Ecological Security Patterns in the Guanzhong–Tianshui Economic Zone. Land, 14(3), 637. https://doi.org/10.3390/land14030637